Ireland — Investor Presentation (June 2009)
27 slides from Ireland's investor presentation, Jun 8, 2009
Slide 1: Corporate Presentation May 2009
o IRELANDINC Corporate Presentation May 2009 Confidential For complete information on Ireland Inc, its projects and risk factors, please review Ireland Inc.’s SEC filings at http://www.sec.gov.
Slide 2: Forward Looking Statements
Forward Looking Statements This Presentation may contain, in addition to historical information, forward-looking statements. Statements in this Presentation that are forward-looking statements are subject to various risks and uncertainties concerning the specific factors disclosed under the heading
Slide 3: Company Vision
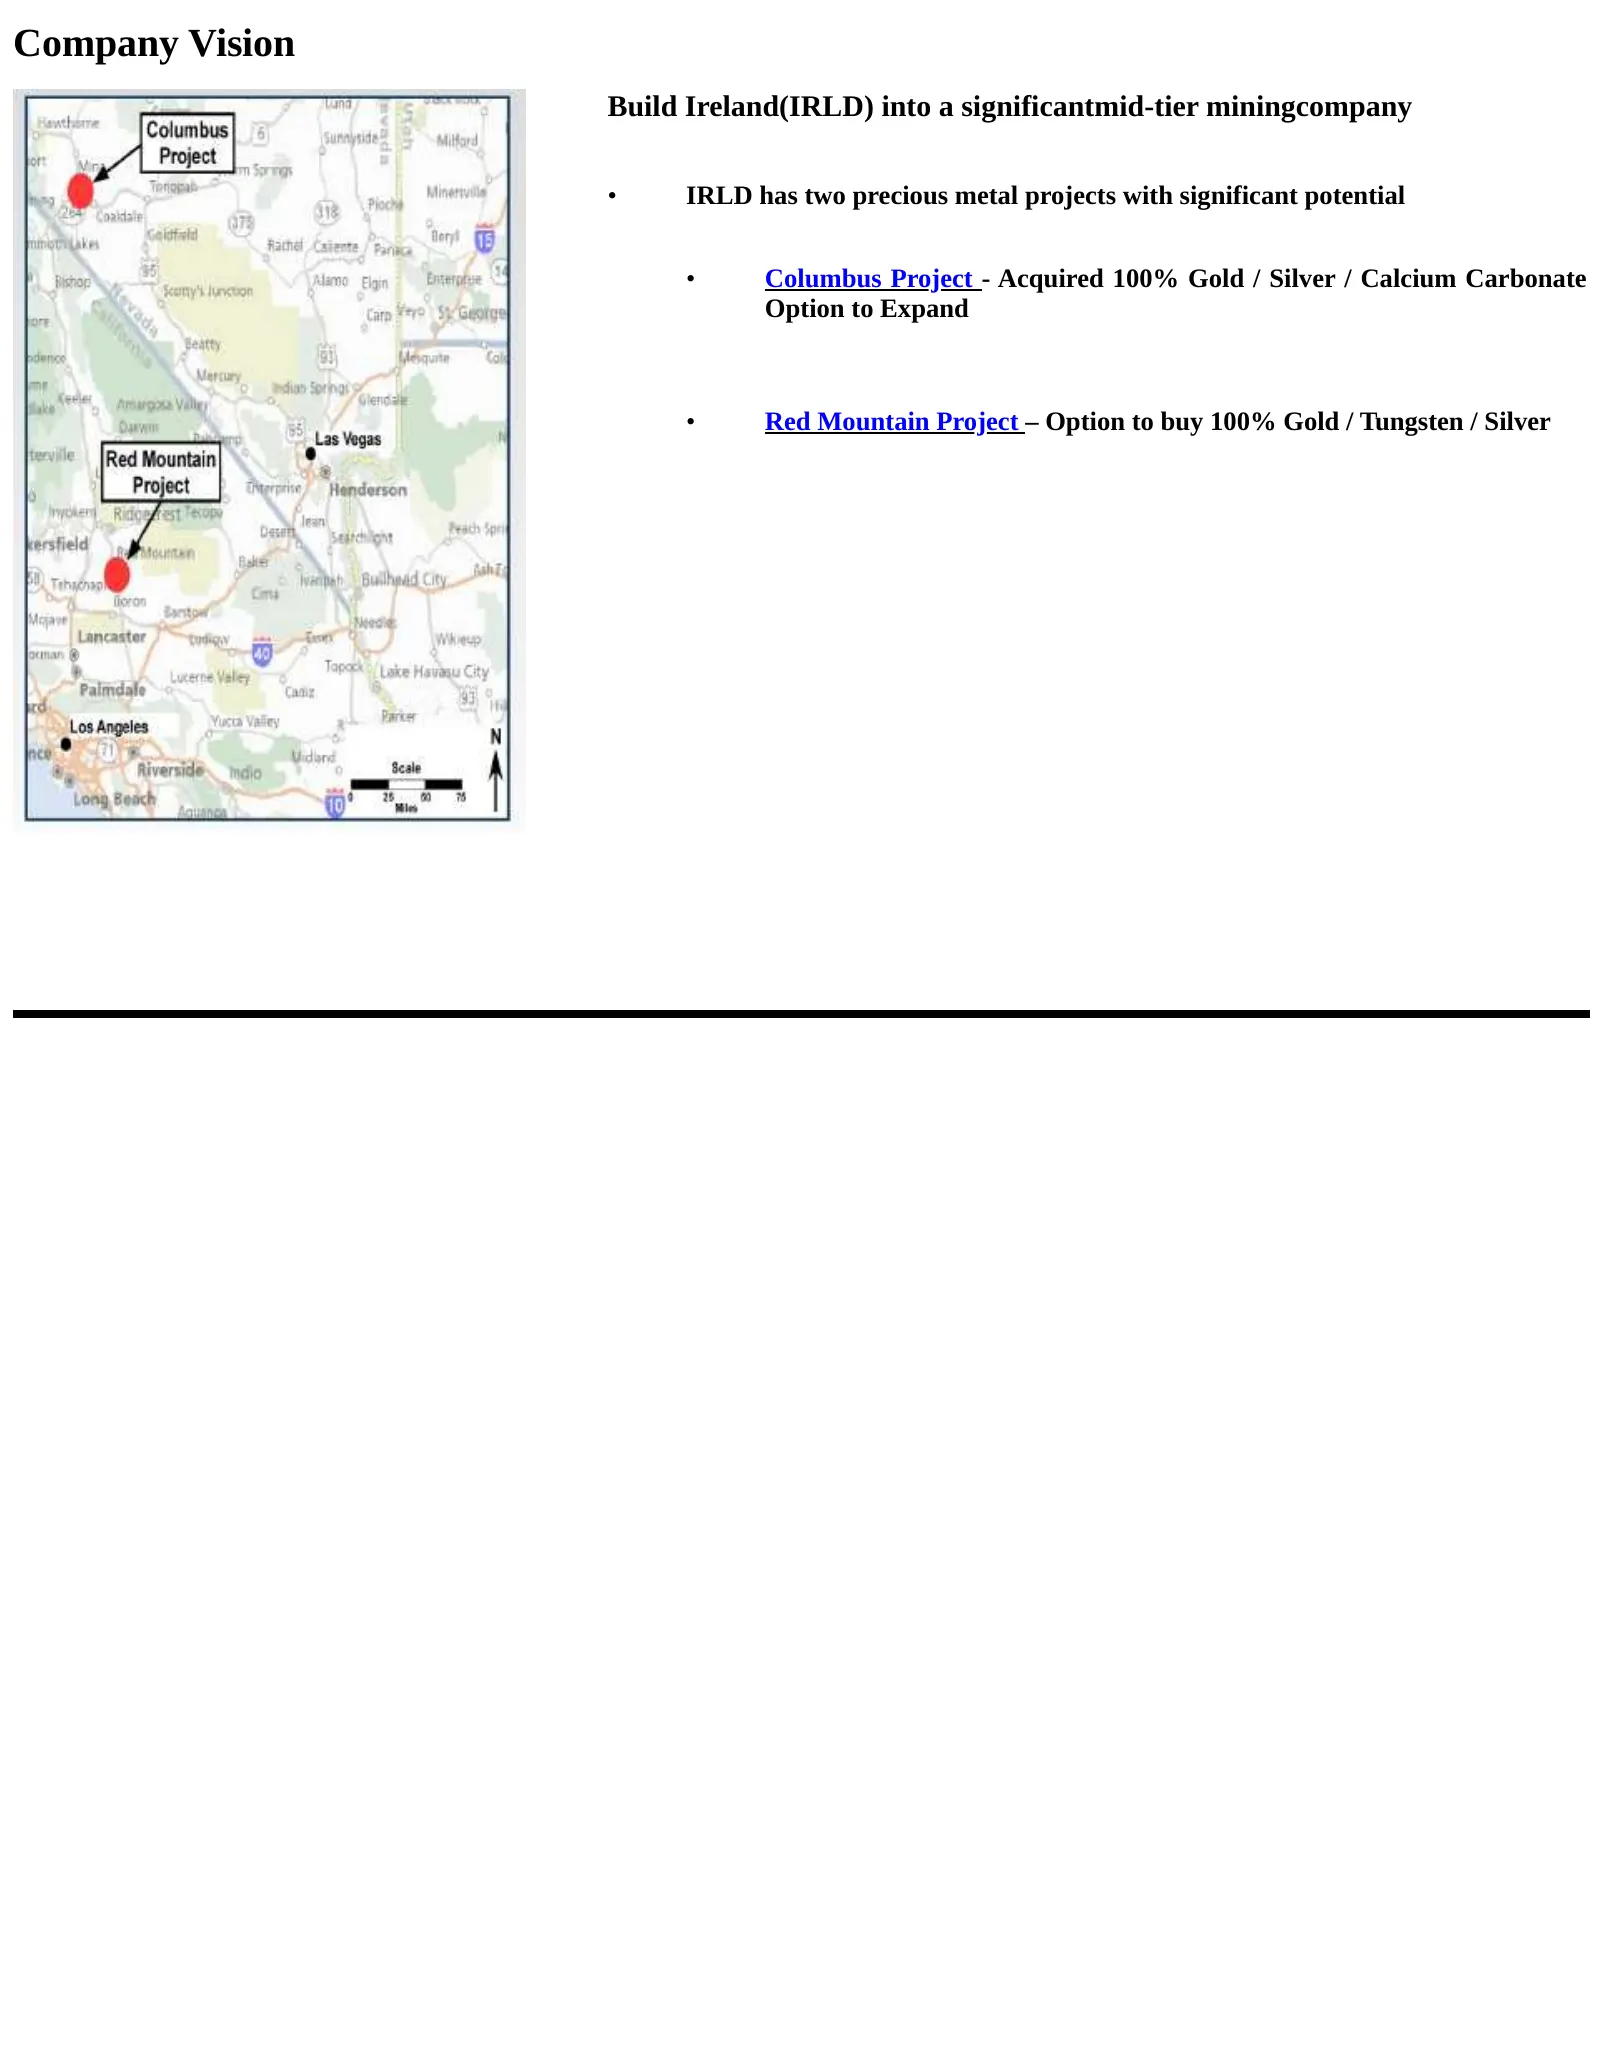
Company Vision Build Ireland(IRLD) into a significantmid-tier miningcompany • IRLD has two precious metal projects with significant potential • Columbus Project - Acquired 100% Gold / Silver / Calcium Carbonate Option to Expand • Red Mountain Project – Option to buy 100% Gold / Tungsten / Silver
Slide 4: Columbus Project
Columbus Project
Slide 5: Columbus Project Overview
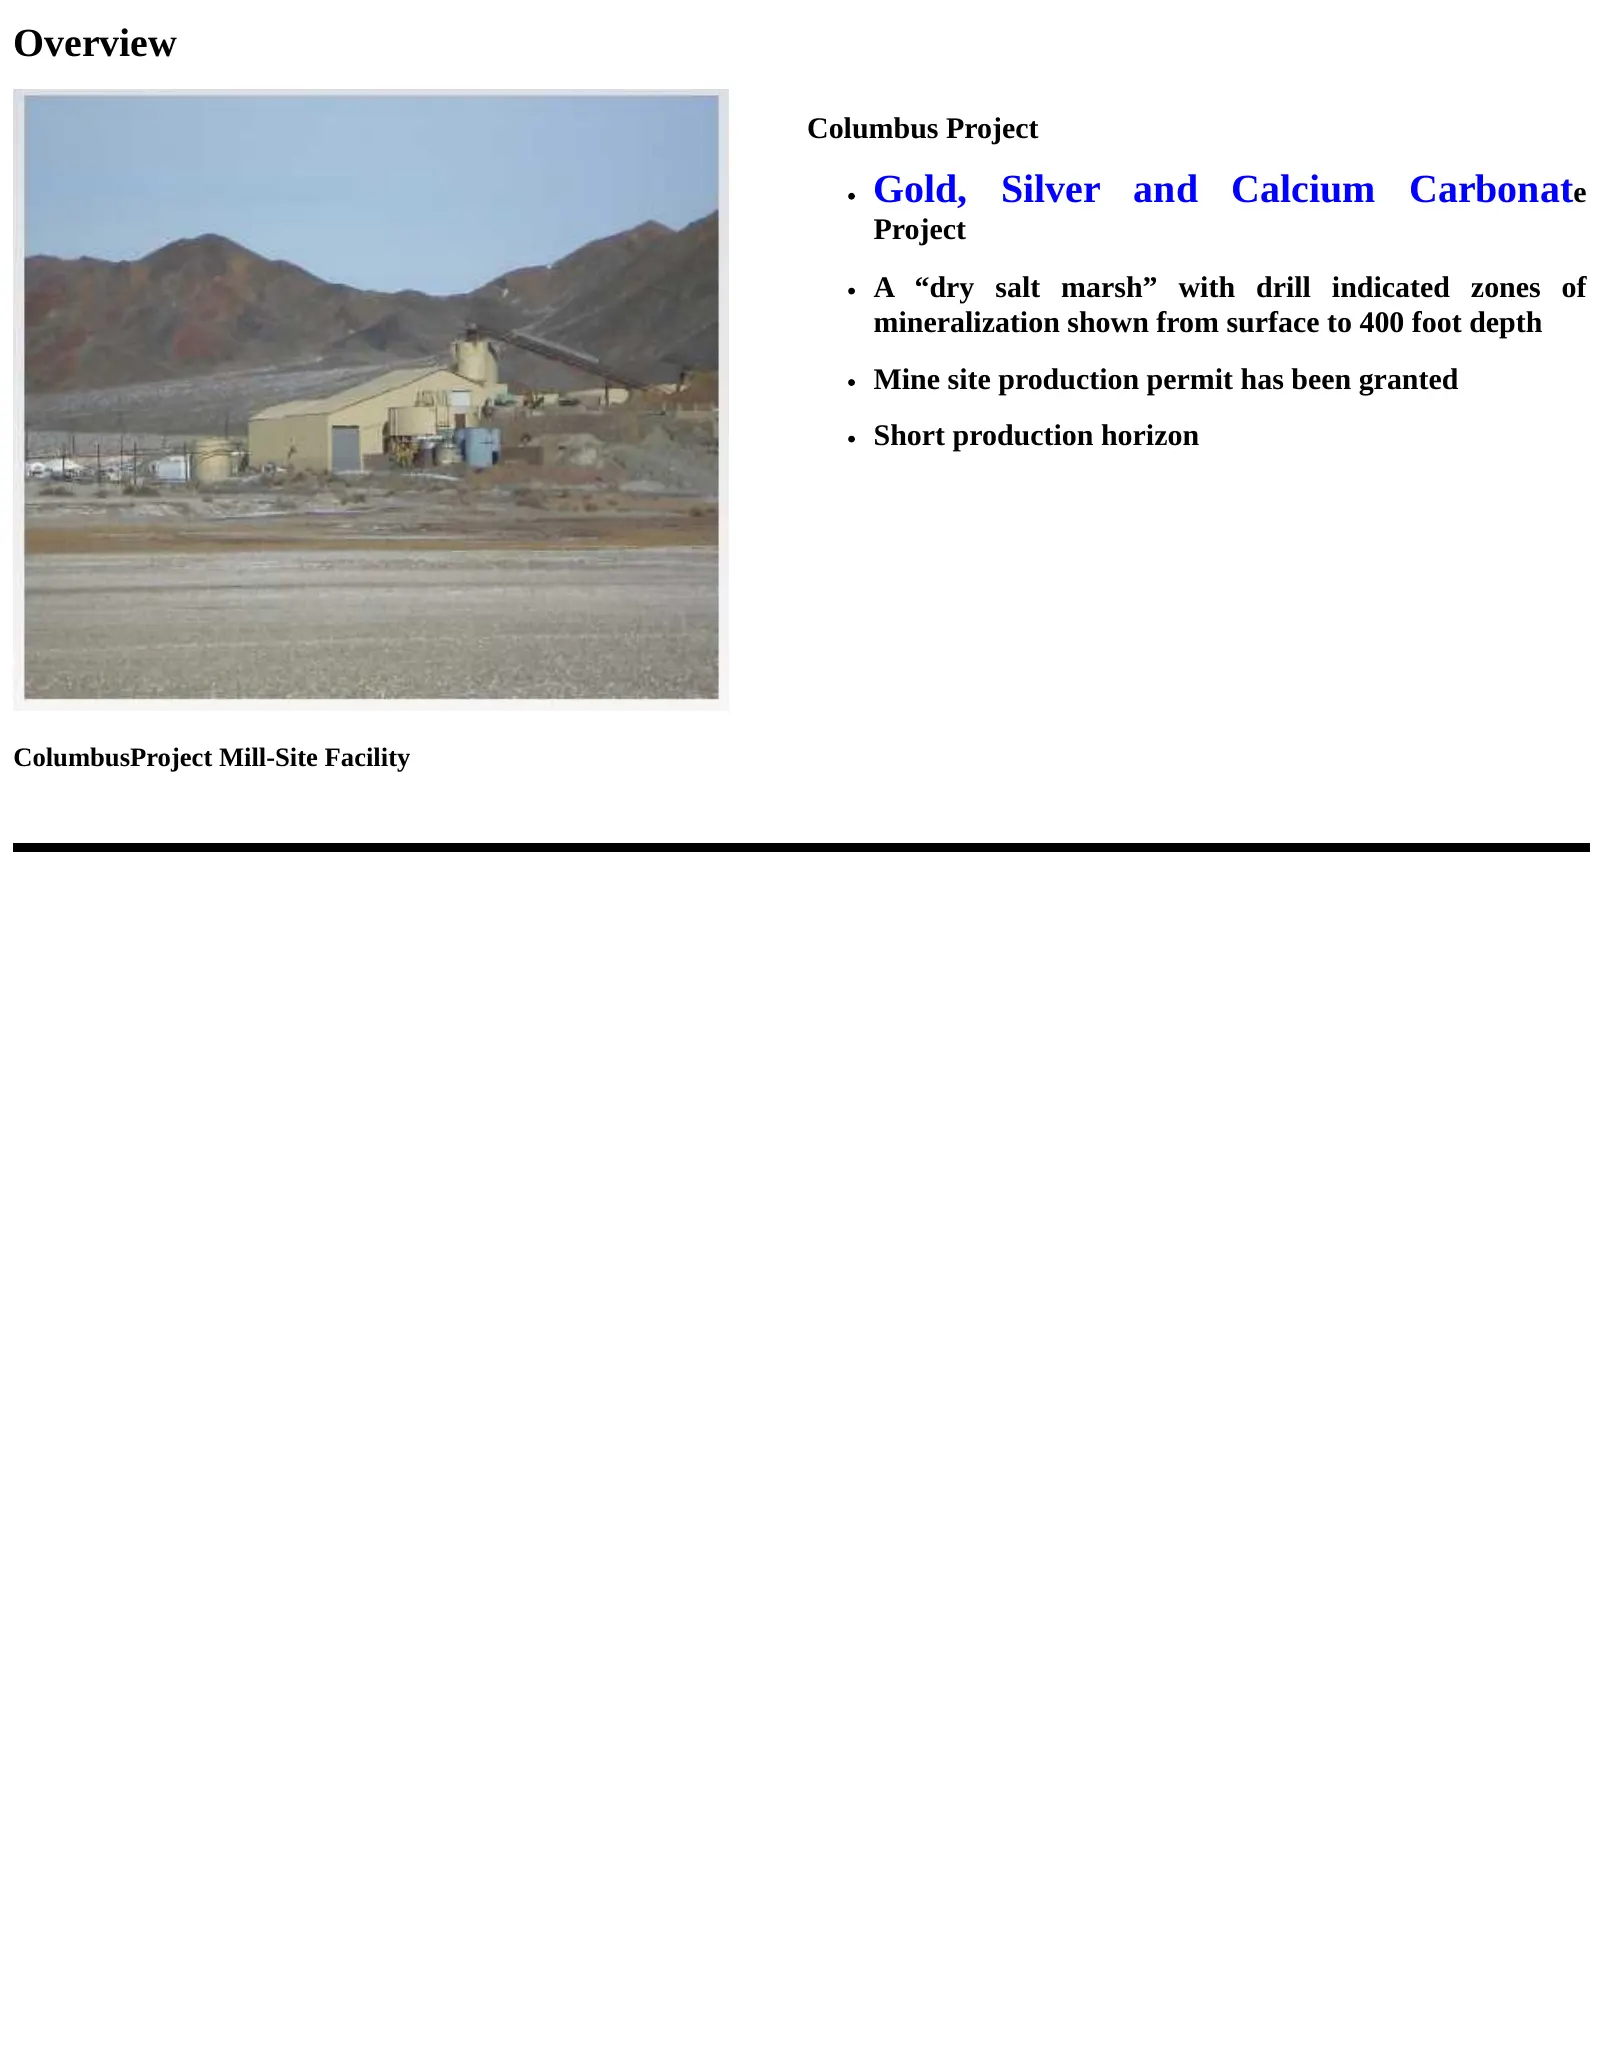
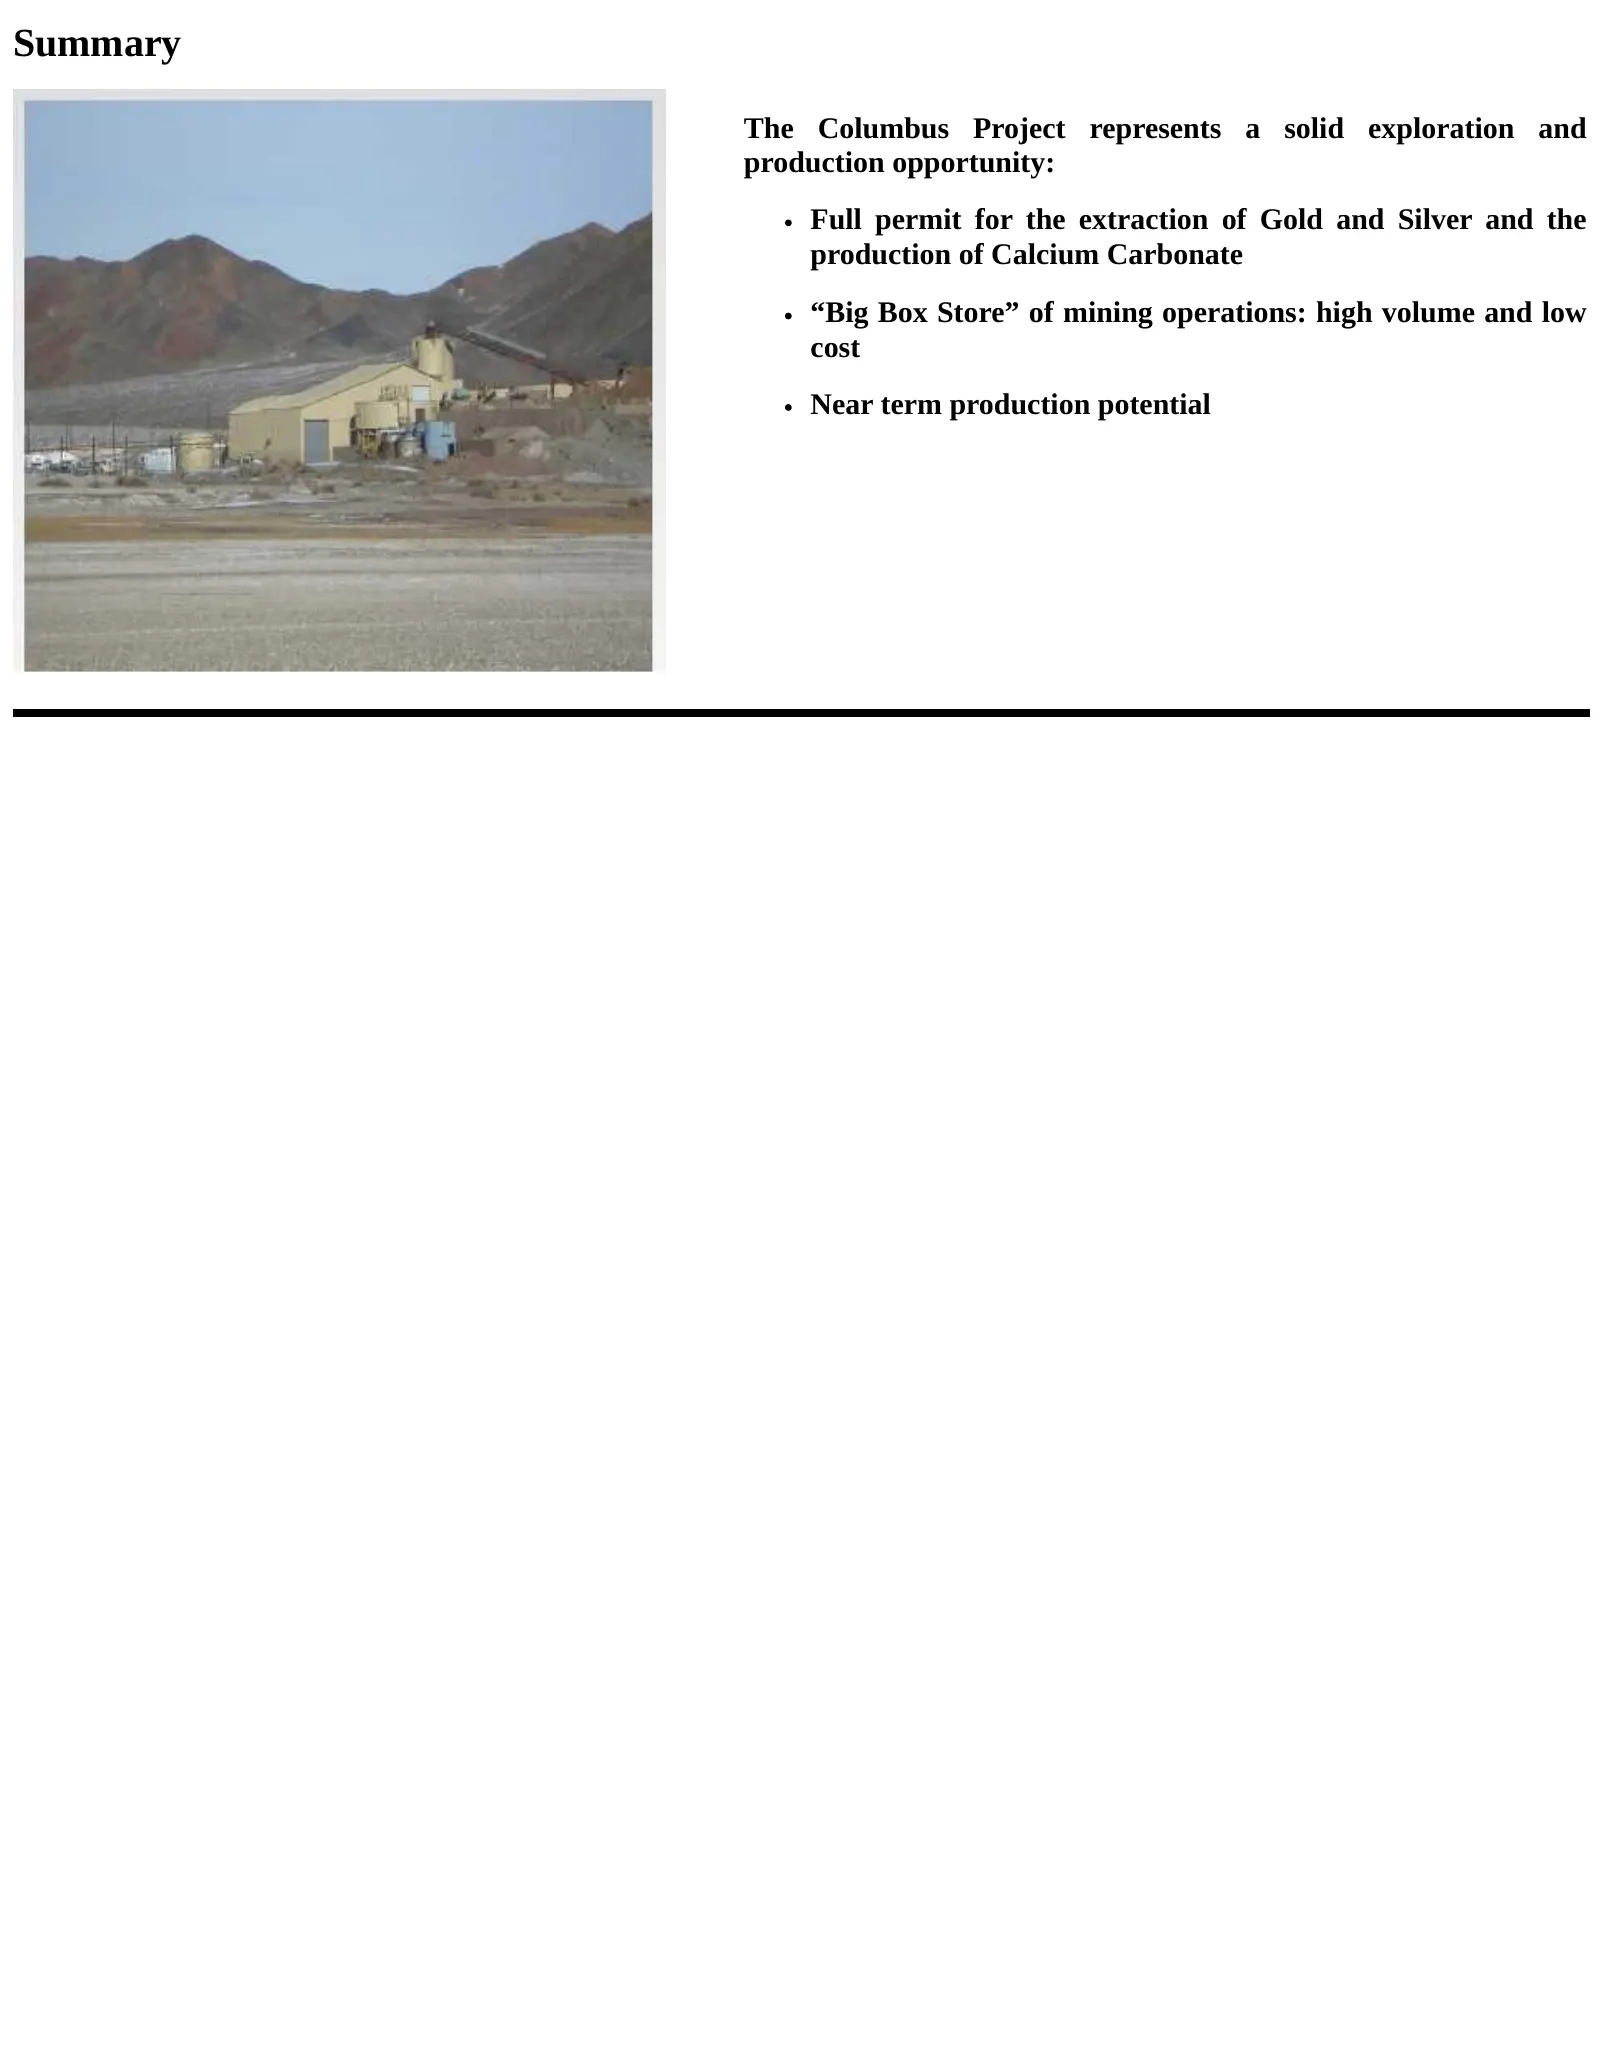
Overview Columbus Project Gold, Silver and Calcium Carbonate Project A “dry salt marsh” with drill indicated zones of mineralization shown from surface to 400 foot depth Mine site production permit has been granted Short production horizon ColumbusProject Mill-Site Facility
Slide 6: Location
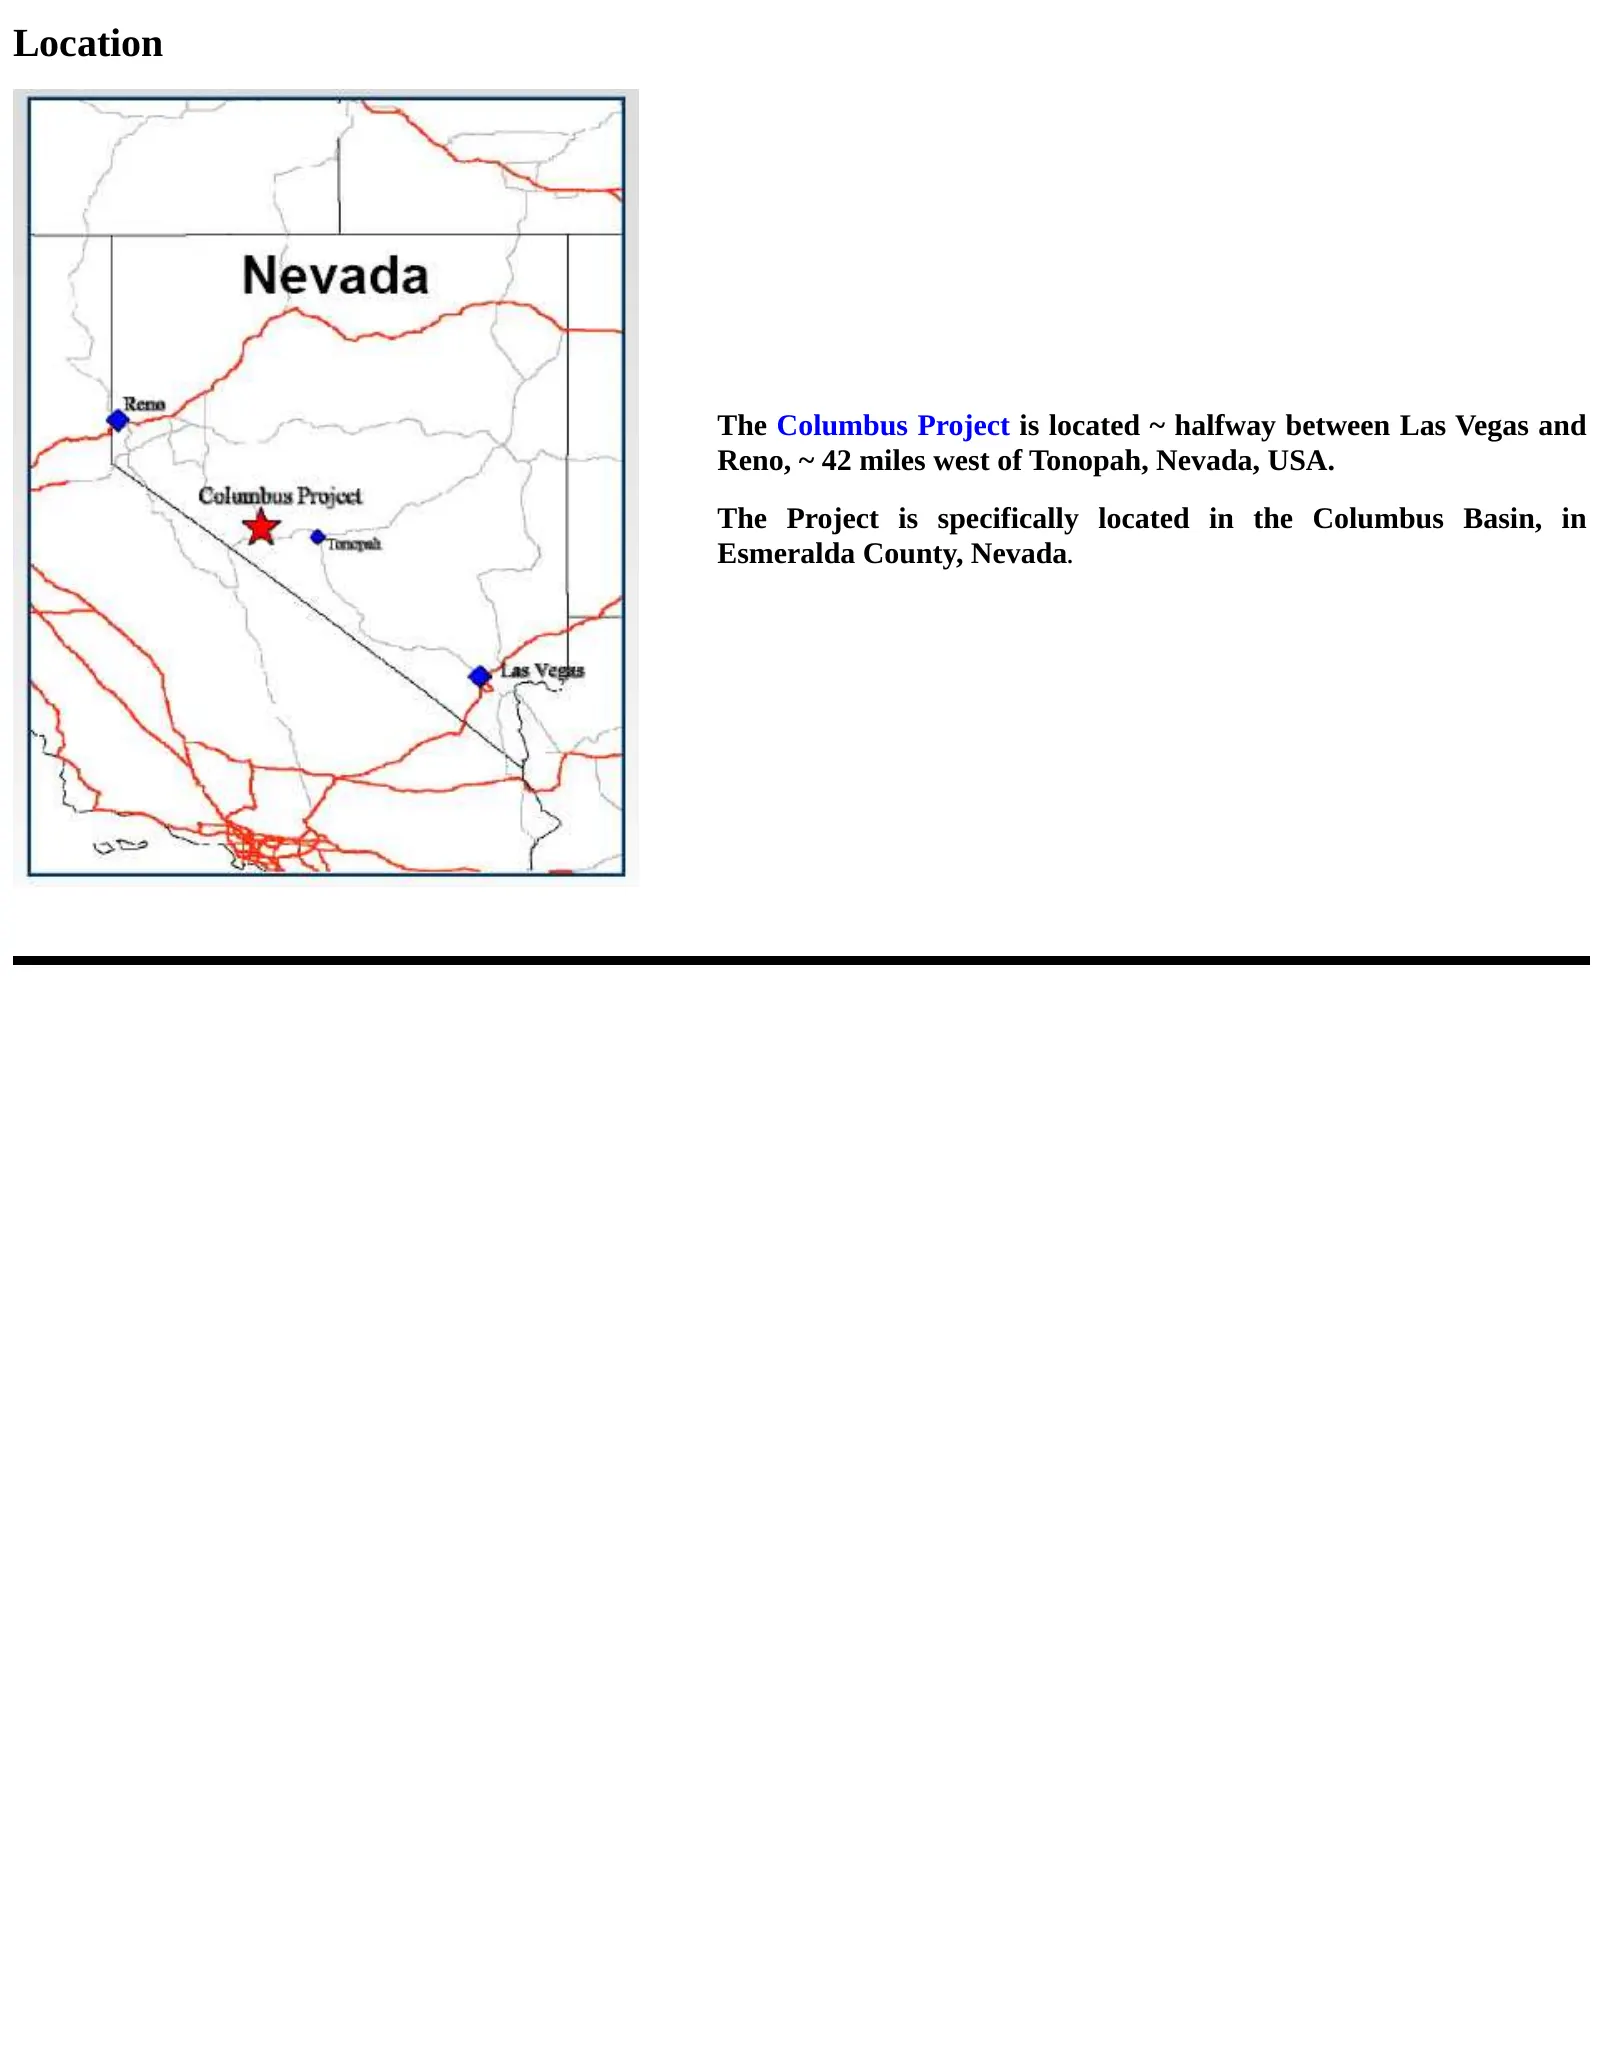
Location The Columbus Project is located ~ halfway between Las Vegas and Reno, ~ 42 miles west of Tonopah, Nevada, USA. The Project is specifically located in the Columbus Basin, in Esmeralda County, Nevada.
Slide 7: Regional History
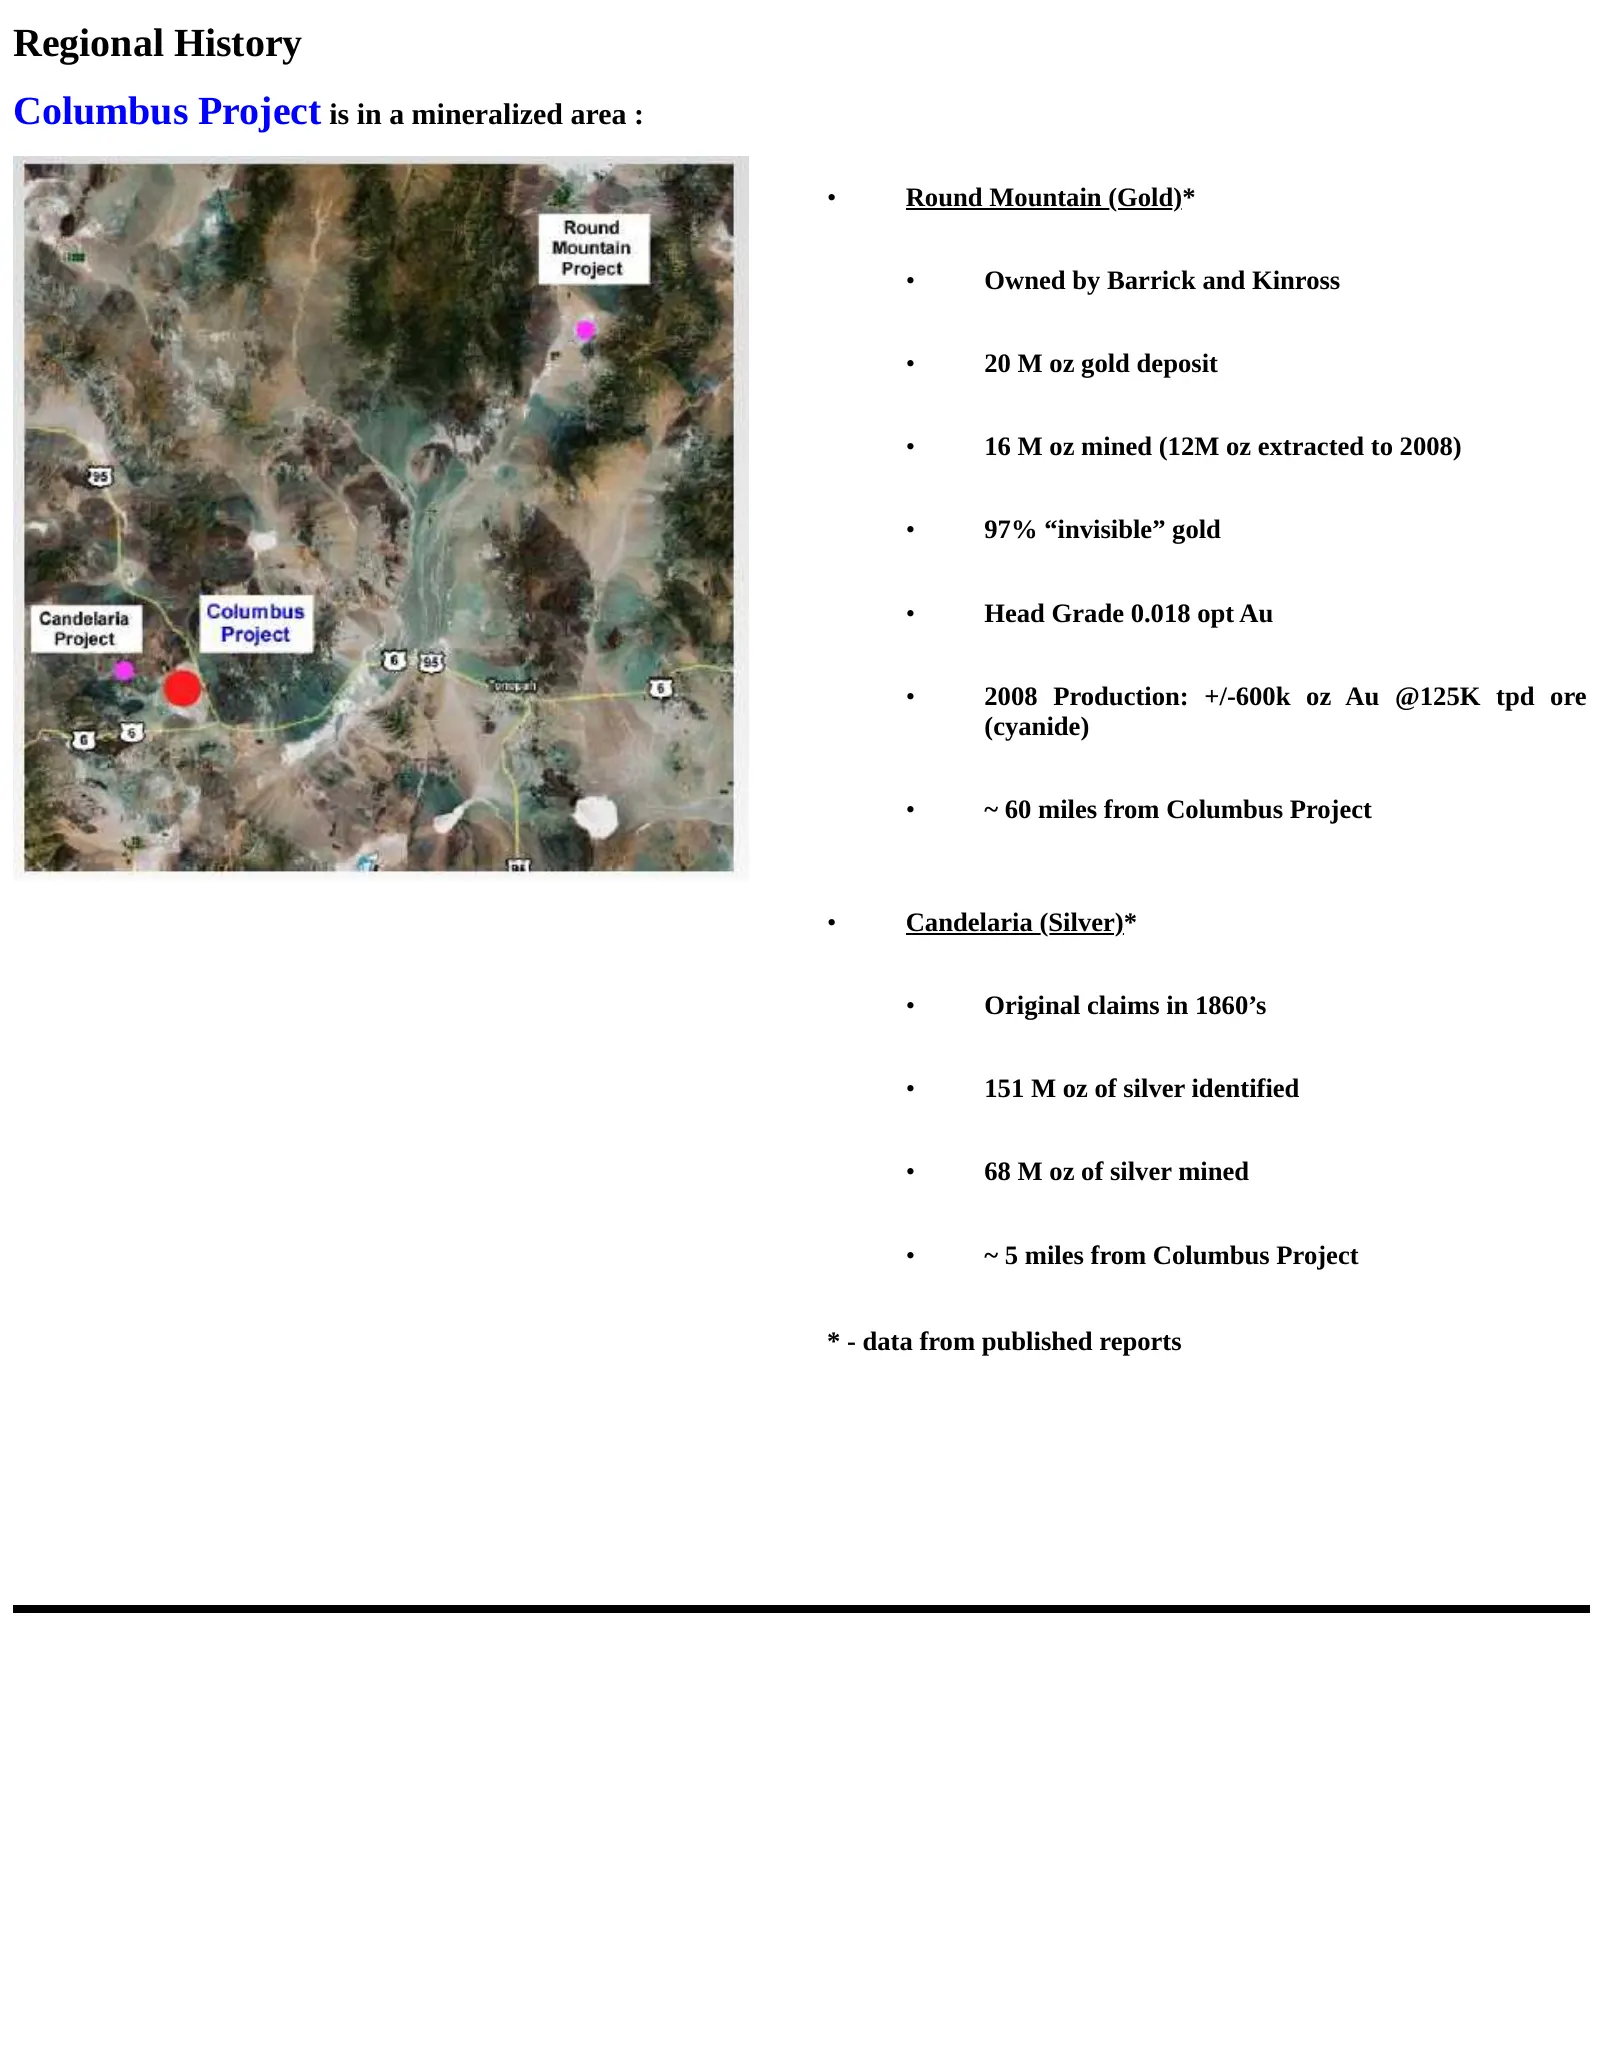
Regional History Columbus Project is in a mineralized area : • Round Mountain (Gold)* • Owned by Barrick and Kinross • 20 M oz gold deposit • 16 M oz mined (12M oz extracted to 2008) • 97% “invisible” gold • Head Grade 0.018 opt Au • 2008 Production: +/-600k oz Au @125K tpd ore (cyanide) • ~ 60 mile
Slide 8: Project Assets
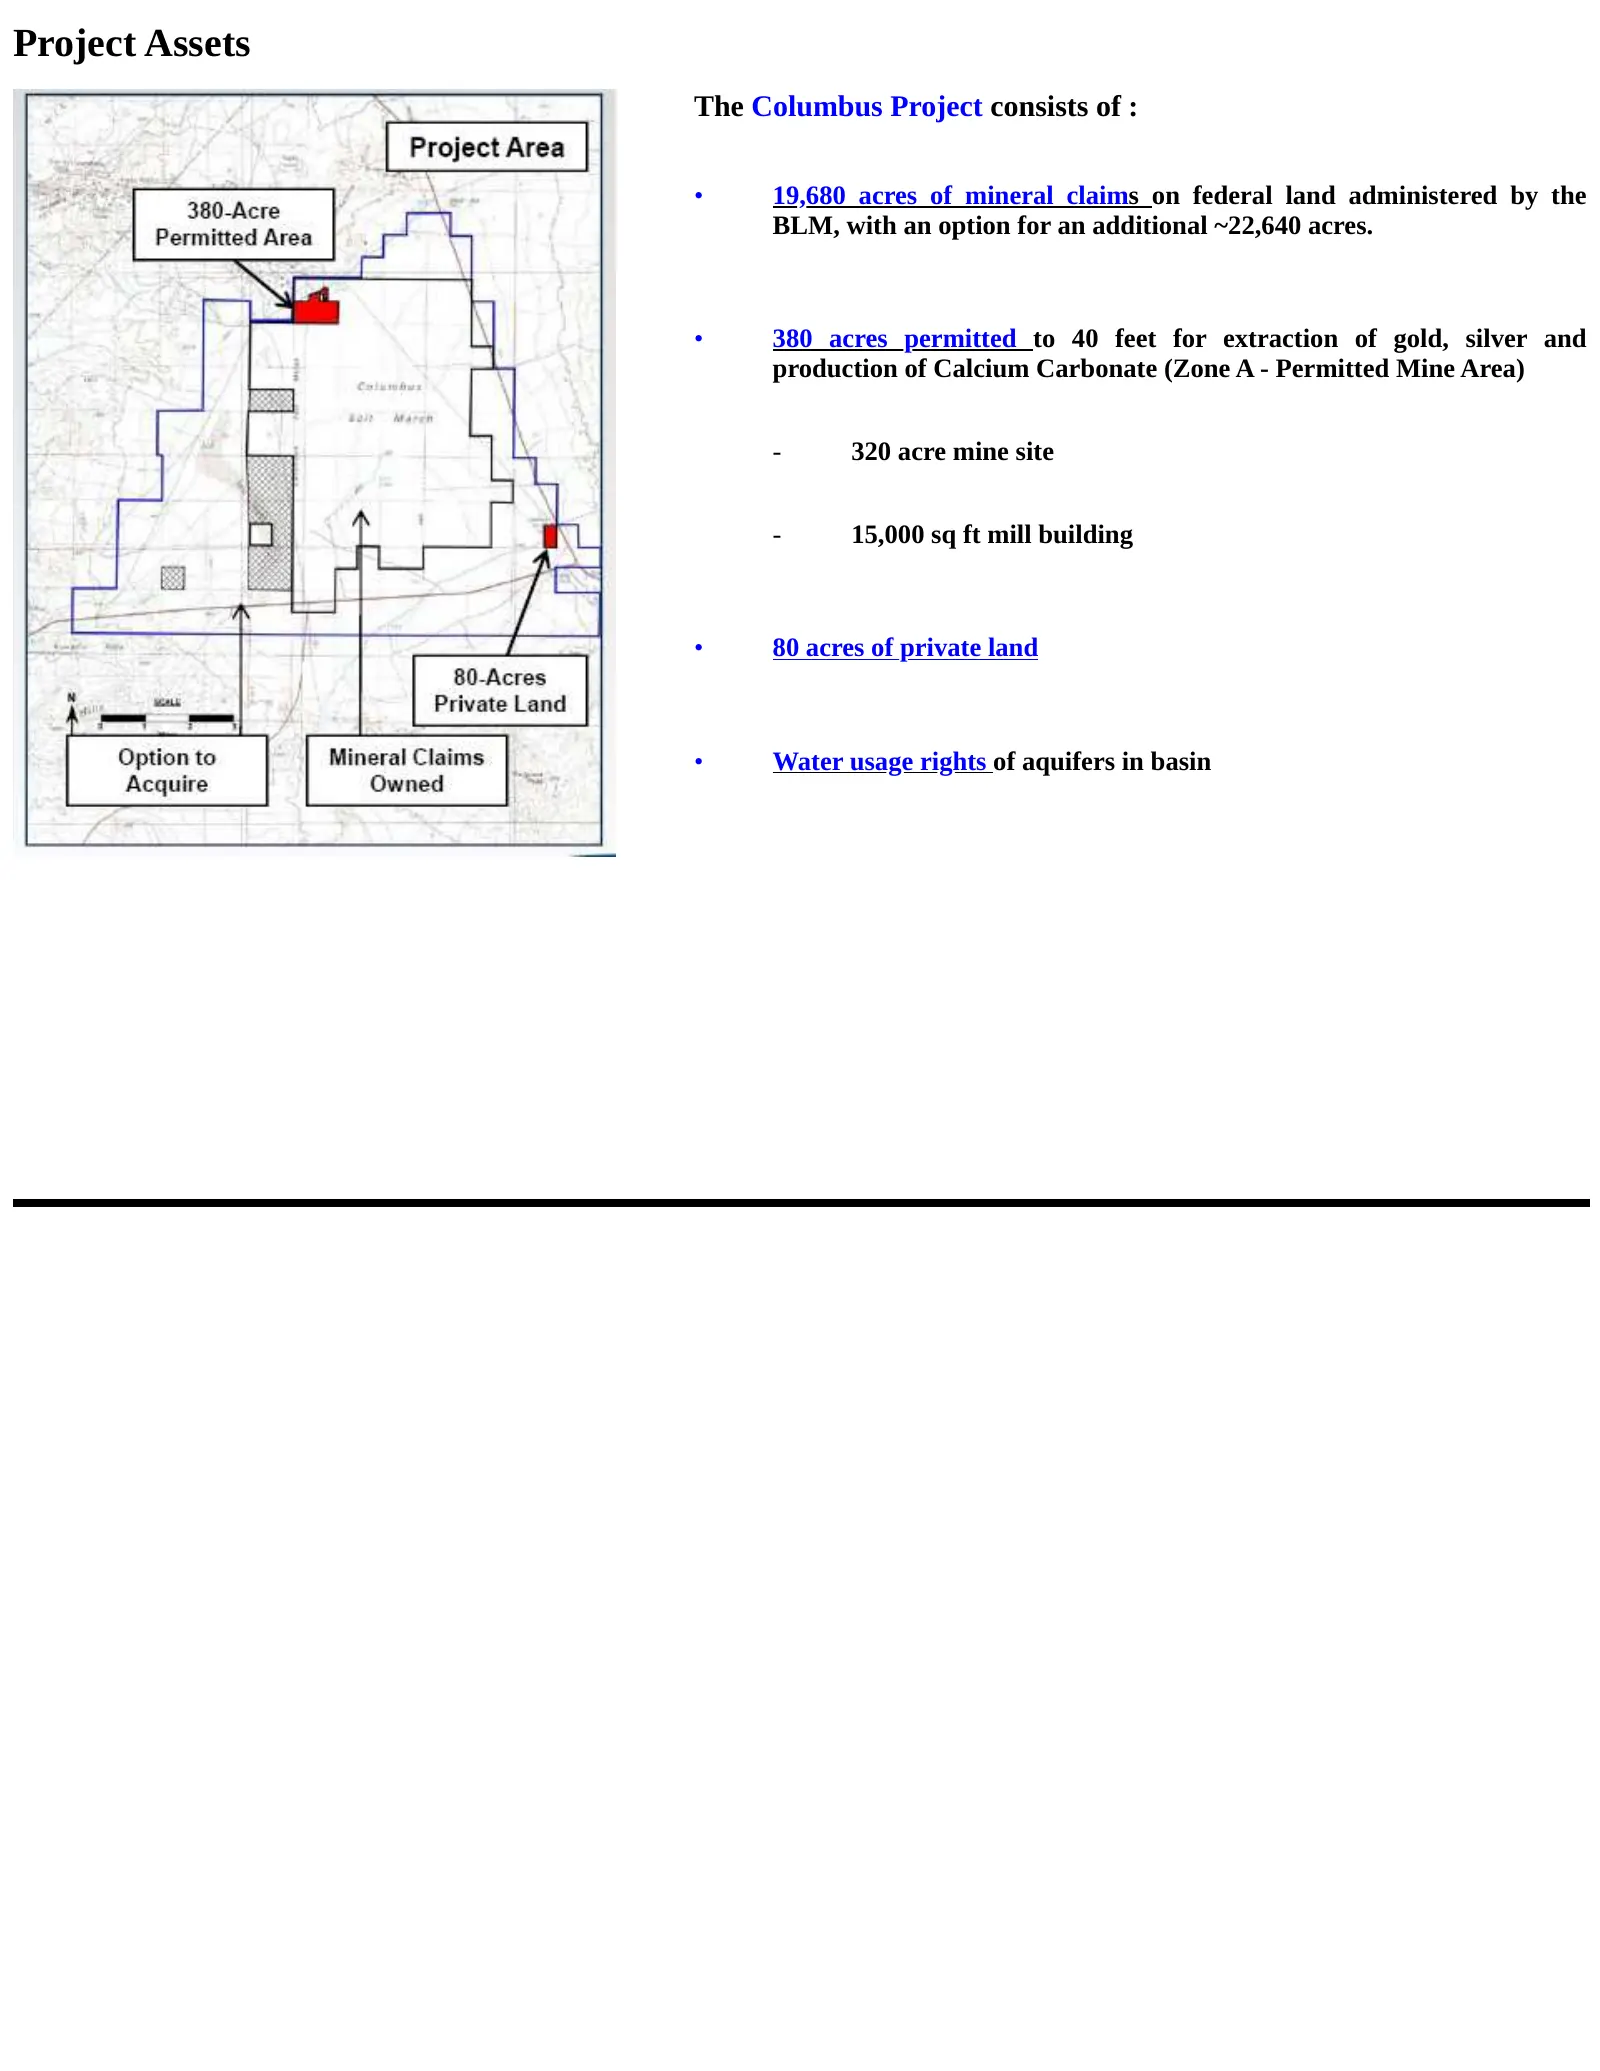
Project Assets The Columbus Project consists of : • 19,680 acres of mineral claims on federal land administered by the BLM, with an option for an additional ~22,640 acres. • 380 acres permitted to 40 feet for extraction of gold, silver and production of Calcium Carbonate (Zone A - Permitted Mine Are
Slide 9: Technical Team
Technical Team Retained independent engineering firms: Permitting Lumos & Associates – based in Reno, NV ProjectResources McEwen Geological – Drill program management / Modeling Arrakis Inc. – Mining and production process design/ Metallurgy AuRIC Labs – Drill sample analysis / Metallurgy ProjectFea
Slide 10: 2008 Exploratory Drill Program
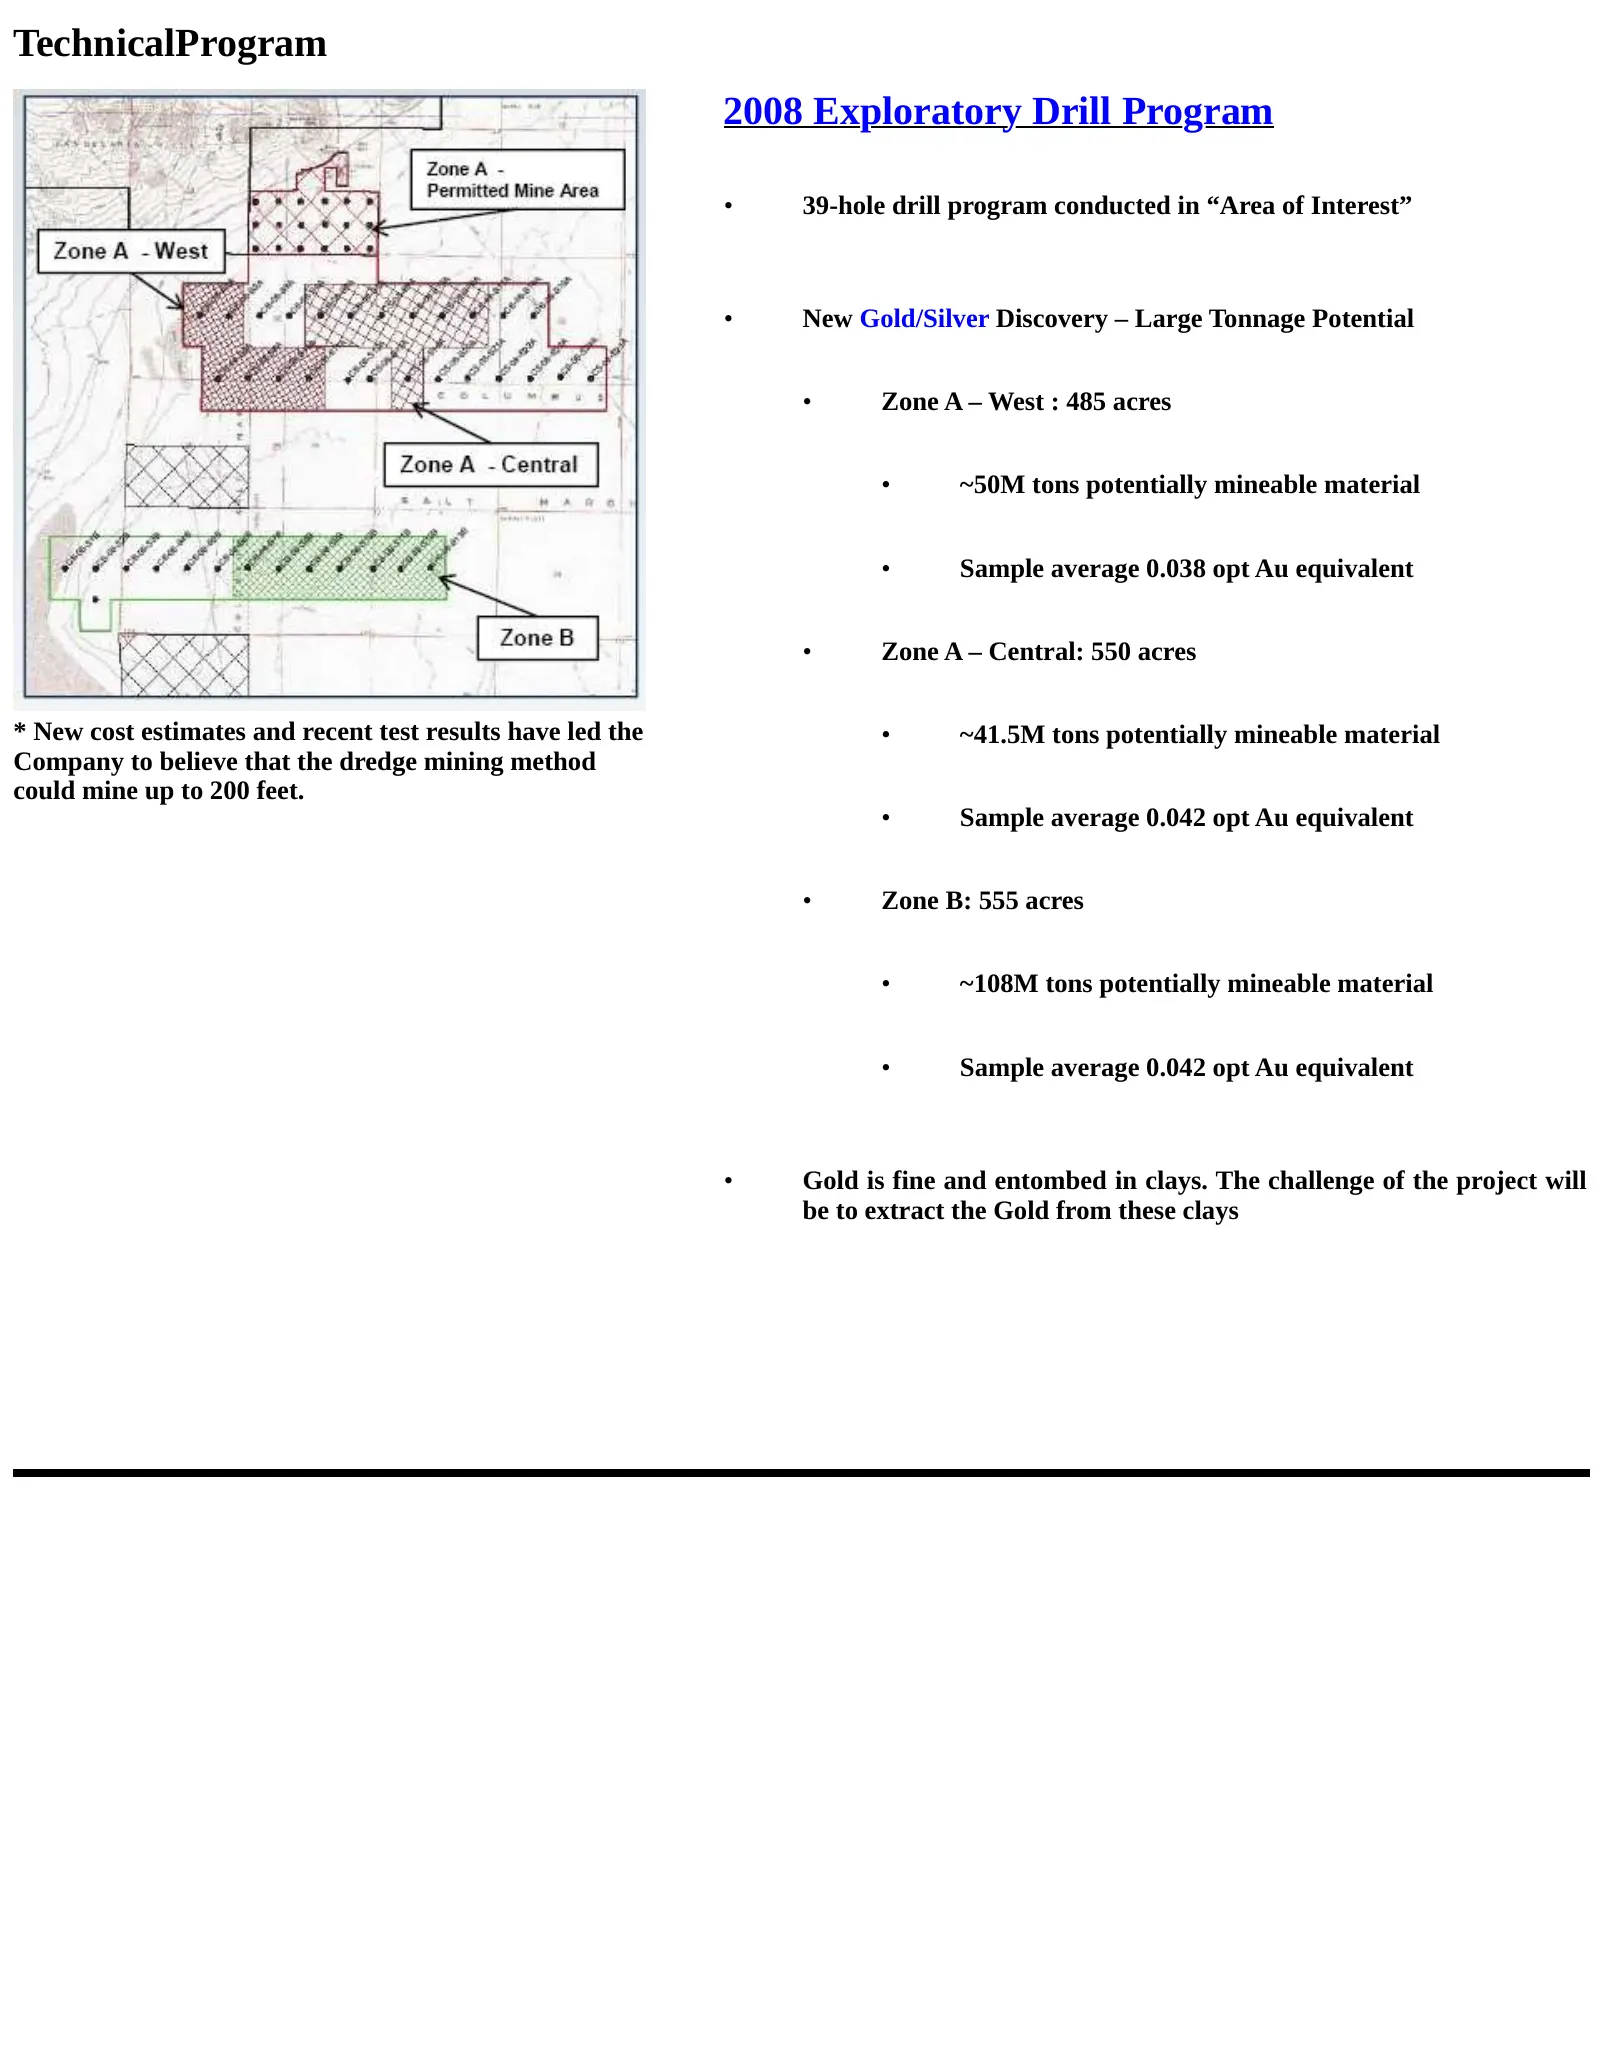
TechnicalProgram 2008 Exploratory Drill Program • 39-hole drill program conducted in “Area of Interest” • New Gold/Silver Discovery – Large Tonnage Potential • Zone A – West : 485 acres • ~50M tons potentially mineable material • Sample average 0.038 opt Au equivalent • Zone A – Central: 550 acres *
Slide 11: Zone B – Mineralized Intercepts
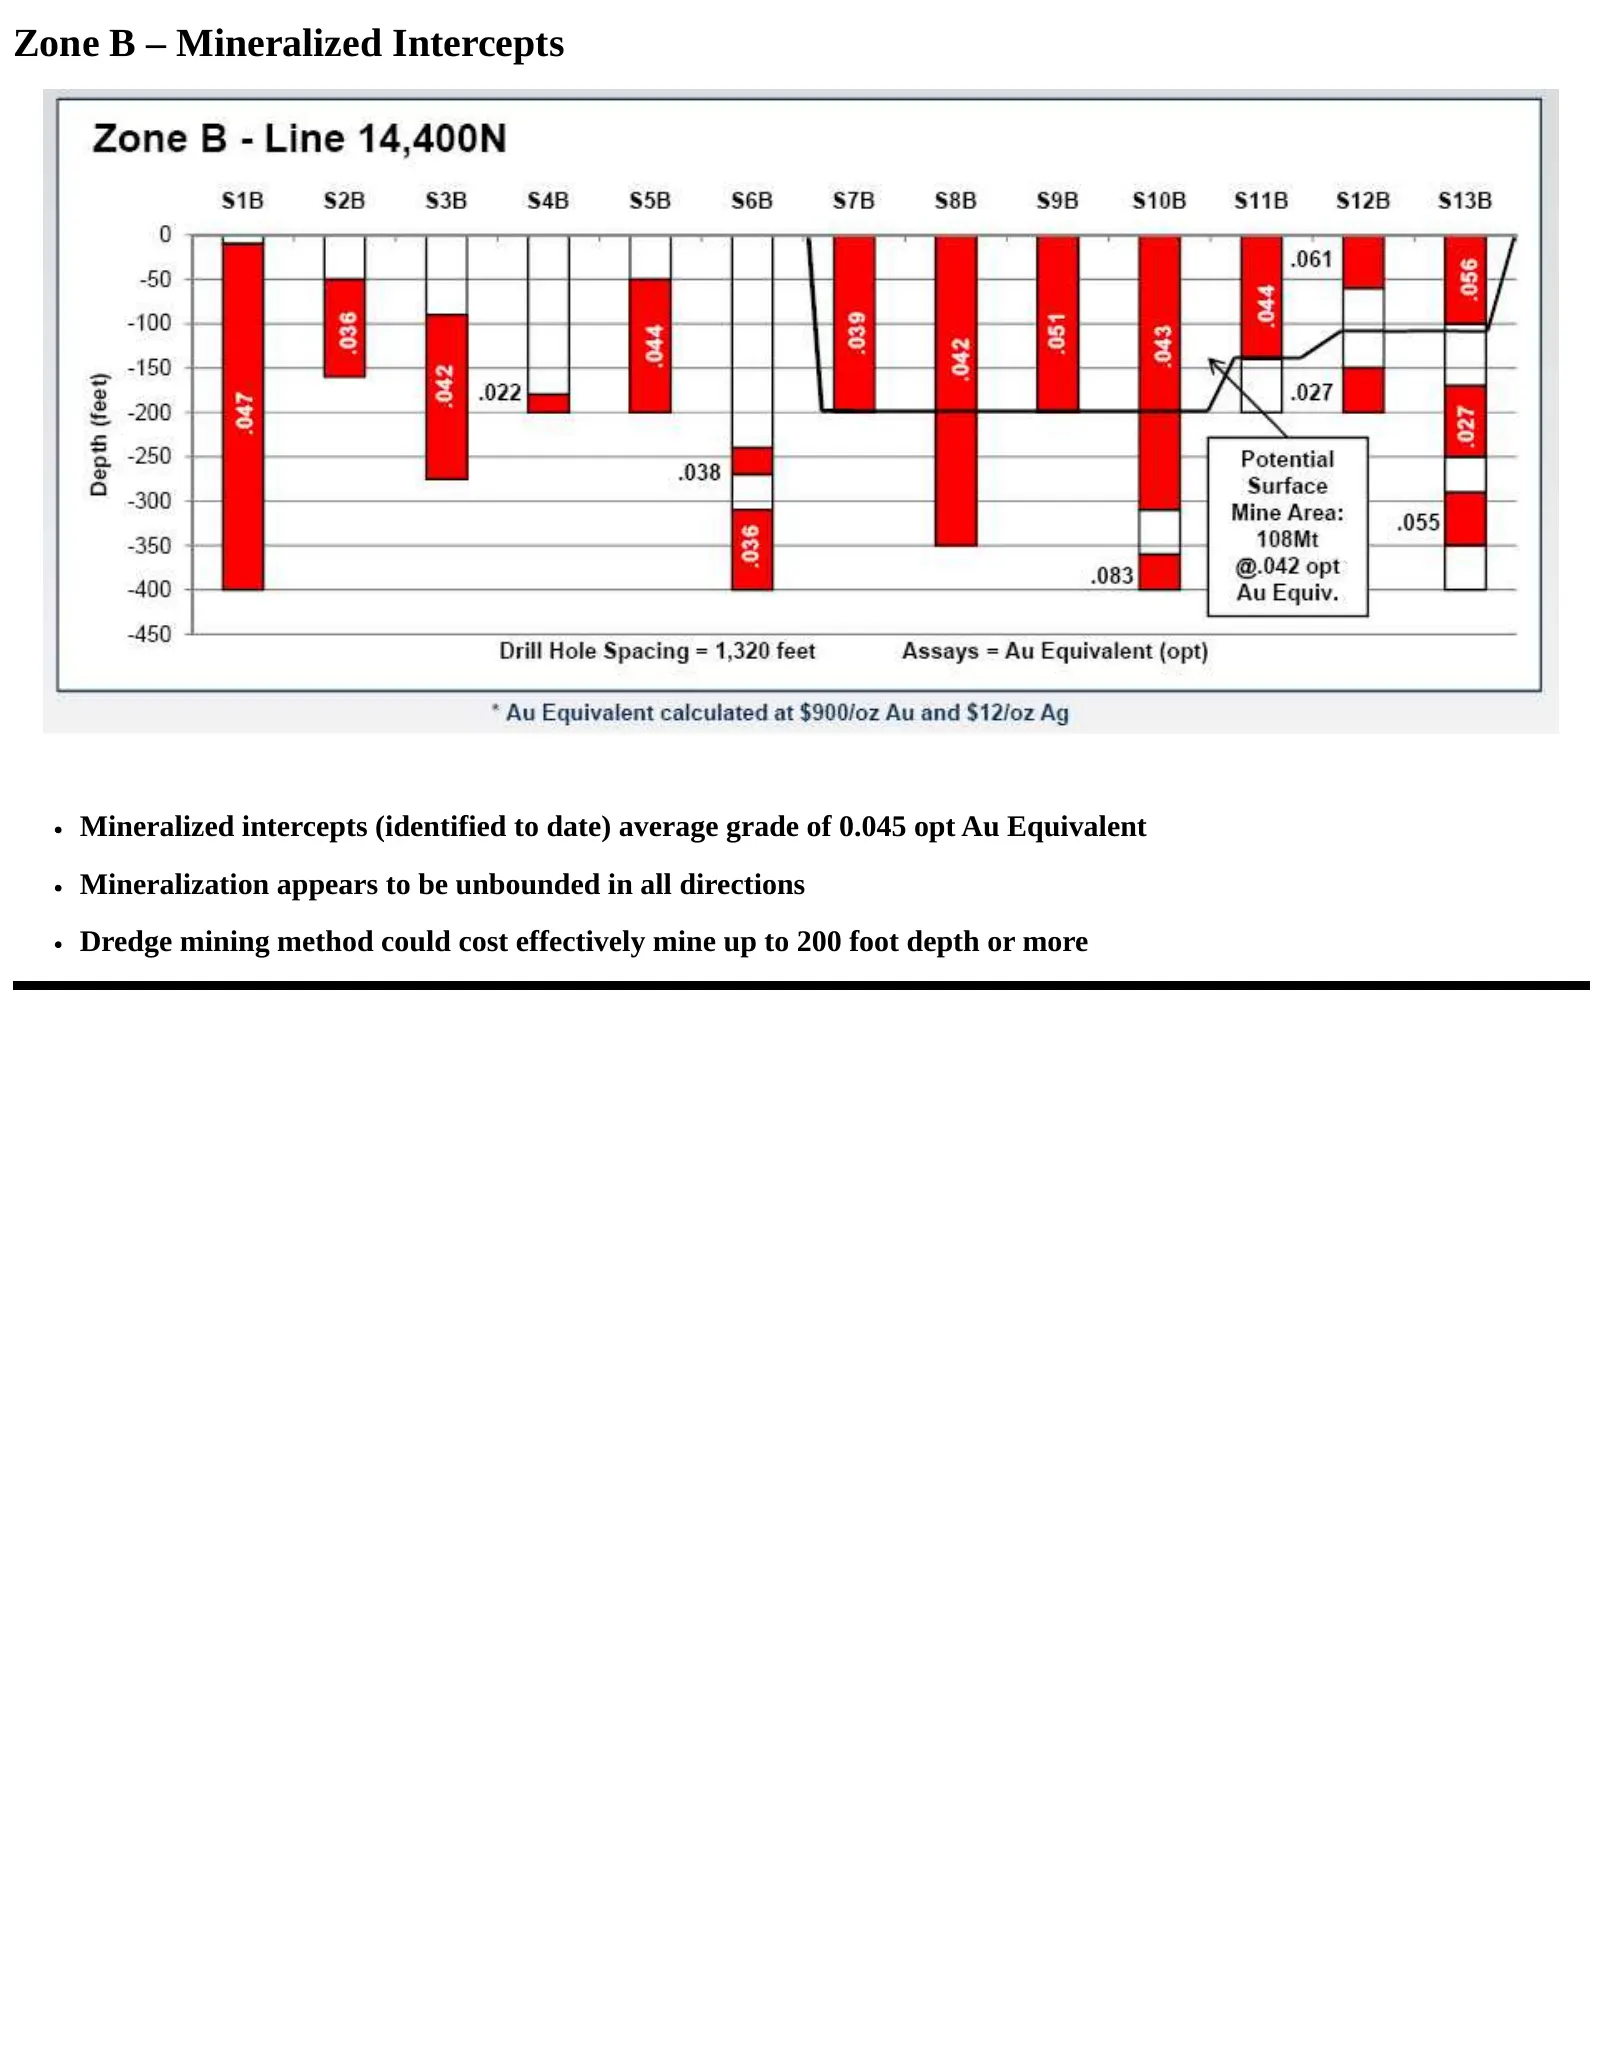
Zone B – Mineralized Intercepts Mineralized intercepts (identified to date) average grade of 0.045 opt Au Equivalent Mineralization appears to be unbounded in all directions Dredge mining method could cost effectively mine up to 200 foot depth or more
Slide 12: Geology: Aeromagnetic Survey
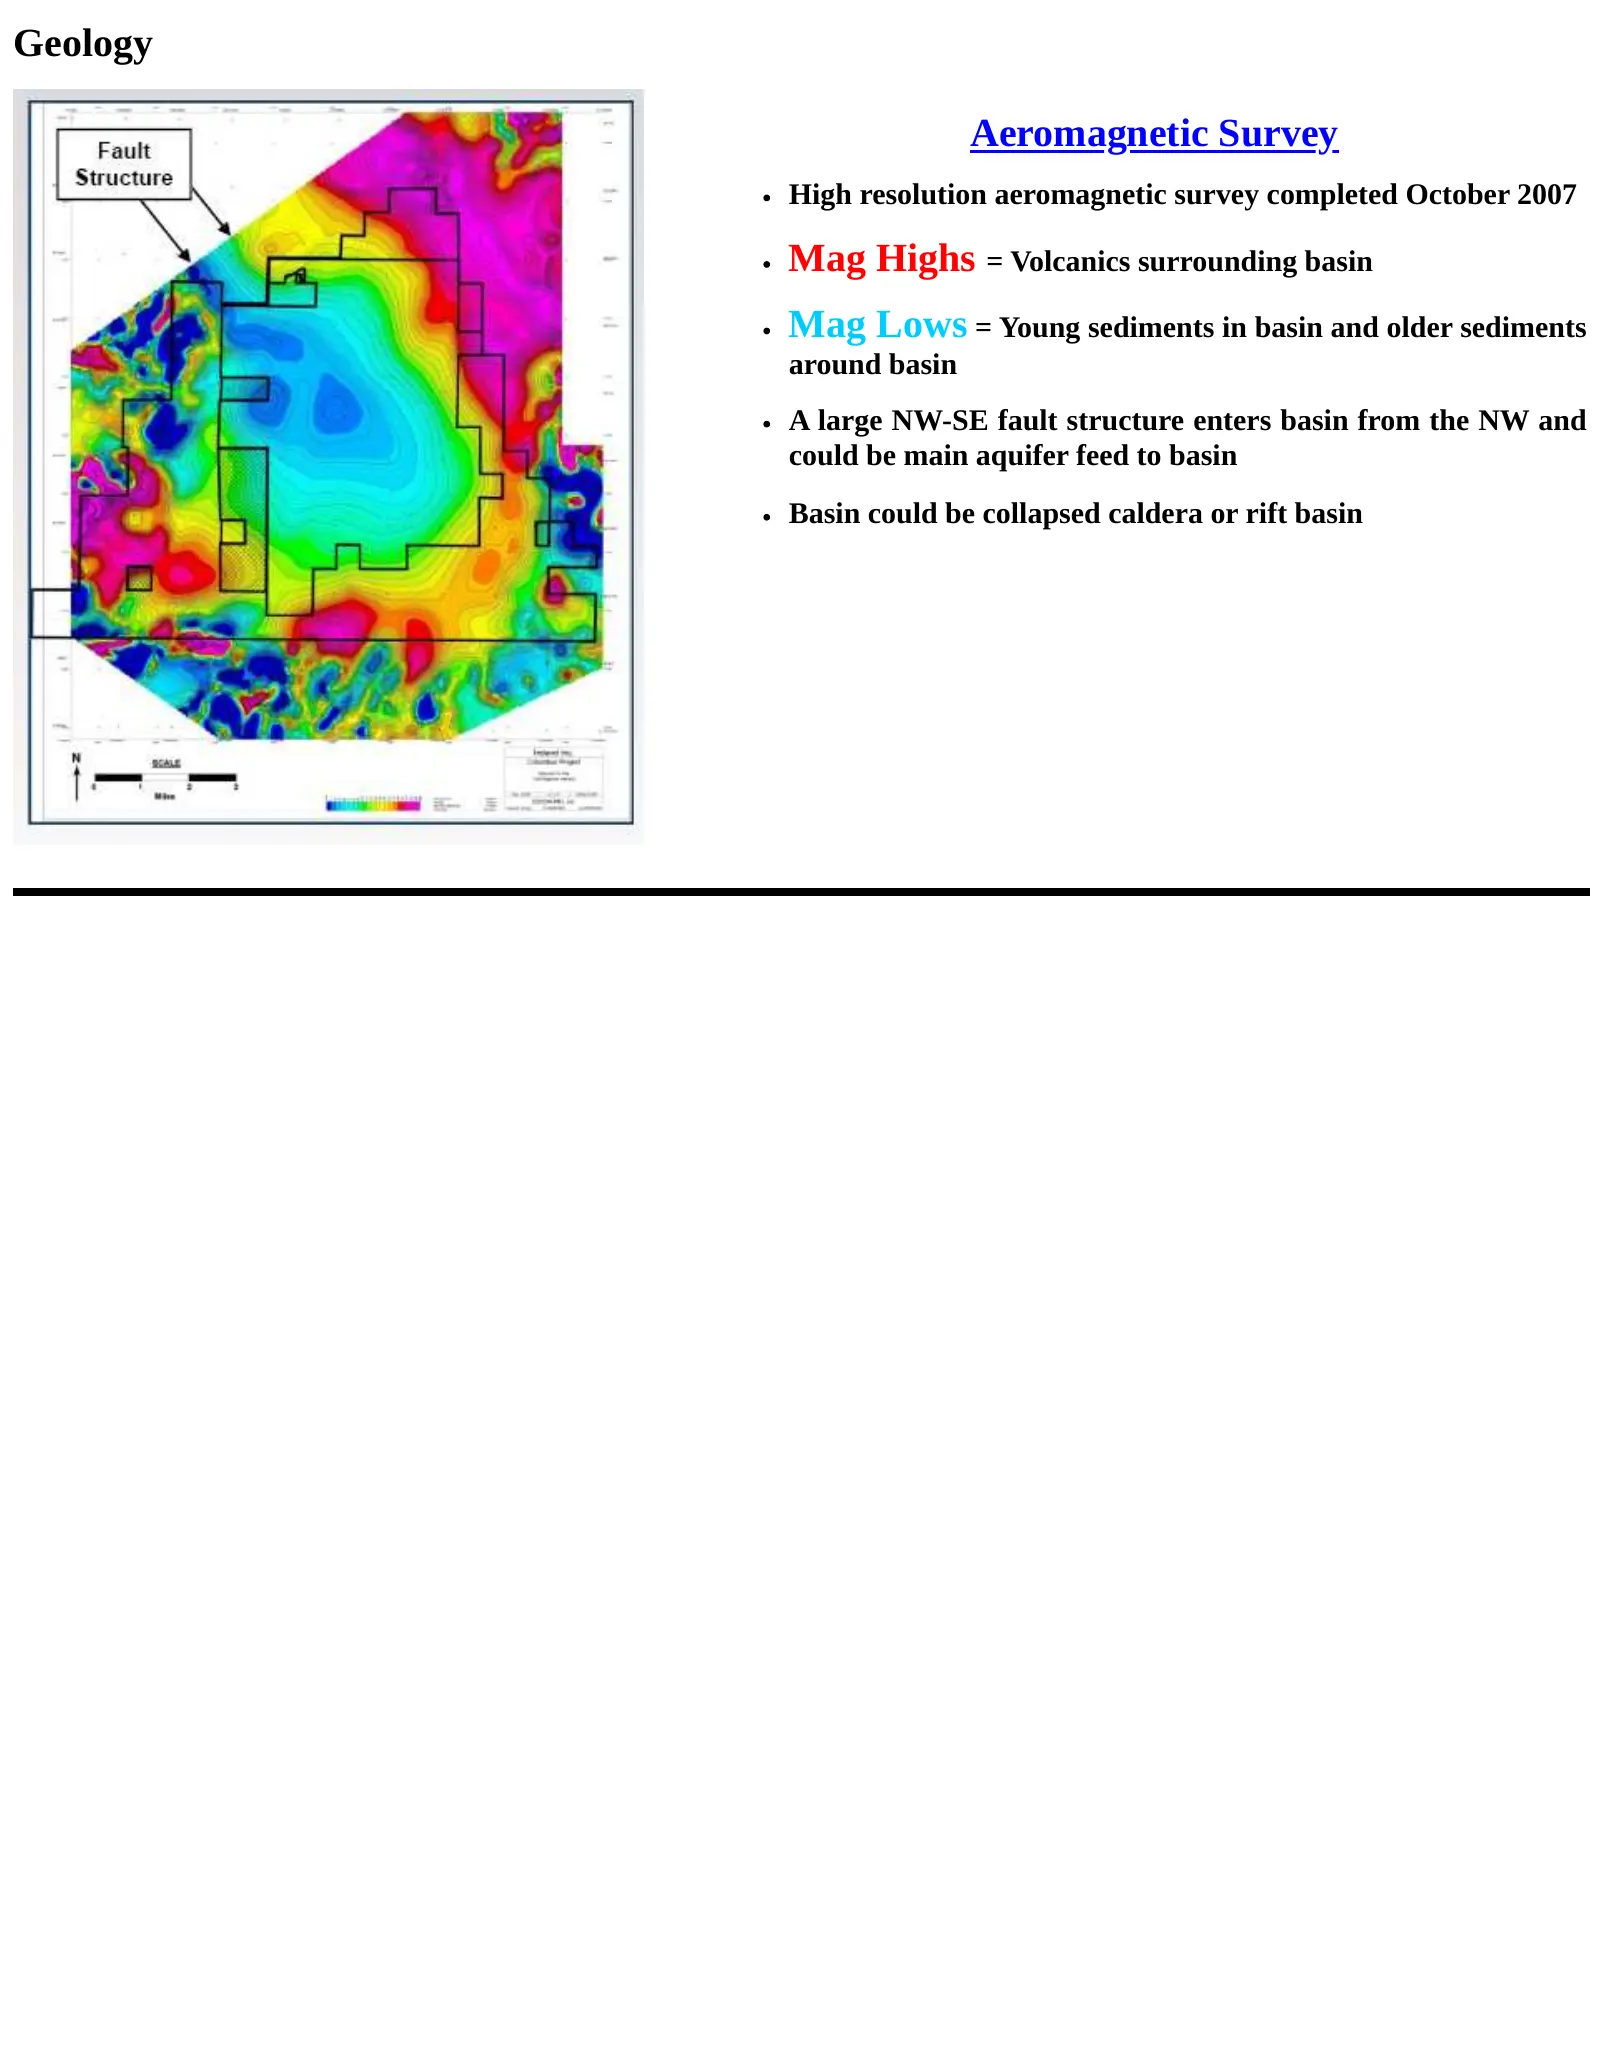
Geology Aeromagnetic Survey High resolution aeromagnetic survey completed October 2007 Mag Highs = Volcanics surrounding basin Mag Lows = Young sediments in basin and older sediments around basin A large NW-SE fault structure enters basin from the NW and could be main aquifer feed to basin Basin cou
Slide 13: Leach Test Results
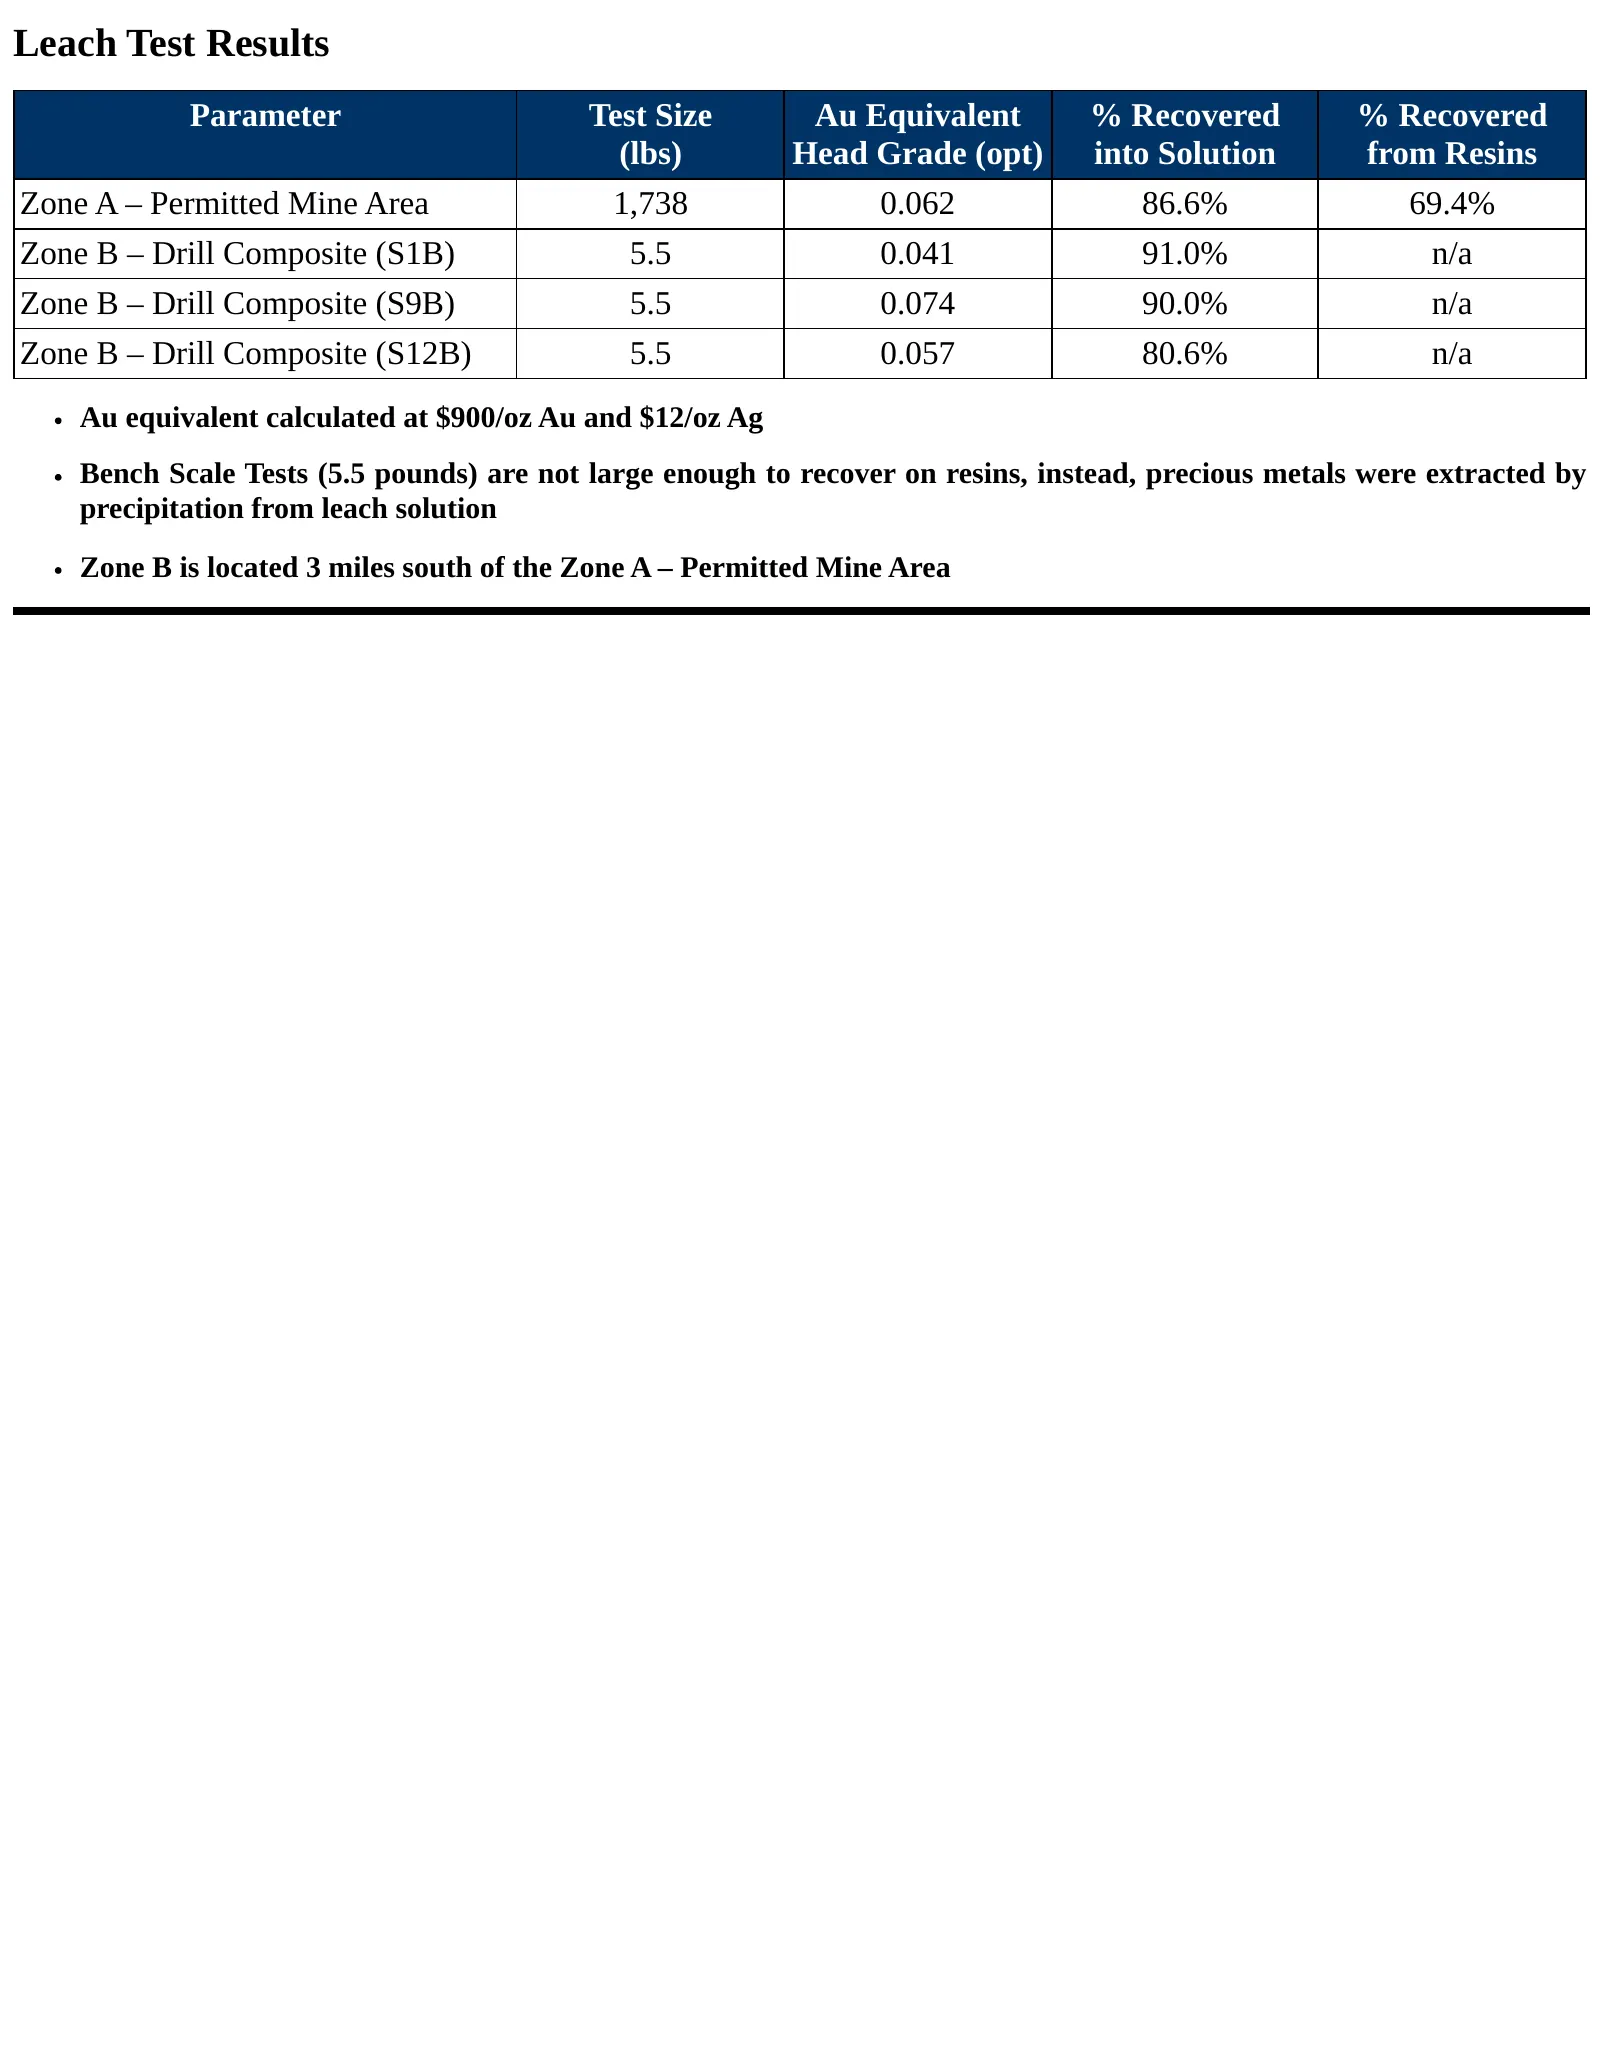
Leach Test Results Parameter Test Size Au Equivalent % Recovered % Recovered (lbs) Head Grade (opt) into Solution from Resins Zone A – Permitted Mine Area 1,738 0.062 86.6% 69.4% Zone B – Drill Composite (S1B) 5.5 0.041 91.0% n/a Zone B – Drill Composite (S9B) 5.5 0.074 90.0% n/a Zone B – Drill Comp
Slide 14: Potential of Mineralized Area
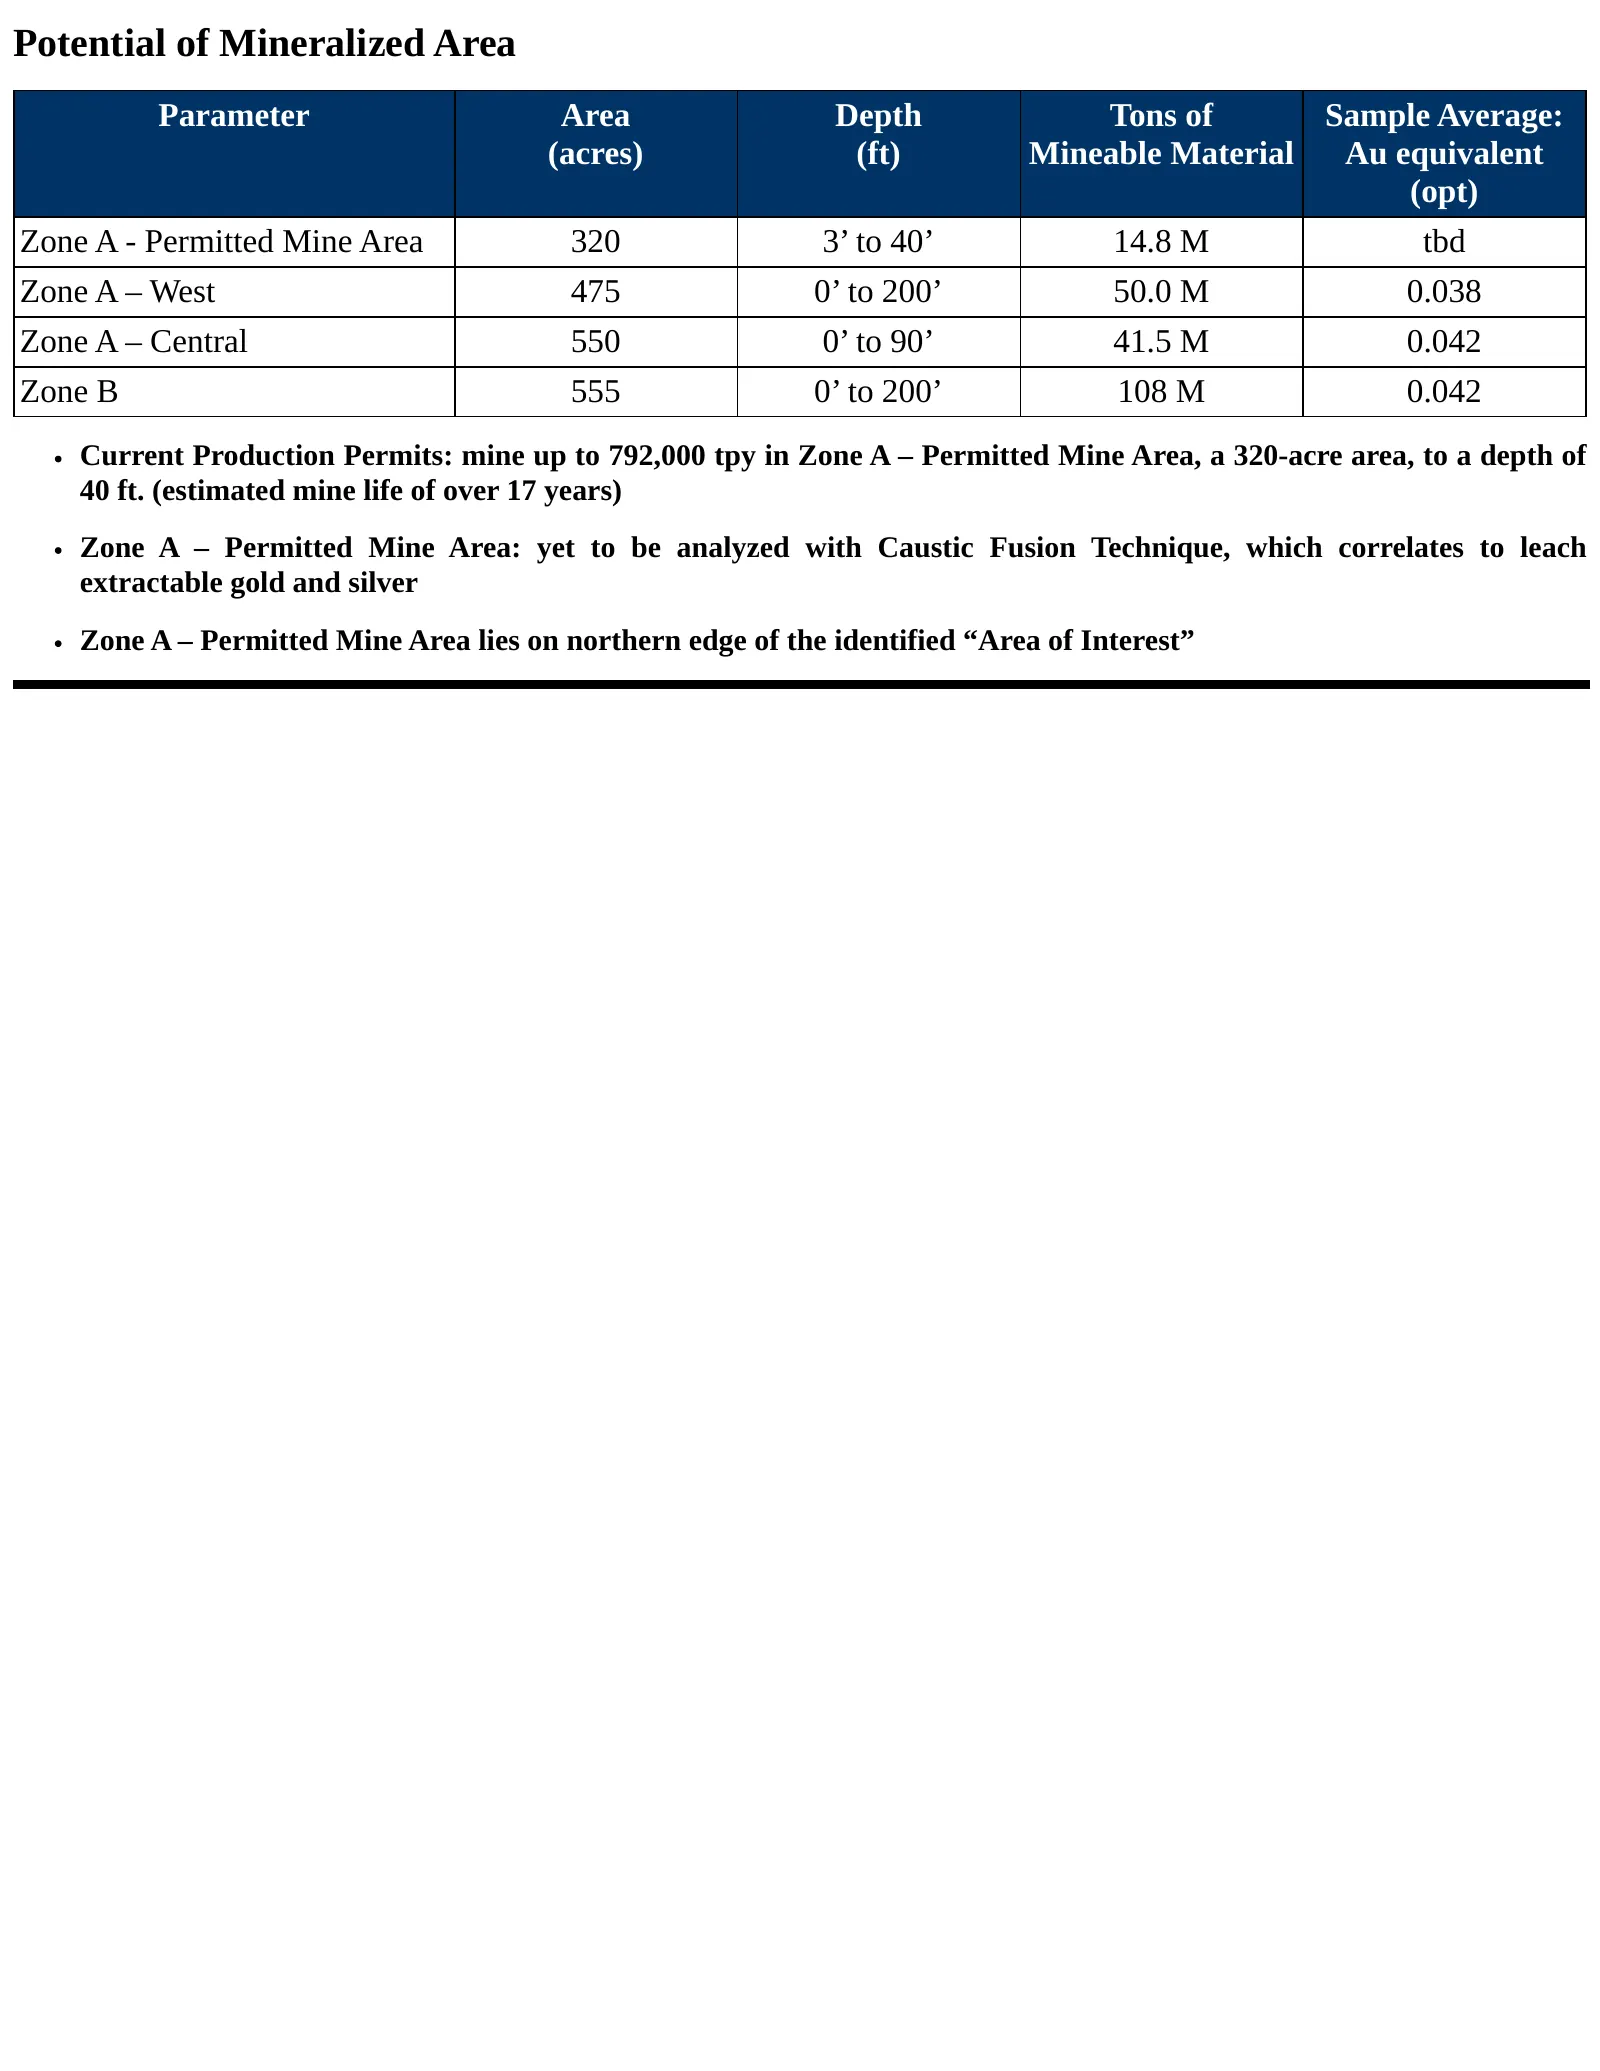
Potential of Mineralized Area Parameter Area Depth Tons of Sample Average: (acres) (ft) Mineable Material Au equivalent (opt) Zone A - Permitted Mine Area 320 3’ to 40’ 14.8 M tbd Zone A – West 475 0’ to 200’ 50.0 M 0.038 Zone A – Central 550 0’ to 90’ 41.5 M 0.042 Zone B 555 0’ to 200’ 108 M 0.042
Slide 15: Project Feasibility
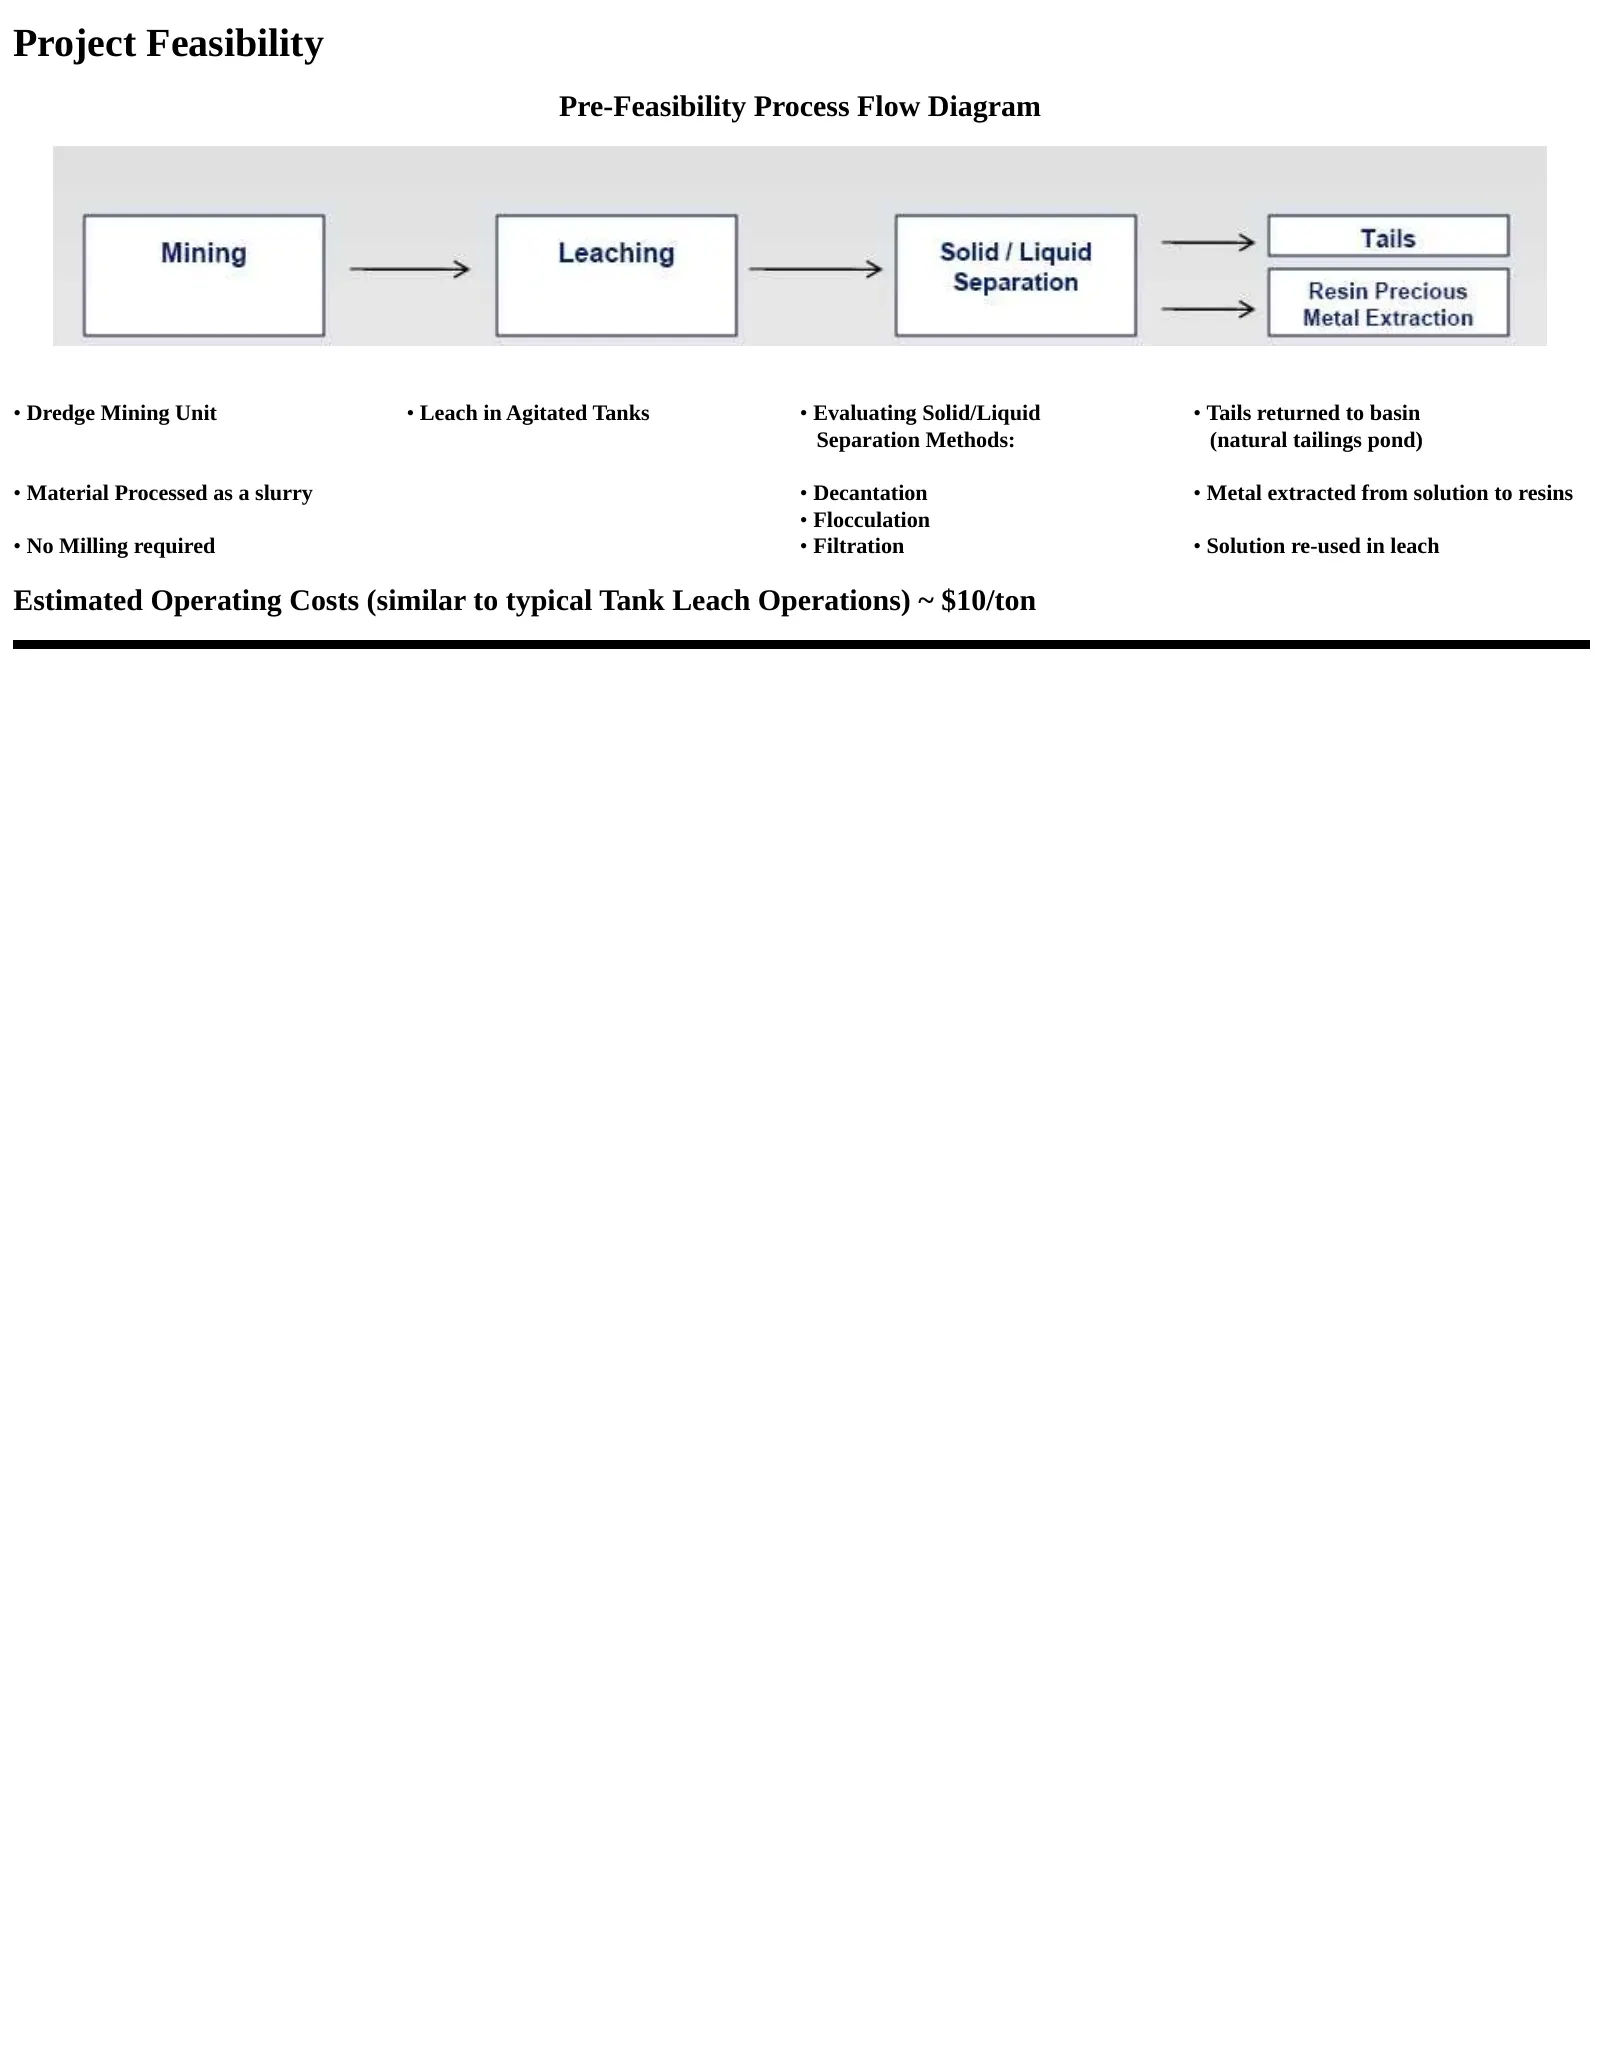
Project Feasibility Pre-Feasibility Process Flow Diagram • Dredge Mining Unit • Leach in Agitated Tanks • Evaluating Solid/Liquid • Tails returned to basin Separation Methods: (natural tailings pond) • Material Processed as a slurry • Decantation • Metal extracted from solution to resins • Flocculat
Slide 16: Recent Milestones
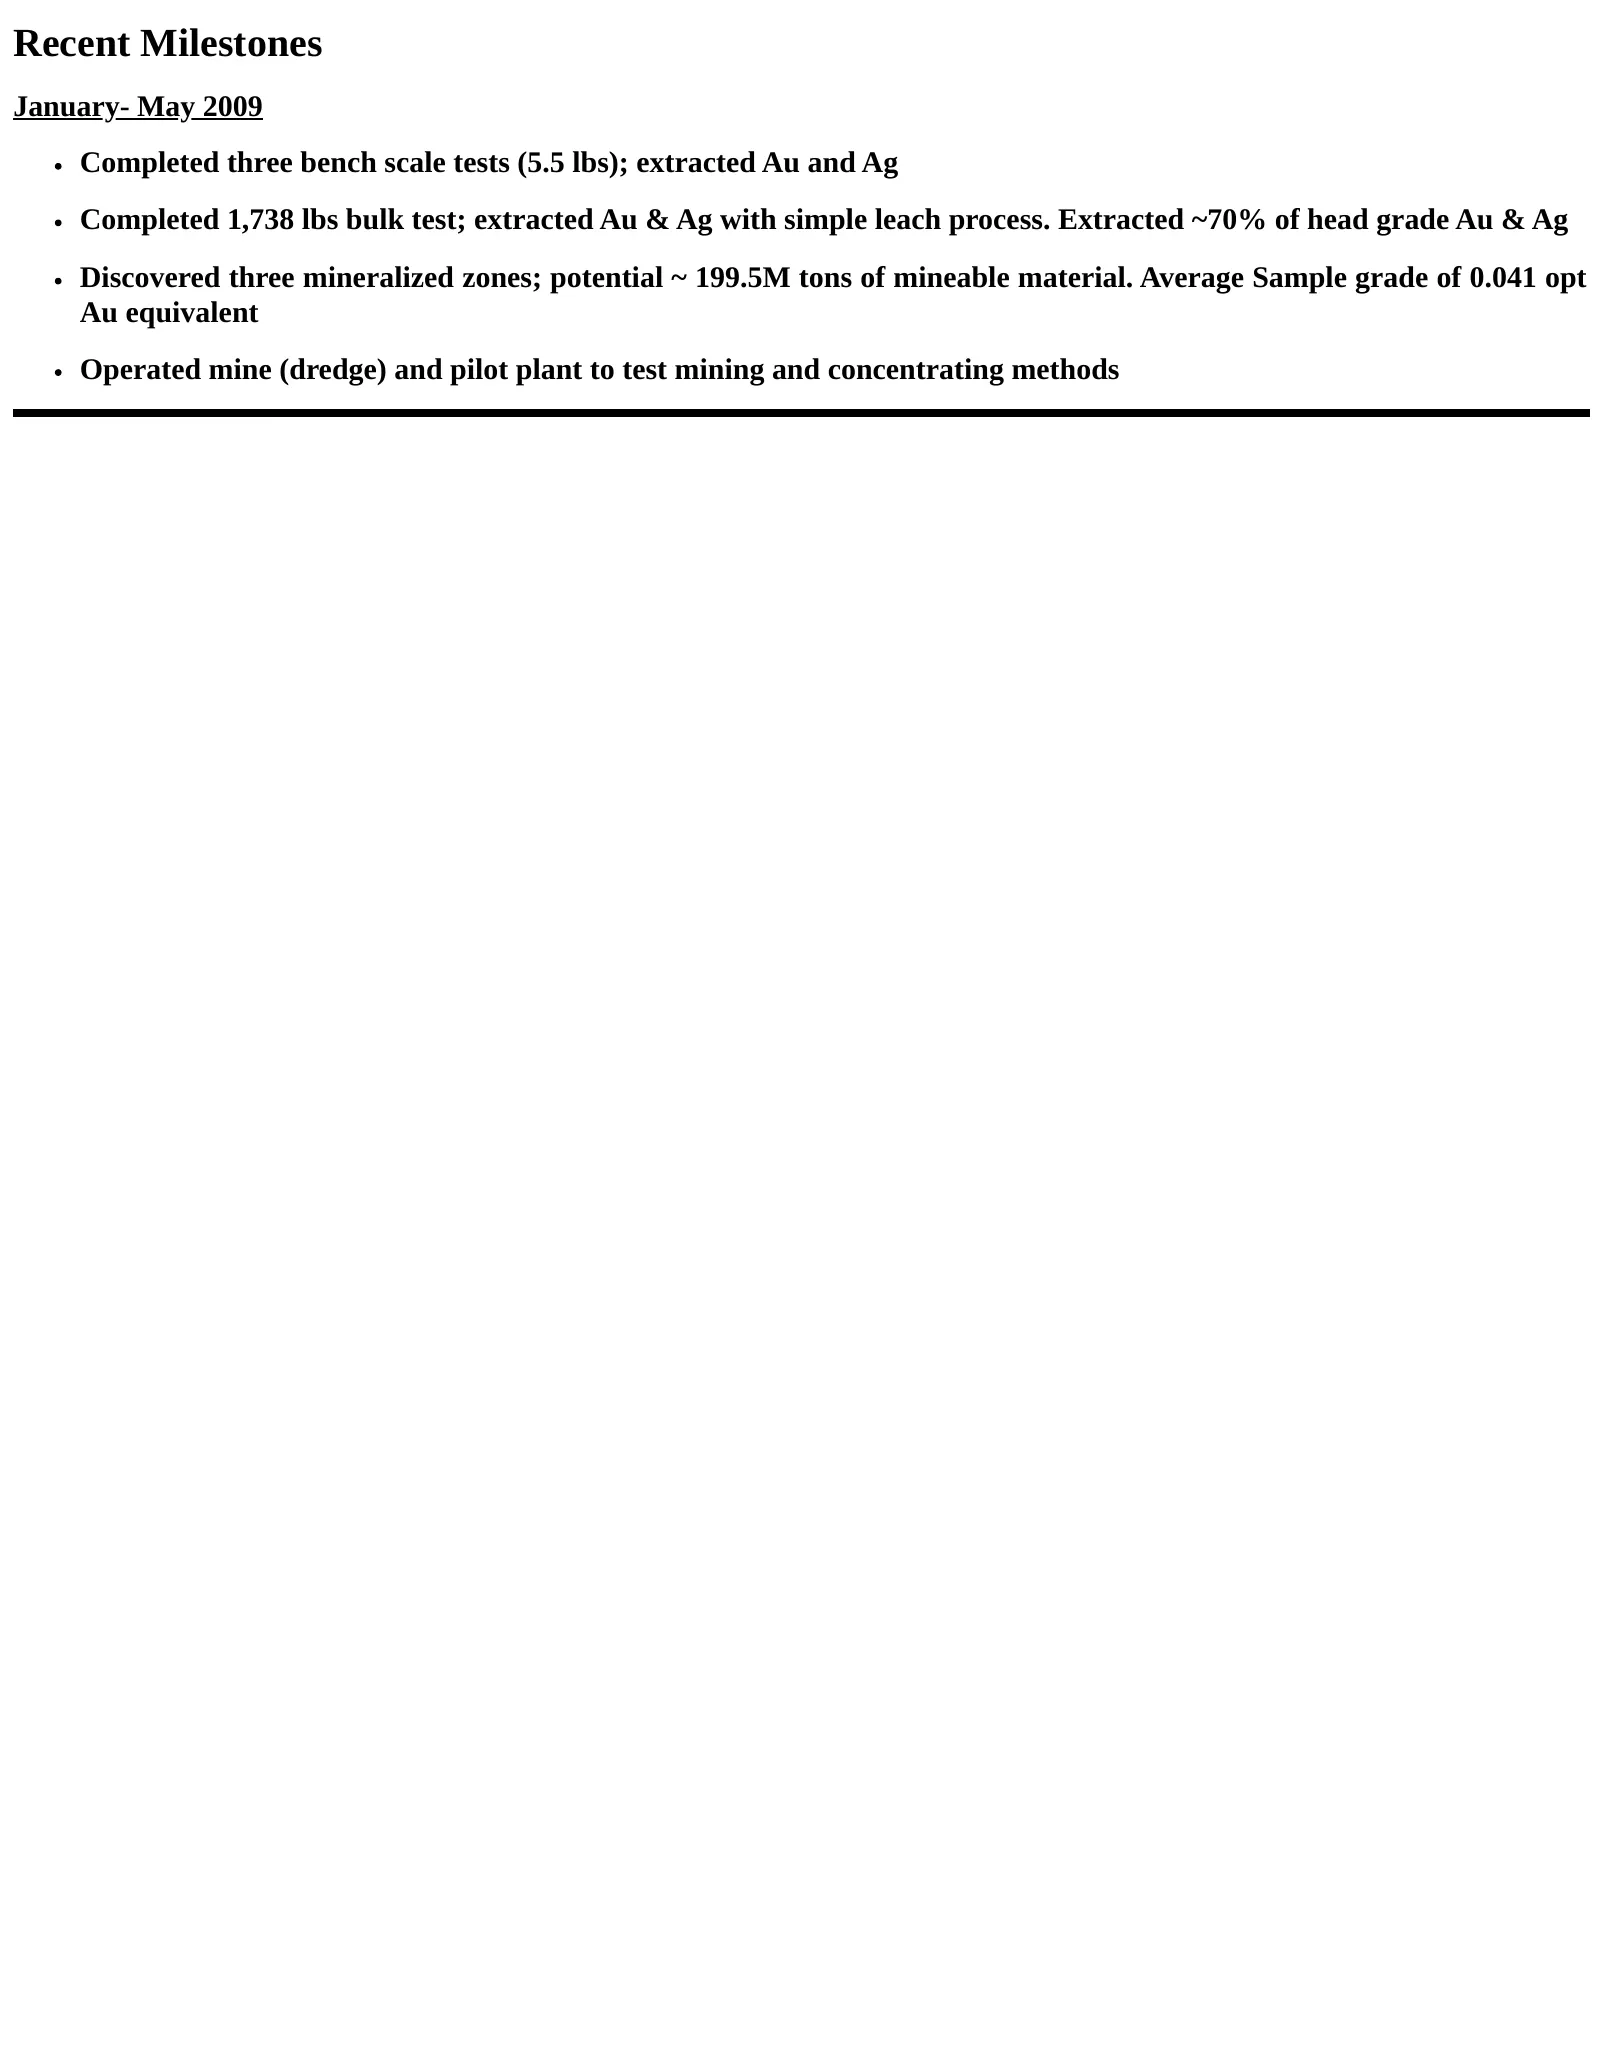
Recent Milestones January- May 2009 Completed three bench scale tests (5.5 lbs); extracted Au and Ag Completed 1,738 lbs bulk test; extracted Au & Ag with simple leach process. Extracted ~70% of head grade Au & Ag Discovered three mineralized zones; potential ~ 199.5M tons of mineable material. Aver
Slide 17: Project Development- 2009
Project Development- 2009 Determine Project Reserves Expand drilled area with 2009 drill program Calculate project resources and reserves Complete National Instrument 43-101 technical report Complete Project Feasibility Complete additional bench/bulk leach tests Operate on-site pilot plant to optimi
Slide 18: Summary
Summary The Columbus Project represents a solid exploration and production opportunity: Full permit for the extraction of Gold and Silver and the production of Calcium Carbonate “Big Box Store” of mining operations: high volume and low cost Near term production potential
Slide 19: Red Mountain Project
Red Mountain Project
Slide 20: Red Mountain Overview
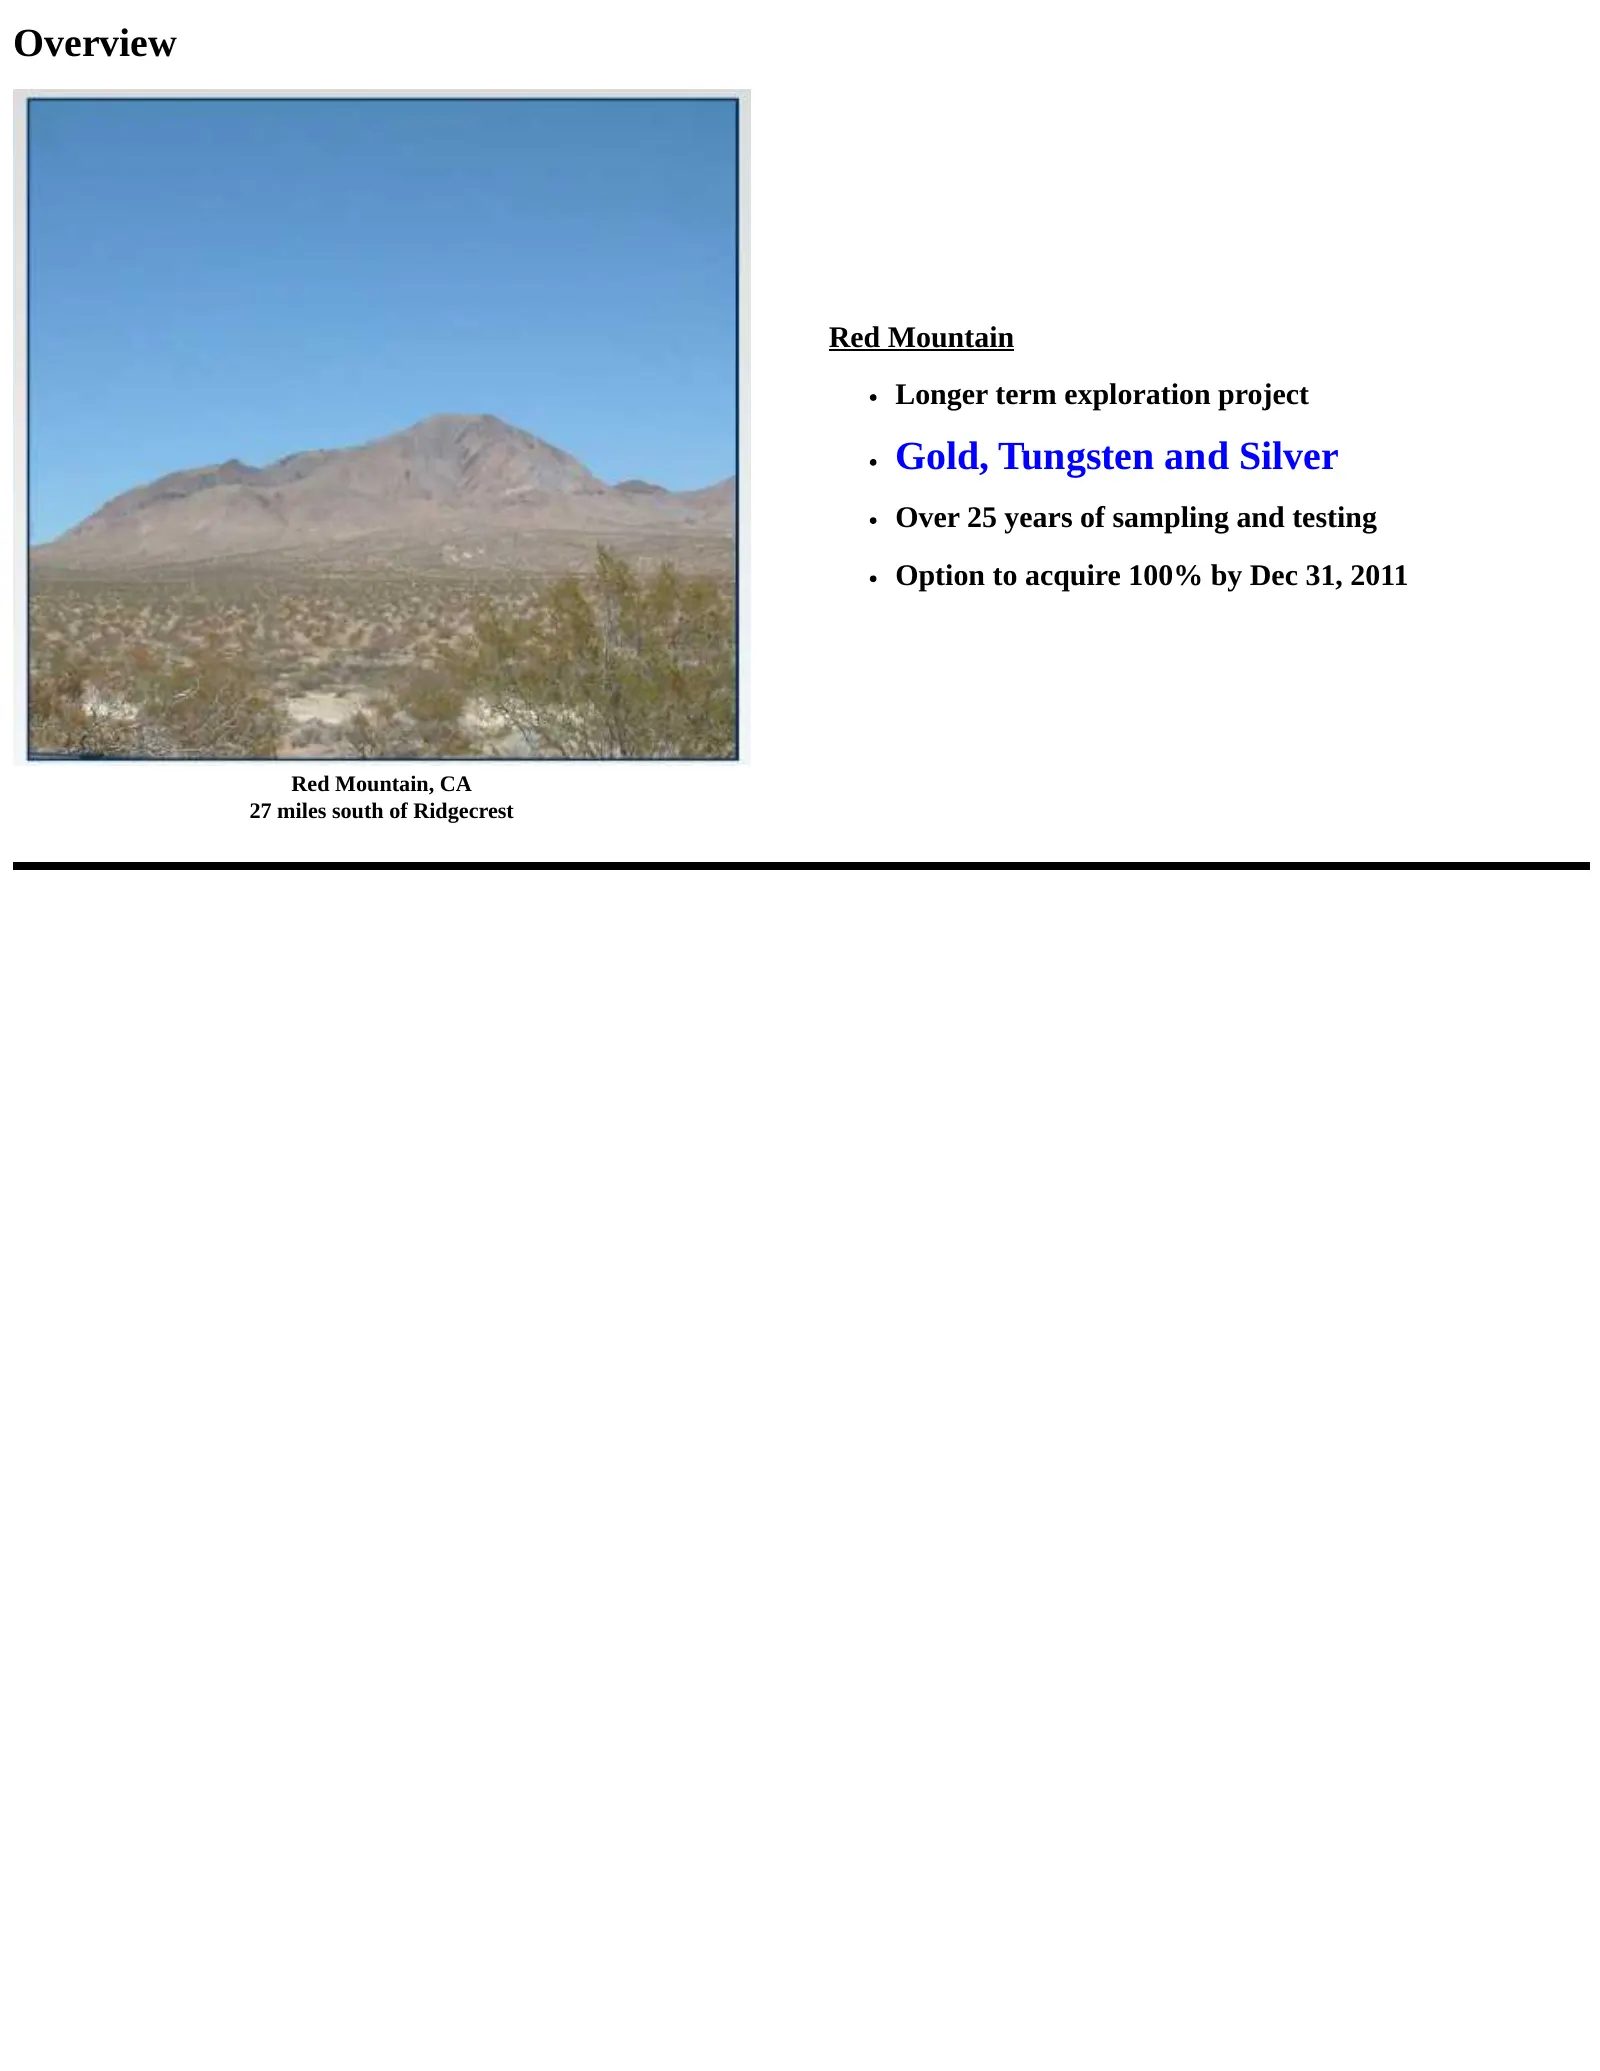
Overview Red Mountain Longer term exploration project Gold, Tungsten and Silver Over 25 years of sampling and testing Option to acquire 100% by Dec 31, 2011 Red Mountain, CA 27 miles south of Ridgecrest
Slide 21: History and Project Assets
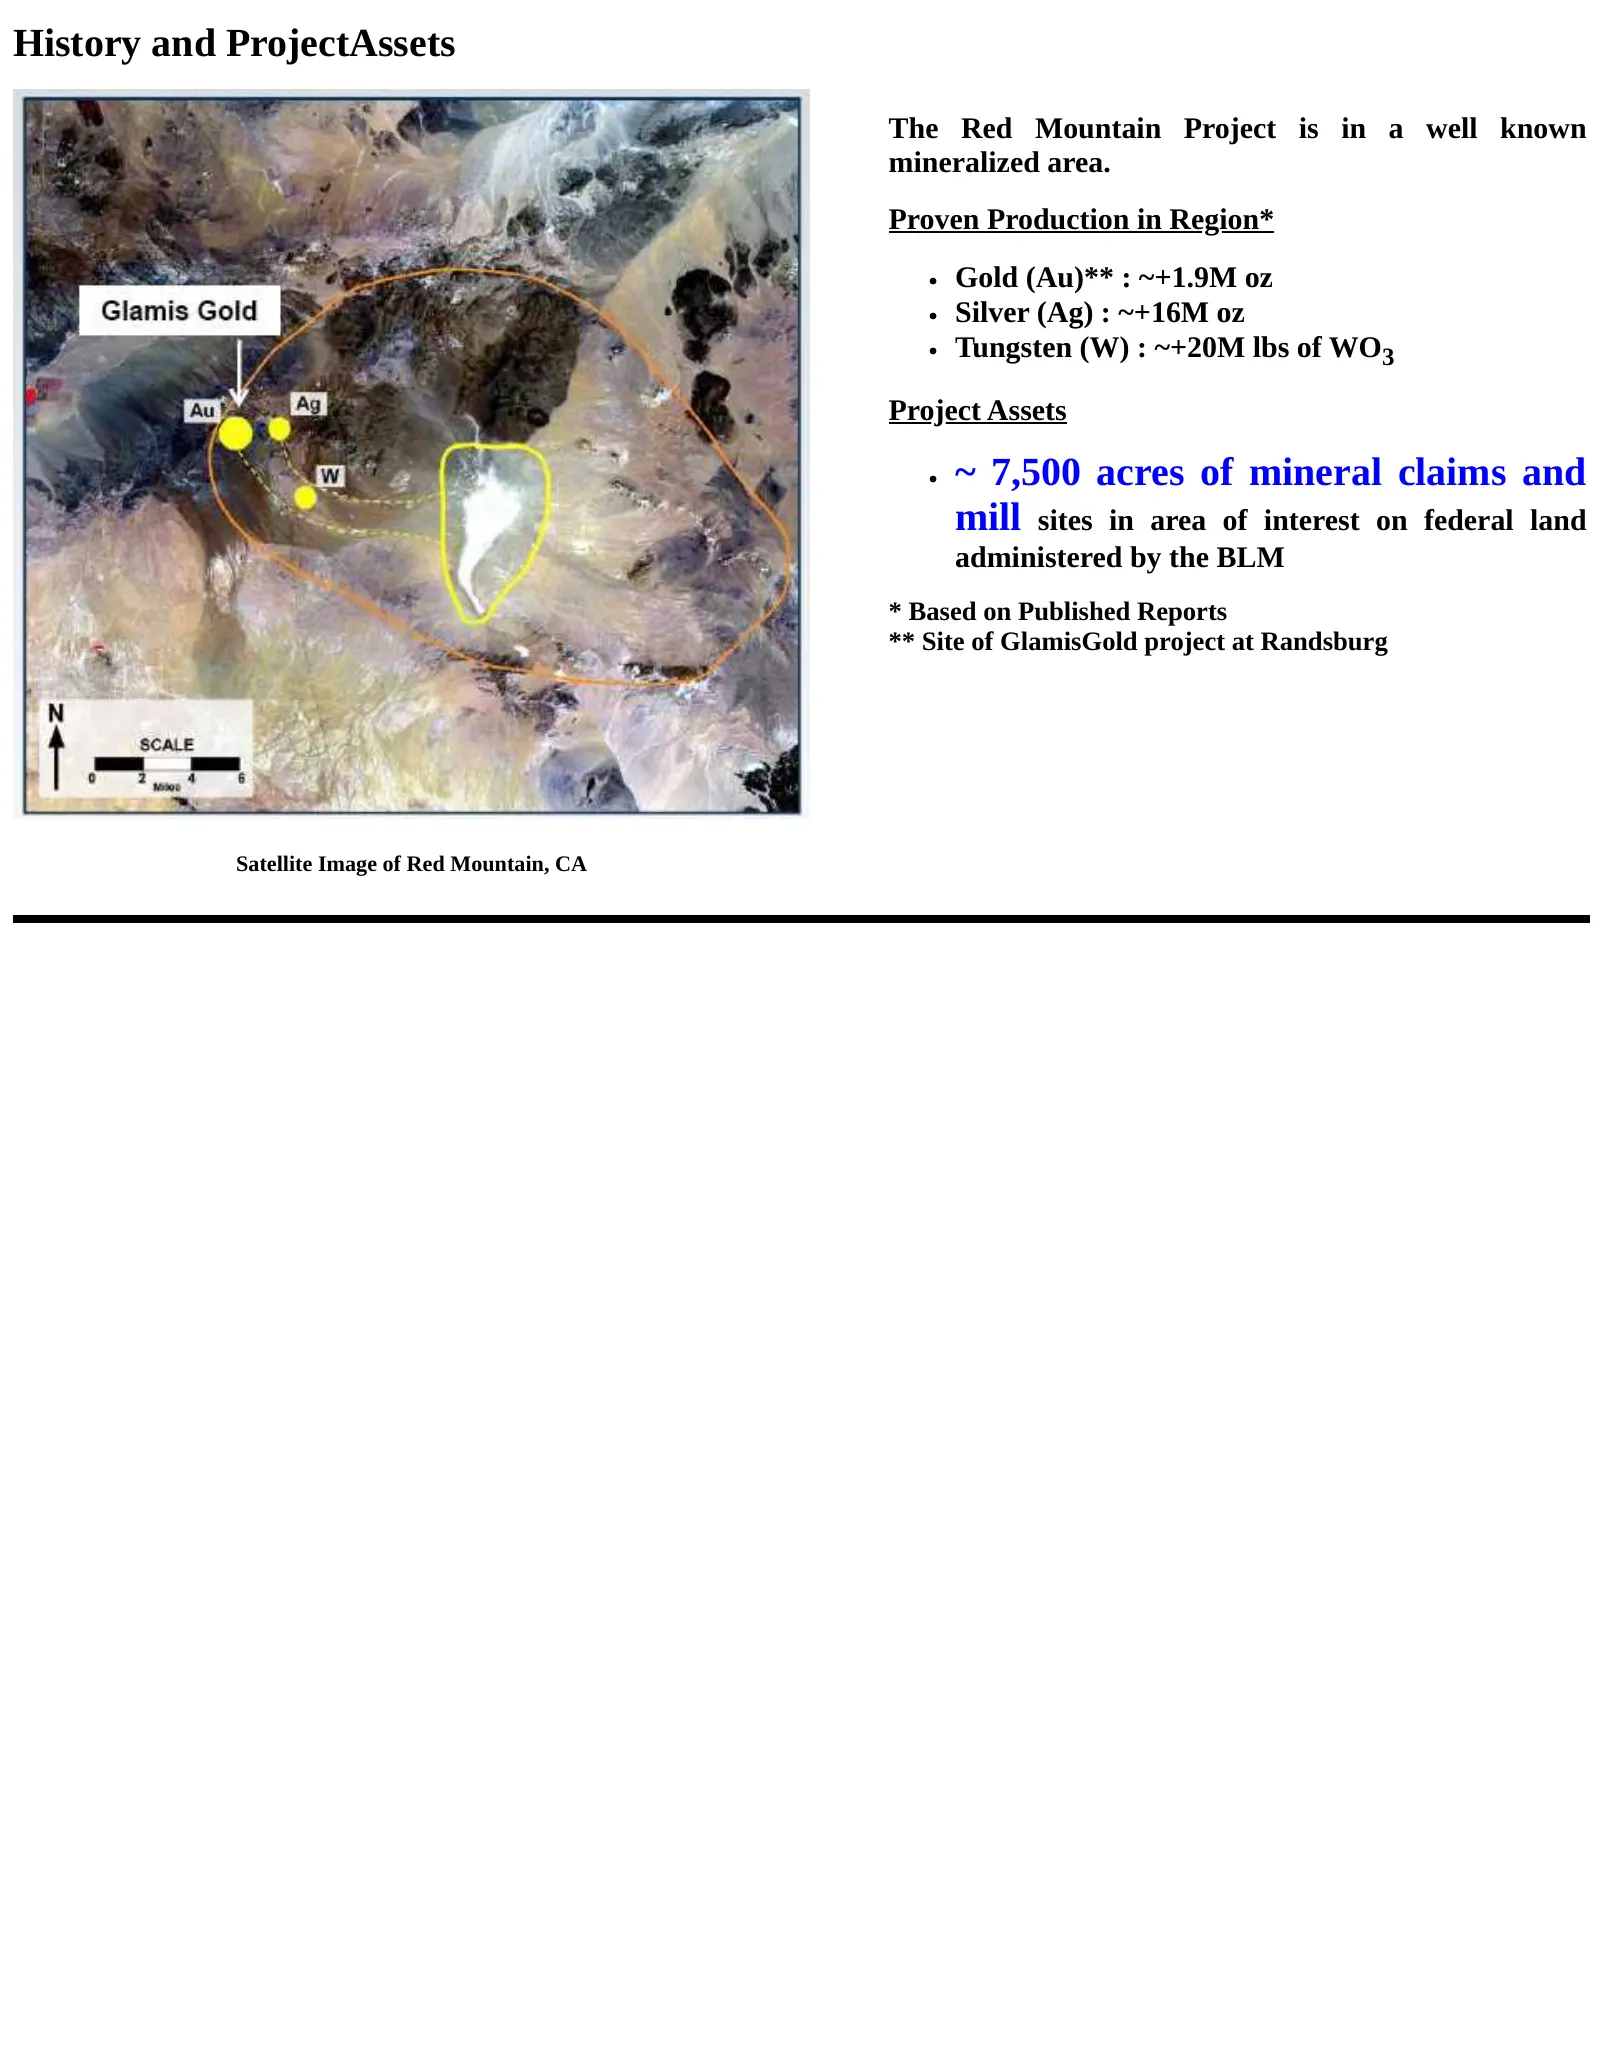
History and ProjectAssets The Red Mountain Project is in a well known mineralized area. Proven Production in Region* Gold (Au)** : ~+1.9M oz Silver (Ag) : ~+16M oz Tungsten (W) : ~+20M lbs of WO3 Project Assets ~ 7,500 acres of mineral claims and mill sites in area of interest on federal land admini
Slide 22: Summary
Summary The Red Mountain Project represents a solid exploration and production opportunity for Au/W/Ag. The Red Mountain project is very appealing due to its location in a historical mining district, the project’s size and economic potential.

Slide 23: Financial Information
Financial Information
Slide 24: Capitalization and Finances
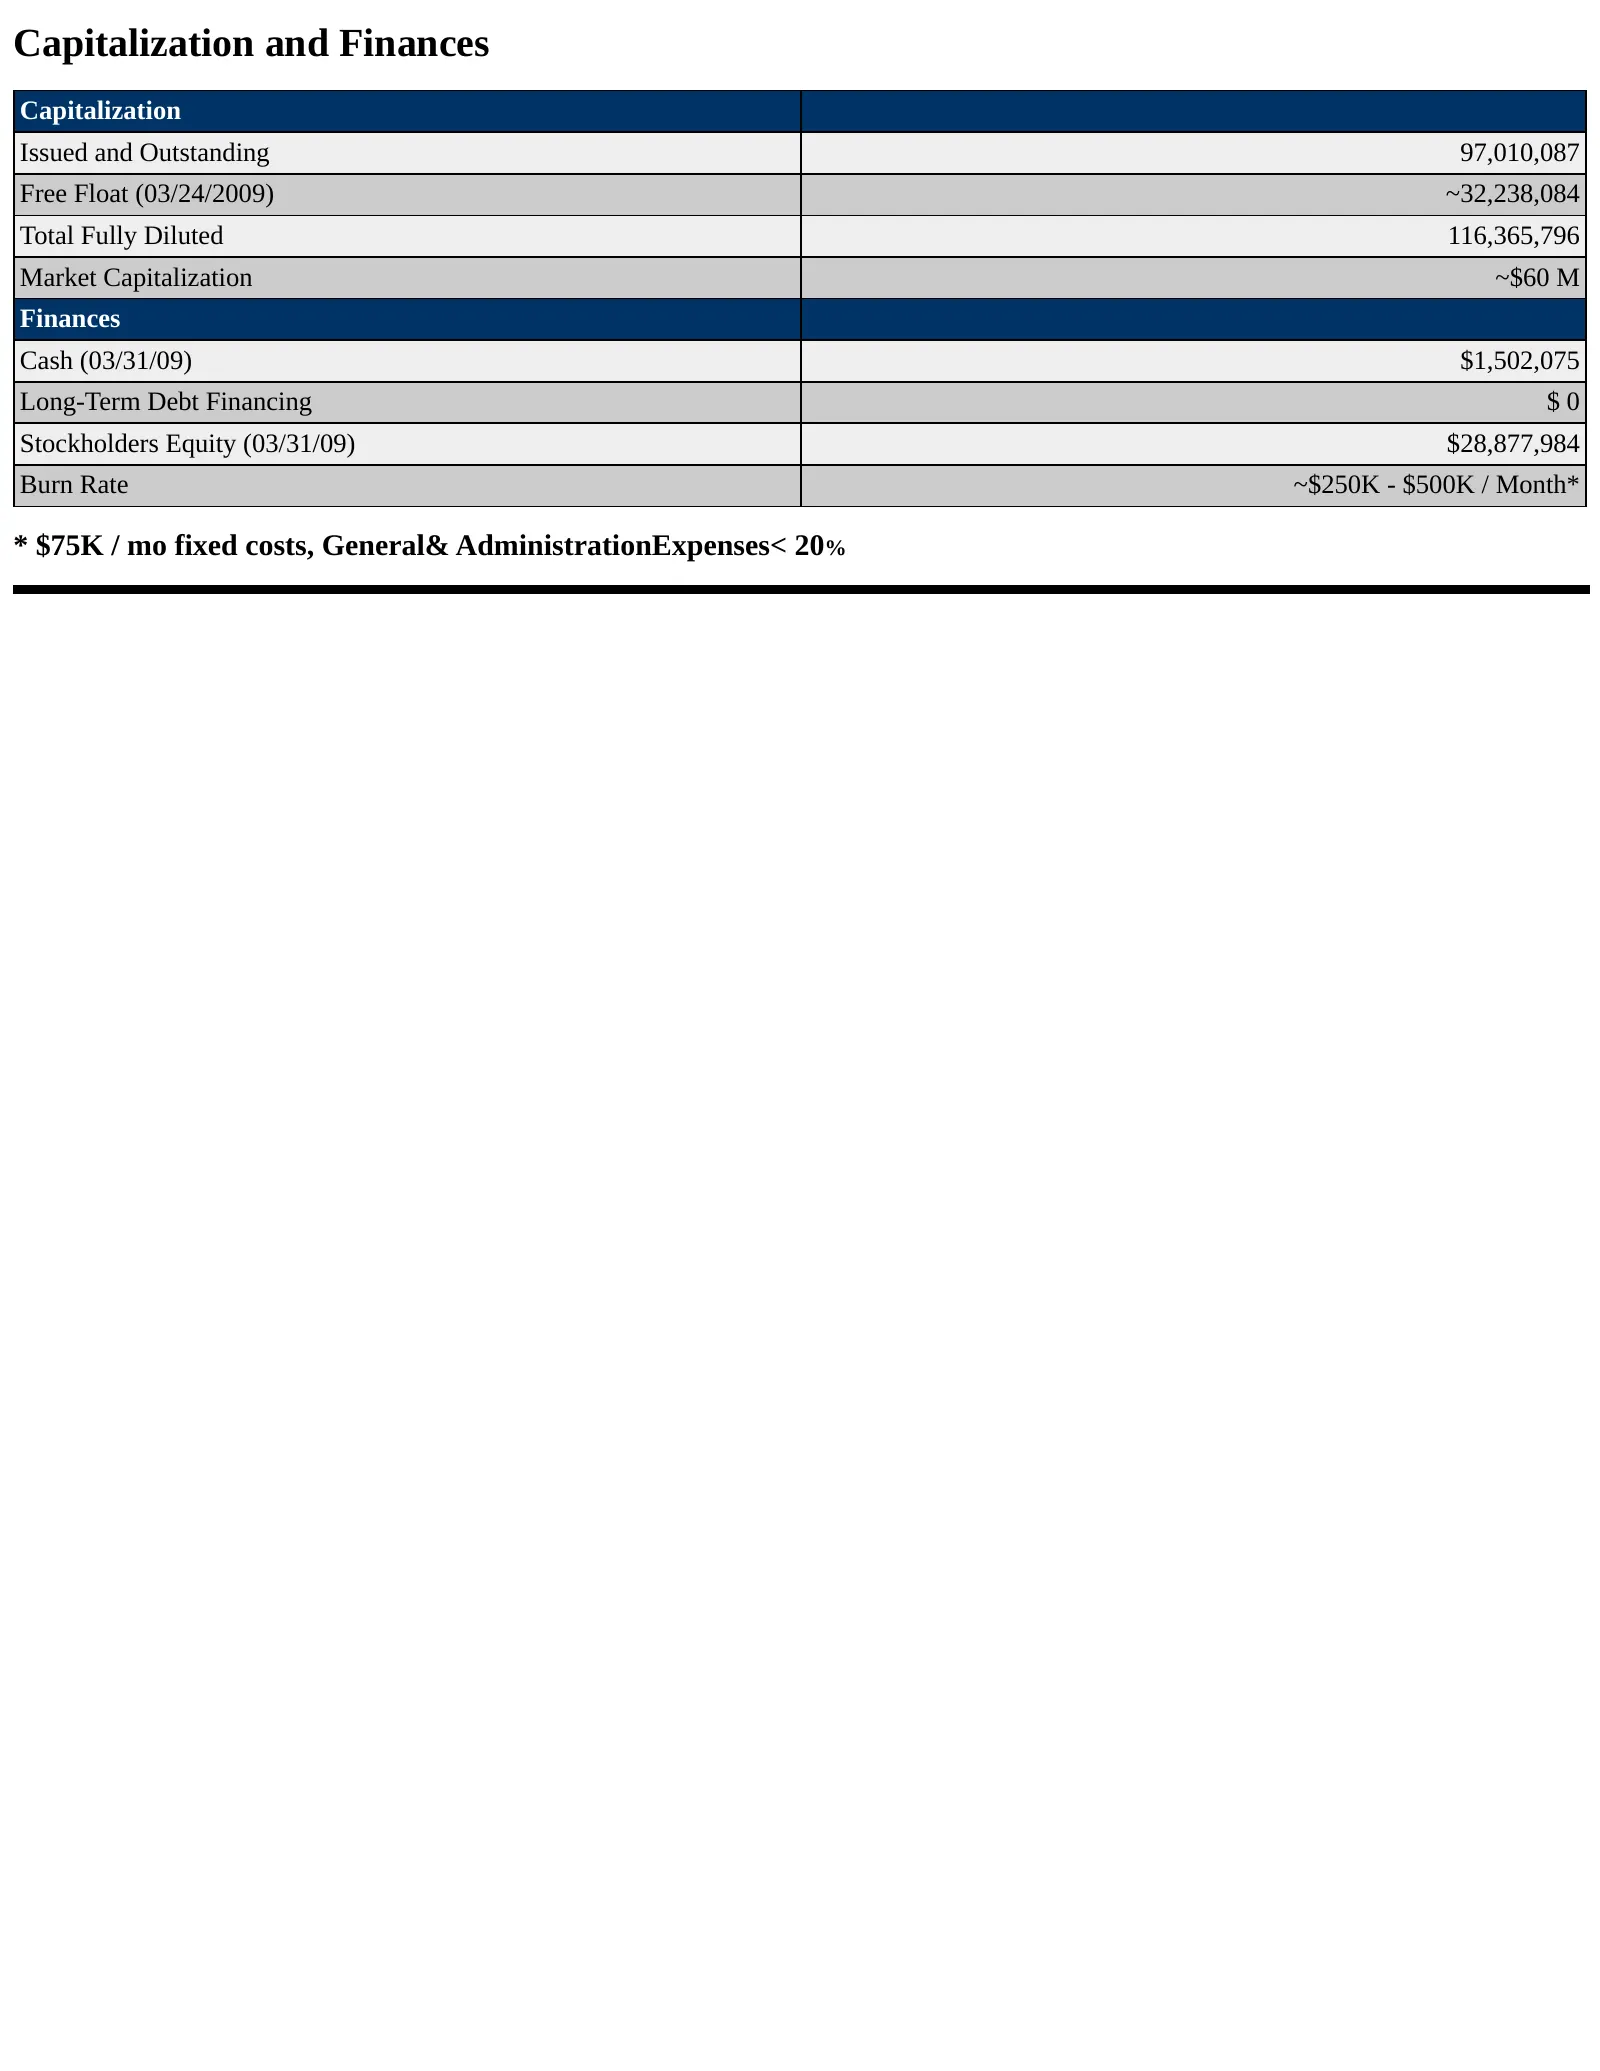
Capitalization and Finances Capitalization Issued and Outstanding 97,010,087 Free Float (03/24/2009) ~32,238,084 Total Fully Diluted 116,365,796 Market Capitalization ~$60 M Finances Cash (03/31/09) $1,502,075 Long-Term Debt Financing $0 Stockholders Equity (03/31/09) $28,877,984 Burn Rate ~$250K -
Slide 25: Expenses
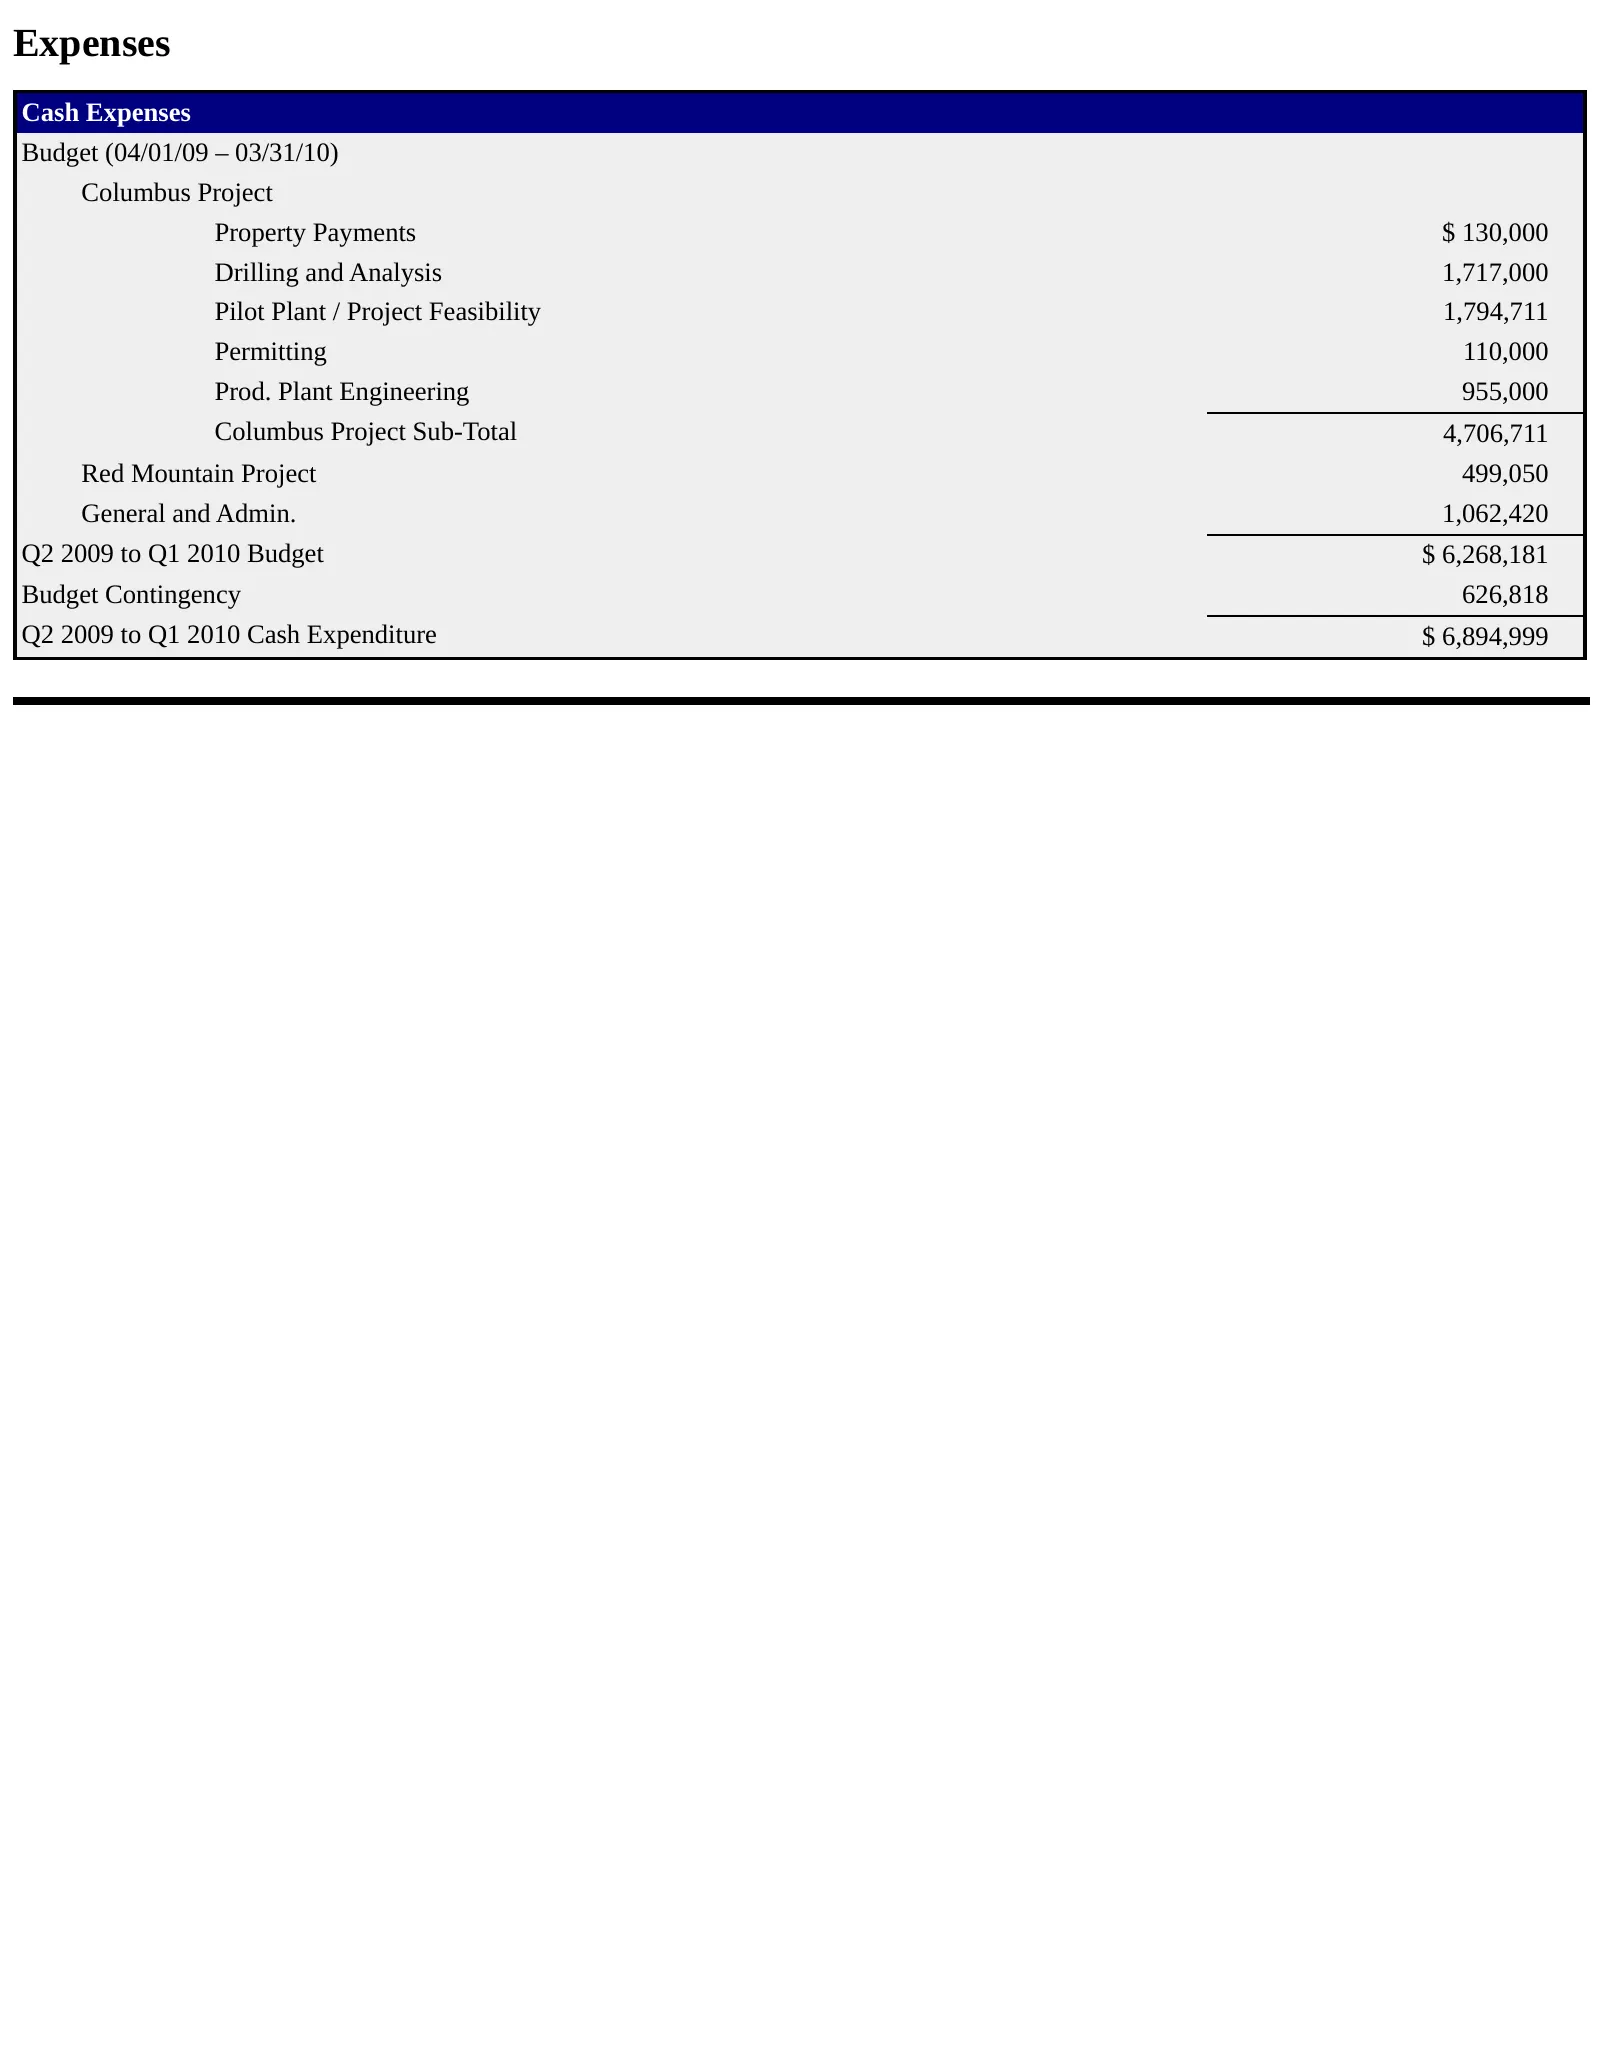
Expenses Cash Expenses Budget (04/01/09 – 03/31/10) Columbus Project Property Payments $ 130,000 Drilling and Analysis 1,717,000 Pilot Plant / Project Feasibility 1,794,711 Permitting 110,000 Prod. Plant Engineering 955,000 Columbus Project Sub-Total 4,706,711 Red Mountain Project 499,050 General an
Slide 26: Ireland Inc. Overall Summary
Ireland Inc. Overall Summary • Exploration company with goal of production • Two projects with significant potential • Columbus: Gold/Silver/Calcium Carbonate • Red Mountain: Gold/Tungsten/Silver • Good Fundamentals • Assembled Talented Technical Team • Strong Mineral / Metal Prices
Slide 27: Ireland Inc.
Ireland Inc. Corporate Office: 2441 West Horizon Ridge Parkway, Suite 100 Henderson, NV, 89044 (702) 932-0353 [email protected] http://www. irelandminerals.com Investor Relations Contact: R. Jerry Falkner, CFA RJ Falkner & Company, Inc. 125 Piper Lane Spicewood, TX, 78669 Tel: 800-377-9893
Source: SEC EDGAR · 8-K filed Jun 8, 2009
More decks from Ireland Inc
 Corporate Update (November 2012)18 slides · Nov 29, 2012
 LD Micro Conference (December 2011)10 slides · Dec 8, 2011
 Rodman & Renshaw Conference September 201121 slides · Sep 9, 2011
 Sidoti Micro Cap Conference June 201021 slides · Jun 30, 2010
 Chicago Resource Expo April 201021 slides · Apr 21, 2010
 Investor Presentation (April 2010)21 slides · Apr 15, 2010