Michael Perkins
CFO at SUPERMARKET INCOME REIT PLC
Replay available
Full Year Results hosted by Supermarket Income REIT (LSE:SUPR) on Investor Meet Company, held 2025-09-18.
On 6ix: 6ix.com/event/supermarket-income-reit-plc-supr-full-year-results
Automated transcript · Written by software from the replay's audio. It can mishear names and figures; the replay is the record.
0:00 Good afternoon, and welcome to SUPERMARKET INCOME REIT PLC full year results investor presentation. Throughout this quarter presentation, investors will be in listen only mode. Questions are encouraged, and they can be submitted at any time by the q and a tab situated in the right corner of your screen. Just simply type in your questions and press send. The company may not be in a position to answer every question received in the meeting itself. However, the company can view the questions submitted today and publish responses where it's appropriate to do so. Before we begin, I'd like to submit the following poll. I'd now like to hand you over to Robert Abraham. Good afternoon to you, sir.
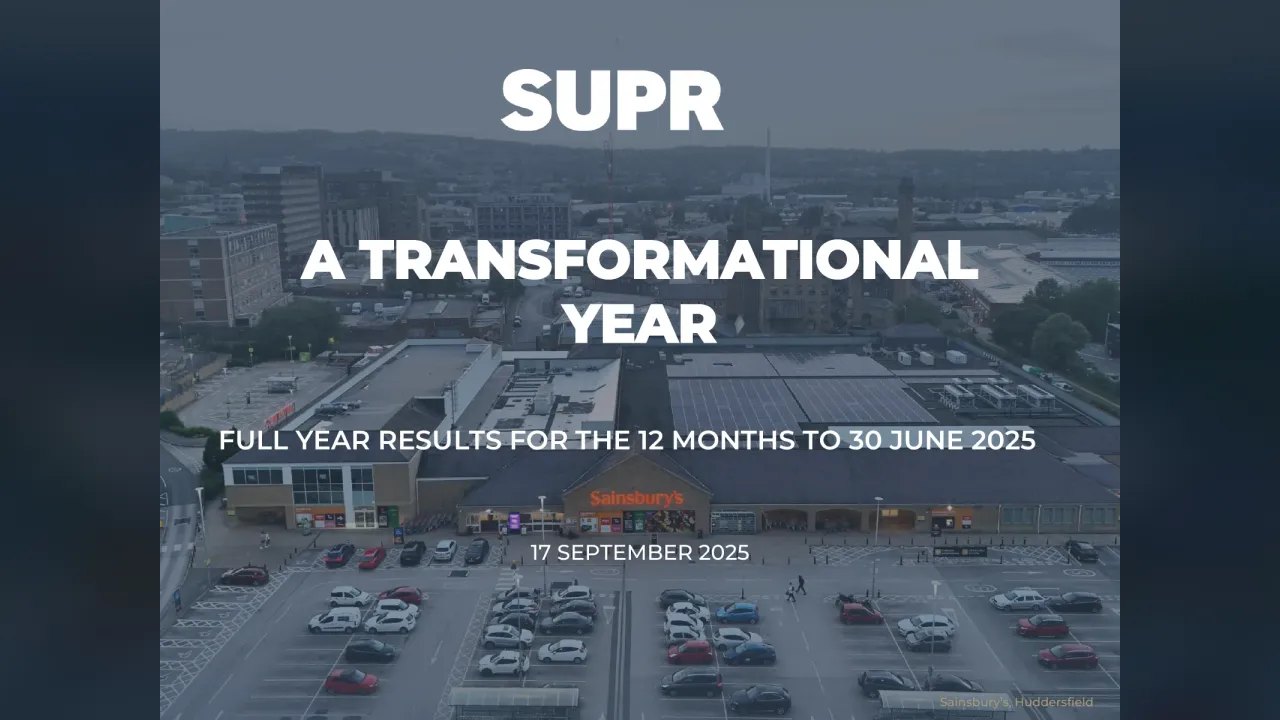
0:29 Thanks, Alessandro. Good afternoon, every Thank you for for dialing in, for our results presentation. You can see on the page here that the headline we've been running with is it's been a transformational year, and I think we've got a really positive story that that we'll take you through. I'm Rob Abraham, CEO of SUPERMARKET INCOME REIT. I'm joined by Mike Perkins, CFO. And let me first just take you through some of those highlights from the year that, as I say, has been transformational. We've demonstrated alignment with shareholders. We've been demonstrating asset values, and we've been demonstrating affordable rents. And those those three items have really helped us to drive value for shareholders, and and we've seen a corresponding, reaction in the share price. So that really has been achieved by delivering on our key strategic objectives.
1:24 Firstly, lease renewals. These were done 13% above our value as ERV. Internalization and the the cost savings material cost savings from internalizing the management means that we're now targeting a net cost ratio below 9% and materially improved dividend cover. A strategic joint venture, that's a £403,000,000 partnership with Blue Owl Capital, and that has released proceeds, for us alongside as part of our capital recycling strategy, alongside other disposals that we we're now able to deploy into accretive acquisitions.
2:10 Debut bond issuance. This is something Mike and the team worked hard on just just in July, which is a £250,000,000 six year unsecured bond for the first time. And then lastly, changes to our listing. So, the secondary listing on the Johannesburg Stock Exchange and the commercial companies category. So we changed to that category. That just allows us to to to appeal to a broader, range of investors and enhance liquidity in the shares, and we're starting to see the benefits of that come through now. So I think if you were to take any kind of two of these deliverables in it in any given year and a company might refer to a transformational year with six of these delivered, it really has been a a kind of significant step forward for the business.
3:04 And all of that's been achieved, at a time when when SUPER's investment case is as compelling as it's ever been. We're operating in a defensive sector. Grocery is nondiscretionary spend, and that just means it's resilient through economic cycles. We've got strong tenants, which are the leading and largest grocery supermarket operators, and that means we're we're providing stable and predictable income, and we've got eleven year warts on our leases. The portfolio we own is of mission critical last mile omnichannel fulfillment hubs. So these are critical assets to our tenants, and they those stores are seeing growing like for like sales, and that just provides for our our own rental increases coming through as landlord being sustainable.
3:55 We've also got a a cost efficient shareholder aligned team of sector specialists now following the internalization. And bringing all that together has has mean means we're now positioned for growth with a with a very attractive pipeline to deploy capital into. So on that, I will I will hand over to Mike to take you through the numbers, and then I'll I'll come back to the strategy. Great. Thanks, Rob. Good afternoon, everybody. If we start with with the highlights for the year set up on this page, £115,000,000 of net rental income, that does include our share of joint venture rents. That was up 7.3% year on year. The as Rob mentioned, the internalization has started to deliver cost savings.
4:41 So you can see the upper cost ratio is down to 13%, and we'll we'll jump into that into more detail later on in the slide deck. We declared dividends of 6.12p, which is up 1%. Portfolio evaluation of 1,600,000,000 was up 1.9% on a like for like basis, and was 18 with 1p, which was broadly flat over over the the year, year, but we'll take you through the evolution of NAF since June 24 later on in the slide deck and total accounting return of 7.2%. So looking at rental income in greater detail, as I mentioned, point 3% increase year on year set out in this chart is the drivers of that growth. You can see GBP 1,900,000 growth coming from like for like growth.
5:33 Completed 45 rent reviews across the year, and they were settled at an average uplift of 3.4%. 8,600,000 coming from acquisitions. Now that reflects in part of four years of income from assets we acquired in 'twenty four and also some revenue coming through from assets we've acquired in the current financial year. And the disposals of Tesco in new market and our joint venture disposal drops in £2,200,000 reduction in rent, but that is a part year impact. And we'll take you through the next slide, the impact, the full year impact on on passing rents as a result of that transact those transactions. But those charts graphics on the right, you see a 100% occupancy, a 100% rent collection, again, really gives us as unscored by our asset quality and and tenant base.
6:32 And we have predominantly single let assets. So there is various income leakage through to service charge or void costs. And you can see 99.3% gross to net rents ratio is one of the highest across the sector. So just to go into slightly more detail around the impacts of disposals on passing rents. So we set out on this side here the the move in passing revenue from June 24 to June 25. So you see the first chart, £7,400,000 of growth coming from acquisitions and like for like for like growth. The new market disposal results in £3,500,000 reduction in rental income. The proceeds of the new market disposal past the process were used to fund the management internalization, and that was done at a 19% yield on cost.
7:25 And then the final chart or on the chart, the the joint venture. So we completed the JV with with in May 25, and that's resulted in £14,300,000 reduction in passing rent. But what that has transaction has unlocked is that we've now received £200,000,000 in net proceeds. Disposal was 6.6% initial yield, and that was done at 3% premium to previous book values.
7:55 The set out here on this slide is the evolution of the EPRA cost ratio. As we've mentioned, we are targeting the 9% cost ratio. You can see from the chart that for a reduction from FY '24 to FY '25 was about 170 basis points. So you'll see 13% at the cost ratio for FY '25. And our target of sub 9%, we believe we can get to very quickly. Clearly, we've only benefited from one quarter's worth of savings from the management fee post internalization. So we'll get the full benefit of those savings coming through in FY '26 and beyond. And then we'd estimate there that that equates to approximately 35% reduction in costs versus FY '24.
8:44 And just putting that into context as to where SUPERMARKET is relative to our peer group. The peer group here is FTSE three fifty listed REITs. Clearly, 13%, we are already one of the the leading or most efficient platforms in the sector and delivering the sub 9% target would would very much further improve our sort of weighting towards getting closer to the lowest cost base in the sector.
9:13 So earnings per share was 6p for the year, which was a slightly a slight reduction from the prior year principally due to the disposals made and their proximity to the year end. So starting with the charts on the left, we can see the core earnings up 0.1 p, and that's really a reflection of 0.9 p coming from like for like growth in our rental portfolio, but also from acquisitions. The cost savings we've achieved in the year have improved earnings by 0.1p. And then we have been that has been partially offset or largely offset by an increase in financing costs now. That is broadly 50% due to an increase in average drawn debt over the period and then also due to an increase in weighted average debt costs.
10:04 At disposals, you can see, 0.2p impact on EPS, but, yes, 6p represents on the dividends declared in the years 98% covered. So turning to the balance sheet. We can see here in the chart is a bridge from June 24 to June 25. So we've covered across the components of the 6p EPRA earnings, 6.1p dividends paid. And as I mentioned, that was 98% covered by earnings. And what is quite interesting in terms of the valuation or revaluation of portfolios is we now have increased by 2.2p as a result of our active asset management during the year. And what we've done is just break that down further.
10:50 So that the first bar in the middle there, 0.9 p of NAV growth coming through realized gains from the disposal of new market and the joint venture. They were blended 4.4% premium to book value. That 0.8 peak coming from the lease rig years, the three lease rig years that we did in the year. Rob will talk to those in more detail later on. And then finally, NOK 500,000,000 of unrealized gains. Property yields were broadly flat during the year. So that growth is coming from rent, the contracted growth in the portfolio leading to an increase in capital values. And those combined to offset the cost of internalization. So obviously, that was a one off payment to the previous investment adviser, and that was 1.7 p in relative to NAV. So across the year, broadly flat, but a lot of activity in the year.
11:46 And as I said, the active asset management more than offsetting the cost of internalizing the company's management function. And then at the bottom, you can see that results in a 7.2% total accounting return, which is underpinned by highly secured income. Nearly 80% of our portfolio is investment grade. So it's a very secure income driven total accounting return. We've been very active in in improving or targeting our an improvement in our average debt maturity profile. So you see in the chart on the left, we show the the debt maturity profile as of June 24, that was two years average maturity. The refinancings that we've done in the year, which included two private placements.
12:32 And as Rob mentioned earlier, our debut bond issuance shortly after year end, we're able to increase our debt maturity profile to three point nine years as of today. But importantly, for us, the private placements and the bonds raised £355,000,000 of new debts at an average tenure of six point two years and fixed to 5%, which we think is a really attractive price relative to where we're seeing pipeline transactions at the moment. Just to take you through the bonds issuance in greater detail, as mentioned, complete in July, there was a window of opportunity for us to transact in July. We managed to to execute in that window. The £250,000,000 issuance, six year tenor was a 115 basis points over gilts, and that resulted in a coupon of 5.125% with the issuance being three times oversubscribed.
13:26 So significant confidence from from the investors in in our business model and our strategy. But the part of the key strategic benefits for us on the right there, It improves or as aids our transition to a 100% unsecured debt debt stack. A 100% of our drawn debt as of today is now unsecured. We further diversified the capital structure, which will help us grow as a business in the future. As I mentioned, it it extended the debt maturity profile by approximately two years. Those are medium term borrowing costs and and enhances the earnings accretion for our acquisition pipeline. Staying on debt for now, just to look at greater detail in these covenants.
14:15 So we set out two charts on this slide. The top one is the net debt to EBITDA ratio. Clearly, with the joint venture completing in in May 25, we use the net proceeds of that short term to repay debt. So you can see net debt to EBITDA of June 25 was 5.1 times. And the chart beneath, you can see 31% loan to value, which is down from 37% in the prior year. But we would expect those two to increase as we deployed the pipeline. 100% of our debt is now or drawn debt is fixed or hedged to term. And the average debt cost stands today at 4.8%. And we have 350,000,000 pounds of undrawn liquidity headroom, which we'll be able to use utilize to to make acquisitions, which would be earnings enhancing.
15:06 And just I would probably just say as a reminder, our policy on leverage is to operate between 30 to 40%, but we will where we see the accretive acquisitions. We're we're happy to given what the stage of property cycle we're in, we're happy to take leverage to the low forties as we've demonstrated previously, but we'll only do so where we've got a clear pathway to come back down to that 30% to 40% where we will look to operate in the medium term. So in summary, we've delivered material cost reductions, targeting that EPRA cost ratio below nine percent, materially improved our debt maturity with the two private placements and bond issuance. And with GBP $350,000,000 in liquidity headroom, we are well positioned for growth.
15:55 And I'll hand back to Rob to walk through the strategic update. Thank you, Mike. So just to start with the grocery market. And, of course, we're we're fortunate, as I said earlier, to operate in what is a very defensive growing grocery market is nondiscretionary spend. And you can see on this chart that consistent growth, 4.3% per annum since SUPER's IPO in 2017, forecast to reach 259,000,000,000 of sales this year. So it really is a huge market, and we've got tenants that are absolutely huge players within that. But, of course, that growth isn't evenly distributed. On the left hand side, you've got our key our largest tenants, Tesco's and Sainsbury's. They have been winning through scale.
16:44 Grocery is ultimately a scale driven exercise. The larger you are, the more buying power you have, and therefore, the the the wider margins you have, and that gives you the ability to be most competitive on on price whilst preserving pervert preserving margins. So they've been able to cap capitalize on poor performance elsewhere. It's been well publicized. Morrison's, they have suffered more recently, but they have certainly suffered over the last twelve, twenty four months. They've lost market share. Like for like sales is still down for the likes of ASDA, but Morrison's has returned to growth, and we're really starting to see the, I guess, the green shoots of recovery coming through for the turnaround strategies for those operators.
17:34 And Aldi and Lidl have been some of the beneficiaries there as they continue to pursue growth. They're investing heavily in new store openings. It's the fastest growing channel, but we are starting to see them open stores, or we've been seeing them open stores in in more highly competitive areas. And, of course, it therefore gets increasingly difficult to make make the return stack on a new store. So it is the discounters that have been making the headlines. And you can see in this chart the growth in sales by channel across the total market. Discount food stores up 26% since 2022. Large format up 13%, and convenience up 9%.
18:19 But then when you adjust that to reflect the additional new space that has come online in each of those channels, you can see discount has actually only grown by 5% on a on a sales per square foot basis. And as I mentioned, we think it's gonna get increasingly difficult to be opening new stores and finding sites. In the middle there, you can see large format. That's really been what is actually very profitable growth for large format stores because it's largely coming from existing space. So 12% increase in sales per square foot from existing large format stores. And then, again, you compare that to convenience, another big growth channel in terms of new space for operators.
19:07 And when you adjust for that, then it's only 4% growth set increase in sales per square foot. So it's that middle box is where we really operate, and it's those stores that we own that are seeing the most profitable growth come through. And it's for that reason that you're seeing Tesco also spending a further 130,000,000 during the year buying back large format stores such as the ones we own. Three examples on this page, Southwark, Congleton, and then the last one, Newmarket, is actually SUPERMARKET, that we sold back to Tesco at 7% above book value. So, these transactions, if you want who who who knows more about, kind of grocery and the value of the real estate than Tesco?
19:58 And the they are the ultimate insider, and they're spending 130,000,000 buying back these large format stores. It demonstrates exactly how strategically important these large format stores are to the business. And then we're also seeing market evidence, which is providing upwards pressure on rents, in in the supermarket space. On the left hand side, you've got the three lease renewals that SUPER undertook. So we on the three shortest leases in SUPER's portfolio, we reset the term to fifteen years with RPI linked, increases. That was 13% above the value of the ERV, as I mentioned earlier, but very importantly, a 4% rent to turnover benchmark.
20:49 And that's the most important metric in our space is rent rent to turnover. So it's all about the affordability of the rent relative to the sales performance.
21:00 Wantage Oxfordshire in the middle there. This was a Sainsbury's lease renewal. They entered into a twenty five year inflation linked lease. That was actually acquired at four and a half percent net initial yield. But really importantly, again, the four percent rent to turnover metric being proven out. And then lastly, home based conversions. So demonstrating exactly how difficult it is to to find sites for food stores and demonstrating the value in the existing properties is the fact that Sainsbury's and M and S, they've taken around 25 of the former home based stores, and they're paying rents with believe it's Colliers reporting that rents of up to £28 per square foot have been paid.
21:57 And, of course, that also requires if it's a home based unit and you have to con convert it to a supermarket, it requires significant tenant capital investment to refit those stores. So, as I say, the combination of this slide and the page before really highlighting the value and importance of owning good food stores to the tenants.
22:17 And it's in that context that we look at SUPER's average rent to turnover at 4%, and £23 per square foot as being highly affordable. So now turning to our portfolio. Mentioned earlier, we've got a portfolio led to the leading and largest supermarket operators, in both The UK and France. Total value of £1,700,000,000. That's across 84 supermarket sites. They're valued at a net initial yield of 5.9%, and 93% of those stores are omnichannel. And when we say omnichannel, we mean fulfilling online home delivery as well as your traditional in store shopping.
23:02 And you can see there in the bottom left, Tesco, 44%, Sainsbury's, 31%, are very much our our key tenants, and they are also the the tenants seeing the strongest performance at the moment. We also look to generate value in the portfolio through active managements of of the sites. I mentioned on the left hand side already the lease renewals that we undertook on those three Tesco stores. That achieved an 8% capital value increase, on those. In the middle column there where we've got some larger sites that have some non grocery exposure, we had two home based stores. They were both rapidly to to in the example on the screen, you've got the range.
23:53 At the other site, it was B and M. And through that, it was a 10% capital value increase. So we underwrote acquisition of those sites. We underwrote the home based covenant risk very conservatively. So we've able to achieve by getting some better quality tenants in there, a capital value uplift. That was 78,000 square foot of what was vacancy risk, and and we've been able to relet that rapidly. So there's very little in terms of any lost lost income. And then lastly, on this page, just attractive development opportunities because we own these really, kind of attractive sites that get high footfall. We're able to to develop, and we we've got a a discount operator.
24:40 We're developing a new store for achieving an 8% yield on cost there for a new 20,000 square foot store with a fifteen year inflation linked lease. So where we're able to, we're pulling the levers to really maximize those returns for for shareholders.
24:58 To the investment market now. So supermarket yields present a buying opportunity. You can see there. If you look at that dark blue line, you can see it's plateaued. It's currently at 6.3%. The MSCI supermarket's net initial yield, it has flattened out around the level where we last saw the peak in 2009. And, actually, we've plotted on their SUPERMARKET ON portfolio net initial yield of 5.9%, which is tighter than MSCI just reflecting the better quality of assets we own, but it's still a very attractive level compared to the MSCI all property index. And and, of course, with a higher net initial yield, that just means you're getting higher proportion of your return in income, which is is known and certain, which is which is very valuable in the current environment.
25:49 But
25:51 we're not whilst we're not expecting yields to kind of if you look back at 2009, yields tightened very quickly once again, and that was a result of interest rates being rapidly cut to to zero effectively. Obviously, we're not expecting that this time, but what we are seeing is investment market activity that makes us confident that yields have peaked and that it is therefore a good buying opportunity. And just to take you through some examples of the transactions that have been taking place in our market, a few on this page, the four on the left were were acquired by other other parties. We are the sector specialists, so we see everything in our market. If you have a supermarket to sell, we are one of the the first calls that that that you will make.
26:44 So we see everything, and, of course, we consider the these stores on the left. An example there, Tesco Bracknell in the middle at the bottom, £50,000,000 lot size, 6.2% net initial yield. This store was really quite over rented. That was actually bought by an ultra high net worth individual. So just, and the one the example above that by a local government pension scheme is you've got a real range of purchases in our space, including institutional buyers.
27:15 That just means there's a real depth of liquidity. But then on the right hand side of the page, two examples there of stores that we acquired. And just to take you through an example of the types of assets that we've been buying. So this is Tesco Ashford. We acquired it in July of this year at a 7% net initial yield. That was about £54,000,000 with a nine year lease remaining term, and it's got annual RPI linked uplifts,
27:46 rent reviews, capped at 5%. So we get that really visible growing contractual income growth, and it's a strong trading store. It's q one on trading density. It's got 14 home delivery vans. That means it's a it's a large omnichannel hub for Tesco. If you look at that satellite in the bottom left, you can see stand alone food store, big home delivery section at the back, large car park. And if you were to zoom this out, you would see it's got excellent connectivity, on the roads there, and it's got a catchment population of three to 400,000 that it's serving, through through that online delivery. So that just means it's a really mission critical hub for Tesco in its online fulfillment given they have such strong online market share as well.
28:39 And it's not just us seeing the value in those types of opportunities. So we did establish a joint venture during the year, and that joint venture targets those sort of high yielding Tesco's and Sainsbury's. The JV itself, the rationale there for establishing a vehicle like this instead of just selling assets outright, you get financial flexibility. You see you're releasing capital that we can then recycle and and deploy elsewhere. We're able to scale in that instance through third party capital at a time when raising in the equity markets has not been an option for us. It's been prohibitively expensive. Our dividend yield at 7.8% or so today is very attractive as an investor, but raising additional equity, that is relatively expensive compared to transacting with a third party. We get paid a management fee on their interest, and we've got a very credible third party supporting our investment thesis.
29:41 But we also retain ownership. So we sold 50% interest. That means we're able to to retain half, and we have an option to buy those stores back in the future, at ultimately at at the market value, as and when our partner wishes to exit. And the management fee itself is is attractive as £1,200,000 a year, so that makes a meaningful contribution to our earnings with actually not too much additional management intensity. It is value add from our perspective because it's our tenant relationships that really drive the value when it comes to the high yielding stores and being able to underwrite that risk. But but that's where our kind of value and and the value of the platform comes comes into play.
30:28 There is a opportunity or or an aspiration to to grow this vehicle to to 1,000,000,000 over time. It will depend on how that pipeline evolves as to as to exactly how it grows. But with 400,000,000 pounds of day one scale, there is no pressure to grow that vehicle. It was certainly worthwhile or sufficiently worthwhile by seeding it with those assets. So then where are we looking to deploy the capital that we've effectively raised by by creating that joint venture. Well, on the left hand side, you've got Tesco Sainsbury's high yielding opportunities. These these give you around ten years of income, but from investment grade operators.
31:13 So very strong tenants. Second column, you've got the private equity backed operators in Astor and Morrisons. Now there there is a a value opportunity there because you are able to to achieve net initial yields that are higher up six and a half, maybe 7% plus, but for lease terms of twenty, twenty five years. So you are getting compensated, for for the additional kind of risk with with the fact that they are not investment grade. The third column there, you've got car four. So only 5% of our portfolio today is in France. That allows us to deploy capital at a net initial yield of six to six and a half percent, but it's worth remembering, that Mike and the team put in place private placements during the year. So we're able to borrow euro funding at a much lower rate than sterling. You borrow at around 4% versus the equivalent, say, five five five and a quarter percent in The UK.
32:16 So you get a really attractive spread between the net initial yield and the cost of debt for an investment grade tenant. And then lastly, smaller format. So those of you who followed us for some time will know that our primary focus is on large format omnichannel stores. But, actually, we do see some some value opportunity in in smaller format, maybe even down to convenience where you've got lot sizes of 1,500,000 to to 5,000,000 or so. But you get ten, fifteen year triple net leases from the likes of Sainsbury's, Tesco, but also a broader range of operators, M and S, Waitrose, Co op. What you get here is net initial yields of six, six and a half percent. So you're getting about a 100 basis points additional yield to to for the for the smaller format than you do for a large format store with the same lease structure. So there is some real relative value there for us. It's not that we're going to pile hundreds of millions into that. It takes it takes longer to deploy capital in into more granular units, but, actually, we do see some real relative value.
33:31 So just to summarize there on on the outlook. So we've got a cost efficient platform for growth. So with a high caliber team of sector specialists, the internalization means that SUPER itself is able to capture the upside of that team as we do transactions like the joint venture. We're able to capture that in earnings with the management fee, and we are able to have one of the lowest EPRA cost ratios in the sector as Mike talked to. We've got a really attractive pipeline and opportunity to to deploy capital into those assets. And and as Mike talked to, we've got a got a good couple of 100,000,000 of capacity to now do that, and and in doing so, we'll be enhancing earnings.
34:20 And what we're targeting by the end of this financial year is to have demonstrated to the market a fully covered and growing dividend, by the by the time we get to the end of the year. And I think that's the real catalyst, the real driver for us, taking the business back to a point where we should be really trading at or around now if I would hope and closing out that discount. That is a big focus for us. And as is driving kind of investor demands by by doing presentations, whether it's in in a format like this or just we're out on our investor roadshow in the next couple of weeks, and we are seeing as many names as we can. And we're looking to build awareness of of SUPER and and looking to drive those those additional buys of the stock and and and create some positive momentum. So with that, I think we will we will turn to q and a.
35:16 I've just done a lot of speaking there, so I I might ask Mike to go first. We've got some questions on the platform. Mike, there's one there around the portfolio. We'll why don't you start with that one, please? Sure. Will do. So the the question around the the historic current and medium term expectations for our walk. So as we said, our walk today is eleven years. We have seen that naturally tick down given passage of time. But lease is now typically a set of fifteen years. So you we demonstrated with the three lease rig years. We did new lease that typically sets at fifteen years. So on that basis, we would expect to to targeting or walks in the medium term of between ten to twelve years and sort of managing that walks actively by regears or portfolio composition.
36:11 So very much a number that's in our control and something that we're we're we're cognizant of. There is another question here around NAV. While the company's growing through both equity and capital raises, NTA has gone from 108 p in '21 to eight seven p in June 24 and as commenting on that. So, I guess, real estate is cyclical. Clearly, yields probably work their low point around 2022, and then we had this mini budget at the end of twenty two, but did see property yields move out. So we weren't the I guess, we weren't the only real estate company that would have seen the NAV decline over that time.
36:58 I guess the point for us now is trying to demonstrate our NAV, and we were able to effectively sell £466,000,000 of assets, also retaining an interest in the JV, but we sold those at blended premium of of to book value of 4%. So we're we're incredibly comfortable where our NAV is. Clearly, there were we we have been able to grow the NAV. So with the lead regears that provide an 8% increase, the reletting to home base is 10% capital uplift as a result of those. So we are able to drive that sort of total return, but, yeah, we we are immune to the kind of cyclical nature of real estate, but that wouldn't be isolated to just our company.
37:44 We we we where we see yields now, yields are flat over the year. We see much more competition in when we're bidding for assets. So we feel that, you know, where we what we're seeing in the market is that definitely yields have have peaked, and we would expect the next movement to hopefully be down, and we'd be the beneficiaries of of NAF growth thereafter. Thanks, Mark. Why don't I take one of the next ones just around business rates review? So what effects would a potential increase in business rates on large commercial premises have on SUPERMARKET? So this is, as you'd expect, something we have, of course, to work on as soon as there were announced announcements around potential changes. I think the the starting point is that a large format store, will turn over, say, £70,000,000 plus a year of revenue for the for the tenant.
38:37 And the increase in business rates costs will will be typically around a 100,000 a year for a store of that size. So relative to total trading performance, it it isn't that significant. Clearly, it has a an impact on profitability, but, again, it's largely marginal. At the operator's total business level, it's, of course, unwelcome and just further adds to pressure for increasing food prices and and and food price inflation because the grocers operate supermarkets are ultimately a relatively fine margin business. So costs are pretty efficiently passed through, and margins are are largely maintained over time. So, actually, we're not really anticipating an impact. It doesn't materially move the needle in terms of the tenant's occupancy cost versus rent and existing rates bill.
39:35 But what I do think you'll see is just, yeah, along along with national insurance changes, just yeah. It will translate into higher food prices for consumers, which is clearly unfortunate. But as from a landlord's perspective, we are pretty insulated. And it this all comes back to the benefit of being in a what is absolutely a nondiscretionary sector, is that demand is very, very robust, when it comes to to to food. There's a question around the INCOME potential propose or proposals for the government banning upward only rent reviews and the potential effects on I I guess it is still very early stages, and so we'll we'll we'll keep a very close eye on how that legislation evolves.
40:24 Again, one of the differences, though, in supermarkets is your tenants want to secure long term occupation of these assets. So our tenants are the ones who want the leases sub ten years. They want to reset it back to fifteen. If there is a ban on upward only rent refuse, well, then that changes potentially, that that the willingness of the landlord to grant those long leases. So it's it's it's too early to say, but what we may well see is is, for instance, a move to fixed uplifts of of a a few percent a year rather than inflation linkage. Who who knows? But but what I would say is, again, I think supermarkets will be one of the best placed assets to kind of deal with that.
41:12 Another one, in a moment, Mike, I'll ask you to do the one on the the JV warehousing, but I'll take the the one before that, which is just around two of the larger big four supermarkets are in a far better financial shape than the other two. How do you view the risk of acquiring supermarkets from the two weaker companies? Which is a great question. And, look, fundamentally, supermarkets and grocery is a it's a localized market. Shoppers will not travel typically more than ten minutes to do their shop. Typically, they won't travel past one supermarket to go to another one. So what you really need to do is make make sure you're buying the best performing stores in those markets, and that's our job as sector specialists is understanding that market underwriting at the market level.
42:00 But, also, we should have a very good handle on the balance sheets of the operators and their own strategies, and we'll be taking a view on those. But first and foremost, you acquire the top performing stores because top performing food stores simply don't go vacant. They might change operator. They they do not go vacant. But, also, it's underwriting that kind of credit risk, and and we're well placed to do it. I I would say we are very much underweight those names at the moment. We only have 2% exposure to as to 4% exposure to to Morrison. So, yeah, we're we're in a we're in a good place, from that perspective. Fine. I'll take those questions coming around the joint venture. We refer to assets being warehouse pipeline and what is Blue House exit horizon and are there any baked in the kind surprising?
42:47 Well, I guess to take that into when we refer to to warehousing pipeline, the one one typically, once these assets acquired because they're typically long term holds at the stop, once the asset's gone, it will be some time before you see it back in the market. So part of the part of the rationale for the joint venture was that we're able to when the equity markets were closed, we're able to raise it raise capital and sell a 50% interest in our own assets. And, yeah, we have a right of first refusal that when they're sold, the SUPER will get a right of first refusal. So potential to buy those stores back in to on SUPER's balance sheet directly in the future. In terms of the exit horizon and and the the pricing for for buying stores back in, yeah, we we typically expect the the horizon to be probably five to seven years. We'd imagine the time we look into to our part, we're looking to exit.
43:48 And there's no there's no predetermined pricing. There'll just be fair market value as determined at the point of sale. So, yeah, it'll be done at market market rates as determined by independent valuers at the time. There's another one. Like many people, the the supermarkets come to me via home delivery now now these days. Given warehouses are cheaper than stores, do you think a risk is grocers start delivering directly from warehouses? So that is effectively the Ocado model. There's a very quick answer to this in that, well, maybe not that quick, in that it was, ASDA and Sainsbury's both closed during COVID. They both closed these what are known as dark stores, customer fulfillment centers, these warehouses that fulfill online.
44:41 They closed them during the pandemic when online grocery was really booming, and that was to instead fulfill through stores because the the biggest element of cost when it comes to grocery, online is is the hope is the delivery element. And the shorter you can make your delivery journey, the lower the cost it is to deliver. So, store omnichannel stores like the ones we own are absolutely the method of fulfillment. And you may have seen some headlines in The US, in the last week or so from Kroger who've got a big partnership with Ocado, where they said they were reviewing some of those warehouses, and instead looking to potentially fulfilling through stores. So, I think it's omnichannel has been the kind of clear winner, and you see that across the market. Over 80% of online orders are fulfilled from stores.
45:33 And I think that is actually, is actually all of the questions, for us. One more that's just coming in, Rob, on would we consider bidding for public publicly listed REIT? Well, I think, I guess, on that, we one of clearly, one of the benefits of internalization for us is that we are able to potentially look at some in a m and a activity, but we'd only, you know, execute on anything where there was a a meaningful improvement to to returns for our shareholders, be it through earnings or or NAV growth. But, fundamentally, I guess, we we would we would not want to dilute the story in terms of we are sort of grocery specialists. So we we as as probably most are in the sector are looking at our options, but nothing nothing imminent that we would be talking to, but clearly and at potential avenue that we would keep under review.
46:33 Perfect. Well, that's great. Thanks very much for answering those questions from investors. Of course, the company can view all the questions that have been submitted today. We'll publish the responses out on the investment company platform. But just before redirecting investors to provide you with their feedback, and it's particularly important to you both, Rob, could I just ask you for a few closing comments? Thanks, Alessandro. Look. Thank you, everyone, for for listening in. It, for us, as we said, transformational year, incredibly busy, lots of significant milestones, but we are not done yet. We have plenty more to do. We've got capital to deploy. The the priority now for us is getting that deployed into accretive opportunities that prove to the market a growing, and and covered dividend. And I think that will that that we're we're aiming for that to be the next catalyst for the rerating the shares, as I say. So thank you all for for the support.
47:25 That's great. And, Rob, Michael, thank you once again for updating investors today. Can I please ask investors not to close the session as you now be automatically redirected to provide your feedback and all the management team can better understand your views and expectations? Apart from the management team of SUPERMARKET INCOME REIT PLC, we'd like to thank you for attending today's presentation, and good afternoon to you all.
Follow Supermarket Income REIT PLC into a list and get an email when it puts out news.
CFO at SUPERMARKET INCOME REIT PLC
CEO at SUPERMARKET INCOME REIT PLC