Dennys — 16th Annual ICR XChange Conference (January 2014)
36 slides from Dennys's conference presentation, Jan 14, 2014
Slide 1: Investor Presentation, 16th Annual ICR XChange Conference
January 14, 2014 Investor Presentation 16th Annual ICR XChange Conference
Slide 2: Forward-Looking Statements and Non-GAAP Financial Measures
2 Forward-Looking Statements and Non-GAAP Financial Measures Denny’s Corporation urges caution in considering its current trends and any outlook on earnings disclosed in this presentation. In addition, certain matters discussed may constitute forward-looking statements. These forward-looking stateme
Slide 3: Denny's Investment Highlights
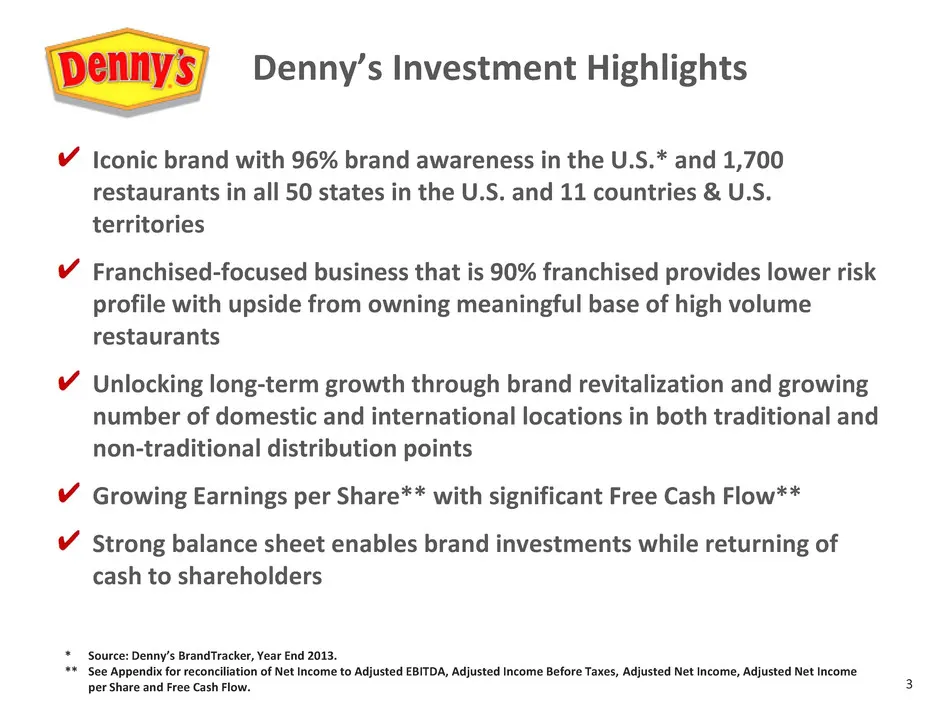
3 Denny’s Investment Highlights Iconic brand with 96% brand awareness in the U.S.* and 1,700 restaurants in all 50 states in the U.S. and 11 countries & U.S. territories Franchised-focused business that is 90% franchised provides lower risk profile with upside from owning meaningful base of high vol
Slide 4: Driving Shareholder Returns with America's Diner Revitalization
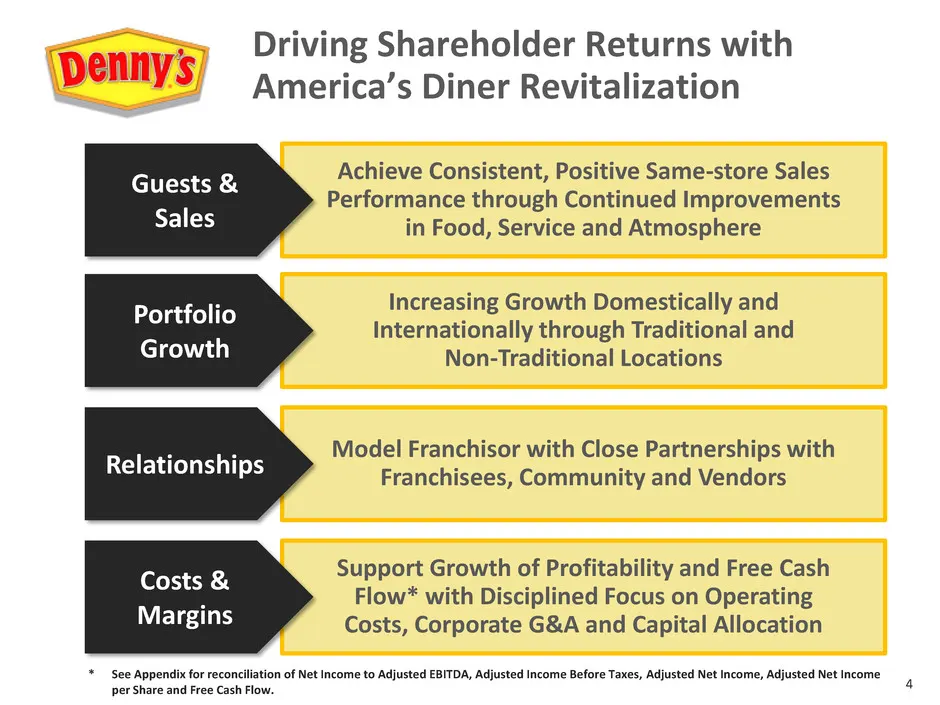
4 Achieve Consistent, Positive Same-store Sales Performance through Continued Improvements in Food, Service and Atmosphere Driving Shareholder Returns with America’s Diner Revitalization Guests & Sales * See Appendix for reconciliation of Net Income to Adjusted EBITDA, Adjusted Income Before Taxes,
Slide 5: Driving Guest Traffic with America's Diner Strategy
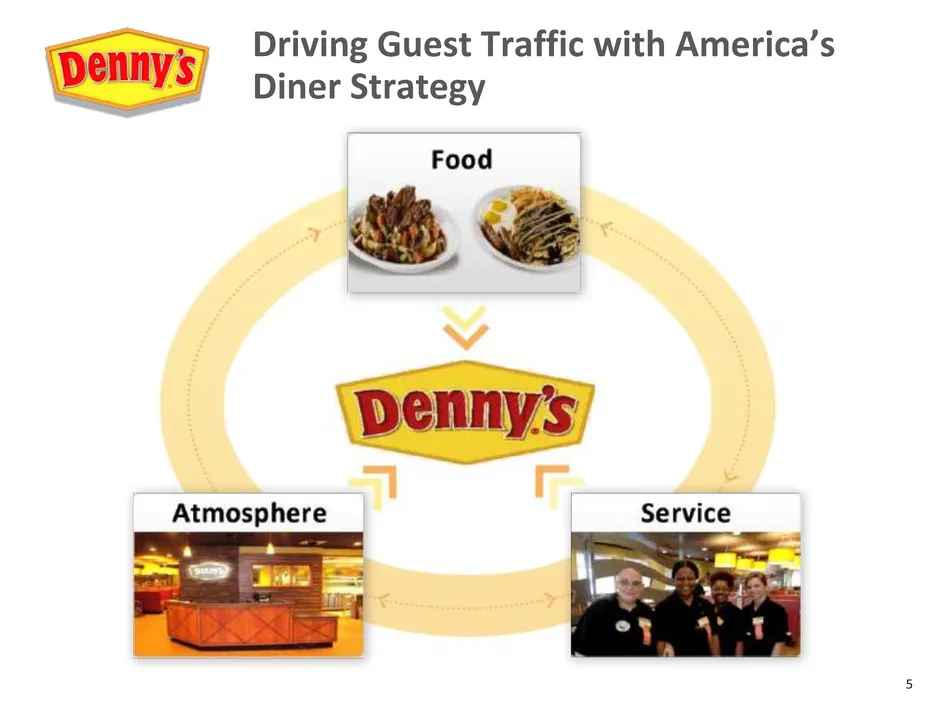
5 Driving Guest Traffic with America’s Diner Strategy
Slide 6: "America's Diner" Positioning
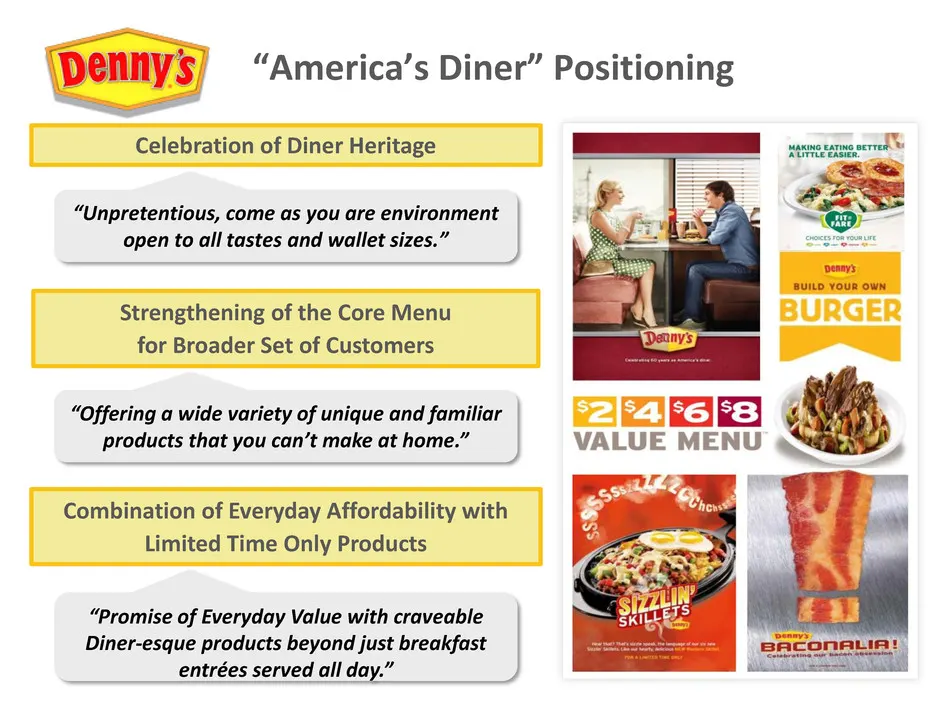
6 “America’s Diner” Positioning “Unpretentious, come as you are environment open to all tastes and wallet sizes.” Celebration of Diner Heritage “Offering a wide variety of unique and familiar products that you can’t make at home.” “Promise of Everyday Value with craveable Diner-esque products beyond
Slide 7: Continuous Improvement of Core Menu
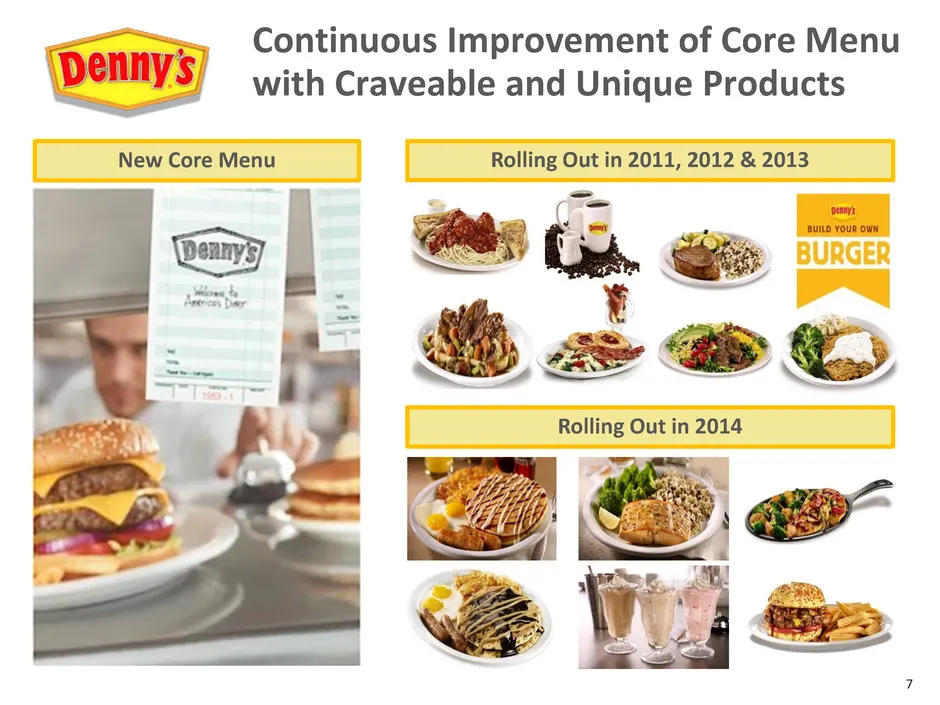
7 Continuous Improvement of Core Menu with Craveable and Unique Products Rolling Out in 2014 Rolling Out in 2011, 2012 & 2013 New Core Menu
Slide 8: Leading Everyday Value Platform
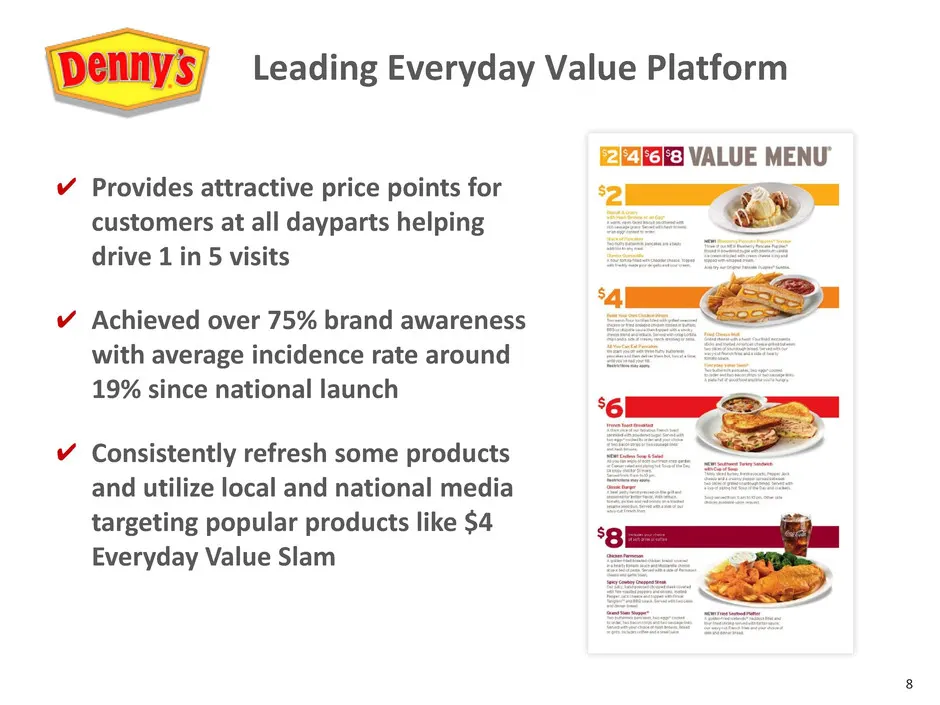
8 Leading Everyday Value Platform Provides attractive price points for customers at all dayparts helping drive 1 in 5 visits Achieved over 75% brand awareness with average incidence rate around 19% since national launch Consistently refresh some products and utilize local and national media targetin
Slide 9: Pipeline of Limited Time Only Products
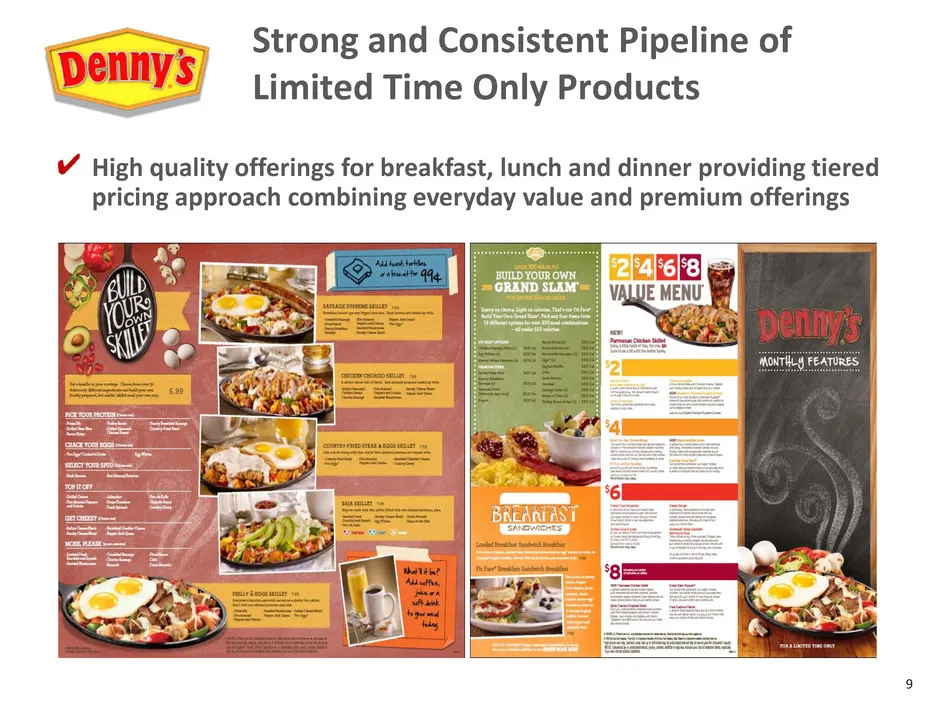
9 Strong and Consistent Pipeline of Limited Time Only Products High quality offerings for breakfast, lunch and dinner providing tiered pricing approach combining everyday value and premium offerings
Slide 10: "Hijack" Commercial
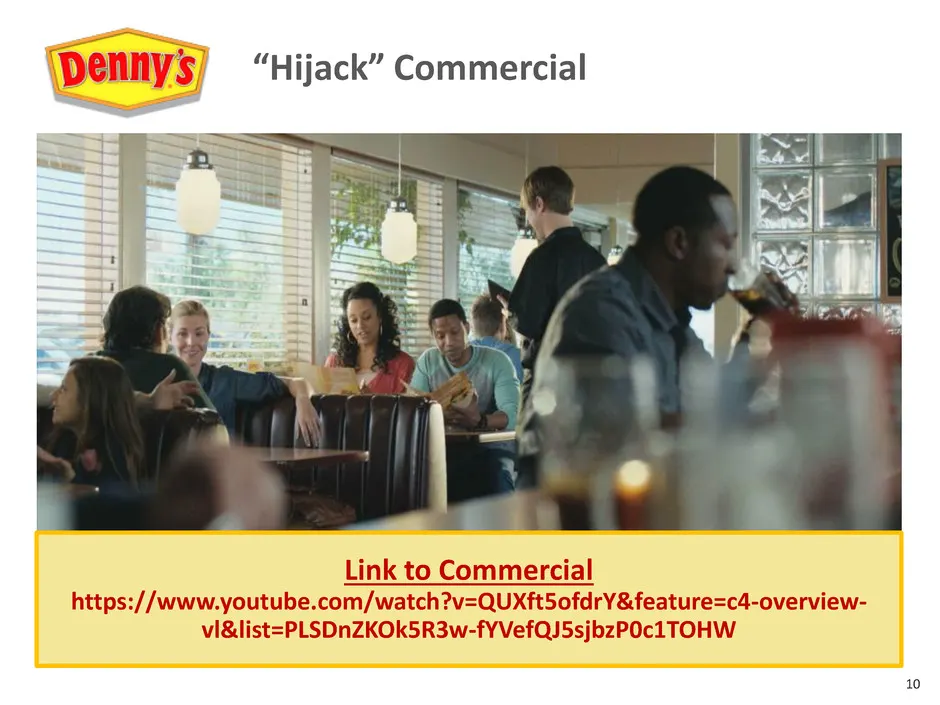
10 “Hijack” Commercial Link to Commercial https://www.youtube.com/watch?v=QUXft5ofdrY&feature=c4-overview- vl&list=PLSDnZKOk5R3w-fYVefQJ5sjbzP0c1TOHW
Slide 11: "Speaking My Language" Commercial
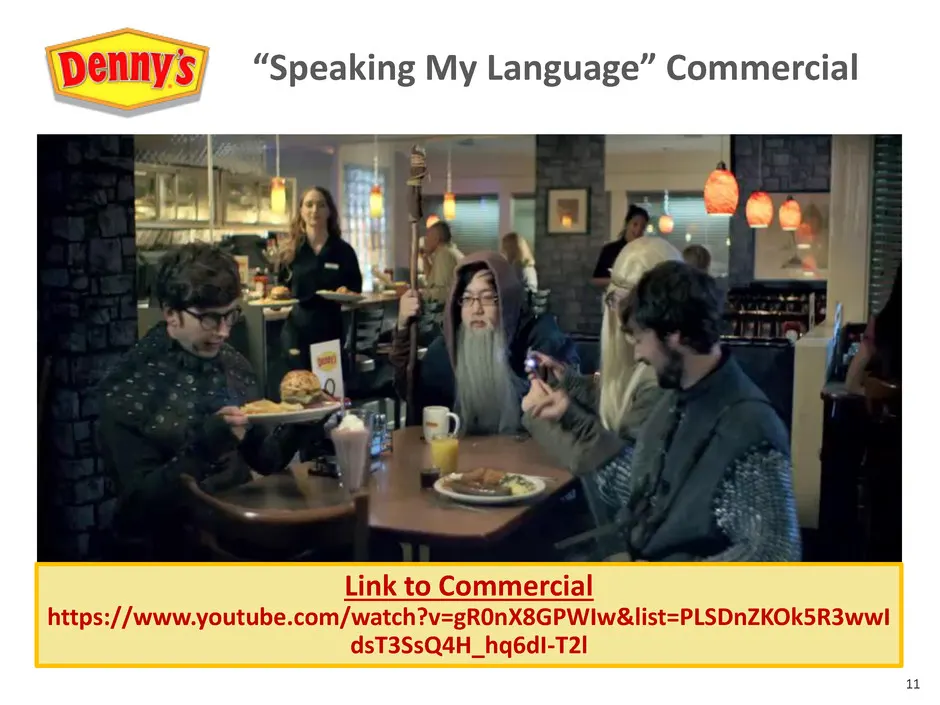
11 “Speaking My Language” Commercial Link to Commercial https://www.youtube.com/watch?v=gR0nX8GPWIw&list=PLSDnZKOk5R3wwI dsT3SsQ4H_hq6dI-T2l
Slide 12: "Date" Commercial
12 “Date” Commercial Link to Commercial https://www.youtube.com/watch?v=rOtg2FBzEq4
Slide 13: "Pancakes for Dinner" Commercial
13 “Pancakes for Dinner” Commercial Link to Commercial https://www.youtube.com/watch?v=qmviqUsyOWo#t=2
Slide 14: "Genius / BYO Slam" Commercial
14 “Genius / BYO Slam” Commercial Link to Commercial Unavailable at this time
Slide 15: Improving Guest Service
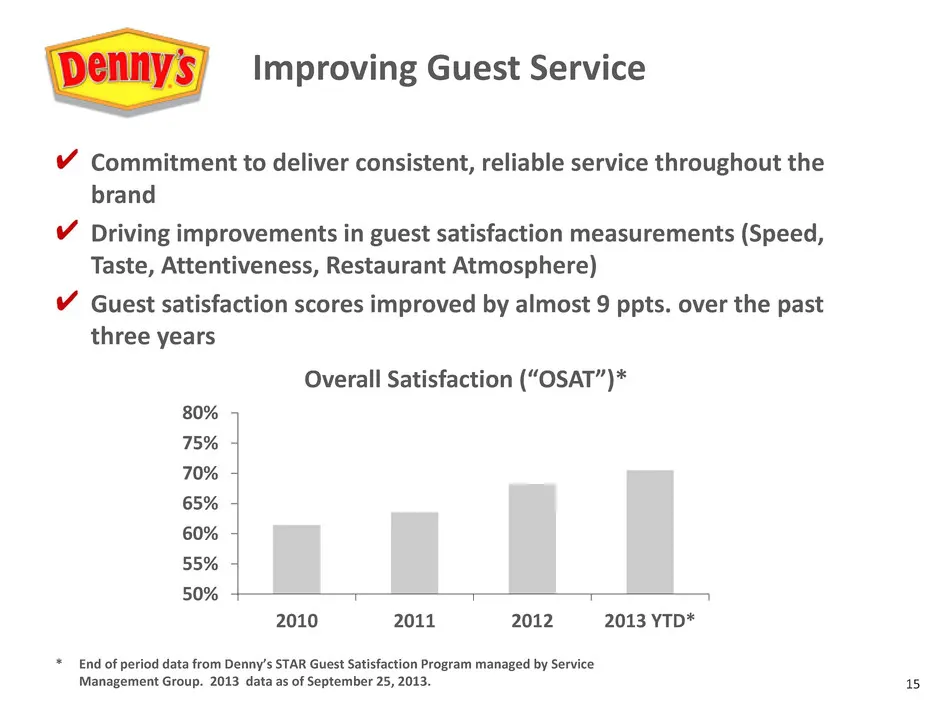
15 50% 55% 60% 65% 70% 75% 80% 2010 2011 2012 2013 YTD* Overall Satisfaction (“OSAT”)* Commitment to deliver consistent, reliable service throughout the brand Driving improvements in guest satisfaction measurements (Speed, Taste, Attentiveness, Restaurant Atmosphere) Guest satisfaction scores improv
Slide 16: New Heritage Remodel Program: Exterior
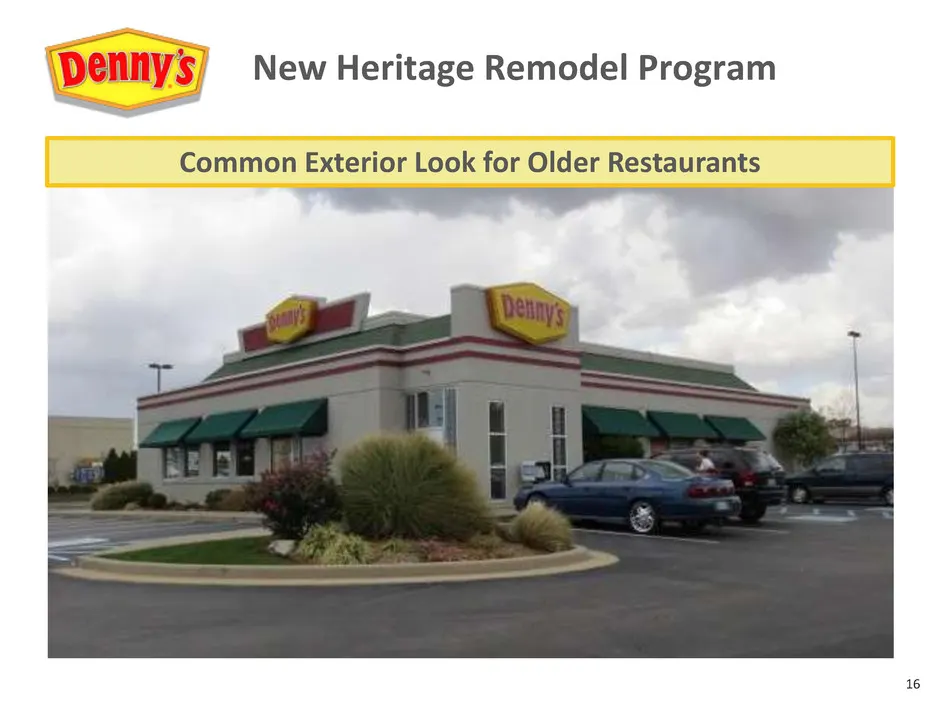
16 New Heritage Remodel Program Common Exterior Look for Older Restaurants
Slide 17: New Heritage Remodel Program: Interior
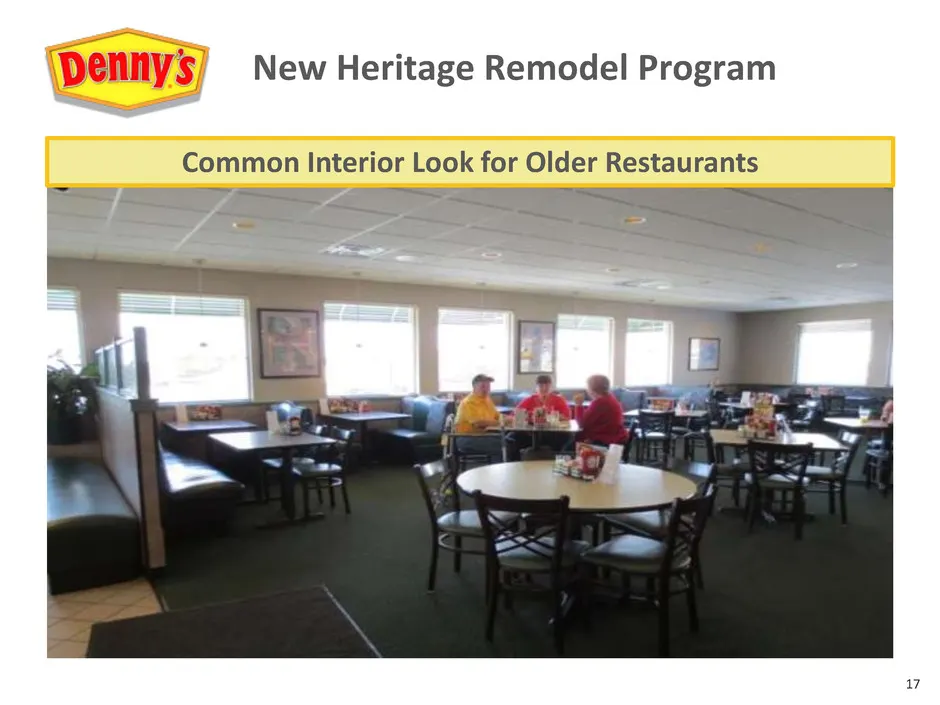
17 New Heritage Remodel Program Common Interior Look for Older Restaurants
Slide 18: New Heritage Remodel Program
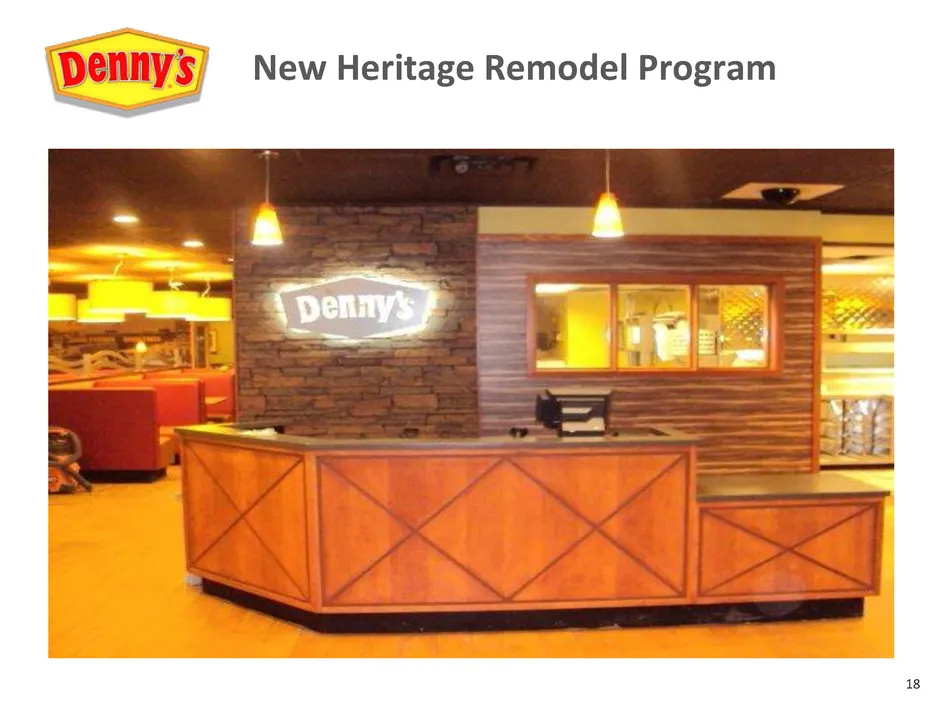
18 New Heritage Remodel Program
Slide 19: New Heritage Remodel Program
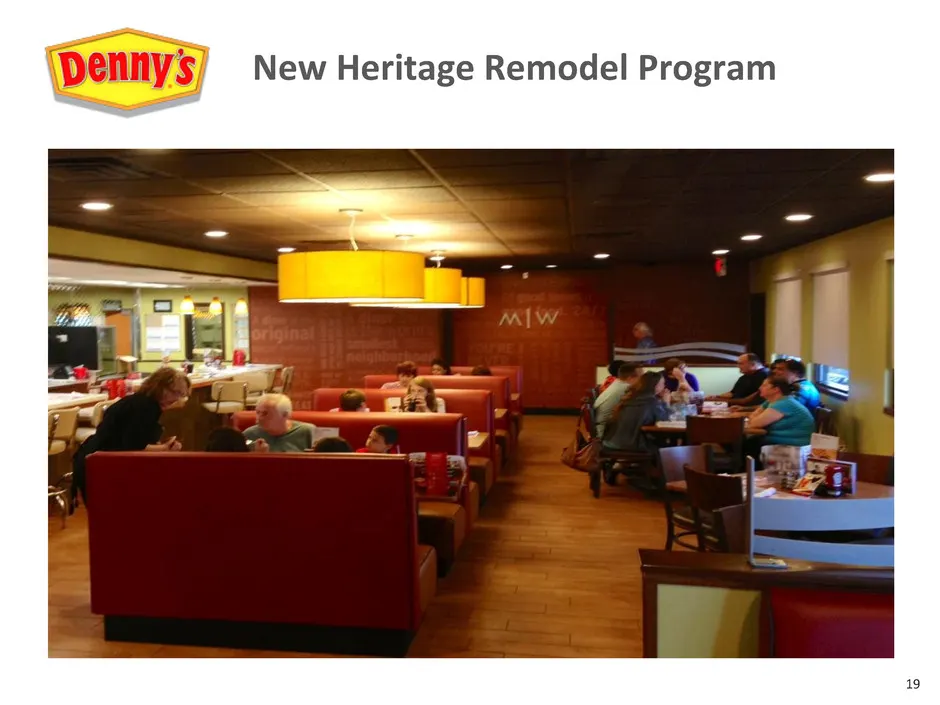
19 New Heritage Remodel Program
Slide 20: Enhancing Denny's Atmosphere with New Heritage Remodel Program
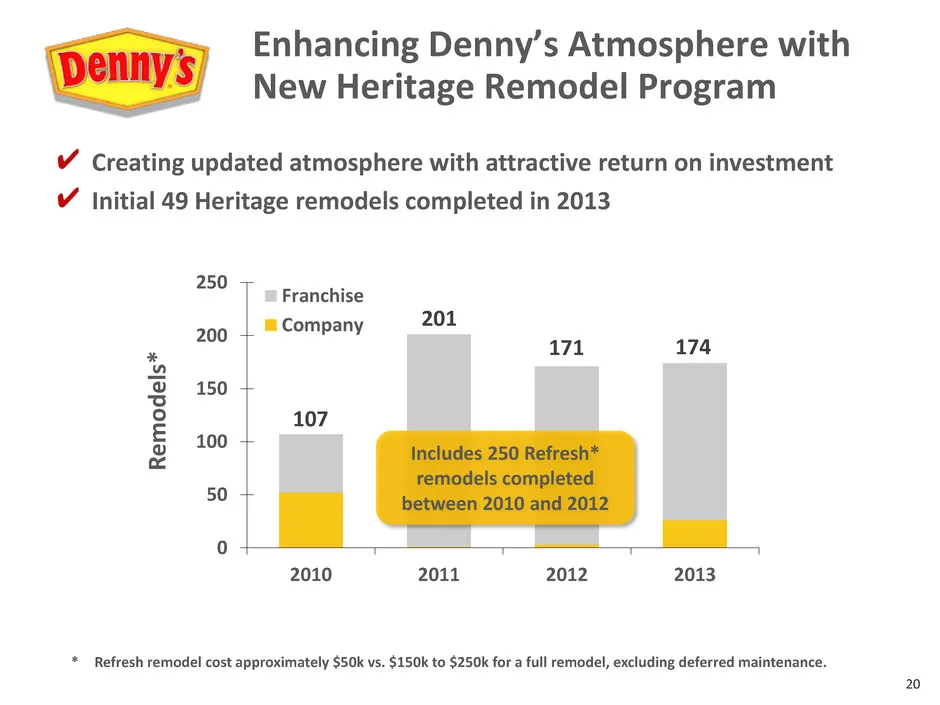
20 Enhancing Denny’s Atmosphere with New Heritage Remodel Program Creating updated atmosphere with attractive return on investment Initial 49 Heritage remodels completed in 2013 0 50 100 150 200 250 2010 2011 2012 2013 R emodels * Franchise Company * Refresh remodel cost approximately $50k vs. $150k
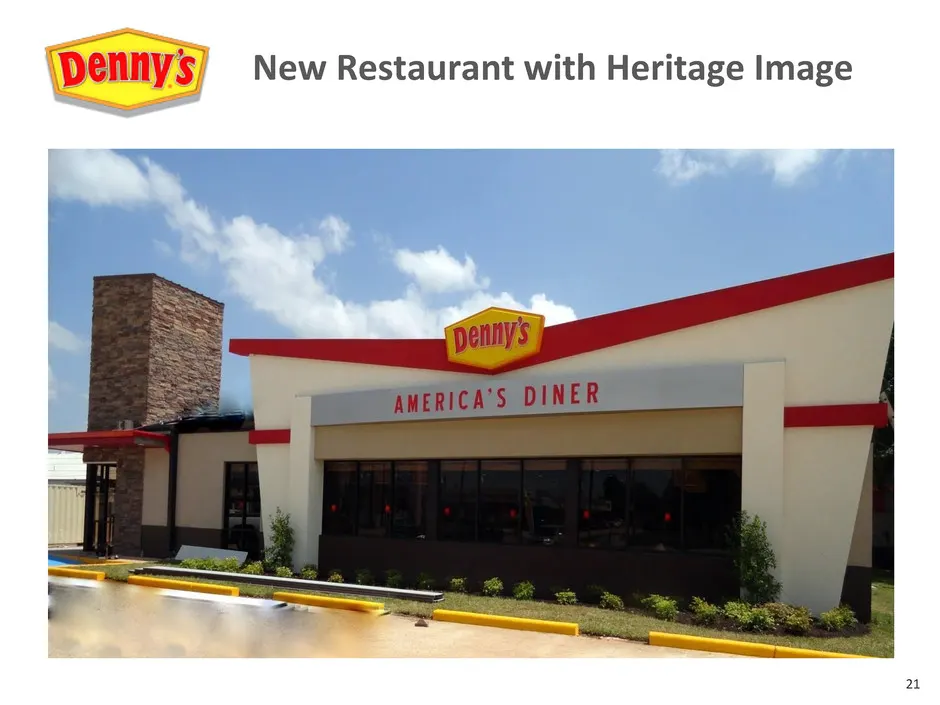
Slide 21: New Restaurant with Heritage Image
21 New Restaurant with Heritage Image
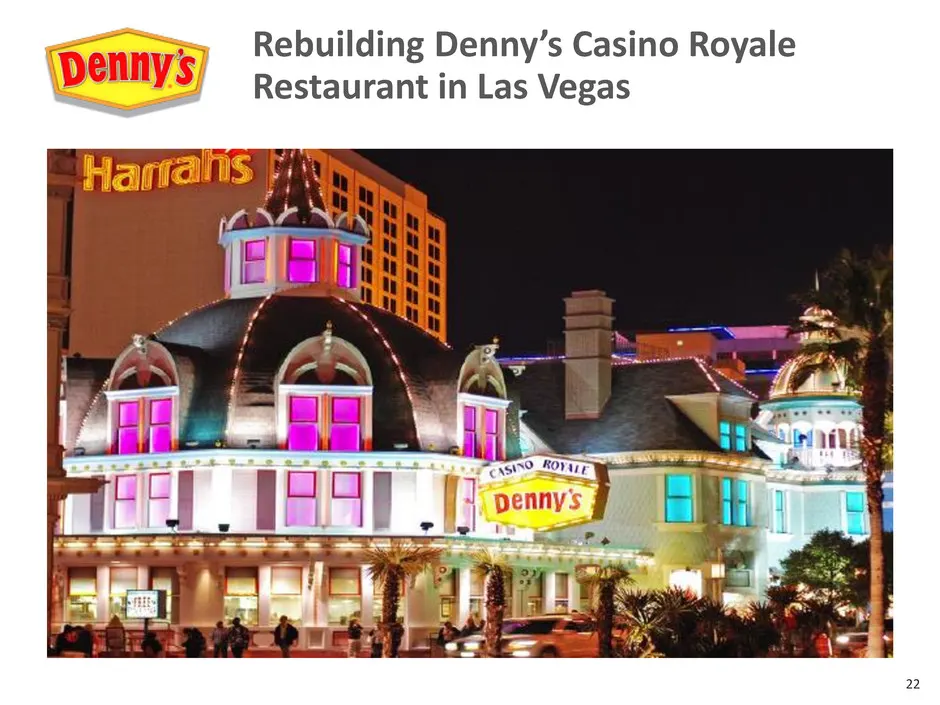
Slide 22: Rebuilding Denny's Casino Royale Restaurant in Las Vegas
22 Redevelopment of location by landlord provides opportunity to rebuild Denny’s highest volume restaurant Rebuilding Denny’s Casino Royale Restaurant in Las Vegas
Slide 23: Continue to Grow and Energize Franchise System
23 Growing group of 274 franchisees with 37 owning more than 10 restaurants, or 53% of system Utilizing Brand Advisory Councils and Denny’s Franchisee Association (DFA) to drive improvements Leading full-service franchisor providing support through a number of avenues: • In-house purchasing group co
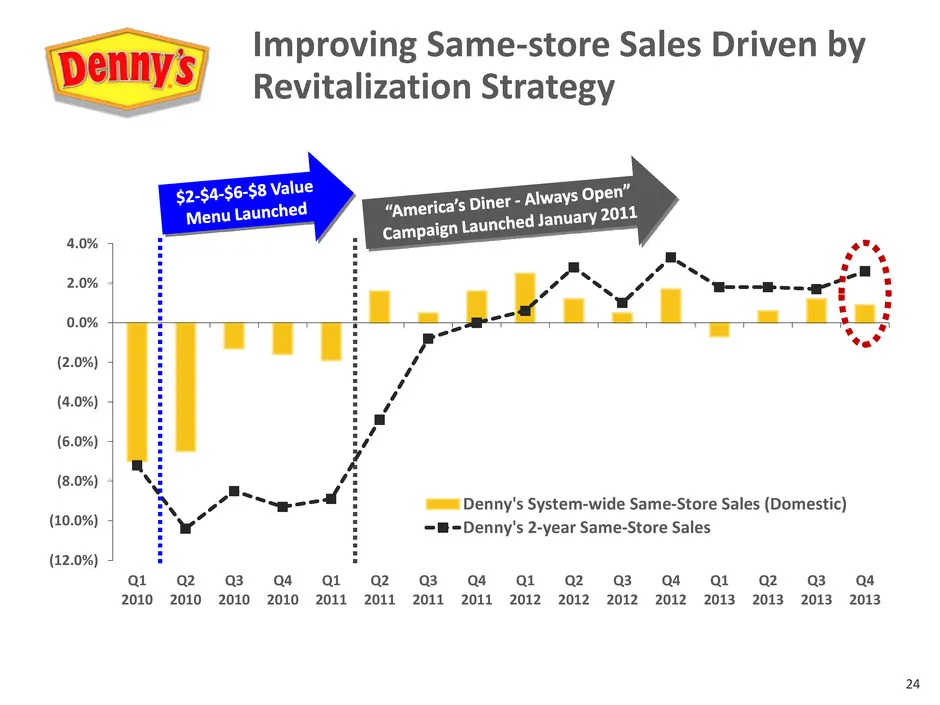
Slide 24: Improving Same-store Sales Driven by Revitalization Strategy
24 (12.0%) (10.0%) (8.0%) (6.0%) (4.0%) (2.0%) 0.0% 2.0% 4.0% Q1 2010 Q2 2010 Q3 2010 Q4 2010 Q1 2011 Q2 2011 Q3 2011 Q4 2011 Q1 2012 Q2 2012 Q3 2012 Q4 2012 Q1 2013 Q2 2013 Q3 2013 Q4 2013 Denny's System-wide Same-Store Sales (Domestic) Denny's 2-year Same-Store Sales Improving Same-store Sales Dri
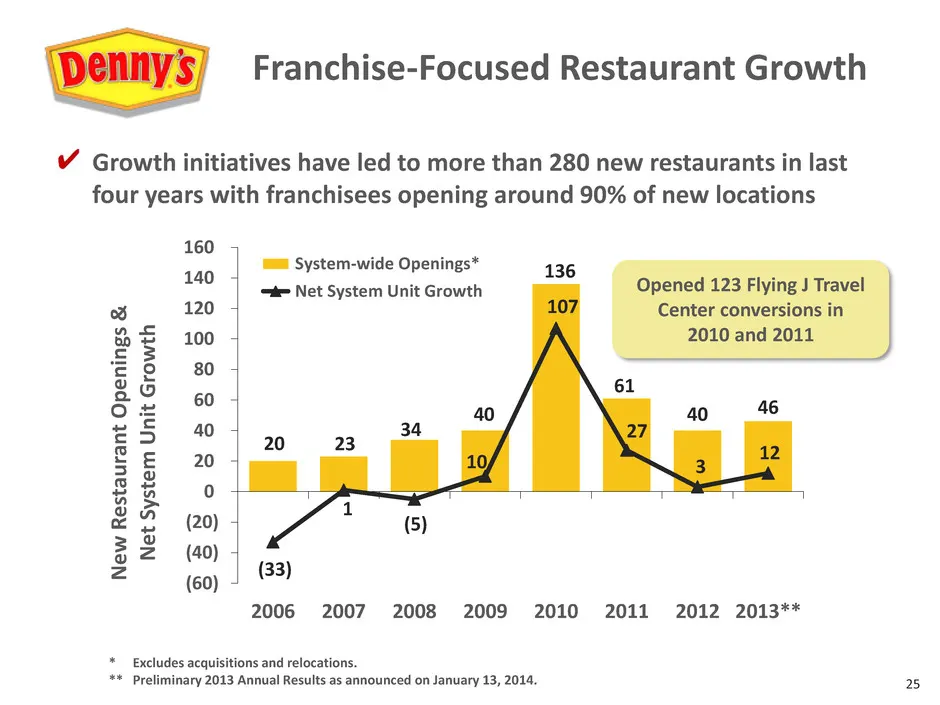
Slide 25: Franchise-Focused Restaurant Growth
25 20 23 34 40 136 61 40 46 (33) 1 (5) 10 107 27 3 12 (60) (40) (20) 0 20 40 60 80 100 120 140 160 2006 2007 2008 2009 2010 2011 2012 2013** New R e st au ra n t Op e n in gs & Net Sy st e m U n it G ro w th System-wide Openings* Net System Unit Growth * Excludes acquisitions and relocations. ** Pre
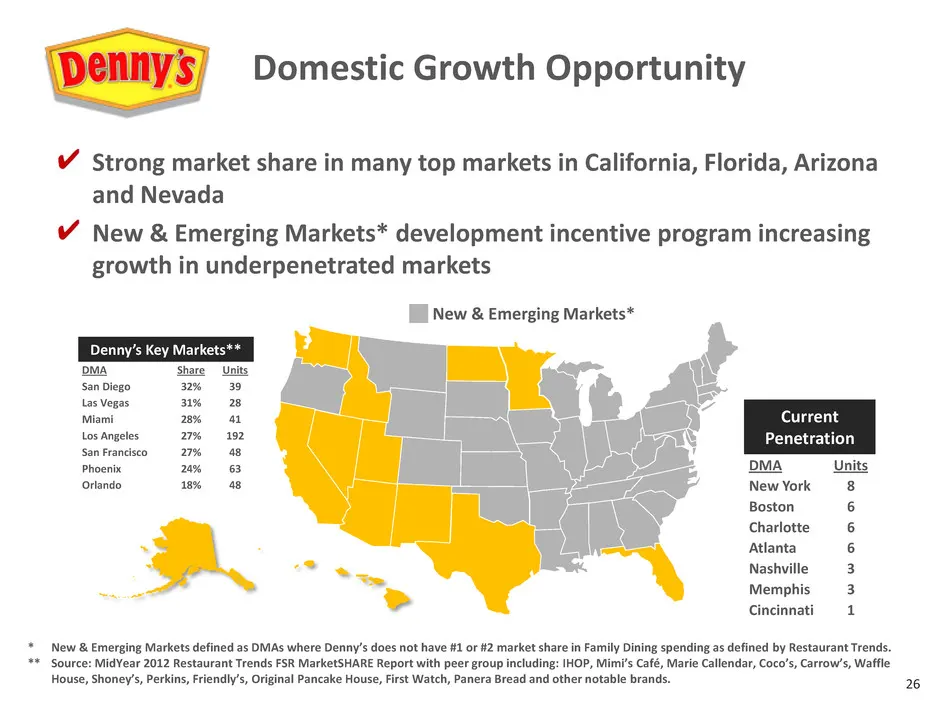
Slide 26: Domestic Growth: Key Markets and New & Emerging Markets
26 Strong market share in many top markets in California, Florida, Arizona and Nevada New & Emerging Markets* development incentive program increasing growth in underpenetrated markets Denny’s Key Markets** DMA Share Units San Diego 32% 39 Las Vegas 31% 28 Miami 28% 41 Los Angeles 27% 192 San Franci
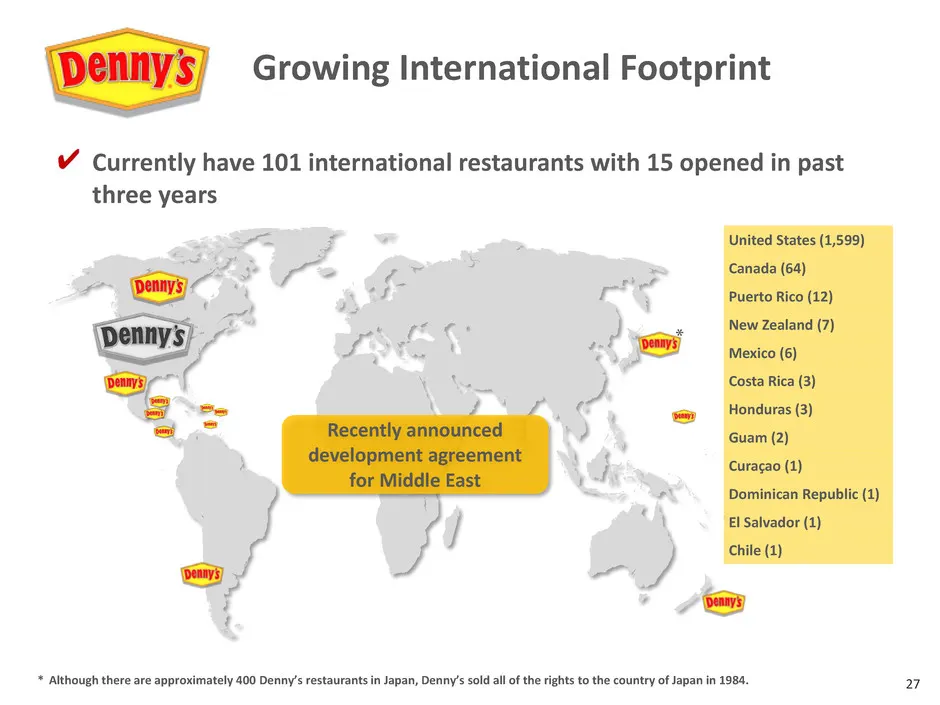
Slide 27: Growing International Footprint
27 * Although there are approximately 400 Denny’s restaurants in Japan, Denny’s sold all of the rights to the country of Japan in 1984. United States (1,599) Canada (64) Puerto Rico (12) New Zealand (7) Mexico (6) Costa Rica (3) Honduras (3) Guam (2) Curaçao (1) Dominican Republic (1) El Salvador (1
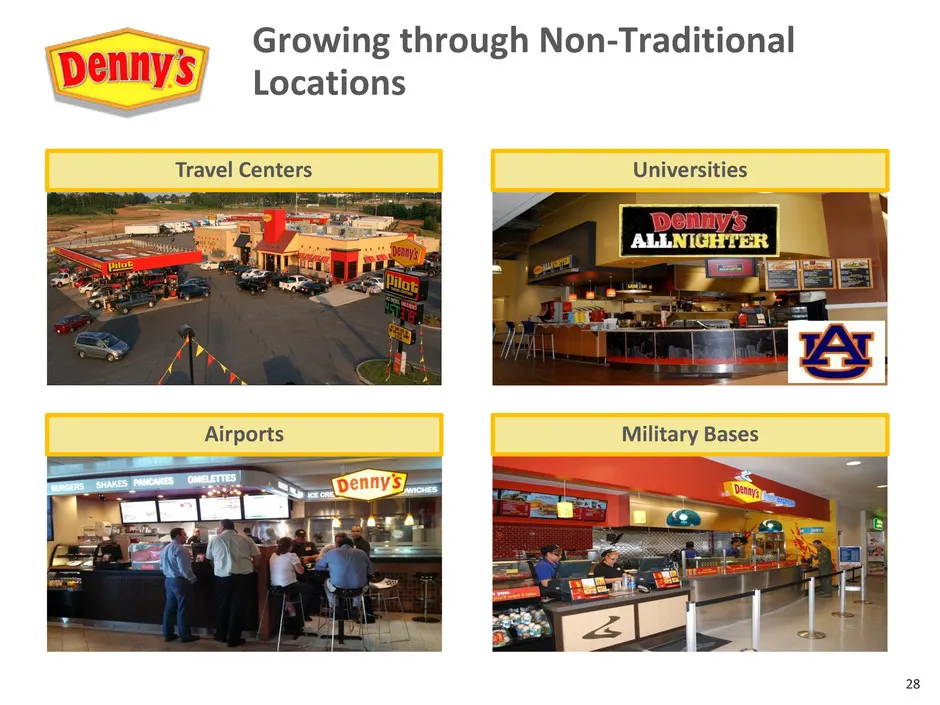
Slide 28: Growing through Non-Traditional Locations
28 Growing through Non-Traditional Locations Travel Centers Airports Universities Military Bases
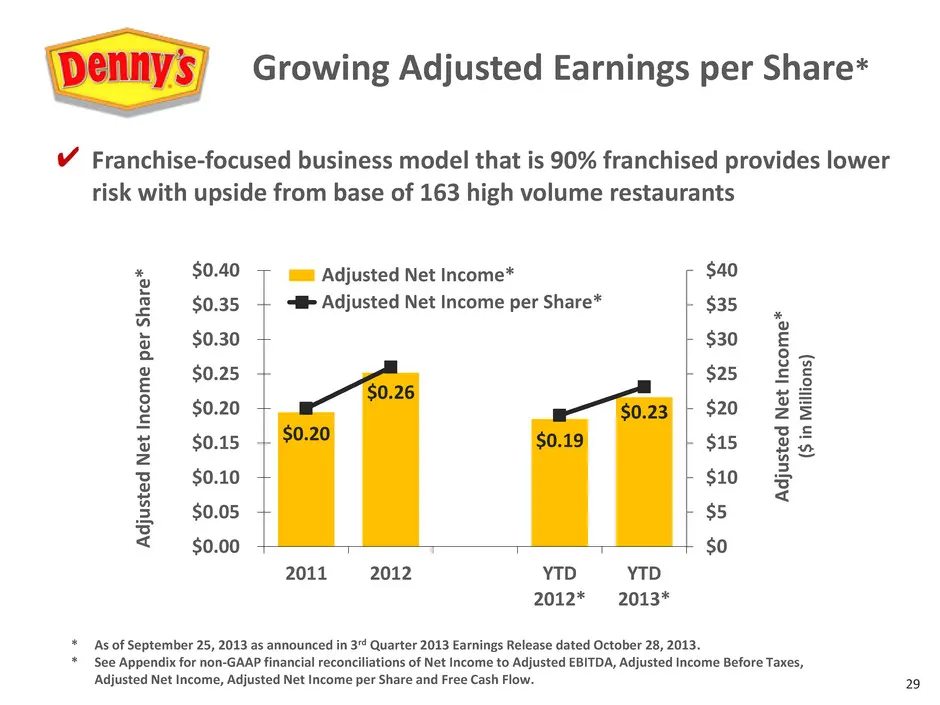
Slide 29: Growing Adjusted Earnings per Share
29 $0.20 $0.26 $0.19 $0.23 $0 $5 $10 $15 $20 $25 $30 $35 $40 $0.00 $0.05 $0.10 $0.15 $0.20 $0.25 $0.30 $0.35 $0.40 2011 2012 YTD 2012* YTD 2013* A d ju st ed N et In co me * ($ in Mil lio n s) A d ju st ed N et In co me p er Sha re * Adjusted Net Income* Adjusted Net Income per Share* * As of Septem
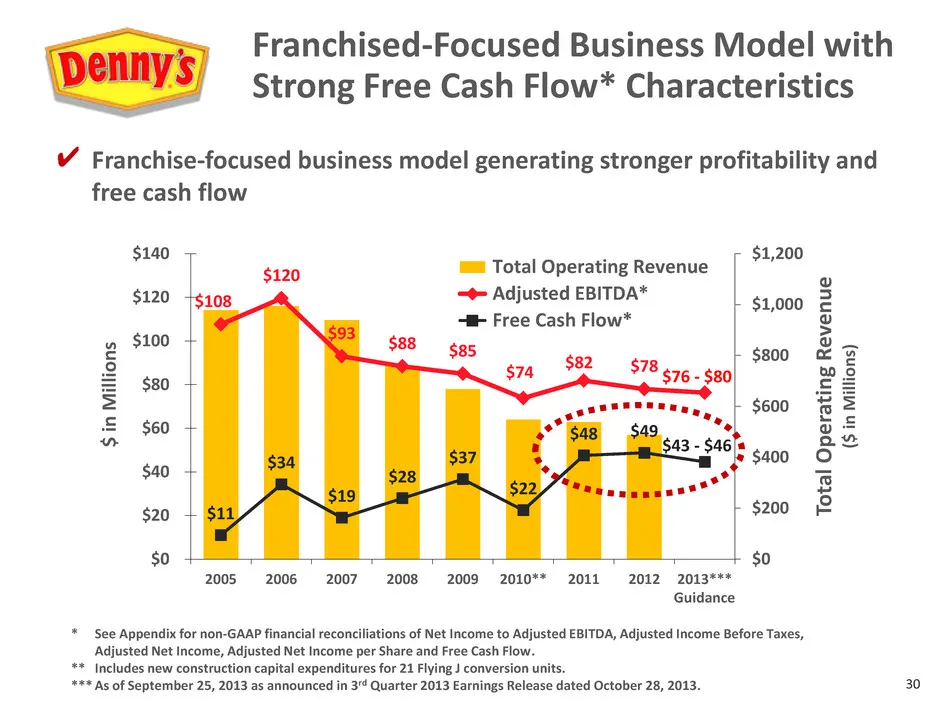
Slide 30: Franchised-Focused Business Model with Strong Free Cash Flow
30 $108 $120 $93 $88 $85 $74 $82 $78 $11 $34 $19 $28 $37 $22 $48 $49 $0 $200 $400 $600 $800 $1,000 $1,200 $0 $20 $40 $60 $80 $100 $120 $140 2005 2006 2007 2008 2009 2010** 2011 2012 2013*** To tal Op e ra ti n g R ev e n u e ($ in Mil lio n s) $ in M ill io n s Total Operating Revenue Adjusted EBITD
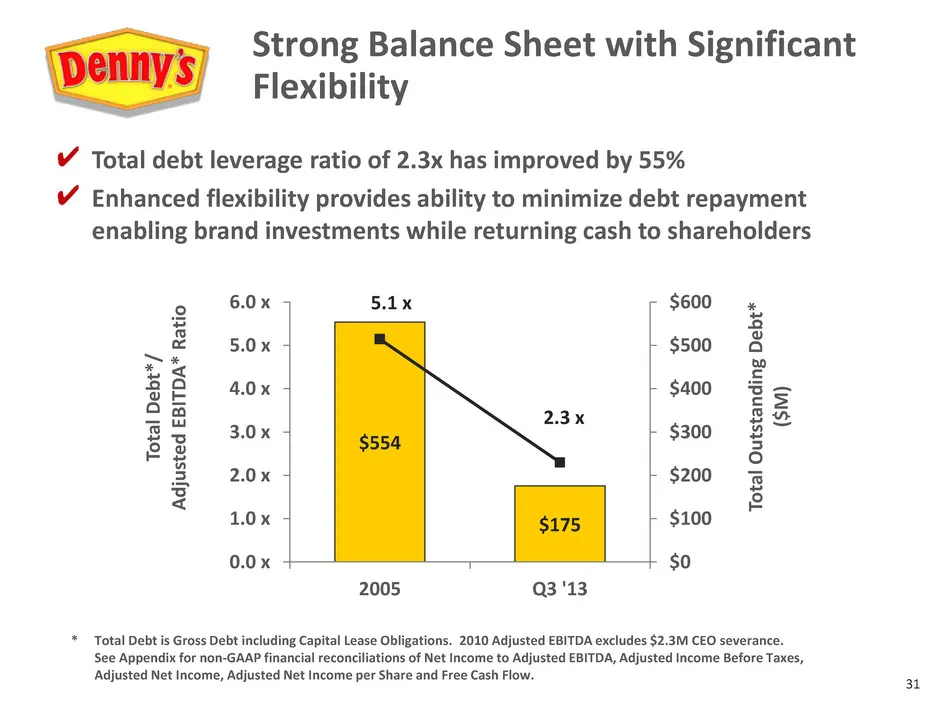
Slide 31: Strong Balance Sheet with Significant Flexibility
31 Strong Balance Sheet with Significant Flexibility $554 $175 5.1 x 2.3 x 0.0 x 1.0 x 2.0 x 3.0 x 4.0 x 5.0 x 6.0 x 2005 Q3 '13 $0 $100 $200 $300 $400 $500 $600 To ta l De b t* / A d ju st ed E B IT D A * R ati o To ta l Ou ts tan d ing De b t* ($ M ) Total debt leverage ratio of 2.3x has improved
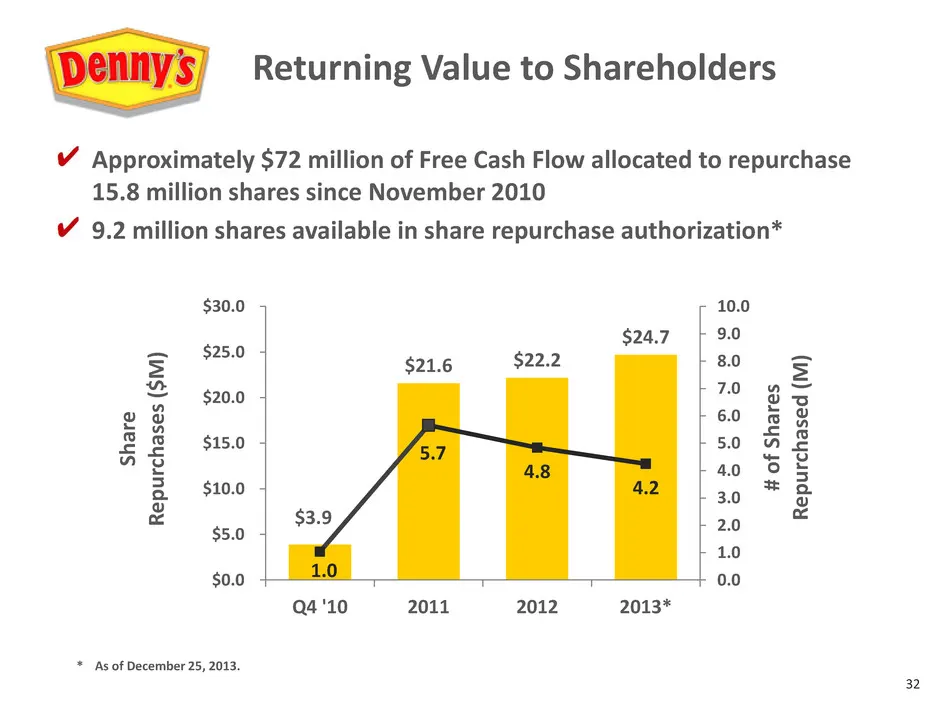
Slide 32: Returning Value to Shareholders
32 $3.9 $21.6 $22.2 $24.7 1.0 5.7 4.8 4.2 0.0 1.0 2.0 3.0 4.0 5.0 6.0 7.0 8.0 9.0 10.0 Q4 '10 2011 2012 2013* $0.0 $5.0 $10.0 $15.0 $20.0 $25.0 $30.0 # o f Sha re s R e p u rc h as e d (M ) Sh ar e R e p u rc h as e s ($M ) Approximately $72 million of Free Cash Flow allocated to repurchase 15.8 mil
Slide 33: Denny's Investment Highlights
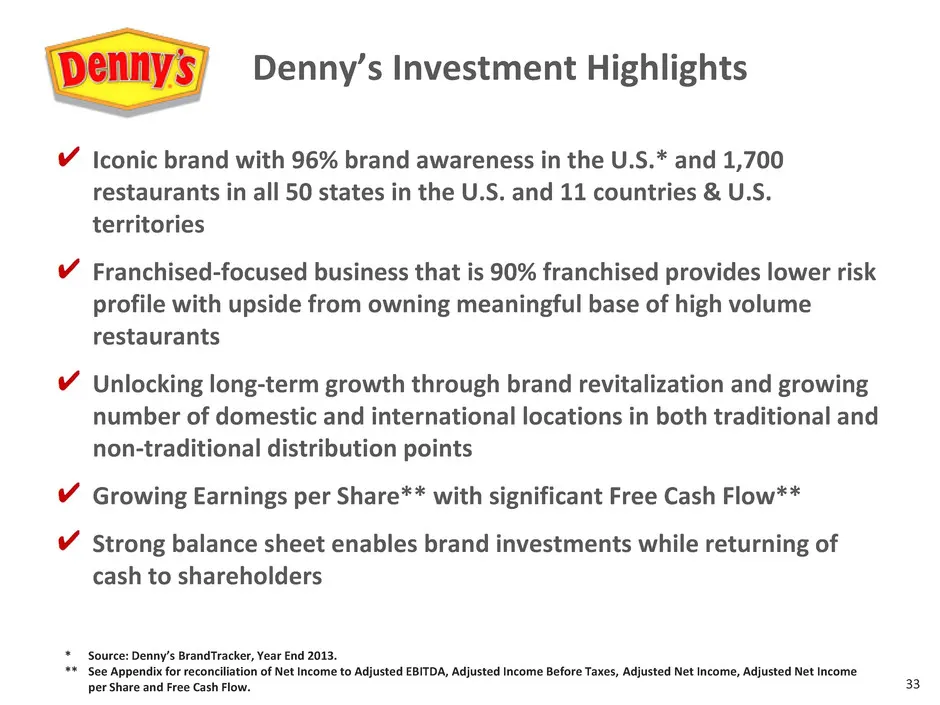
33 Denny’s Investment Highlights Iconic brand with 96% brand awareness in the U.S.* and 1,700 restaurants in all 50 states in the U.S. and 11 countries & U.S. territories Franchised-focused business that is 90% franchised provides lower risk profile with upside from owning meaningful base of high vo
Slide 34: Appendix
APPENDIX
Slide 35: Successful Transition to Franchise Based Business Model through FGI Program
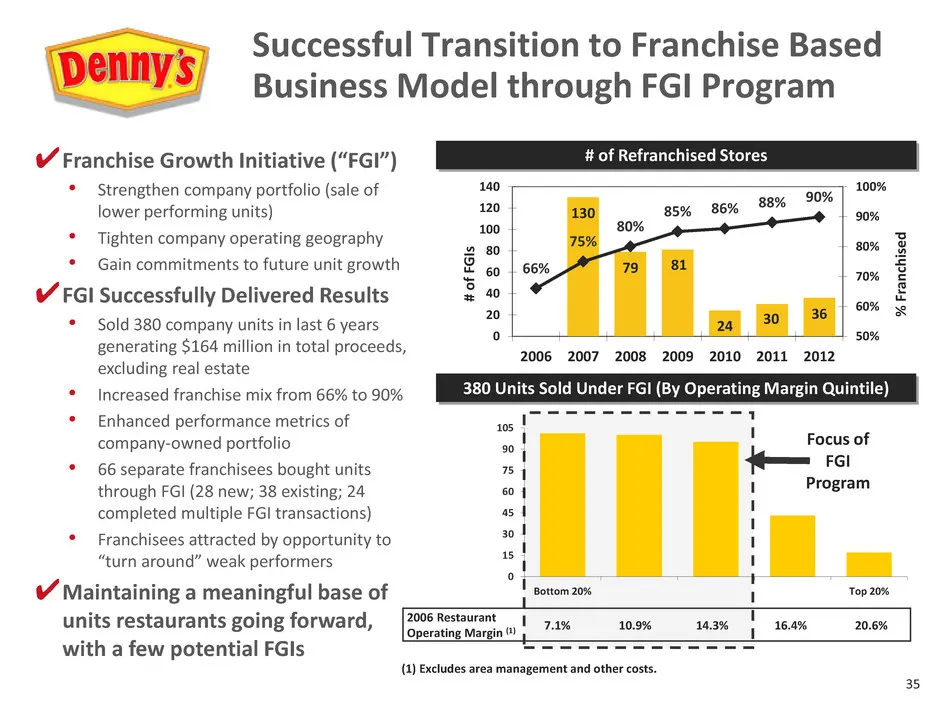
35 380 Units Sold Under FGI (By Operating Margin Quintile) # of Refranchised Stores 130 79 81 24 30 36 66% 75% 80% 85% 86% 88% 90% 50% 60% 70% 80% 90% 100% 0 20 40 60 80 100 120 140 2006 2007 2008 2009 2010 2011 2012 % F ra n ch ise d # o f FG Is 0 15 30 45 60 75 90 105 Bottom 20% Top 20% 7.1% 10.9%
Slide 36: Non-GAAP Financial Reconciliations
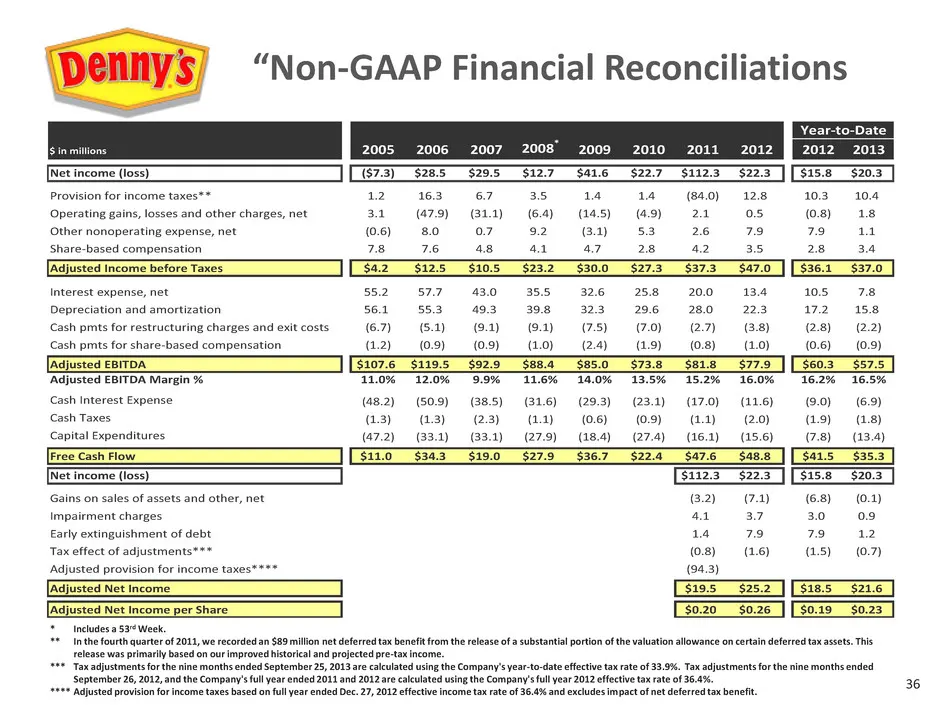
36 * Includes a 53rd Week. ** In the fourth quarter of 2011, we recorded an $89 million net deferred tax benefit from the release of a substantial portion of the valuation allowance on certain deferred tax assets. This release was primarily based on our improved historical and projected pre-tax inco
Source: SEC EDGAR · 8-K filed Jan 14, 2014
More decks from Dennys Corp
 Investor Presentation (August 2025)30 slides · Aug 4, 2025
 Investor Presentation (May 2025)32 slides · May 2025
 Investor Presentation (February 2025)32 slides · February 2025
 Investor Presentation (January 2025)32 slides · Jan 13, 2025
 Investor Day (October 2024)137 slides · Oct 22, 2024
 Q2 2024 Earnings Presentation22 slides · Jul 30, 2024