Dennys — Q2 2024 Earnings Presentation
22 slides from Dennys's earnings presentation, Jul 30, 2024

Slide 1: Investor Presentation
D E N N Y ’ S C O R P O R AT I O N INVESTOR PRESENTATION JULY THROUGH SEPTEMBER 2024
Slide 2: Forward-Looking Statements and Non-GAAP Financial Measures
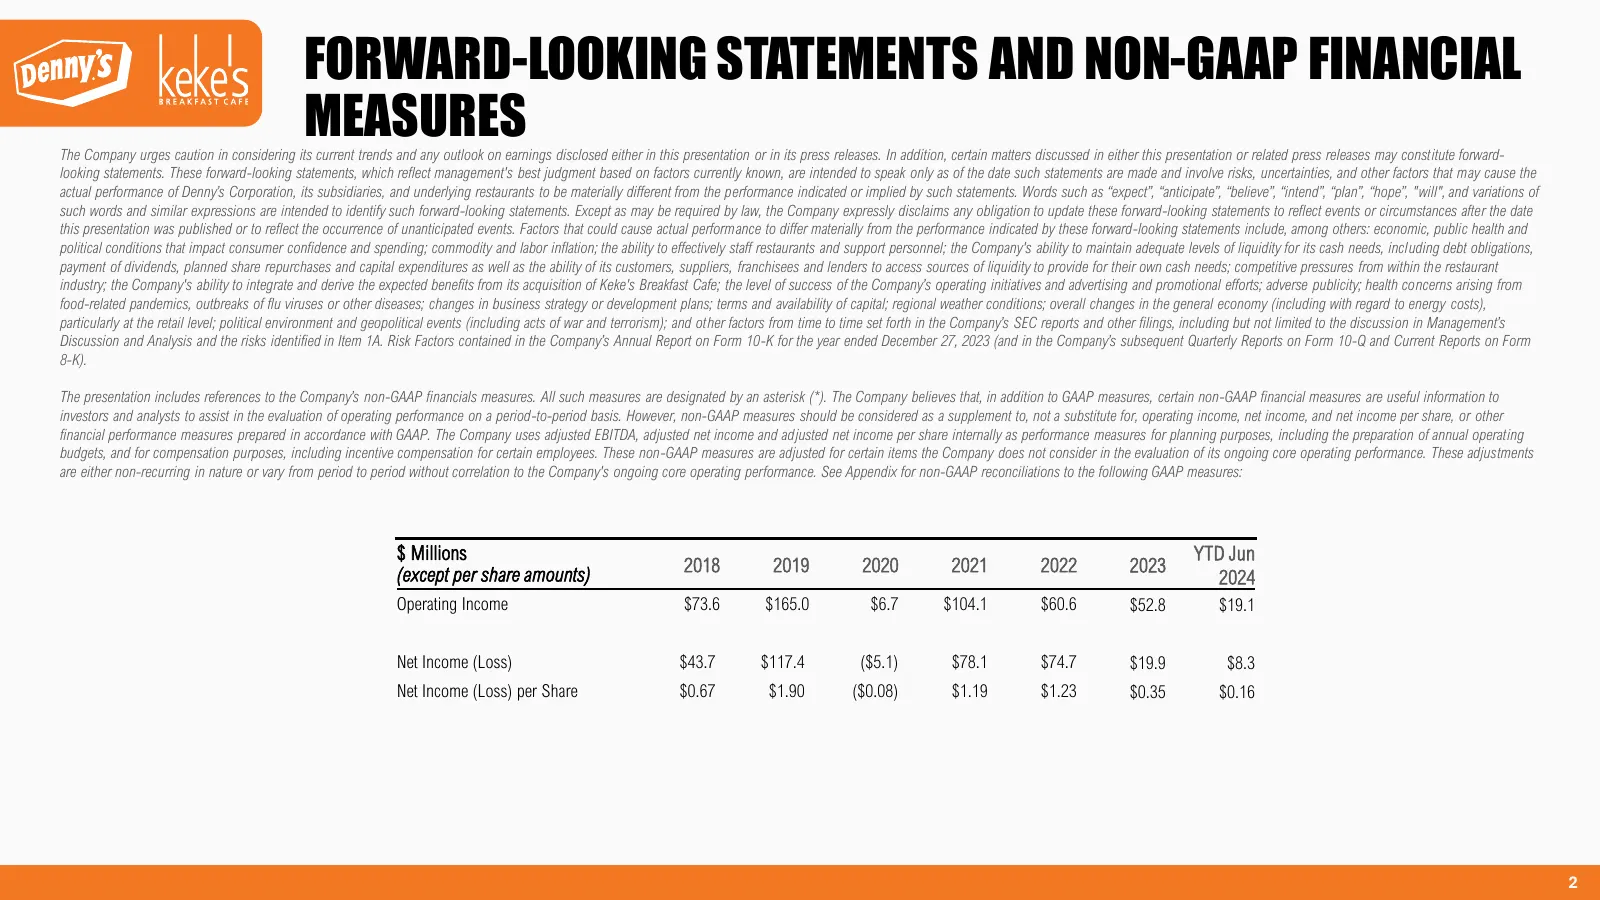
FORWARD-LOOKING STATEMENTS AND NON-GAAP FINANCIAL MEASURES The Company urges caution in considering its current trends and any outlook on earnings disclosed either in this presentation or in its press releases. In addition, certain matters discussed in either this presentation or related press relea
Slide 3: Q2 2024 Highlights
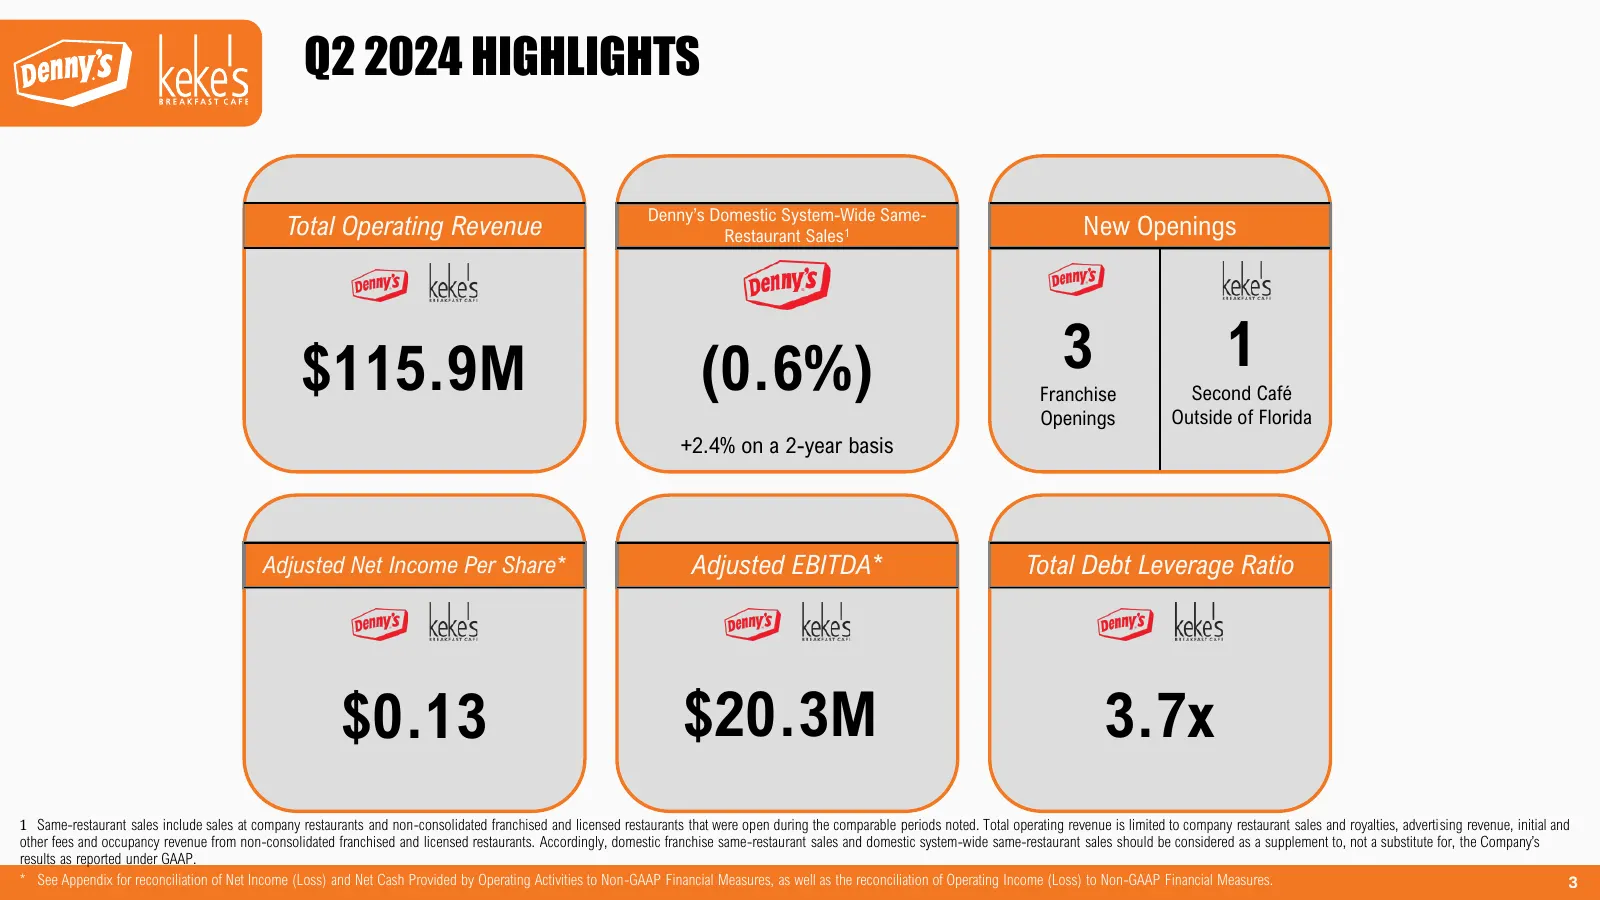
Q2 2024 HIGHLIGHTS Denny’s Domestic System-Wide Same- Total Operating Revenue Restaurant Sales1 New Openings $115.9M (0.6%) 3 1 Franchise Second Café Openings Outside of Florida +2.4% on a 2-year basis Adjusted Net Income Per Share* Adjusted EBITDA* Total Debt Leverage Ratio $0.13 $20.3M 3.7x 1 Same
Slide 4: Full Year 2024 Guidance
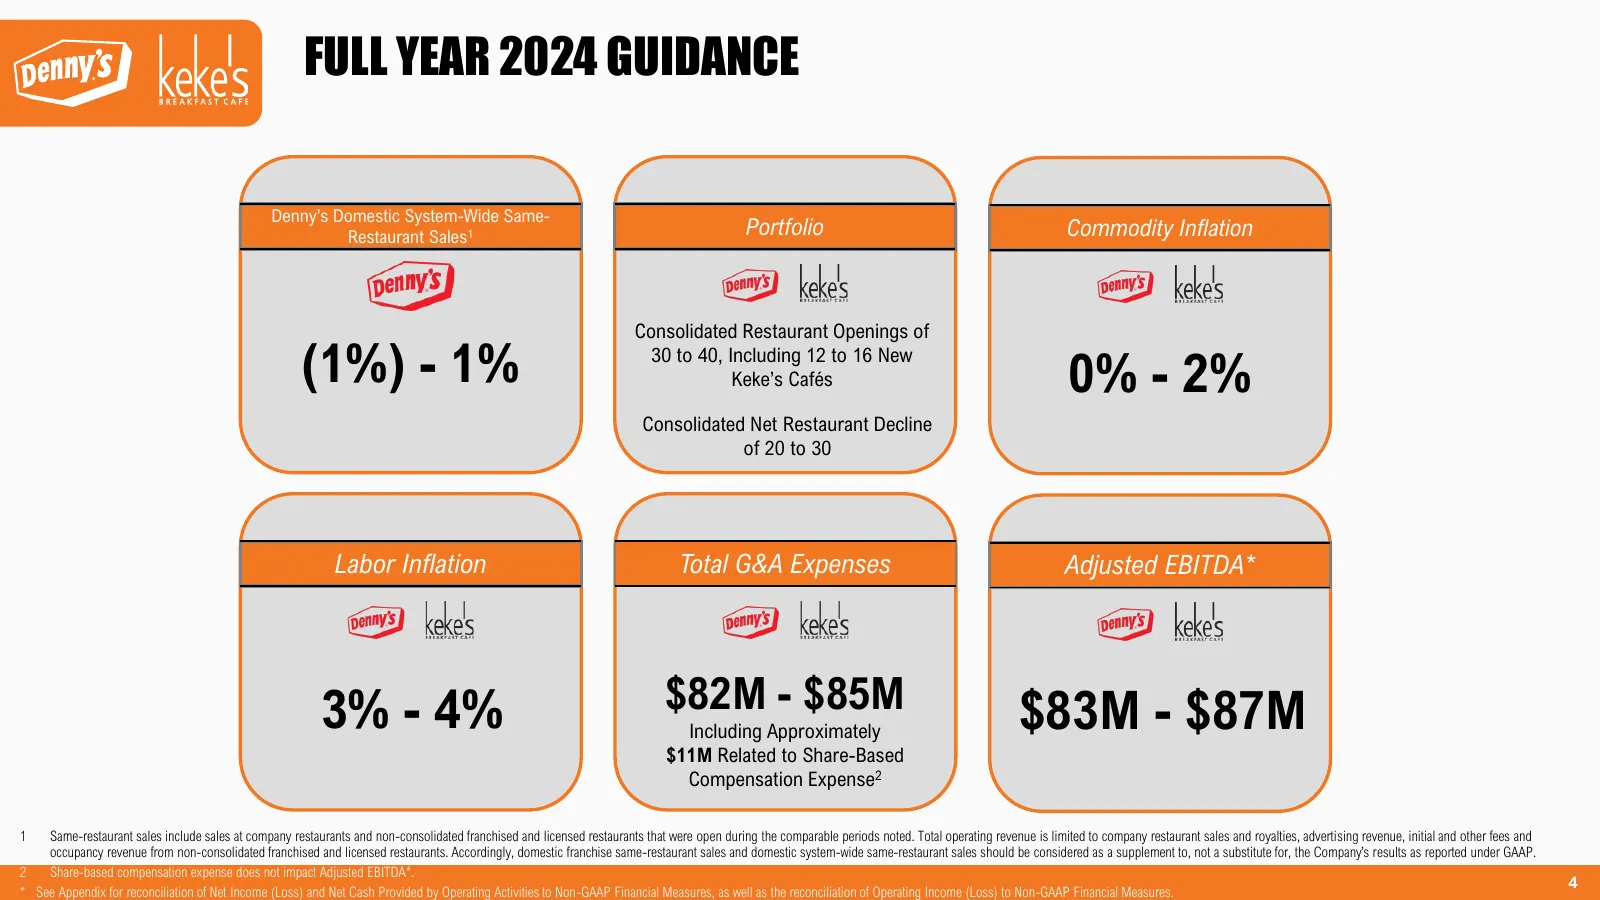
FULL YEAR 2024 GUIDANCE Denny’s Domestic System-Wide Same- Restaurant Sales1 Portfolio Commodity Inflation Consolidated Restaurant Openings of (1%) - 1% 30 to 40, Including 12 to 16 New Keke’s Cafés 0% - 2% Consolidated Net Restaurant Decline of 20 to 30 Labor Inflation Total G&A Expenses Adjusted E

Slide 5: Denny's
DENNY’S
Slide 6: Denny's Domestic Sales
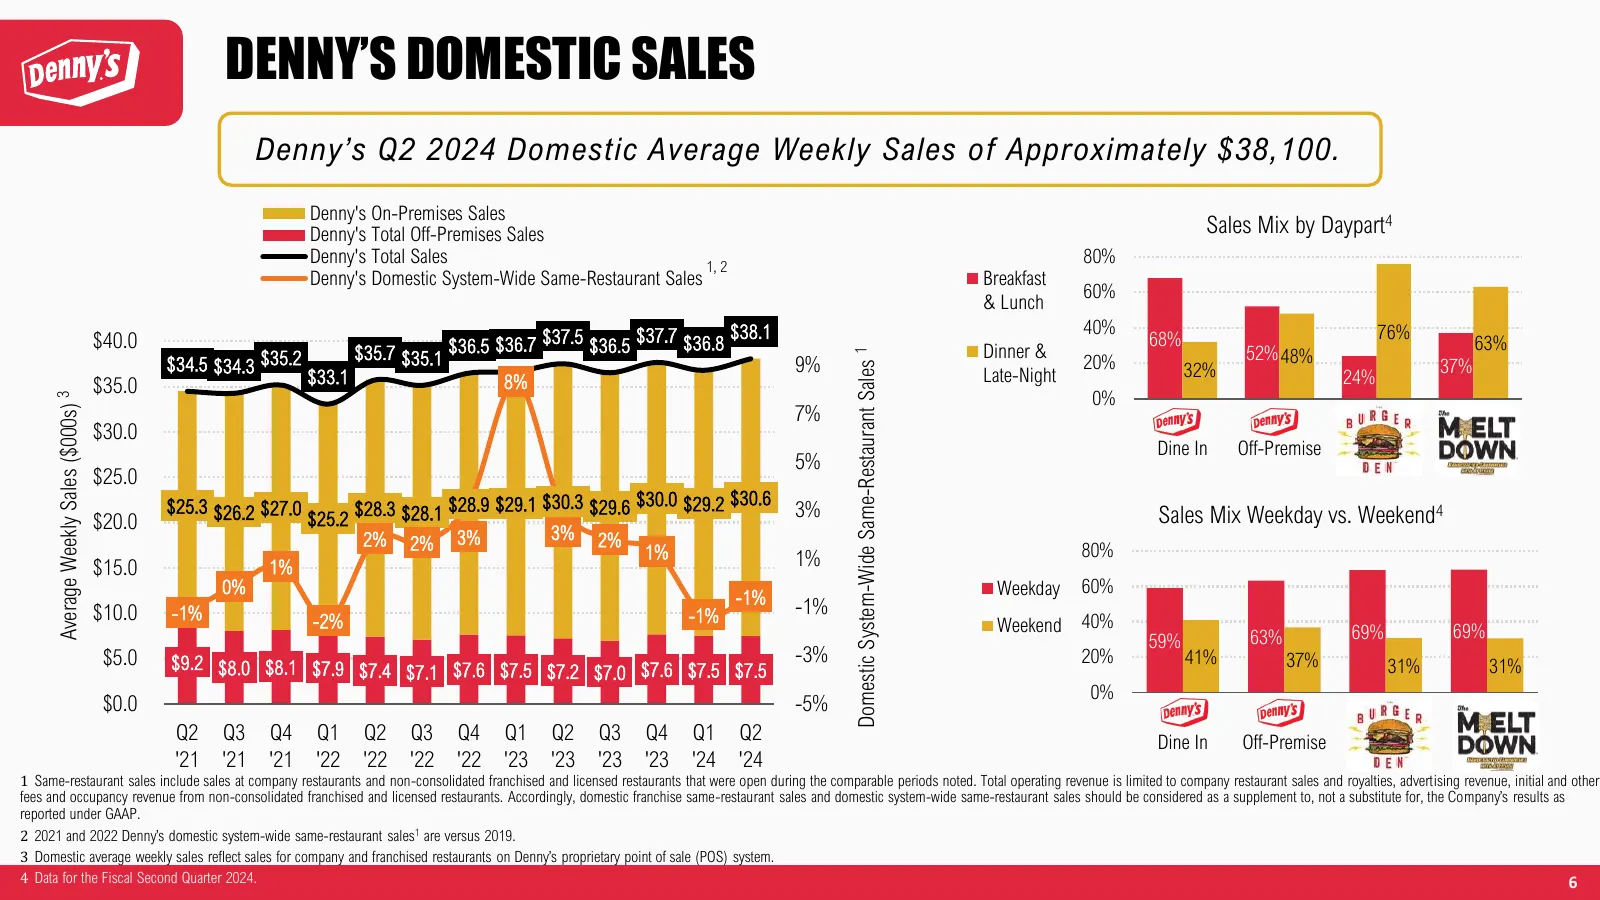
DENNY’S DOMESTIC SALES Denny’s Q2 2024 Domestic Average Weekly Sales of Approximately $38,100. Denny's On-Premises Sales Denny's Total Off-Premises Sales Sales Mix by Daypart4 Denny's Total Sales 1, 2 80% Denny's Domestic System-Wide Same-Restaurant Sales Breakfast 60% & Lunch $37.5 $36.5 $37.7 $36.
Slide 7: Denny's Value and Off-Premises Sales
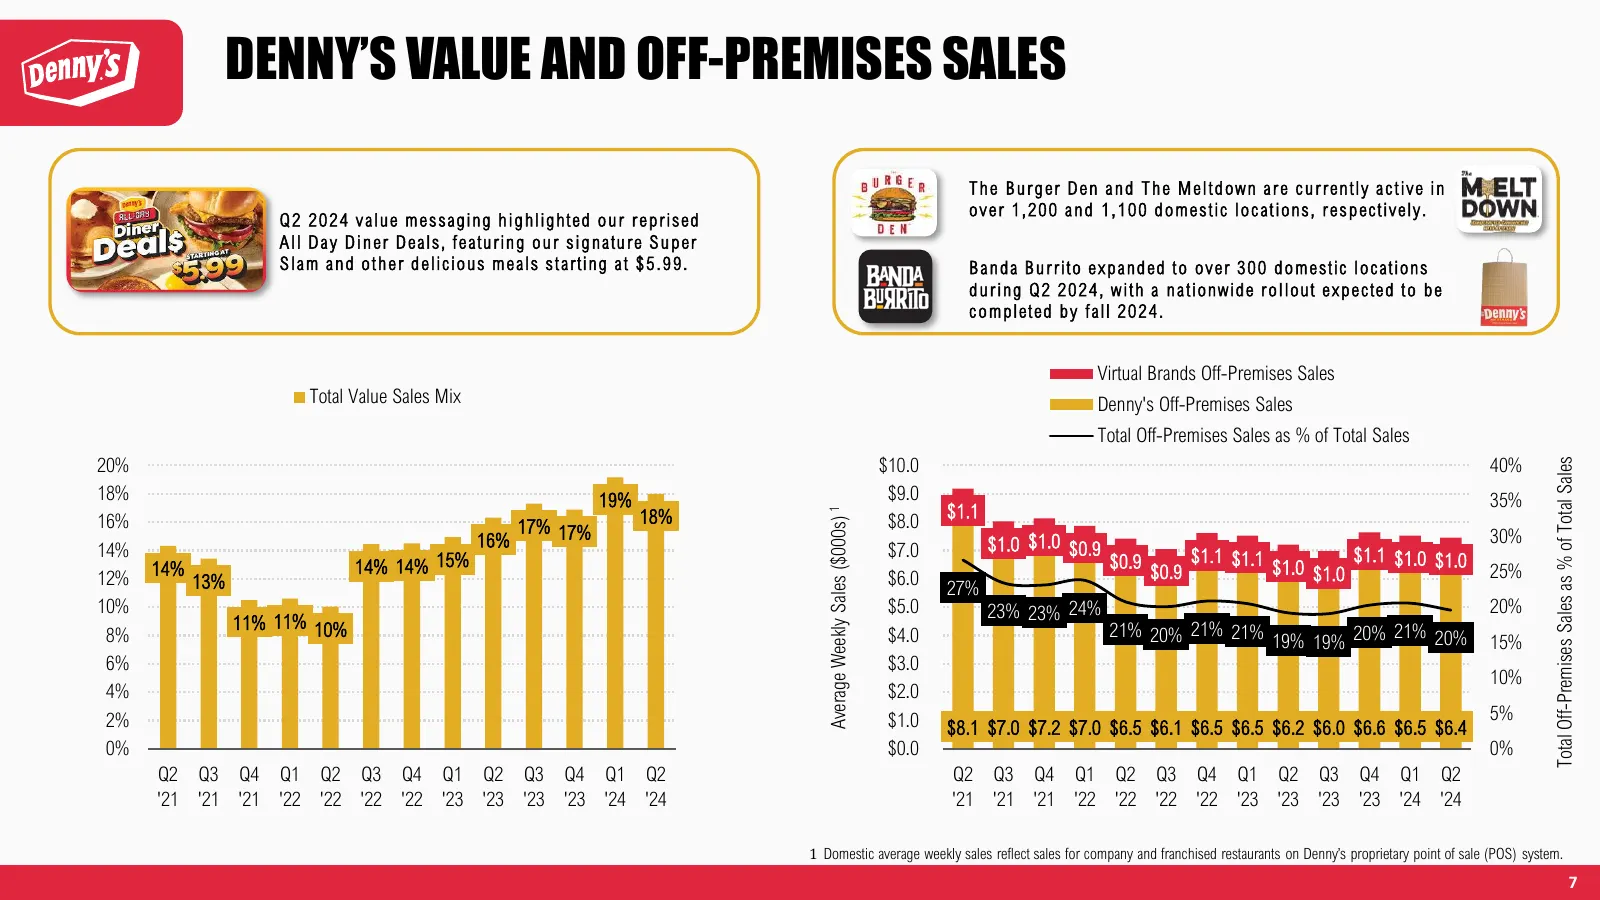
DENNY’S VALUE AND OFF-PREMISES SALES T h e B u r g er D e n a n d T h e M e l t d o w n a r e c u r r en tl y a c t i v e i n o v e r 1 , 2 0 0 a n d 1 , 1 0 0 d o m e s ti c l o c a t i o ns , r e s p ec ti v el y . Q 2 2 0 2 4 v a l u e m e s s a g i n g h i g h l i g h ted o u r r e p r i s ed A
Slide 8: Denny's Footprint
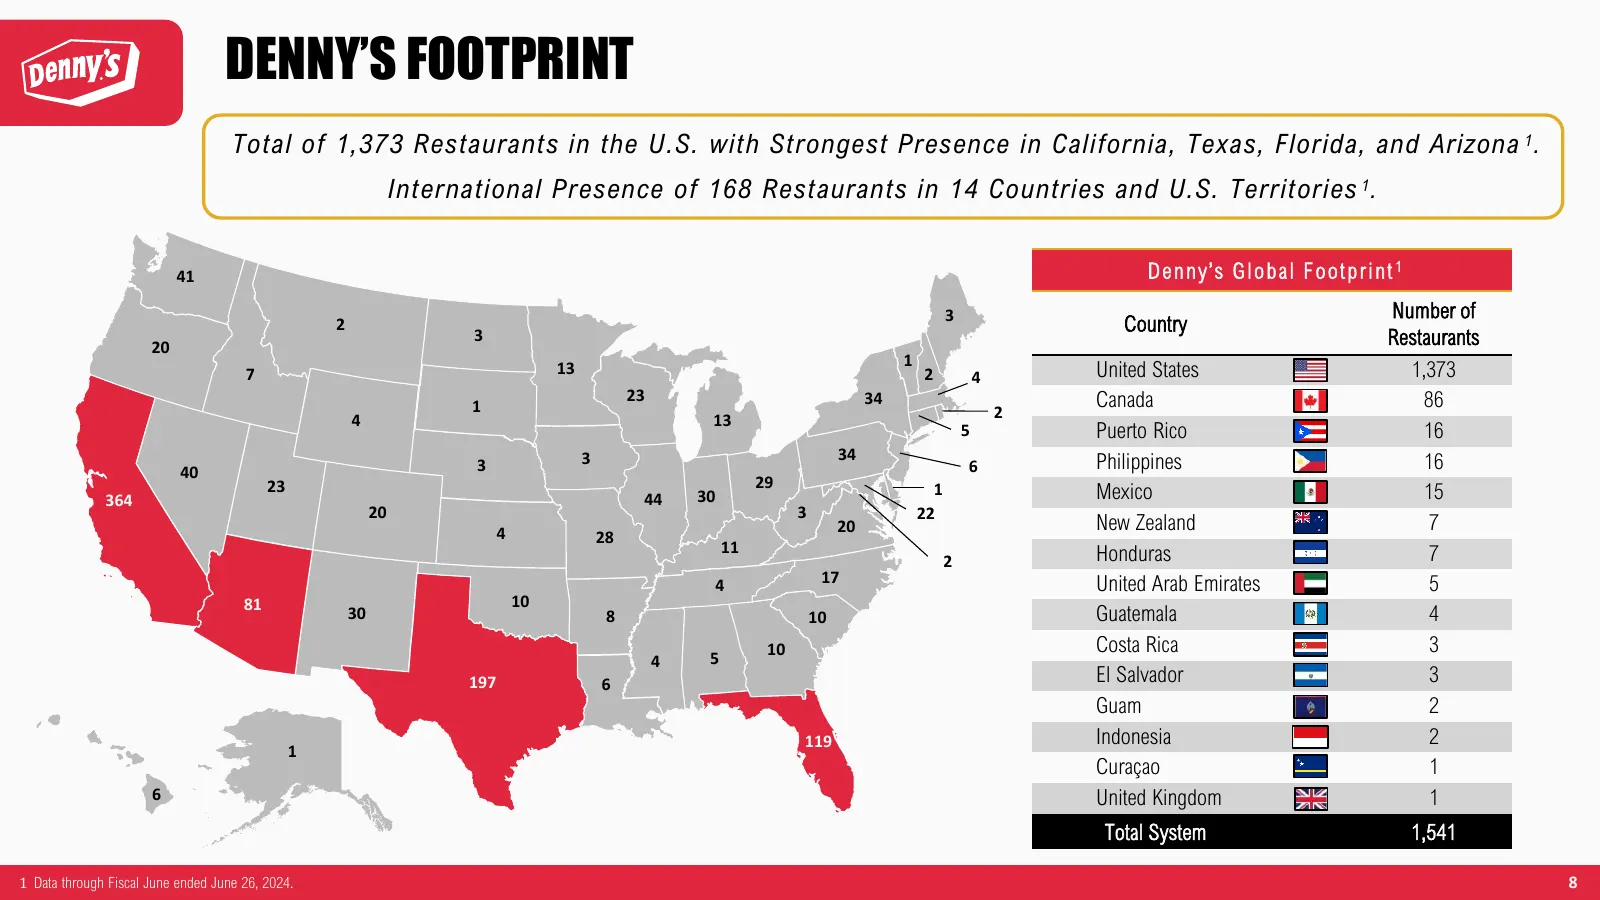
DENNY’S FOOTPRINT Total of 1,373 Restaurants in the U.S. with Strongest Presence in California, Texas, Florida, and Arizona 1 . International Presence of 168 Restaurants in 14 Countries and U.S. Territories 1 . 41 Denny’s Global Footprint 1 3 Number of 2 Country 20 3 Restaurants 1 7 13 2 4 United St
Slide 9: Denny's Strong Partnership with Franchisees
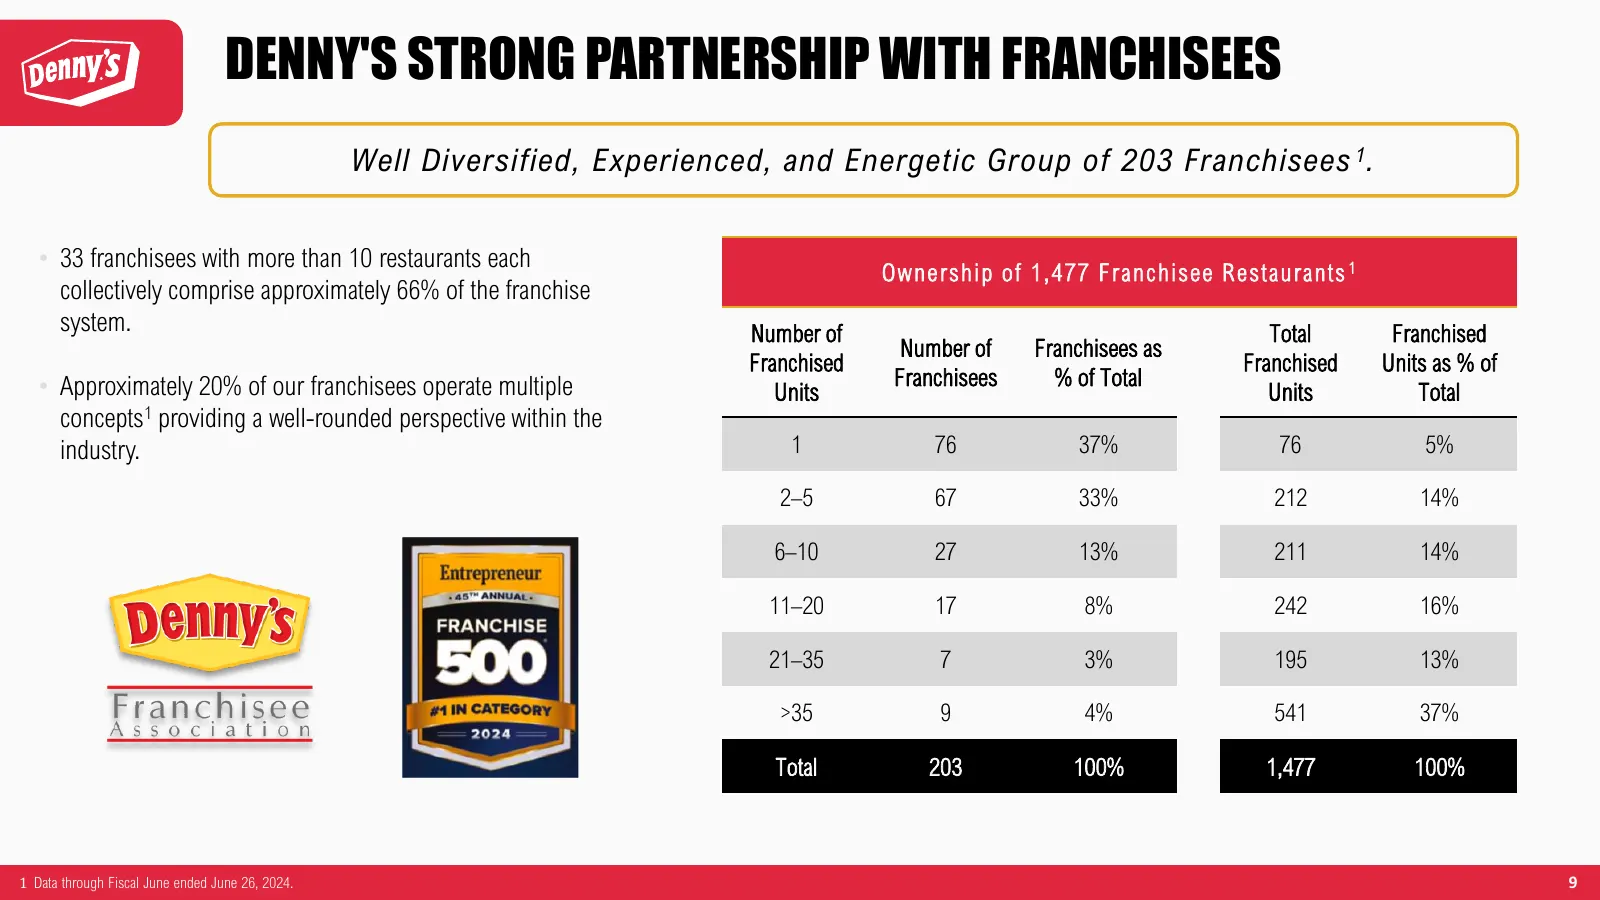
DENNY'S STRONG PARTNERSHIP WITH FRANCHISEES Well Diversified, Experienced, and Energetic Group of 203 Franchisees 1 . • 33 franchisees with more than 10 restaurants each Ownership of 1,477 Franchisee Re s taurants 1 collectively comprise approximately 66% of the franchise system. Number of Total Fra

Slide 10: Keke's
KEKE’S
Slide 11: Keke's Highlights
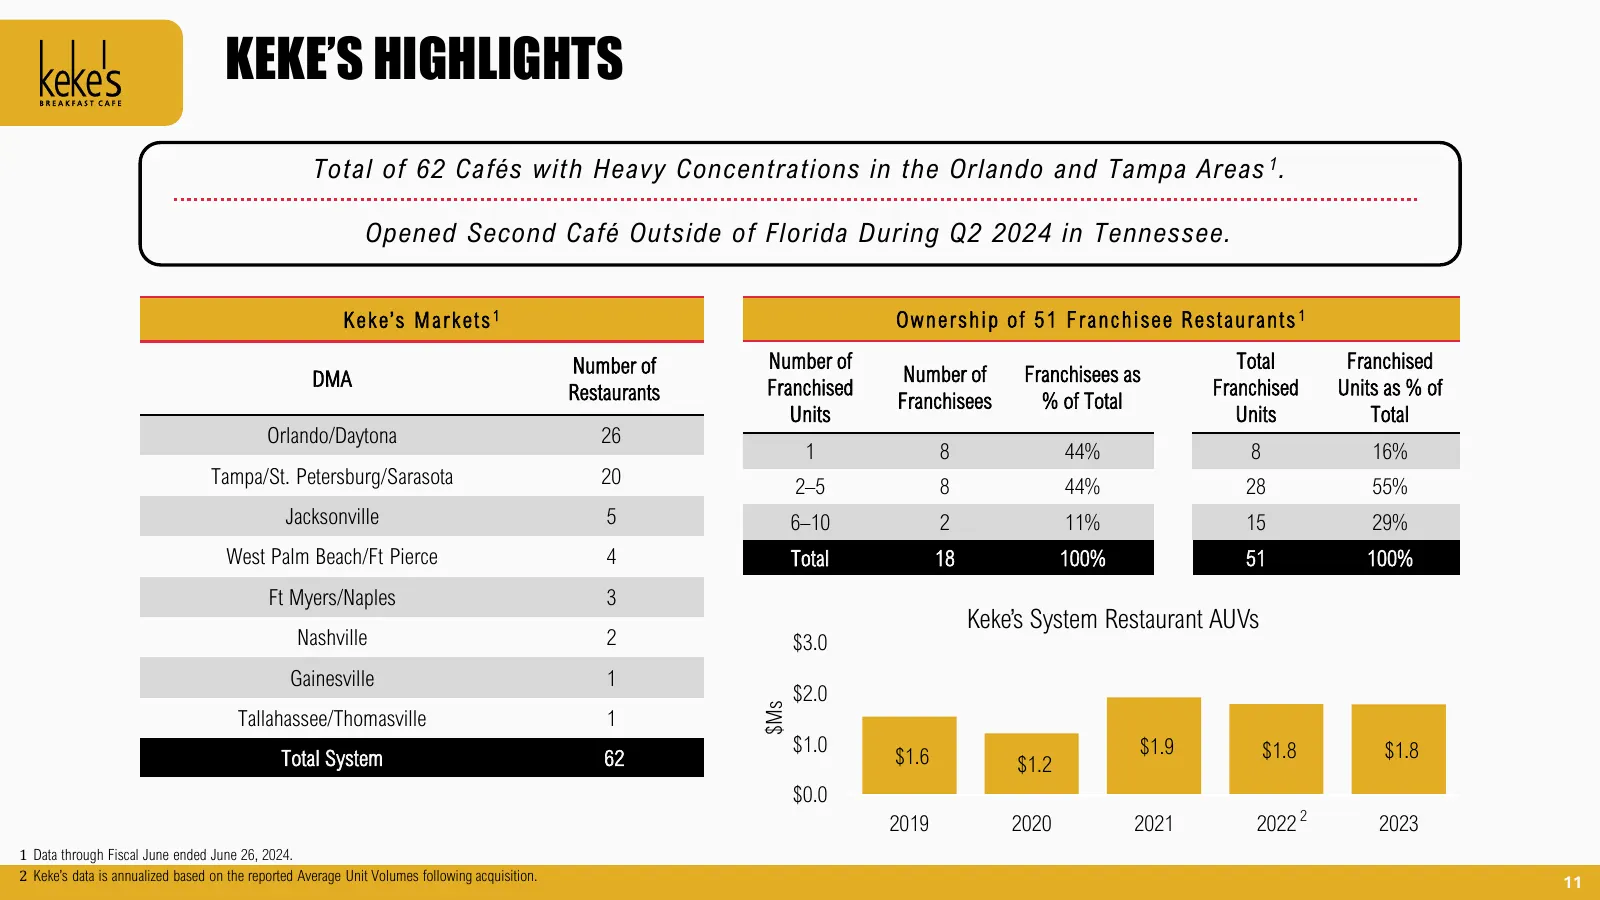
KEKE’S HIGHLIGHTS Total of 62 Cafés with Heavy Concentrations in the Orlando and Tampa Areas 1 . Opened Second Café Outside of Florida During Q2 2024 in Tennessee. Keke’s Markets1 O w n e r s h ip o f 5 1 F r a n c h i se e R e s t a u r a n t s 1 Number of Number of Total Franchised DMA Number of F
Slide 12: Growth Momentum
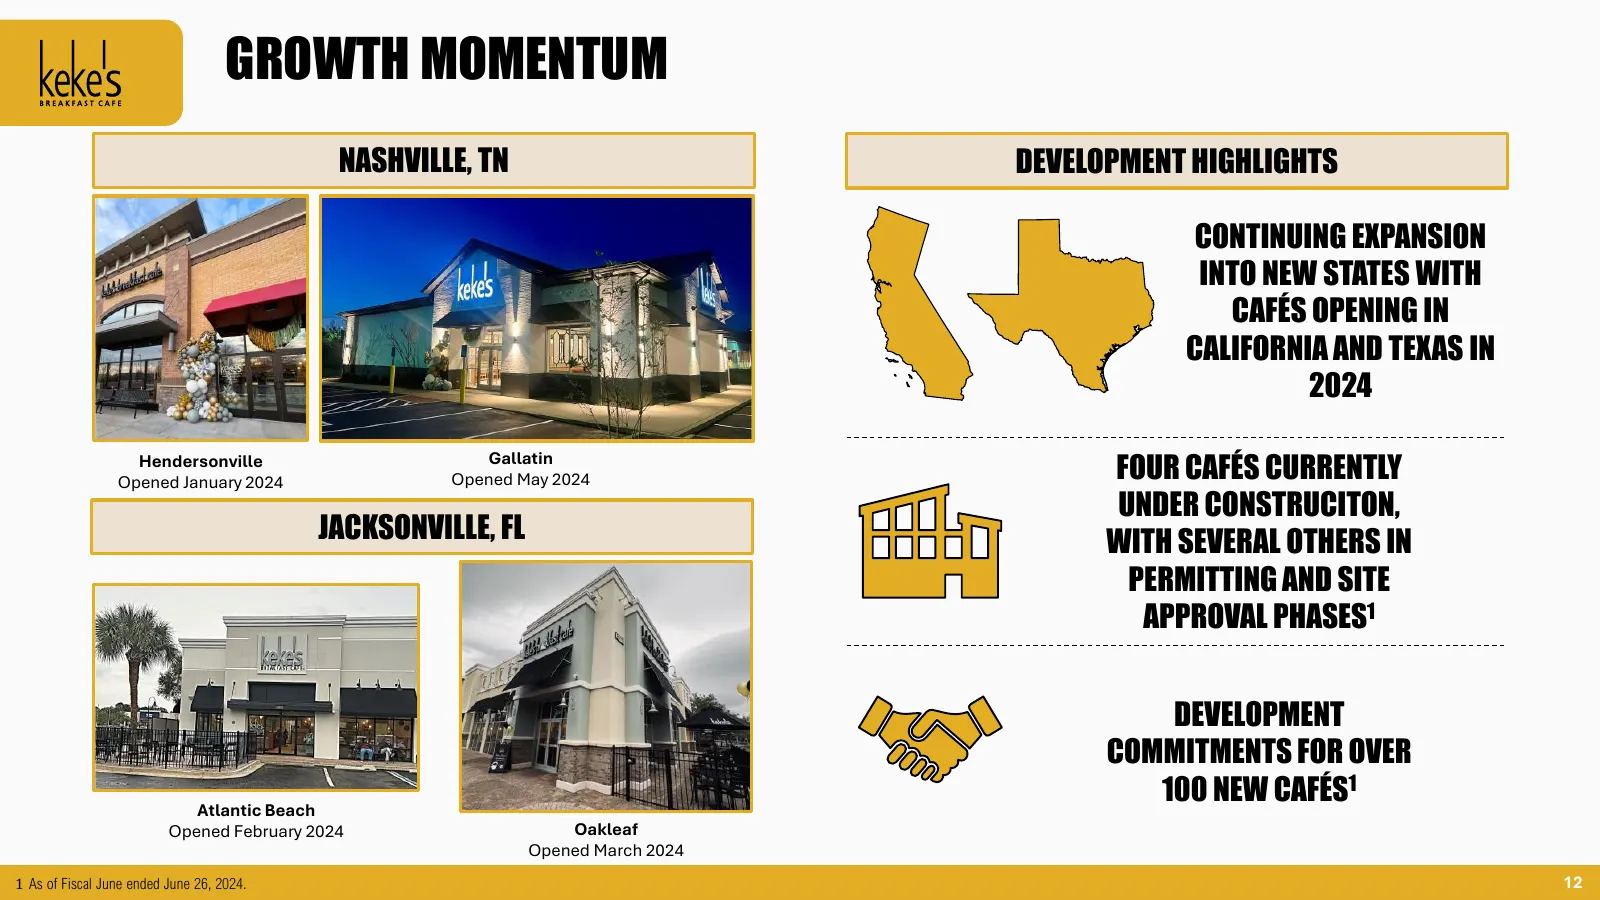
GROWTH MOMENTUM NASHVILLE, TN DEVELOPMENT HIGHLIGHTS CONTINUING EXPANSION INTO NEW STATES WITH CAFÉS OPENING IN CALIFORNIA AND TEXAS IN 2024 Hendersonville Opened January 2024 Gallatin Opened May 2024 FOUR CAFÉS CURRENTLY UNDER CONSTRUCITON, JACKSONVILLE, FL WITH SEVERAL OTHERS IN PERMITTING AND SIT
Slide 13: New Keke's Design
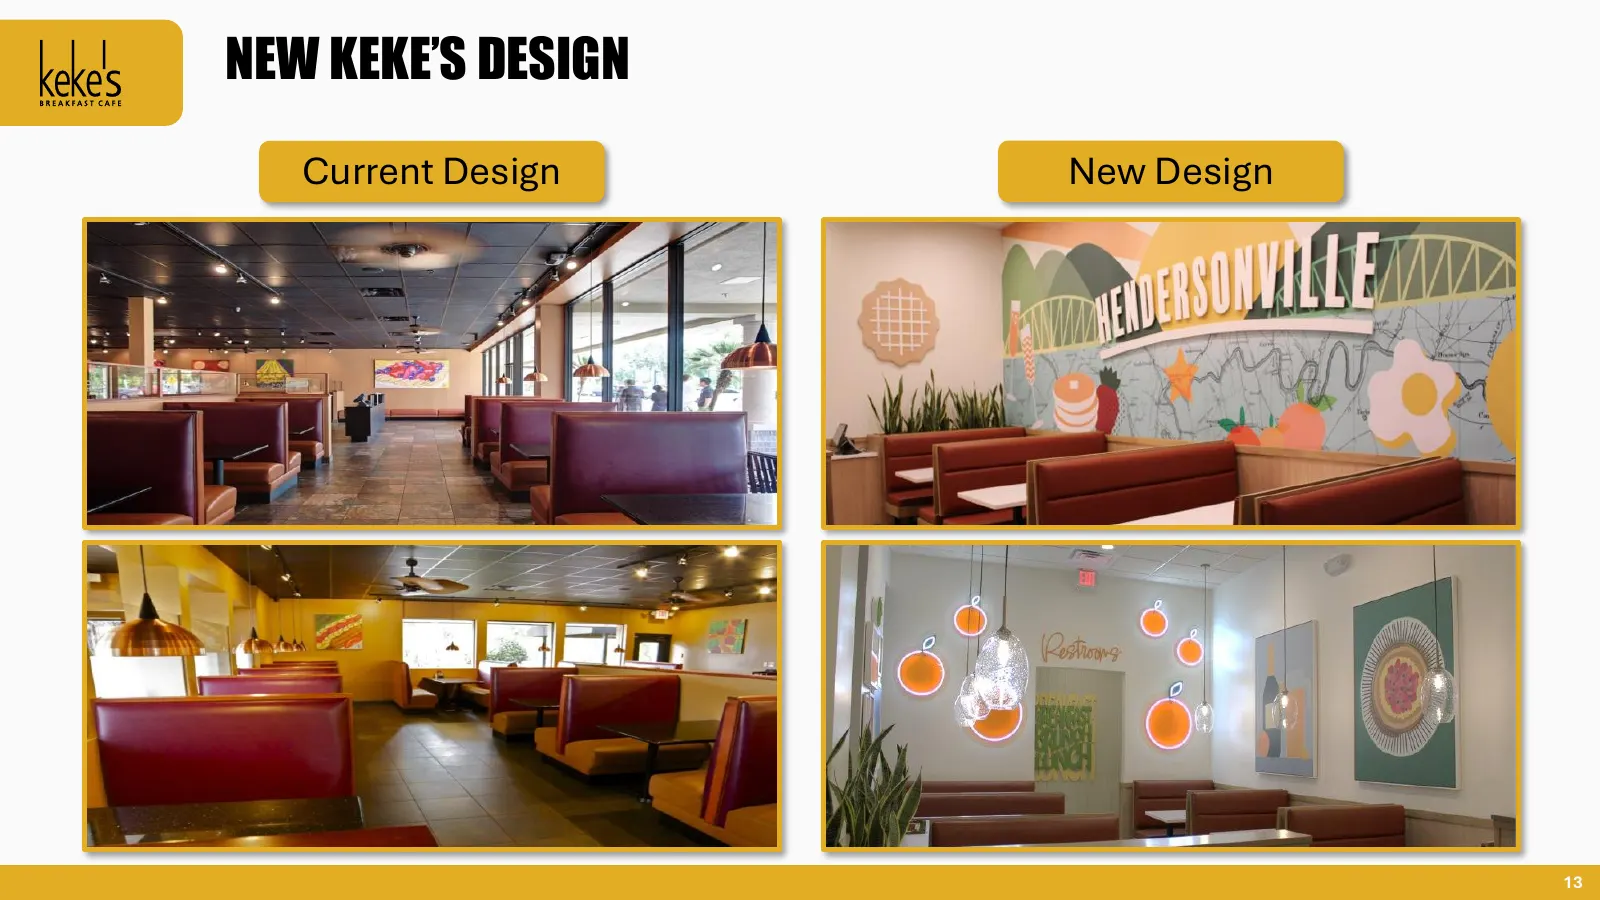
NEW KEKE’S DESIGN Current Design New Design 13

Slide 14: Denny's Corporation
DENNY’S CORPORATION
Slide 15: Solid Balance Sheet with Flexibility
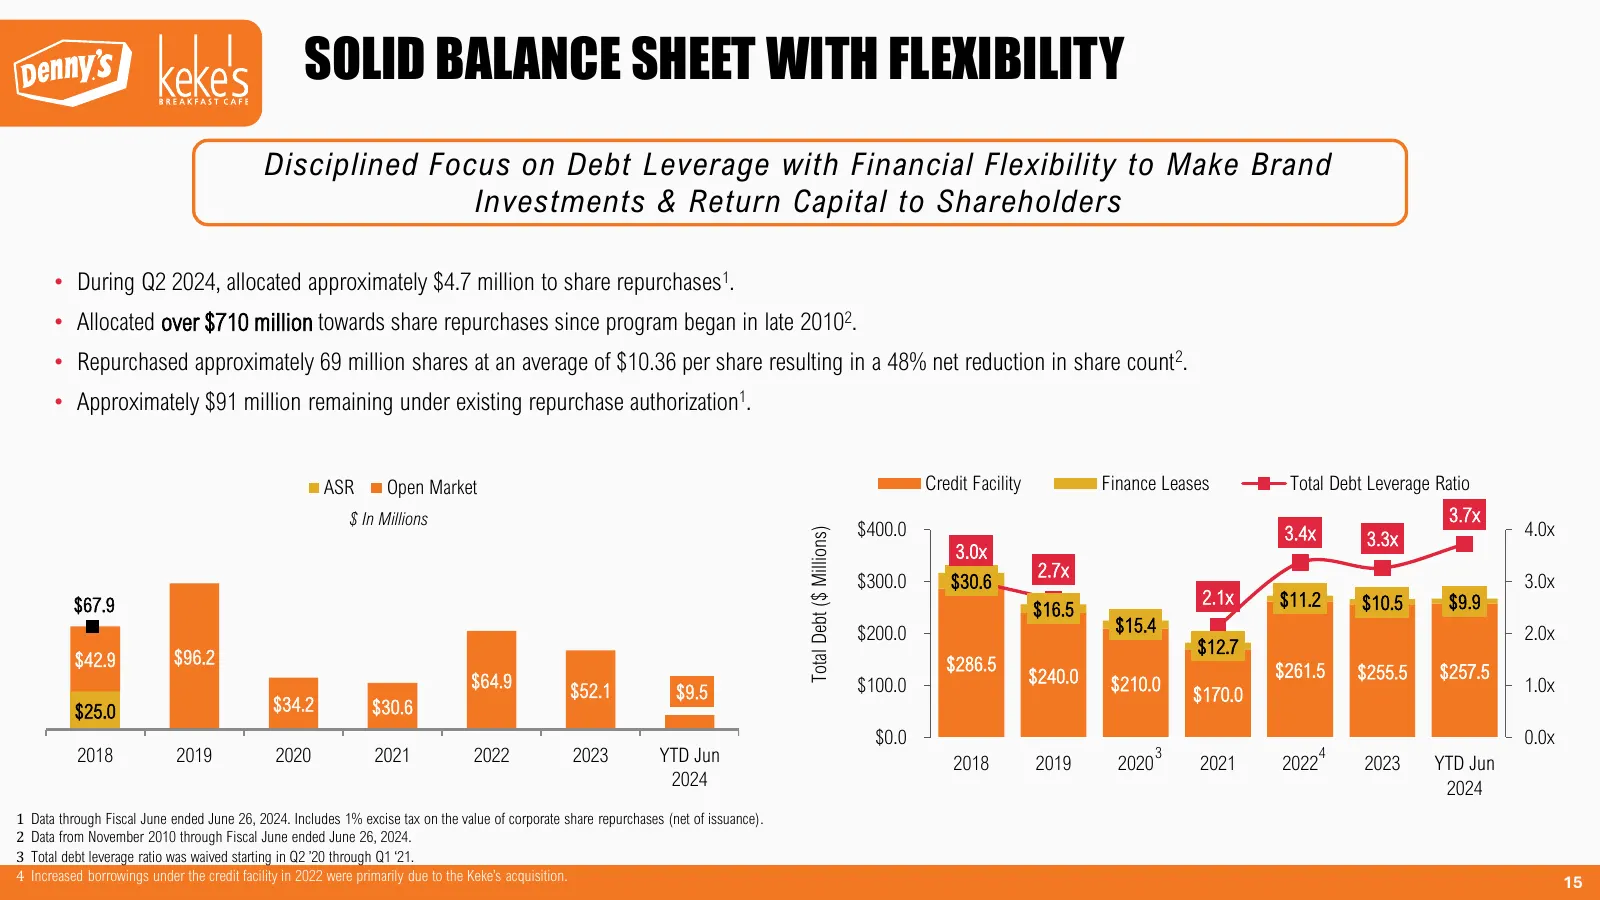
SOLID BALANCE SHEET WITH FLEXIBILITY Disciplined Focus on Debt Leverage with Financial Flexibility to Make Brand Investments & Return Capital to Shareholders • During Q2 2024, allocated approximately $4.7 million to share repurchases1. • Allocated over $710 million towards share repurchases since pr
Slide 16: Our CRAVE Strategies
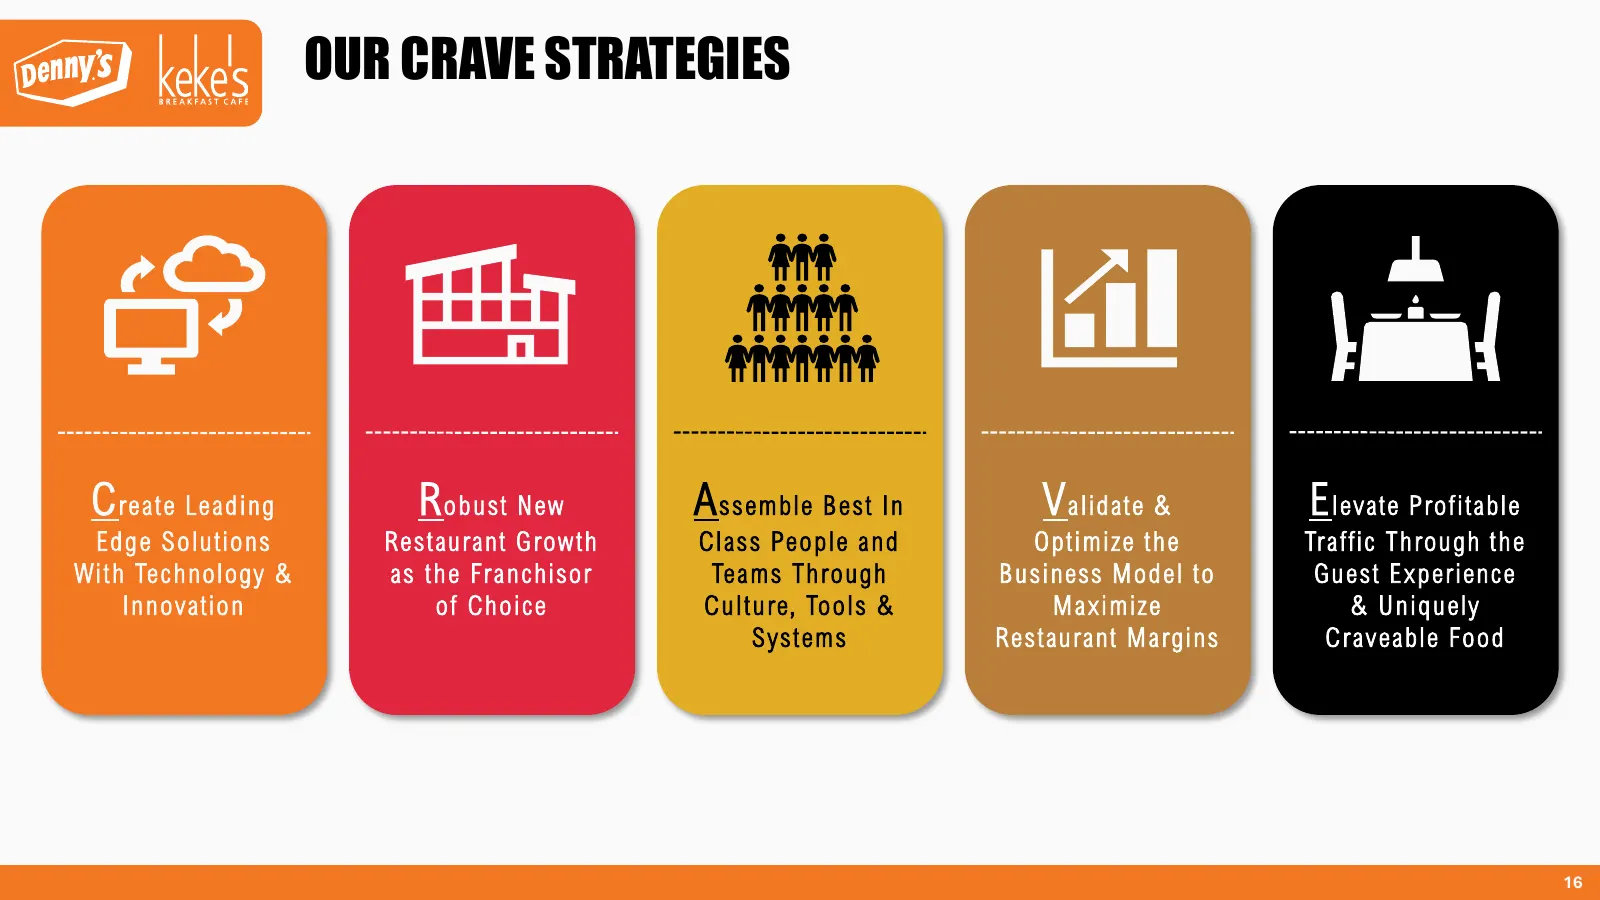
OUR CRAVE STRATEGIES C rea t e Lea d ing R o b ust New A s s emble B es t In V a lidat e & E levate Pro f itable Edg e Solutions Res t aurant G ro w t h Clas s Peo p le a nd Op t imize t he Tra ffic Through t he Wit h Tec hnology & as t he Fra nchisor Tea ms Thro ugh B us iness M o d el t o Gu es t

Slide 17: Appendix
APPENDIX
Slide 18: Denny's Franchised and Company Restaurant Sales
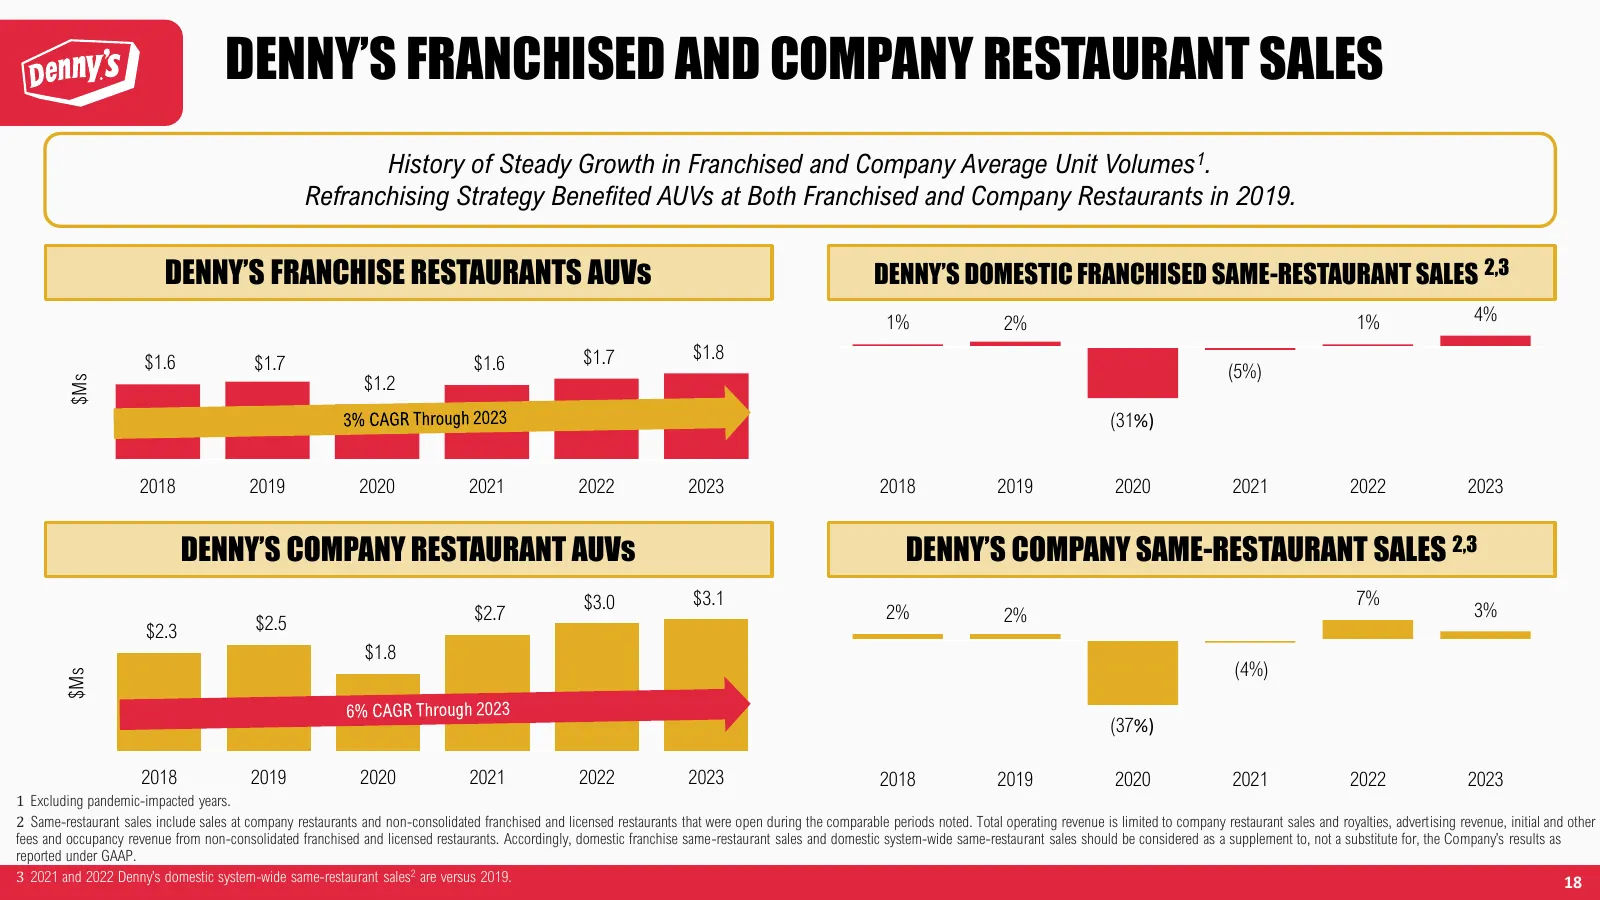
DENNY’S FRANCHISED AND COMPANY RESTAURANT SALES History of Steady Growth in Franchised and Company Average Unit Volumes1. Refranchising Strategy Benefited AUVs at Both Franchised and Company Restaurants in 2019. DENNY’S FRANCHISE RESTAURANTS AUVs DENNY’S DOMESTIC FRANCHISED SAME-RESTAURANT SALES 2,3
Slide 19: Non-GAAP Financial Measures
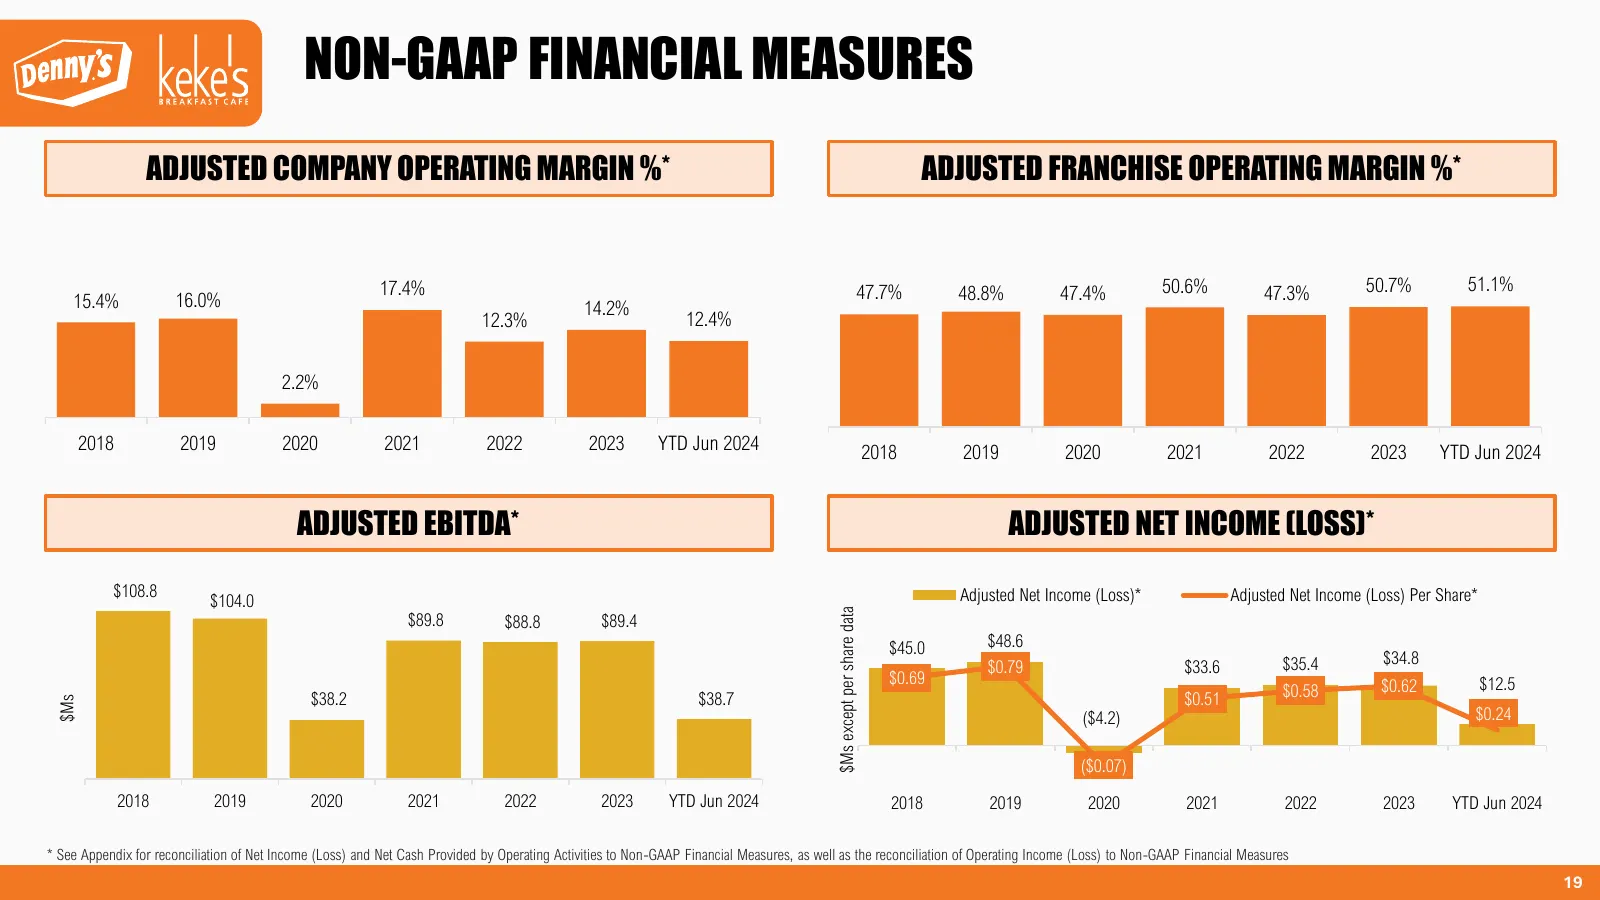
NON-GAAP FINANCIAL MEASURES ADJUSTED COMPANY OPERATING MARGIN %* ADJUSTED FRANCHISE OPERATING MARGIN %* 17.4% 47.7% 48.8% 47.4% 50.6% 47.3% 50.7% 51.1% 15.4% 16.0% 14.2% 12.3% 12.4% 2.2% 2018 2019 2020 2021 2022 2023 YTD Jun 2024 2018 2019 2020 2021 2022 2023 YTD Jun 2024 ADJUSTED EBITDA* ADJUSTED N
Slide 20: Experienced and Committed Leadership Team
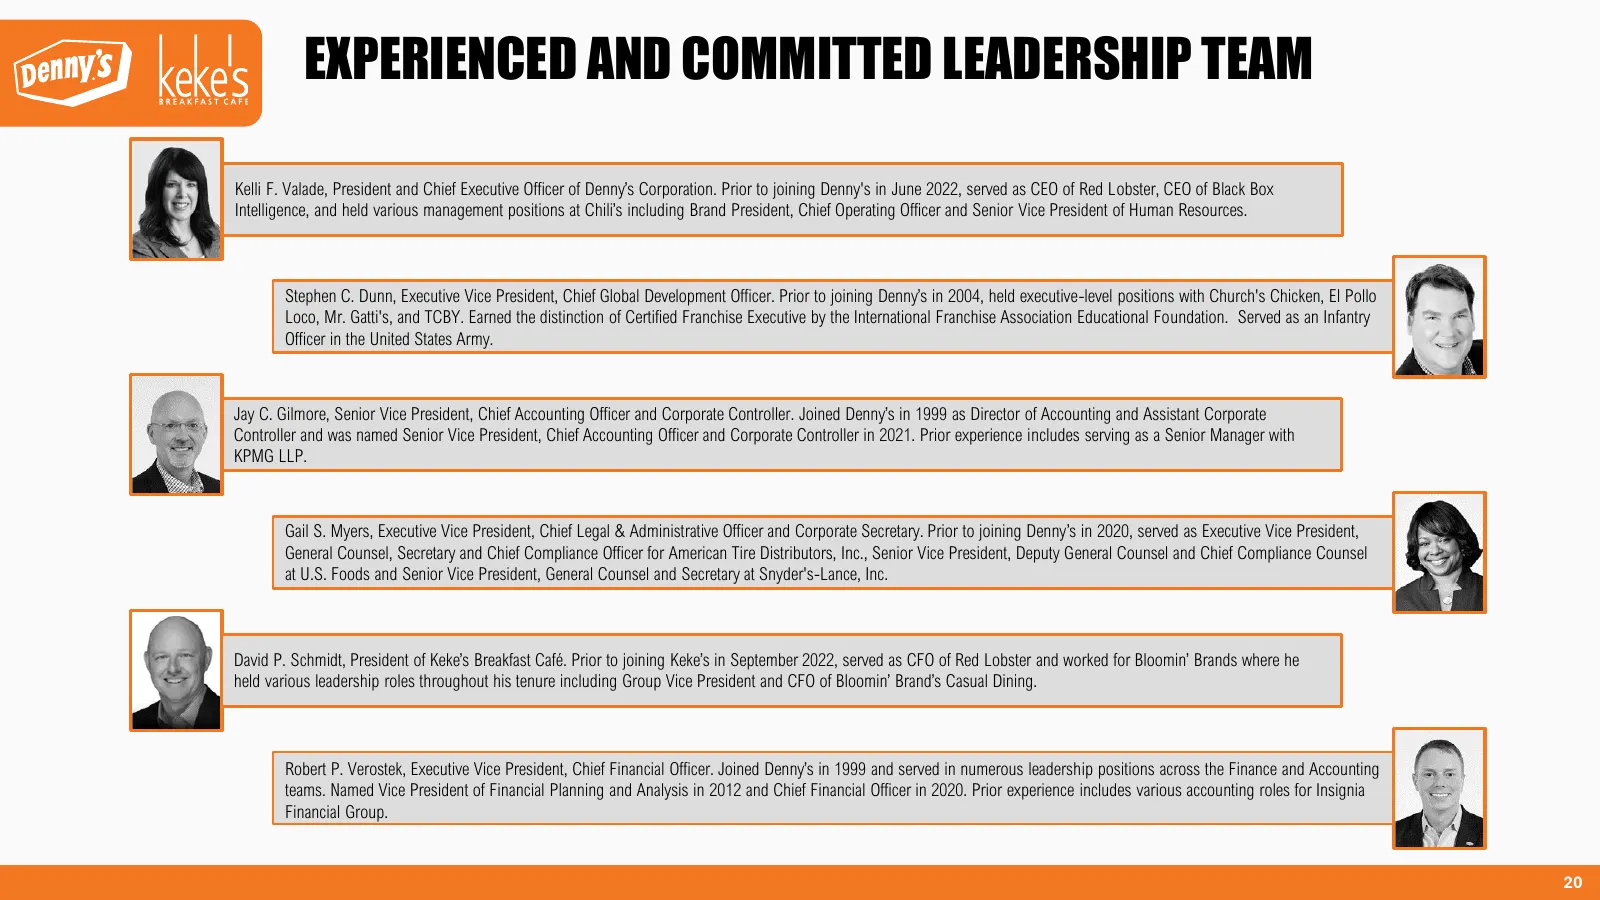
EXPERIENCED AND COMMITTED LEADERSHIP TEAM Kelli F. Valade, President and Chief Executive Officer of Denny’s Corporation. Prior to joining Denny's in June 2022, served as CEO of Red Lobster, CEO of Black Box Intelligence, and held various management positions at Chili’s including Brand President, Chi
Slide 21: Reconciliation of Net Income (Loss) to Non-GAAP Financial Measures
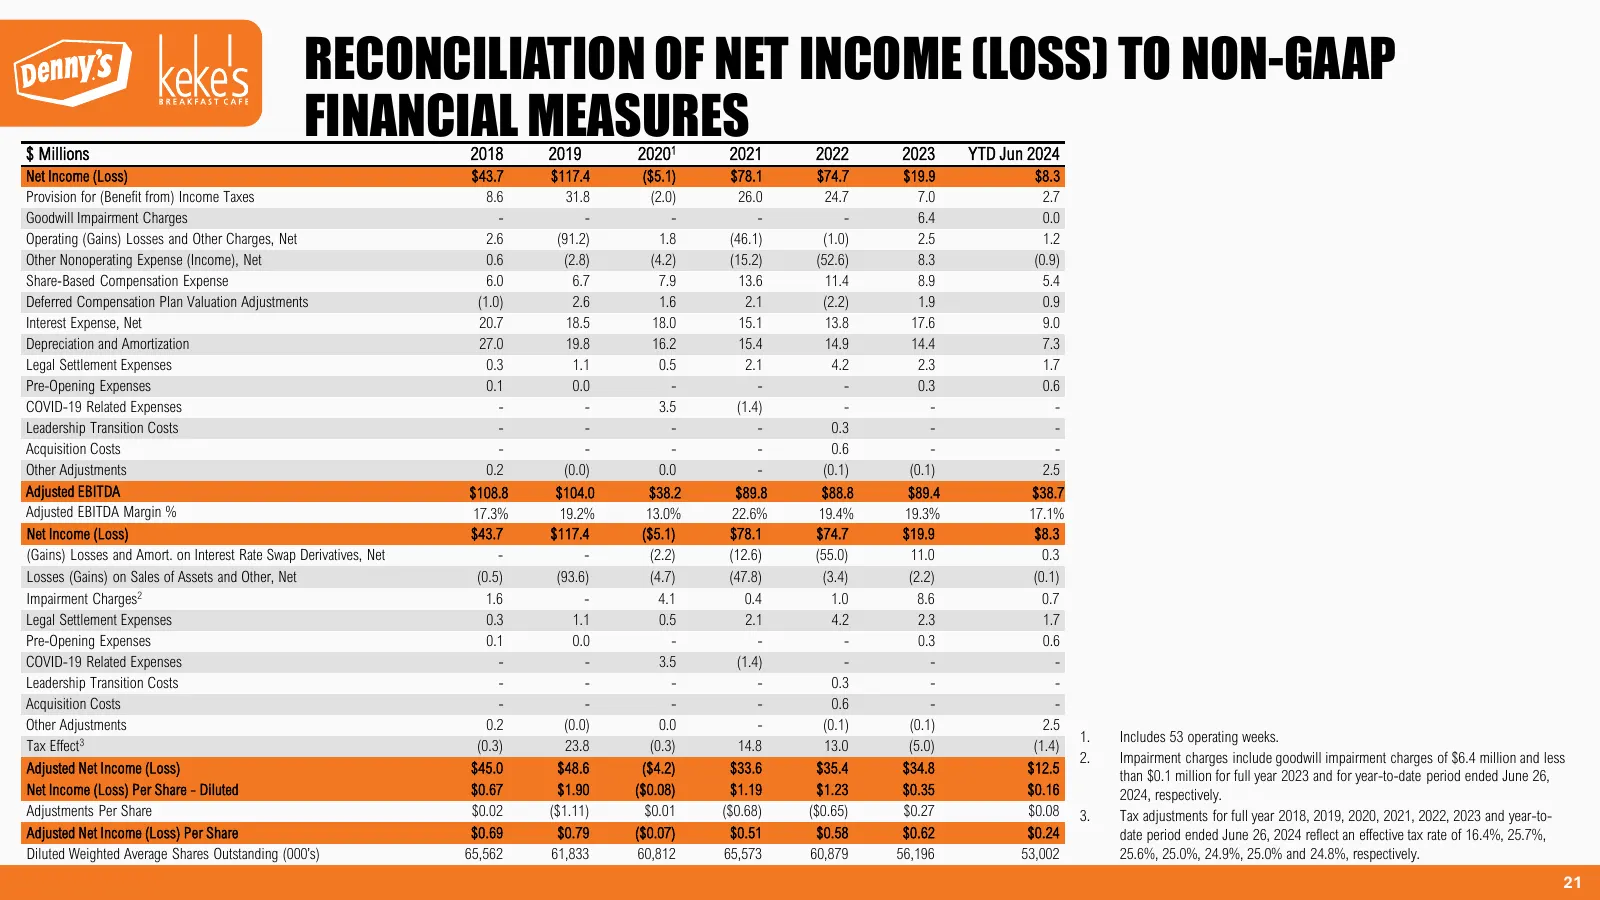
RECONCILIATION OF NET INCOME (LOSS) TO NON-GAAP $ Millions FINANCIAL MEASURES 2018 2019 20201 2021 2022 2023 YTD Jun 2024 Net Income (Loss) $43.7 $117.4 ($5.1) $78.1 $74.7 $19.9 $8.3 Provision for (Benefit from) Income Taxes 8.6 31.8 (2.0) 26.0 24.7 7.0 2.7 Goodwill Impairment Charges - - - - - 6.4
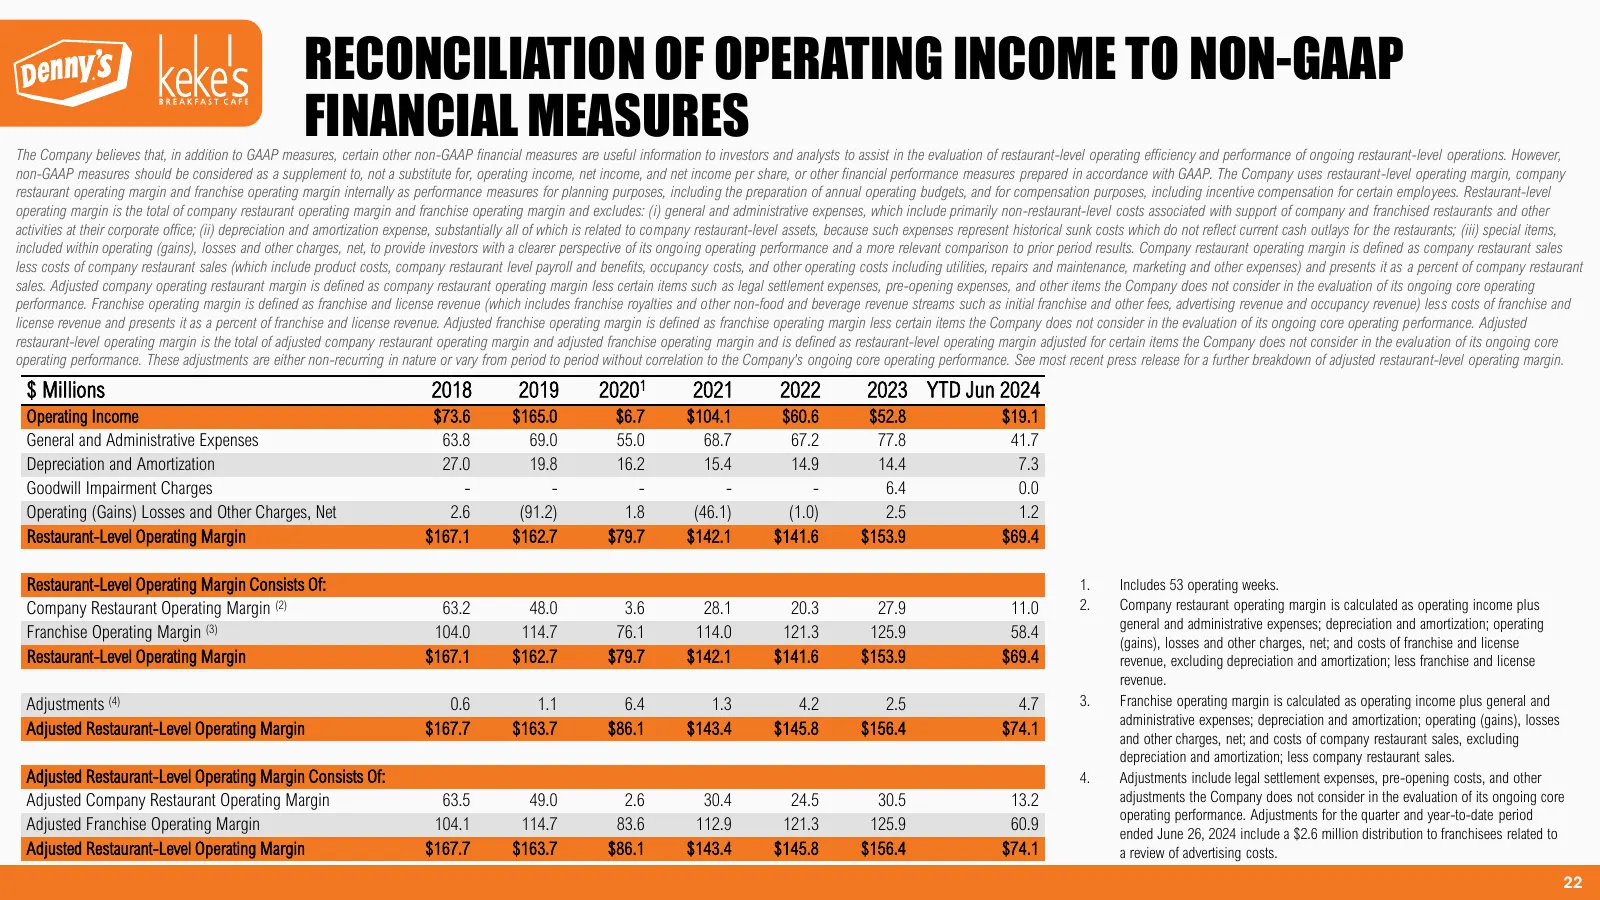
Slide 22: Reconciliation of Operating Income to Non-GAAP Financial Measures
RECONCILIATION OF OPERATING INCOME TO NON-GAAP FINANCIAL MEASURES The Company believes that, in addition to GAAP measures, certain other non-GAAP financial measures are useful information to investors and analysts to assist in the evaluation of restaurant-level operating efficiency and performance o
Source: EarningsCall slides
More decks from Dennys Corp
 Investor Presentation (August 2025)30 slides · Aug 4, 2025
 Investor Presentation (May 2025)32 slides · May 2025
 Investor Presentation (February 2025)32 slides · February 2025
 Investor Presentation (January 2025)32 slides · Jan 13, 2025
 Investor Day (October 2024)137 slides · Oct 22, 2024
 Q1 2024 Earnings Presentation21 slides · April 2024