Dennys — Investor Presentation (May 2025)
32 slides from Dennys's investor presentation, May 2025
Slide 1: Denny's Corporation Investor Presentation
DENNY’S CORPORATION INVESTOR PRESENTATION MAY THROUGH JULY 2025
Slide 2: Forward-Looking Statements and Non-GAAP Financial Measures
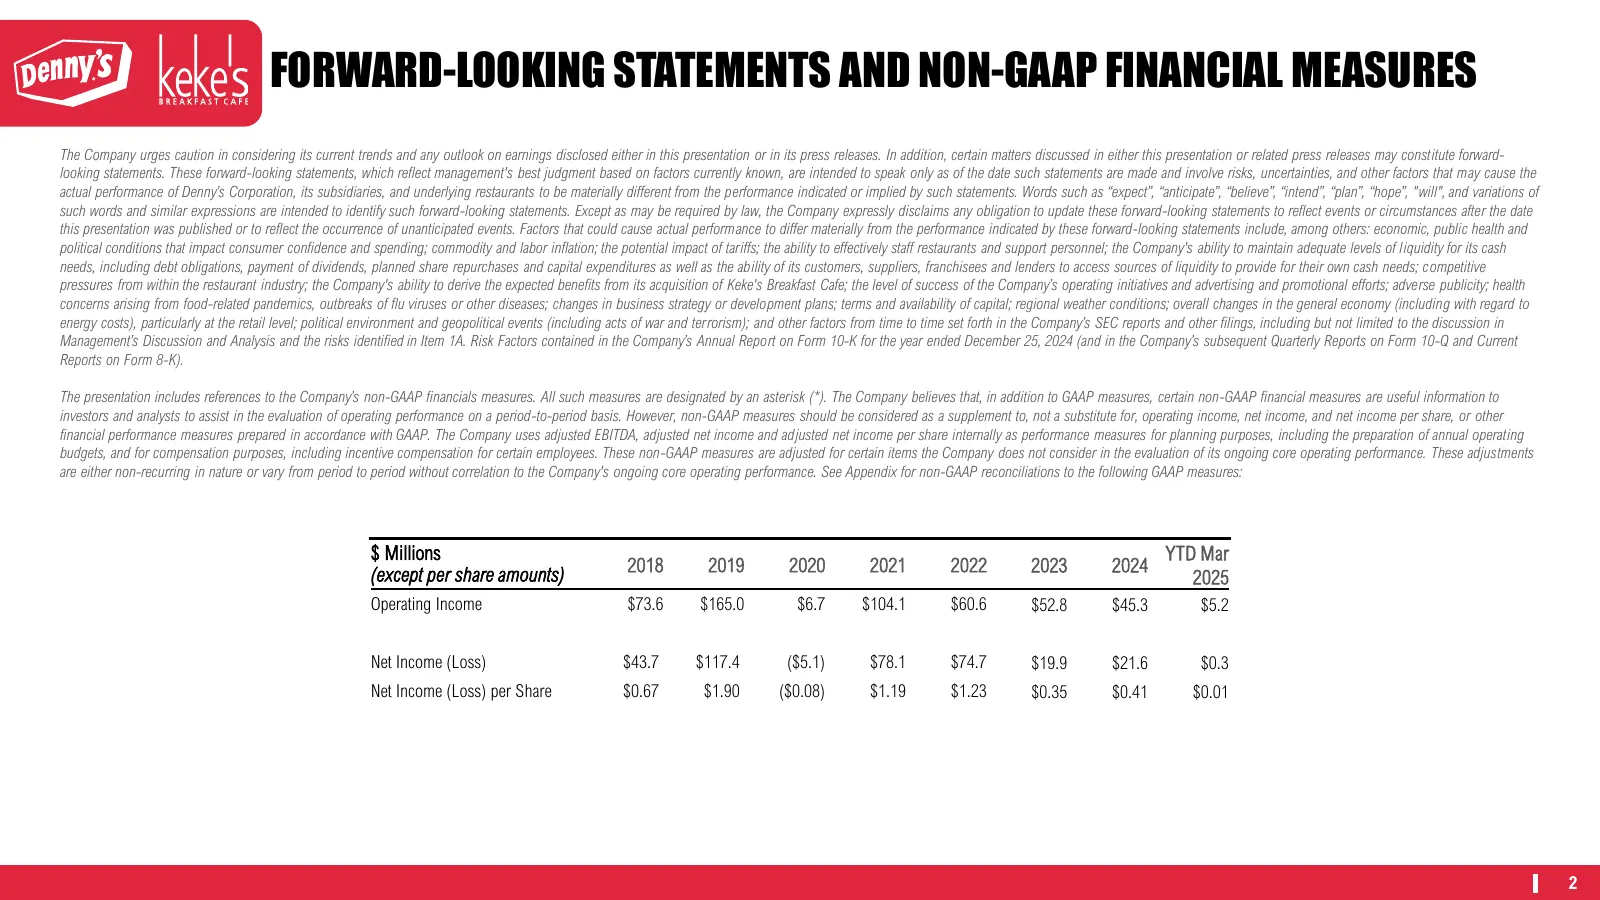
FORWARD-LOOKING STATEMENTS AND NON-GAAP FINANCIAL MEASURES The Company urges caution in considering its current trends and any outlook on earnings disclosed either in this presentation or in its press releases. In addition, certain matters discussed in either this presentation or related press relea
Slide 3: Denny's Corporation at a Glance
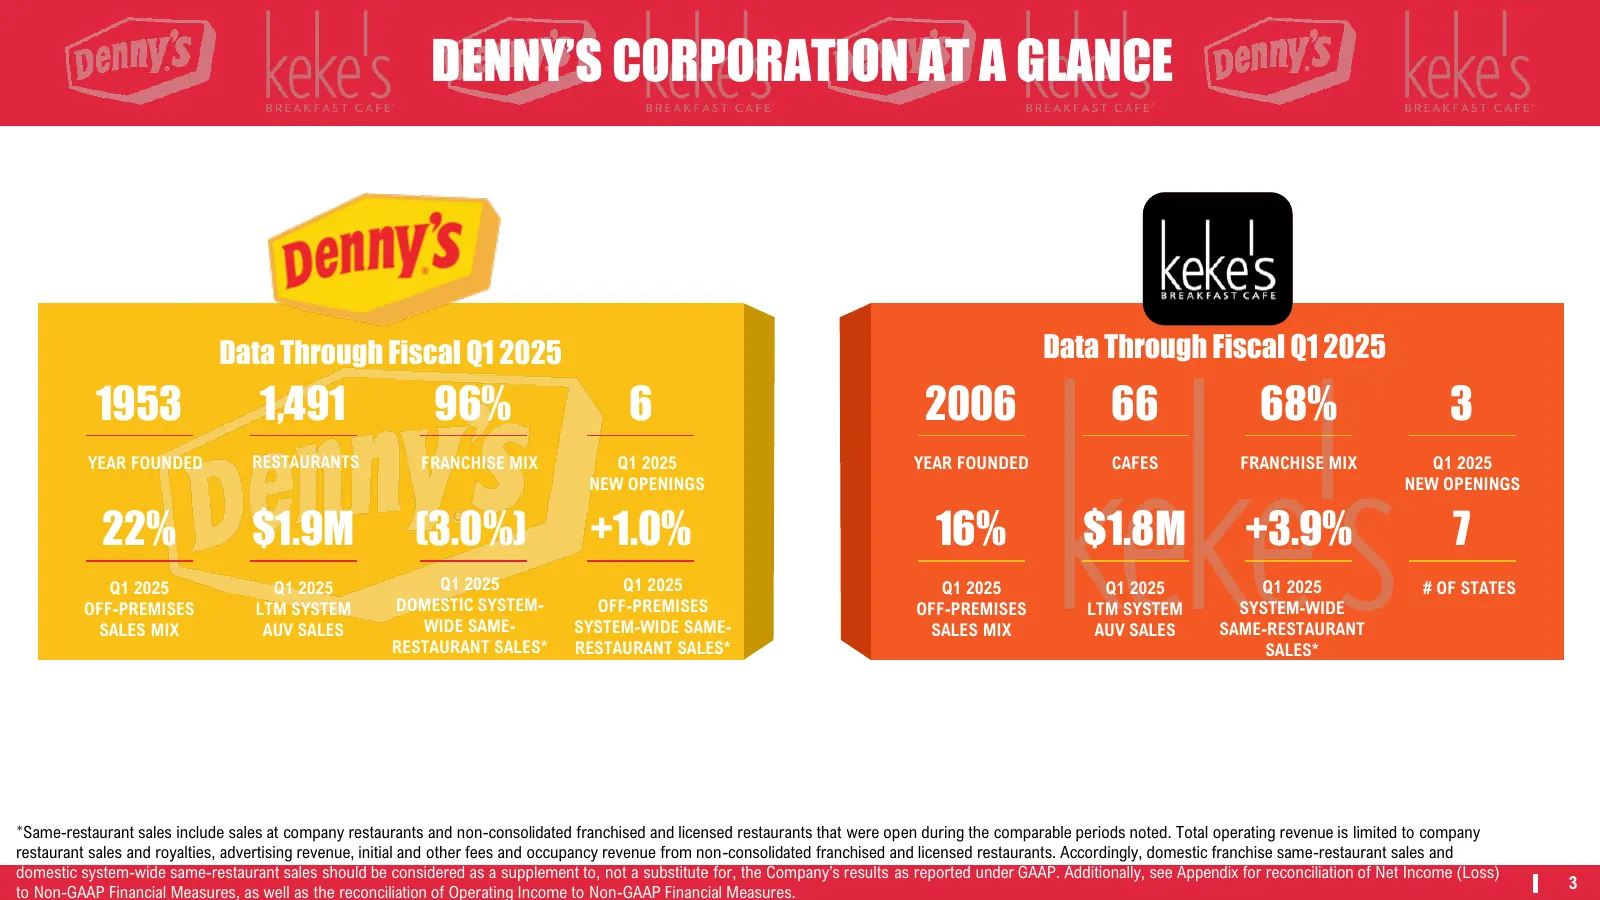
DENNY’S CORPORATION AT A GLANCE Data Through Fiscal Q1 2025 Data Through Fiscal Q1 2025 1953 1,491 96% 6 2006 66 68% 3 YEAR FOUNDED RESTAURANTS FRANCHISE MIX Q1 2025 YEAR FOUNDED CAFES FRANCHISE MIX Q1 2025 NEW OPENINGS NEW OPENINGS 22% $1.9M (3.0%) +1.0% 16% $1.8M +3.9% 7 Q1 2025 Q1 2025 Q1 2025 Q1
Slide 4: Q1 2025 Highlights
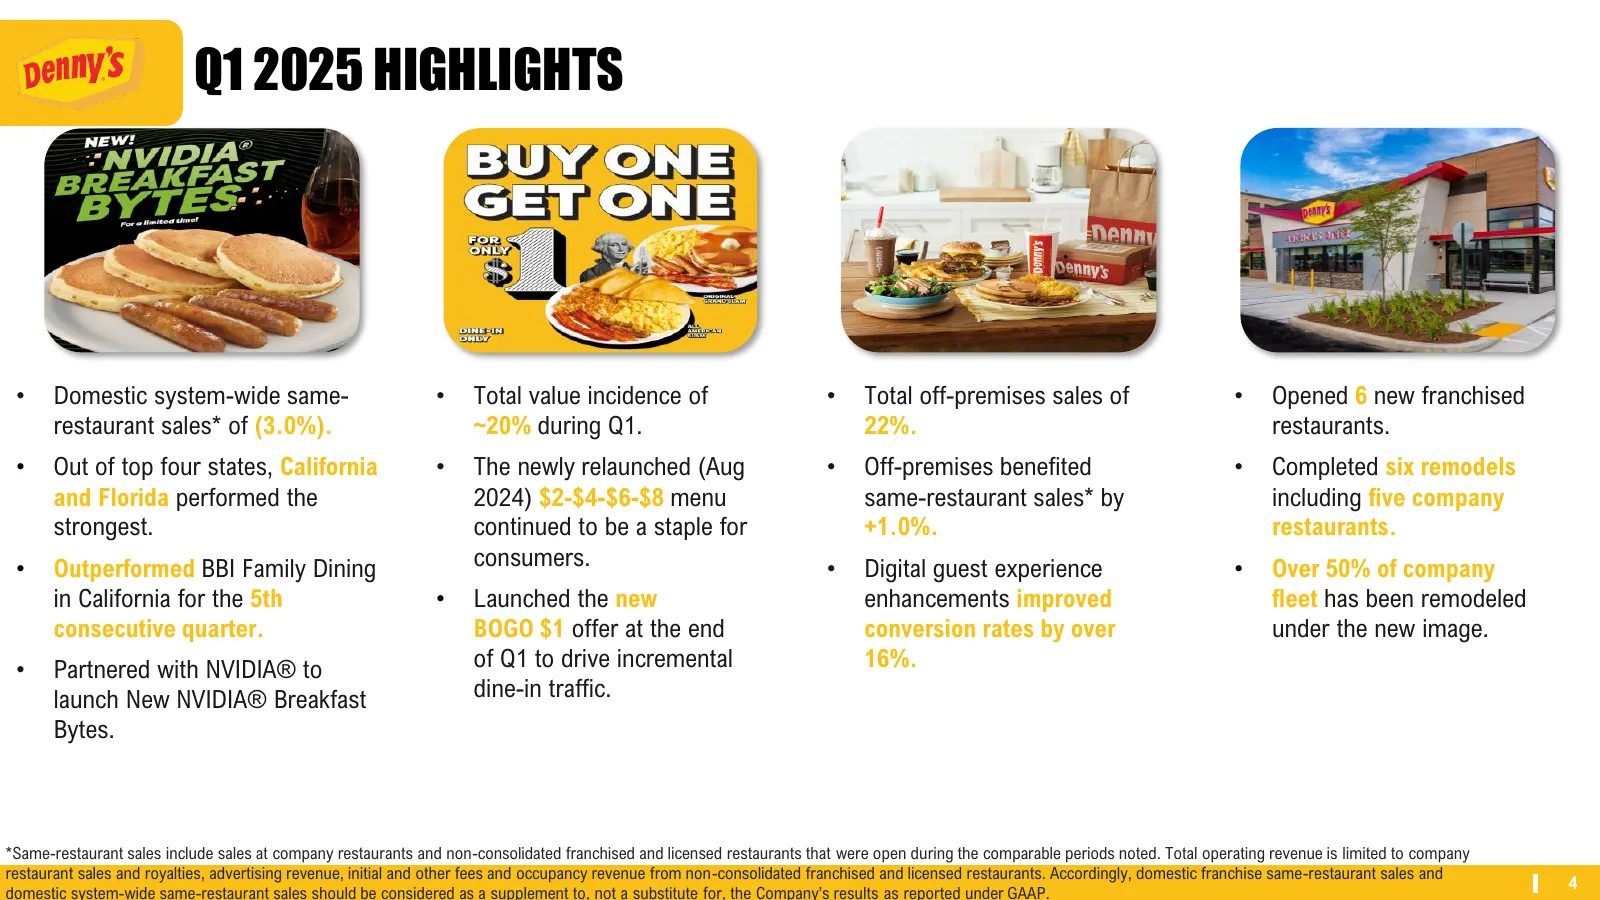
Q1 2025 HIGHLIGHTS • Domestic system-wide same- • Total value incidence of • Total off-premises sales of • Opened 6 new franchised restaurant sales* of (3.0%). ~20% during Q1. 22%. restaurants. • Out of top four states, California • The newly relaunched (Aug • Off-premises benefited • Completed six
Slide 5: Q1 2025 Highlights
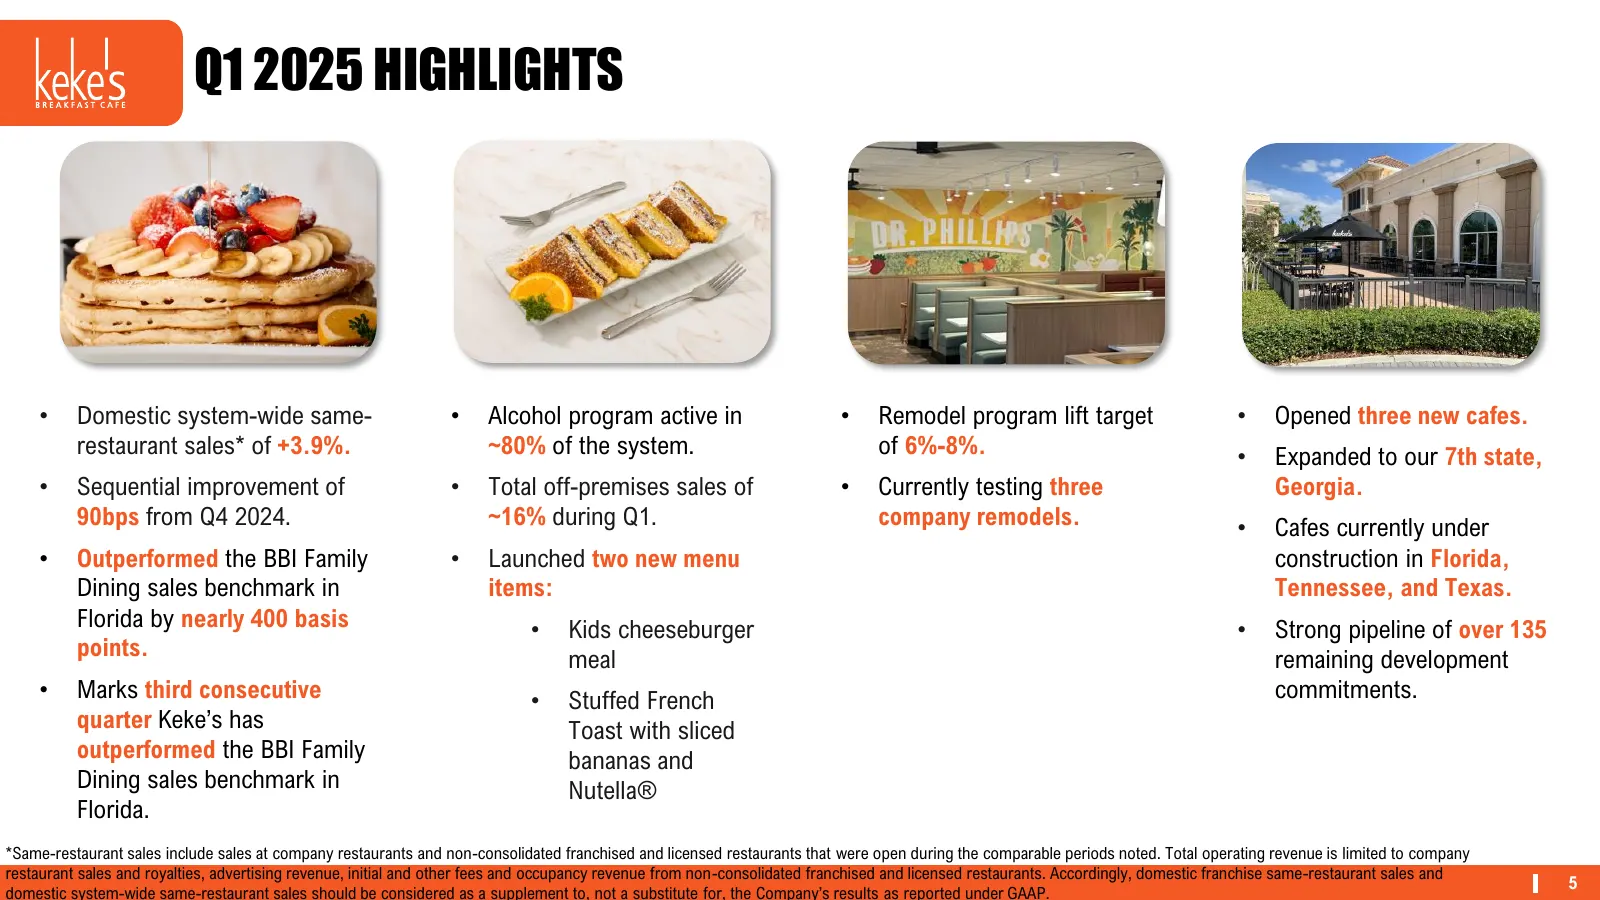
Q1 2025 HIGHLIGHTS • Domestic system-wide same- • Alcohol program active in • Remodel program lift target • Opened three new cafes. restaurant sales* of +3.9%. ~80% of the system. of 6%-8%. • Expanded to our 7th state, • Sequential improvement of • Total off-premises sales of • Currently testing thr

Slide 6: Denny's
DENNY’S We Love to Feed People – Body, Mind and Soul
Slide 7: Denny's Domestic System-Wide Same-Restaurant Sales
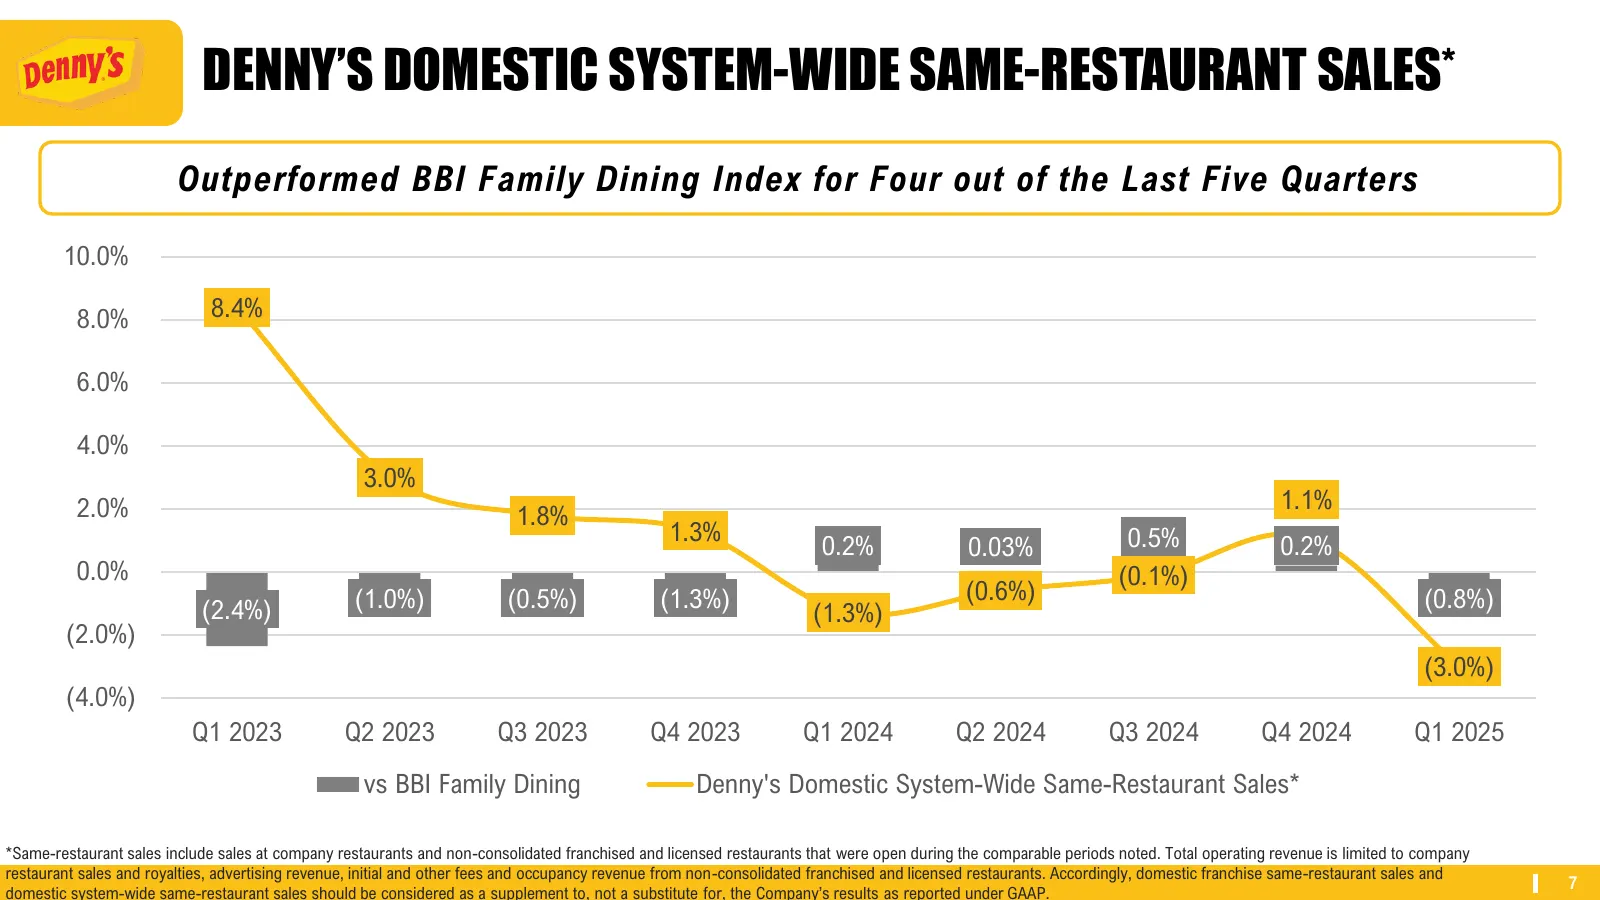
DENNY’S DOMESTIC SYSTEM-WIDE SAME-RESTAURANT SALES* Outperformed BBI Family Dining Index for Four out of the Last Five Quarters 10.0% 8.0% 8.4% 6.0% 4.0% 3.0% 2.0% 1.1% 1.8% 1.3% 0.5% 0.2% 0.03% 0.2% 0.0% (0.1%) (1.0%) (0.5%) (1.3%) (0.6%) (0.8%) (2.4%) (1.3%) (2.0%) (3.0%) (4.0%) Q1 2023 Q2 2023 Q3
Slide 8: Denny's Domestic Sales
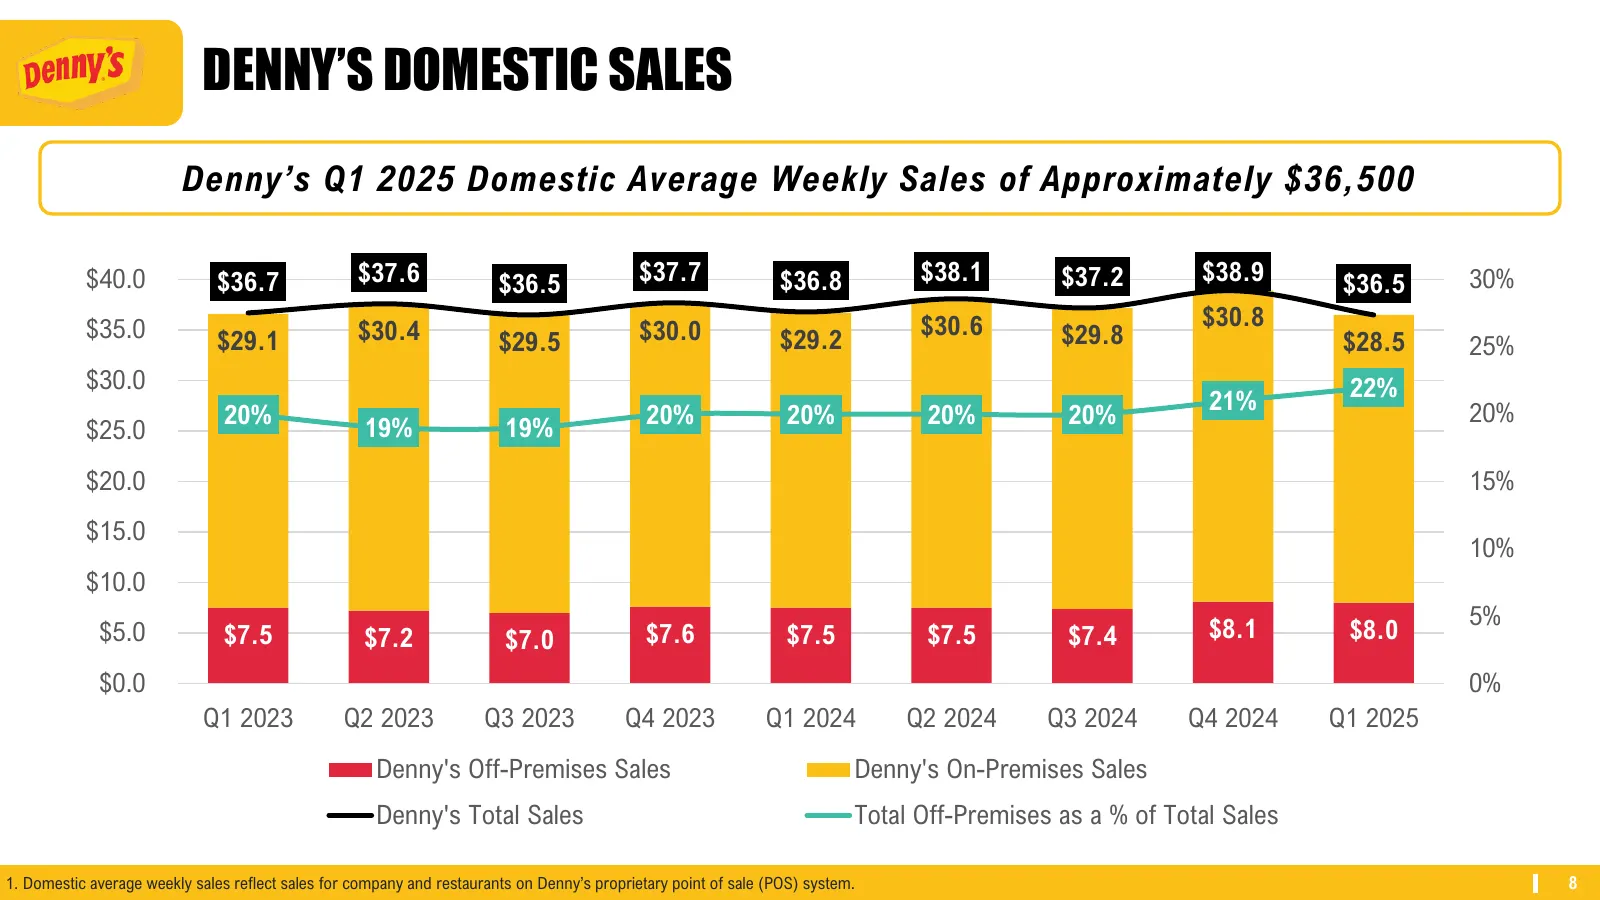
DENNY’S DOMESTIC SALES Denny’s Q1 2025 Domestic Average Weekly Sales of Approximately $36,500 $40.0 $36.7 $37.6 $36.5 $37.7 $36.8 $38.1 $37.2 $38.9 $36.5 30% $35.0 $30.4 $30.0 $30.6 $30.8 $29.1 $29.5 $29.2 $29.8 $28.5 25% $30.0 22% 21% 20% 20% 20% 20% 20% 20% $25.0 19% 19% $20.0 15% $15.0 10% $10.0
Slide 9: Denny's Domestic Sales Mix
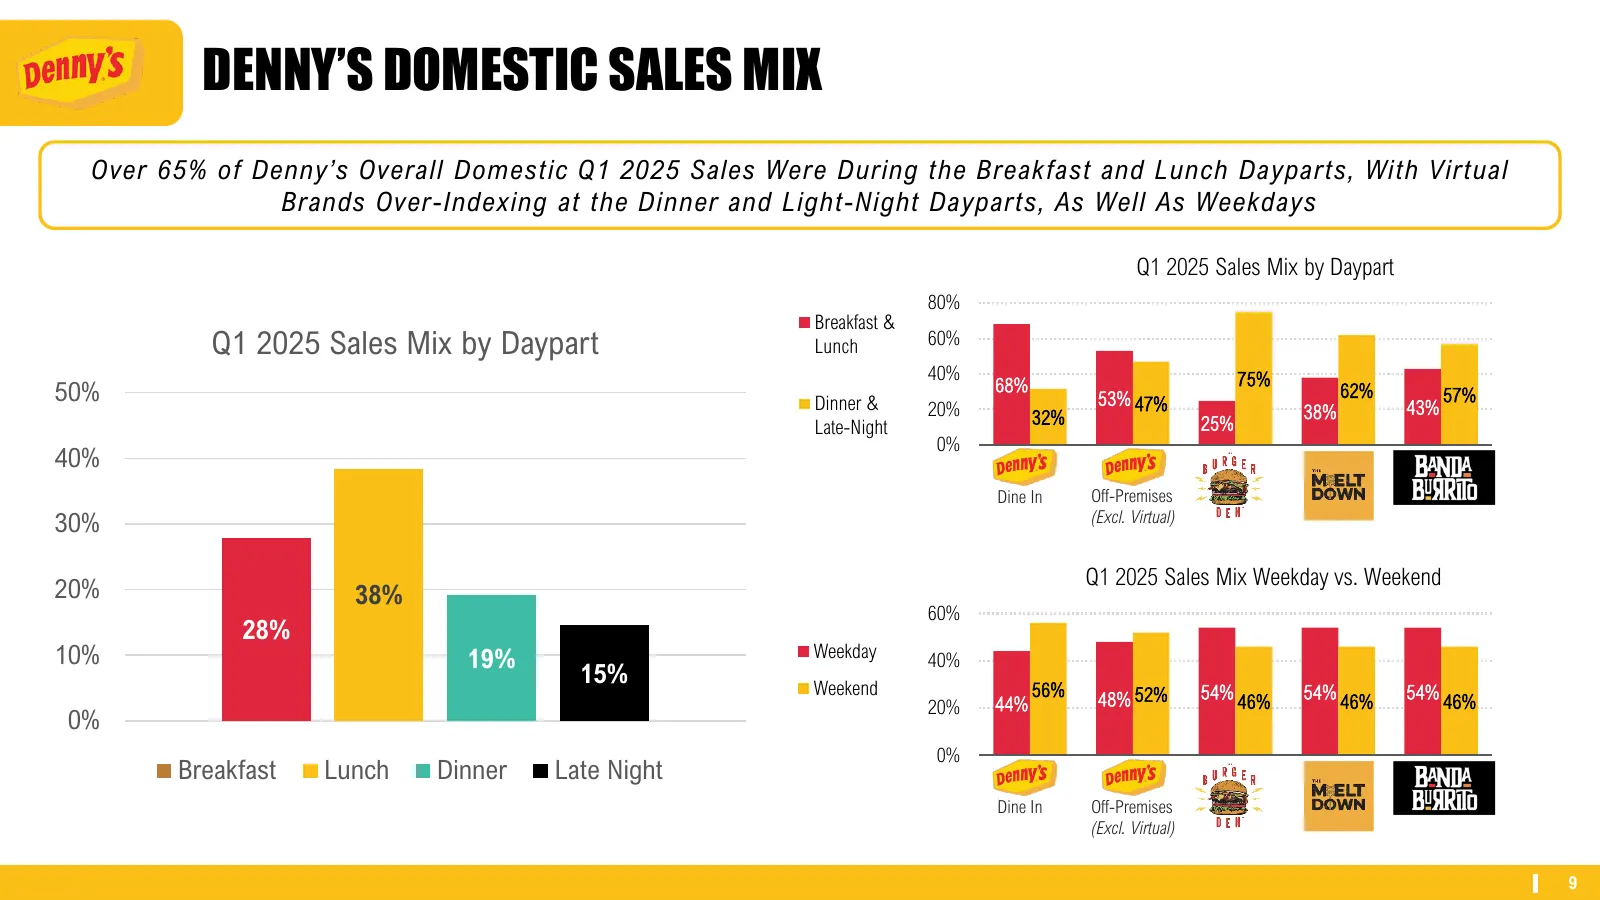
DENNY’S DOMESTIC SALES MIX Over 65% of Denny’s Overall Domestic Q1 2025 Sales Were During the Breakfast and Lunch Dayparts, With Virtual Brands Over-Indexing at the Dinner and Light-Night Dayparts, As Well As Weekdays Q1 2025 Sales Mix by Daypart 80% Breakfast & Q1 2025 Sales Mix by Daypart Lunch 60
Slide 10: Diner 2.0 Remodel Program
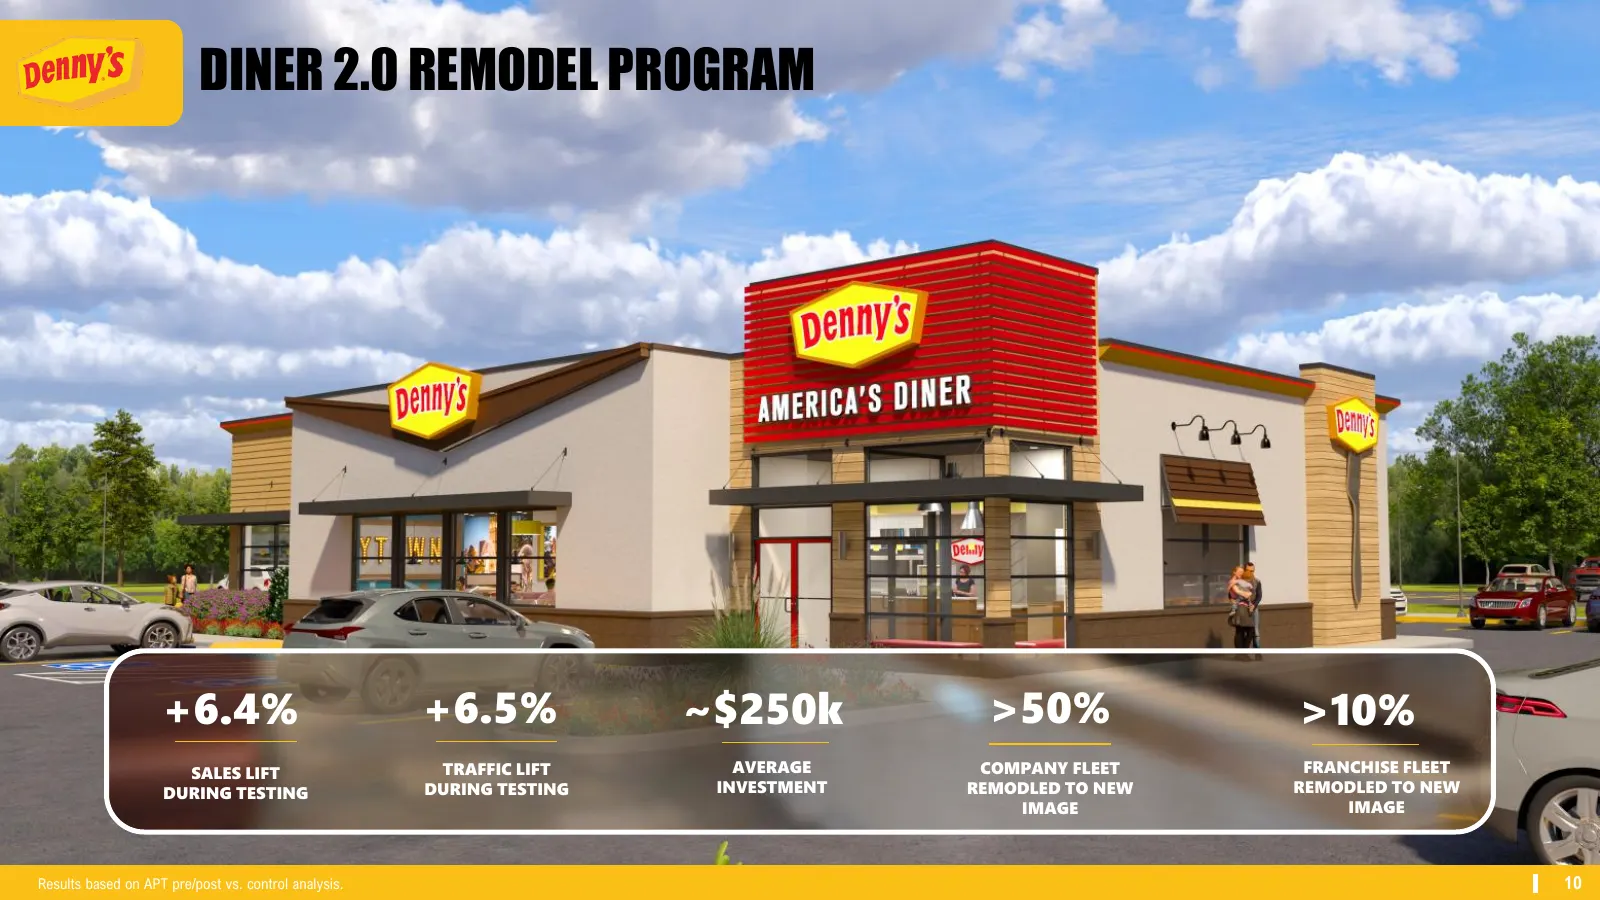
DINER 2.0 REMODEL PROGRAM +6.4% +6.5% ~$250k >50% >10% SALES LIFT TRAFFIC LIFT AVERAGE COMPANY FLEET FRANCHISE FLEET DURING TESTING DURING TESTING INVESTMENT REMODLED TO NEW REMODLED TO NEW IMAGE IMAGE Results based on APT pre/post vs. control analysis. 10
Slide 11: Guest Feedback
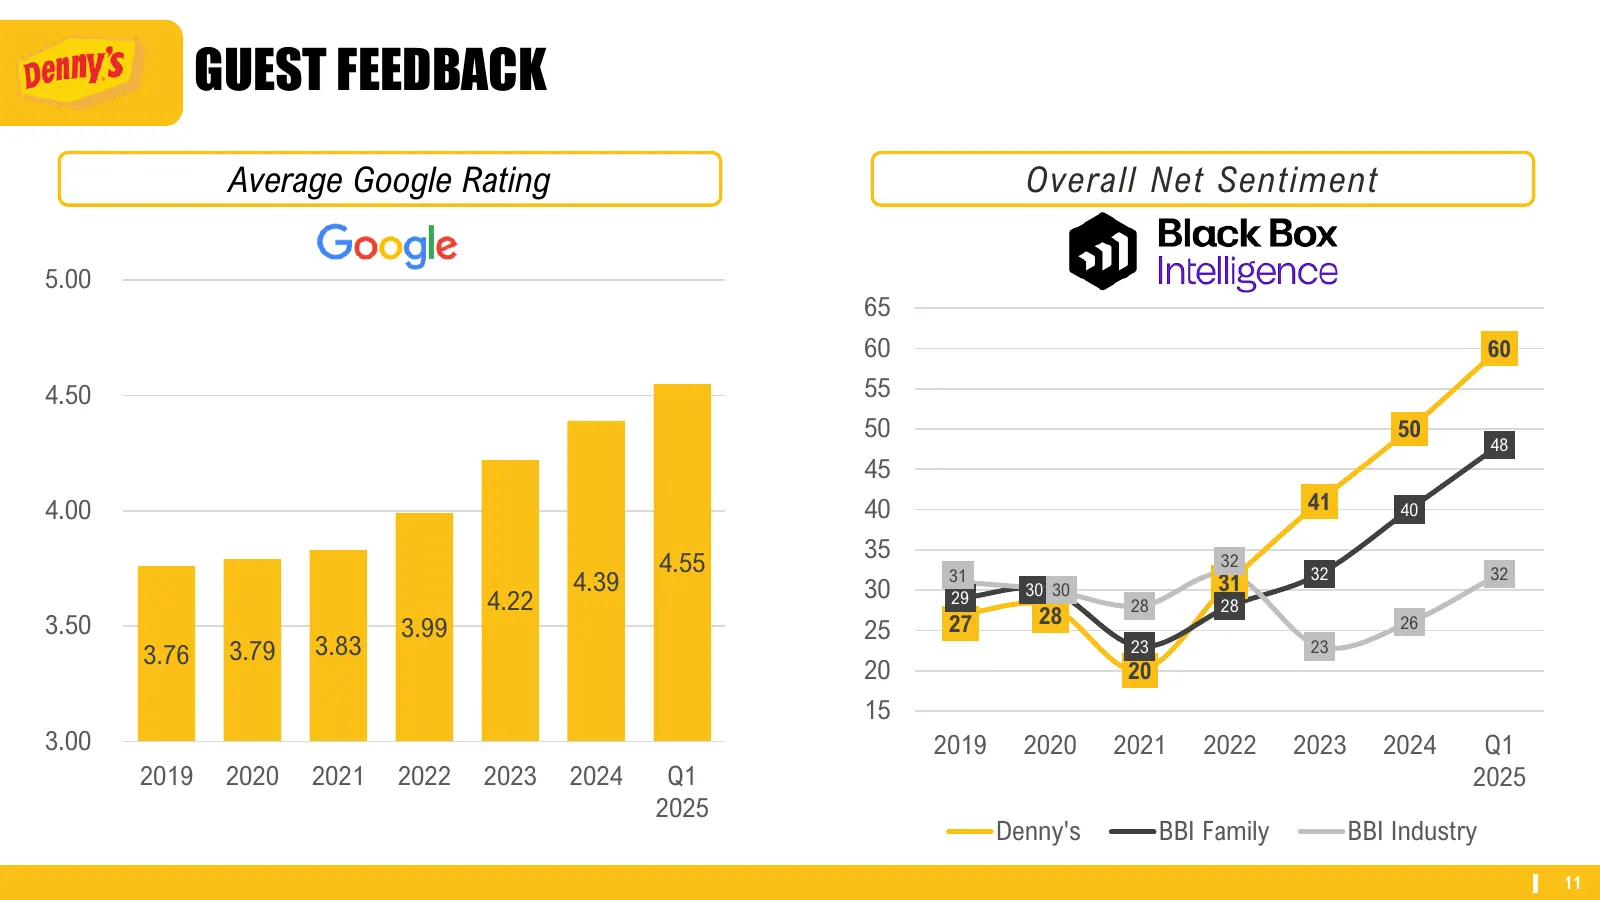
GUEST FEEDBACK Average Google Rating Overall Net Sentiment 5.00 65 60 60 4.50 55 50 50 48 45 4.00 40 41 40 35 4.55 31 32 32 32 4.39 30 30 30 31 4.22 29 28 28 28 3.50 3.99 25 27 26 3.76 3.79 3.83 23 23 20 20 15 3.00 2019 2020 2021 2022 2023 2024 Q1 2019 2020 2021 2022 2023 2024 Q1 2025 2025 Denny's B
Slide 12: Denny's Footprint
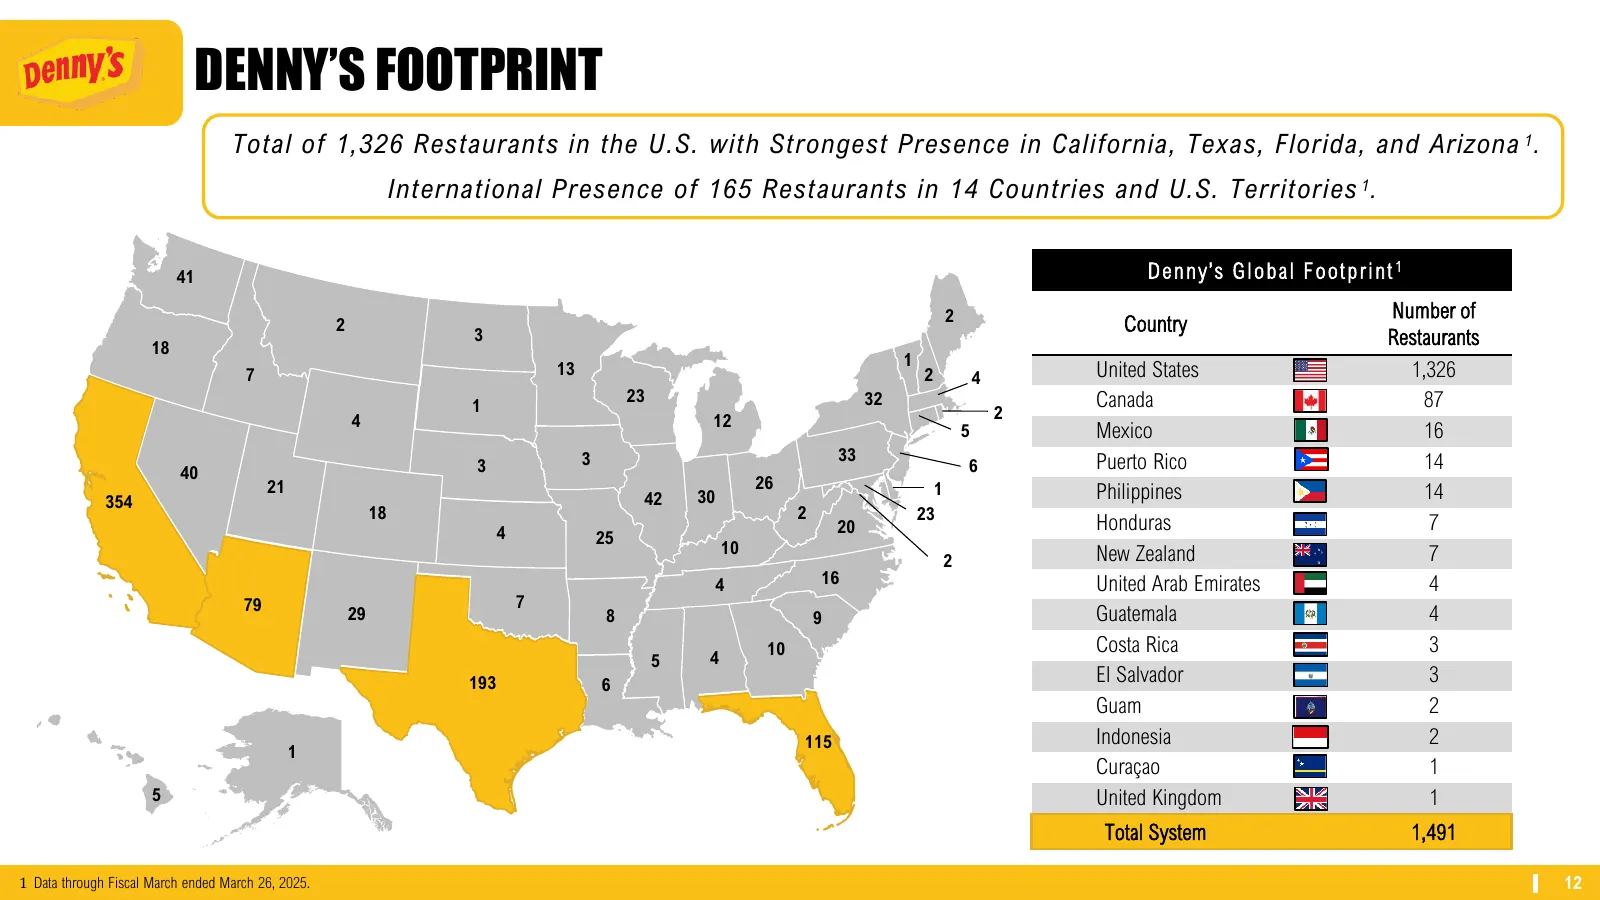
DENNY’S FOOTPRINT Total of 1,326 Restaurants in the U.S. with Strongest Presence in California, Texas, Florida, and Arizona 1 . International Presence of 165 Restaurants in 14 Countries and U.S. Territories 1 . 41 Denny’s Global Footprint 1 2 Number of 2 Country 18 3 Restaurants 1 7 13 2 4 United St
Slide 13: Denny's Strong Partnership with Franchisees
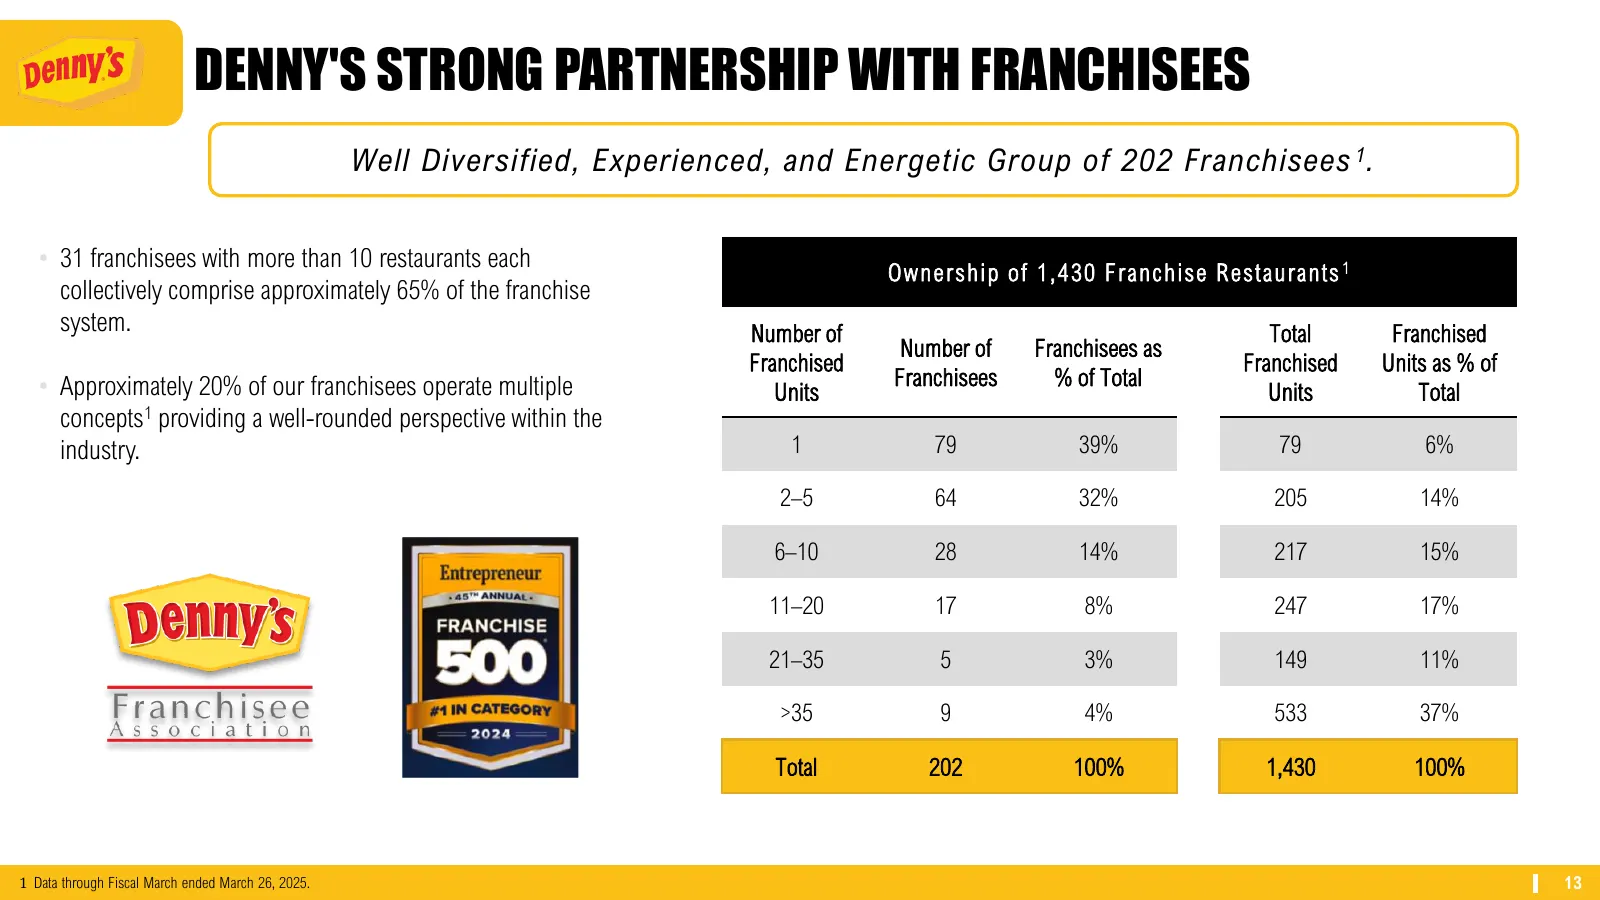
DENNY'S STRONG PARTNERSHIP WITH FRANCHISEES Well Diversified, Experienced, and Energetic Group of 202 Franchisees 1 . • 31 franchisees with more than 10 restaurants each Ownership of 1,430 Franchise Re s taurants 1 collectively comprise approximately 65% of the franchise system. Number of Total Fran
Slide 14: Keke's Breakfast Cafe
KEKE’S BREAKFAST CAFE We Create Fresh Starts for Everyone, Every day
Slide 15: Keke's Domestic System-Wide Same-Restaurant Sales
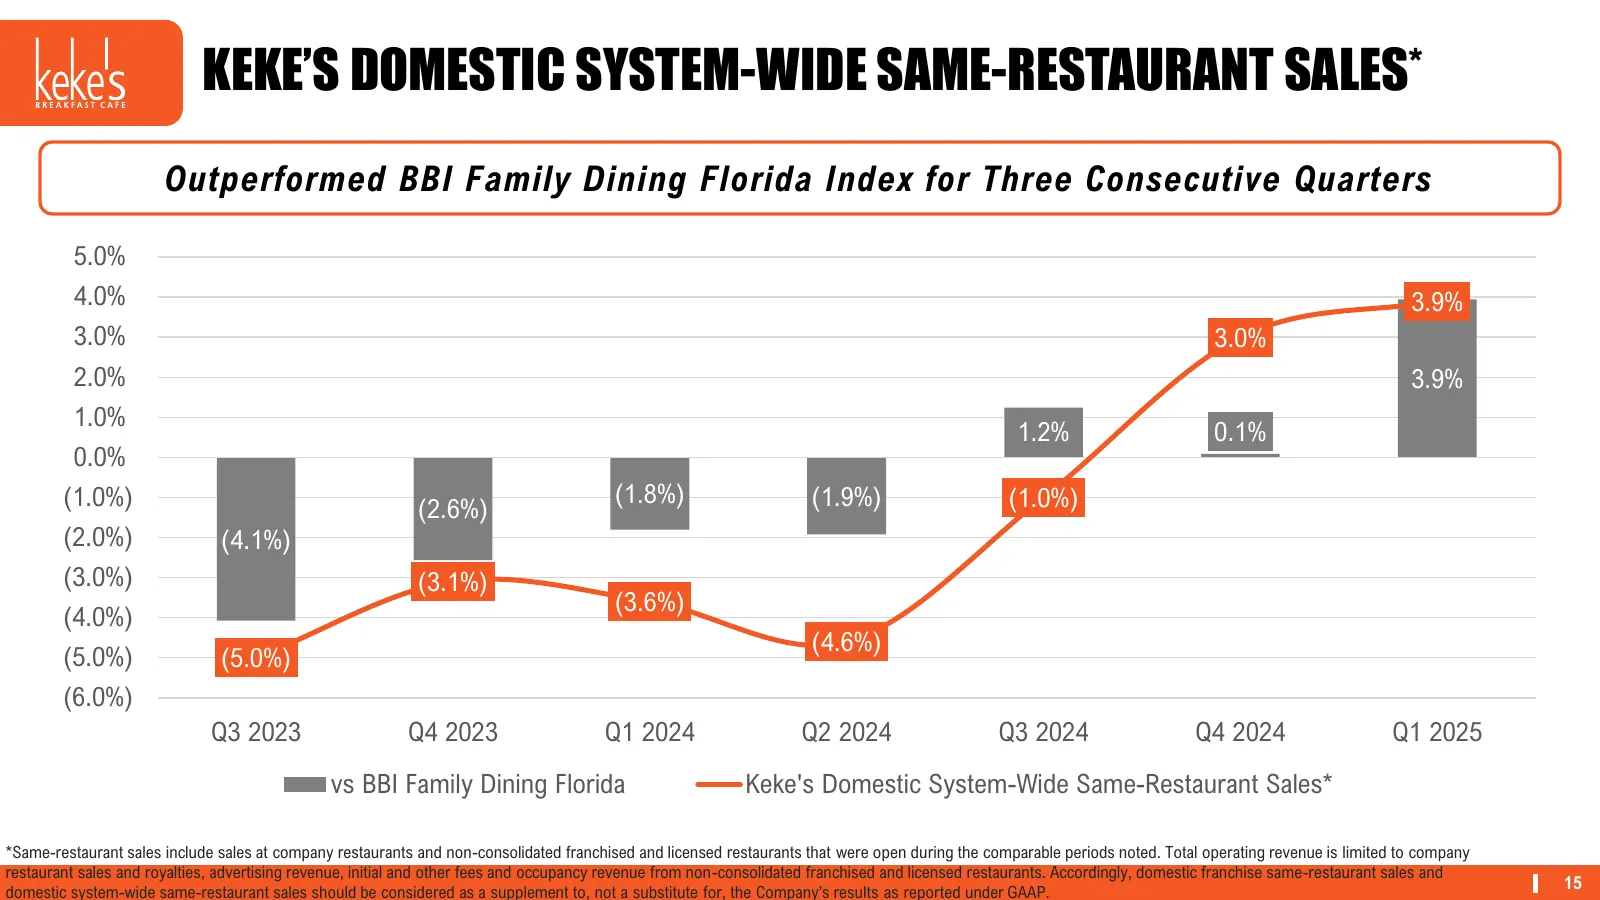
KEKE’S DOMESTIC SYSTEM-WIDE SAME-RESTAURANT SALES* Outperformed BBI Family Dining Florida Index for Three Consecutive Quarters 5.0% 4.0% 3.9% 3.0% 3.0% 2.0% 3.9% 1.0% 1.2% 0.1% 0.0% (1.0%) (1.8%) (1.9%) (1.0%) (2.6%) (2.0%) (4.1%) (3.0%) (3.1%) (3.6%) (4.0%) (4.6%) (5.0%) (5.0%) (6.0%) Q3 2023 Q4 20
Slide 16: Guest Feedback
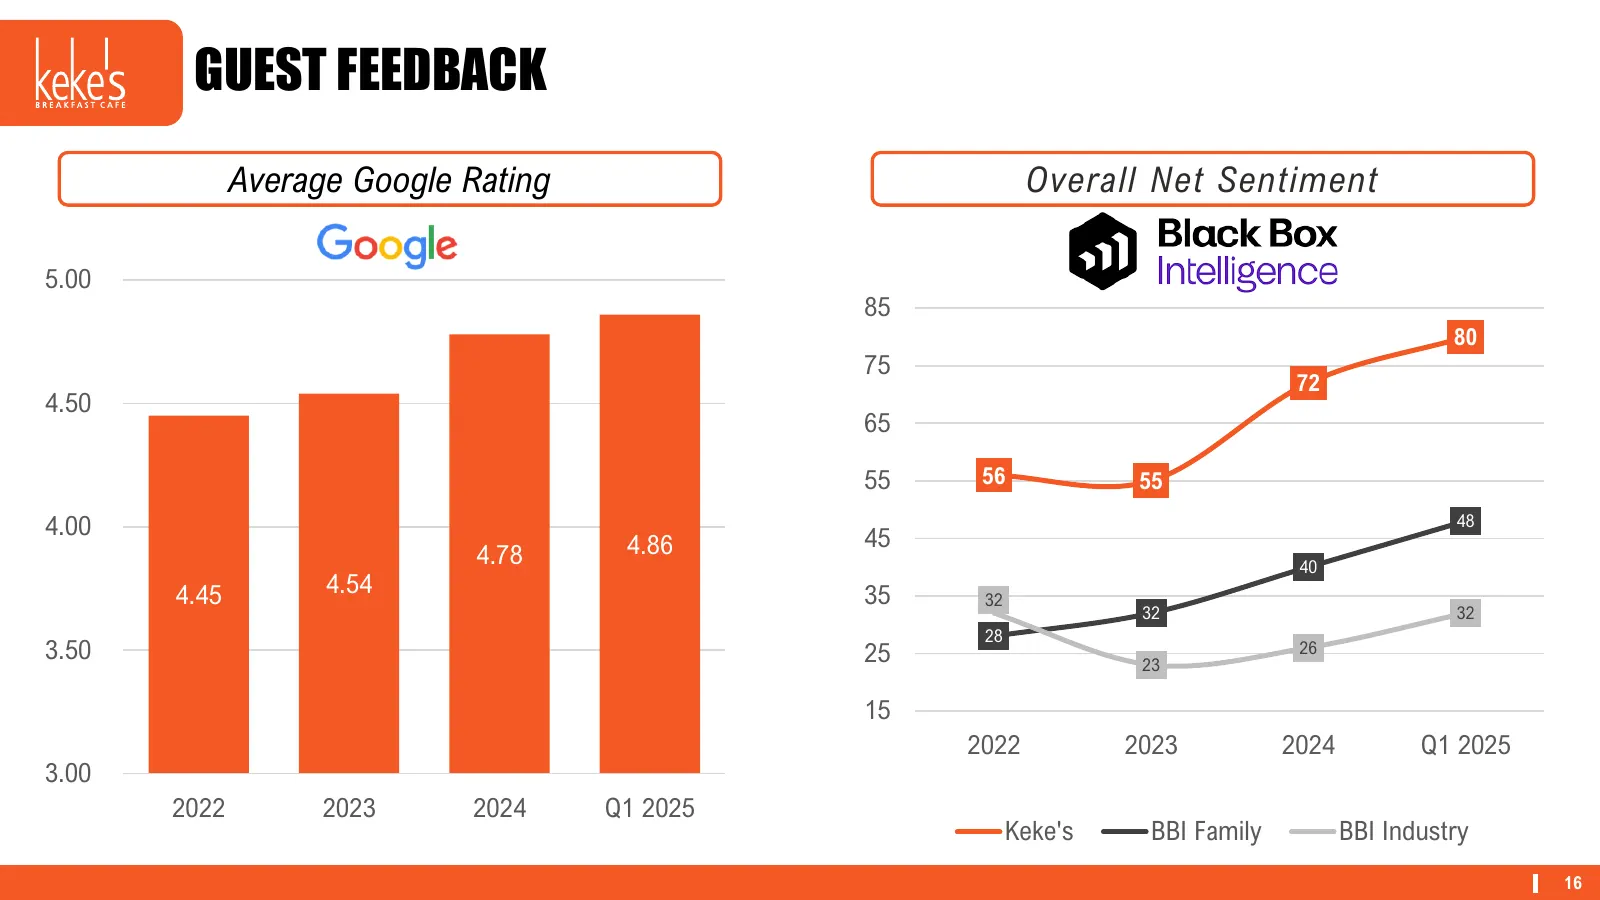
GUEST FEEDBACK Average Google Rating Overall Net Sentiment 5.00 85 80 75 72 4.50 65 55 56 55 4.00 45 48 4.78 4.86 40 4.45 4.54 35 32 32 32 28 3.50 25 23 26 15 2022 2023 2024 Q1 2025 3.00 2022 2023 2024 Q1 2025 Keke's BBI Family BBI Industry 16
Slide 17: New Keke's Design
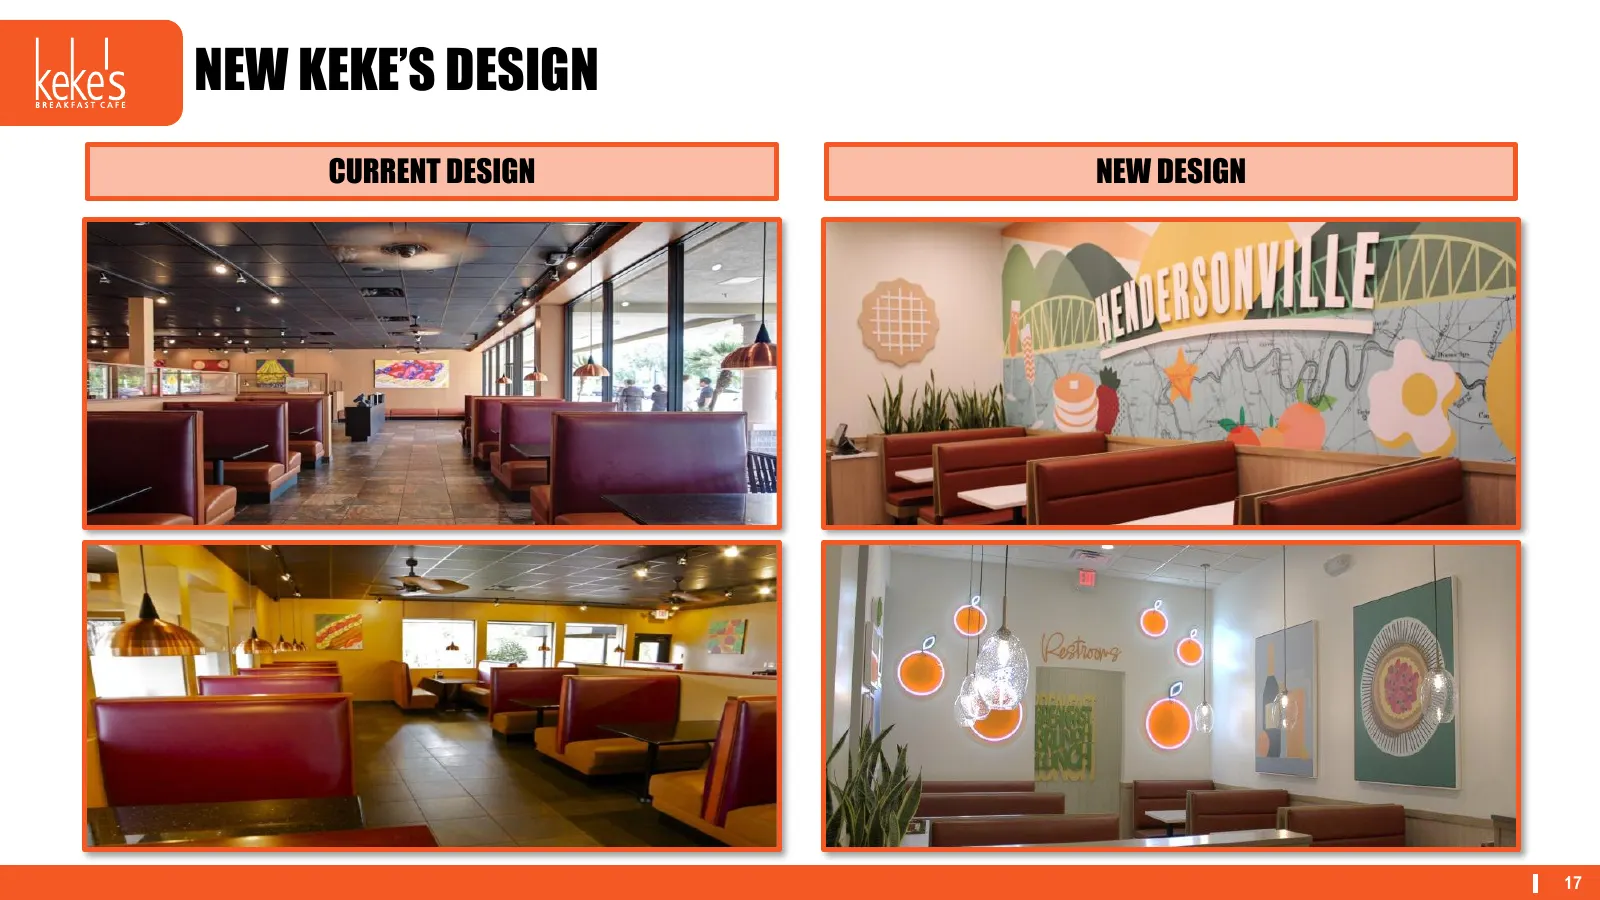
NEW KEKE’S DESIGN CURRENT DESIGN NEW DESIGN 17
Slide 18: Remodel Program Targets
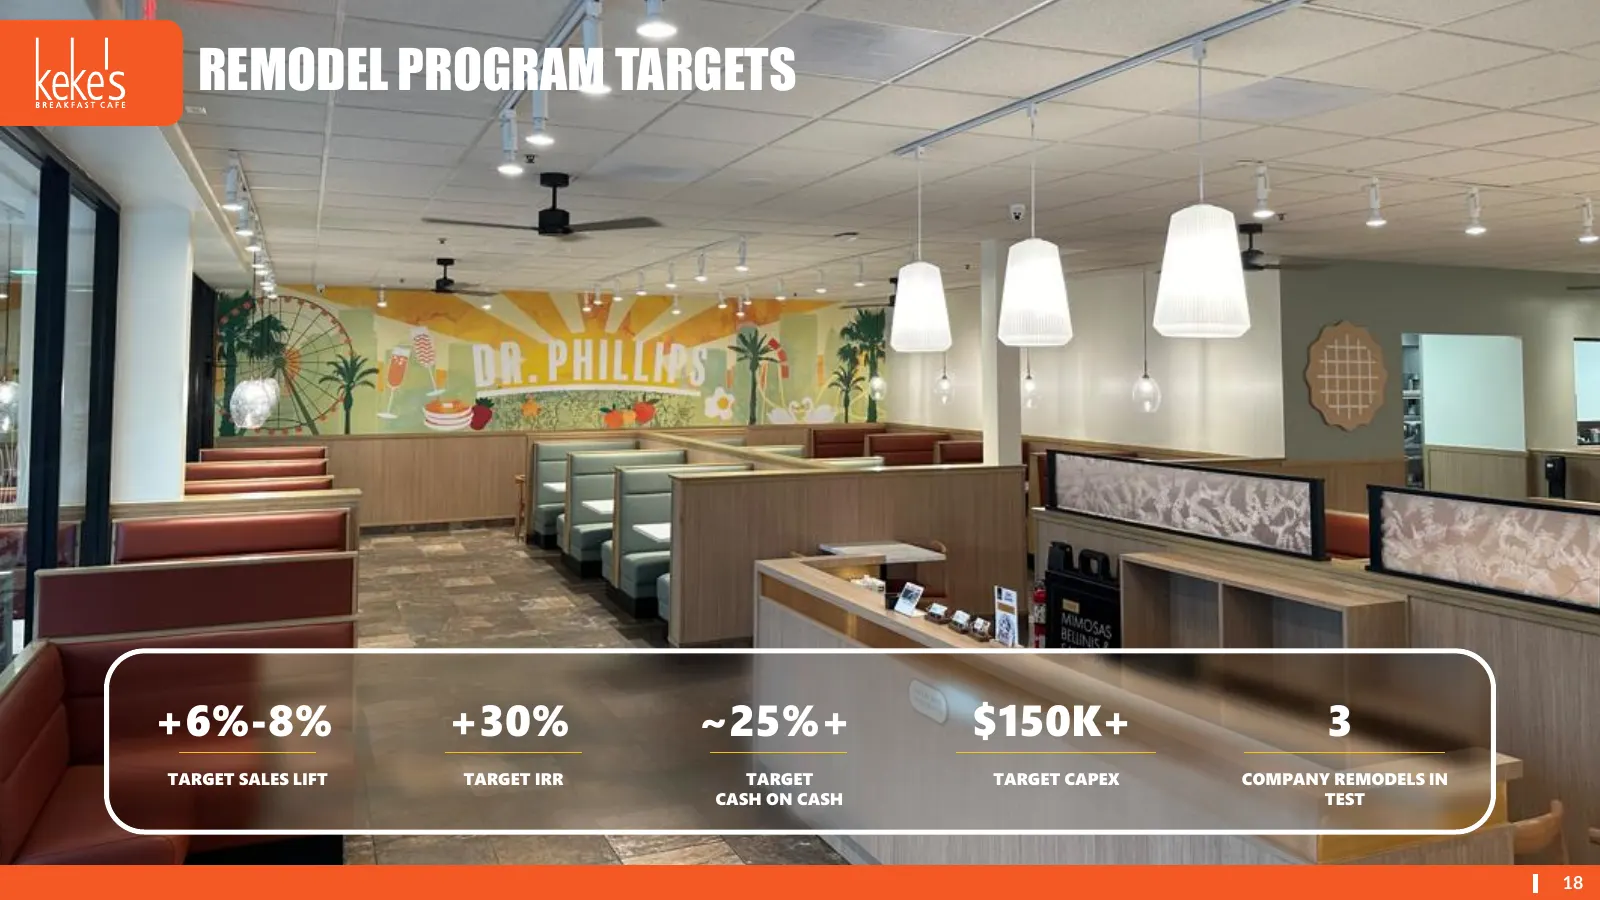
REMODEL PROGRAM TARGETS +6%-8% +30% ~25%+ $150K+ 3 TARGET SALES LIFT TARGET IRR TARGET TARGET CAPEX COMPANY REMODELS IN CASH ON CASH TEST 18
Slide 19: Keke's Growing Partnership with Franchisees
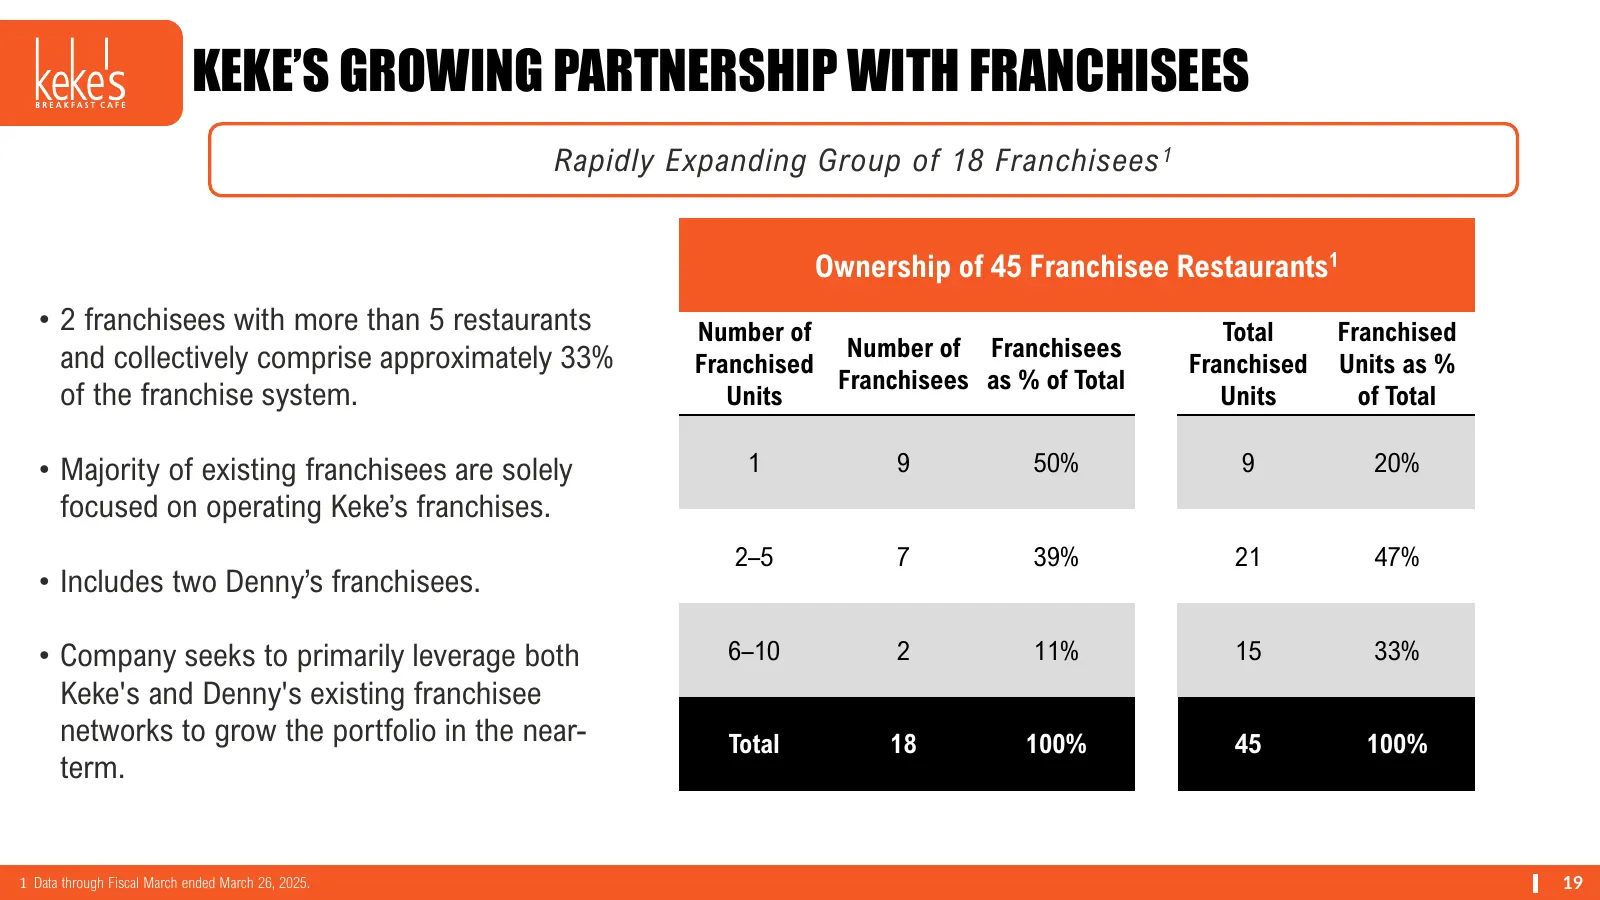
KEKE’S GROWING PARTNERSHIP WITH FRANCHISEES Rapidly Expanding Group of 18 Franchisees 1 Ownership of 45 Franchisee Restaurants1 • 2 franchisees with more than 5 restaurants Number of Total Franchised and collectively comprise approximately 33% Number of Franchisees Franchised Franchised Units as % F
Slide 20: Keke's Footprint and Development Commitments
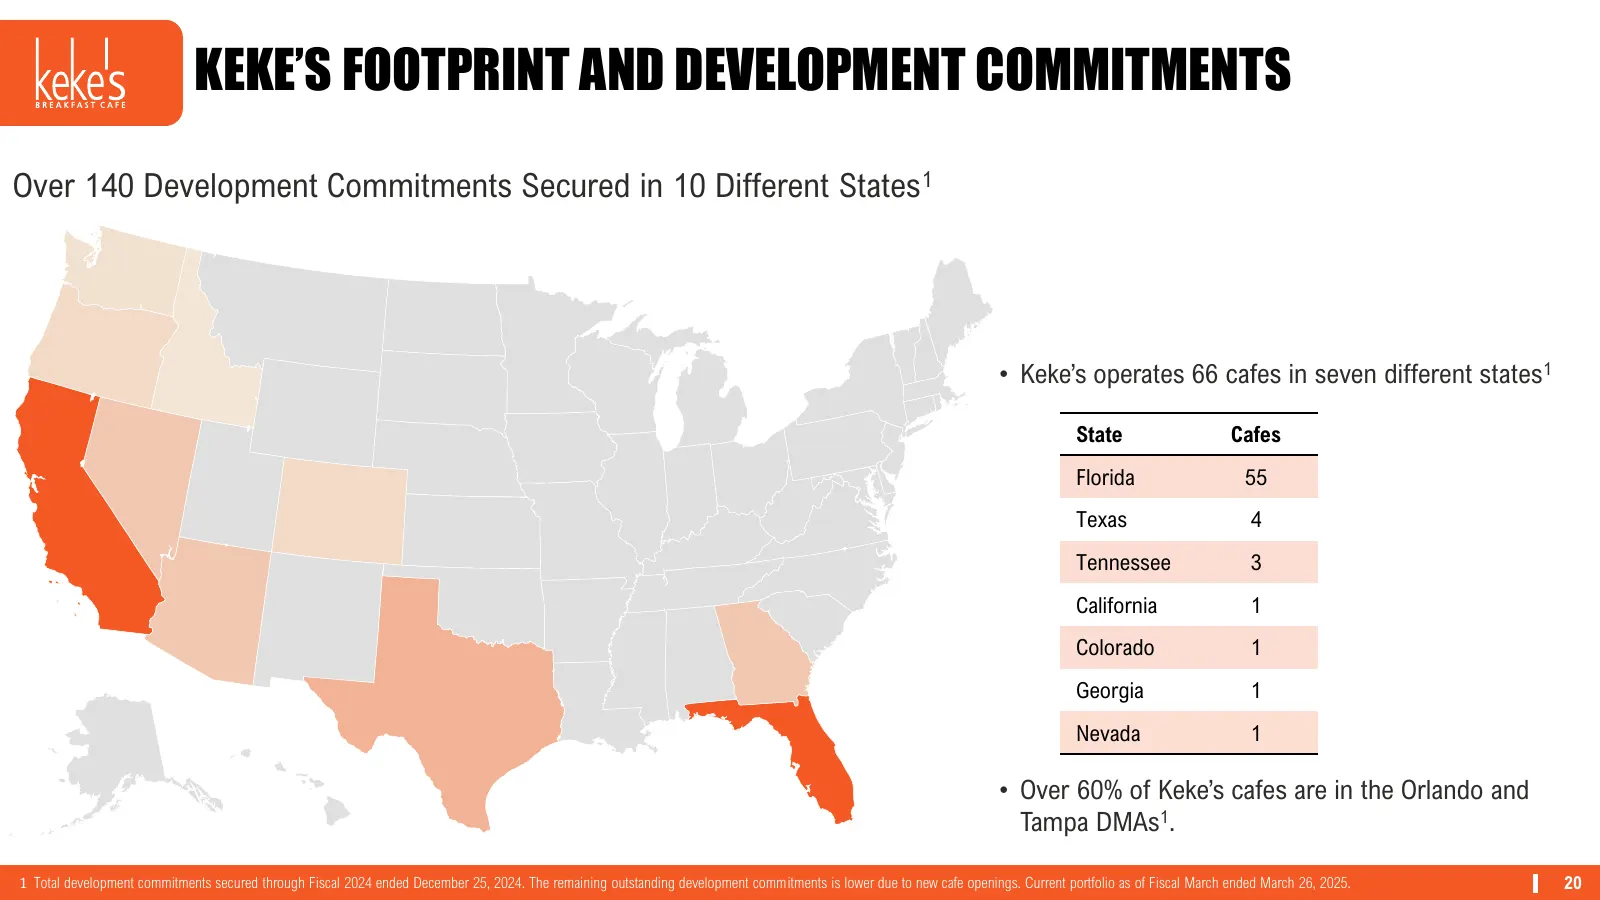
KEKE’S FOOTPRINT AND DEVELOPMENT COMMITMENTS Over 140 Development Commitments Secured in 10 Different States1 • Keke’s operates 66 cafes in seven different states1 State Cafes Florida 55 Texas 4 Tennessee 3 California 1 Colorado 1 Georgia 1 Nevada 1 • Over 60% of Keke’s cafes are in the Orlando and
Slide 21: Denny's Corporation
DENNY’S CORPORATION
Slide 22: Solid Balance Sheet with Flexibility
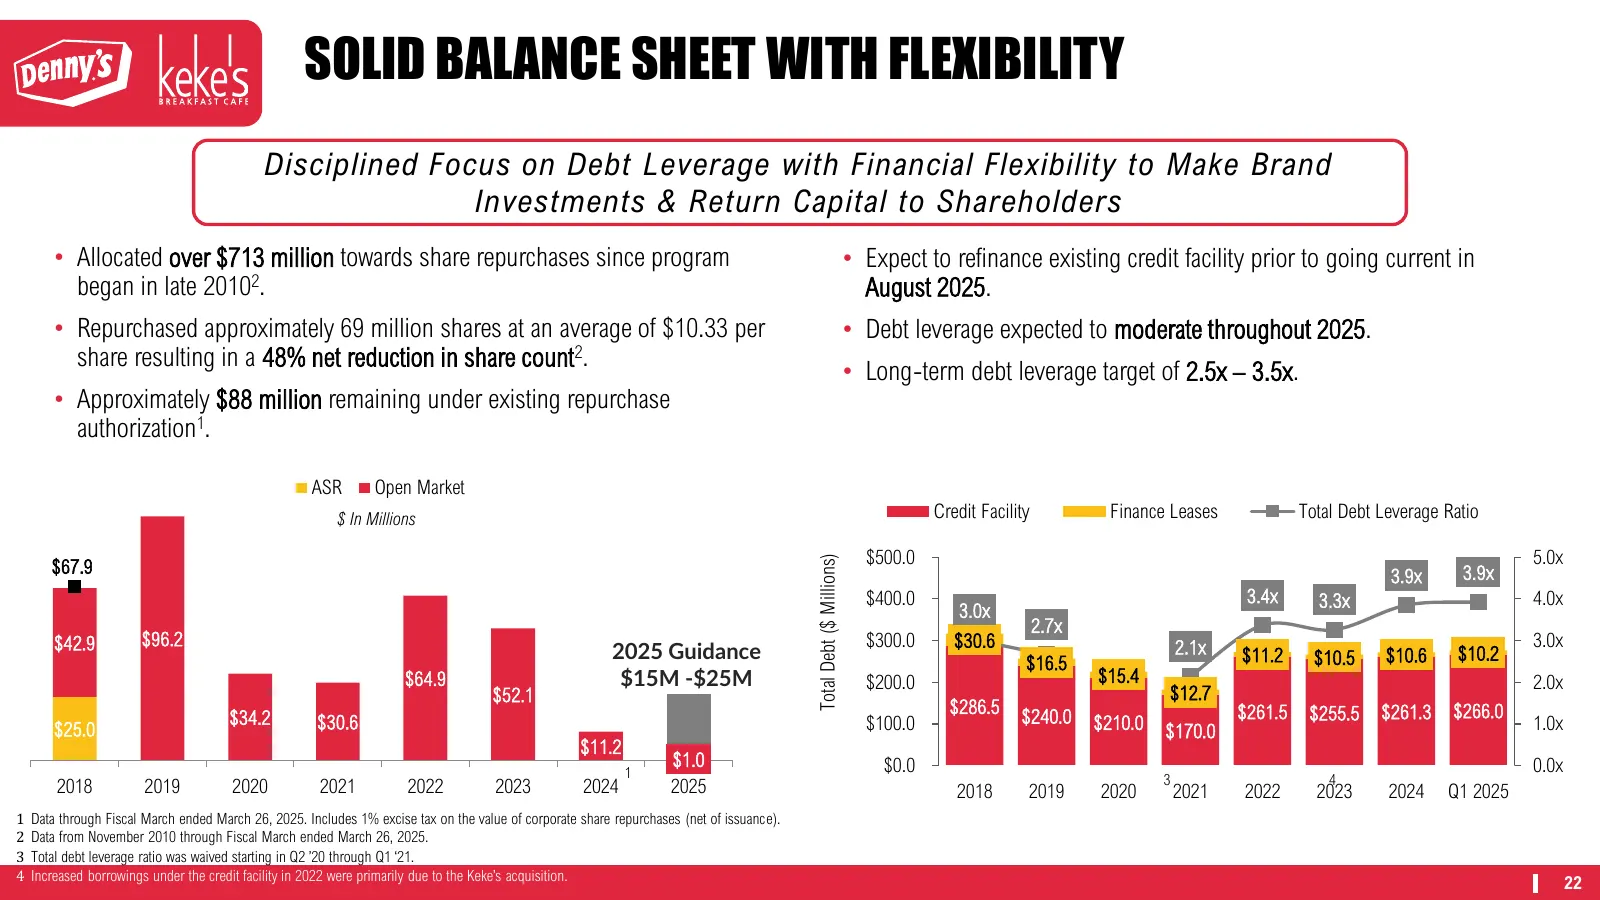
SOLID BALANCE SHEET WITH FLEXIBILITY Disciplined Focus on Debt Leverage with Financial Flexibility to Make Brand Investments & Return Capital to Shareholders • Allocated over $713 million towards share repurchases since program • Expect to refinance existing credit facility prior to going current in
Slide 23: C-R-A-V-E Strategic Framework
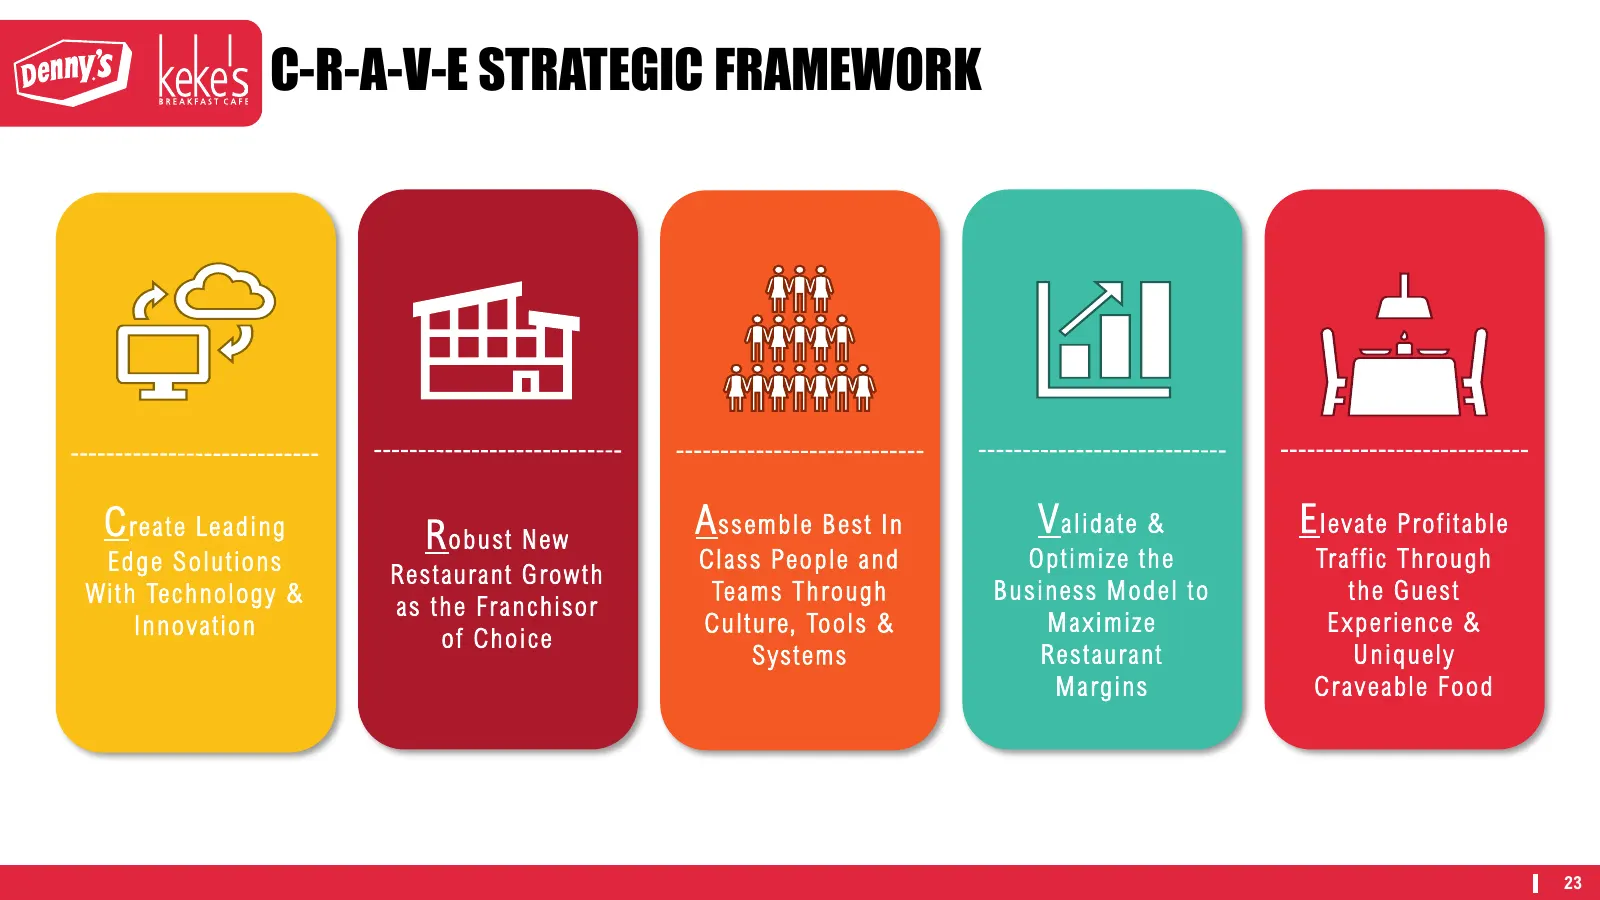
C-R-A-V-E STRATEGIC FRAMEWORK C re a t e Le a d ing R o b ust New A s s emb le B es t In V a lidate & E levat e Pro f it able Ed g e So lu tio ns Clas s Peo p le a nd Op t imize t he Tra f fic Throu gh Res t aurant G ro w t h With Technology & Tea ms Thro ugh B us iness M o d el t o t he Gu es t as
Slide 24: Long-Range Outlook
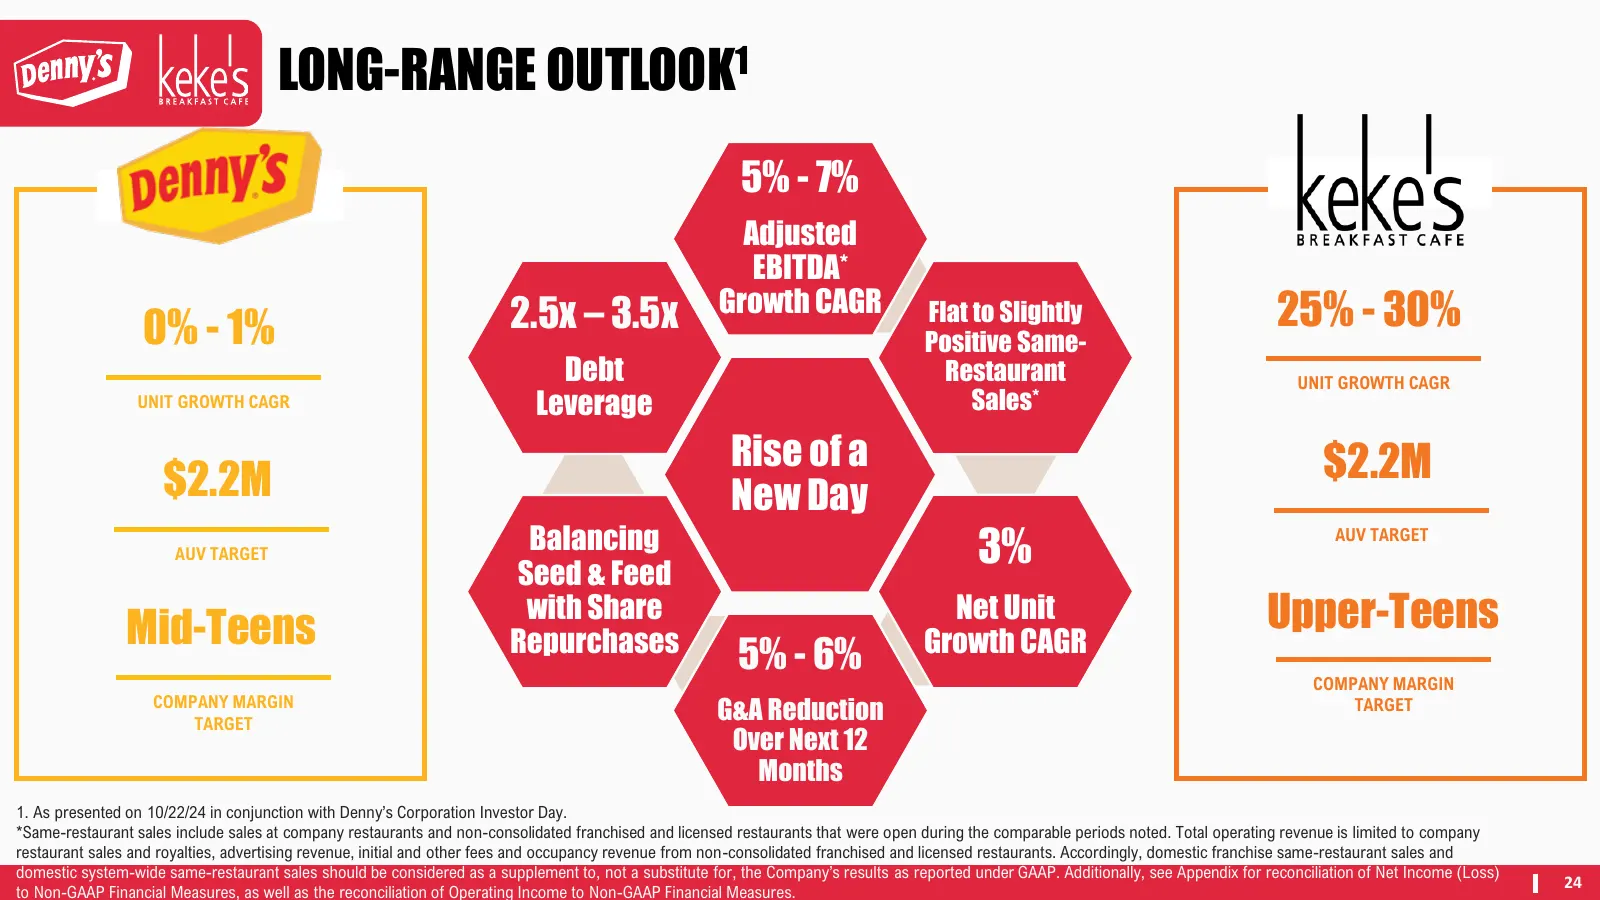
LONG-RANGE OUTLOOK1 5% - 7% Adjusted EBITDA* 0% - 1% 2.5x – 3.5x Growth CAGR Flat to Slightly 25% - 30% Positive Same- Debt Restaurant UNIT GROWTH CAGR UNIT GROWTH CAGR Leverage Sales* Rise of a $2.2M $2.2M New Day AUV TARGET Balancing 3% AUV TARGET Seed & Feed Mid-Teens with Share Net Unit Upper-Te
Slide 25: Appendix
APPENDIX
Slide 26: Franchised and Company Restaurant Sales
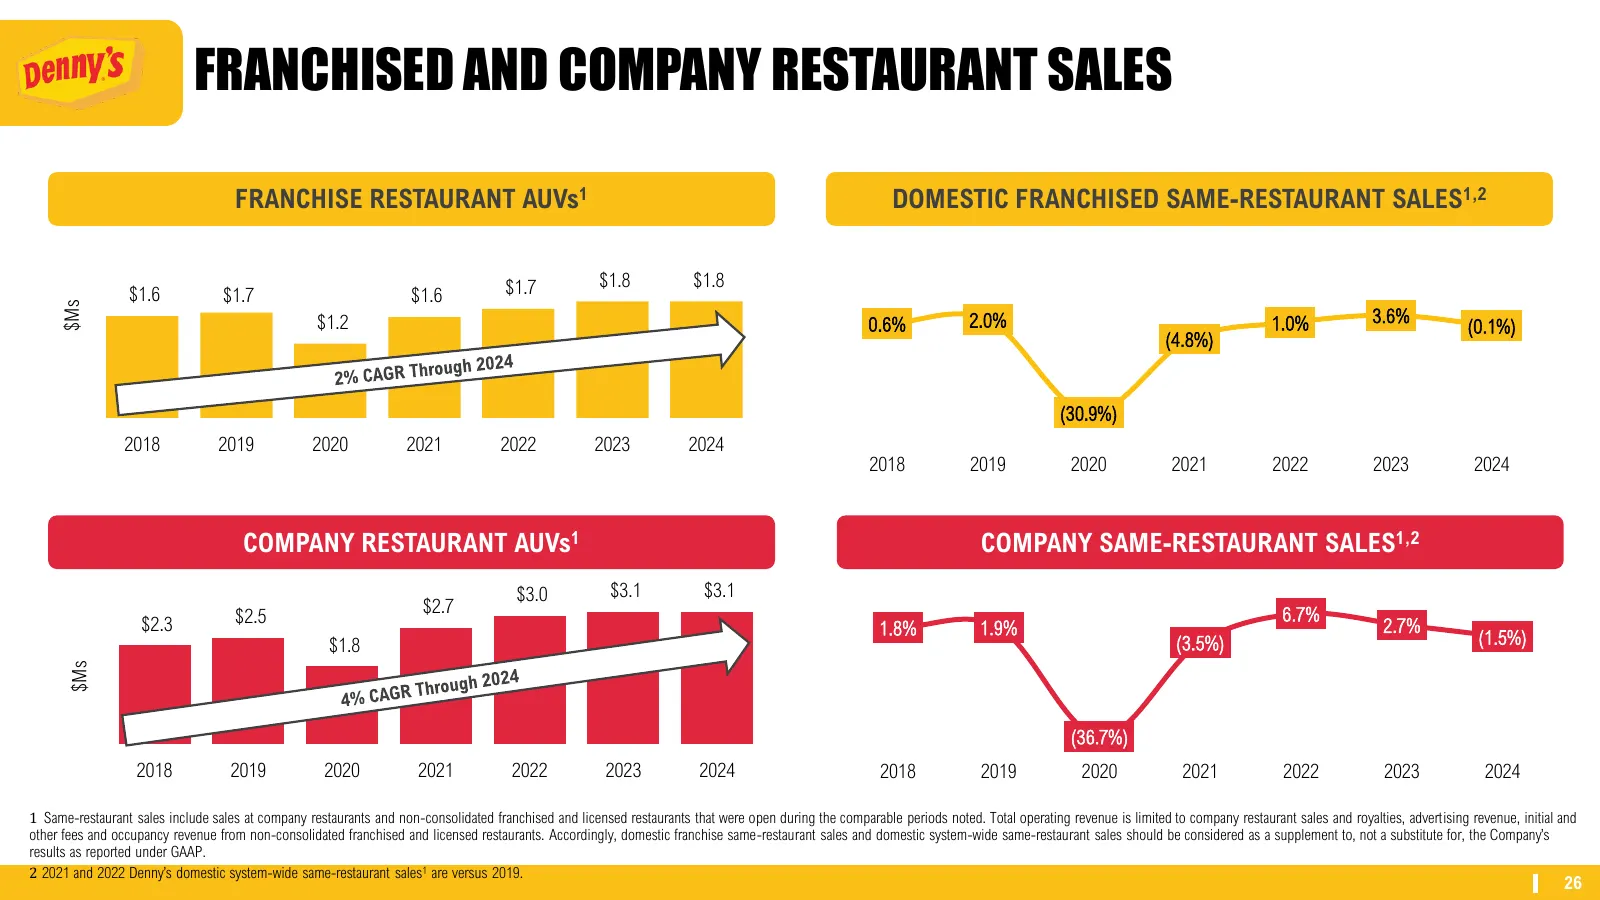
FRANCHISED AND COMPANY RESTAURANT SALES FRANCHISE RESTAURANT AUVs1 DOMESTIC FRANCHISED SAME-RESTAURANT SALES1,2 $1.7 $1.8 $1.8 $1.6 $1.7 $1.6 $Ms $1.2 0.6% 2.0% 1.0% 3.6% (0.1%) (4.8%) (30.9%) 2018 2019 2020 2021 2022 2023 2024 2018 2019 2020 2021 2022 2023 2024 COMPANY RESTAURANT AUVs1 COMPANY SAME
Slide 27: Keke's Franchised and Company Restaurant Sales
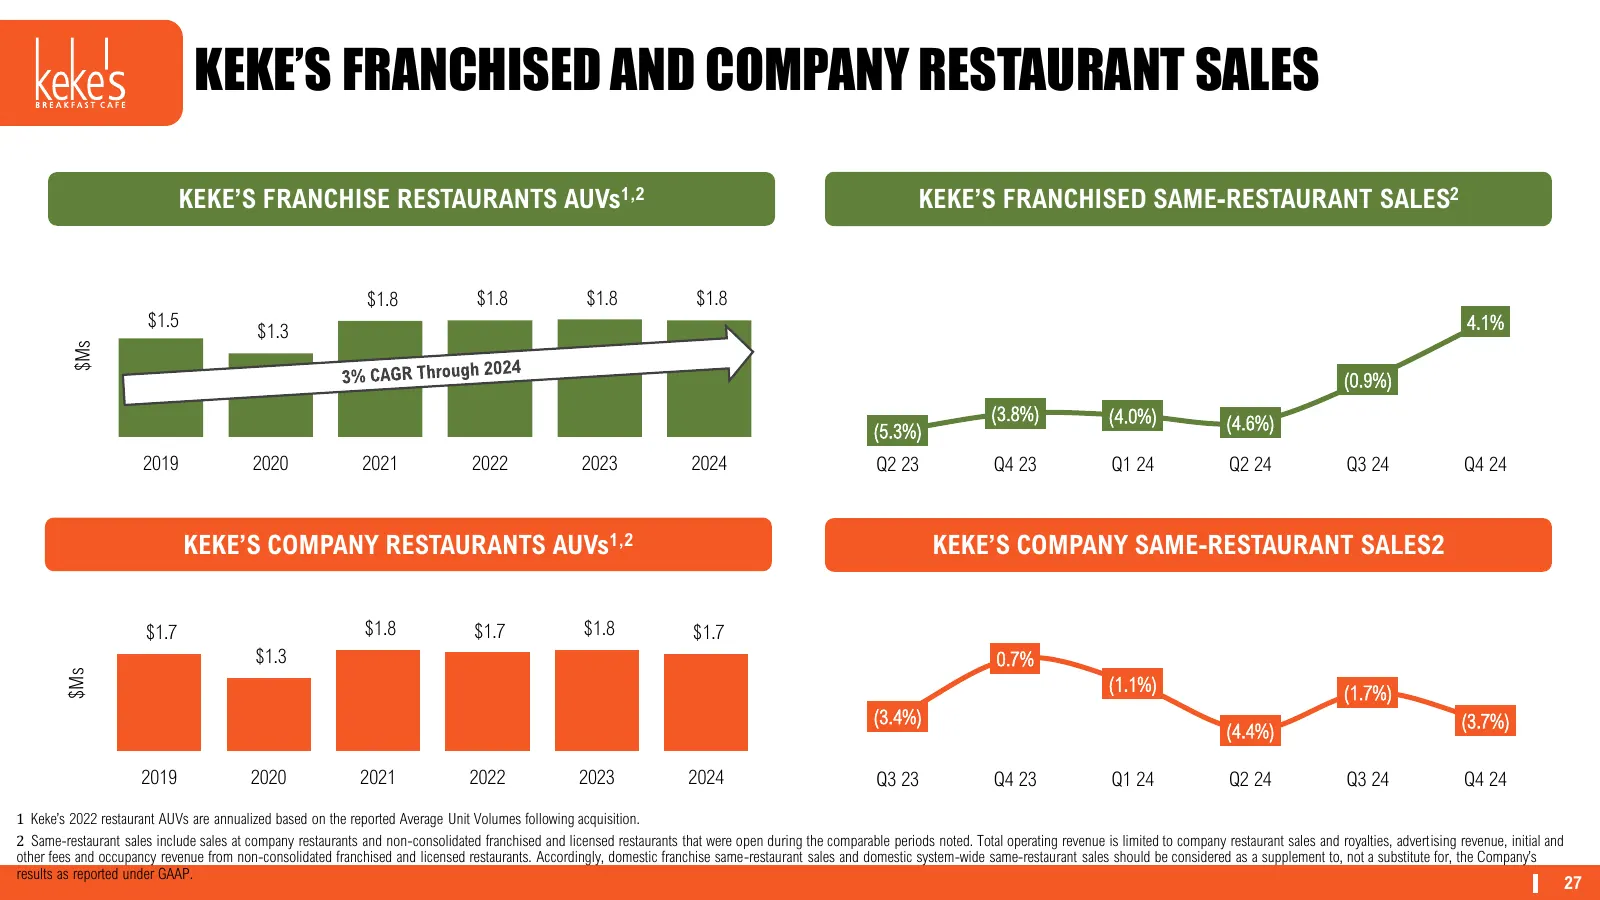
KEKE’S FRANCHISED AND COMPANY RESTAURANT SALES KEKE’S FRANCHISE RESTAURANTS AUVs1,2 KEKE’S FRANCHISED SAME-RESTAURANT SALES2 $1.8 $1.8 $1.8 $1.8 $1.5 4.1% $1.3 $Ms (0.9%) (3.8%) (4.0%) (4.6%) (5.3%) 2019 2020 2021 2022 2023 2024 Q2 23 Q4 23 Q1 24 Q2 24 Q3 24 Q4 24 KEKE’S COMPANY RESTAURANTS AUVs1,2
Slide 28: Brand Portfolios
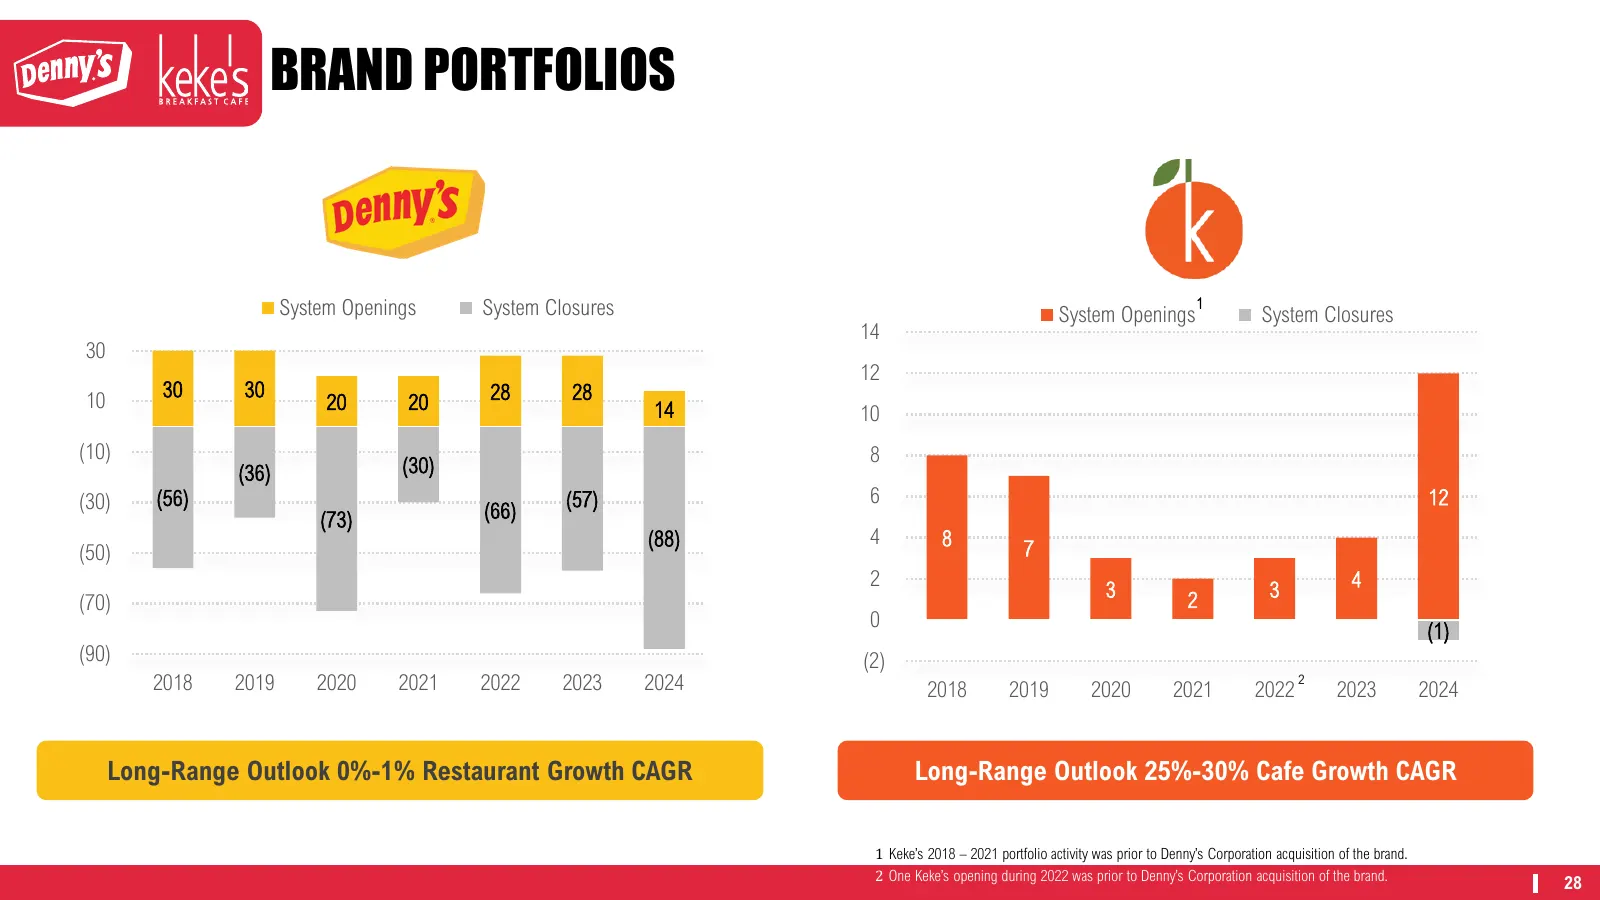
BRAND PORTFOLIOS System Openings System Closures 1 System Openings System Closures 14 30 12 30 30 28 28 10 20 20 14 10 (10) 8 (36) (30) (30) (56) (57) 6 12 (73) (66) (88) 4 8 (50) 7 2 4 3 2 3 (70) 0 (1) (90) (2) 2018 2019 2020 2021 2022 2023 2024 2018 2019 2020 2021 2022 2 2023 2024 Long-Range Outlo
Slide 29: Non-GAAP Financial Measures
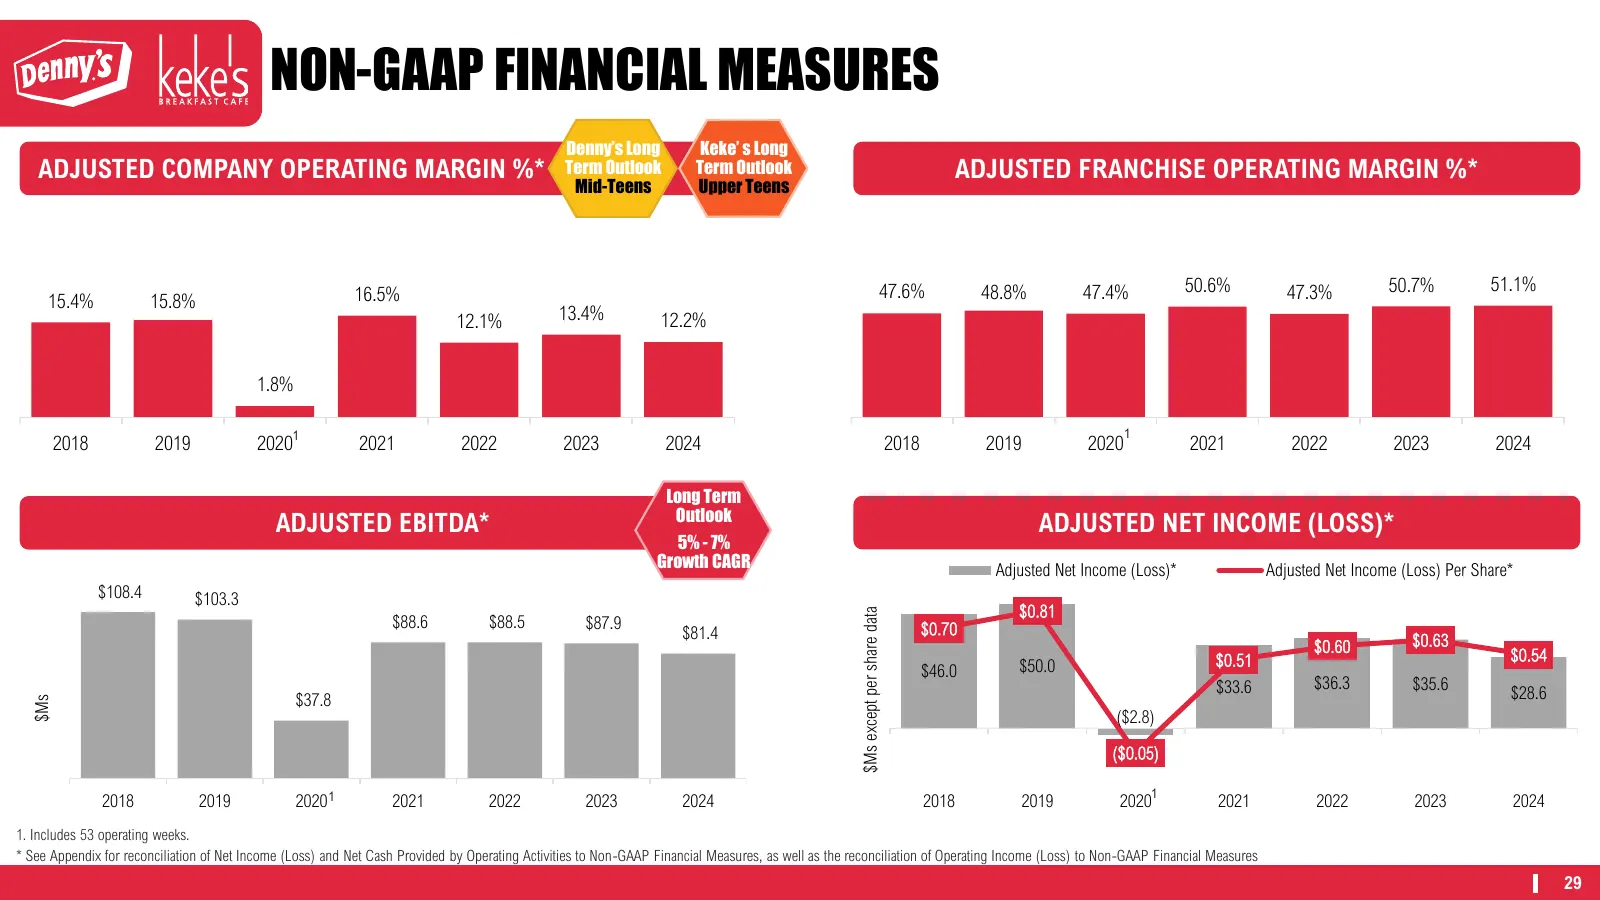
NON-GAAP FINANCIAL MEASURES Denny’s Long Keke’ s Long ADJUSTED COMPANY OPERATING MARGIN %* Term Outlook Term Outlook ADJUSTED FRANCHISE OPERATING MARGIN %* Mid-Teens Upper Teens 47.6% 48.8% 47.4% 50.6% 47.3% 50.7% 51.1% 15.4% 15.8% 16.5% 12.1% 13.4% 12.2% 1.8% 1 1 2018 2019 2020 2021 2022 2023 2024
Slide 30: Experienced and Committed Leadership Team
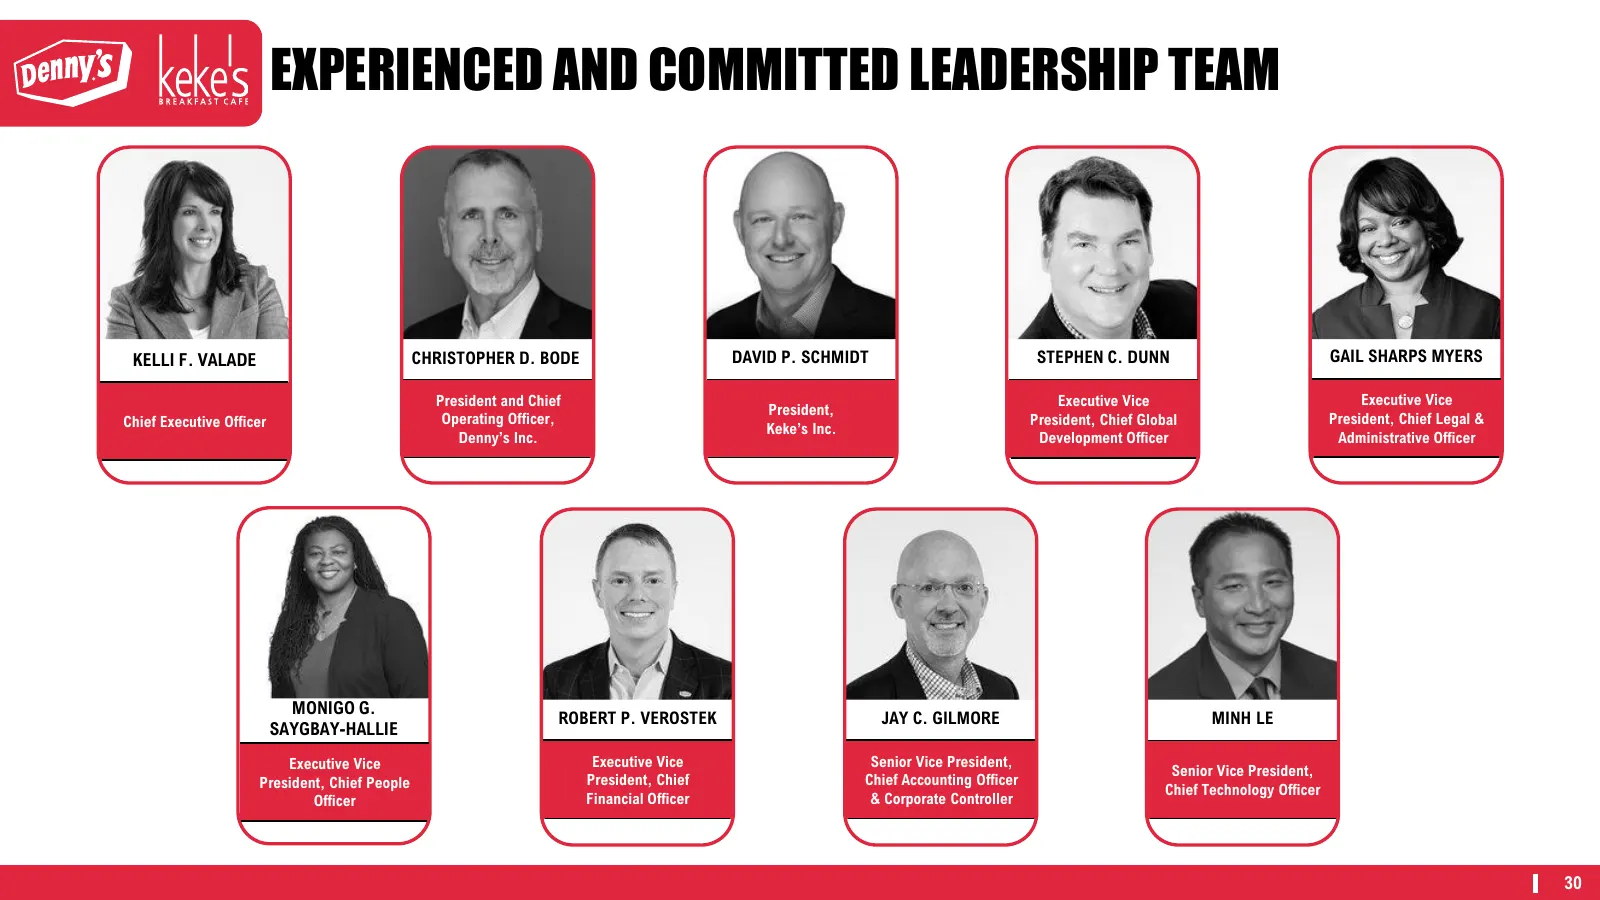
EXPERIENCED AND COMMITTED LEADERSHIP TEAM KELLI F. VALADE CHRISTOPHER D. BODE DAVID P. SCHMIDT STEPHEN C. DUNN GAIL SHARPS MYERS President and Chief Executive Vice Executive Vice President, Chief Executive Officer Operating Officer, President, Chief Global President, Chief Legal & Keke’s Inc. Denny’
Slide 31: Reconciliation of Net Income (Loss) to Non-GAAP Financial Measures
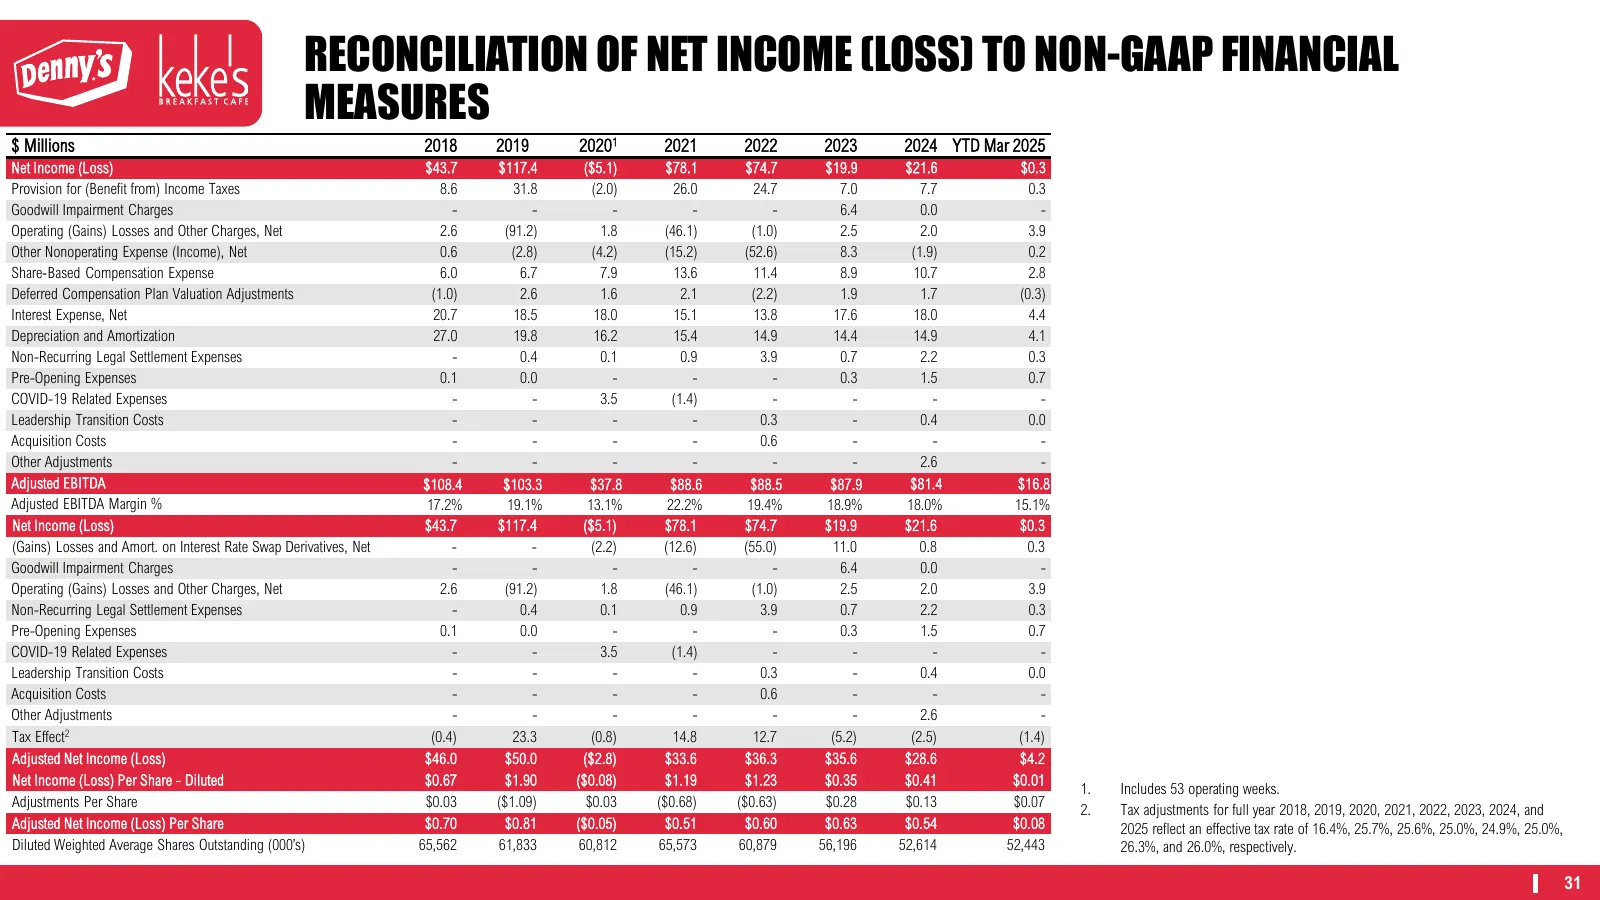
RECONCILIATION OF NET INCOME (LOSS) TO NON-GAAP FINANCIAL MEASURES $ Millions 2018 2019 20201 2021 2022 2023 2024 YTD Mar 2025 Net Income (Loss) $43.7 $117.4 ($5.1) $78.1 $74.7 $19.9 $21.6 $0.3 Provision for (Benefit from) Income Taxes 8.6 31.8 (2.0) 26.0 24.7 7.0 7.7 0.3 Goodwill Impairment Charges
Slide 32: Reconciliation of Operating Income to Non-GAAP Financial Measures
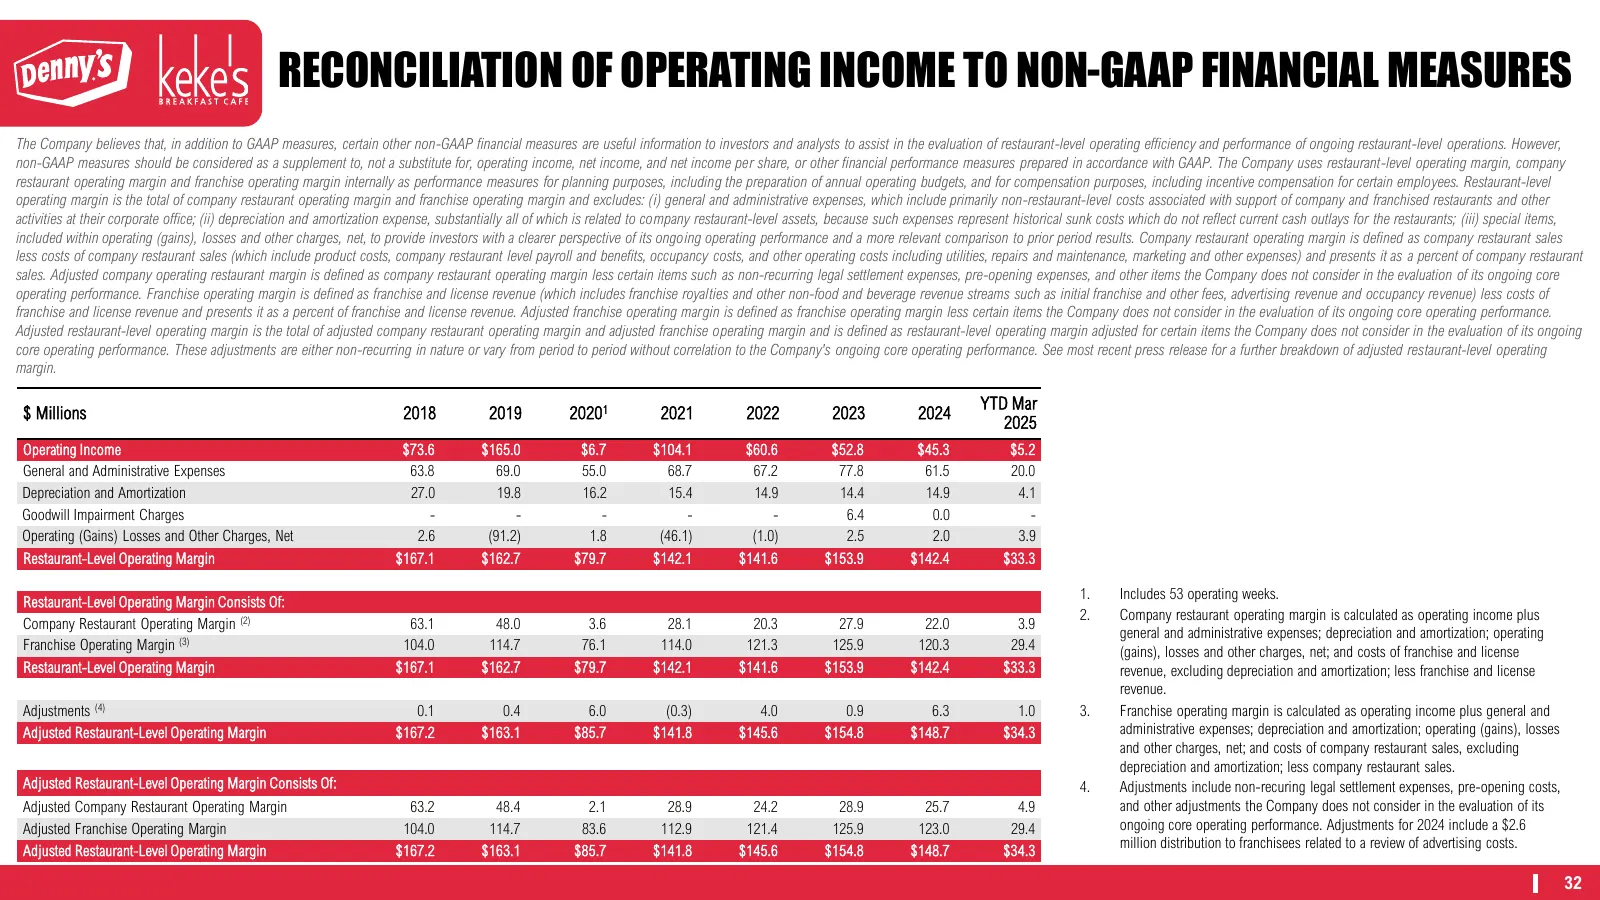
RECONCILIATION OF OPERATING INCOME TO NON-GAAP FINANCIAL MEASURES The Company believes that, in addition to GAAP measures, certain other non-GAAP financial measures are useful information to investors and analysts to assist in the evaluation of restaurant-level operating efficiency and performance o
Source: EarningsCall slides
More decks from Dennys Corp
 Investor Presentation (August 2025)30 slides · Aug 4, 2025
 Investor Presentation (February 2025)32 slides · February 2025
 Investor Presentation (January 2025)32 slides · Jan 13, 2025
 Investor Day (October 2024)137 slides · Oct 22, 2024
 Q2 2024 Earnings Presentation22 slides · Jul 30, 2024
 Q1 2024 Earnings Presentation21 slides · April 2024