Dennys — Investor Presentation (August 2025)
30 slides from Dennys's investor presentation, Aug 4, 2025
Slide 1: Denny's Corporation Investor Presentation August through October 2025
DENNY’S CORPORATION INVESTOR PRESENTATION AUGUST THROUGH OCTOBER 2025
Slide 2: Forward-looking statements
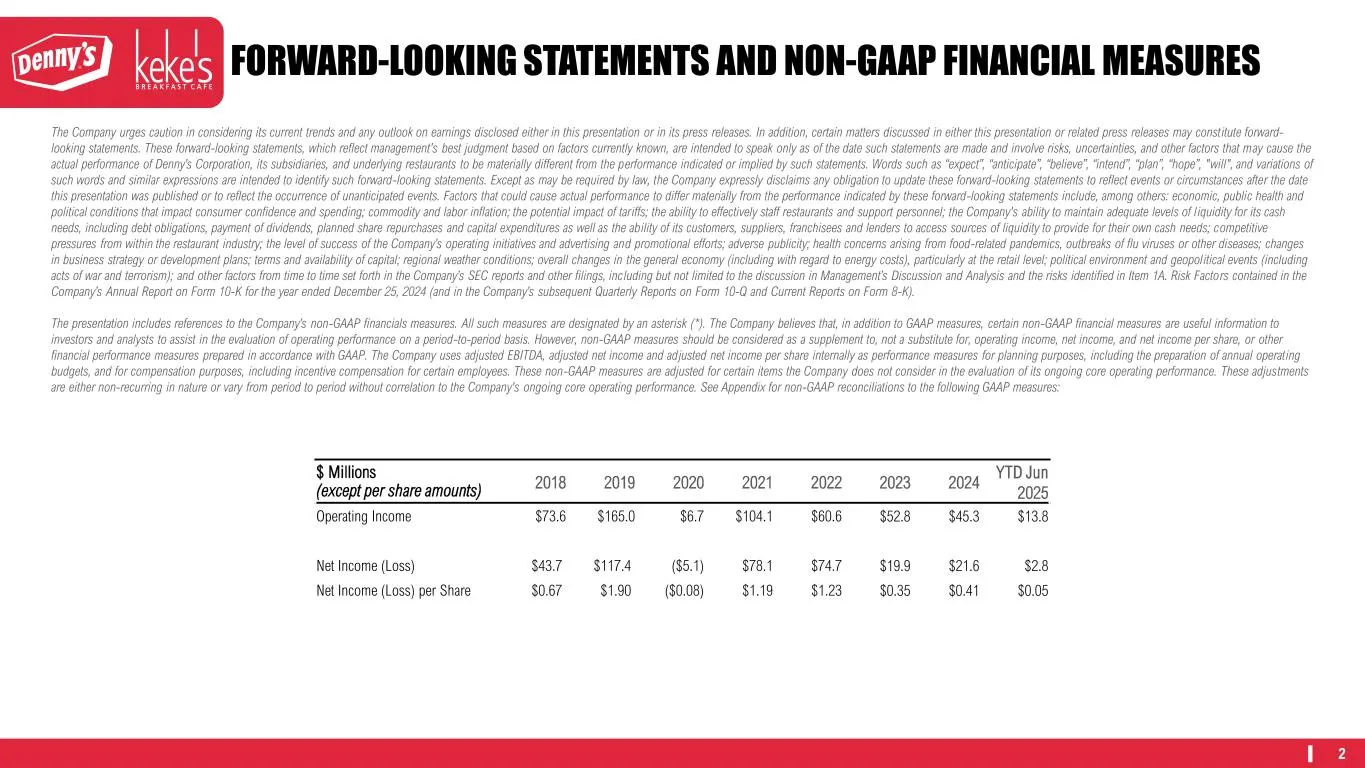
2 The Company urges caution in considering its current trends and any outlook on earnings disclosed either in this presentation or in its press releases. In addition, certain matters discussed in either this presentation or related press releases may constitute forward- looking statements. These for
Slide 3: Denny's Corporation at a Glance
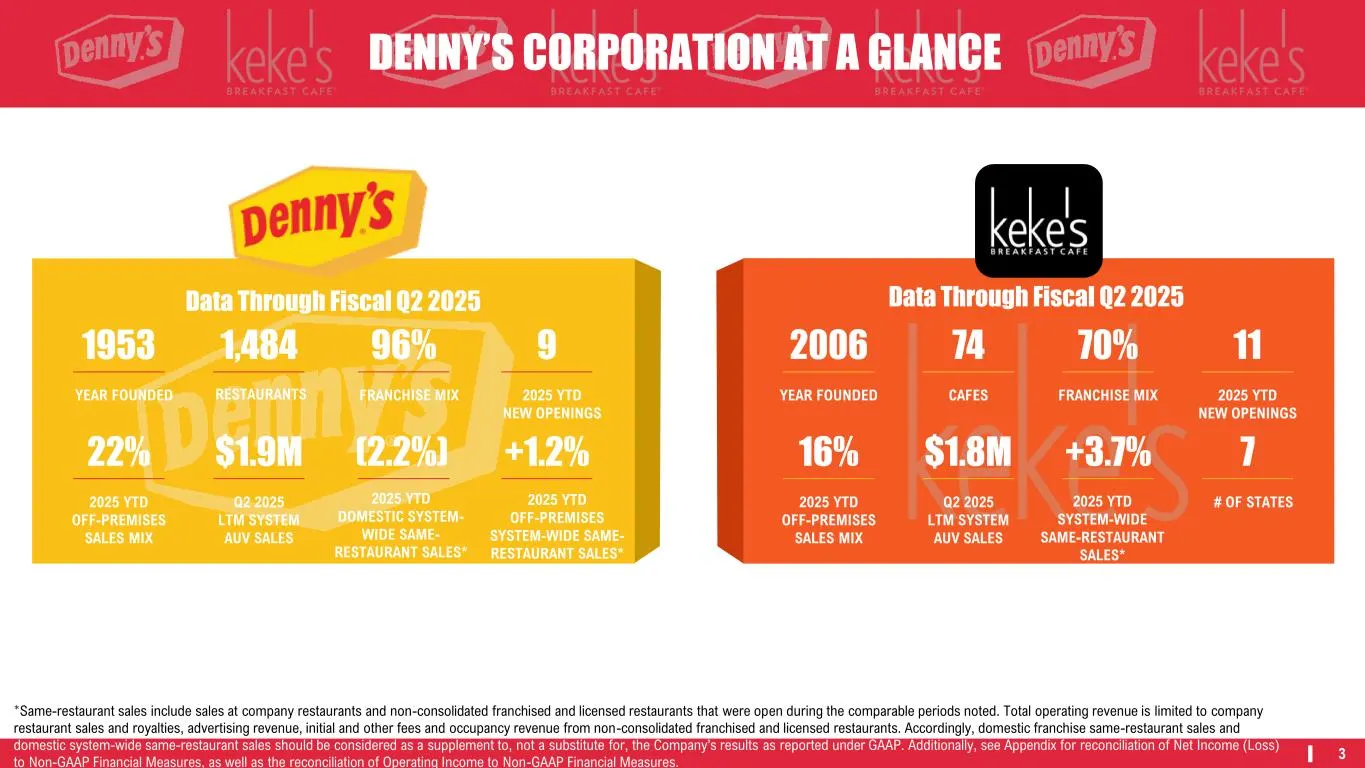
Main logo and presentation color Yellow from IR Presentation Black from IR Presentation Orange from IR presentation Slide Background from IR presentation Blue from IR Presentation Grey Second Grey Black text from website White Yellow from logo SE C O N D A R Y C O LO R S R0 G0 B0 P R IM A R Y C O LO
Slide 4: Q2 2025 Highlights
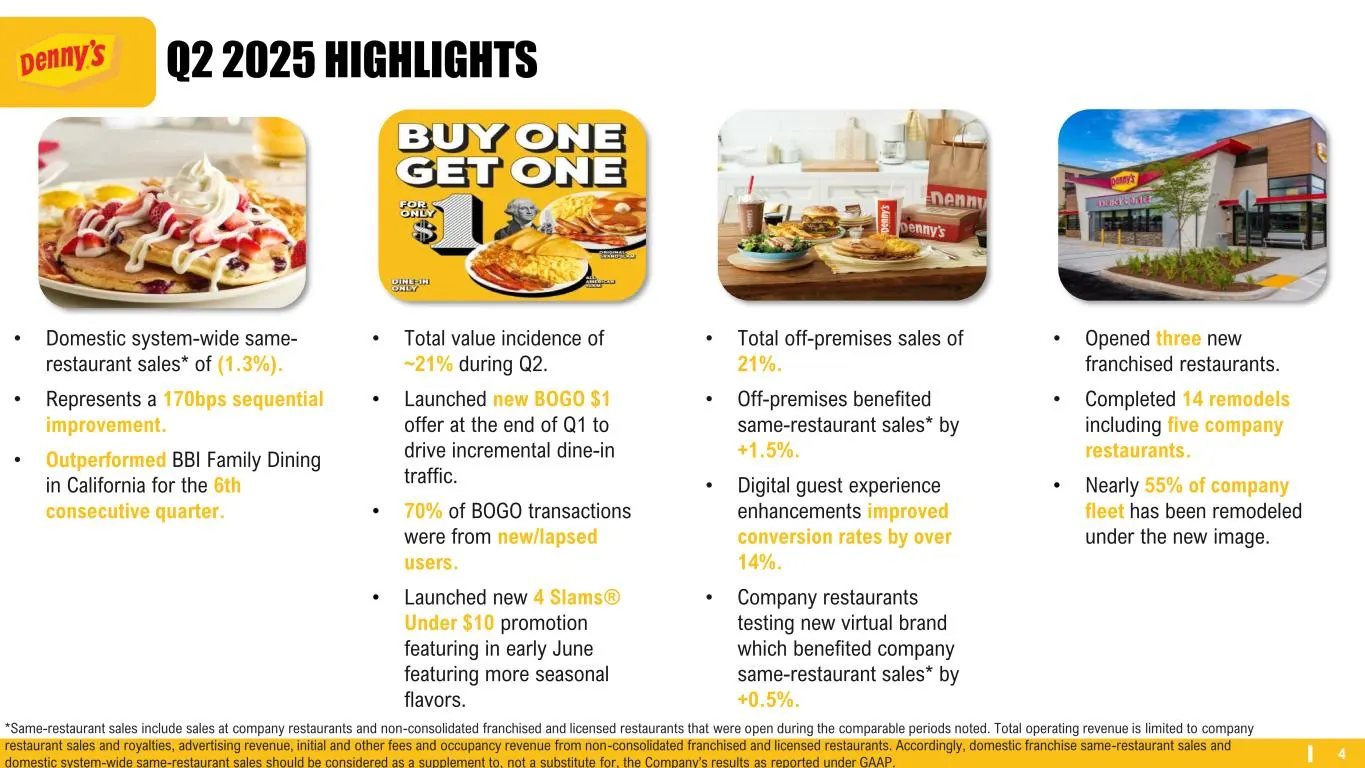
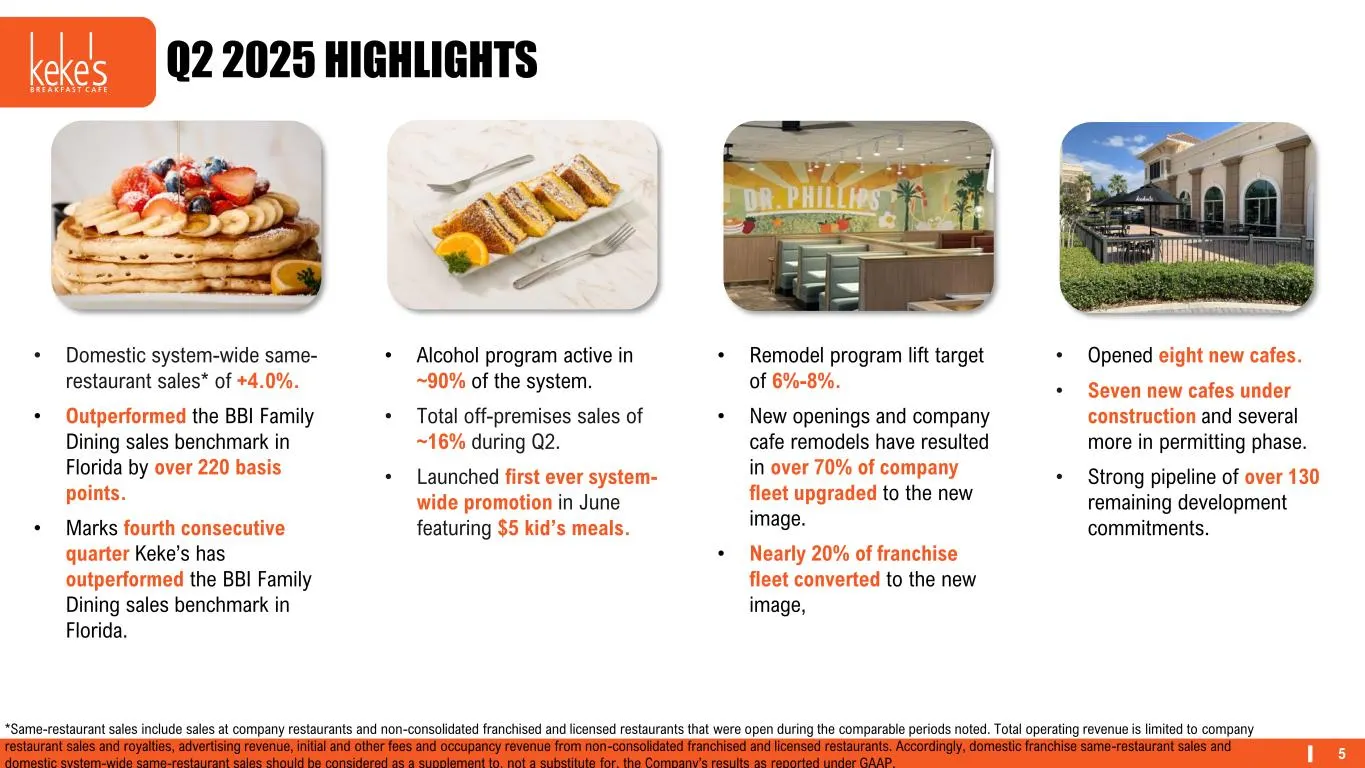
4 Q2 2025 HIGHLIGHTS • Domestic system-wide same- restaurant sales* of (1.3%). • Represents a 170bps sequential improvement. • Outperformed BBI Family Dining in California for the 6th consecutive quarter. • Total value incidence of ~21% during Q2. • Launched new BOGO $1 offer at the end of Q1 to dri
Slide 5: Q2 2025 Highlights
5 Q2 2025 HIGHLIGHTS • Alcohol program active in ~90% of the system. • Total off-premises sales of ~16% during Q2. • Launched first ever system- wide promotion in June featuring $5 kid’s meals. • Opened eight new cafes. • Seven new cafes under construction and several more in permitting phase. • Str
Slide 6: Denny's: We Love to Feed People – Body, Mind and Soul
DENNY’S We Love to Feed People – Body, Mind and Soul
Slide 7: Denny's Domestic Sales
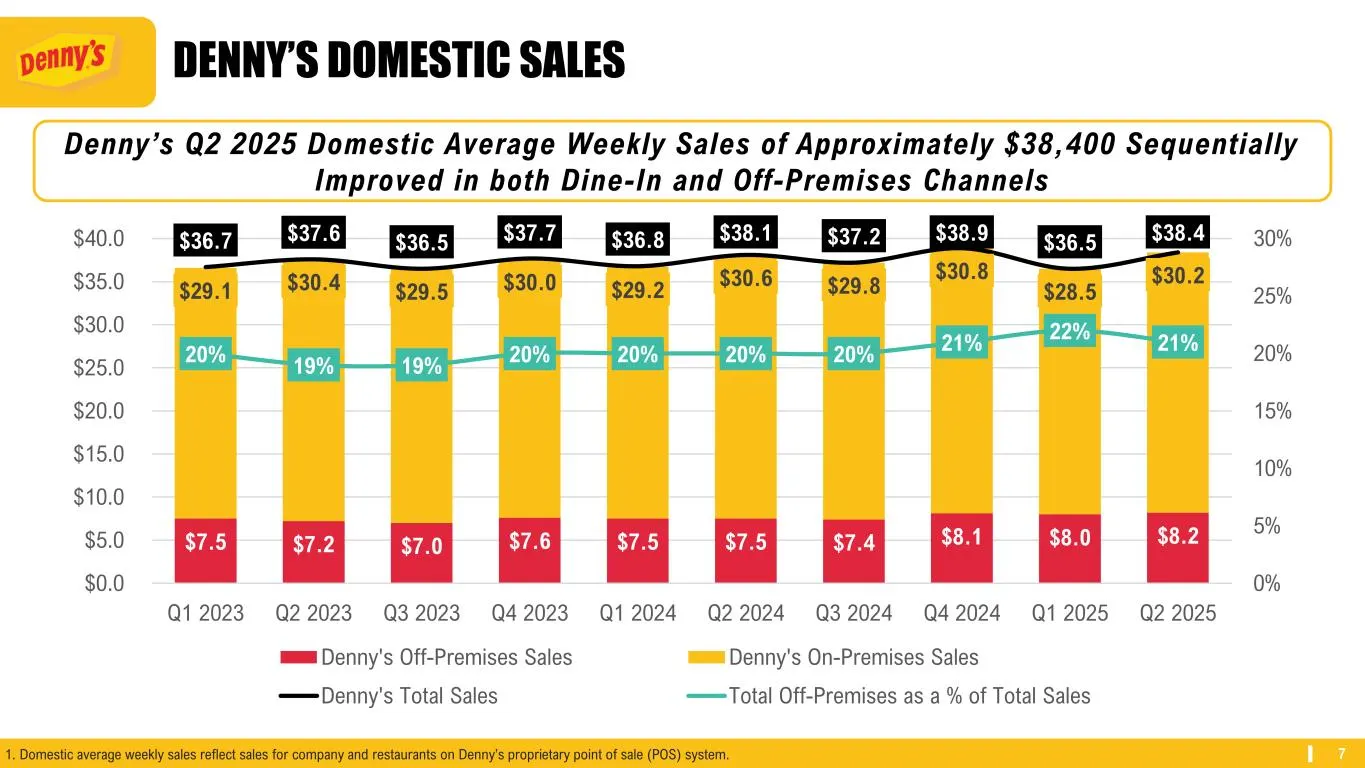
7 DENNY’S DOMESTIC SALES Denny’s Q2 2025 Domestic Average Weekly Sales of Approximately $38,400 Sequentially Improved in both Dine-In and Off-Premises Channels 1. Domestic average weekly sales reflect sales for company and restaurants on Denny’s proprietary point of sale (POS) system. $7.5 $7.2 $7.0
Slide 8: Denny's Domestic Sales Mix
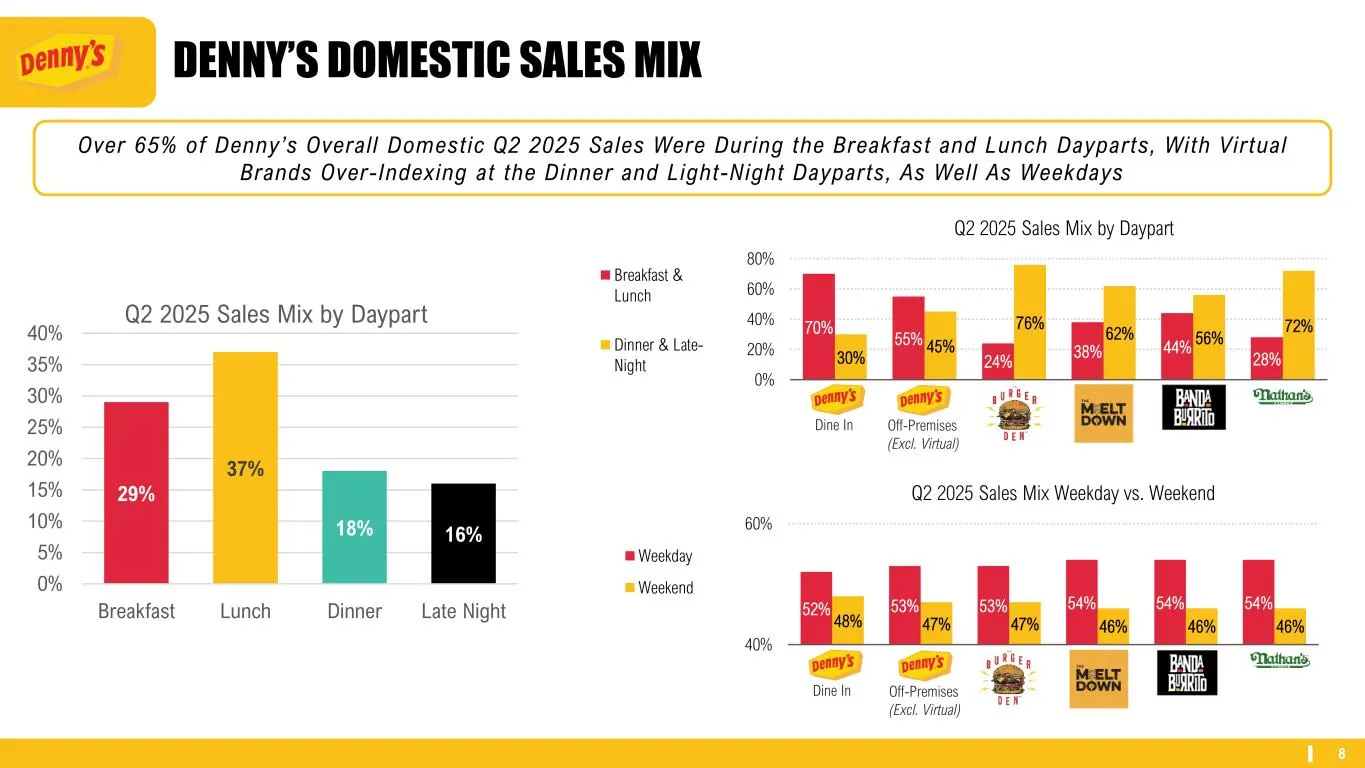
8 DENNY’S DOMESTIC SALES MIX Over 65% of Denny’s Overall Domestic Q2 2025 Sales Were During the Breakfast and Lunch Dayparts, With Virtual Brands Over-Indexing at the Dinner and Light-Night Dayparts, As Well As Weekdays 52% 53% 53% 54% 54% 54% 48% 47% 47% 46% 46% 46% 40% 60% Dine In Off-Premise The
Slide 9: Diner 2.0 Remodel Program
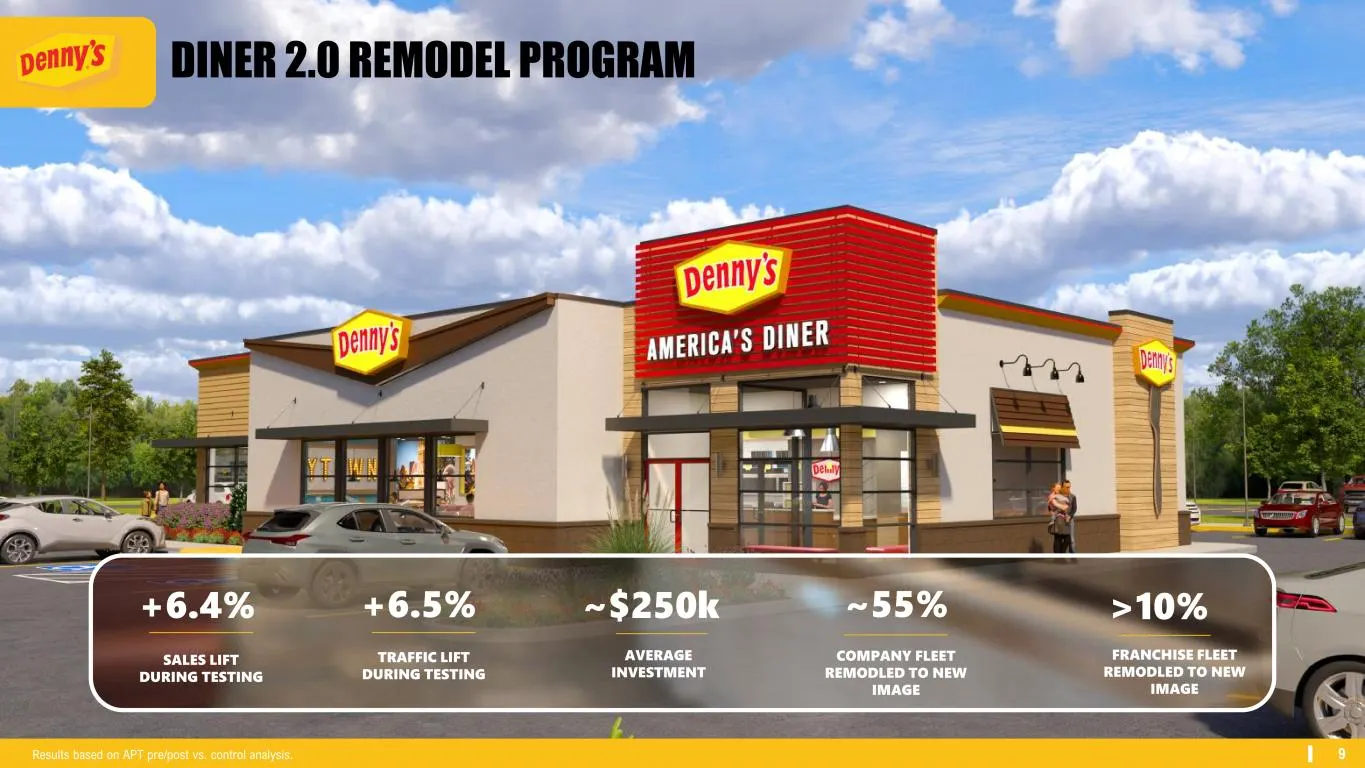
9 DINER 2.0 REMODEL PROGRAM Results based on APT pre/post vs. control analysis. +6.4% SALES LIFT DURING TESTING +6.5% TRAFFIC LIFT DURING TESTING ~$250k AVERAGE INVESTMENT ~55% COMPANY FLEET REMODLED TO NEW IMAGE >10% FRANCHISE FLEET REMODLED TO NEW IMAGE
Slide 10: Guest Feedback
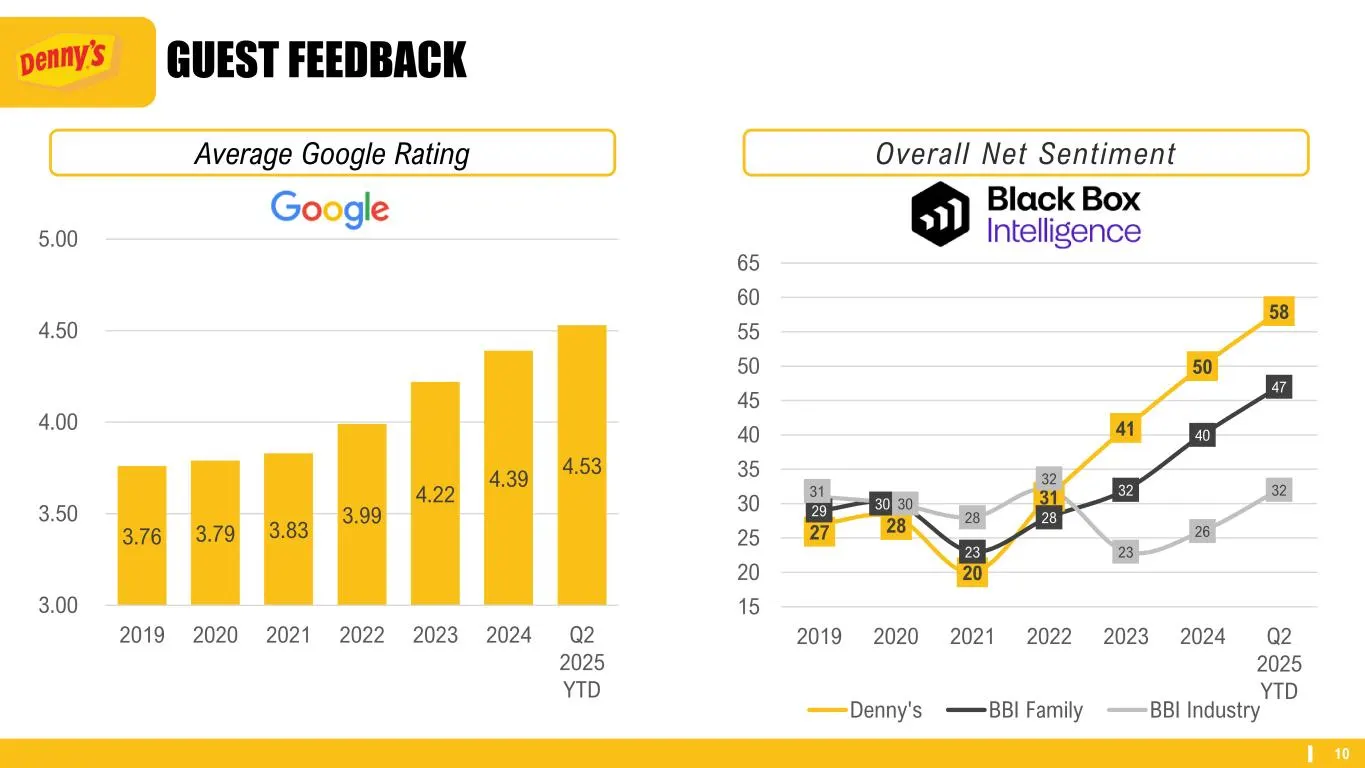
10 GUEST FEEDBACK Average Google Rating 3.76 3.79 3.83 3.99 4.22 4.39 4.53 3.00 3.50 4.00 4.50 5.00 2019 2020 2021 2022 2023 2024 Q2 2025 YTD Overall Net Sentiment 27 28 20 31 41 50 58 29 30 23 28 32 40 47 31 30 28 32 23 26 32 15 20 25 30 35 40 45 50 55 60 65 2019 2020 2021 2022 2023 2024 Q2 2025 YT
Slide 11: Denny's Footprint
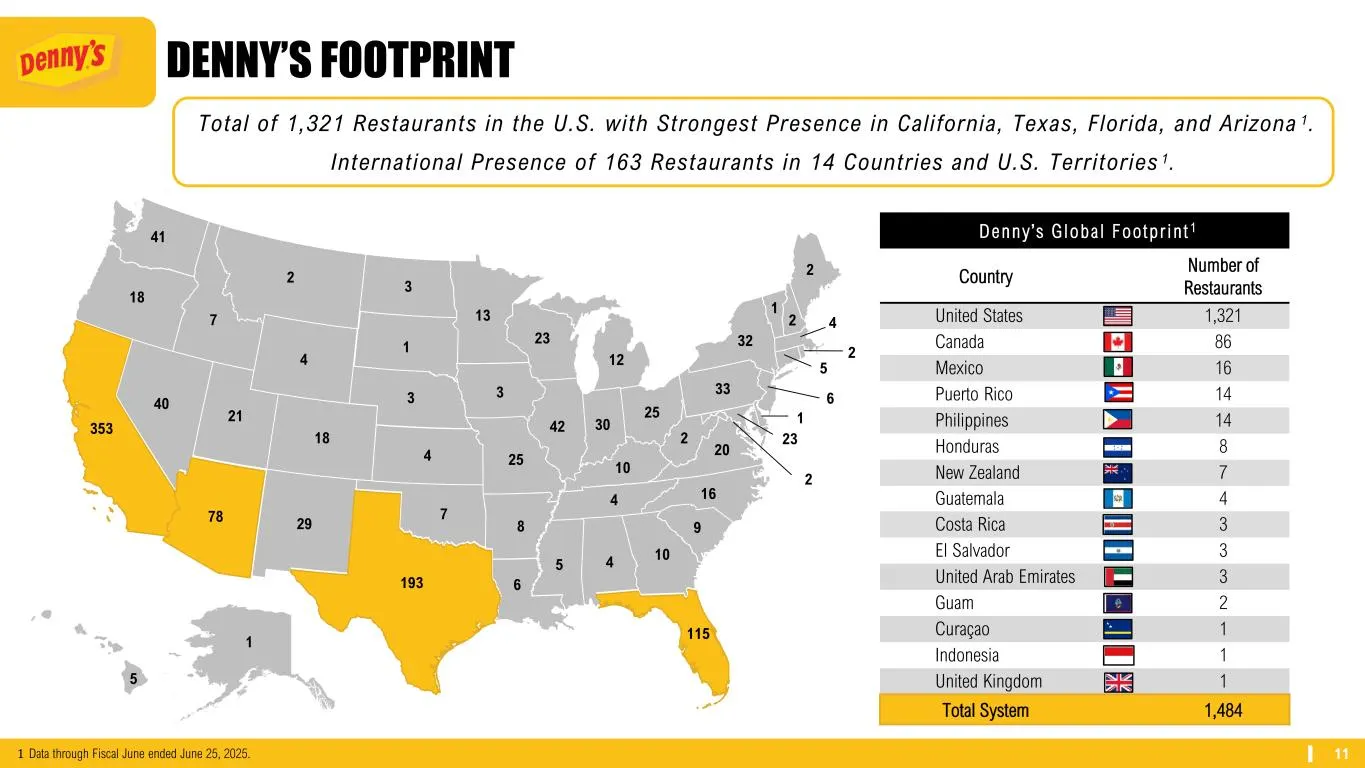
11 1 Total of 1,321 Restaurants in the U.S. with Strongest Presence in California, Texas, Florida, and Arizona 1. International Presence of 163 Restaurants in 14 Countries and U.S. Territories 1. 353 78 29 193 6 5 4 10 115 9 164 8 7 40 21 18 4 25 10 20 2 18 7 4 3 3 42 30 25 33 32 41 2 3 1 13 23 12 2
Slide 12: Strong Partnership with Franchisees
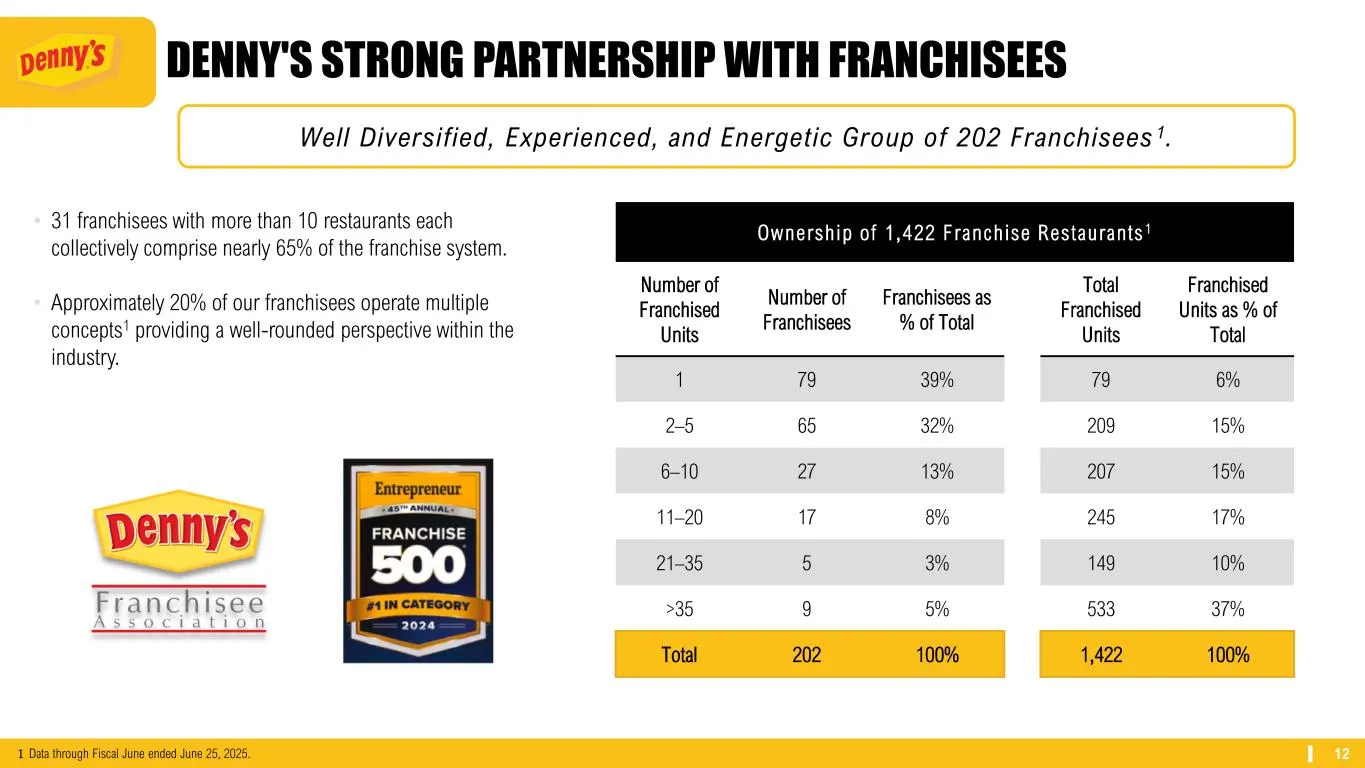
12 Well Diversified, Experienced, and Energetic Group of 202 Franchisees 1. • 31 franchisees with more than 10 restaurants each collectively comprise nearly 65% of the franchise system. • Approximately 20% of our franchisees operate multiple concepts1 providing a well-rounded perspective within the
Slide 13: Keke's Breakfast Cafe: We Create Fresh Starts for Everyone, Every Day
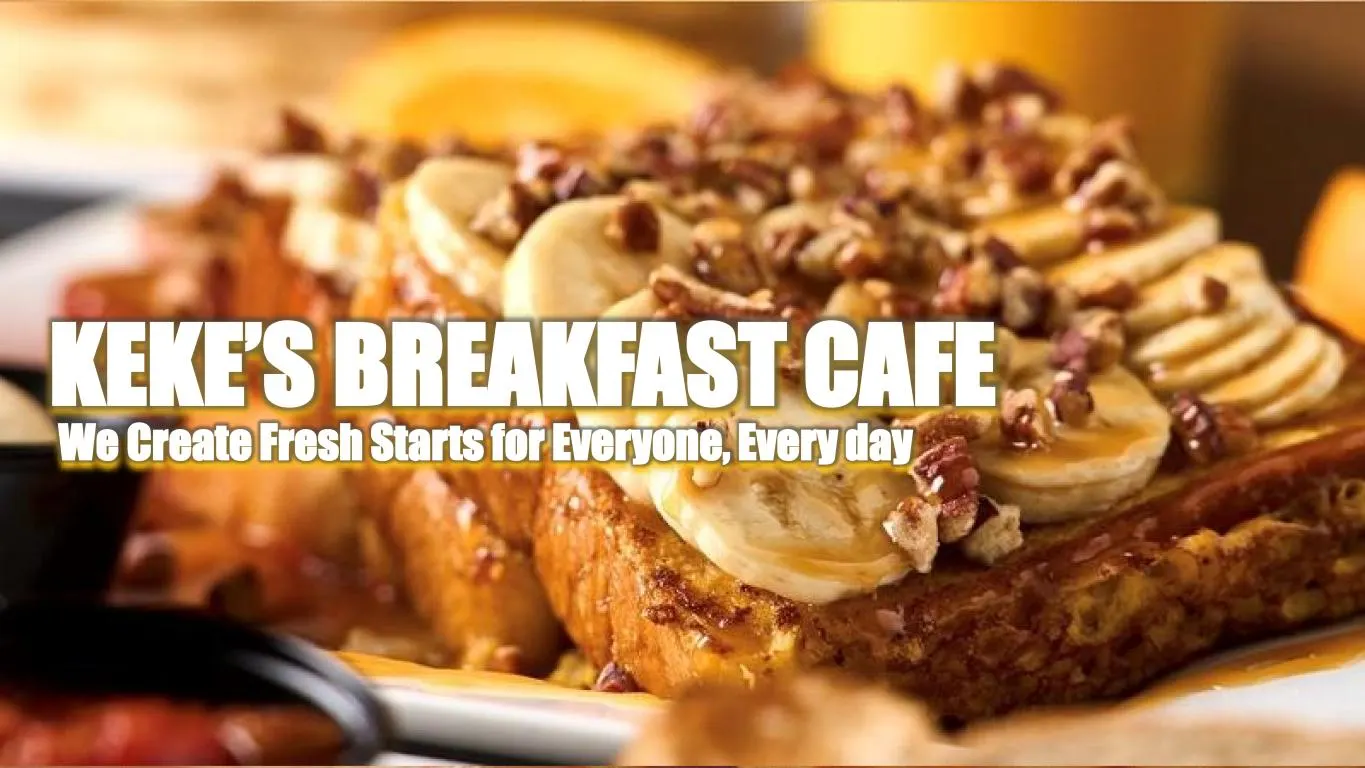
KEKE’S BREAKFAST CAFE We Create Fresh Starts for Everyone, Every day
Slide 14: Guest Feedback
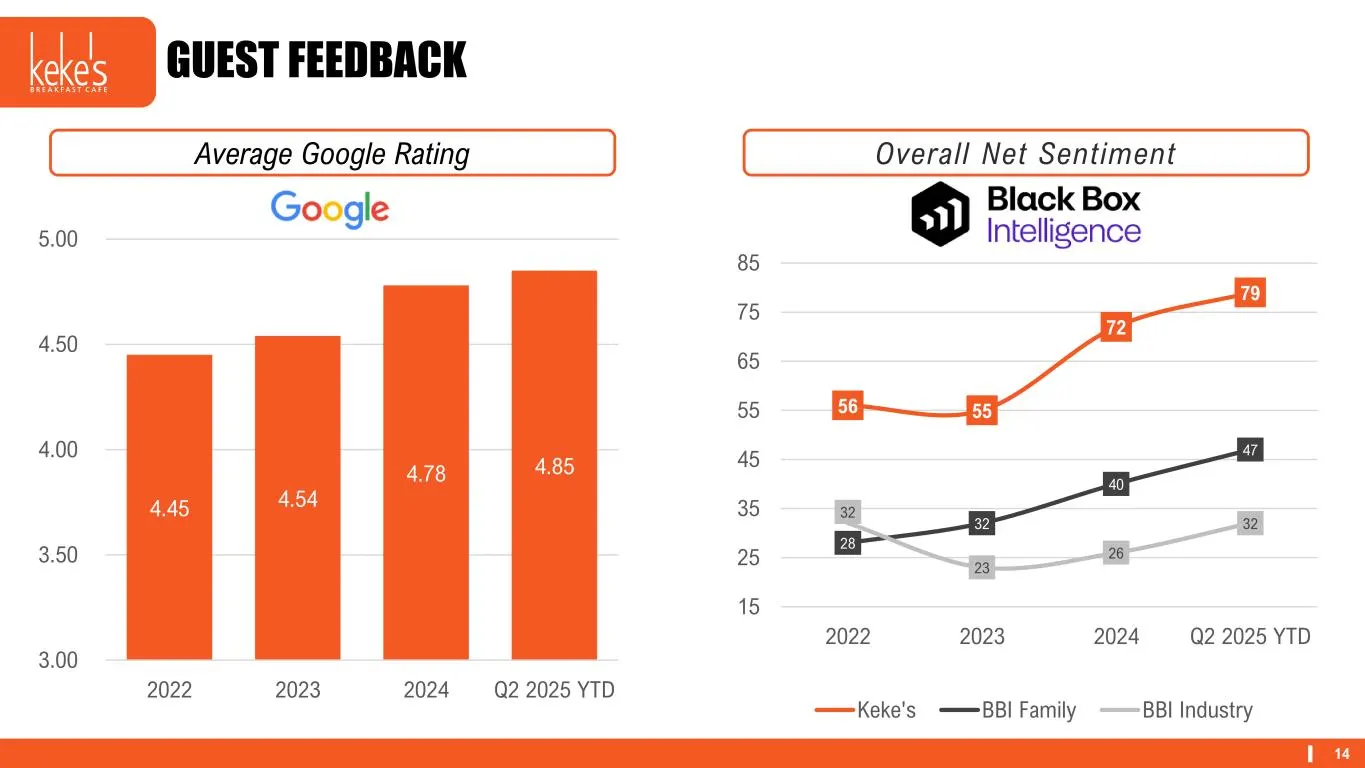
14 GUEST FEEDBACK Average Google Rating 4.45 4.54 4.78 4.85 3.00 3.50 4.00 4.50 5.00 2022 2023 2024 Q2 2025 YTD Overall Net Sentiment 56 55 72 79 28 32 40 47 32 23 26 32 15 25 35 45 55 65 75 85 2022 2023 2024 Q2 2025 YTD Keke's BBI Family BBI Industry
Slide 15: Current Design, New Design, New Keke's Design
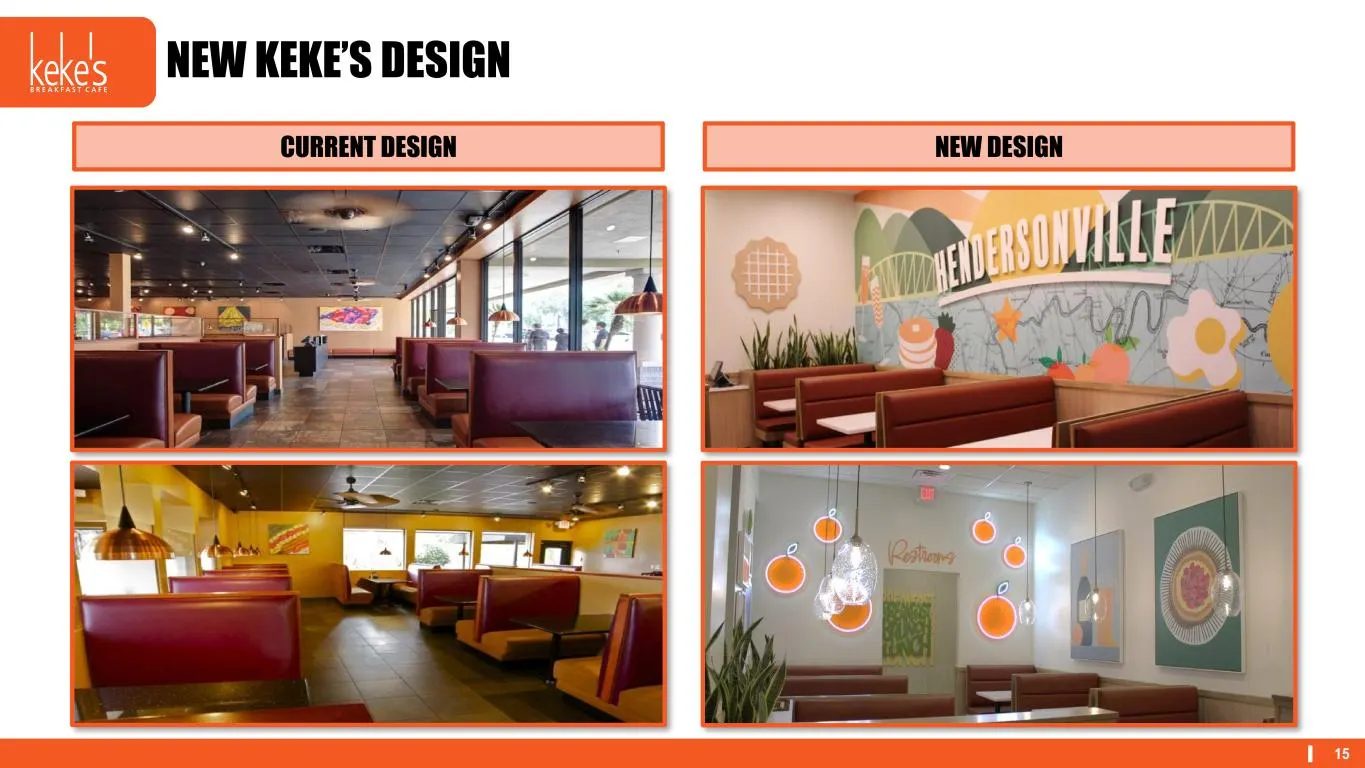
15 CURRENT DESIGN NEW DESIGN NEW KEKE’S DESIGN
Slide 16: Remodel Program Targets
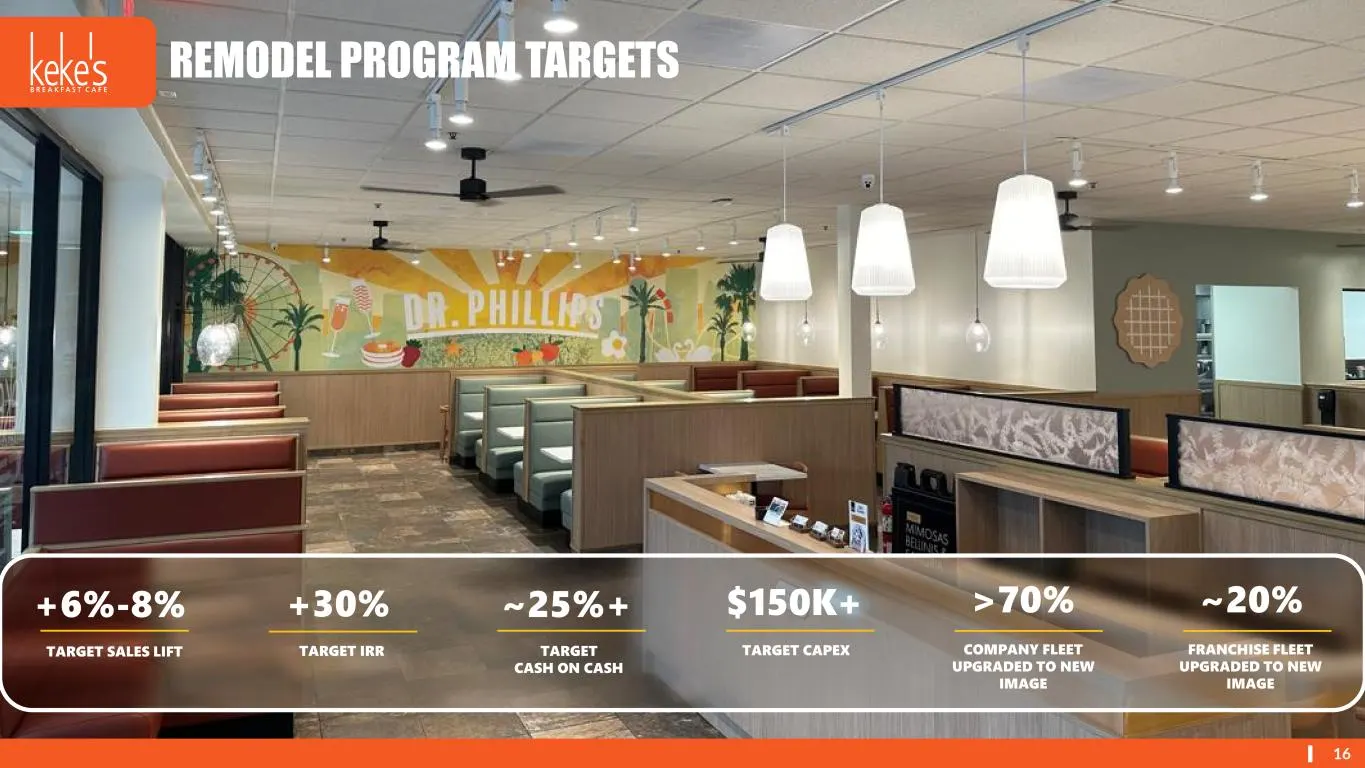
16 REMODEL PROGRAM TARGETS +6%-8% TARGET SALES LIFT +30% TARGET IRR ~25%+ TARGET CASH ON CASH $150K+ TARGET CAPEX >70% COMPANY FLEET UPGRADED TO NEW IMAGE ~20% FRANCHISE FLEET UPGRADED TO NEW IMAGE
Slide 17: Keke's Growing Partnership with Franchisees
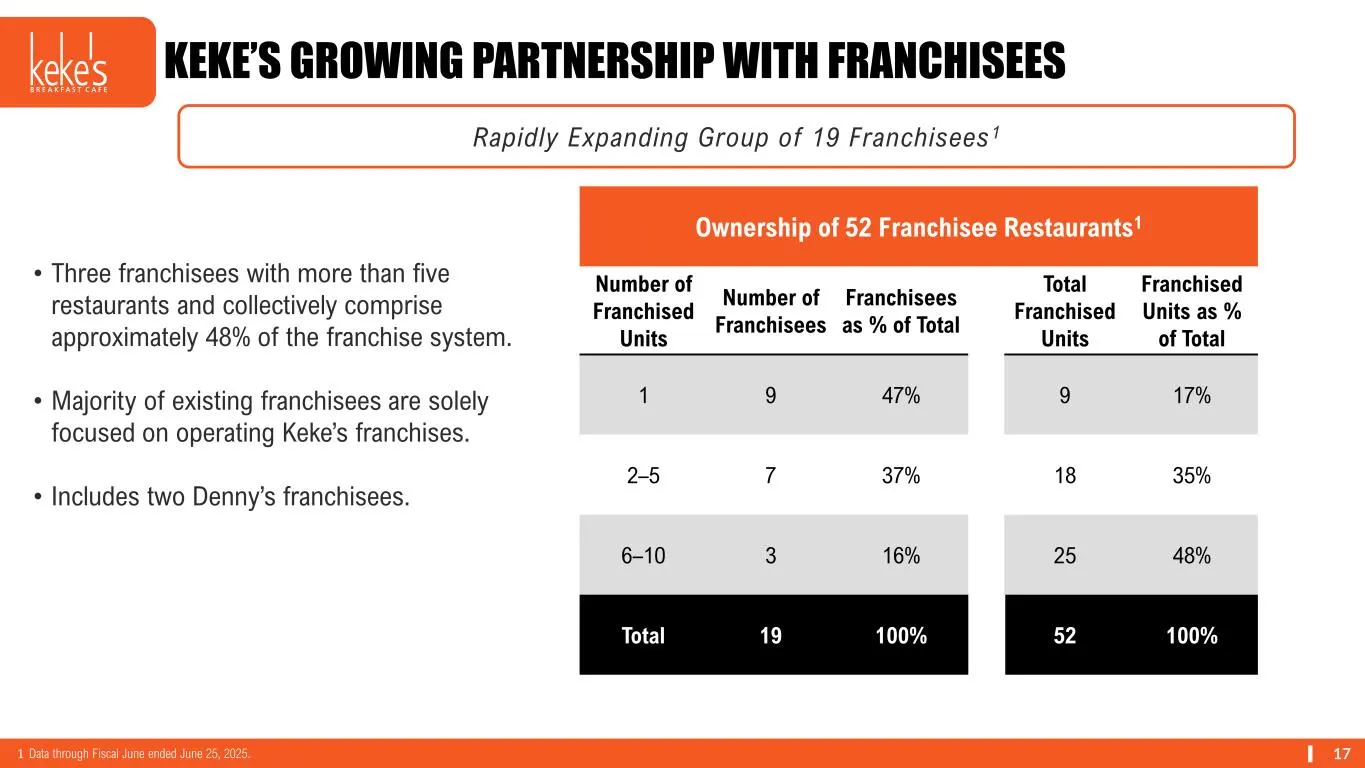
17 KEKE’S GROWING PARTNERSHIP WITH FRANCHISEES Ownership of 52 Franchisee Restaurants1 Number of Franchised Units Number of Franchisees Franchisees as % of Total Total Franchised Units Franchised Units as % of Total 1 9 47% 9 17% 2–5 7 37% 18 35% 6–10 3 16% 25 48% Total 19 100% 52 100% Rapidly Expan
Slide 18: Keke's Footprint and Development Commitments
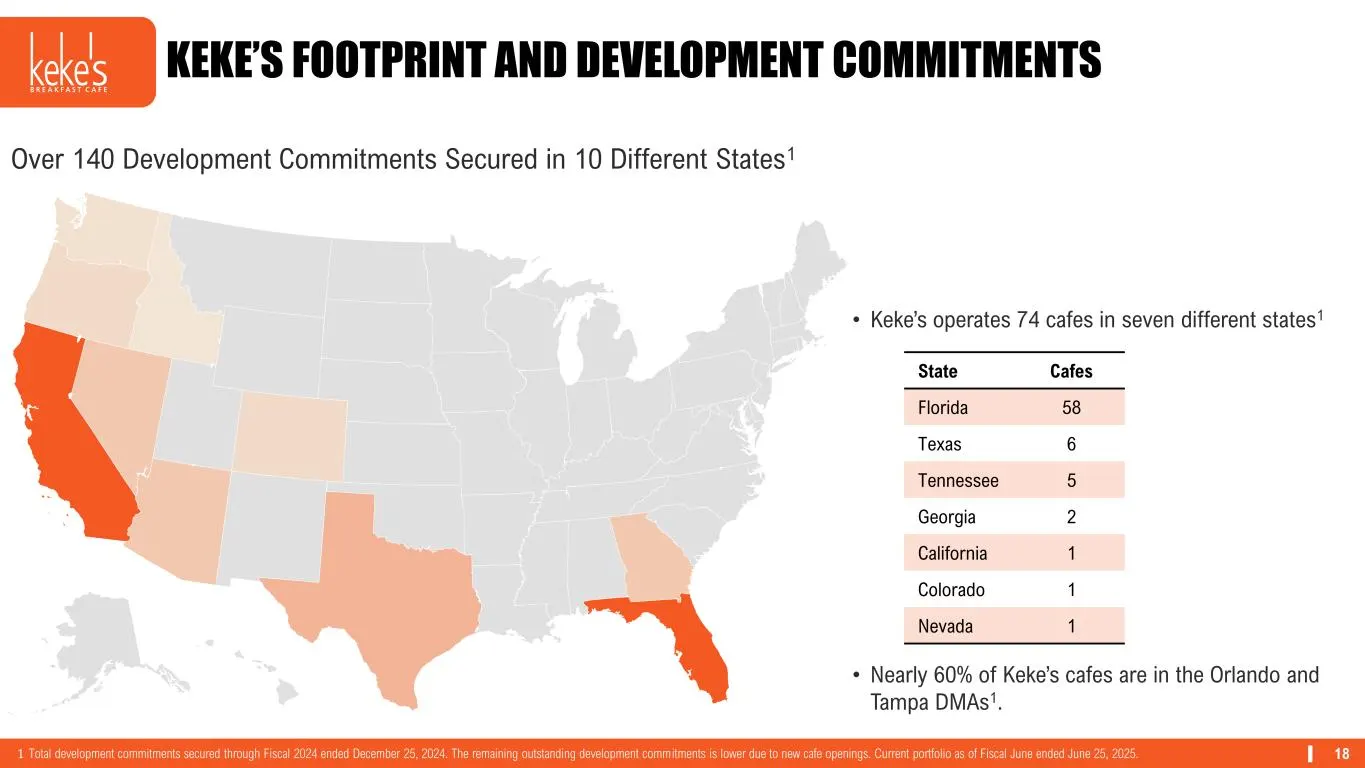
18 KEKE’S FOOTPRINT AND DEVELOPMENT COMMITMENTS © GeoNames, Microsoft, TomTom Powered by Bing Over 140 Development Commitments Secured in 10 Different States1 1 Total development commitments secured through Fiscal 2024 ended December 25, 2024. The remaining outstanding development commitments is low
Slide 19: Denny's Corporation
DENNY’S CORPORATION
Slide 20: Solid Balance Sheet with Flexibility
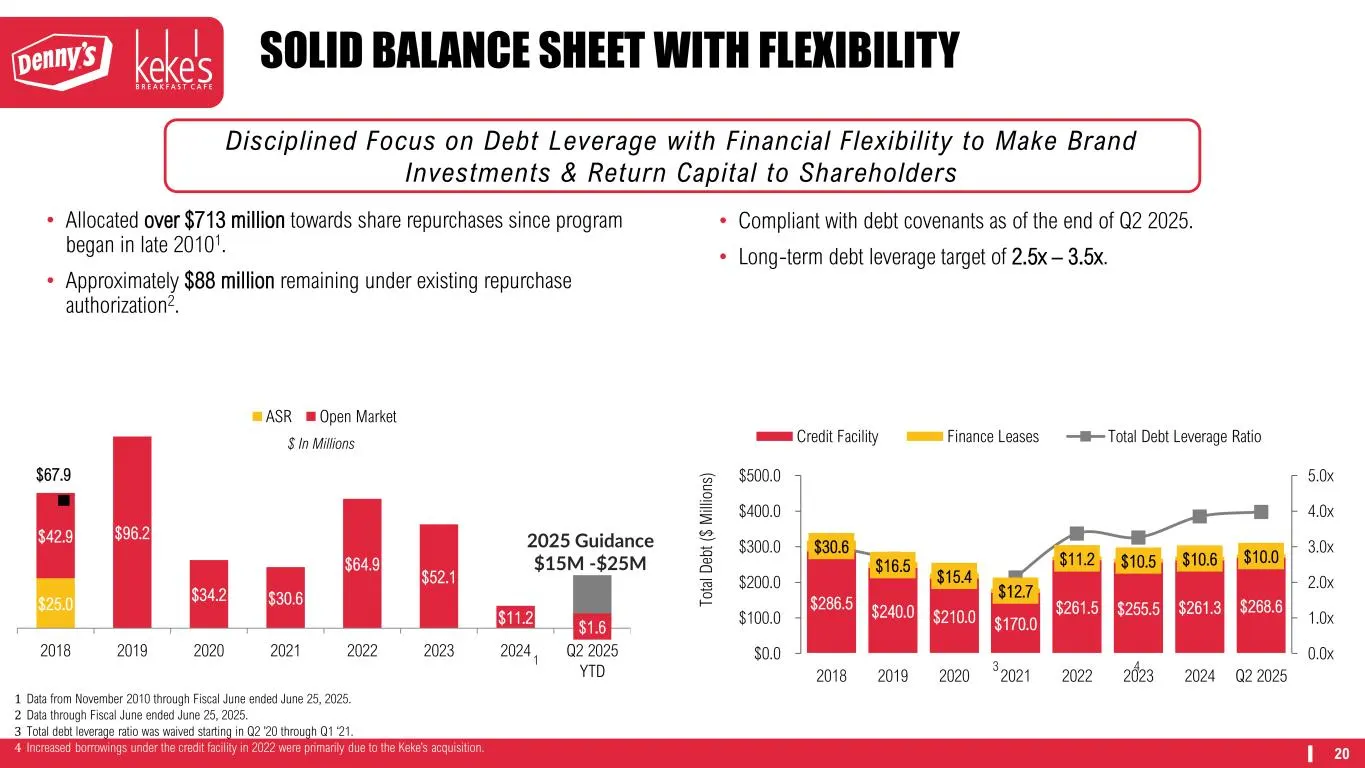
20 $286.5 $240.0 $210.0 $170.0 $261.5 $255.5 $261.3 $268.6 $30.6 $16.5 $15.4 $12.7 $11.2 $10.5 $10.6 $10.0 0.0x 1.0x 2.0x 3.0x 4.0x 5.0x 2018 2019 2020 2021 2022 2023 2024 Q2 2025 $0.0 $100.0 $200.0 $300.0 $400.0 $500.0 To ta l D eb t ( $ M ill io ns ) Credit Facility Finance Leases Total Debt Lever
Slide 21: C-R-A-V-E Strategic Framework
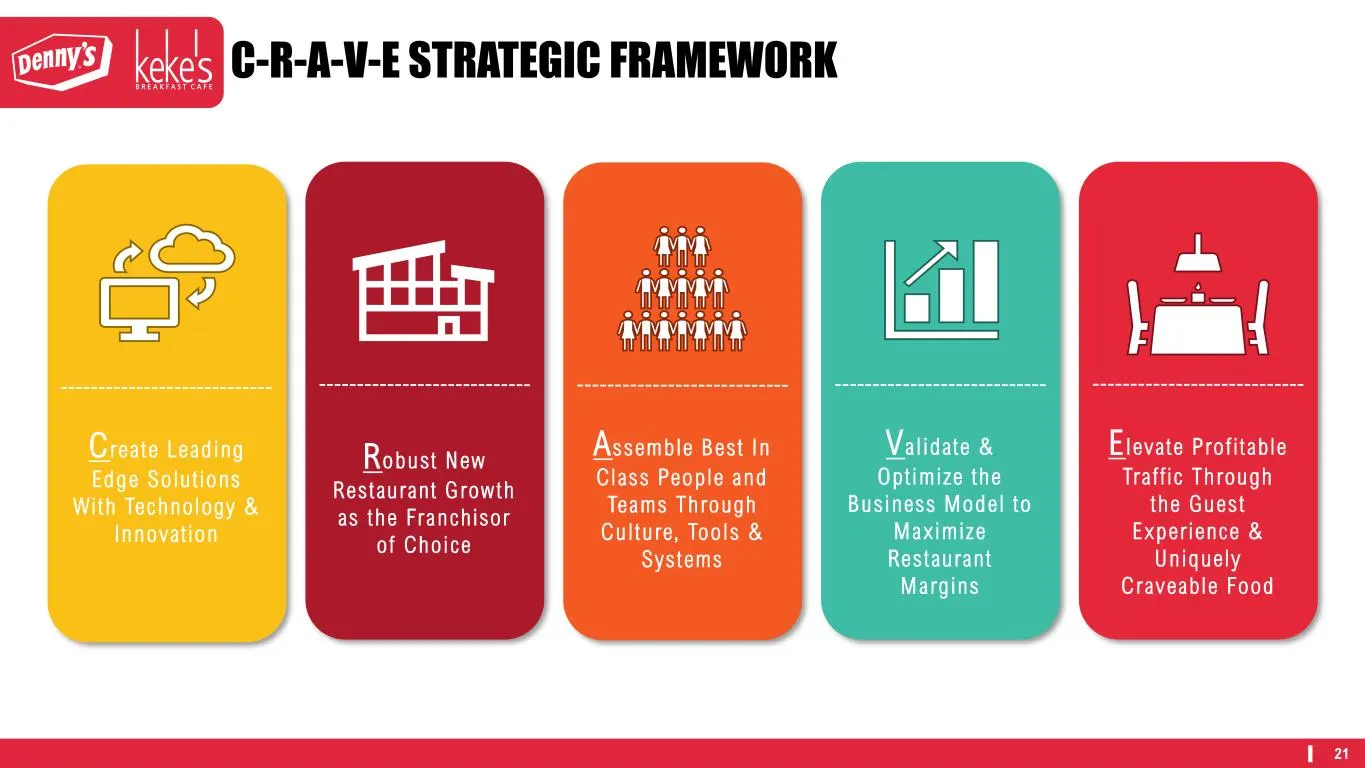
21 C-R-A-V-E STRATEGIC FRAMEWORK Va l ida te & Op t imize the Bus iness Mode l to Max imize Res taurant Marg ins E l eva te Pro f i t ab le Tra f f ic Through the Gues t Exper ience & Un iquely Craveable Food C rea te Lead ing Edge So lu t ions With Technology & Innova t ion Robust New Res taurant G
Slide 22: Long-Range Outlook: Rise of a New Day
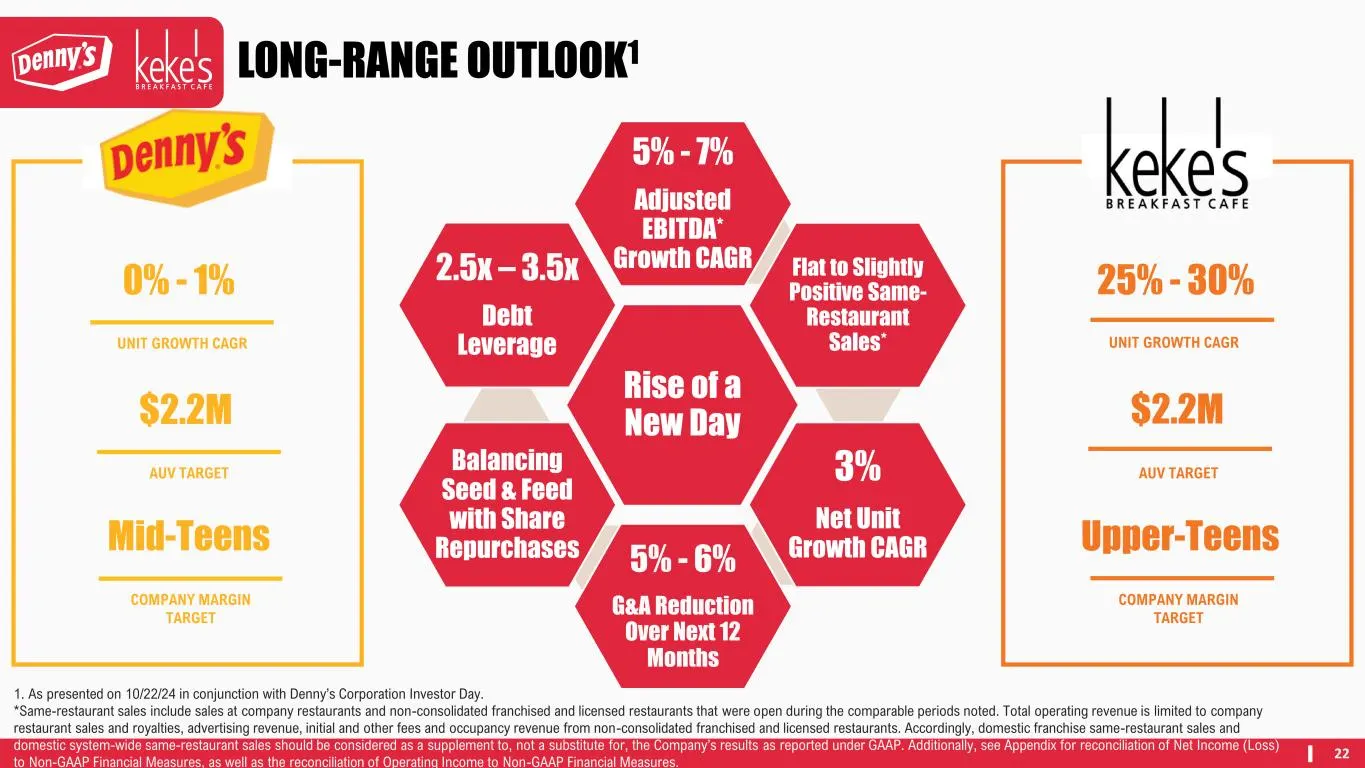
22 Rise of a New Day 5% - 7% Adjusted EBITDA* Growth CAGR Flat to Slightly Positive Same- Restaurant Sales* 3% Net Unit Growth CAGR5% - 6% G&A Reduction Over Next 12 Months Balancing Seed & Feed with Share Repurchases 2.5x – 3.5x Debt Leverage LONG-RANGE OUTLOOK1 0% - 1% UNIT GROWTH CAGR $2.2M AUV T
Slide 23: Appendix
APPENDIX
Slide 24: Franchised and Company Restaurant Sales
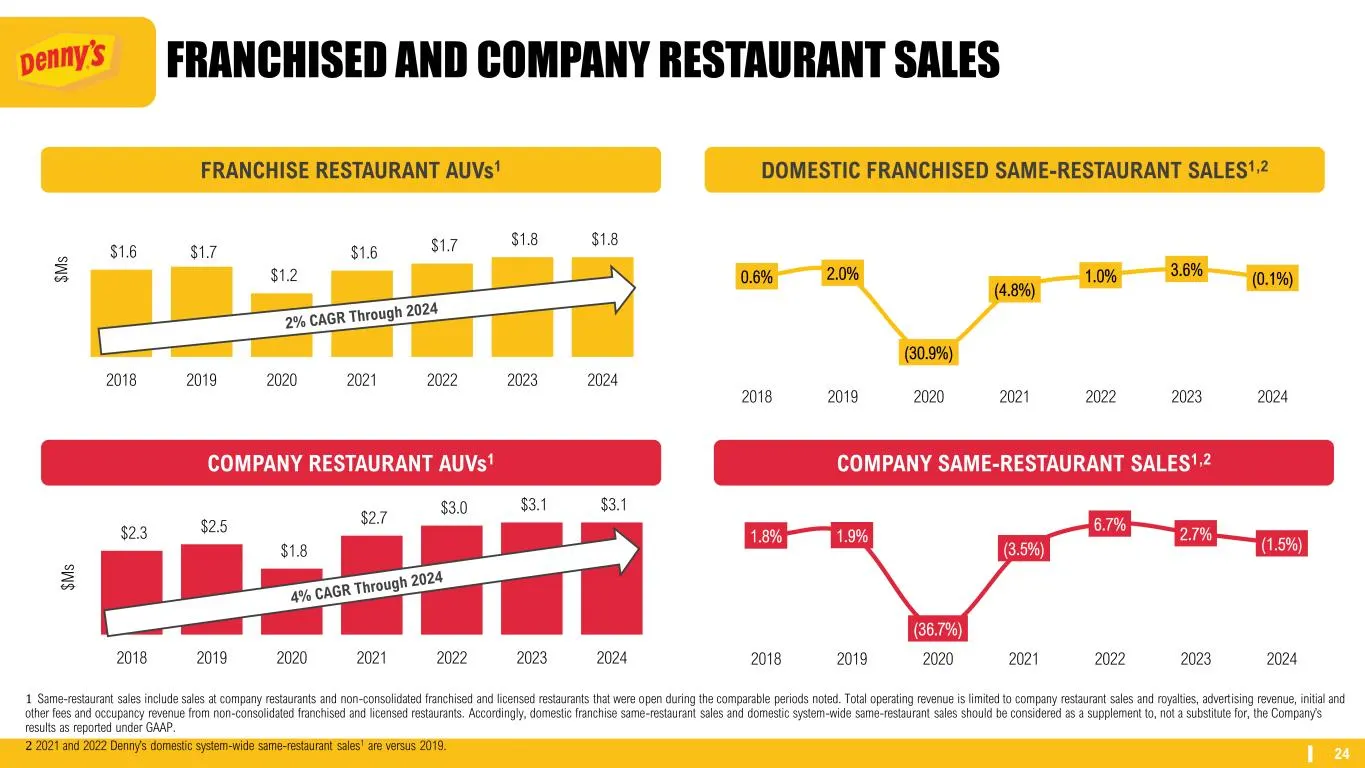
24 FRANCHISED AND COMPANY RESTAURANT SALES 1 Same-restaurant sales include sales at company restaurants and non-consolidated franchised and licensed restaurants that were open during the comparable periods noted. Total operating revenue is limited to company restaurant sales and royalties, advertisi
Slide 25: Keke's Franchised and Company Restaurant Sales
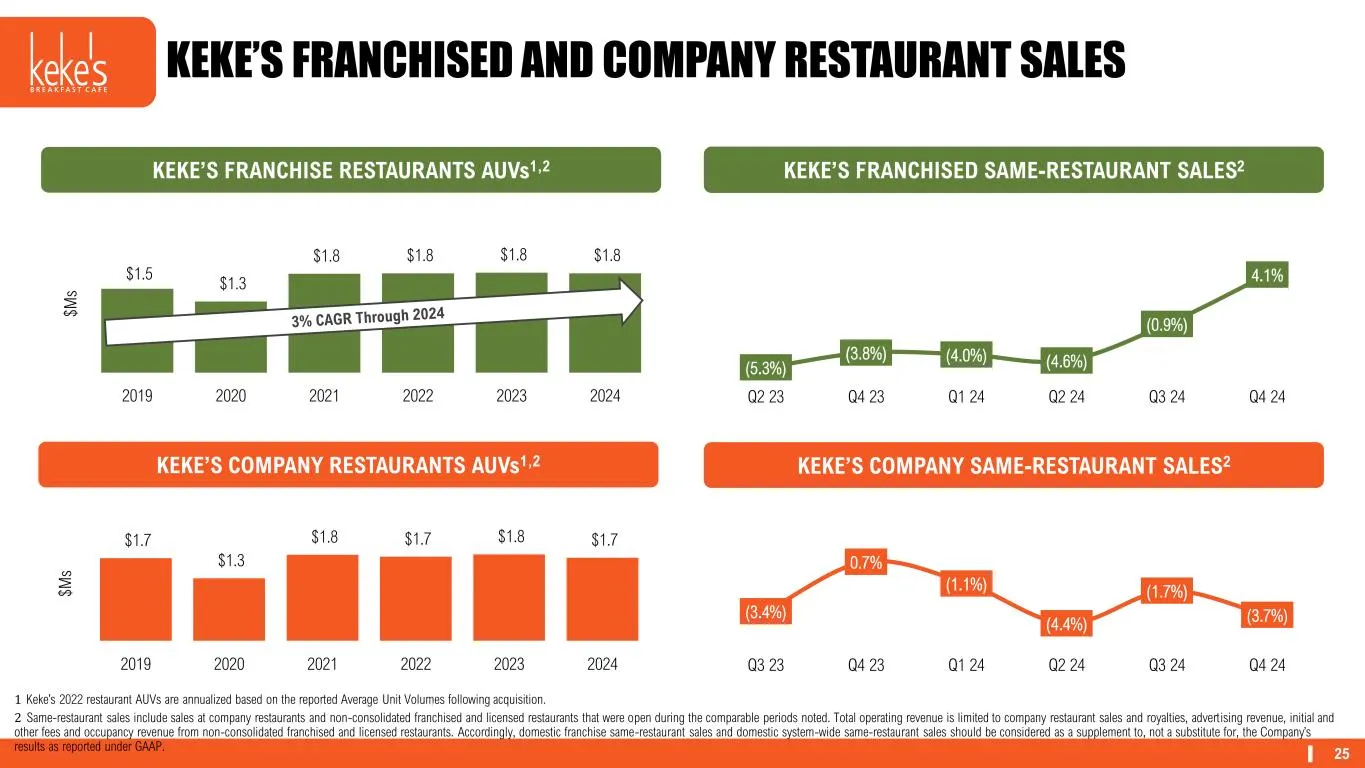
25 (5.3%) (3.8%) (4.0%) (4.6%) (0.9%) 4.1% Q2 23 Q4 23 Q1 24 Q2 24 Q3 24 Q4 24 (3.4%) 0.7% (1.1%) (4.4%) (1.7%) (3.7%) Q3 23 Q4 23 Q1 24 Q2 24 Q3 24 Q4 24 KEKE’S FRANCHISED AND COMPANY RESTAURANT SALES 1 Keke’s 2022 restaurant AUVs are annualized based on the reported Average Unit Volumes following
Slide 26: Brand Portfolios
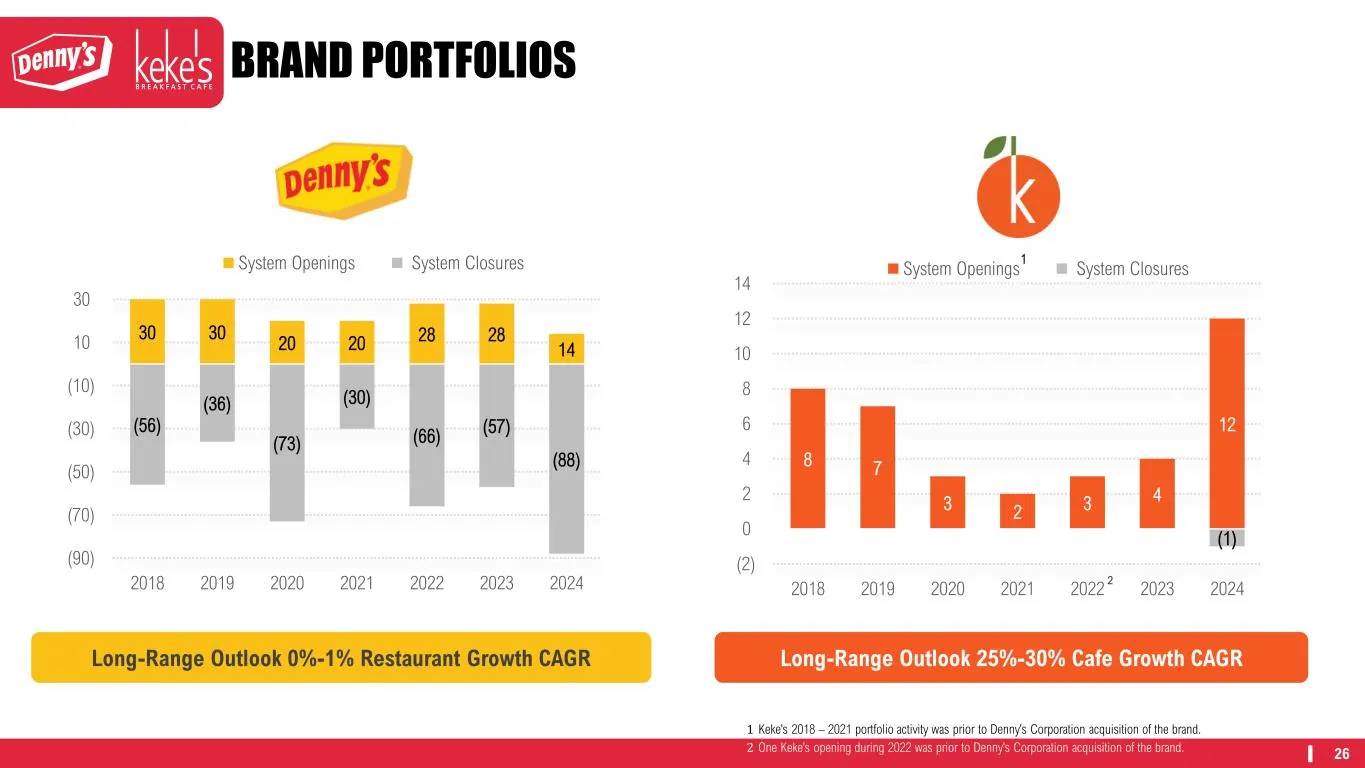
26 BRAND PORTFOLIOS 30 30 20 20 28 28 14 (56) (36) (73) (30) (66) (57) (88) (90) (70) (50) (30) (10) 10 30 2018 2019 2020 2021 2022 2023 2024 System Openings System Closures 8 7 3 2 3 4 12 (1) (2) 0 2 4 6 8 10 12 14 2018 2019 2020 2021 2022 2023 2024 System Openings System Closures 1 Keke’s 2018 – 2
Slide 27: Non-GAAP Financial Measures
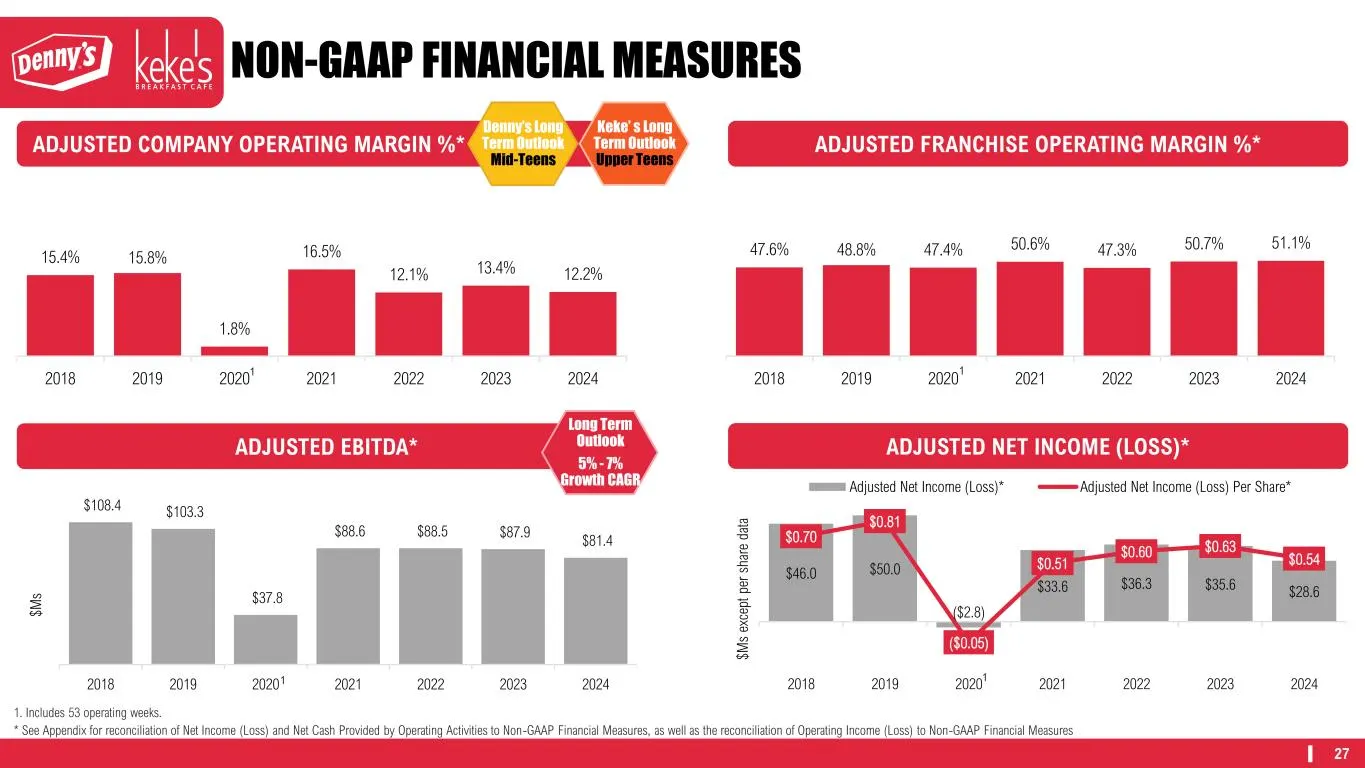
27 NON-GAAP FINANCIAL MEASURES 1. Includes 53 operating weeks. * See Appendix for reconciliation of Net Income (Loss) and Net Cash Provided by Operating Activities to Non-GAAP Financial Measures, as well as the reconciliation of Operating Income (Loss) to Non-GAAP Financial Measures 15.4% 15.8% 1.8%
Slide 28: Experienced and Committed Leadership Team
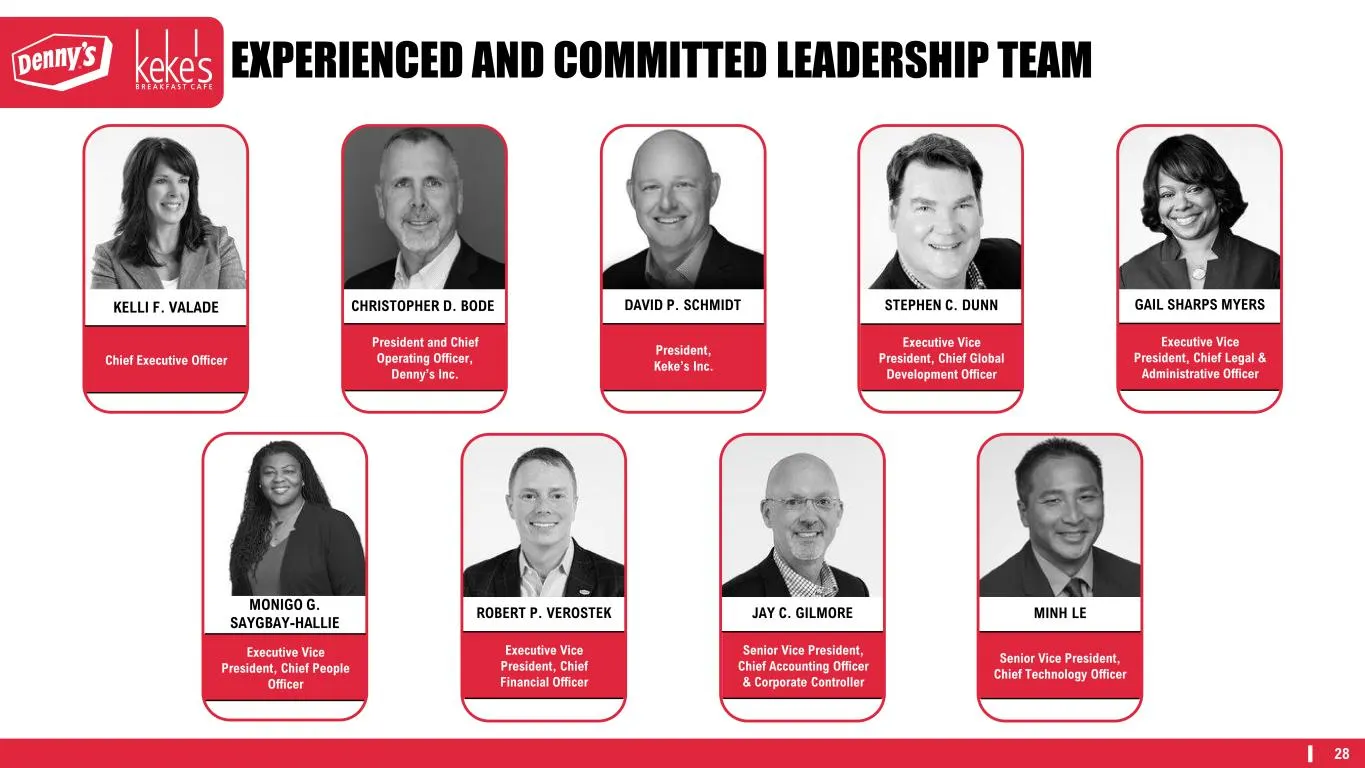
28 EXPERIENCED AND COMMITTED LEADERSHIP TEAM KELLI F. VALADE Chief Executive Officer CHRISTOPHER D. BODE President and Chief Operating Officer, Denny’s Inc. DAVID P. SCHMIDT President, Keke’s Inc. STEPHEN C. DUNN Executive Vice President, Chief Global Development Officer GAIL SHARPS MYERS Executive
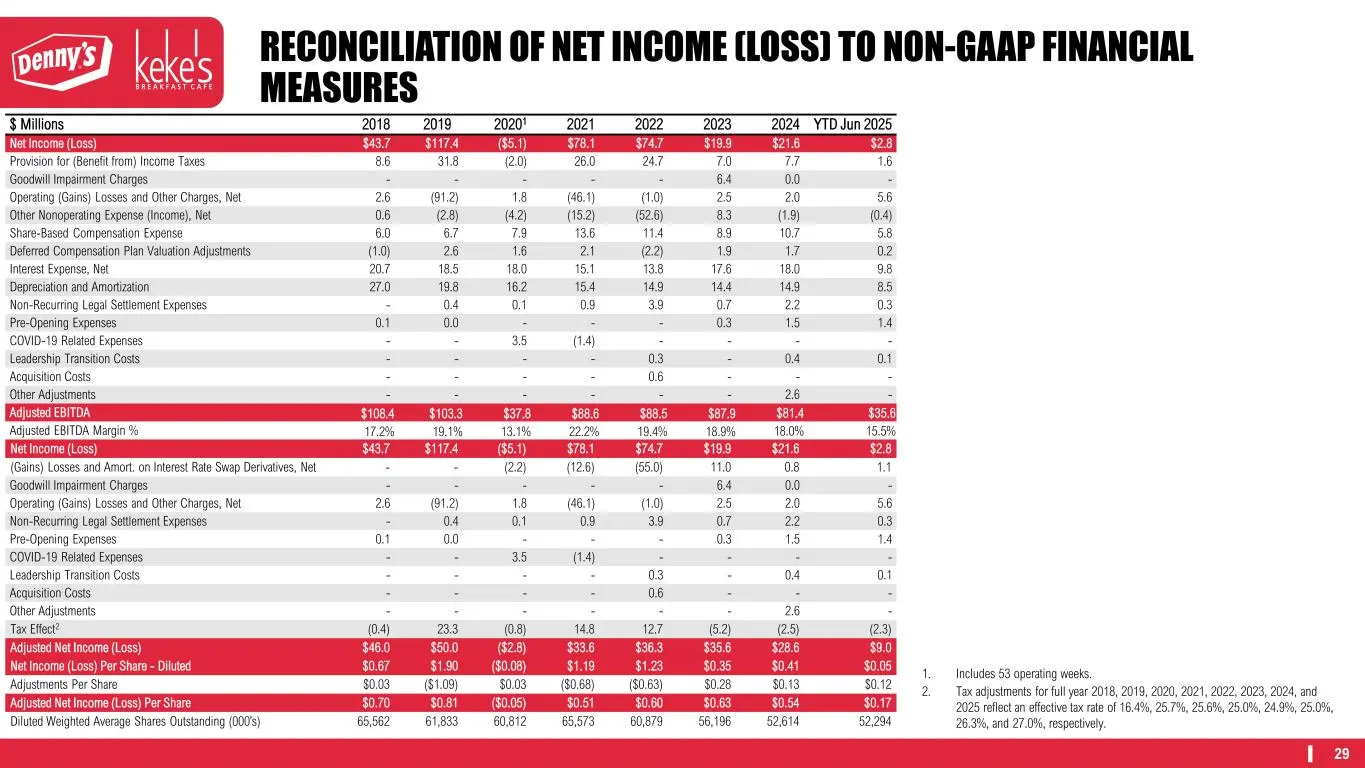
Slide 29: Net Income to Non-GAAP Reconciliation
29 $ Millions 2018 2019 20201 2021 2022 2023 2024 YTD Jun 2025 Net Income (Loss) $43.7 $117.4 ($5.1) $78.1 $74.7 $19.9 $21.6 $2.8 Provision for (Benefit from) Income Taxes 8.6 31.8 (2.0) 26.0 24.7 7.0 7.7 1.6 Goodwill Impairment Charges - - - - - 6.4 0.0 - Operating (Gains) Losses and Other Charges,
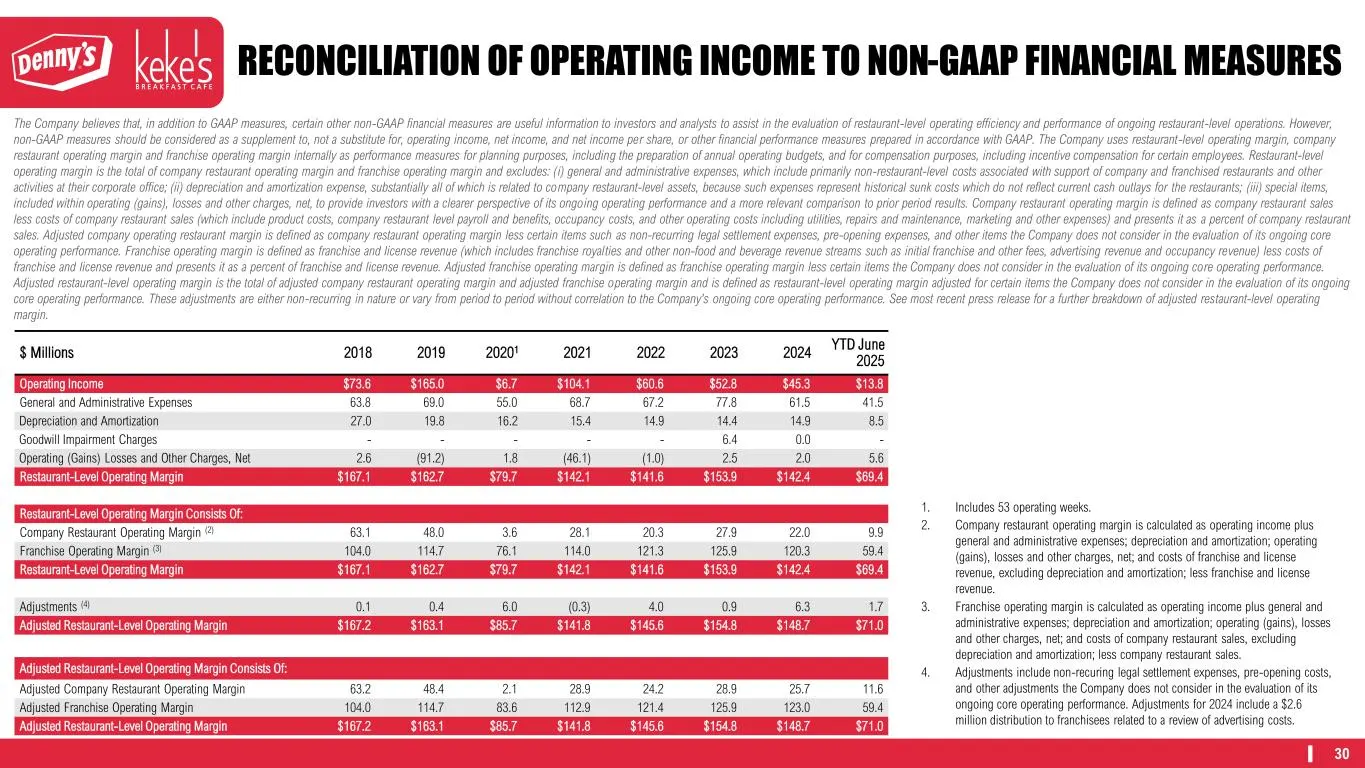
Slide 30: Operating Income to Non-GAAP Reconciliation
30 $ Millions 2018 2019 20201 2021 2022 2023 2024 YTD June 2025 Operating Income $73.6 $165.0 $6.7 $104.1 $60.6 $52.8 $45.3 $13.8 General and Administrative Expenses 63.8 69.0 55.0 68.7 67.2 77.8 61.5 41.5 Depreciation and Amortization 27.0 19.8 16.2 15.4 14.9 14.4 14.9 8.5 Goodwill Impairment Charg
Source: SEC EDGAR · 8-K filed Aug 4, 2025
More decks from Dennys Corp
 Investor Presentation (May 2025)32 slides · May 2025
 Investor Presentation (February 2025)32 slides · February 2025
 Investor Presentation (January 2025)32 slides · Jan 13, 2025
 Investor Day (October 2024)137 slides · Oct 22, 2024
 Q2 2024 Earnings Presentation22 slides · Jul 30, 2024
 Q1 2024 Earnings Presentation21 slides · April 2024