National Penn Bancshares — Q3 2011 Earnings Presentation
19 slides from National Penn Bancshares's earnings presentation, Oct 28, 2011

Slide 1: National Penn Bancshares, Inc. 3rd Quarter 2011 Earnings Webcast
National Penn Bancshares, Inc. 3 nd Quarter 2011 Earnings Webcast

Slide 2: Safe Harbor Regarding Forward Looking Statements
Safe Harbor Regarding Forward Looking Statements This presentation contains forward-looking information about National Penn Bancshares, Inc. that is intended to be covered by the safe harbor for forward-looking statements provided by the Private Securities Litigation Reform Act of 1995. Forward-look

Slide 3: 3Q 2011 Highlights
3Q 2011 Highlights • Continued strong earnings and returns • Continued improvement in asset quality • Continued strengthening of the balance sheet • Positioning the company for future growth
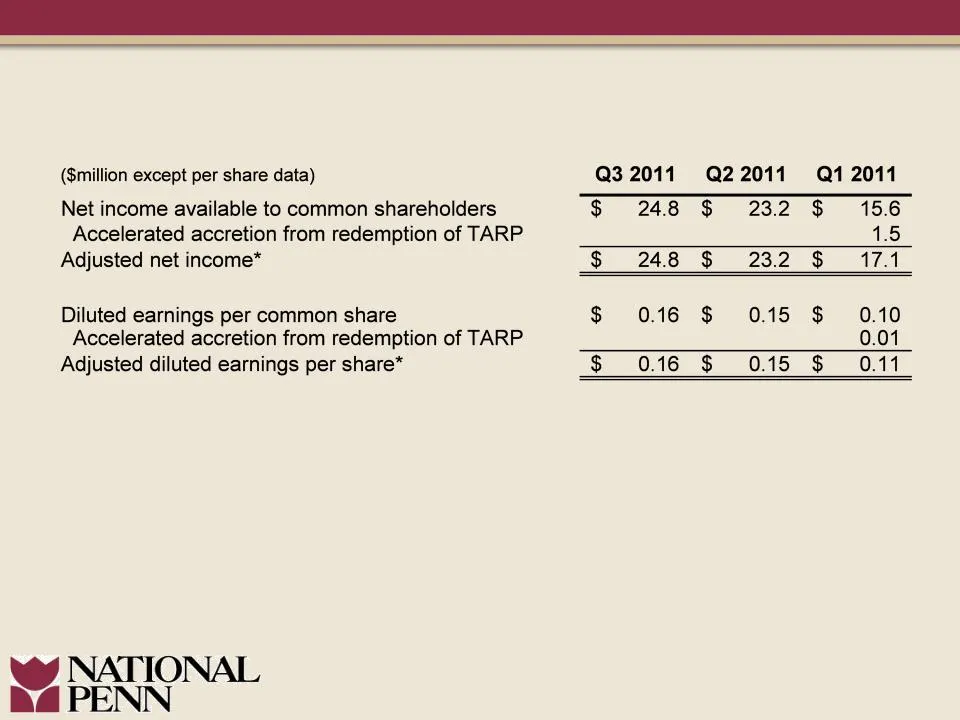
Slide 4: Quarterly Earnings
Quarterly Earnings *A non-GAAP measure.
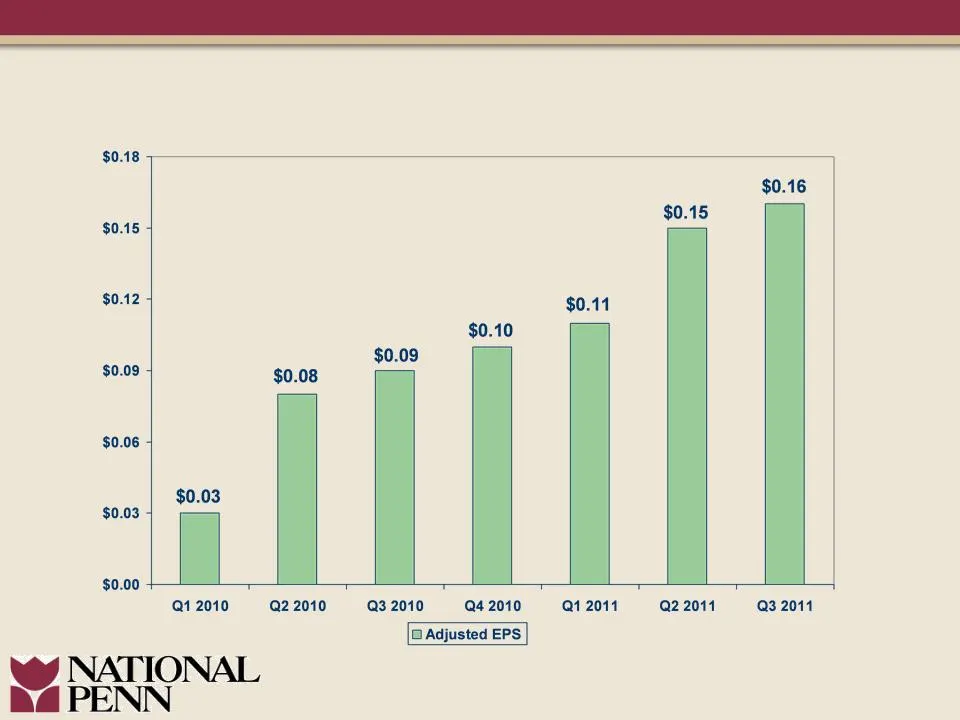
Slide 5: Improving Adjusted Earnings Per Share*
Improving Adjusted Earnings Per Share* *Refer to Appendix for reconciliation of Non-GAAP measure
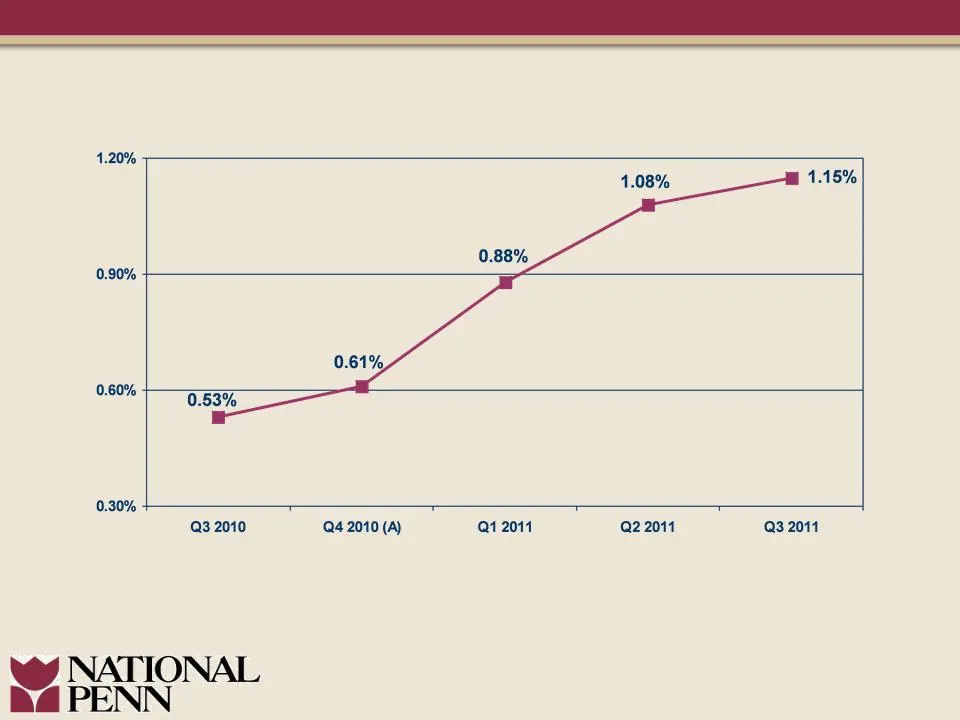
Slide 6: Positive Return on Asset Trend
Positive Return on Asset Trend (A) Excludes charges associated with the divestiture of Christiana Bank & Trust Company on December 3, 2010
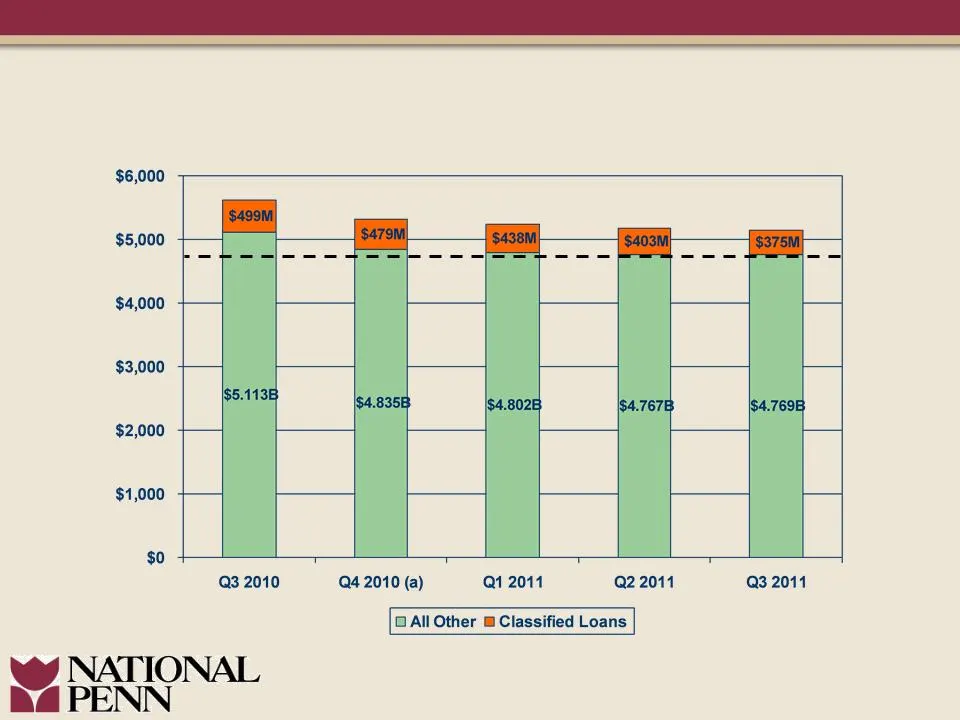
Slide 7: Loan Balances Stable
Loan Balances Stable ($million) (a) Christiana Bank & Trust Company divested on December 3, 2010.
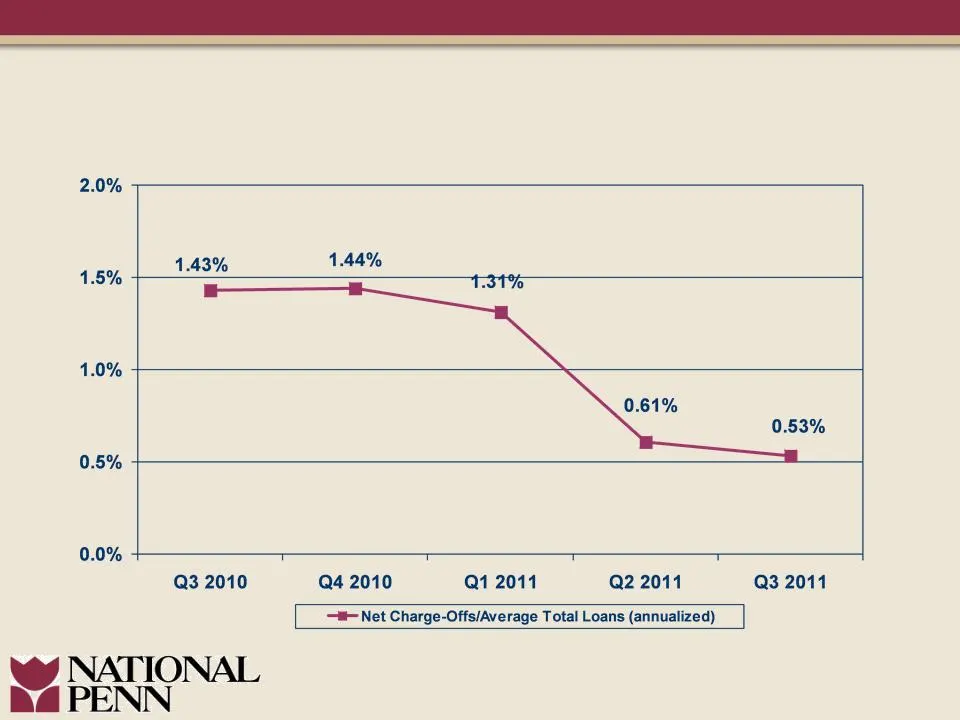
Slide 8: Sustained Asset Quality Improvement
Sustained Asset Quality Improvement Net Charge-Offs/Average Loans
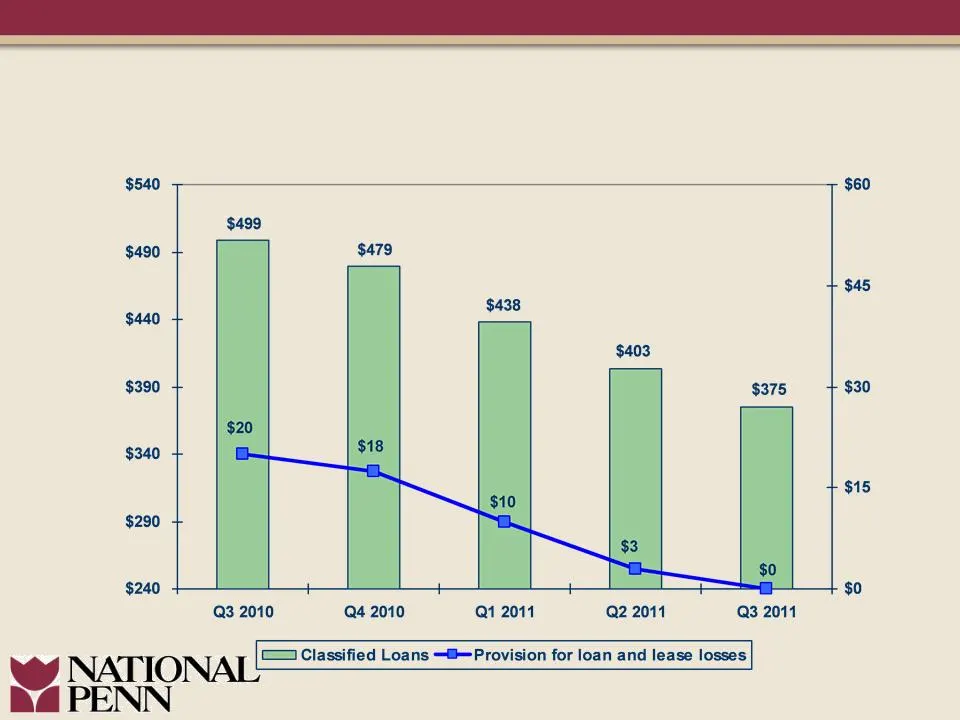
Slide 9: Sustained Asset Quality Improvement
Sustained Asset Quality Improvement Classified Loans & Provision Trends ($million) ($million)
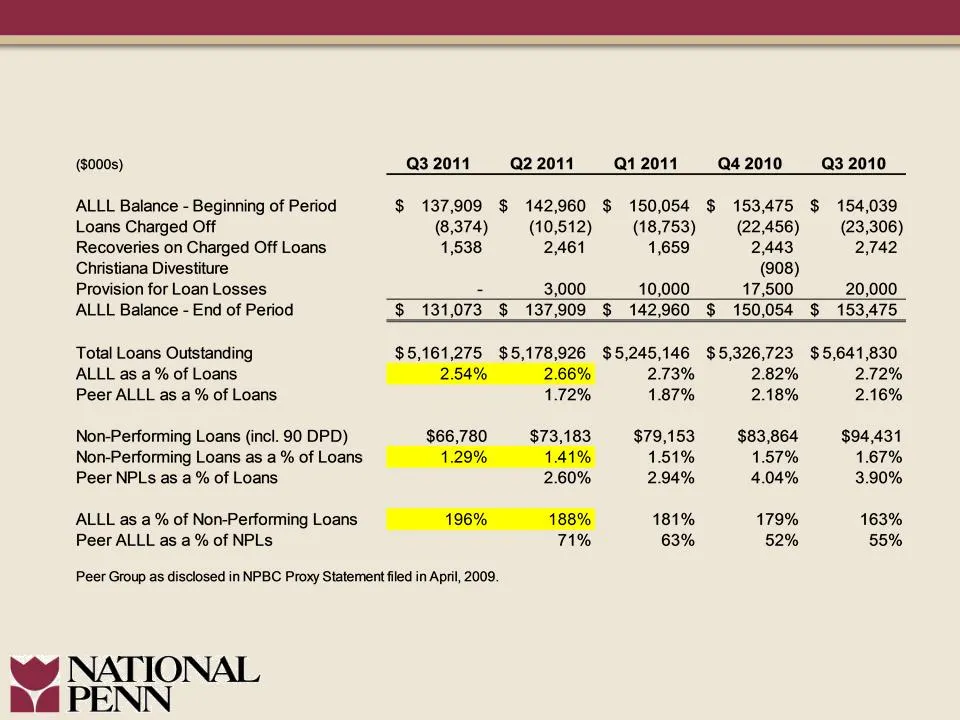
Slide 10: Asset Quality Overview / Peer Comparison
Asset Quality Overview / Peer Comparison
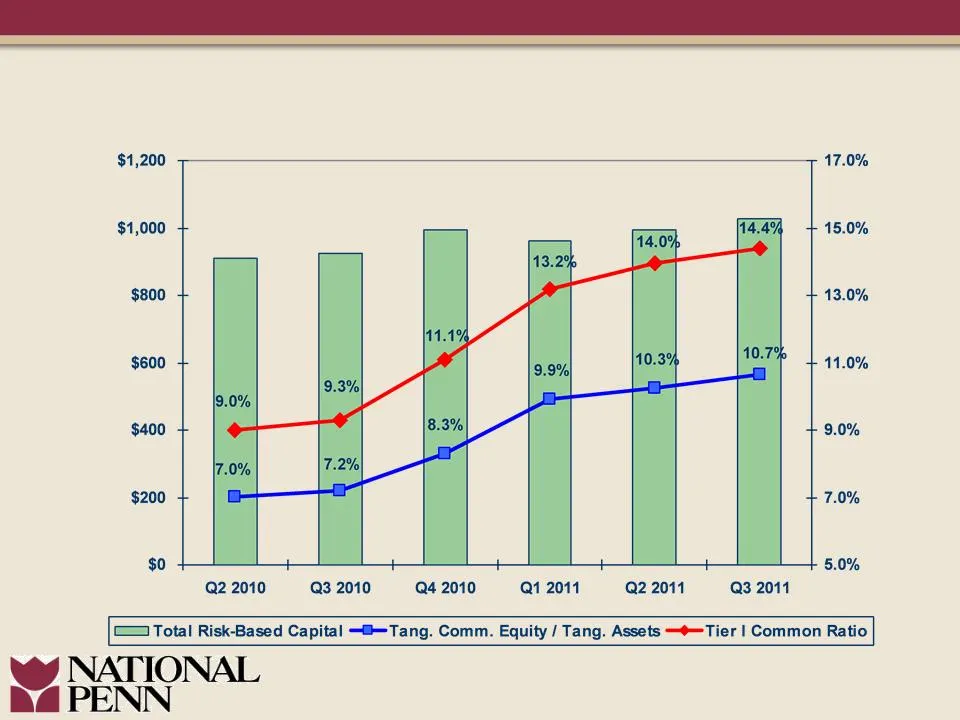
Slide 11: Capital Position Further Enhanced
Capital Position Further Enhanced ($million)
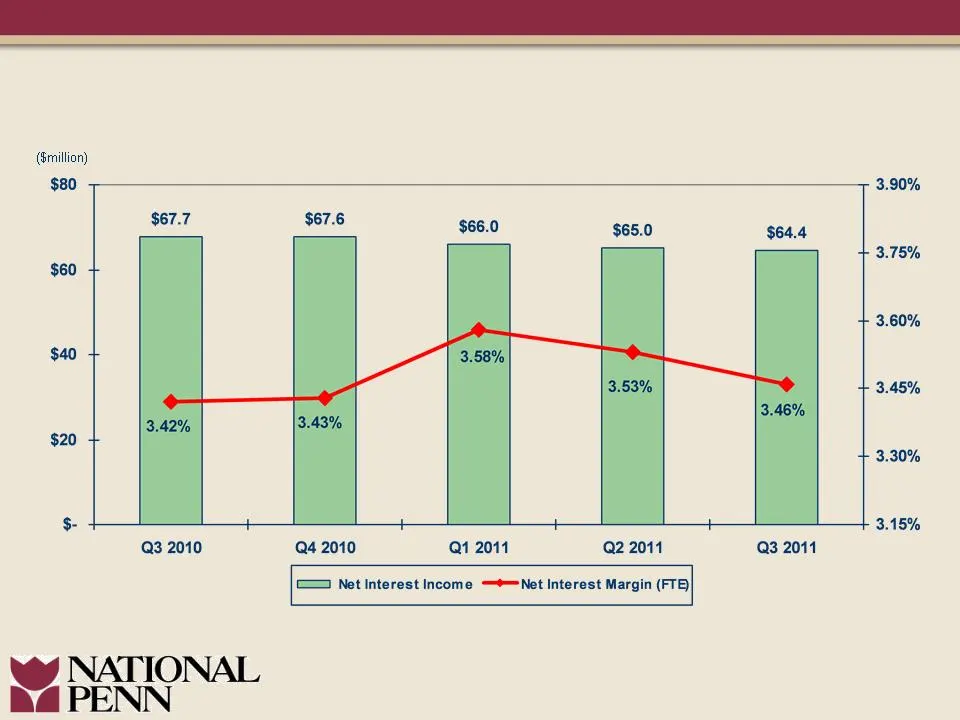
Slide 12: Net Interest Income and Net Interest Margin
(million) $80 3.90% $67.7 $67.6 $66.0 $65.0 $64.4 3.75% $60 3.60% $40 3.45% $20 3.30% $- 3.15% Q3 2010 Q4 2010 Q1 2011 Q2 2011 Q3 2011 [= Net Interest Income —*—Net Interest Margin (FTE)

Slide 13: Net Interest Margin Initiatives
• Extension of a portion of “excess” liquidity - -Approximately $100 million in 3 rd quarter. • Sale of floating rate securities and redeployment into MBS with duration of 3-4 years and termination of repurchase agreements. • Continued focus on deposit pricing including on transaction accounts. • Th
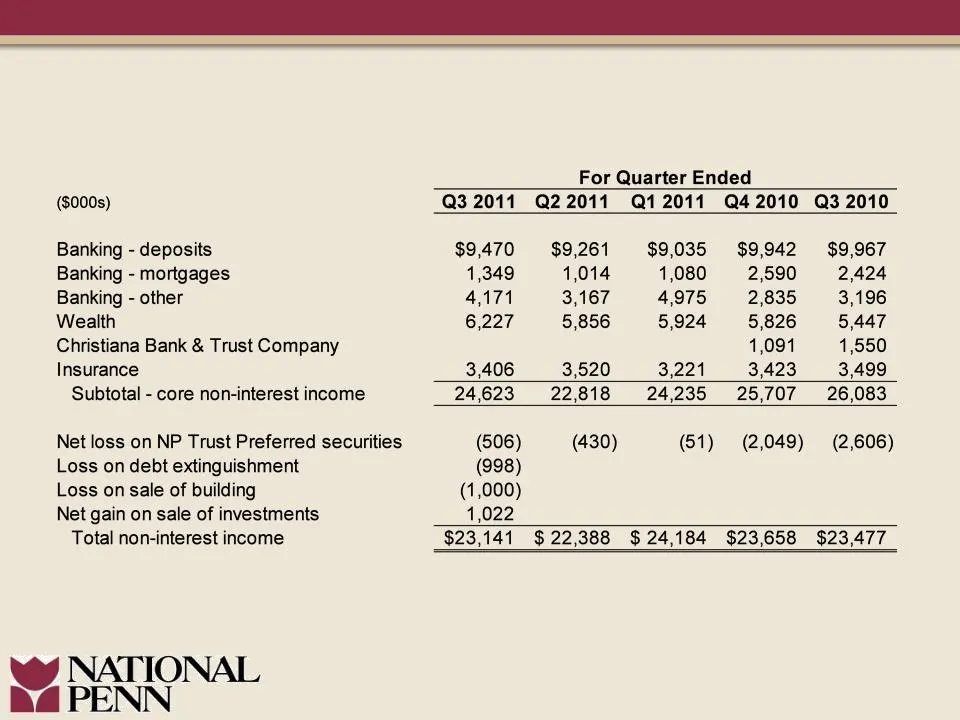
Slide 14: Non-Interest Income
For Quarter Ended ($000s) Q3 2011 Q2 2011 Q12011 Q42010 Q3 2010 Banking - deposits $9,470 $9,261 $9,035 $9,942 $9,967 Banking - mortgages 1,349 1,014 1,080 2,590 2,424 Banking - other 4171 3,167 4,975 2,835 3,196 Wealth 6,227 5,856 5,924 5,826 5,447 Christiana Bank & Trust Company 1,091 1,550 Insura
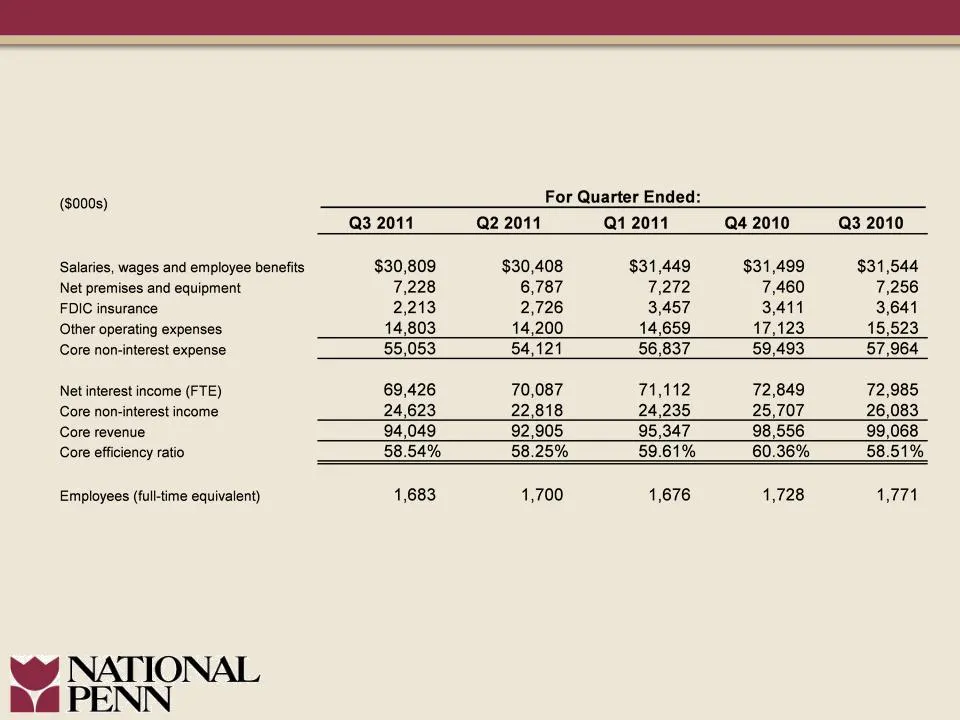
Slide 15: Expense Management Maintained
Expense Management Maintained

Slide 16: Executing on Our Strategic Plan
• Capital management strategies • Continued focus on asset quality • Manage net interest margin through low interest rate environment • Win market share • Re-risk appropriately • Patient and disciplined approach Executing on Our Strategic Plan

Slide 17
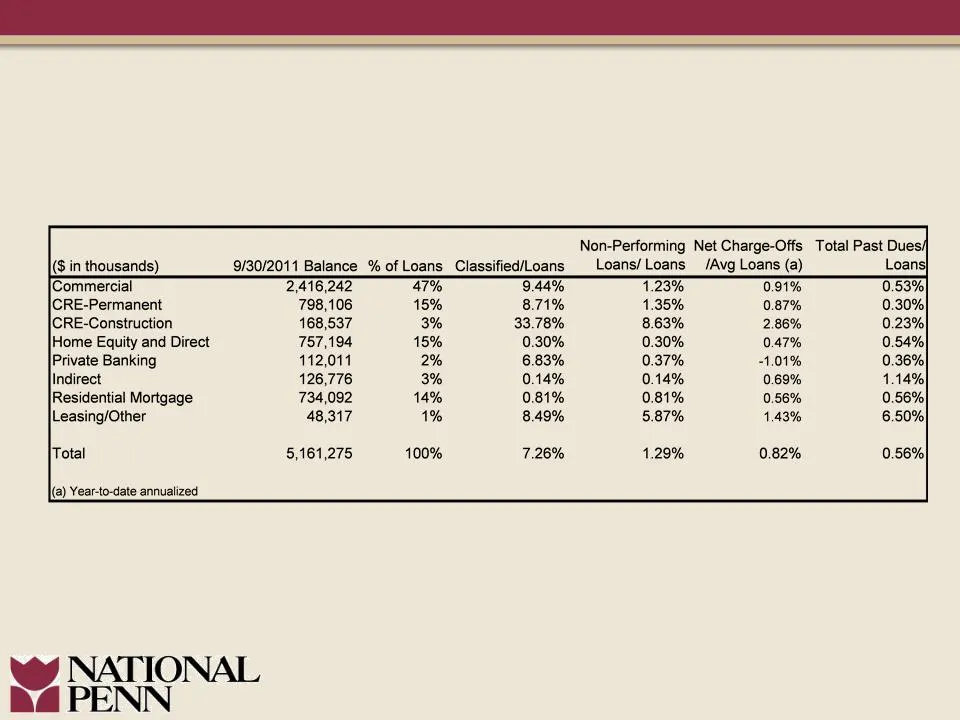
Slide 18: Appendix: Loan Risk Profile
Appendix Loan Risk Profile September 30, 2011
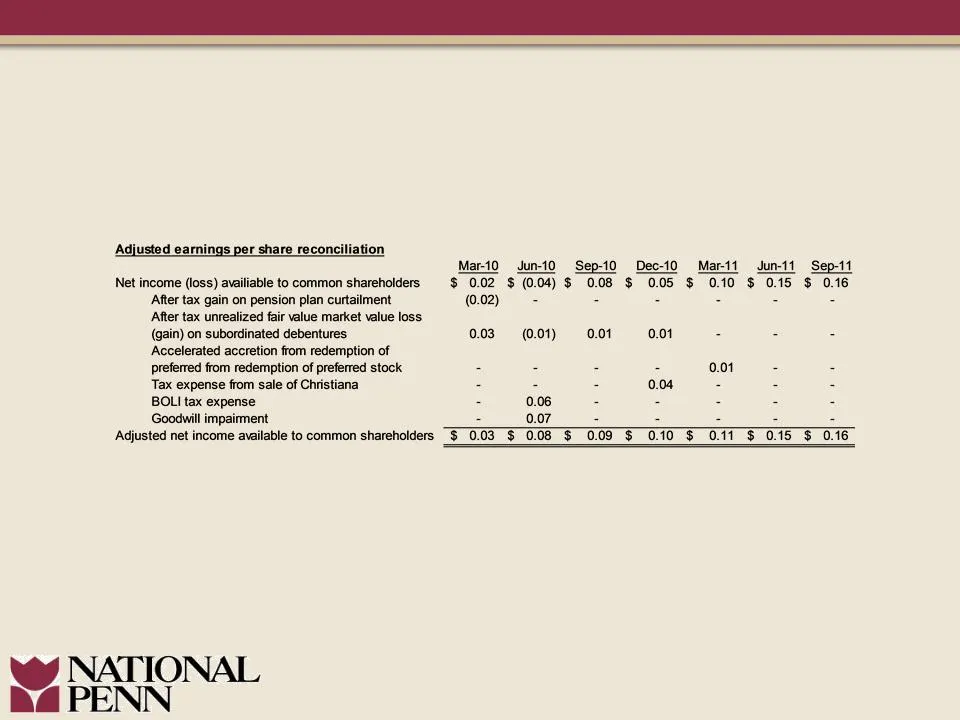
Slide 19: Appendix: Reconciliation of Non-GAAP Measures
Appendix Reconciliation of Non-GAAP Measures
Source: SEC EDGAR · 8-K filed Oct 28, 2011
More decks from National Penn Bancshares
 BB&T Global Financial Services Conference (September 2015)33 slides · Sep 16, 2015
 Merger or Acquisition (August 2015)13 slides · Aug 18, 2015
 Q2 2015 Earnings Presentation17 slides · Jul 23, 2015
 Q1 2015 Earnings Presentation18 slides · Apr 24, 2015
 Investor Presentation (February 2015)36 slides · Feb 11, 2015
 Q4 2014 Earnings Presentation16 slides · Jan 22, 2015