National Penn Bancshares — BB&T Global Financial Services Conference (September 2015)
33 slides from National Penn Bancshares's conference presentation, Sep 16, 2015
Slide 1: BB&T Global Financial Services Conference
BB&T - Global Financial Services Conference Kelly S. King Chairman and Chief Executive Officer September 16, 2015
Slide 2: Forward-Looking Statements
Forward - Looking Statements This communication contains forward - looking statements within the meaning of the Private Securities Litigation Reform Act of 199 5 giving National Penn’s and BB&T’s expectations or predictions of future financial or business performance or conditions. Forward - looking
Slide 3: Important Additional Information and Where to Find It
3 Important Additional Information and Where to Find It In connection with the proposed merger, BB&T will file with the SEC a Registration Statement on Form S - 4 that will include a Pro xy Statement of National Penn and a Prospectus of BB&T, as well as other relevant documents concerning the propos
Slide 4: BB&T is…
4 4 BB&T is… ▪ A values - driven highly profitable growth organization. While we have had a very successful merger history, our primary focus is on organic growth; nonetheless, we are well positioned for strategic opportunities. ▪ Our fundamental strategy is to deliver the best value proposition in
Slide 5: BB&T Corporation: A Growing Franchise
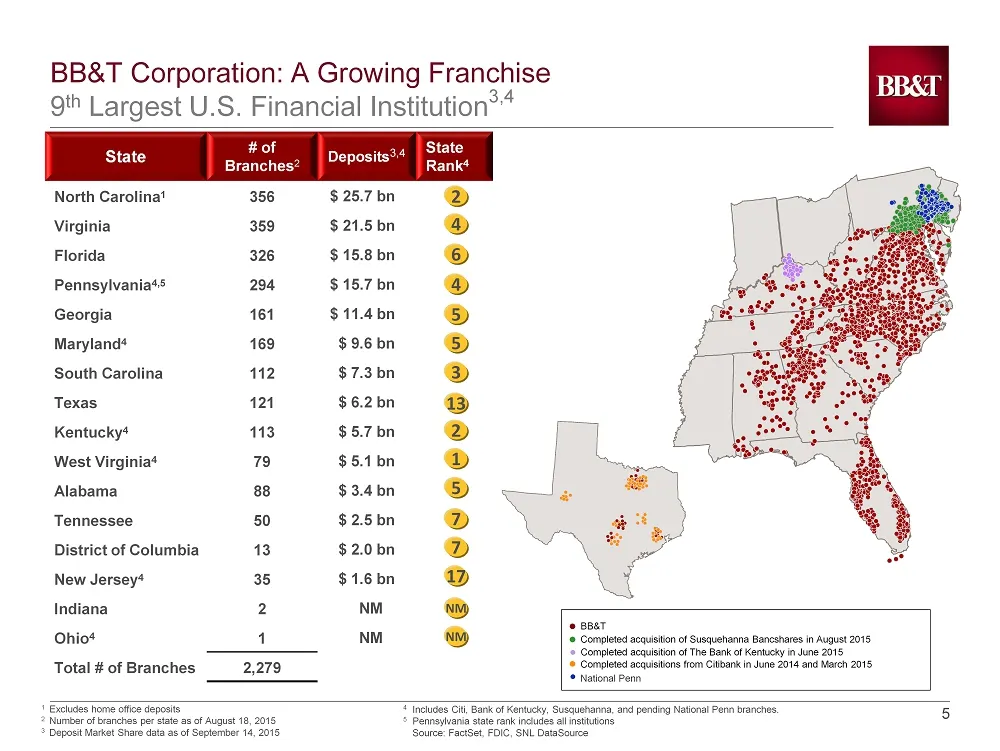
5 5 1 Excludes home office deposits 2 Number of branches per state as of August 18, 2015 3 Deposit Market Share data as of September 14, 2015 State # of Branches 2 Deposits 3,4 State Rank 4 North Carolina 1 356 $ 25.7 bn Virginia 359 $ 21.5 bn Florida 326 $ 15.8 bn Pennsylvania 4,5 294 $ 15.7 bn Geo
Slide 6: Premier Model for Community Banking and Diverse Non-Bank Businesses
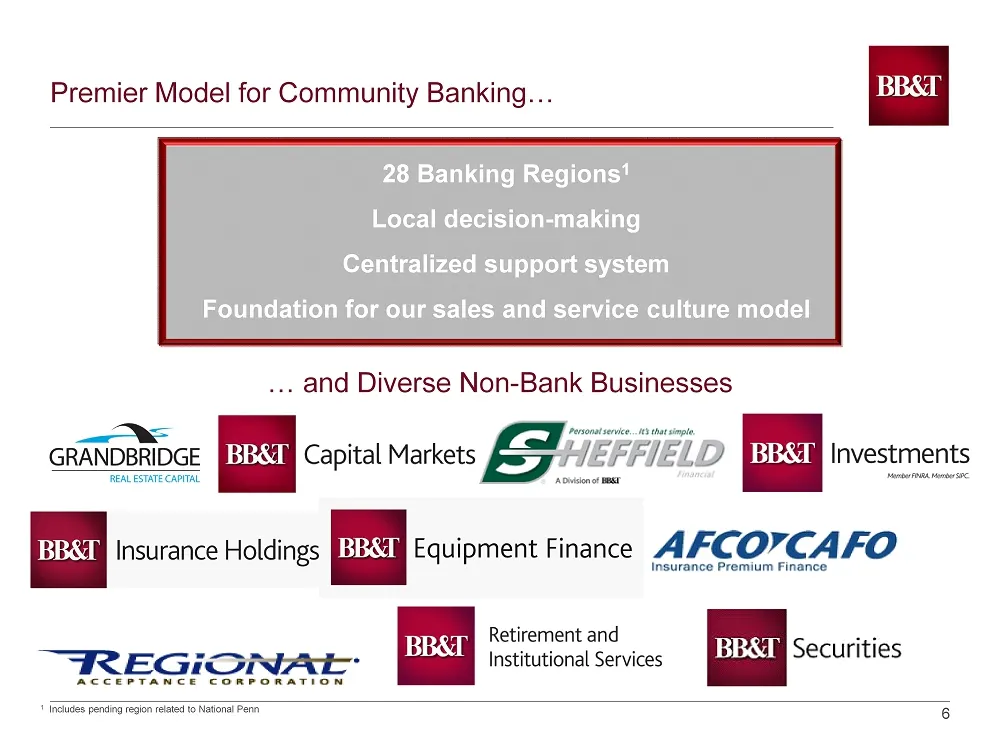
6 6 28 Banking Regions 1 Local decision - making Centralized support system Foundation for our sales and service culture model … and Diverse Non - Bank Businesses Premier Model for Community Banking… 1 Includes pending region related to National Penn
Slide 7: Diversification Drives Revenue and Productivity
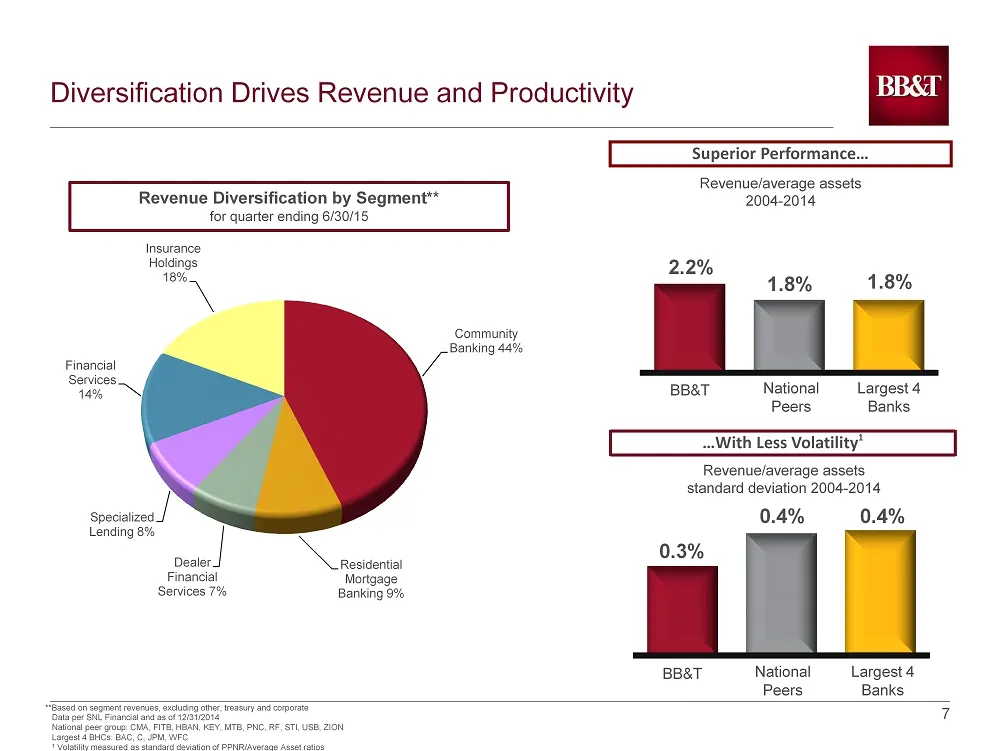
7 7 Diversification Drives Revenue and Productivity **Based on segment revenues, excluding other, treasury and corporate 2.2% 1.8% 1.8% Superior Performance… BB&T National Peers Largest 4 Banks Revenue/average assets 2004 - 2014 …With Less Volatility 1 0.3% 0.4% 0.4% Revenue/average assets standard
Slide 8: Superior Returns
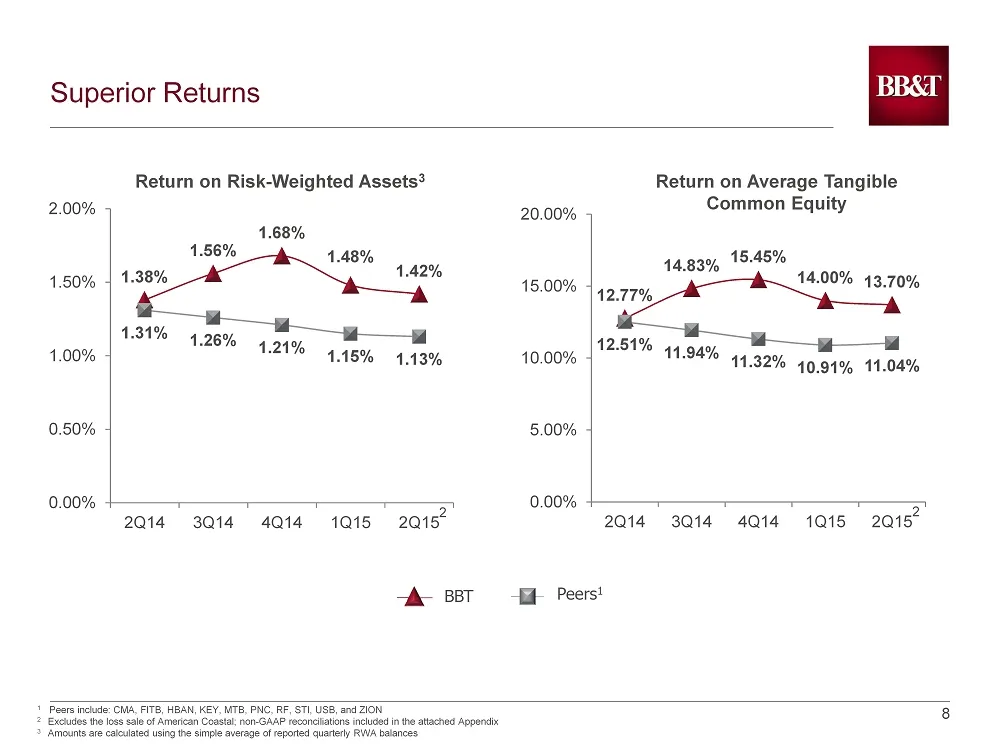
8 8 Superior Returns 12.77% 14.83% 15.45% 14.00% 13.70% 12.51% 11.94% 11.32% 10.91% 11.04% 0.00% 5.00% 10.00% 15.00% 20.00% 2Q14 3Q14 4Q14 1Q15 2Q15 1.38% 1.56% 1.68% 1.48% 1.42% 1.31% 1.26% 1.21% 1.15% 1.13% 0.00% 0.50% 1.00% 1.50% 2.00% 2Q14 3Q14 4Q14 1Q15 2Q15 Return on Average Tangible Common Eq
Slide 9: Seasonally Strong Loan Growth
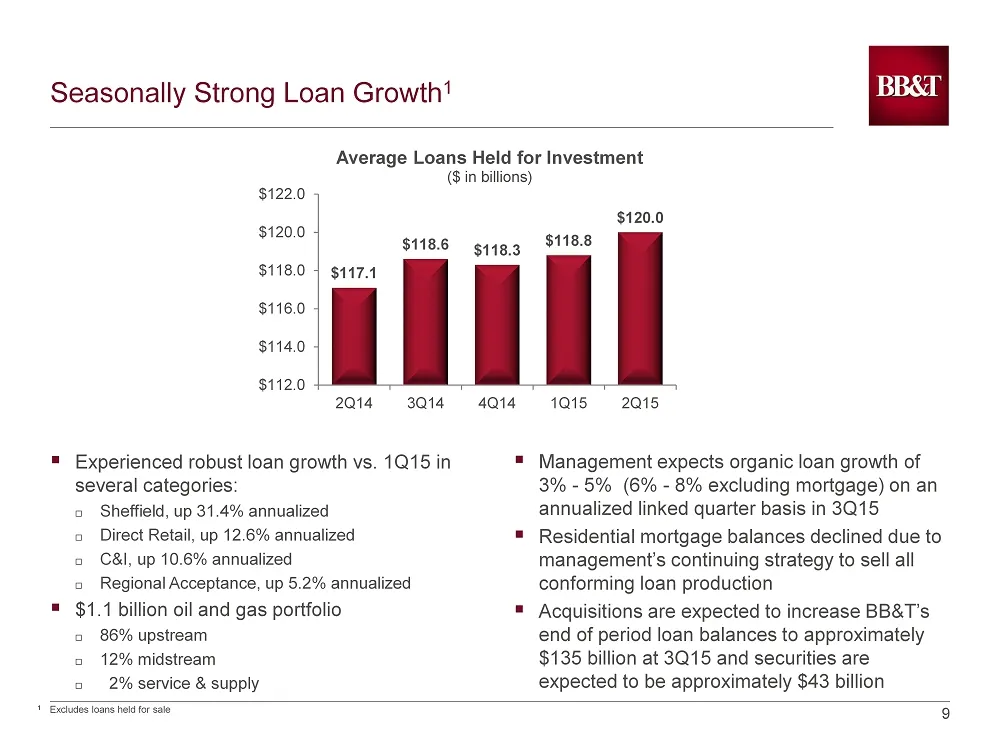
9 9 Seasonally Strong Loan Growth 1 ▪ Management expects organic loan growth of 3% - 5% (6% - 8% excluding mortgage) on an annualized linked quarter basis in 3Q15 ▪ Residential mortgage balances declined due to management’s continuing strategy to sell all conforming loan production ▪ Acquisitions ar
Slide 10: Accelerating Growth in Risk/Return Advantaged Lending Platforms
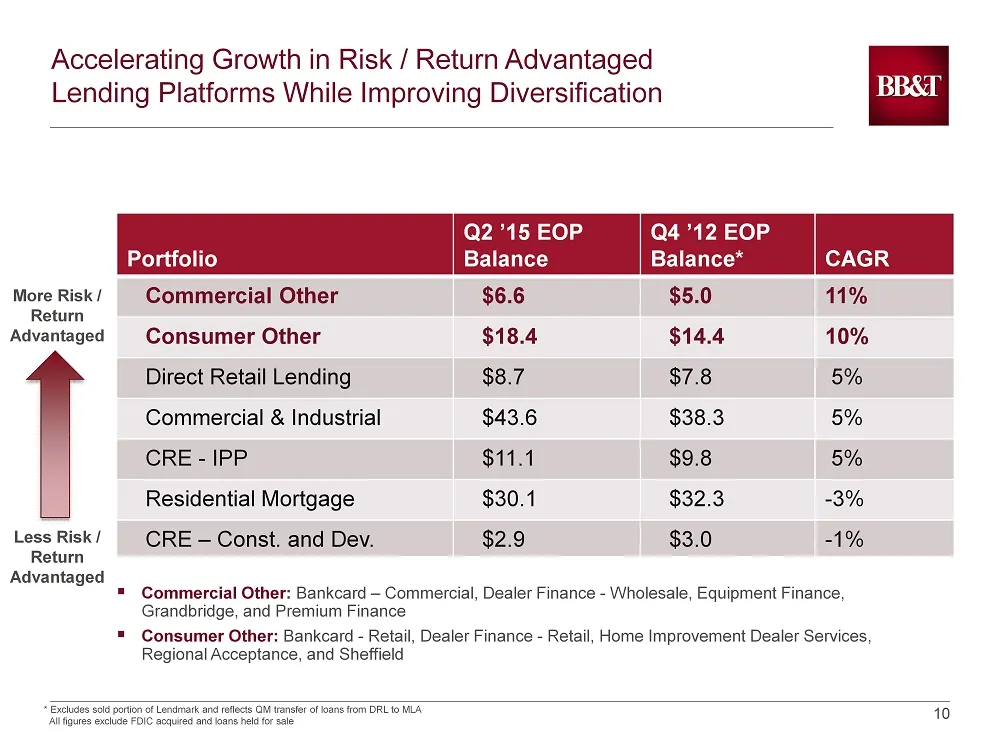
10 10 Accelerating Growth in Risk / Return Advantaged Lending Platforms While Improving Diversification * Excludes sold portion of Lendmark and reflects QM transfer of loans from DRL to MLA All figures exclude FDIC acquired and loans held for sale Portfolio Q2 ’15 EOP Balance Q4 ’12 EOP Balance* CAG
Slide 11: Improved Deposit Mix and Cost
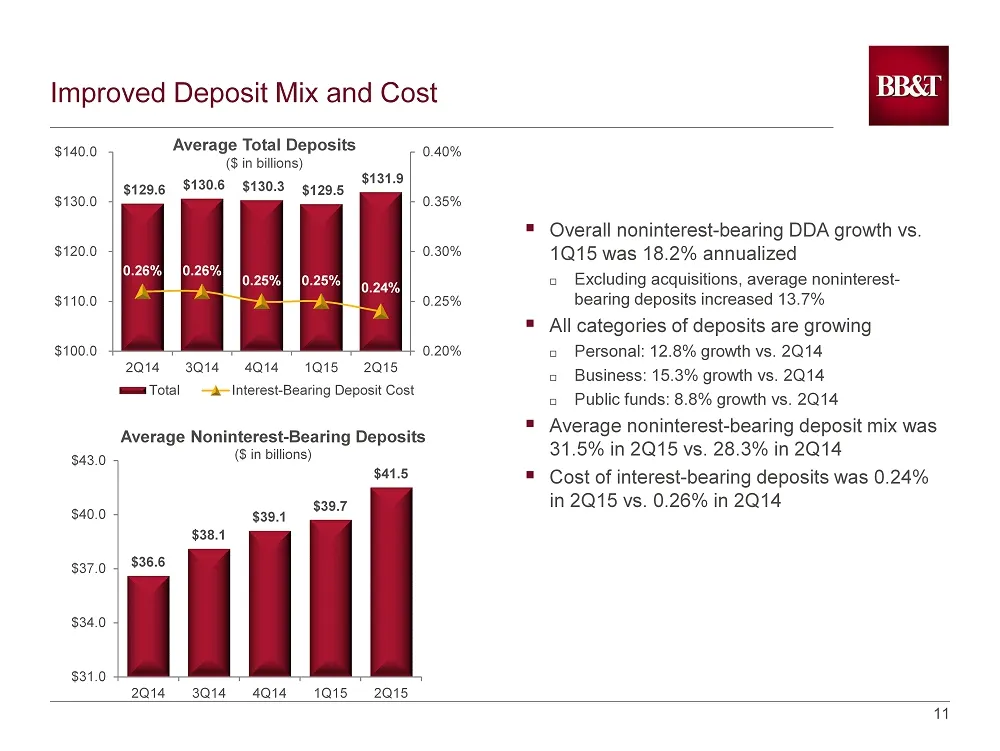
11 11 Improved Deposit Mix and Cost $129.6 $130.6 $130.3 $129.5 $131.9 0.26% 0.26% 0.25% 0.25% 0.24% 0.20% 0.25% 0.30% 0.35% 0.40% $100.0 $110.0 $120.0 $130.0 $140.0 2Q14 3Q14 4Q14 1Q15 2Q15 Total Interest-Bearing Deposit Cost ▪ Overall noninterest - bearing DDA growth vs. 1Q15 was 18.2% annualized
Slide 12: Net Interest Margin Expected to Increase
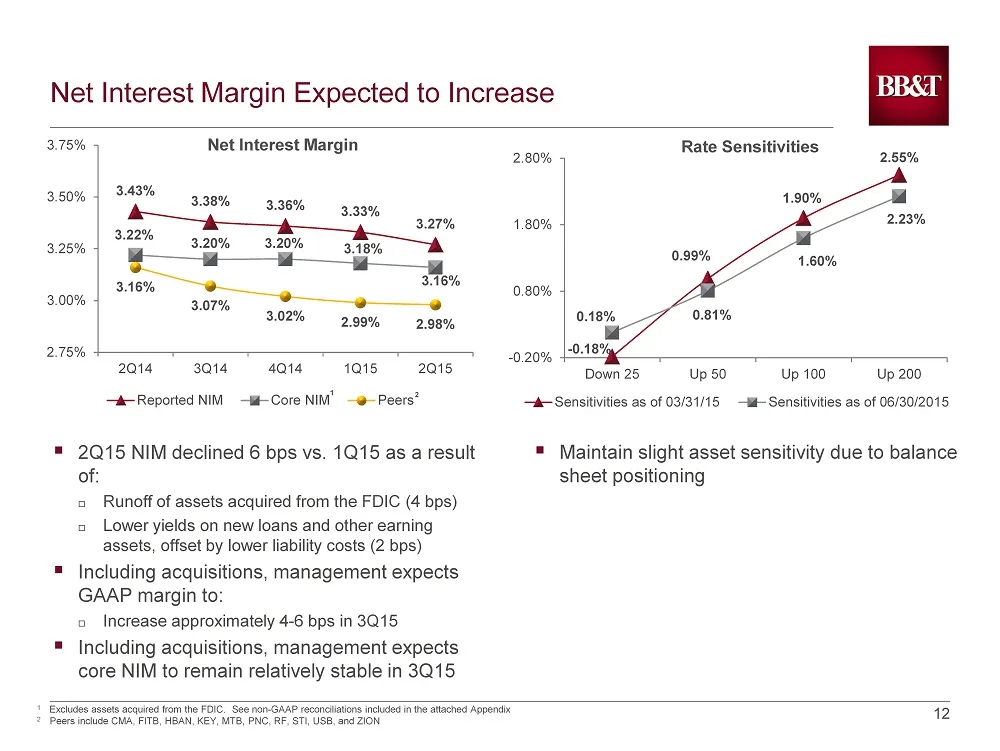
12 12 Net Interest Margin Expected to Increase 3.43% 3.38% 3.36% 3.33% 3.27% 3.22% 3.20% 3.20% 3.18% 3.16% 3.16% 3.07% 3.02% 2.99% 2.98% 2.75% 3.00% 3.25% 3.50% 3.75% 2Q14 3Q14 4Q14 1Q15 2Q15 Reported NIM Core NIM Peers ▪ Maintain slight asset sensitivity due to balance sheet positioning Net Interes
Slide 13: Strong Fee Income
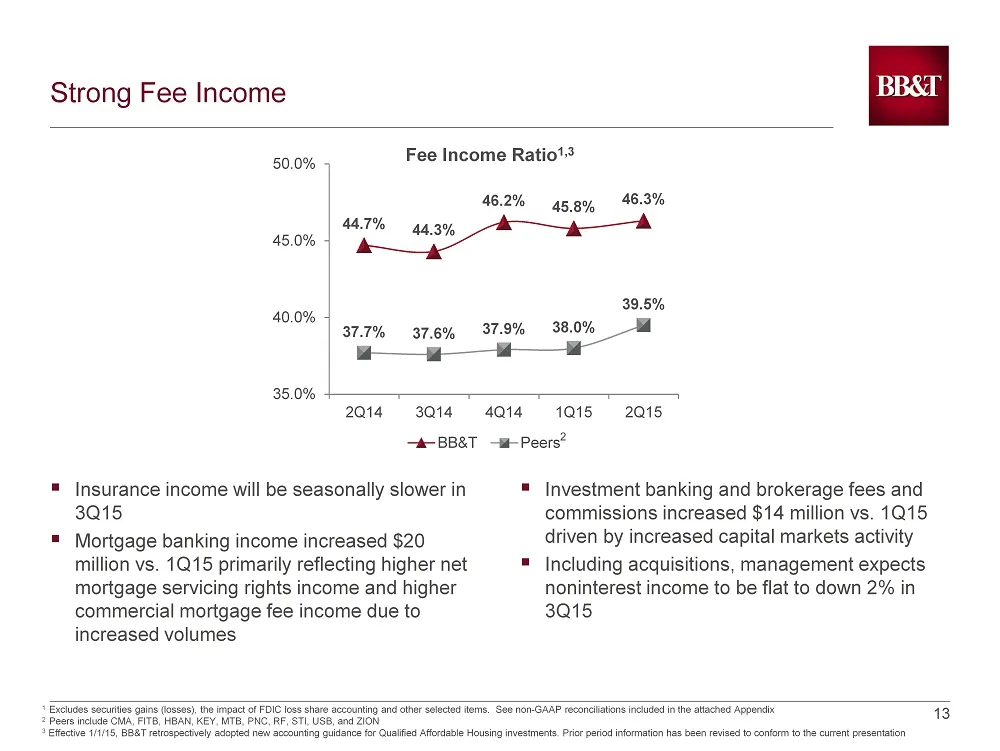
13 13 Strong Fee Income ▪ Insurance income will be seasonally slower in 3Q15 ▪ Mortgage banking income increased $20 million vs. 1Q15 primarily reflecting higher net mortgage servicing rights income and higher commercial mortgage fee income due to increased volumes 44.7% 44.3% 46.2% 45.8% 46.3% 37.7
Slide 14: Noninterest Expense Reflects Acquisitions, Merit Increase
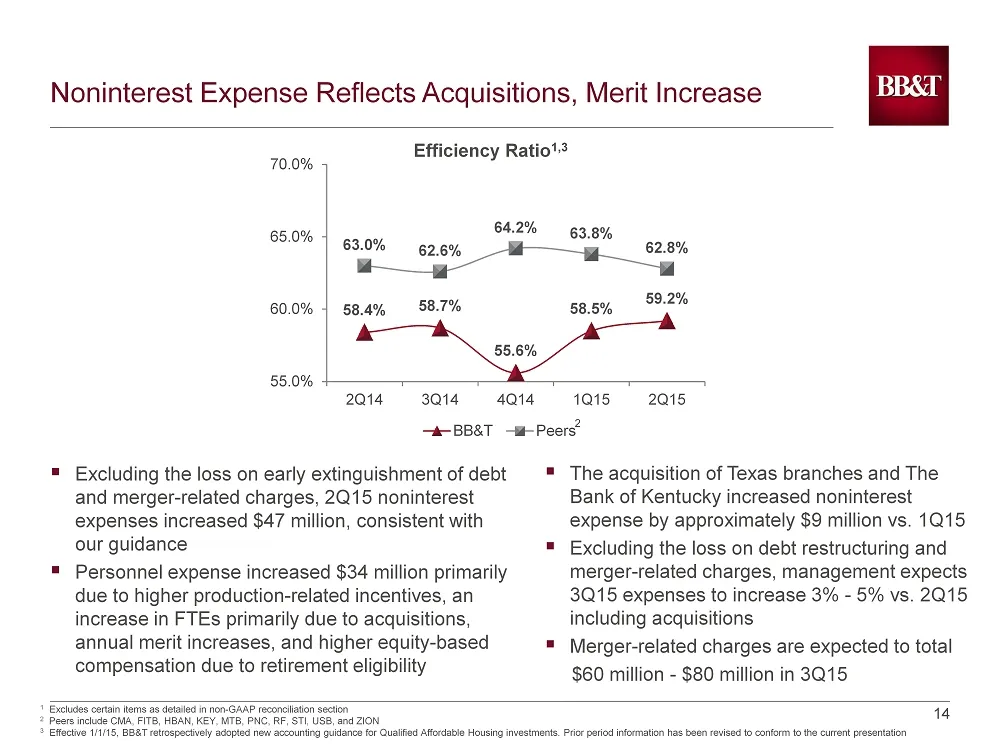
14 14 Noninterest Expense Reflects Acquisitions, Merit Increase ▪ Excluding the loss on early extinguishment of debt and merger - related charges, 2Q15 noninterest expenses increased $47 million, consistent with our guidance ▪ Personnel expense increased $34 million primarily due to higher productio
Slide 15: Committed to Achieving Cost Savings Goals
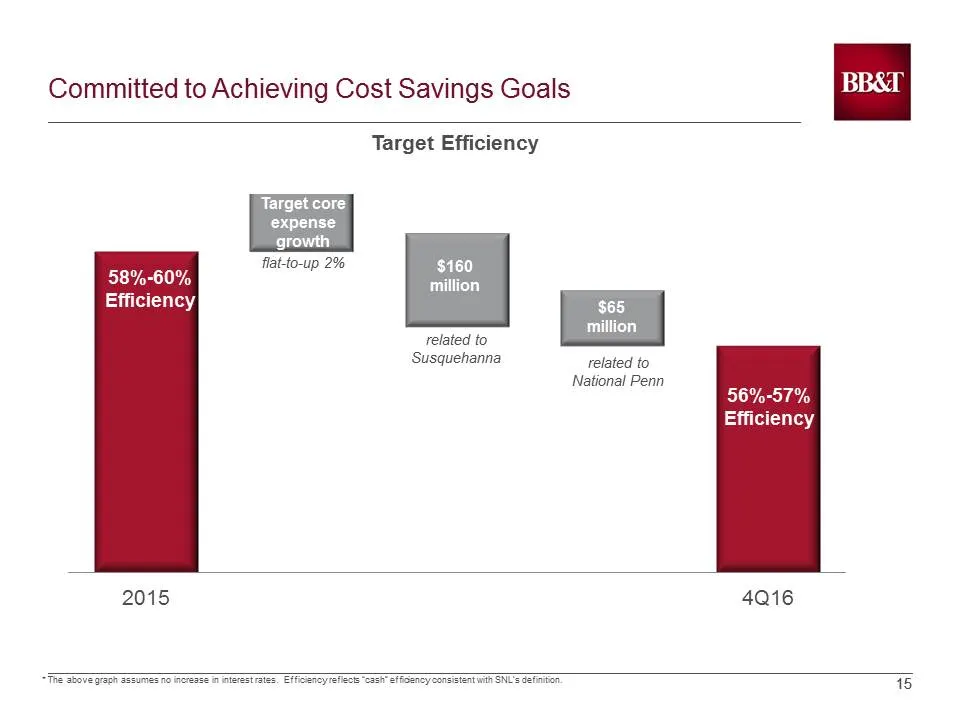
15 15 Committed to Achieving Cost Savings Goals 2015 4Q16 56% - 57% Efficiency $160 million 58% - 60% Efficiency $65 million related to Susquehanna related to National Penn * The above graph assumes no increase in interest rates. Efficiency reflects “cash” efficiency consistent with SNL’s definit io
Slide 16: Capital and Liquidity Strength
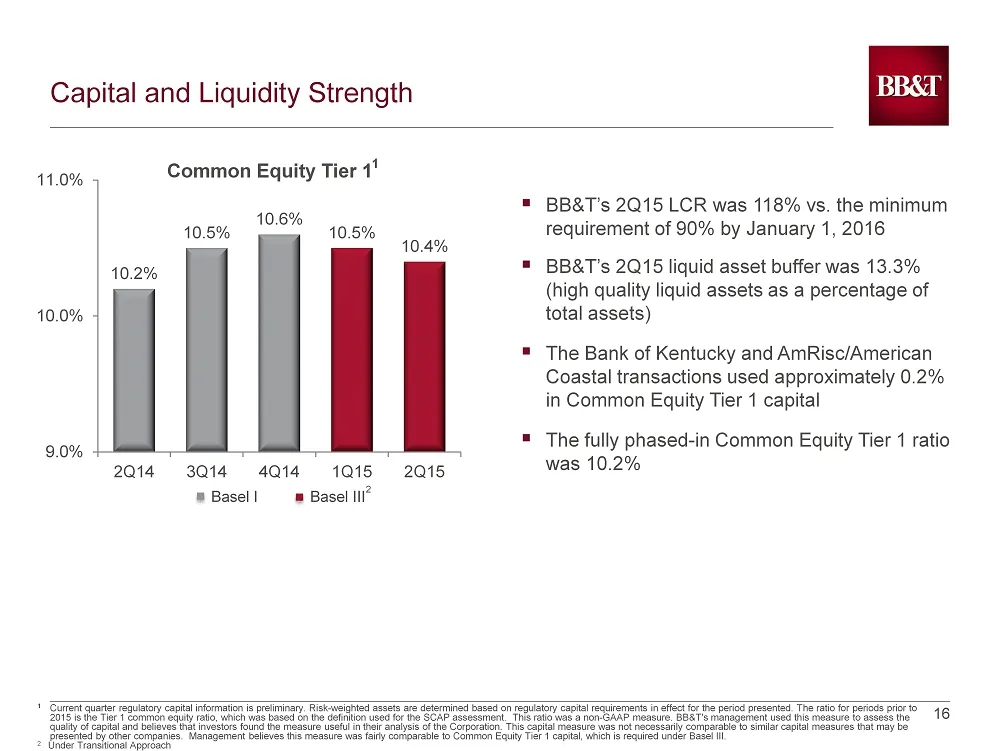
16 16 Capital and Liquidity Strength 10.2% 10.5% 10.6% 10.5% 10.4% 9.0% 10.0% 11.0% 2Q14 3Q14 4Q14 1Q15 2Q15 ▪ BB&T’s 2Q15 LCR was 118% vs. the minimum requirement of 90% by January 1, 2016 ▪ BB&T’s 2Q15 liquid asset buffer was 13.3% (high quality liquid assets as a percentage of total assets) ▪ The
Slide 17: BB&T Has Leading Dividend
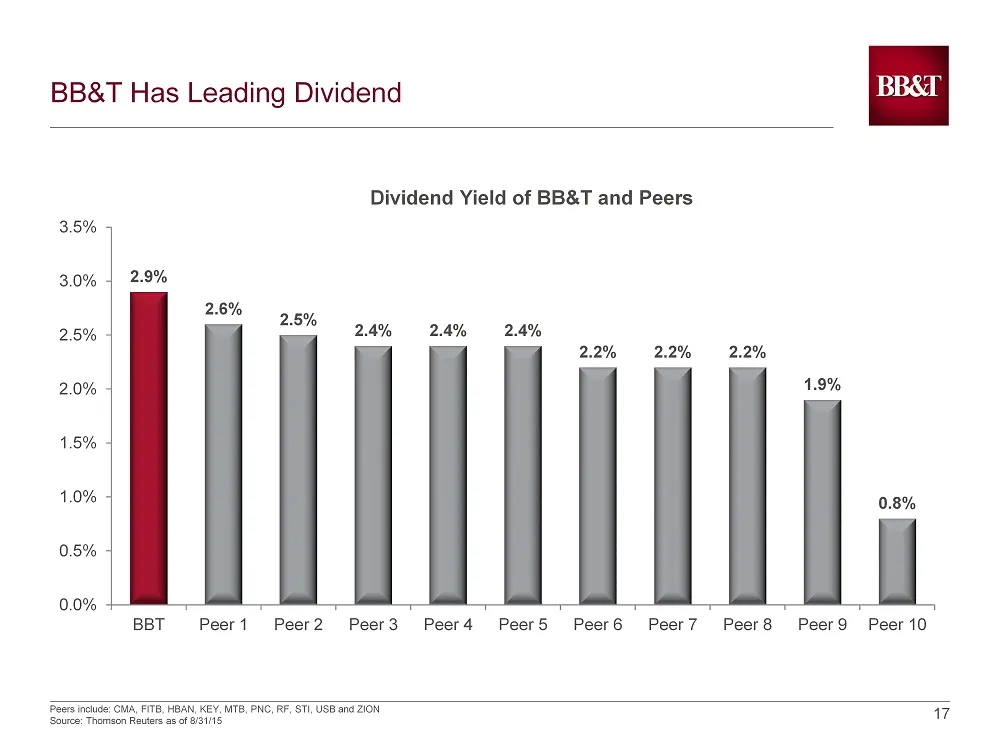
17 17 BB&T Has Leading Dividend 2.9% 2.6% 2.5% 2.4% 2.4% 2.4% 2.2% 2.2% 2.2% 1.9% 0.8% 0.0% 0.5% 1.0% 1.5% 2.0% 2.5% 3.0% 3.5% BBT Peer 1 Peer 2 Peer 3 Peer 4 Peer 5 Peer 6 Peer 7 Peer 8 Peer 9 Peer 10 Dividend Yield of BB&T and Peers Peers include: CMA, FITB, HBAN, KEY, MTB, PNC, RF, STI, USB and Z
Slide 18: Strategic and Compelling Acquisition of National Penn
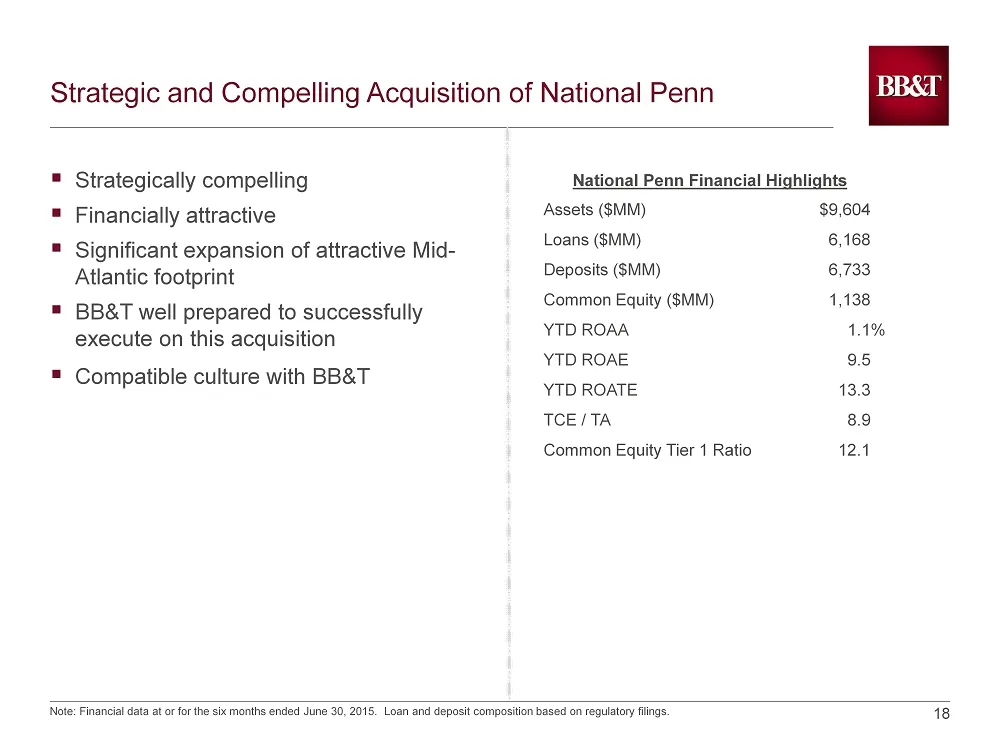
18 18 Strategic and Compelling Acquisition of National Penn ▪ Strategically compelling ▪ Financially attractive ▪ Significant expansion of attractive Mid - Atlantic footprint ▪ BB&T well prepared to successfully execute on this acquisition ▪ Compatible culture with BB&T Assets ($MM) $9,604 Loans ($M
Slide 19: Top 15 Banks in Pennsylvania
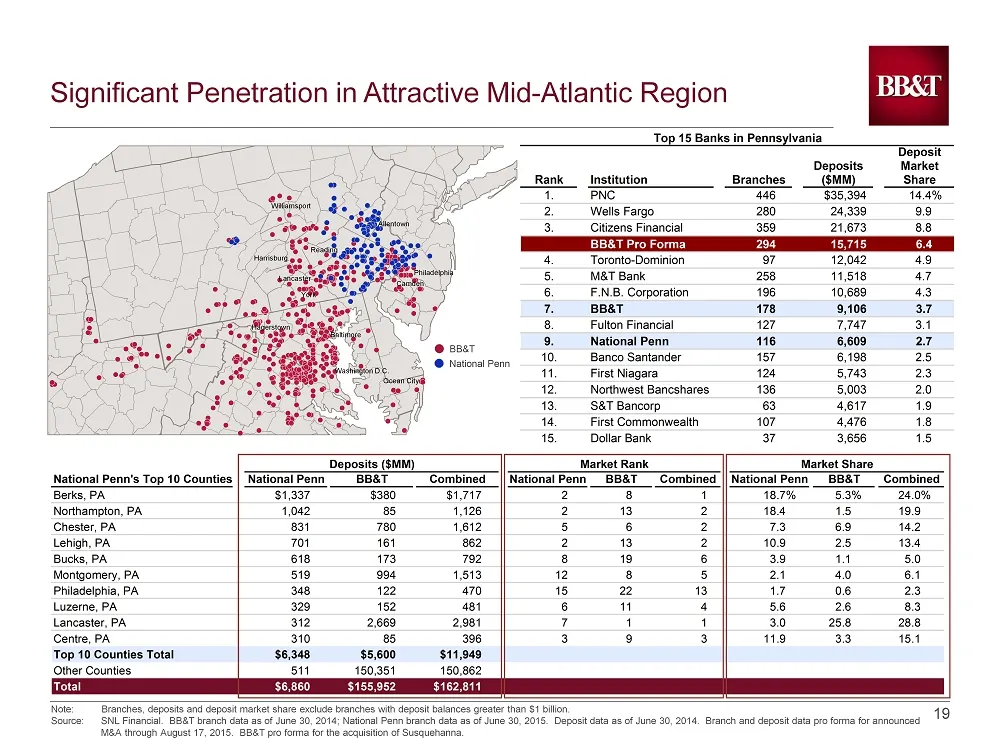
19 19 York Williamsport Washington D.C. Hagerstown Baltimore Philadelphia Reading Harrisburg Camden Lancaster Ocean City Allentown Top 15 Banks in Pennsylvania Deposit Deposits Market Rank Institution Branches ($MM) Share 1. PNC 446 $35,394 14.4% 2. Wells Fargo 280 24,339 9.9 3. Citizens Financial 3

Slide 20: Banking that looks more like...
Banking that looks more like ia BBT.com/| U
Slide 21: Introducing U by BB&T
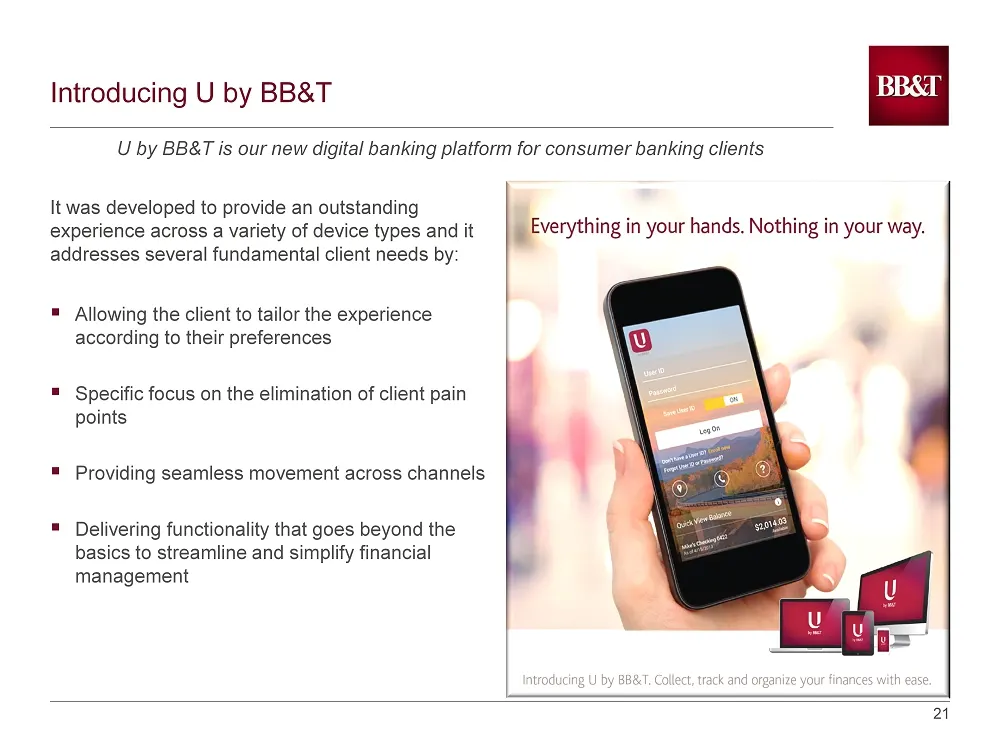
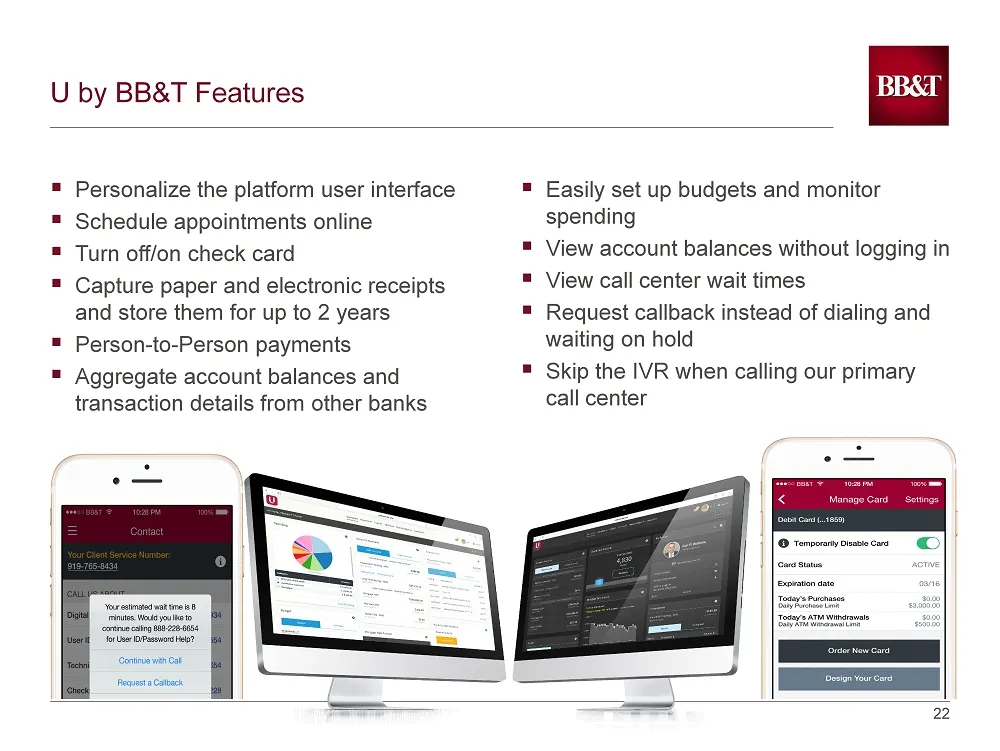
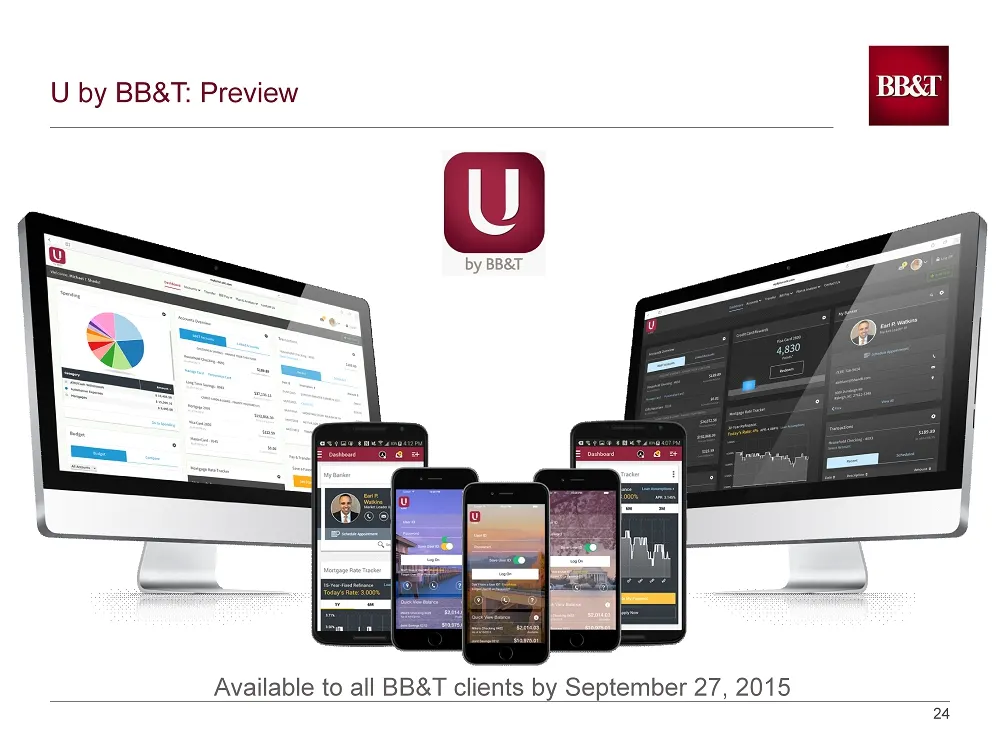
21 21 Introducing U by BB&T It was developed to provide an outstanding experience across a variety of device types and it addresses several fundamental client needs by: ▪ Allowing the client to tailor the experience according to their preferences ▪ Specific focus on the elimination of client pain po
Slide 22: U by BB&T Features
22 22 U by BB&T Features ▪ Personalize the platform user interface ▪ Schedule appointments online ▪ Turn off/on check card ▪ Capture paper and electronic receipts and store them for up to 2 years ▪ Person - to - Person payments ▪ Aggregate account balances and transaction details from other banks ▪
Slide 23: U by BB&T Initial Feedback Very Positive
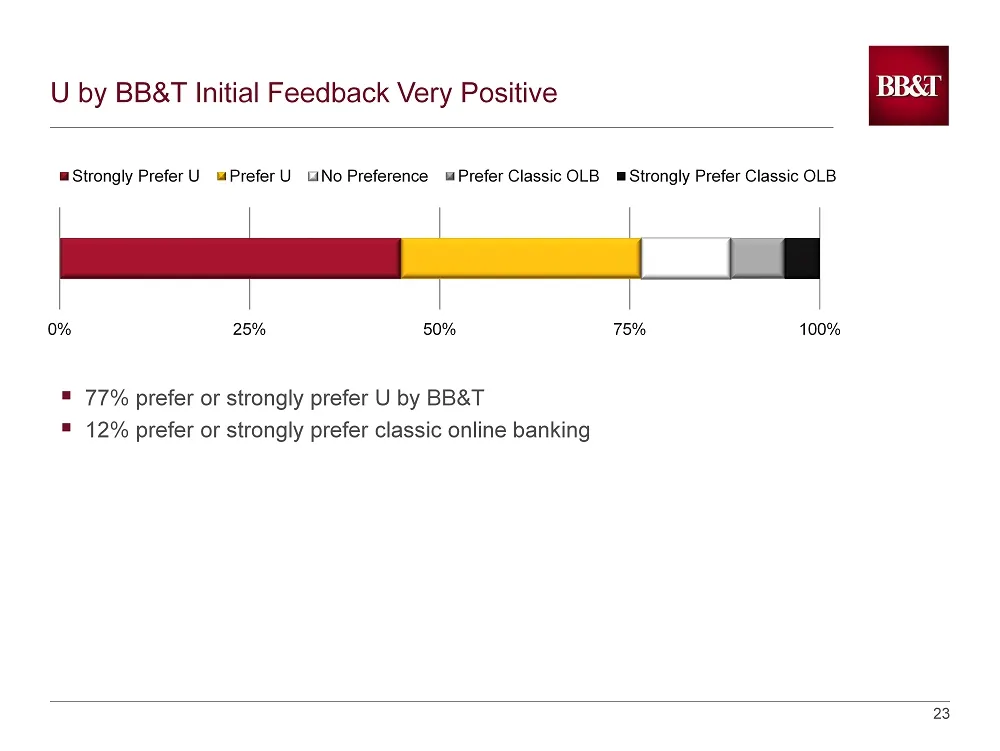
23 23 U by BB&T Initial Feedback Very Positive ▪ 77% prefer or strongly prefer U by BB&T ▪ 12% prefer or strongly prefer classic online banking 0% 25% 50% 75% 100% Strongly Prefer U Prefer U No Preference Prefer Classic OLB Strongly Prefer Classic OLB
Slide 24: U by BB&T: Preview
24 24 U by BB&T: Preview Available to all BB&T clients by September 27, 2015
Slide 25: BB&T's Culture: A differentiating factor
BB&T BB&T’s Culture: A differentiating factor that accelerates succes.
Slide 26: Non-negotiables at BB&T
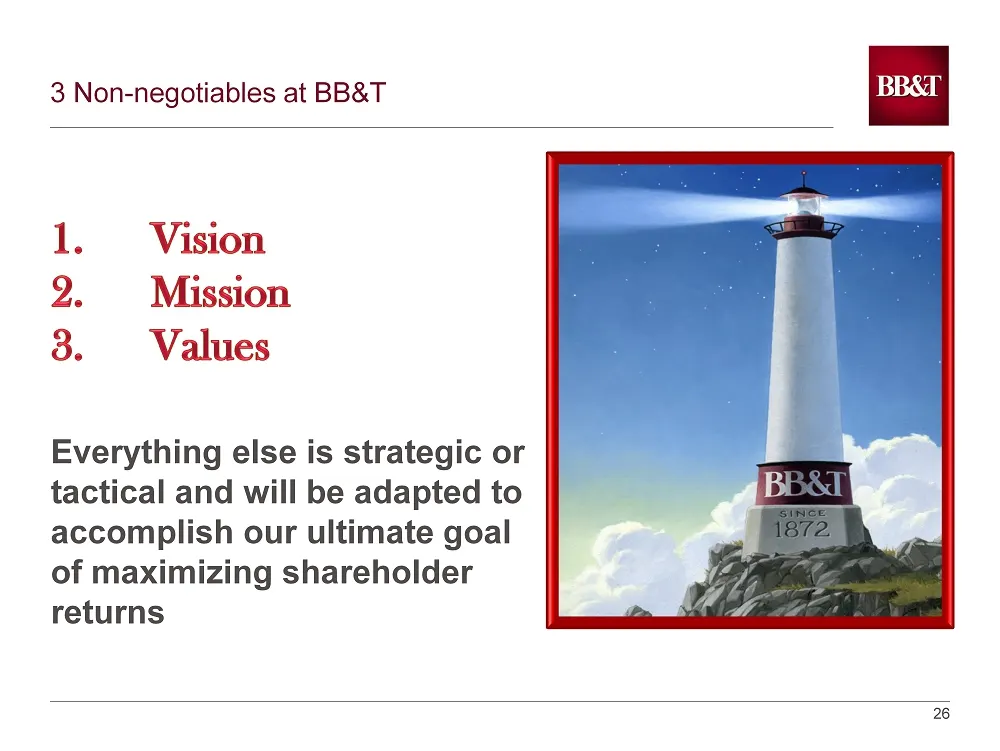
26 26 Everything else is strategic or tactical and will be adapted to accomplish our ultimate goal of maximizing shareholder returns 3 Non - negotiables at BB&T
Slide 27: Values Are Consistent and Important
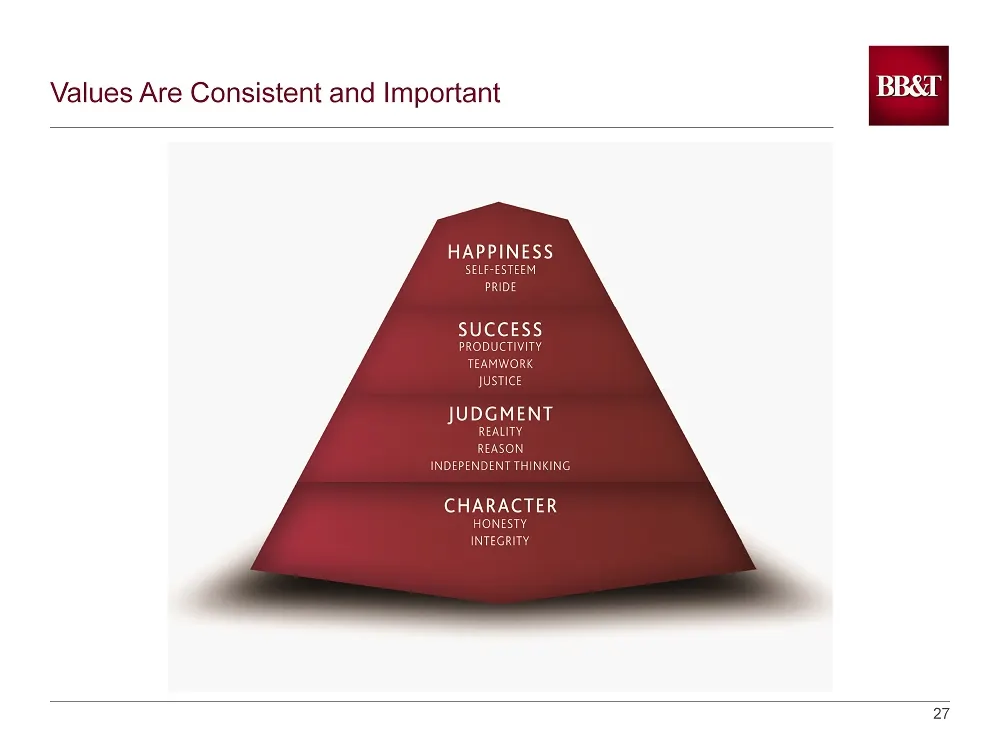
27 27 Values Are Consistent and Important 27
Slide 28: Beliefs Drive Performance
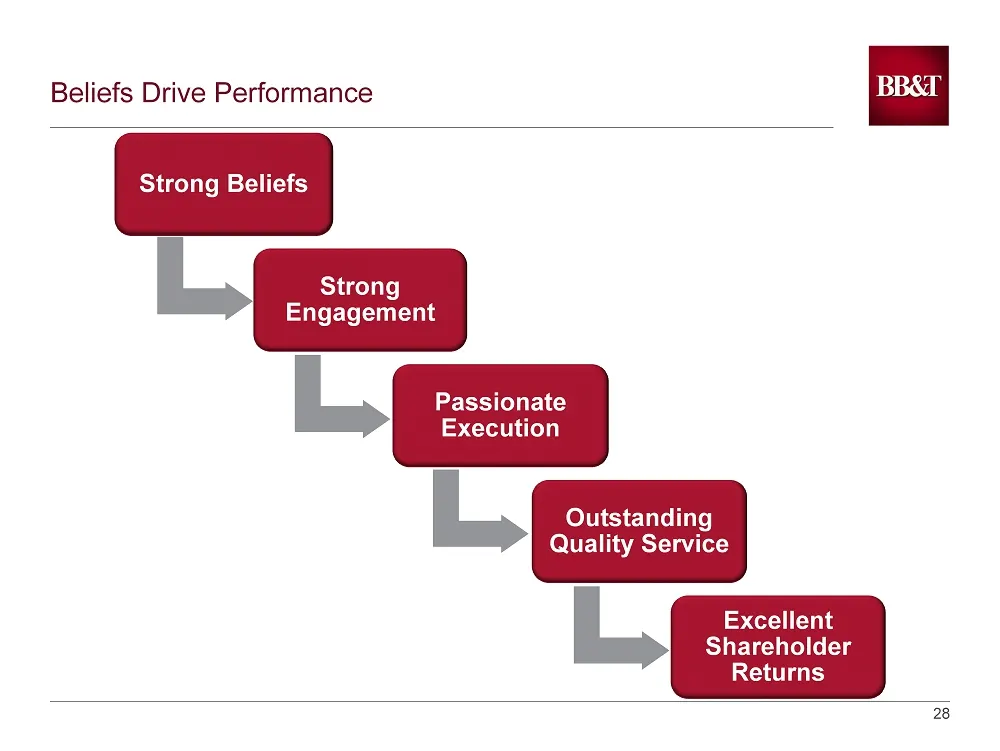
28 28 Beliefs Drive Performance Strong Beliefs Strong Engagement Passionate Execution Outstanding Quality Service Excellent Shareholder Returns
Slide 29: While we’re performing at a superior level, we believe
While we’re performing at a superior level, we believe

Slide 30: Appendix
BB&T Appendix
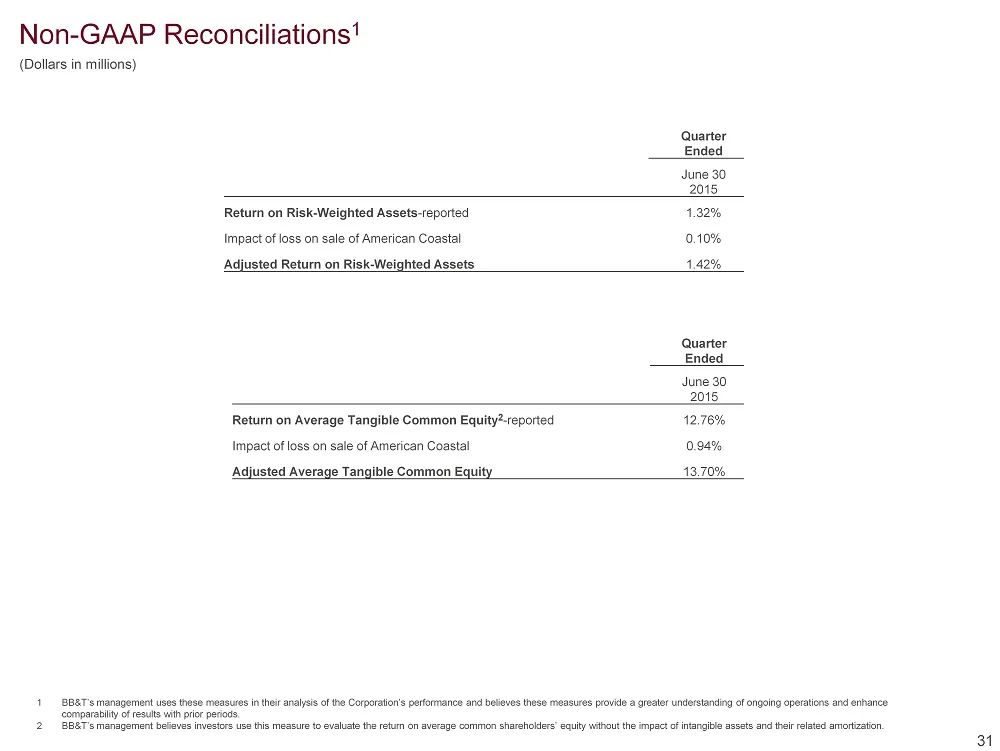
Slide 31: Non-GAAP Reconciliations
31 1 BB&T’s management uses these measures in their analysis of the Corporation’s performance and believes these measures provide a greater understanding of ongoing operations and enhance comparability of results with prior periods. 2 BB&T’s management believes investors use this measure to evaluate
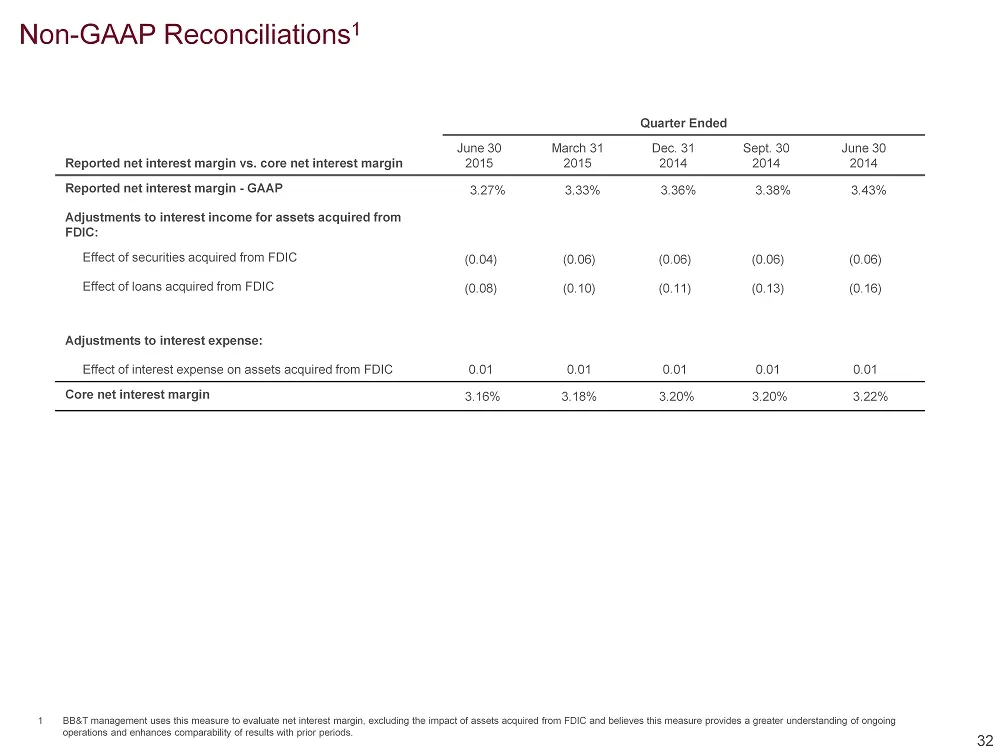
Slide 32: Non-GAAP Reconciliations
Non - GAAP Reconciliations 1 Quarter Ended Reported net interest margin vs. core net interest margin June 30 2015 March 31 2015 Dec. 31 2014 Sept. 30 2014 June 30 2014 Reported net interest margin - GAAP 3.27% 3.33% 3.36% 3.38% 3.43% Adjustments to interest income for assets acquired from FDIC: Effe
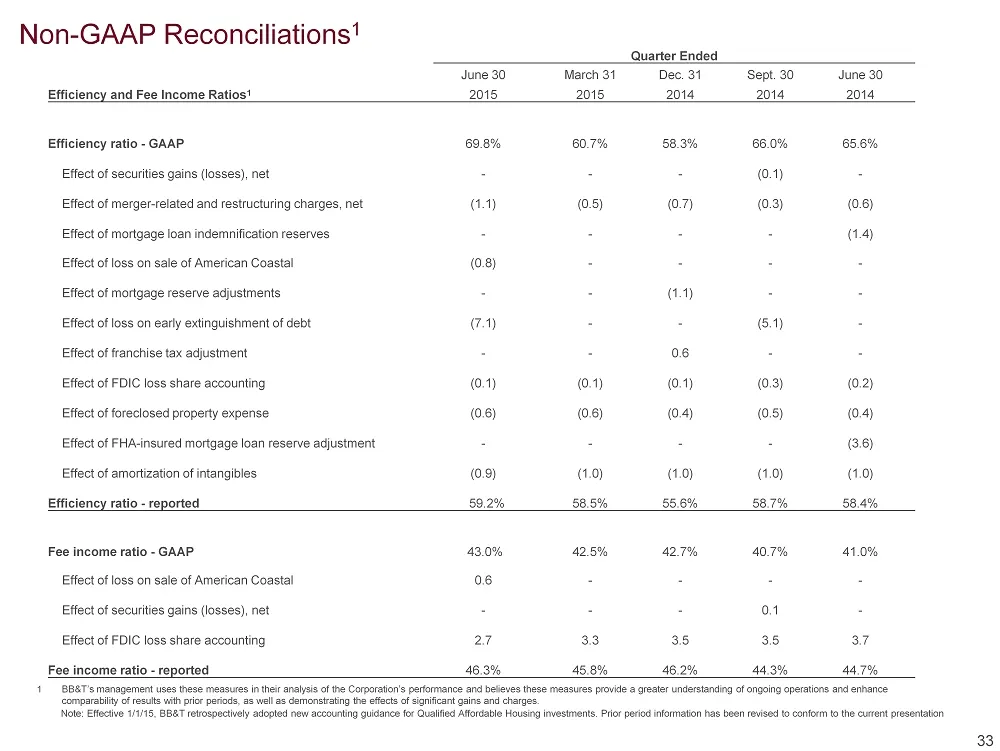
Slide 33: Non-GAAP Reconciliations
Non - GAAP Reconciliations 1 33 1 BB&T’s management uses these measures in their analysis of the Corporation’s performance and believes these measures provide a greater understanding of ongoing operations and enhance comparability of results with prior periods, as well as demonstrating the effects o
Source: SEC EDGAR · 425 filed Sep 16, 2015
More decks from National Penn Bancshares
 Merger or Acquisition (August 2015)13 slides · Aug 18, 2015
 Q2 2015 Earnings Presentation17 slides · Jul 23, 2015
 Q1 2015 Earnings Presentation18 slides · Apr 24, 2015
 Investor Presentation (February 2015)36 slides · Feb 11, 2015
 Q4 2014 Earnings Presentation16 slides · Jan 22, 2015
 Investor Presentation (November 2014)37 slides · Nov 12, 2014