National Penn Bancshares — Q1 2015 Earnings Presentation
18 slides from National Penn Bancshares's earnings presentation, Apr 24, 2015
Slide 1: National Penn Bancshares, Inc. 1st Quarter 2015 Earnings Webcast
National Penn Bancshares, Inc. 1st Quarter 2015 Earnings Webcast
Slide 2: Safe Harbor Regarding Forward Looking Statements
Safe Harbor Regarding Forward Looking Statements 1996. looking terminology such as “believe,” “expect,” “may,” “wil,” ‘should, ”‘projec,” “could,” “plan,” “goal,” potential,” ‘pro forme,” “seek,” “intend,” or “anticipate” or the negative thereof or r obj other SK ‘generally, ir nal Penn systems, sil
Slide 3: Q1 2015 Highlights
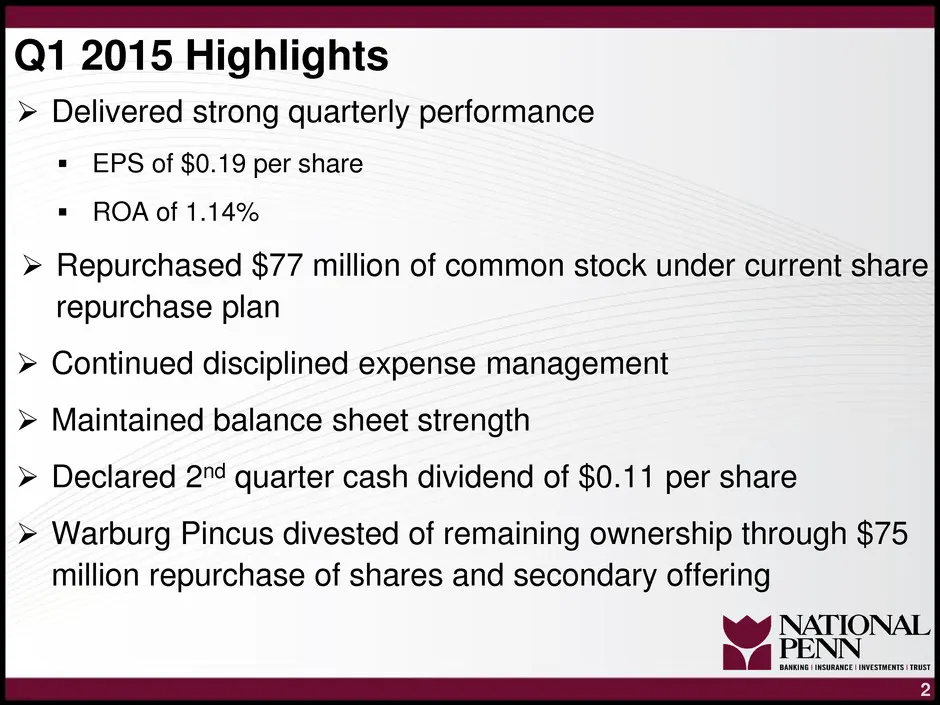
Q1 2015 Highlights > Delivered strong quarterly performance = EPS of $0.19 per share = ROA of 1.14% > Repurchased $77 million of common stock under current share repurchase plan > Continued disciplined expense management > Maintained balance sheet strength > Declared 2" quarter cash dividend of $0.1
Slide 4: Quarterly Earnings and Dividend Trends
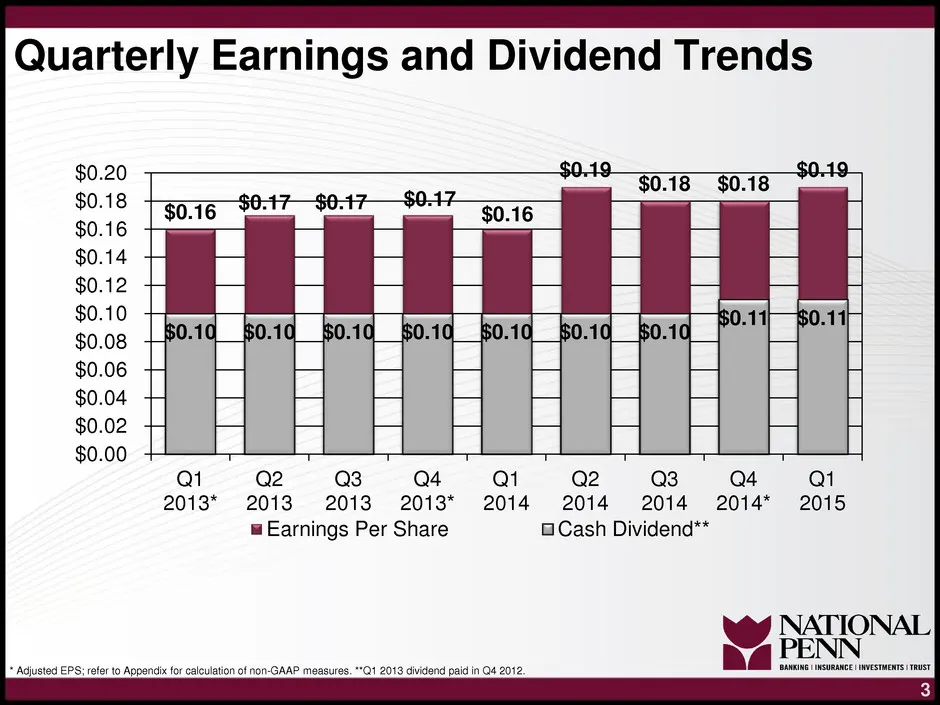
Quarterly Earnings and Dividend Trends Q Q Q4 4 Qi 2013* 2013 2013 2013* 2014 2014 2014 2014* 2015 uw Earnings Per Share Cash Dividend**
Slide 5: Strong Return on Average Assets
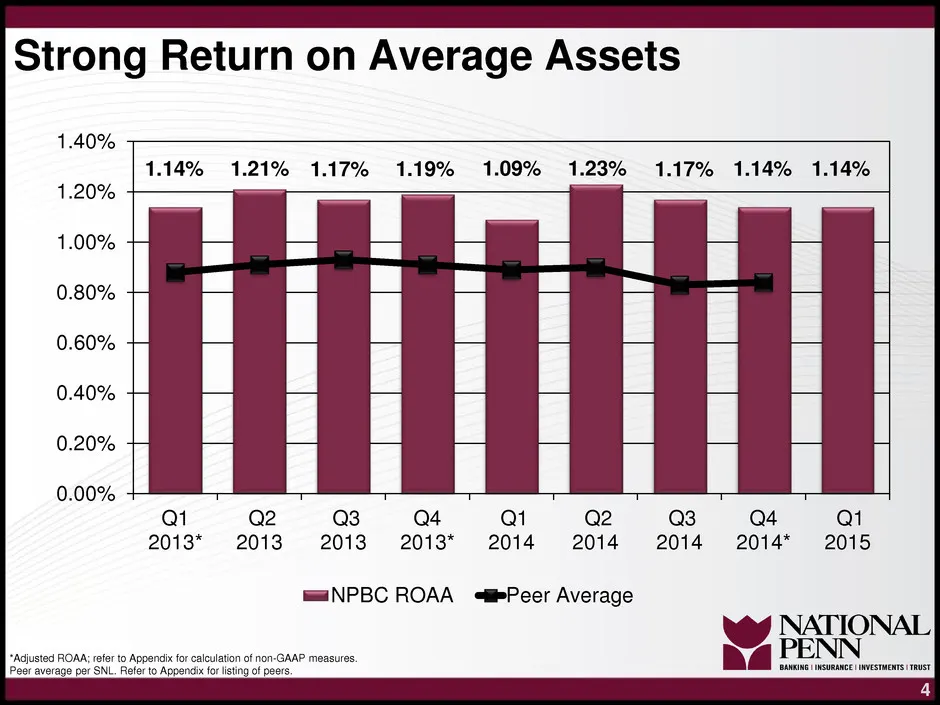
Strong Return on Average Assets 1.40% 1.14% 1.21% 1.17% 1.19% 1.09% 1.23% 1.17% 1.14% 1.14% 1.20% 1.00% 0.80% 0.60% 0.40% 0.20% 0.00% Qi Q4 Qi Q2 Q4 Qi 2013 2013 =2013 2013* 2014 2014 2014 2014* 2015 m=iNPBC ROAA «4iPeer Average NATIONAL peas
Slide 6: Net Interest Income and Margin
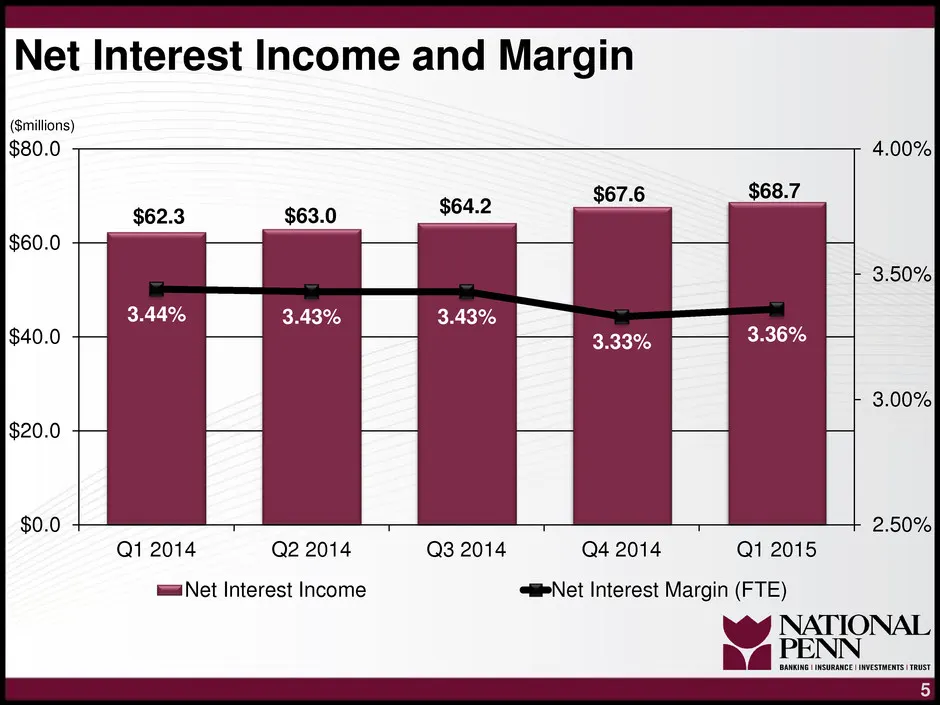
Net Interest Income and Margin ($millions) $80.0 3.44% 3.43% Q1 2014 Q2 2014 Q3 2014 Q4 2014 Q1 2015 tz Net Interest Income Net Interest Margin (FTE) Wey NATIONAL
Slide 7: Disciplined Loan Growth
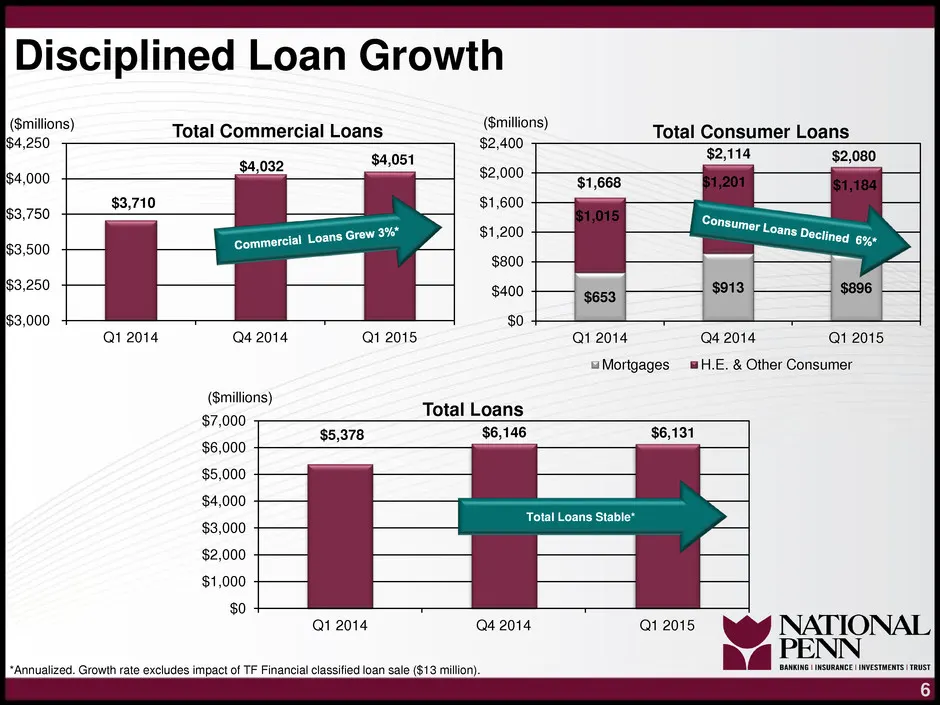
Disciplined Loan Growth Loans Total Consumer Loans (Smillions) (Smillions) is4,250 $2,400 cat $2,000 + $1,600 $1,200 $800 183,750 $2,084 Qi 2014 Q4 2014 Qt 2015 Qt 2014 Q4 2014 Q1 2015 Mortgages #H.E. & Other Consumer (Smillions) $7,000 $6,000 Qt 2014 Q4 2014 “Annualized. Growth rate excludes impact
Slide 8: Factors Influencing Loan Growth in Q1 2015
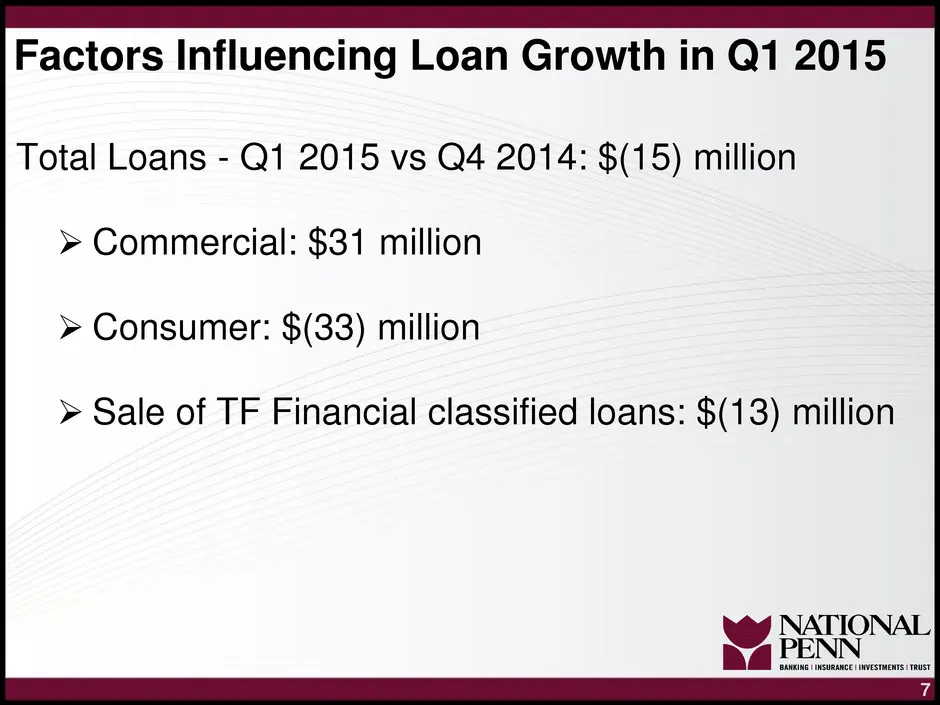
Factors Influencing Loan Growth in Q1 2015 Total Loans - Q1 2015 vs Q4 2014: $(15) million > Commercial: $31 million > Consumer: $(33) million > Sale of TF Financial classified loans: $(13) million
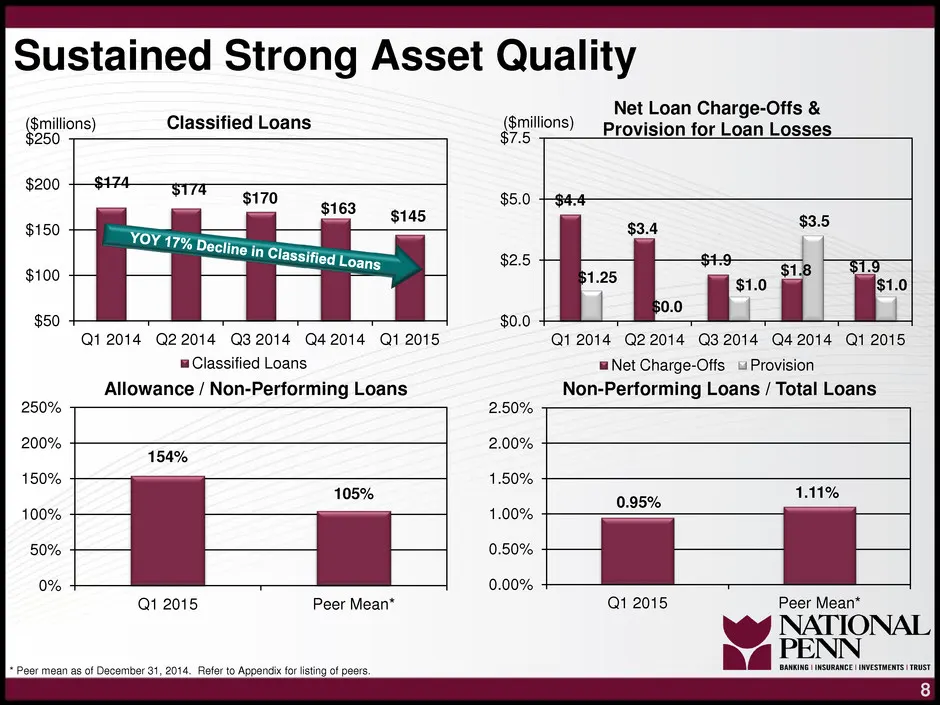
Slide 9: Sustained Strong Asset Quality
Sustained Strong Asset Quality gaitions) 3250 $200 $150 $100 $50 Classified Loans ($mi 7.5 Net Loan Charge-Offs & Provision for Loan Losses lions) $474 31785479 YOY 17%, Decline i |_| Q1 2014 Q22014 Q32014 Q42014 Q1 2015 ™ Classified Loans Allowance / Non-Performing Loans Q1 2014 Q22014 032014 Q4201
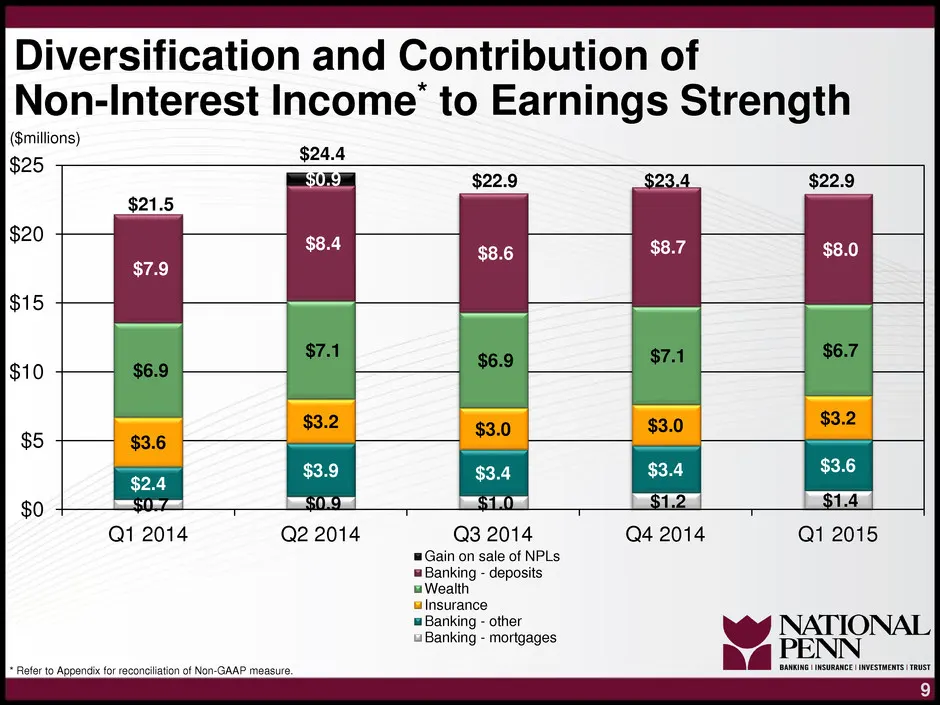
Slide 10: Diversification and Contribution of Non-Interest Income to Earnings Strength
Diversification and Contribution of Non-Interest Income’ to Earnings Strength ($millions) aa 2) z we 0.9 $22.9 $23.4 $22.9 $20 $15 $10 $5 1.4 Q1 2014 Q2 2014 Q3 2014 Q4 2014 Q1 2015 Gain on sale of NPLs Banking - deposits Banking - other u Banking - mortgages
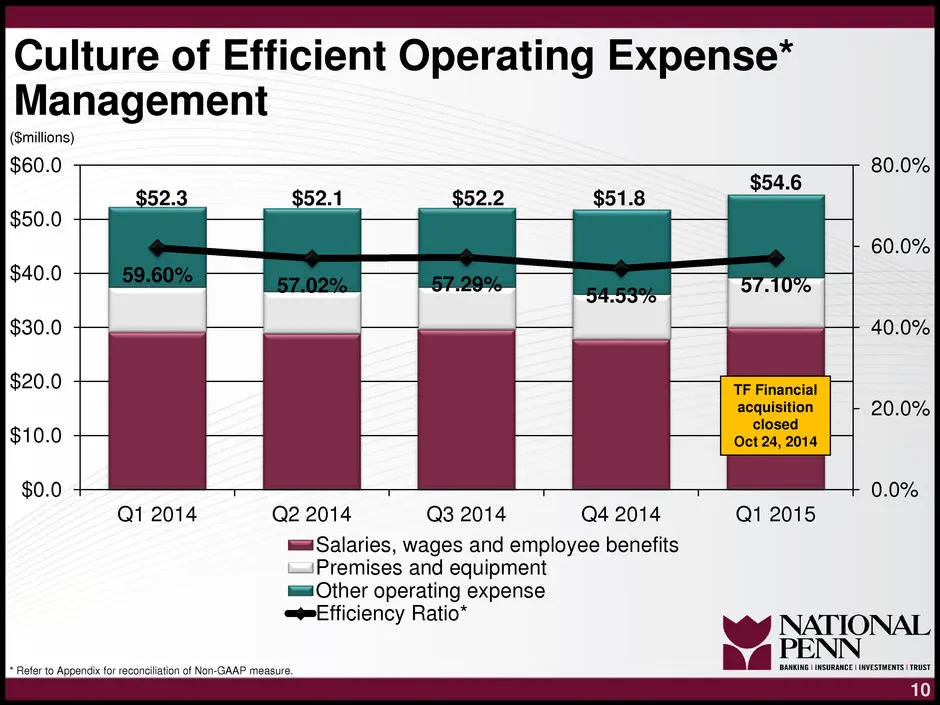
Slide 11: Culture of Efficient Operating Expense Management
Culture of Efficient Operating Expense* Management (Smillions) $60.0 $50.0 $40.0 $30.0 $20.0 $10.0 $0.0 Q1 2014 Q2 2014 Q3 2014 Q4 2014 Q1 2015 waaSalaries, wages and employee benefits —iPremises and equipment sa Other operating expense Efficiency Ratio* wy Te
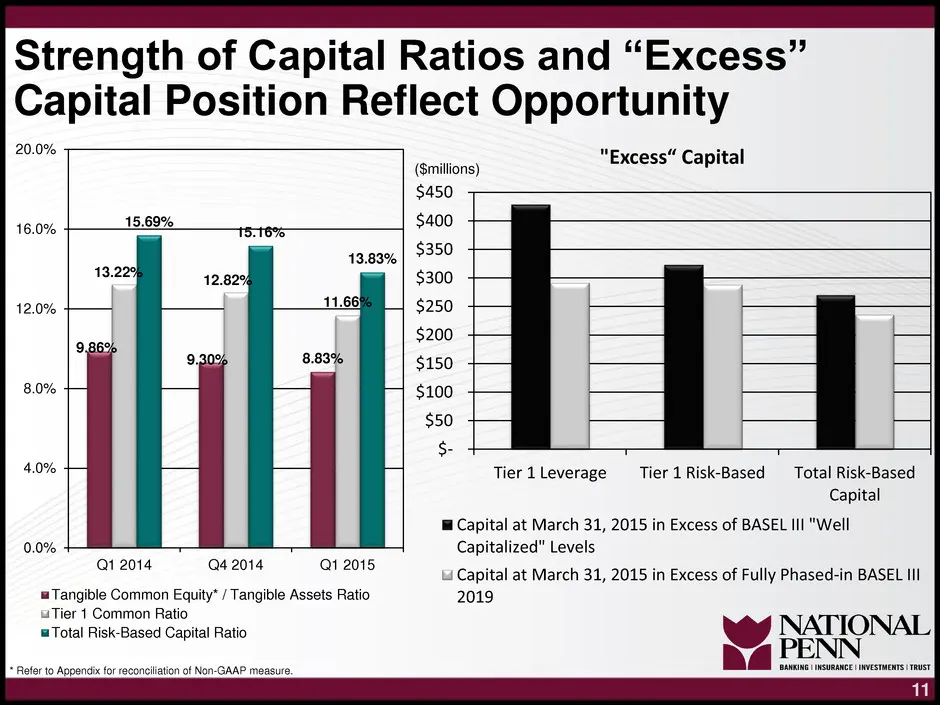
Slide 12: Strength of Capital Ratios and "Excess" Capital Position Reflect Opportunity
Strength of Capital Ratios and “Excess” Capital Position Reflect Opportunity 20.0% " ae i (Smillons) Excess“ Capital $450 16.0% 15.69% : $400 $350 $300 12.0% $250 $200 $150 8.0% $100 $50 $- 4.0% Tier 1Leverage Tier 1 Risk-Based _Total Risk-Based Capital Capital at March 31, 2015 in Excess of BASEL I
Slide 13: National Penn Continues to Build Long-Term Shareholder Value
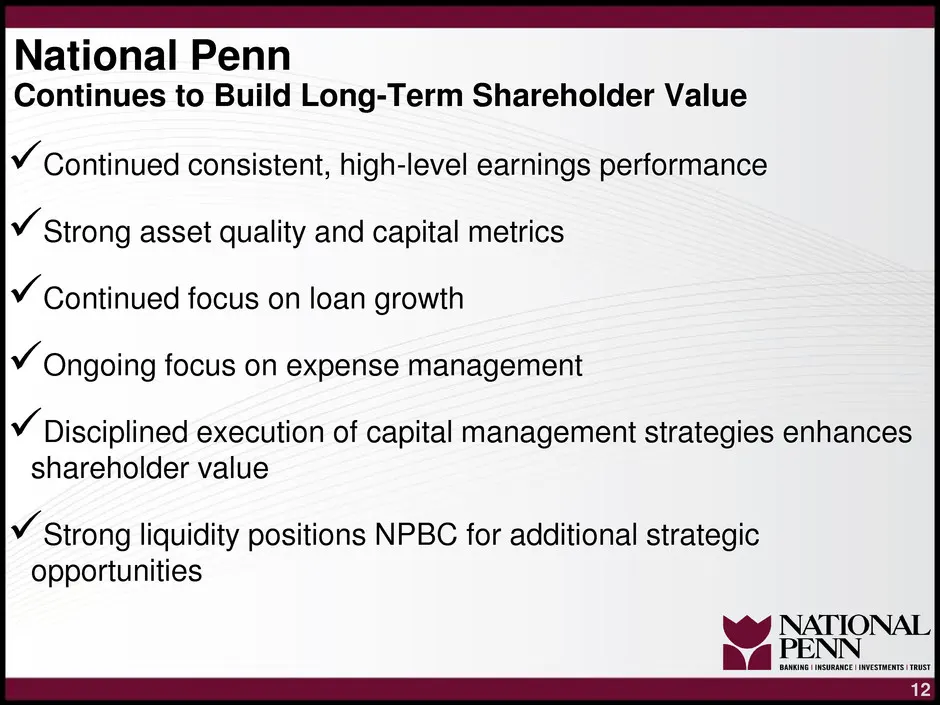
National Penn Continues to Build Long-Term Shareholder Value Y¥ Continued consistent, high-level earnings performance v Strong asset quality and capital metrics Y¥ Continued focus on loan growth Y¥ Ongoing focus on expense management Y Disciplined execution of capital management strategies enhances
Slide 14: Appendix
Appendix
Slide 15: NPBC Peer Group
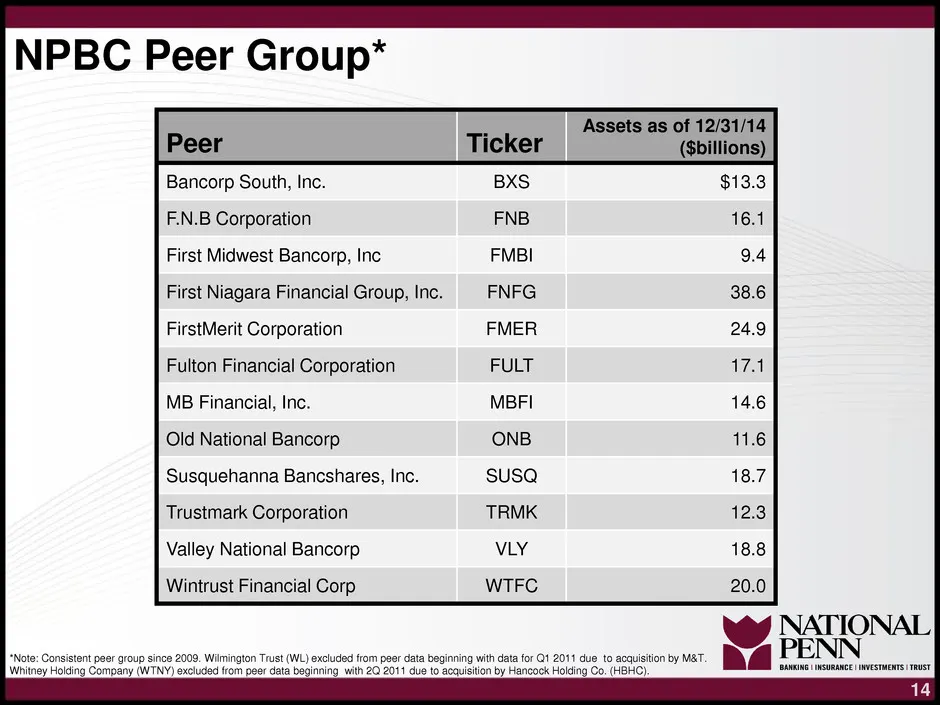
NPBC Peer Group* Assets as of 12/31/14 Peer Ticker ($billions) Bancorp South, Inc. $13.3 F.N.B Corporation 16.1 First Midwest Bancorp, Inc 9.4 First Niagara Financial Group, Inc. 38.6 FirstMerit Corporation 24.9 Fulton Financial Corporation ile MB Financial, Inc. 14.6 Old National Bancorp 11.6 Susqu
Slide 16: Reconciliation of Non-GAAP Measures
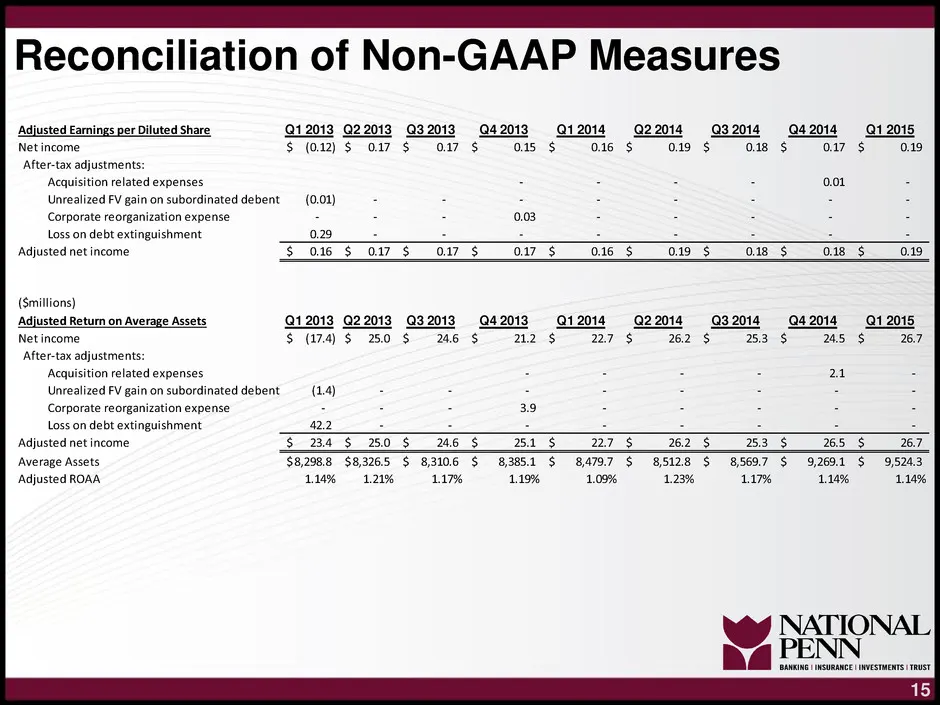
Reconciliation of Non-GAAP Measures ‘Adjusted Earnings per Diluted Share 012013 922013 Net income $ (012) $ 0.7 After-tax adjustments: Q32013 42013 Q12014 © @2.2014 a7 $ 015 $ 016 $ ~—O9 ‘idotclogad igbene (0.01) 0.29 : . : Adjusted net income $016 $017 $017 _$ 019 _$ (Smiltions) ‘Adjusted Return on
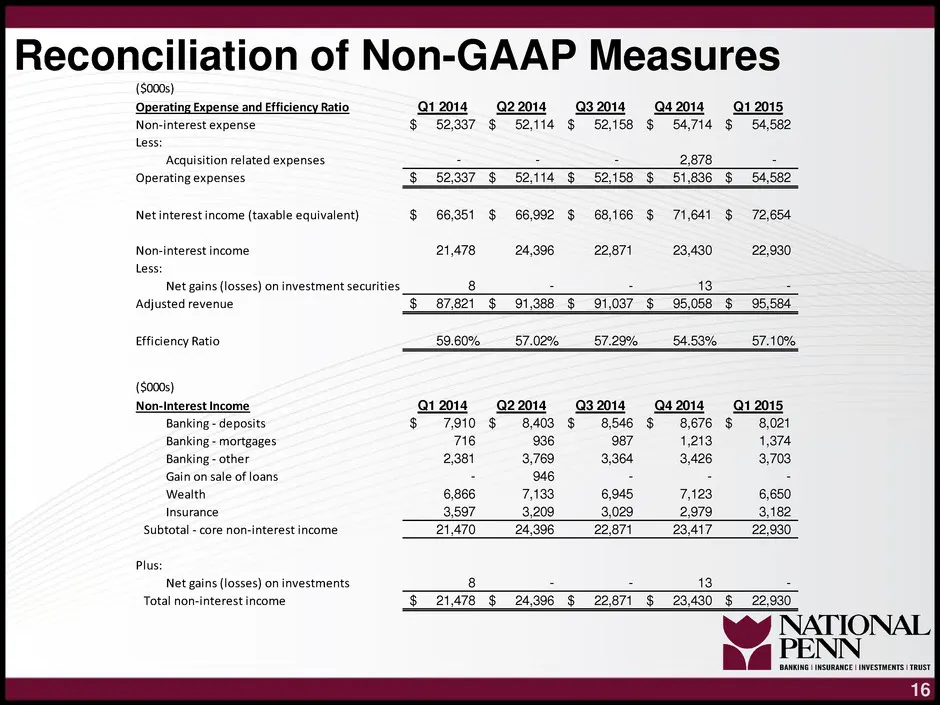
Slide 17: Reconciliation of Non-GAAP Measures
Reconciliation of Non-GAAP Measures ($000s) Operating Expense and Efficiency Rati 12014 22014 32014420141 2015, Non-interest expense $ 52,337 $ 52,114 § 52,158 $ 54,714 § 54,582 Less: Aeon eldad area 378 Operating expen: $_ 52,337 _$ 52114 § 52.158 $ 51,836 _$ 54.582 Net interest income (taxable equ
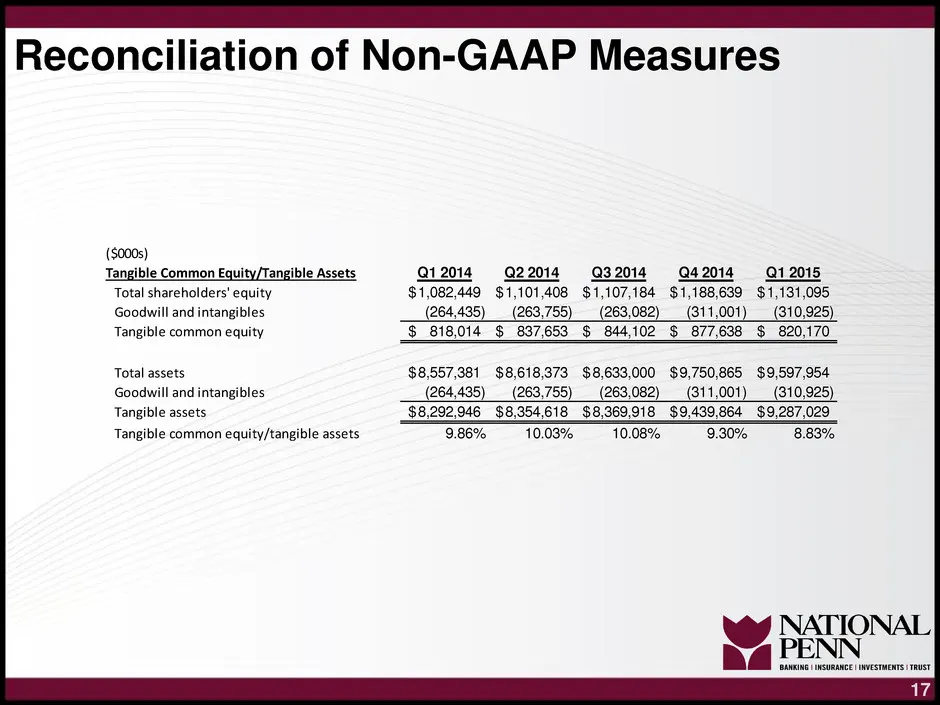
Slide 18: Tangible Common Equity/Tangible Assets
(000s) Tangible Common Equity/Tangible Assets Total someon Esai Goodwill and int Tangible common ie Total assets ;oodwill and intangibles Tangible assets Tangible common equity/tangible assets 12014 © 22014 3.2014 Q4 2014 Reconciliation of Non-GAAP Measures Q12015 $1,082,449 $1,101,408 $1,107,184 $1
Source: SEC EDGAR · 8-K filed Apr 24, 2015
More decks from National Penn Bancshares
 BB&T Global Financial Services Conference (September 2015)33 slides · Sep 16, 2015
 Merger or Acquisition (August 2015)13 slides · Aug 18, 2015
 Q2 2015 Earnings Presentation17 slides · Jul 23, 2015
 Investor Presentation (February 2015)36 slides · Feb 11, 2015
 Q4 2014 Earnings Presentation16 slides · Jan 22, 2015
 Investor Presentation (November 2014)37 slides · Nov 12, 2014