National Penn Bancshares — Investor Presentation (February 2015)
36 slides from National Penn Bancshares's investor presentation, Feb 11, 2015
Slide 1: National Penn Bancshares, Inc. (NPBC)
National Penn Bancshares, Inc. (NPBC) Consistent Performance 4 Well-Positioned for Growth S PENN. February 12, 2015 Mee
Slide 2: Safe Harbor Regarding Forward Looking Statements
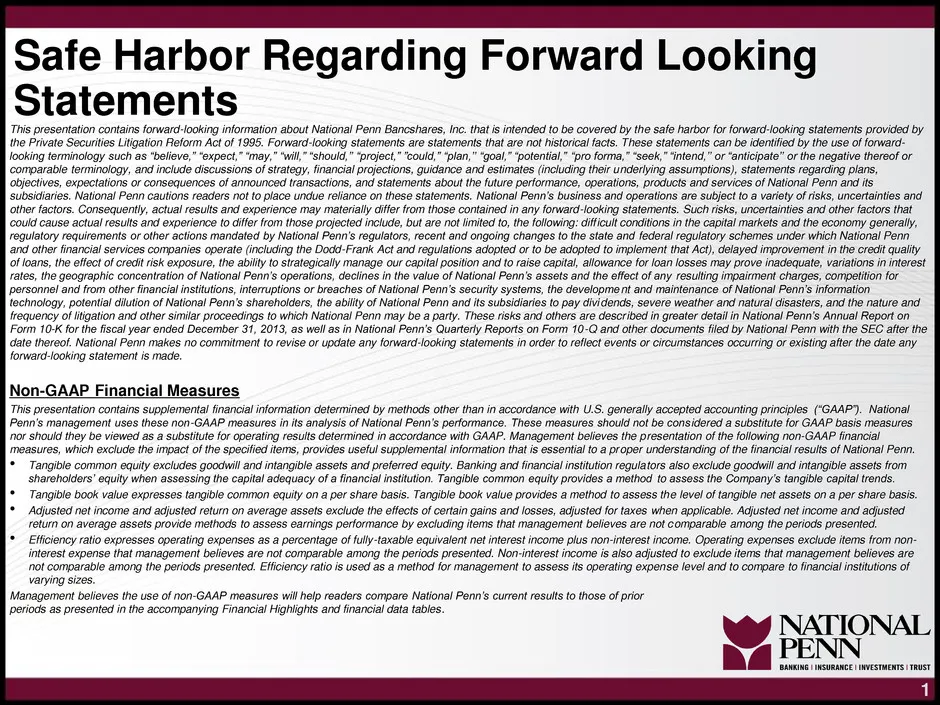
Statements = r Safe Harbor Regarding Forward Looking 1996. looking terminology such as “believe,” “expect,” “may,” “wil,” ‘should, ”‘projec,” “could,” “plan,” “goal,” potential,” ‘pro forme,” “seek,” “intend,” or “anticipate” or the negative thereof or obj other SK ‘generally, nal Penn systems, sili
Slide 3: Leading Community Bank in Eastern PA
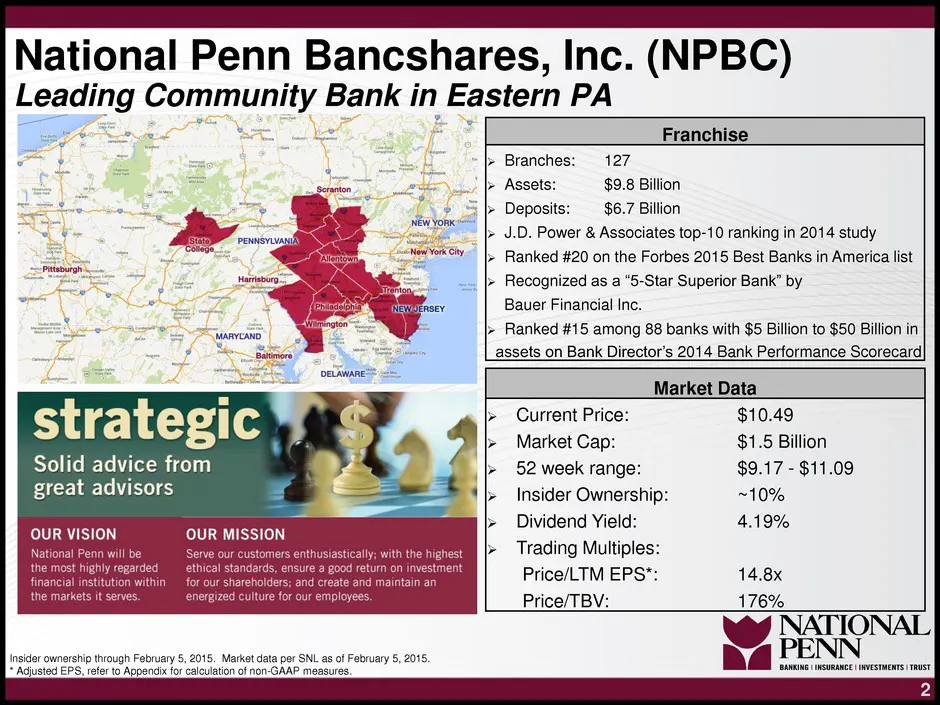
National Penn Bancshares, Inc. (NPBC) Leading Community Bank in Eastern PA Solid advice from great advisors OUR VISION OUR MISSION National Penn willbe Se 2 custo enhusiesisaly, wi Cre Net ly regardk cs sericea coltrane in folders and eerie an uantln an the markets it serves. ES caus fo ur employe I
Slide 4: Concentrated Franchise
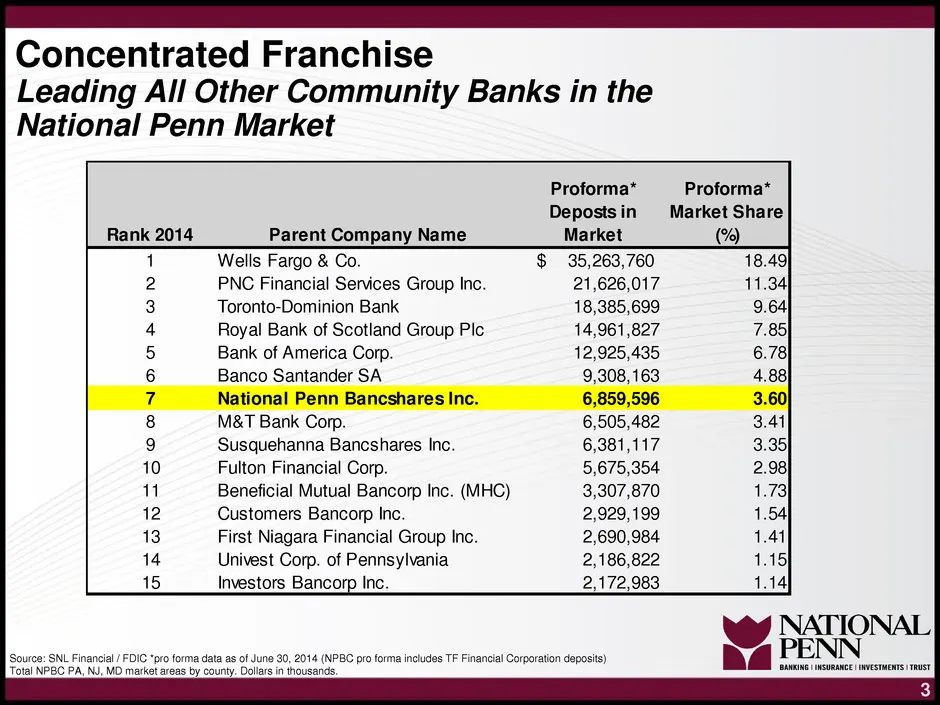
Concentrated Franchise Leading All Other Community Banks in the National Penn Market Proforma* Proforma* Market Share Rank 2014 Parent Company Name Wells Fargo & Co. PNC Financial Services Group Inc. 21,626,017 Toronto-Dominion Bank 18,385,699 Royal Bank of Scotland Group Plc 14,961,827 Bank of Amer
Slide 5: Repurchase of Shares Owned by Warburg Pincus
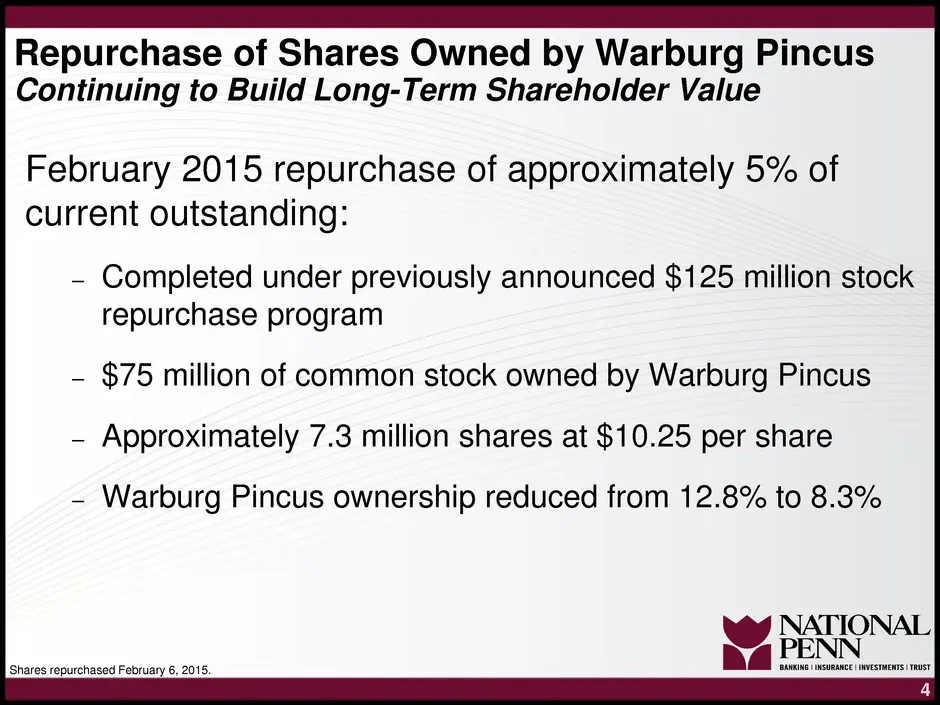
Repurchase of Shares Owned by Warburg Pincus Continuing to Build Long-Term Shareholder Value February 2015 repurchase of approximately 5% of current outstanding: - Completed under previously announced $125 million stock repurchase program - $75 million of common stock owned by Warburg Pincus - Appro
Slide 6: TF Financial Corporation Acquisition
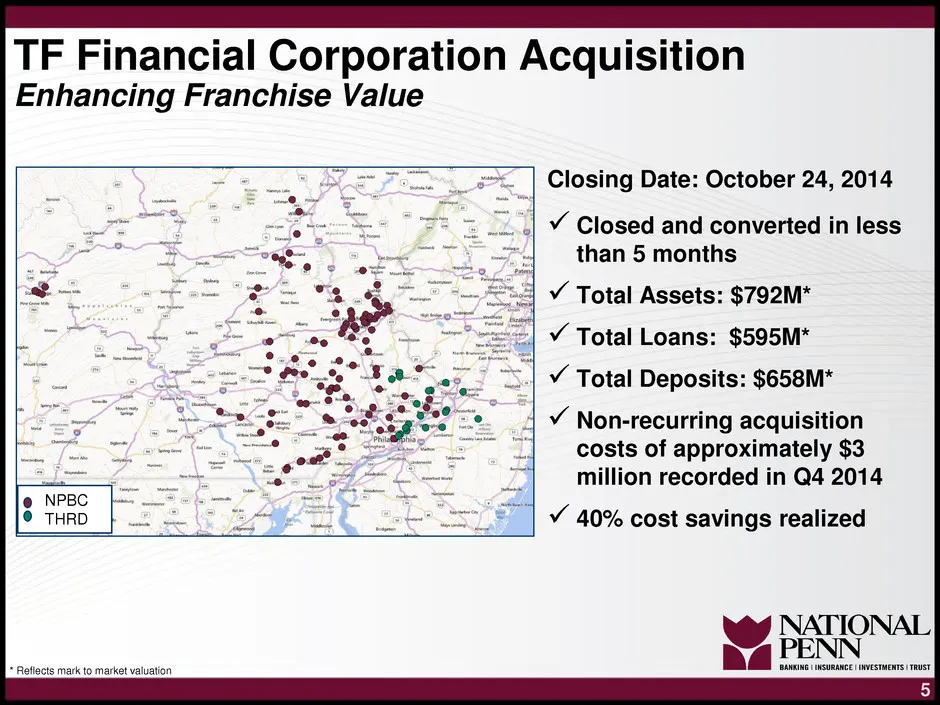
TF Financial Corporation Acquisition Enhancing Franchise Value Closing Date: October 24, 2014 Y Closed and converted in less than 5 months | V Total Assets: $792M* Y Total Loans: $595M* | ¥ Total Deposits: $658M* | ¥ Non-recurring acquisition costs of approximately $3 million recorded in Q4 2014 ¥ 4
Slide 7: Sustained Earnings Performance and Strong ROAA Trend
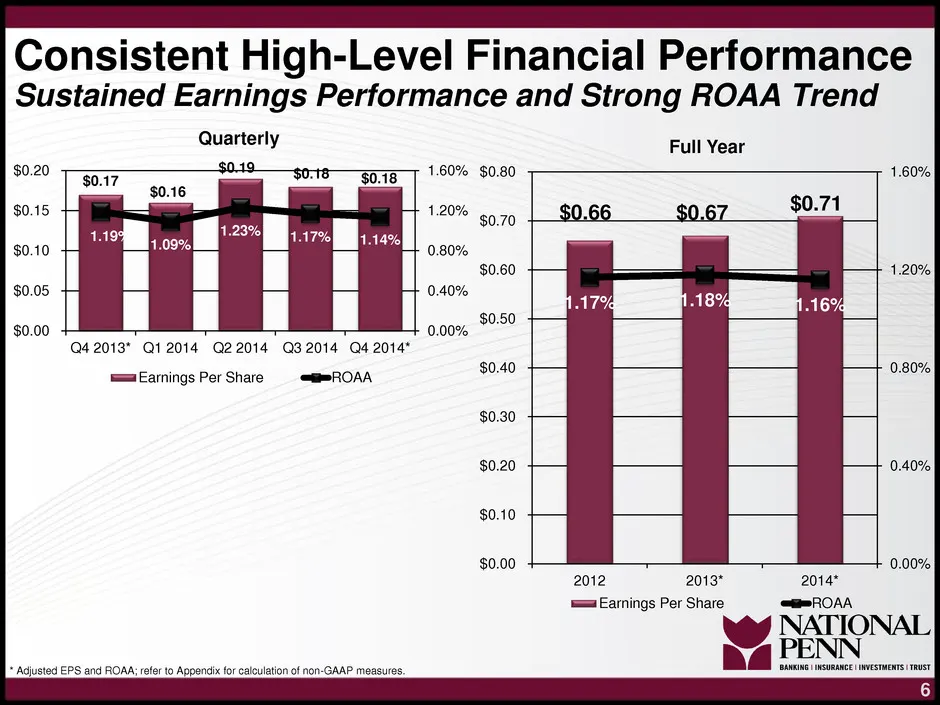
Consistent High-Level Financial Performance Sustained Earnings Performance and Strong ROAA Trend Quarterly $0.20 $0.19 - ; 1.60% $0.80 tr | Full Year $0.15 = | $0.10 i $0.05 | $0.00 1.20% 242013" Q12014 Q22014 32014 Q4 2014 s=srEarnings Per Share mROAA
Slide 8: Sustained Strong Return on Assets
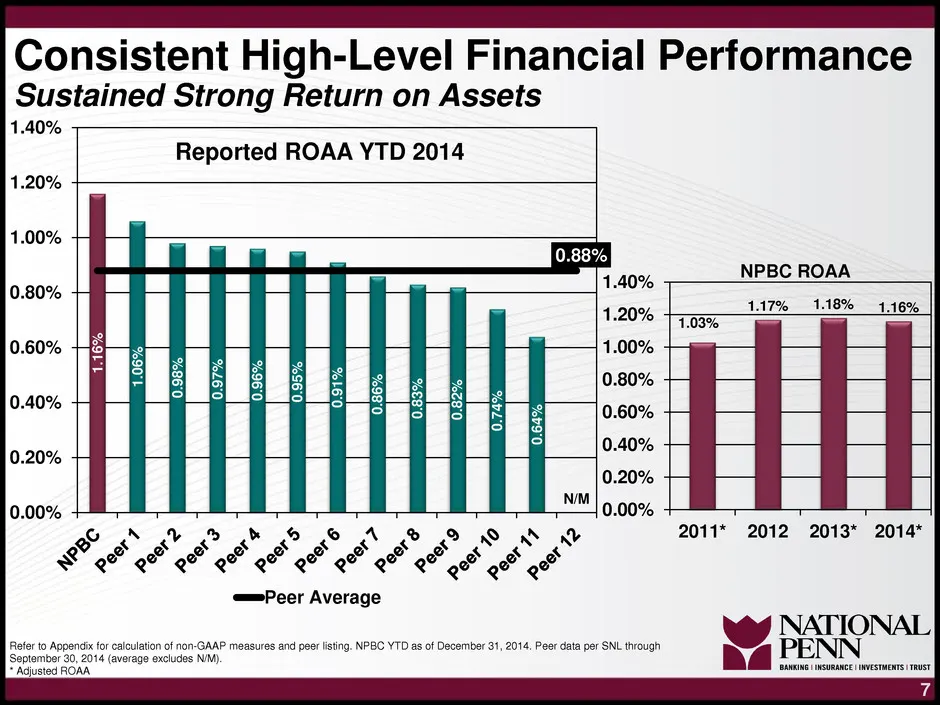
Consistent High-Level Financial Performance Sustained Strong Return on Assets 1.40% Reported ROAA YTD 2014 1.20% 1.00% 0.80% 0.60% 0.40% 0.20% z = 0.00% 08% ° 0.96% | 0.64% A 2011* 2012 2013* 2014* & $ o © eee e ra “é & ee ee ot ee 2 r) m ==Peer Average 2014, Pear data per SNL through NATIONAL KY EN
Slide 9: Stable Margin in a Historically Low Rate Environment
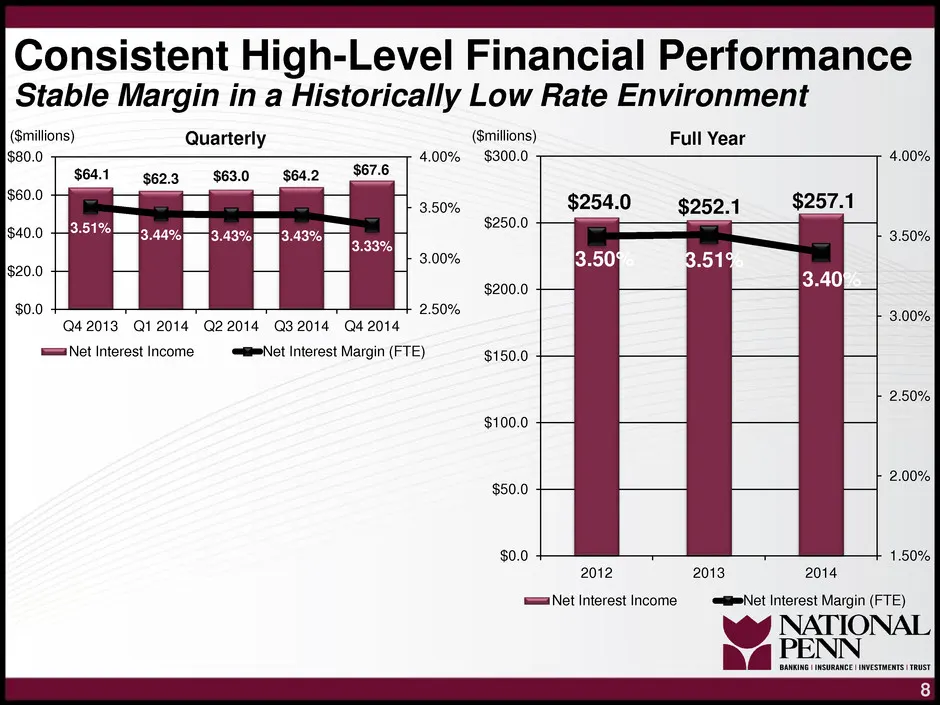
Consistent High-Level Financial Performance Stable Margin in a Historically Low Rate Environment (Smilions) Quarterly (Smillions) $80.0 Full Year 4.00% $300.0 $63.0 $64.2 3.50% $254.0 $252.1 $257.1 3.00% 0) 2.50% Q4 2013 Q12014 Q22014 Q32014 Q42014 '=2Net Interest Income ~—Net Interest Margin (FTE)
Slide 10: Disciplined Growth of Quality Loans
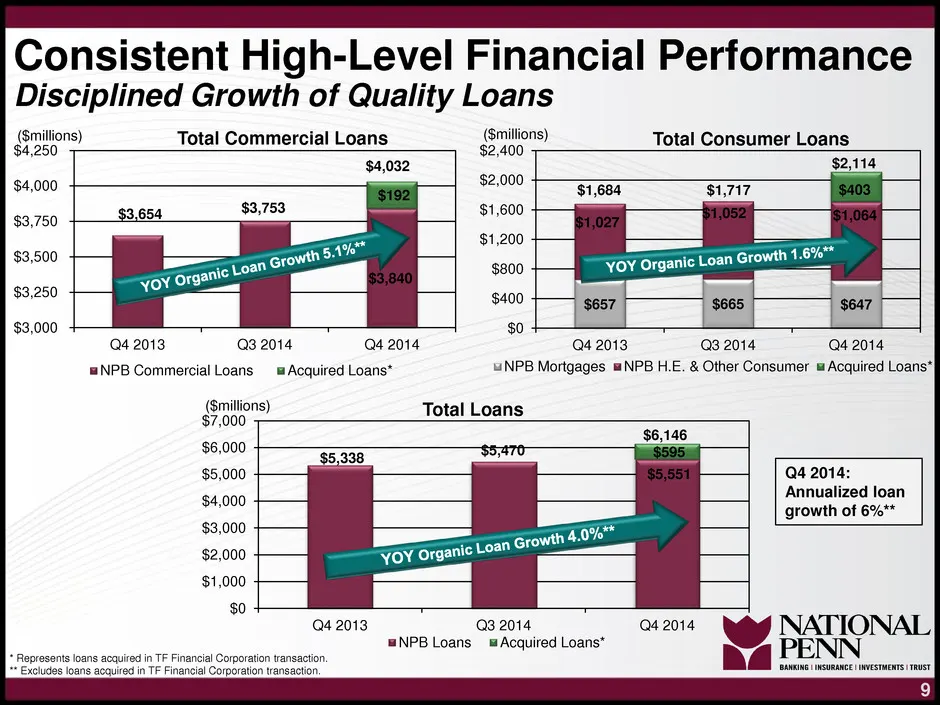
Consistent High-Level Financial Performance Disciplined Growth of Quality Loans (Smilions) Cc (Smillions) $4250 Total a $2,400 Total Consumer Loans $2,000 + $1,600 $4,000 $3,750 4 | $1,200 $3,500 —aaormnie Loan Growth 1.6%" $800 YOY Organi $3,250 a $400 $3,000 Q4 2013 a3 2014 4 2014 = NPB Commercial
Slide 11: Fortress Balance Sheet - Superior Asset Quality
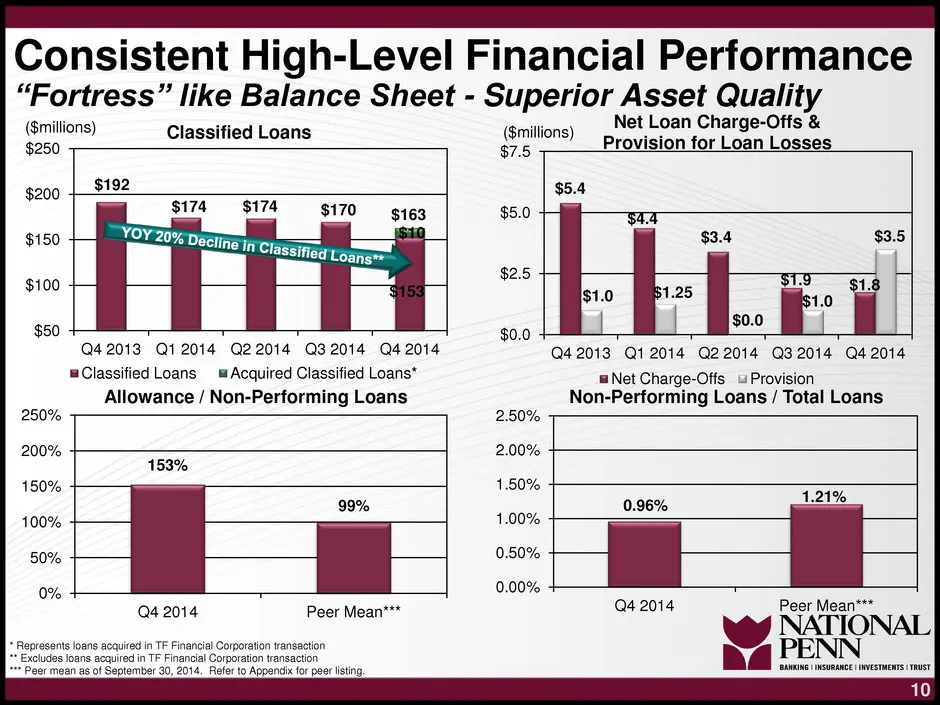
Consistent High-Level Financial Performance “Fortress” like Balance Sheet - Superior Asset Quality (Smillions) $250 Classified Loans Net Loan Charge-Offs & ee Provision for Loan Losses $200 | $192 $174 $174——«170 $150 $100 Q4 2013 Q1 2014 Q22014 Q32014 Q42014 Classified Loans ™ Acquired Classified L
Slide 12: Diversified Revenue Sources
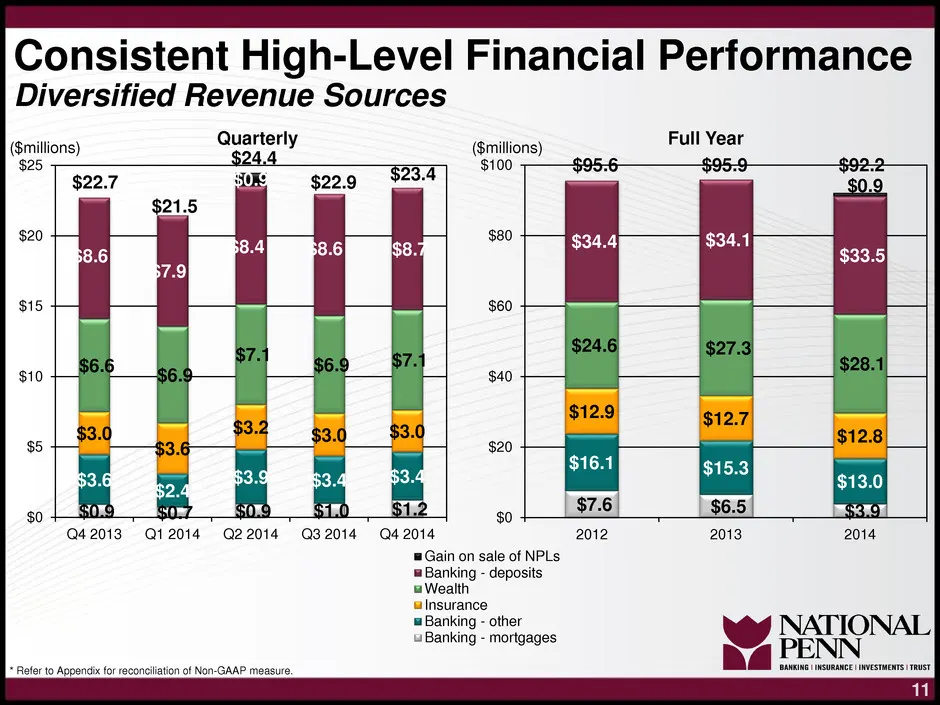
Consistent High-Level Financial Performance Diversified Revenue Sources Quarterly Full Year ($millions) ($millions) $25 $24.4 $100 $22.7 au g22,.9 $23.4 21. 5 3.61 8.4 Ro SS. 7.9) $0.9 $1.c 2 Q42013 Q12014 =Q22014 = Q32014 42014 = Gain on sale of NPLs = Banking - deposits u Banking - mortgages
Slide 13: Diversified Revenue Sources
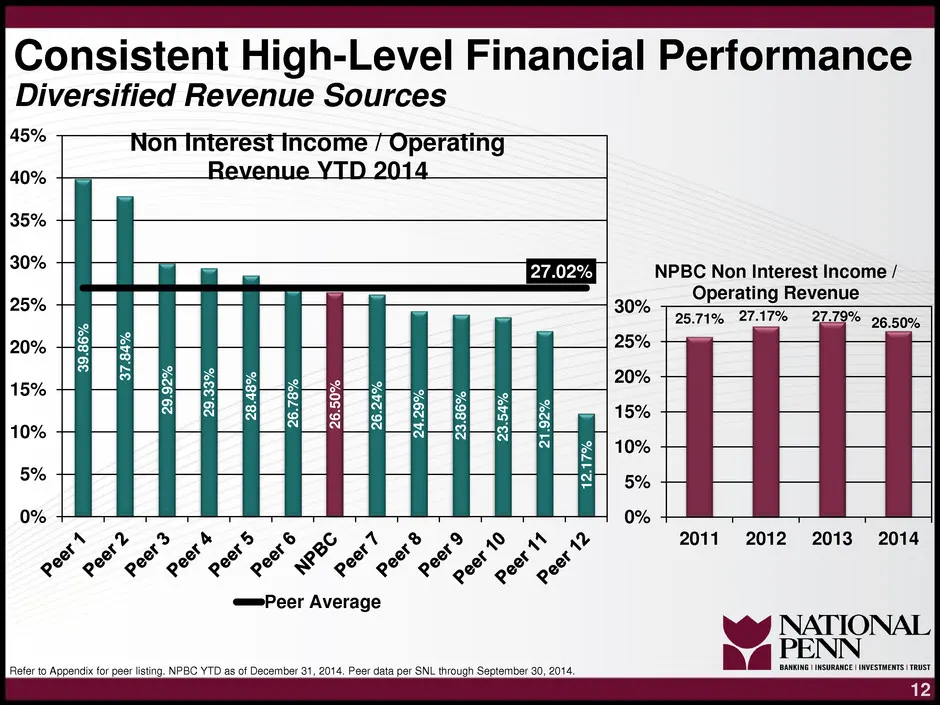
Consistent High-Level Financial Performance Diversified Revenue Sources a Non Interest income / Op wk YTD 2014 35% 30% NPBC Non Interest Income / 25% 20% 15% 10% 5% 0% °? ar °y ar °S ar rT 26:72 % ed FS Ss SPE EE SESS ee =Peer Average FRter to Appendix for per listing. NPBC YTO as of December 31, 20
Slide 14: Disciplined Operating Expense Management
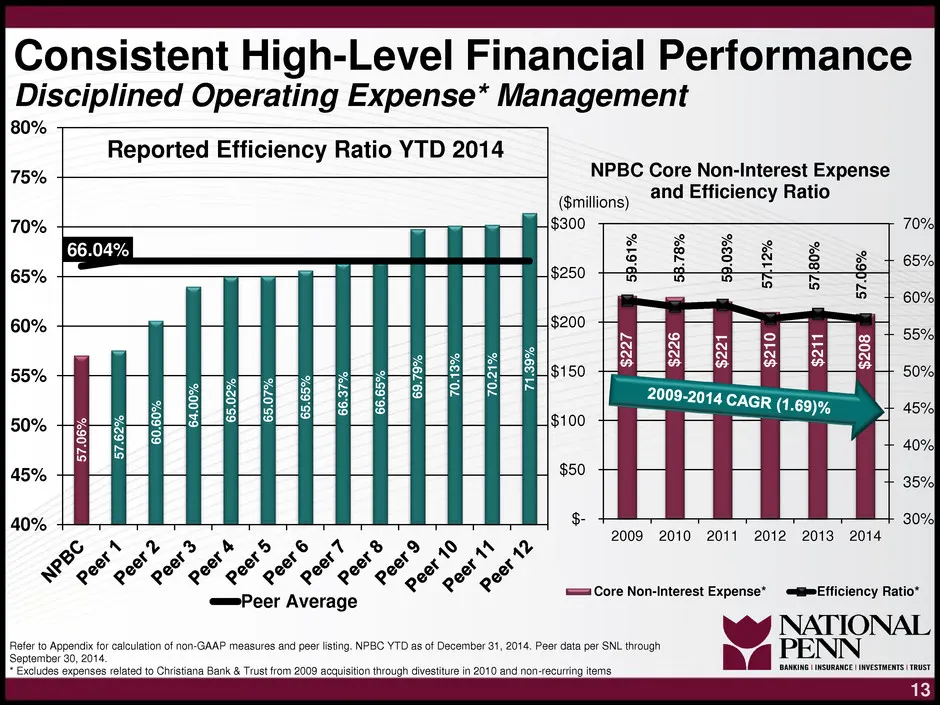
Consistent High-Level Financial Performance Disciplined Operating Expense* Management 80% Reported Efficiency Ratio YTD 2014 75% NPBC Core Non-Interest Expense and Efficiency Ratio (millions) $300 70% 65% 60% 55% 50% 45% 40% eM ee cms Ph 65.65% °> | re 77 ee 2009 2010 2011 2012 2013 2014 v e > © xv
Slide 15: NPBC Senior Debt Issuance
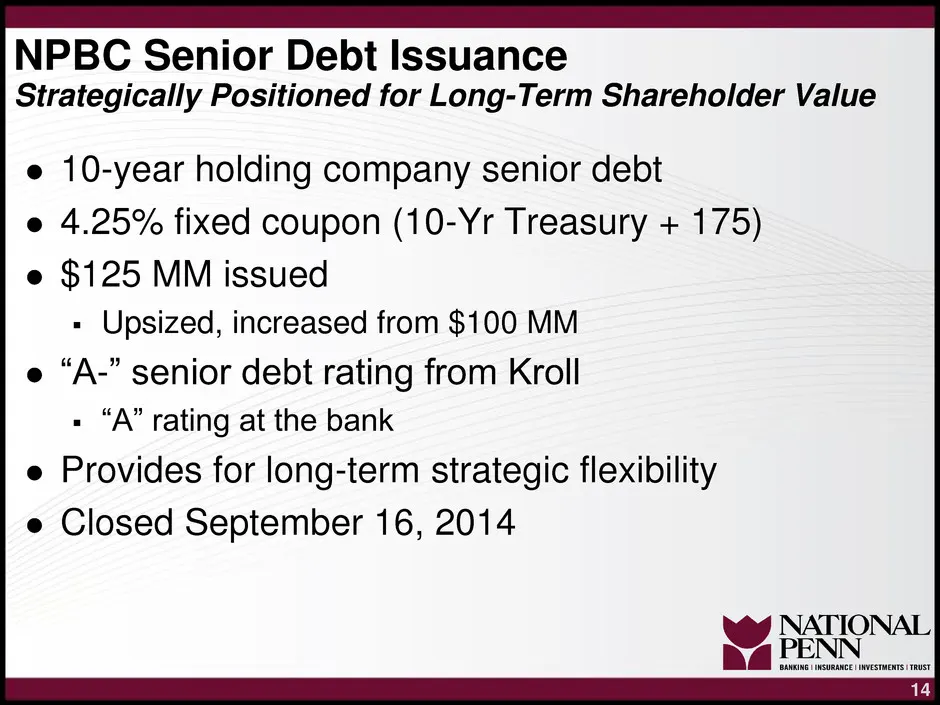
NPBC Senior Debt Issuance Strategically Positioned for Long-Term Shareholder Value e 10-year holding company senior debt e 4.25% fixed coupon (10-Yr Treasury + 175) e $125 MM issued « Upsized, increased from $100 MM e “A-” senior debt rating from Kroll » “A” rating at the bank e Provides for long-te
Slide 16: Holding Company Liquidity - NPBC Liquidity
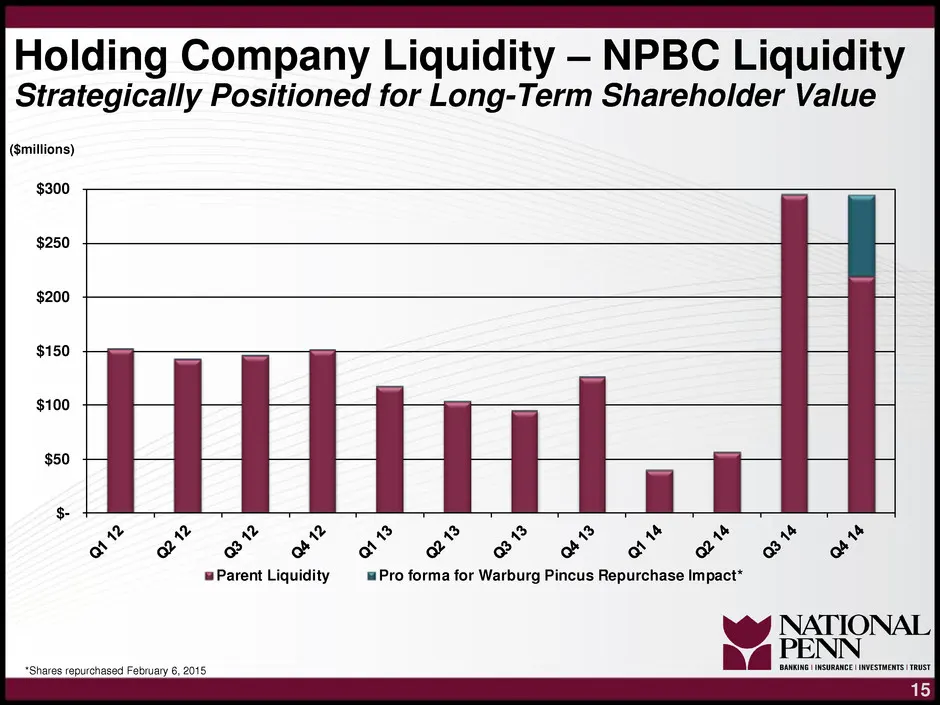
Holding Company Liquidity - NPBC Liquidity Strategically Positioned for Long-Term Shareholder Value (Smillions) ov 2 © © © ® e ~ 4 e roa Parent Liquidity Pro forma for Warburg Pincus Repurchase Impact*
Slide 17: Enhanced Holding Company Liquidity
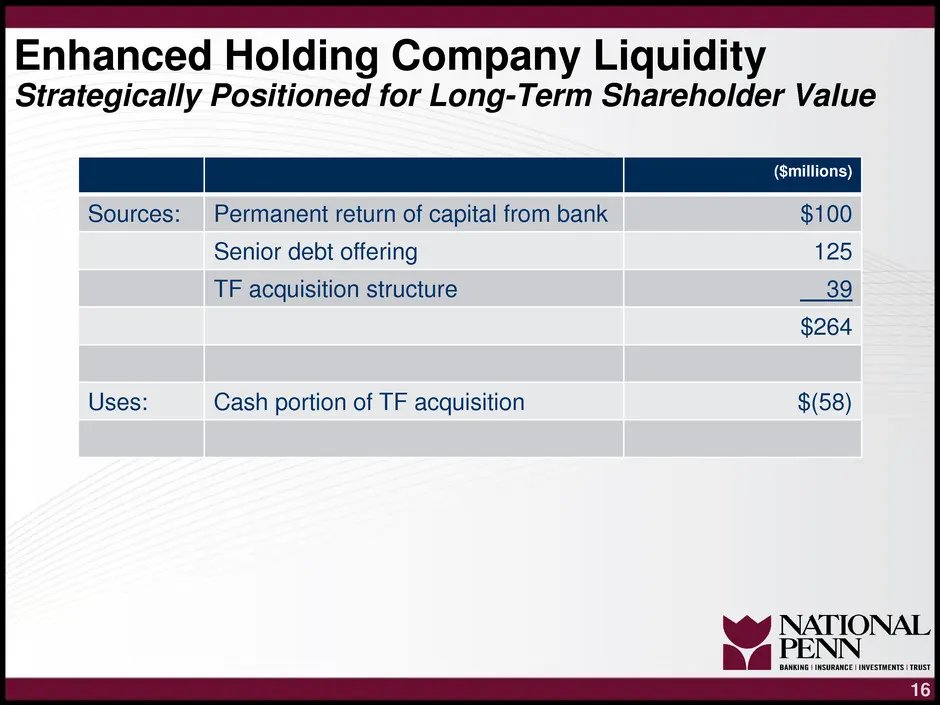
Enhanced Holding Company Liquidity Strategically Positioned for Long-Term Shareholder Value a Permanent return of capital from bank $100 125 Sources: Senior debt offering 39 TF acquisition structure Cash portion of TF acquisition
Slide 18: Strength of Capital Ratios and Excess
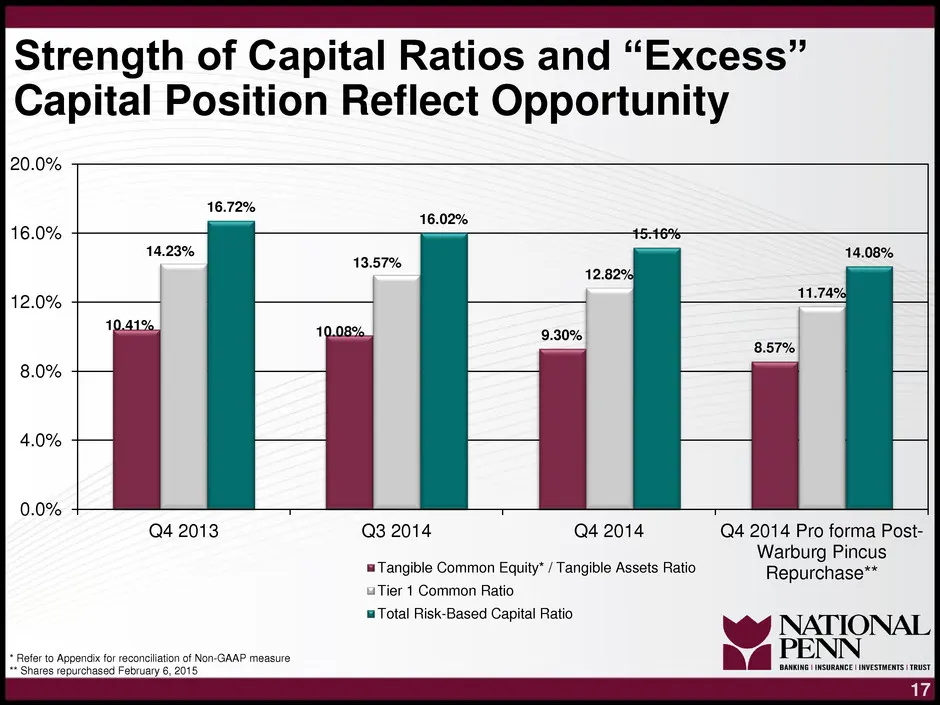
Strength of Capital Ratios and “Excess” Capital Position Reflect Opportunity 20.0% 16.72% 16.0% 12.0% 8.0% 4.0% 0.0% Q4 2013 Q3 2014 Q4 2014 Q4 2014 Pro forma Post- Warburg Pincus p NATIONAL ENN Tangible Common Equity" / Tangibl ts Ratio 1Tier 1 Common Ratio Total Risk-Based Capital Ratio wy * Rafer
Slide 19: Total Return Alternative which Manages Capital Effectively
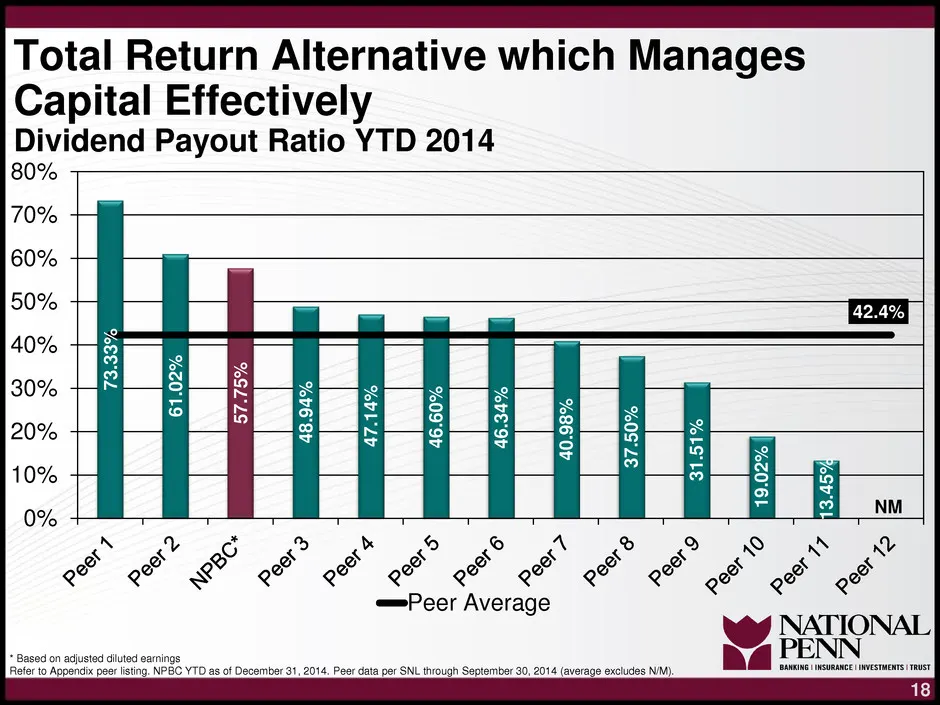
Total Return Alternative which Manages Capital Effectively Dividend Payout Ratio YTD 2014 80%
Slide 20: Total Return Alternative which Manages Capital Effectively
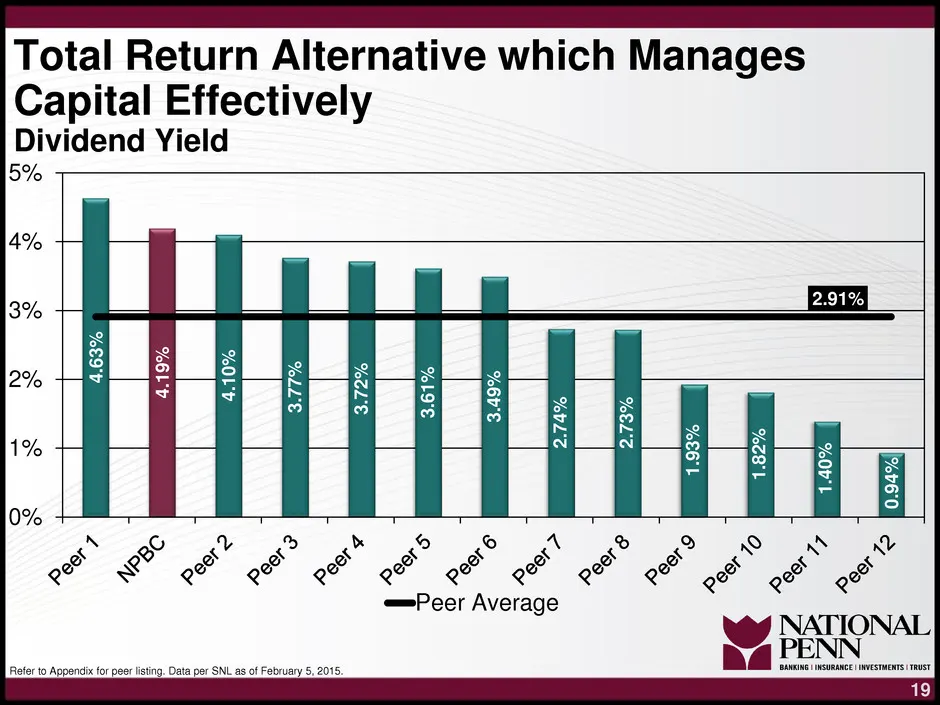
Total Return Alternative which Manages Capital Effectively Dividend Yield 5% 4% 3% 2% 1% Qe? —Peer Average
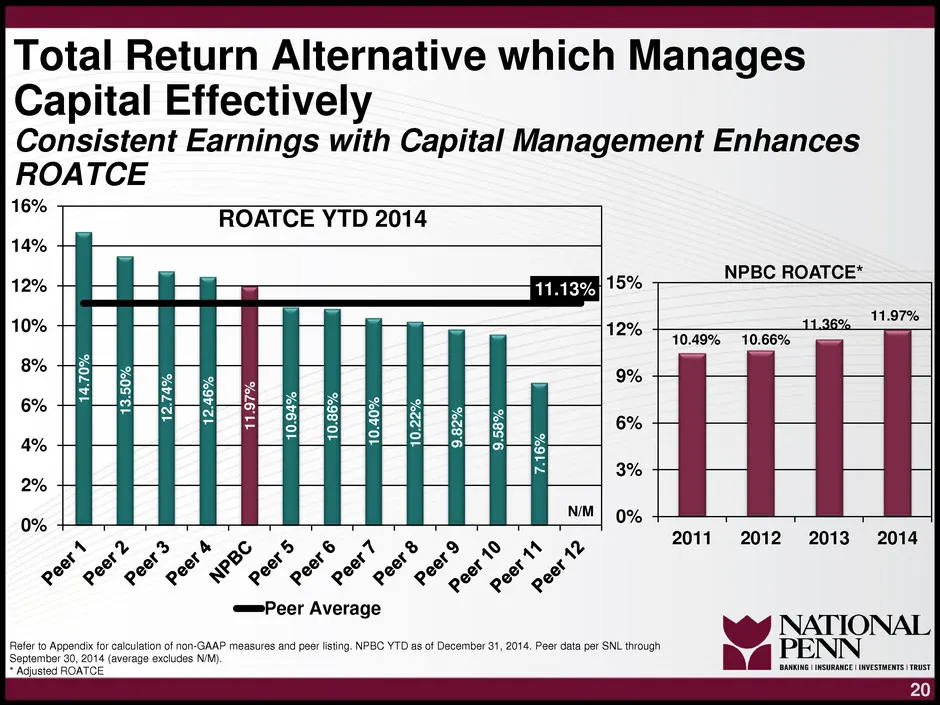
Slide 21: Consistent Earnings with Capital Management Enhances ROATCE
Total Return Alternative which Manages Capital Effectively Consistent Earnings with Capital Management Enhances ROATCE 16% 7 ROATCE YTD 2014 14% 5g | se 15% NPBC ROATCE* : —_—-—________i . 11.97% 10% | | || | || || l| | i I 1 1 19.49% 10.66% 8% 2 9 PROB RARER = 6% a My S & ° | fo i g Hy of OR Fy fd
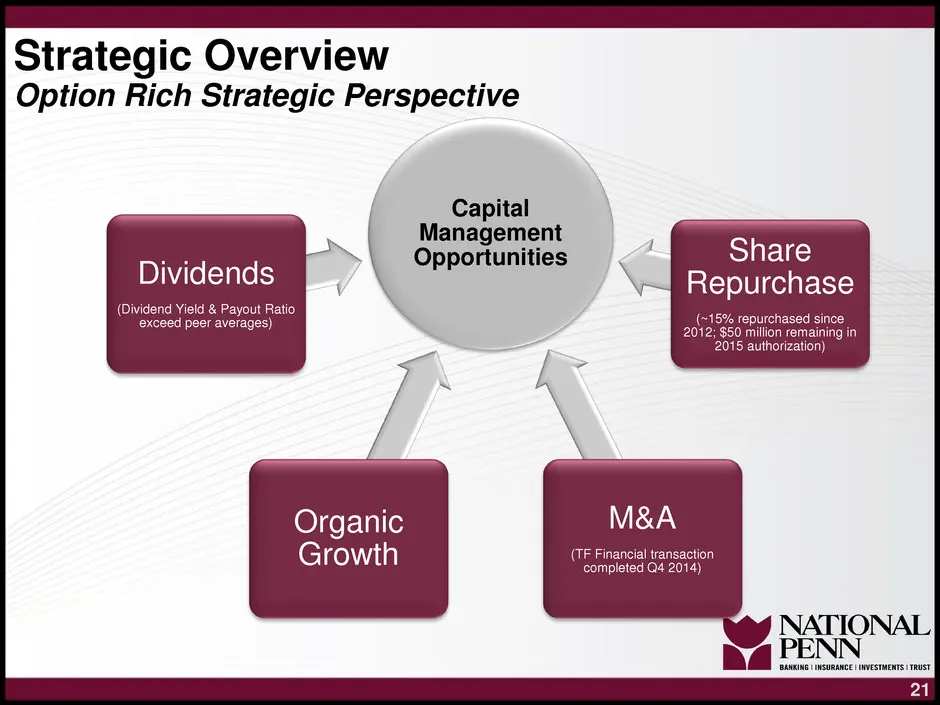
Slide 22: Option Rich Strategic Perspective
Strategic Overview Option Rich Strategic Perspective Capital Management ——— a Opportunities Share Dividends Repurchase (Dividend Yield & Payout Ratio exceed peer averages) % repurchase ed si 2042, $60 rillon remaining in 2015 authorization) Organic M&A Growth (TF Financial transaction completed Q4 2
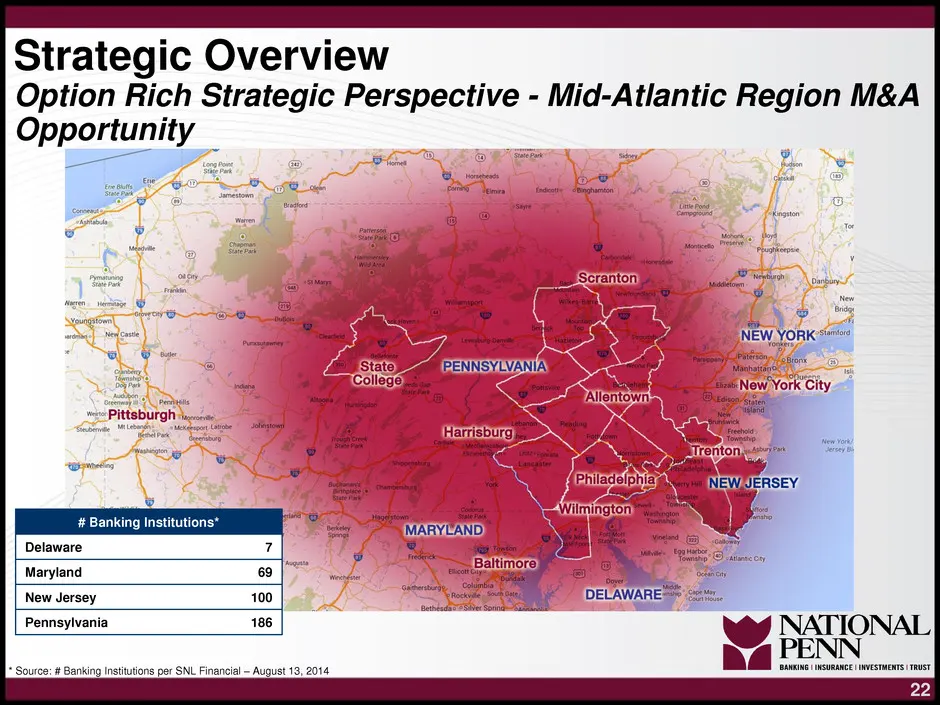
Slide 23: Mid-Atlantic Region M&A Opportunity
Strategic Overview Option Rich Strategic Perspective - Mid-Atlantic Region M&A Opportunity pall & # Banking Institutions’ Delaware Maryland New Jersey Pennsylvania NATIONAL oes: # Barking Itsions per SNL Financ — August 12014
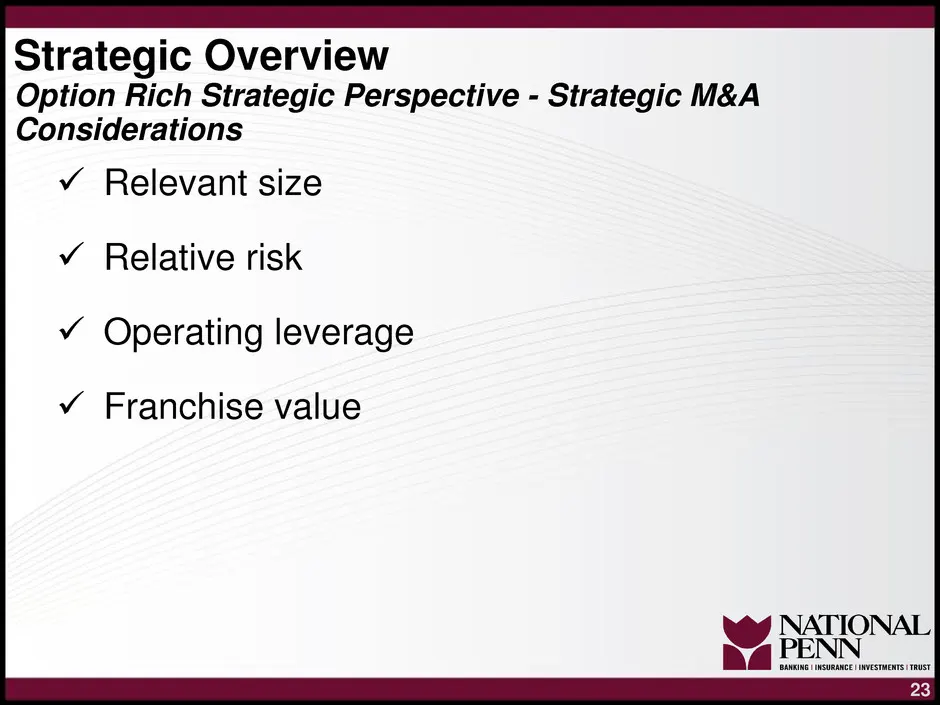
Slide 24: Strategic M&A Considerations
Strategic Overview Option Rich Strategic Perspective - Strategic M&A Considerations v Relevant size v Relative risk v Operating leverage v¥ Franchise value
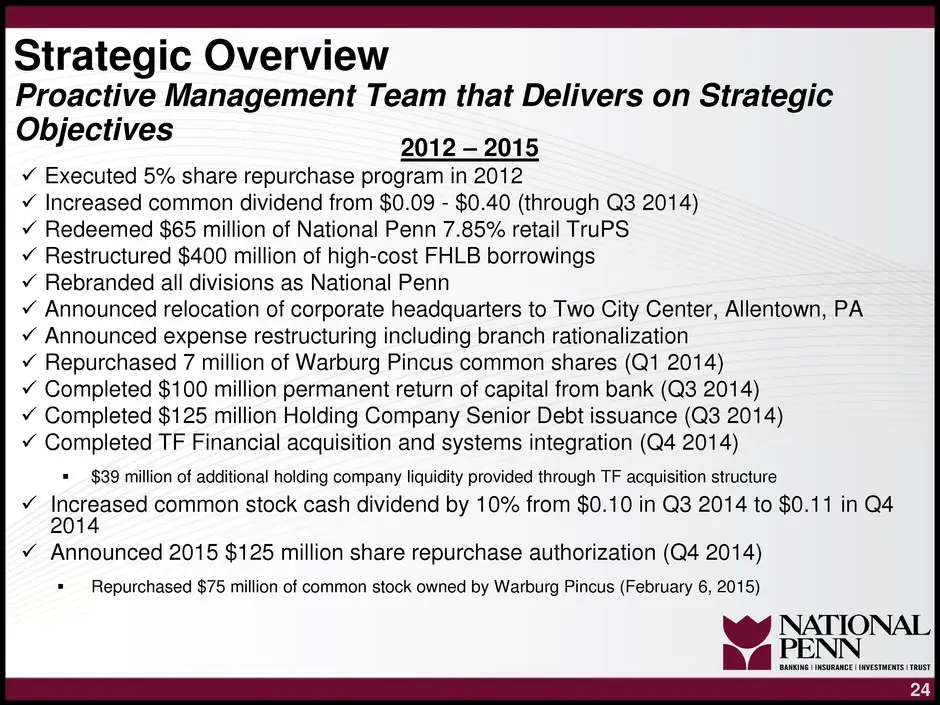
Slide 25: Proactive Management Team that Delivers on Strategic Objectives
Strategic Overview Proactive Management Team that Delivers on Strategic Objectives SOT DOTS v Executed 5% share repurchase program in 2012 ¥ Increased common dividend from $0.09 - $0.40 (through Q3 2014) v Redeemed $65 million of National Penn 7.85% retail TruPS. v Restructured $400 million of high-
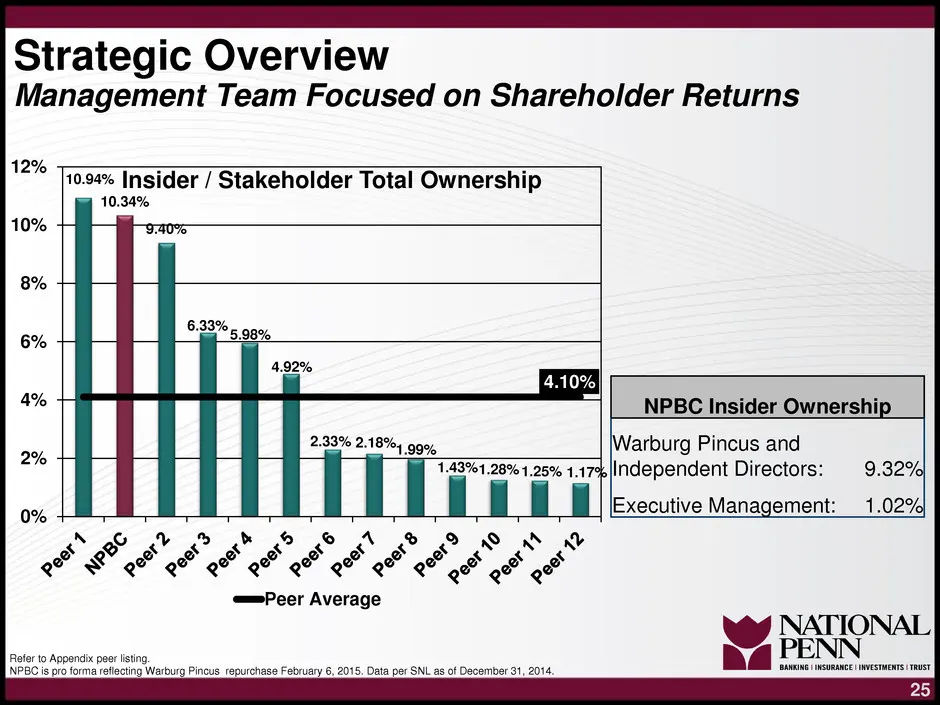
Slide 26: Management Team Focused on Shareholder Returns
Strategic Overview Management Team Focused on Shareholder Returns 12% 10.94% Insider / St Total O 10.34% 10% 8% NG % & b& & © A © 2 © EP SS SF FF oF SF SS eH OF AF OF OF QF FQ Qe” Peer Average Foter to Appendix peer listing, NPB is pro forma rellecing Warburg Pincus repurchase February 6, 2015. Data
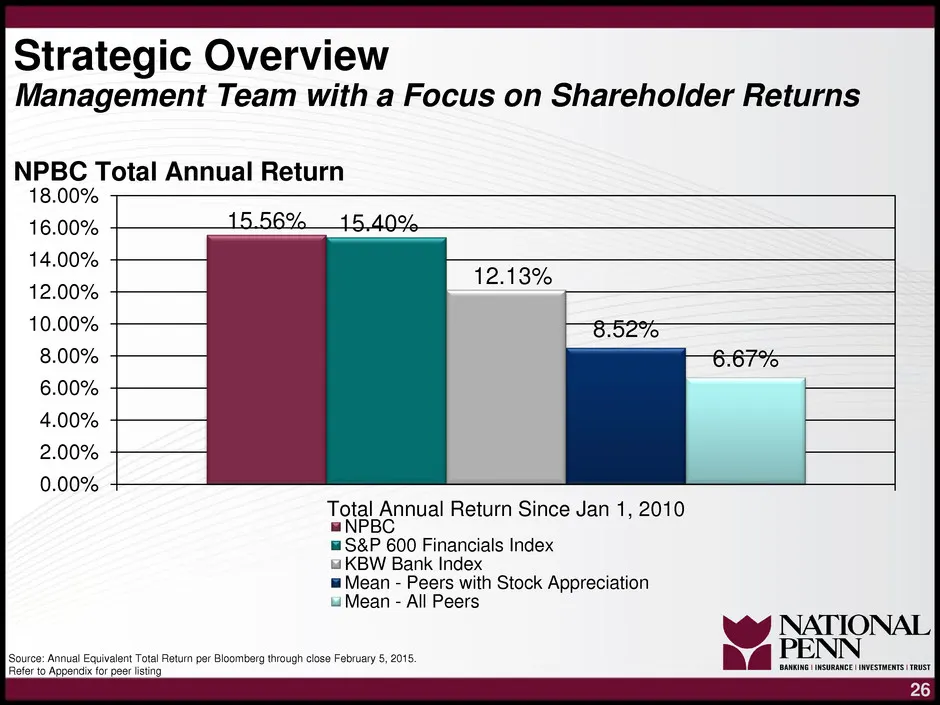
Slide 27: Management Team with a Focus on Shareholder Returns
Strategic Overview Management Team with a Focus on Shareholder Returns NPBC Total Annual Return 18.00% 46.00% 15. 56% 45.40% 14.00% + 9 12.00% 4 12.13% , 10.00% + 8.00% + 6.00% + 4.00% + 2.00% + 0.00% + Total Annual Return Since Jan 1, 2010 = NPBC @ S&P 600 Financials Index & KBW Bank Index Mean - P
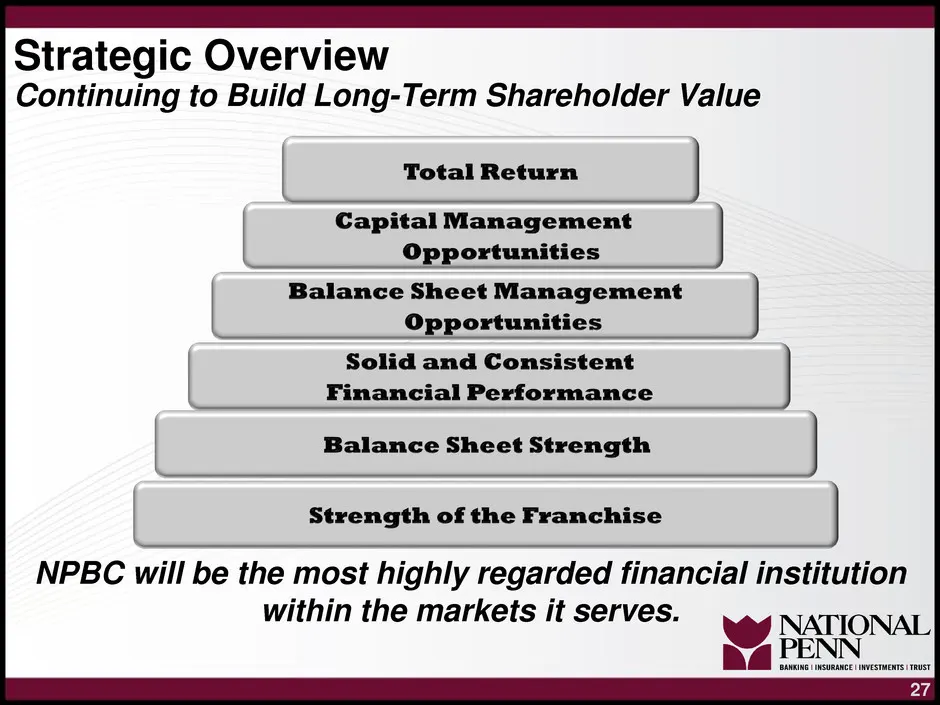
Slide 28: Continuing to Build Long-Term Shareholder Value
Strategic Overview Continuing to Build Long-Term Shareholder Value l Total Return | a) PP oO cas, PP | Bal Sheet M. ] l Solid and Consistent l Balance Sheet Strength g ——— NPBC will be the most highly regarded financial institution within the markets it serves.
Slide 29: Appendix
Appendix
Slide 30: NPBC Peer Group
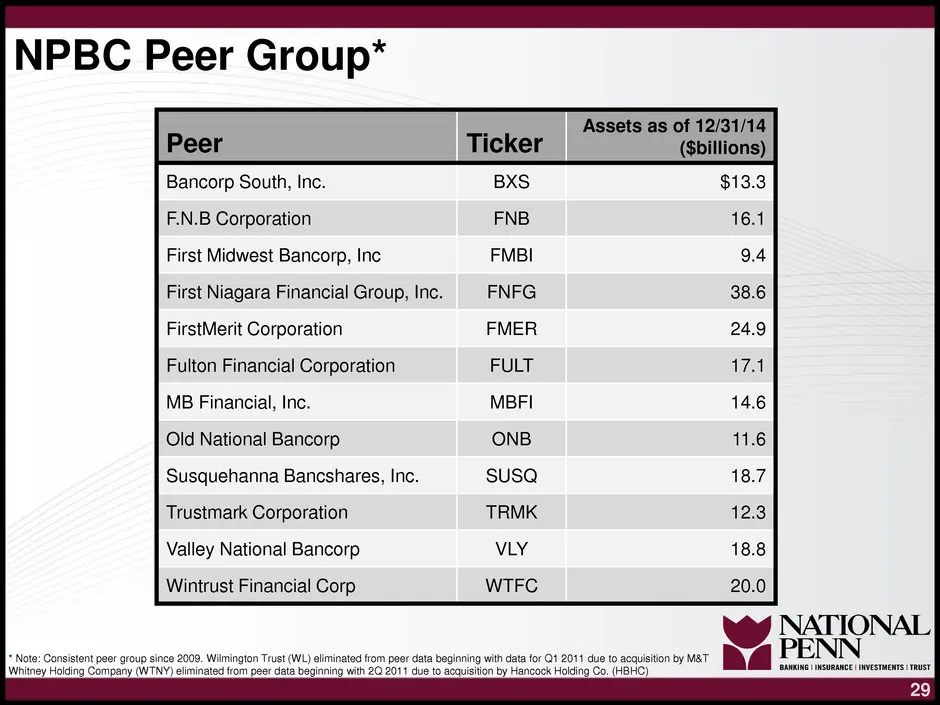
NPBC Peer Group* Assets as of 12/31/14 Peer Ticker ($billions) Bancorp South, Inc. $13.3 F.N.B Corporation 16.1 First Midwest Bancorp, Inc 9.4 First Niagara Financial Group, Inc. 38.6 FirstMerit Corporation 24.9 Fulton Financial Corporation ile MB Financial, Inc. 14.6 Old National Bancorp 11.6 Susqu
Slide 31: Reconciliation of Non-GAAP Measures
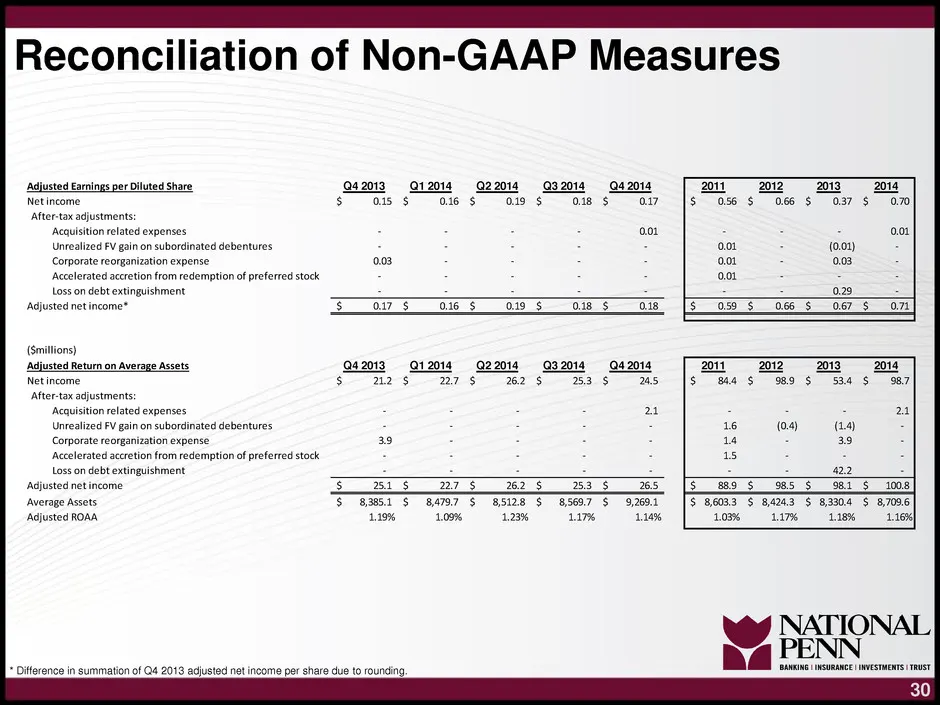
Reconciliation of Non-GAAP Measures Sted ang per Dies Save 242013 Q12014 @22014 32014 Neti Camry 016 $019 $ (OB ter ox adustimens i ston rltedoxeries realized FY gain on subordinated debentures Corse n expense celerated accretion from redemption of preferred stock loool tina Adjusted netincome* 2420
Slide 32: Reconciliation of Non-GAAP Measures
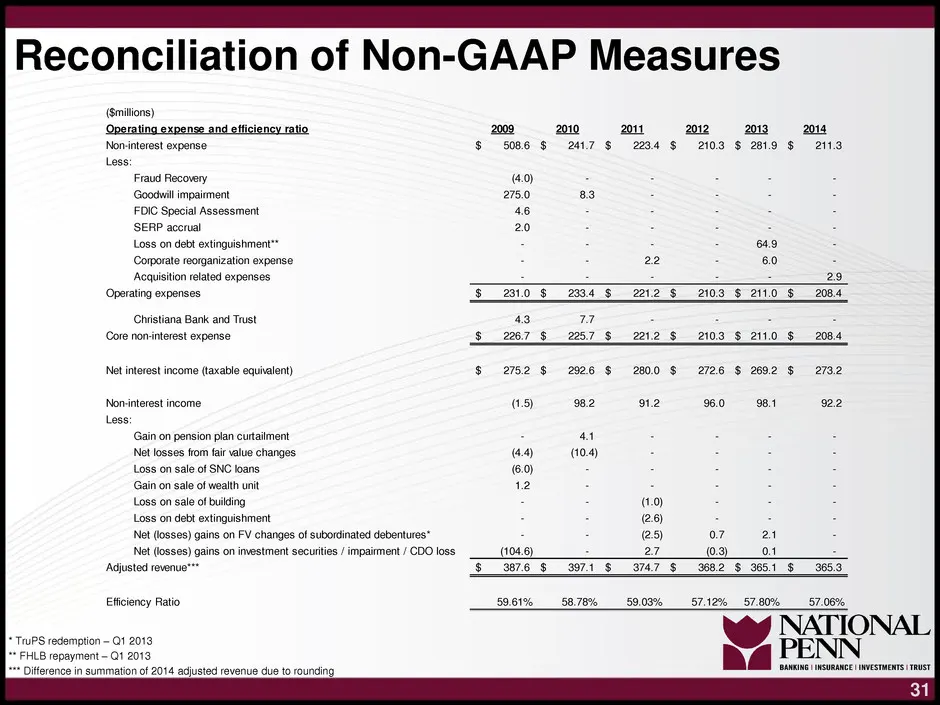
Reconciliation of Non-GAAP Measures (Smilions) ‘Operating expense and efficiency ratio 2009 2010 out iz 21a Nominterest expense 5086 $ 2417 $ 234 $ 2103 § 219 $ 2119 Less: Fraud Recovery ‘Gooduilimpaiment cell eees 22 Operating expenses Be2 $2103 $ Christiana Bank and Trust : Core noninterest expens
Slide 33: Reconciliation of Non-GAAP Measures
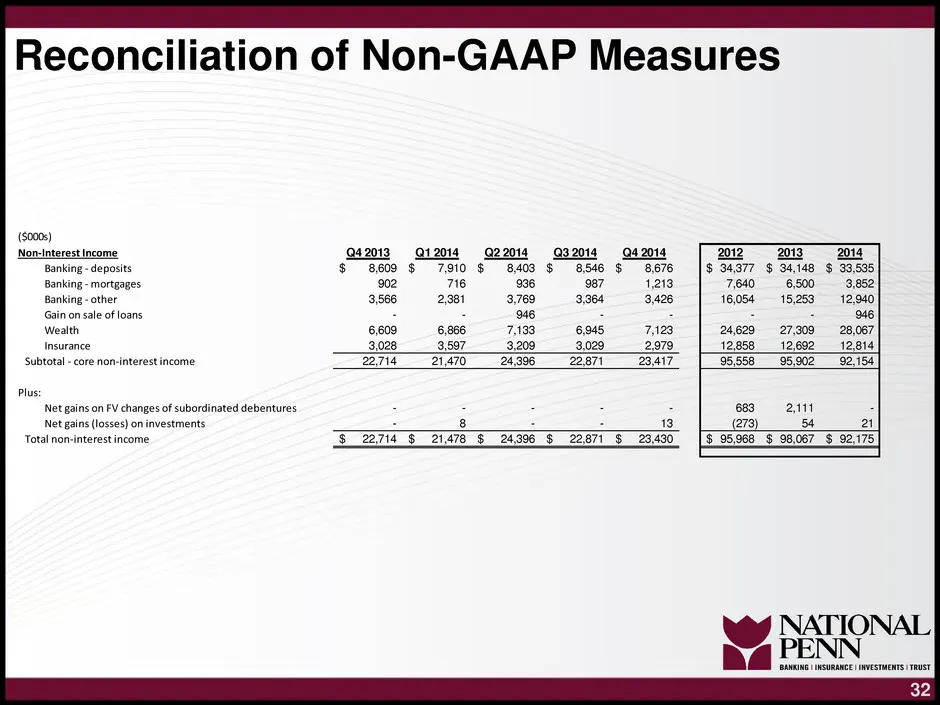
Reconciliation of Non-GAAP Measures 242013 12014 $ 8609 § 7,910 7 3,566 Insurance Subtotal - core non-interest income Plus "Net gains on FV changes of subordinated debentures, Net gains (losses) on investments ‘Total non-interest income NATIONAL PE]
Slide 34: Reconciliation of Non-GAAP Measures
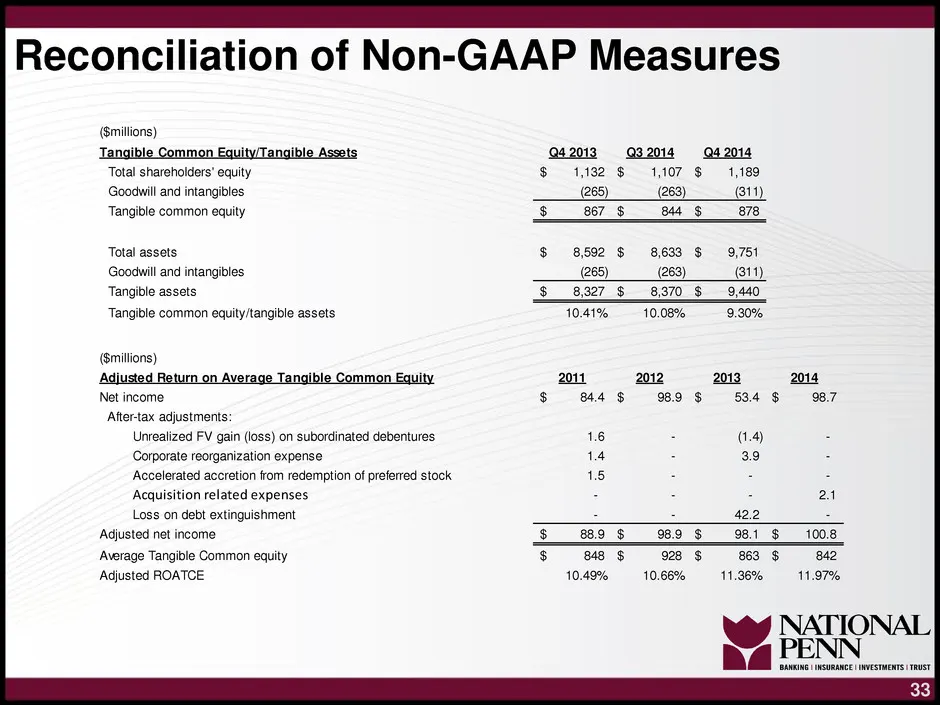
Reconciliation of Non-GAAP Measures (Smilions) Total shareholders’ equity ;oodwill and intangibles Tangible common equity Total assets ;oodwill and intangibles Tangible assets Tangible common equity/tangible assets (millions) Adjusted Net income After-tax adjustments: fealized FV gain (loss) on subo
Slide 35: Investor Relations Information
Investor Relations Information e The following information can be found on our Investor Relations Web site at www.nationalpennbancshares.com e SEC Filings e Corporate News e Analyst Estimates e and much more e Contact information - Michael J. Hughes, Chief Financial Officer 484.709.3305 | michael.hu

Slide 36
Source: SEC EDGAR · 8-K filed Feb 11, 2015
More decks from National Penn Bancshares
 BB&T Global Financial Services Conference (September 2015)33 slides · Sep 16, 2015
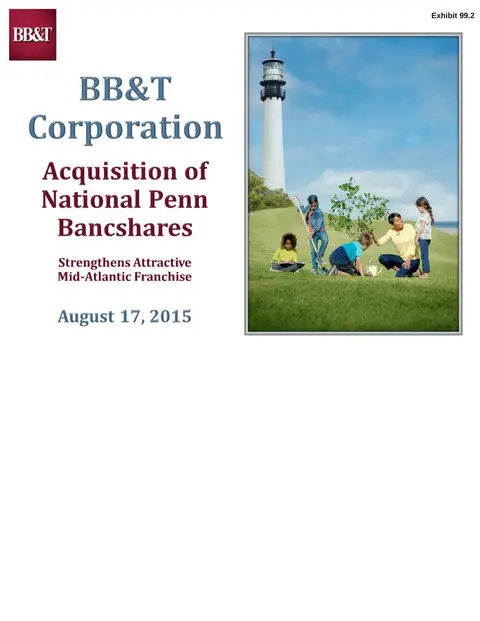 Merger or Acquisition (August 2015)13 slides · Aug 18, 2015
 Q2 2015 Earnings Presentation17 slides · Jul 23, 2015
 Q1 2015 Earnings Presentation18 slides · Apr 24, 2015
 Q4 2014 Earnings Presentation16 slides · Jan 22, 2015
 Investor Presentation (November 2014)37 slides · Nov 12, 2014