Amsouth Bancorporation — BancAnalysts Association of Boston Annual Fall Conference 2004
21 slides from Amsouth Bancorporation's conference presentation, Nov 4, 2004
Slide 1: BancAnalysts Association of Boston Annual Fall Conference
BancAnalysts Association of Boston, Inc. Annual Fall Conference November 4, 2004
Slide 2: Safe Harbor
Safe Harbor Statements made in this document which are not purely historical are forward-looking statements as defined in the “Private Securities Litigation Reform Act of 1995,” including any statements regarding descriptions of management’s plans, objectives or goals for future operations, products
Slide 3: AmSouth Maintains a Leadership Position in Attractive Markets
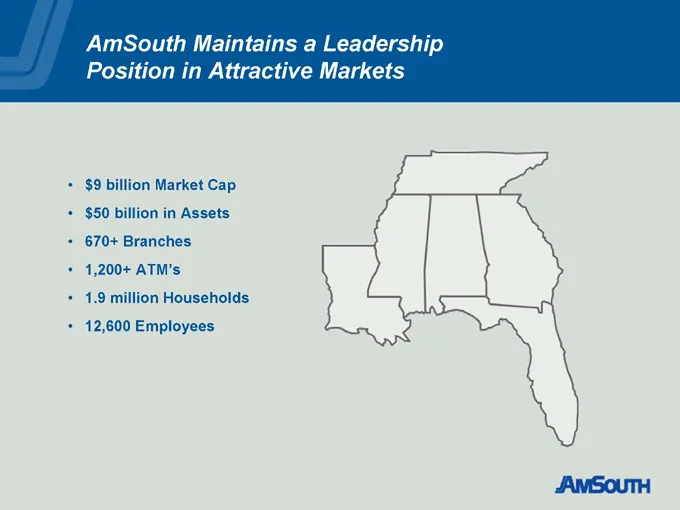
AmSouth Maintains a Leadership Position in Attractive Markets $9 billion Market Cap $50 billion in Assets 670+ Branches 1,200+ ATM’s 1.9 million Households 12,600 Employees
Slide 4: Leading Businesses in Southeast
Leading Businesses in Southeast Mutual fund assets Trust assets Annuity Sales Small business lending Consumer lending Equipment leasing Electronic banking
Slide 5: Recent Developments: Sale of Credit Card Portfolio to MBNA
Recent Developments Sale of $550 Million Credit Card Portfolio to MBNA Rationale Non-core business that lacks meaningful scale Significant on-going investment required to stay competitive Agent bank relationship provides a future revenue stream and allows for a broader array of products to more cust
Slide 6: Recent Developments: Use of Gain
Recent Developments Use of Gain Prepay approximately $1.4 billion of Federal Home Loan Bank borrowings Replace borrowings with a variety of lower cost funding instruments, saving between 240 and 250 basis points in average cost of funds Accretive to 2005 Earnings
Slide 7: Recent Developments: Regulatory Agreements
Recent Developments On October 12, 2004 AmSouth entered into: A deferred prosecution agreement with the U.S. Attorney for the Southern District of Mississippi and A cease and desist order with the Federal Reserve and the Alabama Department of Banking and An Order with FinCen All relating to deficien
Slide 8: Strategic Initiatives
Strategic Initiatives Sustained growth in Consumer Banking Continued aggressive growth in Business Banking Grow Commercial Banking business with improved credit quality Double contribution from Wealth Management Double Florida’s contribution Emphasis on sales productivity, service quality and custom
Slide 9: Sustain Growth in Consumer Banking
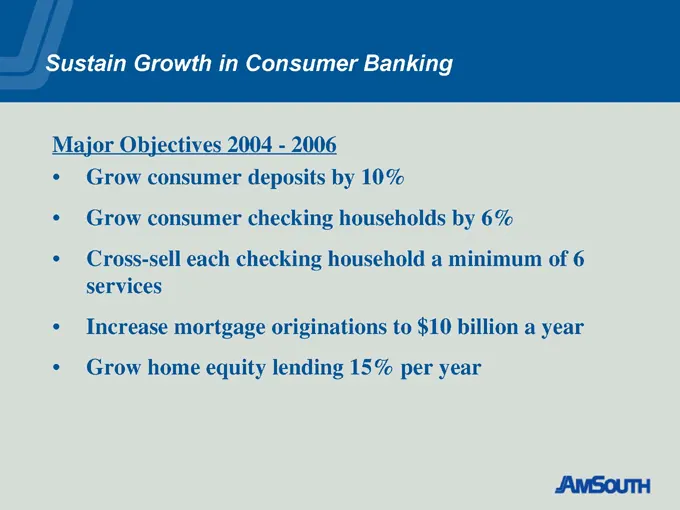
Sustain Growth in Consumer Banking Major Objectives 2004—2006 Grow consumer deposits by 10% Grow consumer checking households by 6% Cross-sell each checking household a minimum of 6 services Increase mortgage originations to $10 billion a year Grow home equity lending 15% per year
Slide 10: Continue Aggressive Growth in Business Banking
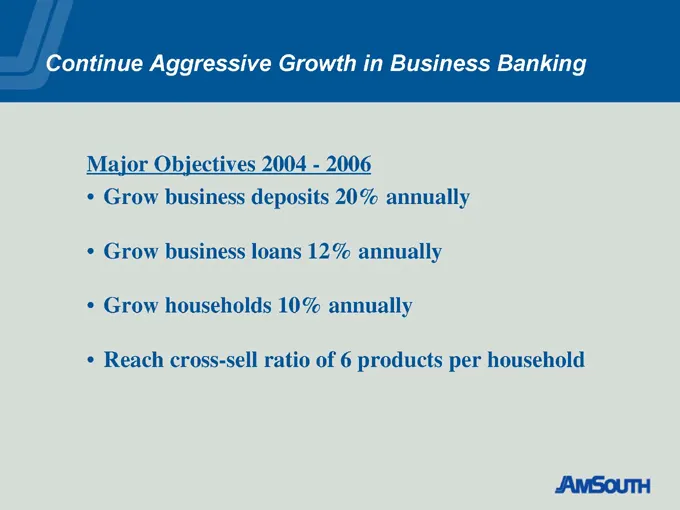
Continue Aggressive Growth in Business Banking Major Objectives 2004—2006 Grow business deposits 20% annually Grow business loans 12% annually Grow households 10% annually Reach cross-sell ratio of 6 products per household
Slide 11: Grow Commercial Banking with Improved Credit Quality
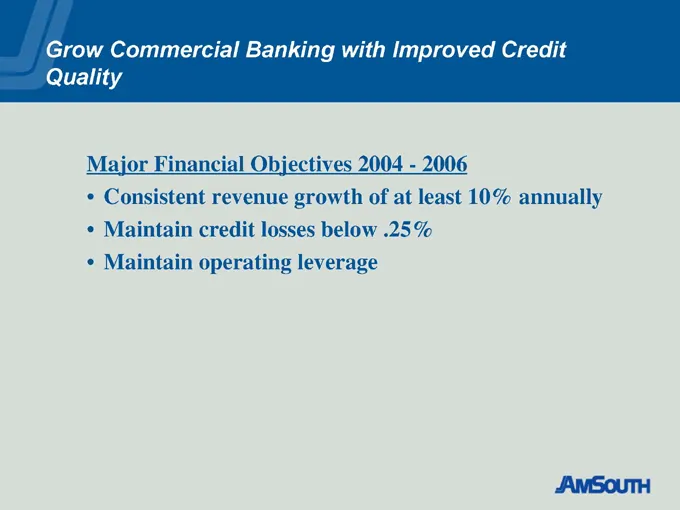
Grow Commercial Banking with Improved Credit Quality Major Financial Objectives 2004—2006 Consistent revenue growth of at least 10% annually Maintain credit losses below .25% Maintain operating leverage
Slide 12: Double Contribution from Wealth Management
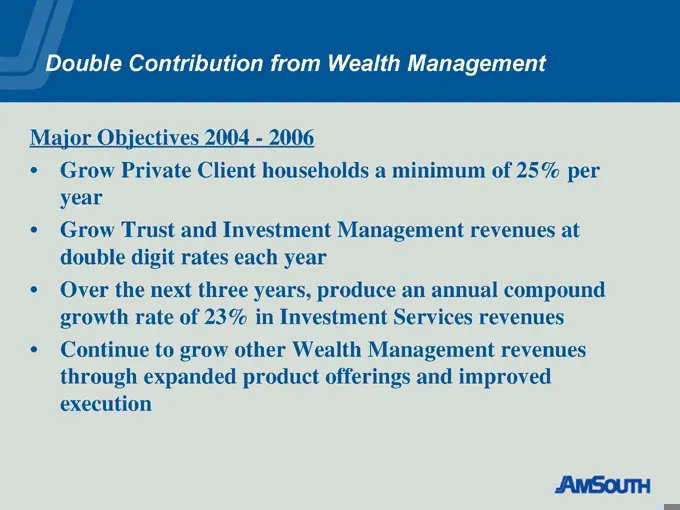
Double Contribution from Wealth Management Major Objectives 2004—2006 Grow Private Client households a minimum of 25% per year Grow Trust and Investment Management revenues at double digit rates each year Over the next three years, produce an annual compound growth rate of 23% in Investment Services
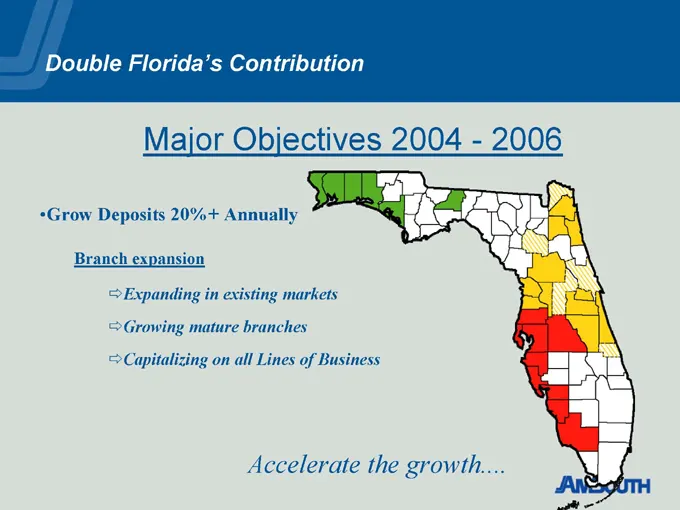
Slide 13: Double Florida's Contribution
Double Florida’s Contribution Major Objectives 2004—2006 Grow Deposits 20%+ Annually Branch expansion Expanding in existing markets Growing mature branches Capitalizing on all Lines of Business Accelerate the growth
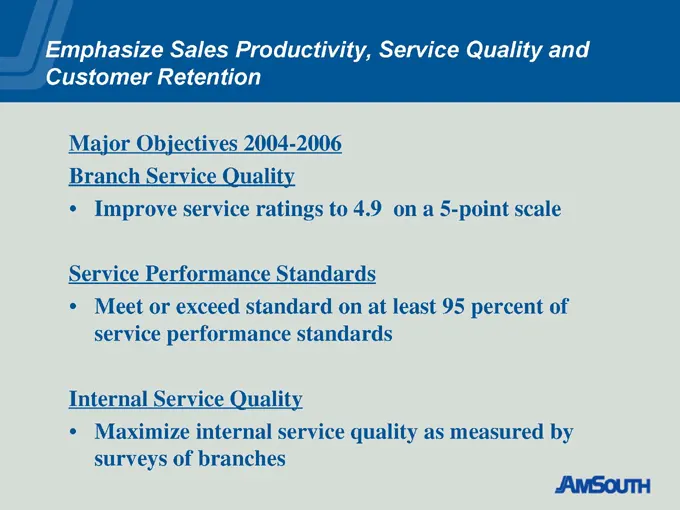
Slide 14: Emphasize Sales Productivity, Service Quality and Customer Retention
Emphasize Sales Productivity, Service Quality and Customer Retention Major Objectives 2004-2006 Branch Service Quality Improve service ratings to 4.9 on a 5-point scale Service Performance Standards Meet or exceed standard on at least 95 percent of service performance standards Internal Service Qual
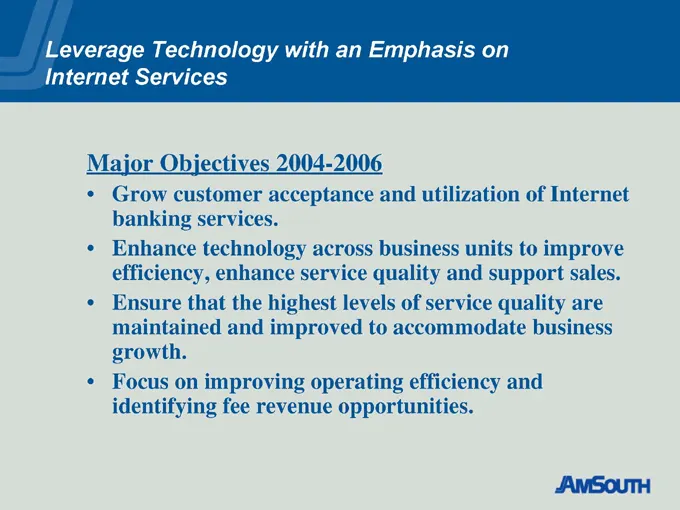
Slide 15: Leverage Technology with an Emphasis on Internet Services
Leverage Technology with an Emphasis on Internet Services Major Objectives 2004-2006 Grow customer acceptance and utilization of Internet banking services. Enhance technology across business units to improve efficiency, enhance service quality and support sales. Ensure that the highest levels of ser
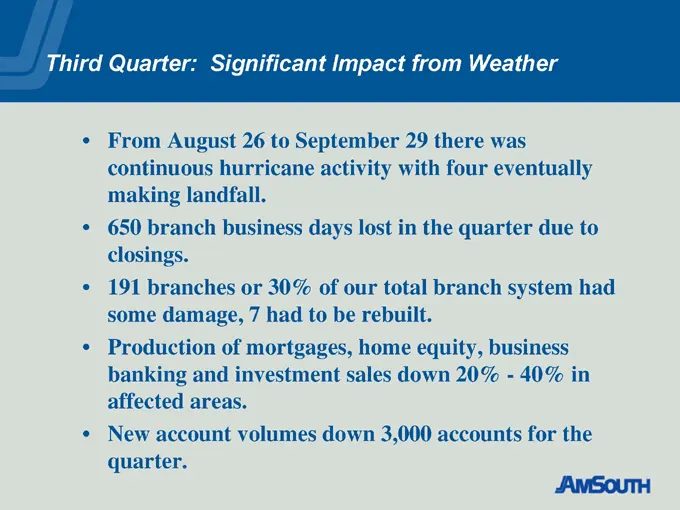
Slide 16: Third Quarter: Significant Impact from Weather
Third Quarter: Significant Impact from Weather From August 26 to September 29 there was continuous hurricane activity with four eventually making landfall. 650 branch business days lost in the quarter due to closings. 191 branches or 30% of our total branch system had some damage, 7 had to be rebuil
Slide 17: Third Quarter Performance Highlights
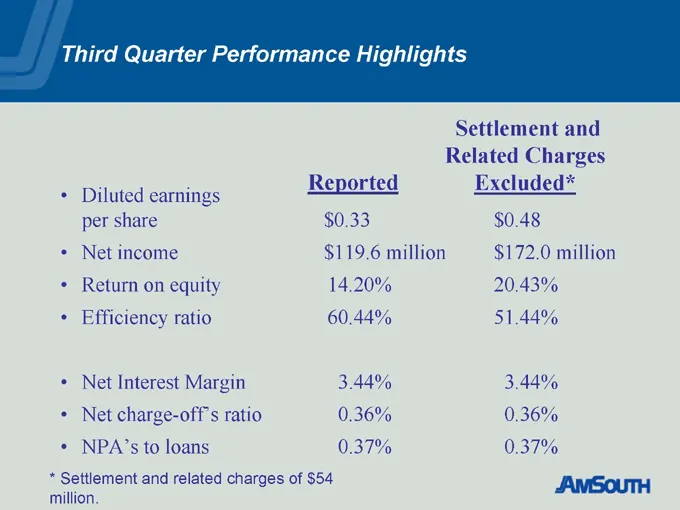
Third Quarter Performance Highlights Reported Diluted earnings per share $0.33 $0.48 Net income $119.6 million $172.0 million Return on equity 14.20% 20.43% Efficiency ratio 60.44% 51.44% Net Interest Margin 3.44% 3.44% Net charge-off’s ratio 0.36% 0.36% NPA’s to loans 0.37% 0.37% * Settlement and r
Slide 18: Good Balance Sheet Momentum
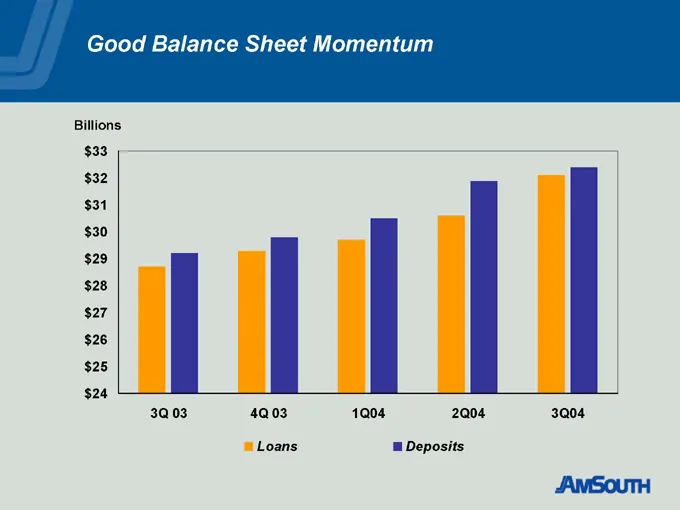
Good Balance Sheet Momentum Billions $24 $25 $26 $27 $28 $29 $30 $31 $32 $33 3Q 03 4Q 03 1Q04 2Q04 3Q04 Loans Deposits
Slide 19: And Improved Credit Quality
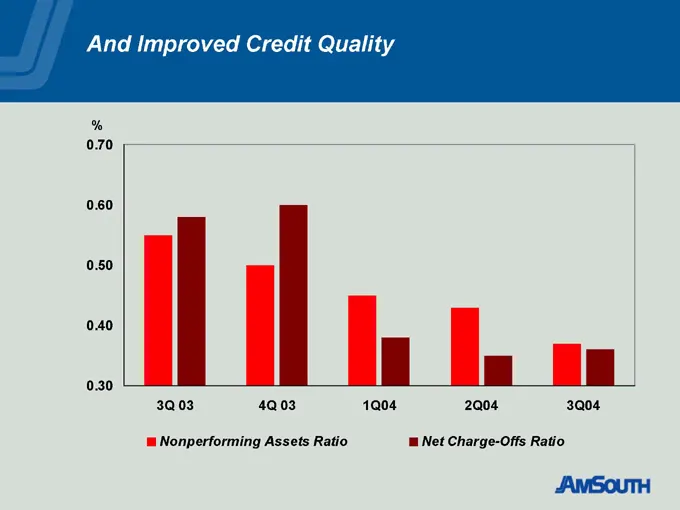
And Improved Credit Quality % 0.30 0.40 0.50 0.60 0.70 3Q 03 4Q 03 1Q04 2Q04 3Q04 Nonperforming Assets Ratio Net Charge-Offs Ratio
Slide 20: Outstanding Record of Dividend Growth
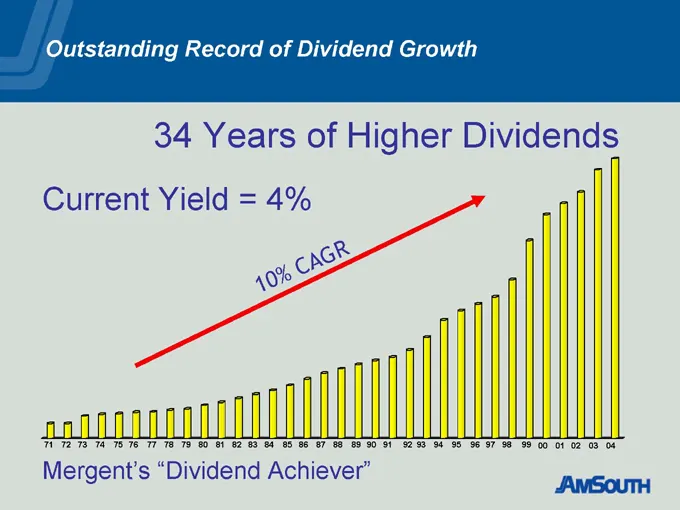
Outstanding Record of Dividend Growth 34 Years of Higher Dividends Current Yield = 4% 10% CAGR Mergent’s “Dividend Achiever”
Slide 21: BancAnalysts Association of Boston Annual Fall Conference
BancAnalysts Association of Boston, Inc. Annual Fall Conference November 4, 2004
Source: SEC EDGAR · 8-K filed Nov 4, 2004
More decks from Amsouth Bancorporation
 Merger or Acquisition (October 2006)10 slides · Oct 3, 2006
 Merger or Acquisition (August 2006)41 slides · Aug 22, 2006
 Regions Financial — Merger or Acquisition (May 2006)28 slides · May 26, 2006
 Shareholder Meeting (April 2006)17 slides · Apr 20, 2006
 Citigroup Financial Services Conference 200631 slides · Feb 1, 2006
 Fox-Pitt, Kelton Global Financial Services Conference 200529 slides · Nov 8, 2005