Amsouth Bancorporation — Shareholder Meeting (April 2006)
17 slides from Amsouth Bancorporation's shareholder meeting presentation, Apr 20, 2006
Slide 1: C. Dowd Ritter, Chairman and Chief Executive Officer
C. Dowd Ritter Chairman and Chief Executive Officer Exhibit 99.1

Slide 2: 2005 Performance Highlights
2005 Performance Highlights Net income (in millions) $725.7 Diluted earnings per share $2.04 Return on equity 20.4% Net Interest Margin 3.38% Efficiency ratio 52.0% Net charge-off ratio 0.27% Nonperforming asset ratio 0.34% 2005

Slide 3: 2005 Noteworthy Events
2005 Noteworthy Events Hurricanes Katrina, Rita and Wilma Sale of mutual fund management business Regulatory compliance Approvals for branch expansion
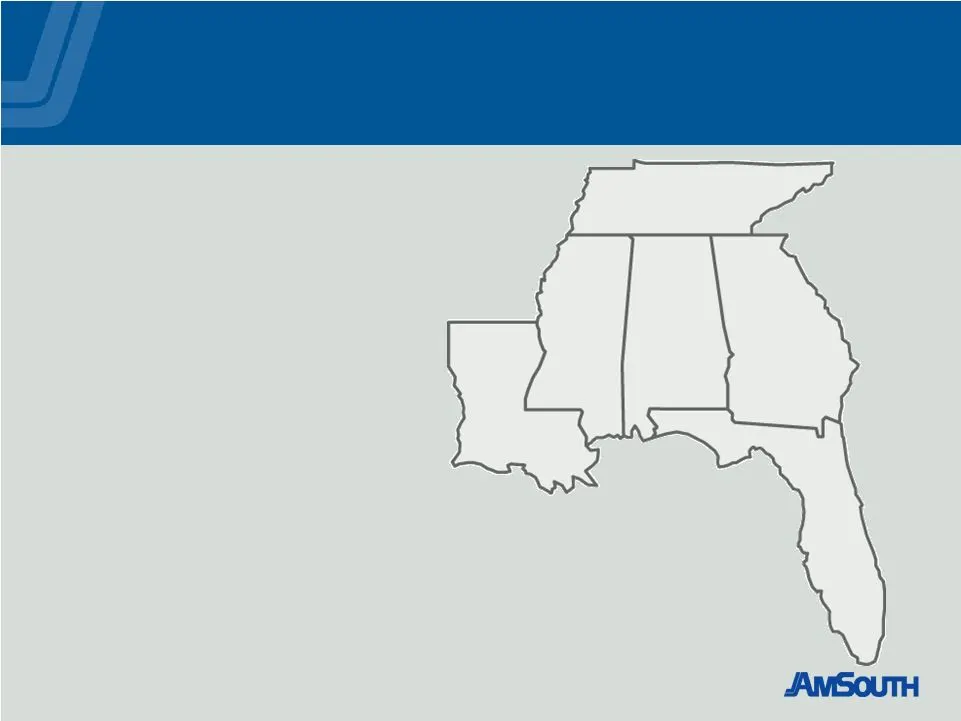
Slide 4: AmSouth Maintains a Leadership Position in Attractive Markets (1Q '06)
AmSouth Maintains a Leadership Position in Attractive Markets (1Q ’06) $10 billion Market Cap $53 billion in Assets 700 Branches 1,200+ ATM’s 1.9 million Households 12,400 Employees

Slide 5: Introducing Positively Free Business Checking
Use your CheckCard to buy got bts Introducing POSITIVELY FREE fe BUSINESS CHECKING for those who love CASH
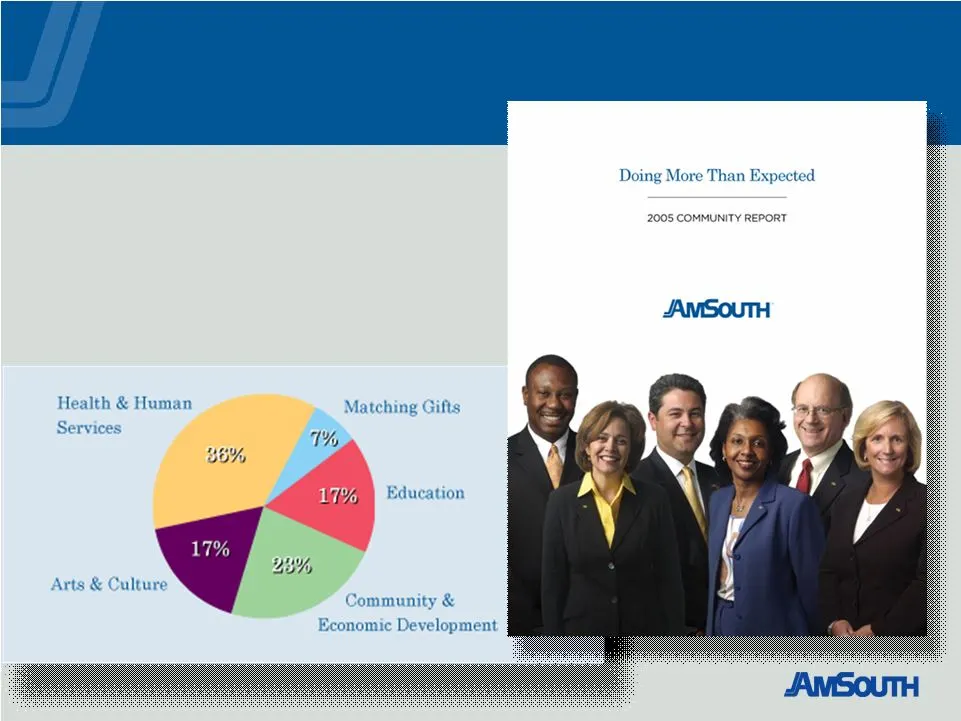
Slide 6: Community Giving
Community Giving $7.9 million in contributions in 2005

Slide 7: First Quarter 2006 Performance Highlights
First Quarter 2006 Performance Highlights Net income (in millions) $181.0 Diluted earnings per share $0.52 Return on equity 20.5% Net Interest Margin 3.42% Efficiency ratio 52.53 Net charge-off ratio 0.47% Nonperforming asset ratio 0.27%

Slide 8: Strategic Initiatives
Strategic Initiatives Sustain growth in Consumer Banking Continue aggressive growth in Business Banking Grow Commercial Banking business with improved credit quality Double contribution from Wealth Management Double Florida’s contribution Emphasize sales productivity, service quality and customer re
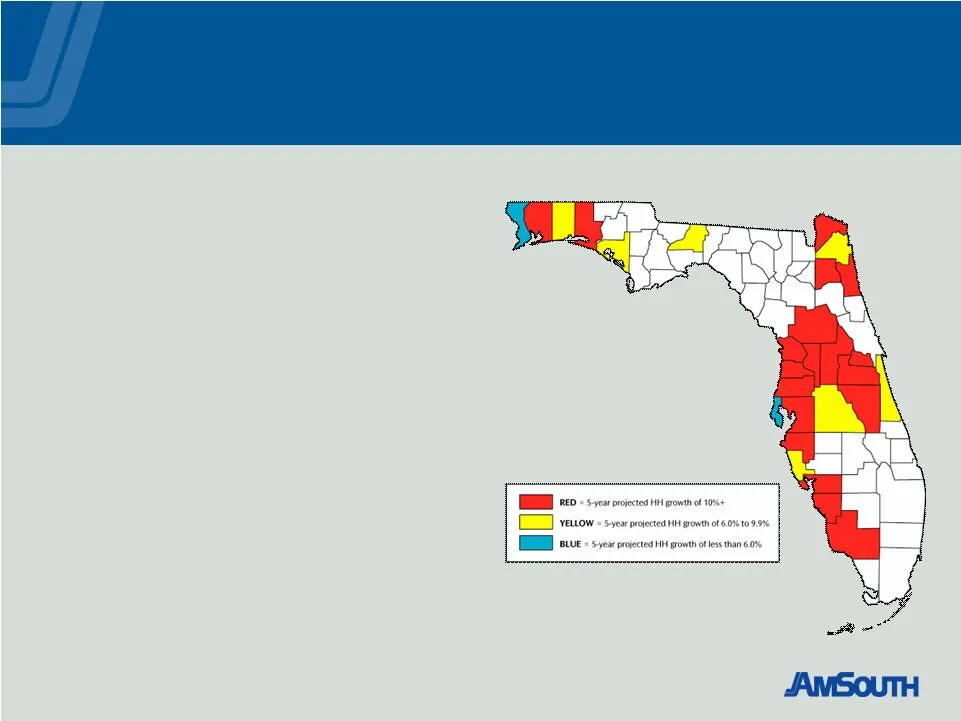
Slide 9: Florida – Current Operations
Florida – Current Operations Loans: $9.9 billion, 27% of total company Deposits: $9.5 billion, 26% of total company Branches: 232, 34% of entire network Households – Consumer Banking: 29% of total company – Business Banking: 35% of total company

Slide 10: Why expand further in Florida?
Why expand further in Florida? Highest growth rate among top 10 most populous states Florida’s population grows by 1,000 people each day Over 250,000 new jobs created last year Evolving economic diversification AmSouth average Florida growth – 4Q04 to 4Q05 – Loans: Up 20% ($1.6 billion) – Deposits:
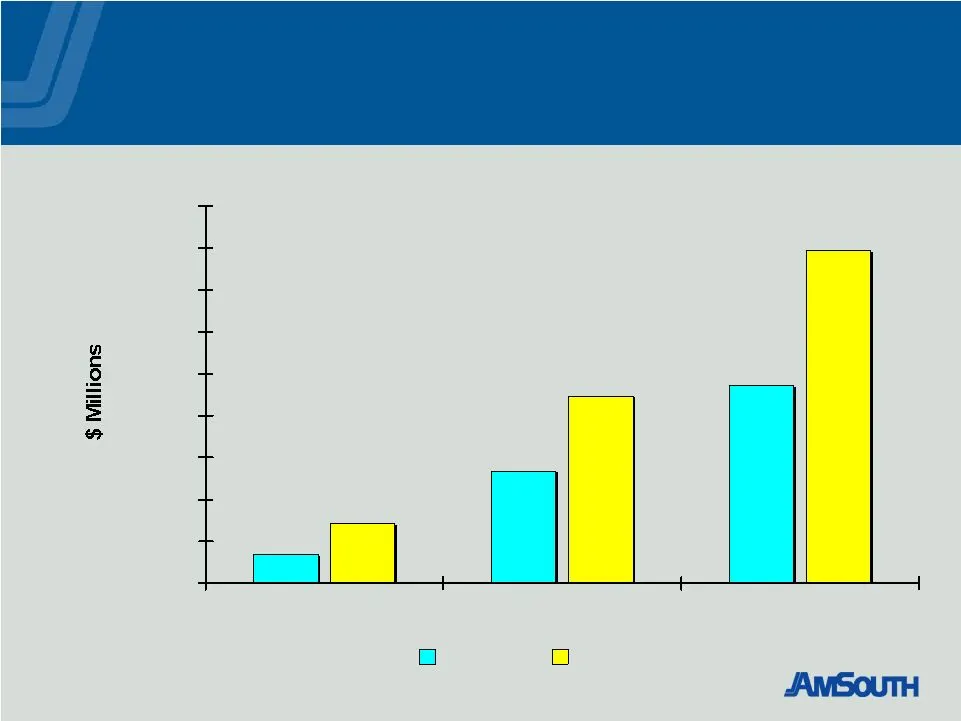
Slide 11: Florida results from branches opened in the last four years
Florida results from branches opened in the last four years $136 $535 $943 $285 $894 $1,589 $0 $200 $400 $600 $800 $1,000 $1,200 $1,400 $1,600 $1,800 2003 2004 2005 Loans Deposits

Slide 12: 2006 Branch Expansion Plan
2006 Branch Expansion Plan 64 Branches – Full year 2006 – First Quarter 12 – Florida 3 – Other high growth markets – Remaining quarters 42 – Florida 7 – Other high growth markets
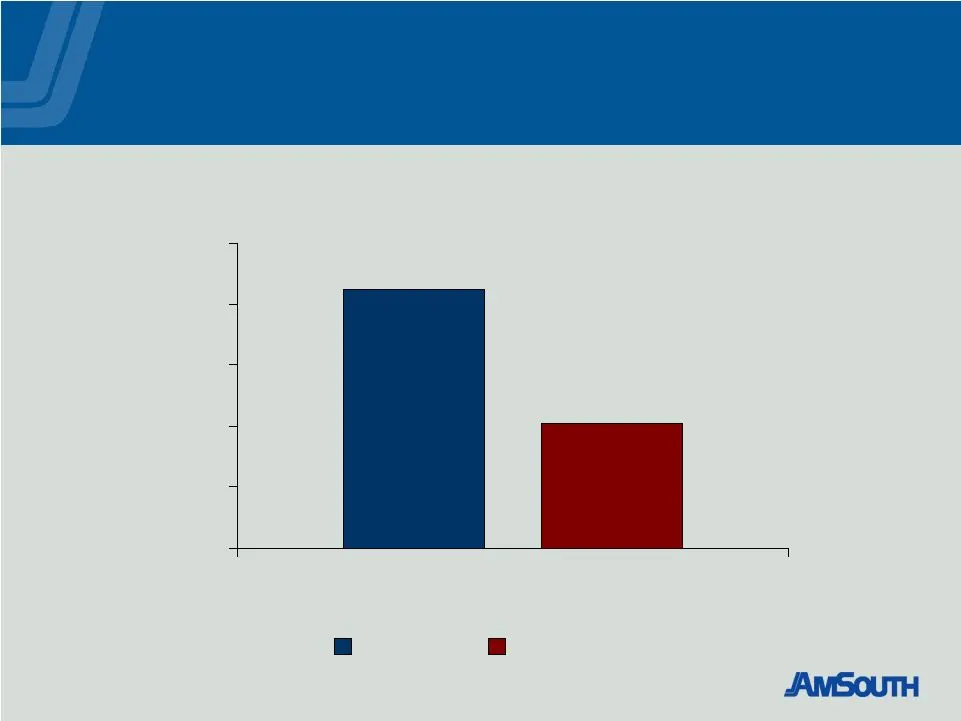
Slide 13: AmSouth Outperforms Broader Market (5 Year)
16.2% 0.5% AmSouth Outperforms Broader Market $21,189 $10,275 $0 $5,000 $10,000 $15,000 $20,000 $25,000 5 Year AmSouth S&P 500 Index
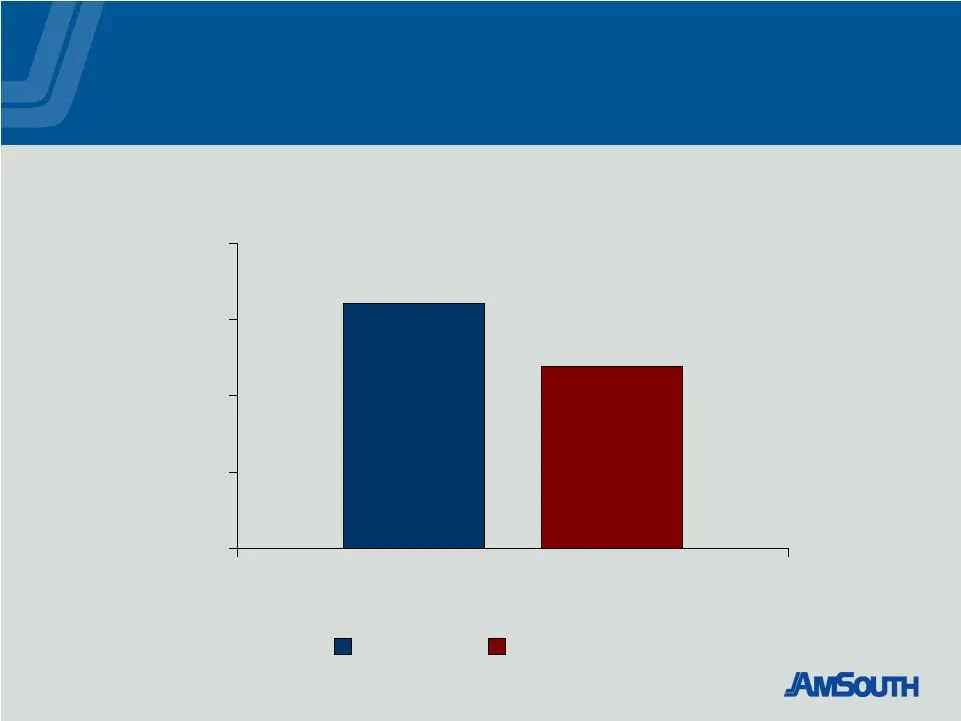
Slide 14: AmSouth Outperforms Broader Market (10 Year)
12.4% 9.1% AmSouth Outperforms Broader Market $32,126 $23,830 $0 $10,000 $20,000 $30,000 $40,000 10 Year AmSouth S&P 500 Index
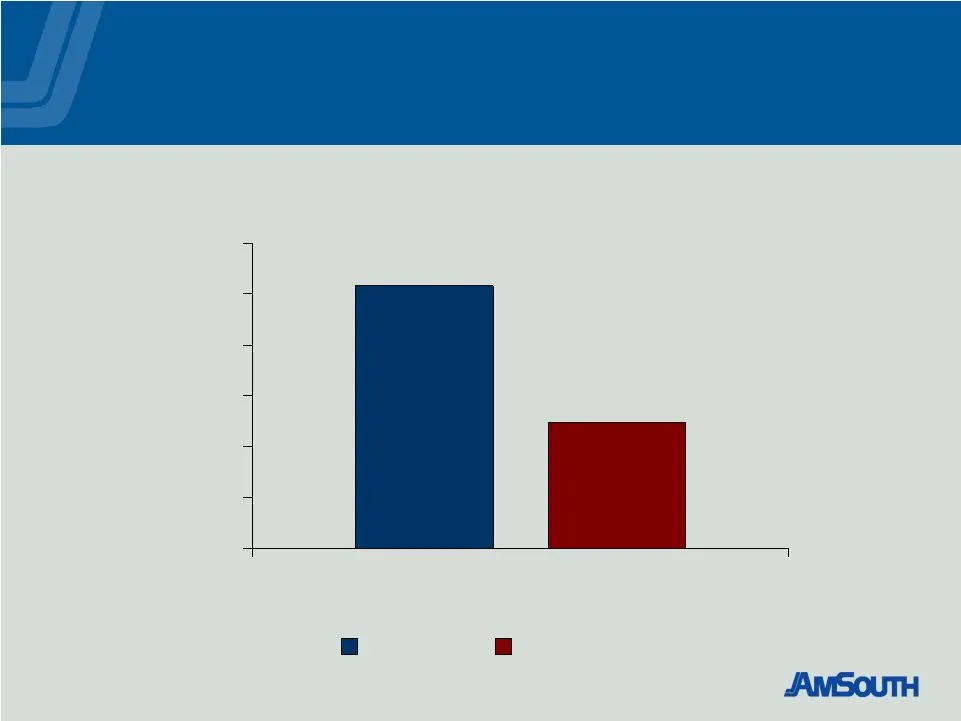
Slide 15: AmSouth Outperforms Broader Market (Since 1971)
AmSouth Outperforms Broader Market 13.6% 11.2% $772,800 $373,077 $0 $150,000 $300,000 $450,000 $600,000 $750,000 $900,000 Since 1971 AmSouth S&P 500 Index
Slide 16: Outstanding Record of Dividend Growth
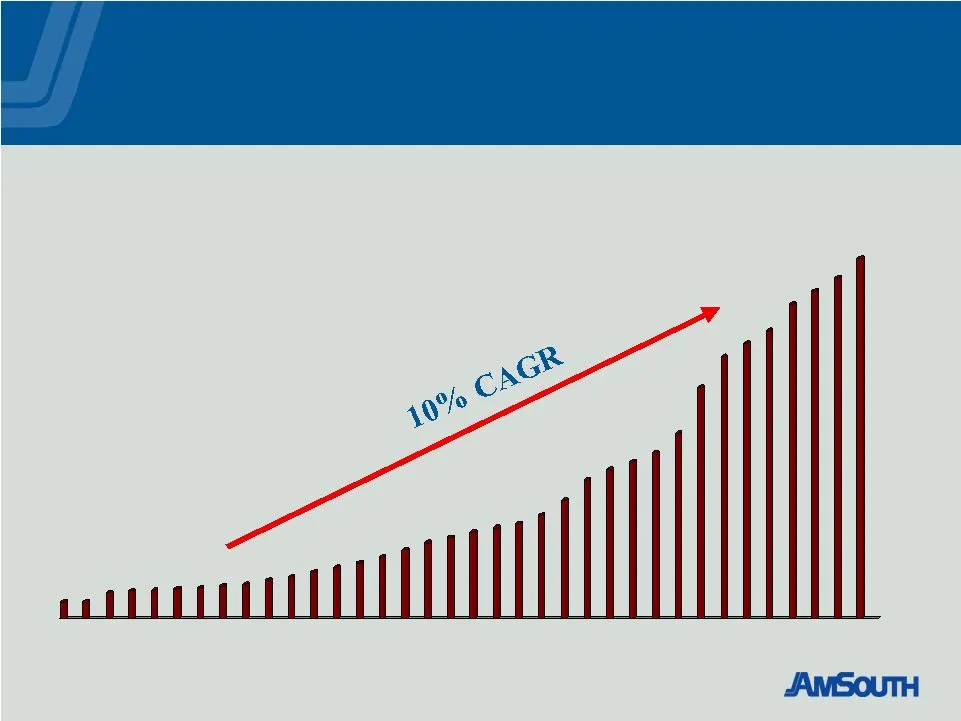
Outstanding Record of Dividend Growth 35 Years of Higher Dividends Current Yield = 3.8 % Mergent’s “Dividend Achiever”
Slide 17: Annual Meeting of Shareholders April 20, 2006
ANNUAL MEETING OF SHAREHOLDERS April 20, 2006
Source: SEC EDGAR · 8-K filed Apr 20, 2006
More decks from Amsouth Bancorporation
 Merger or Acquisition (October 2006)10 slides · Oct 3, 2006
 Merger or Acquisition (August 2006)41 slides · Aug 22, 2006
 Regions Financial — Merger or Acquisition (May 2006)28 slides · May 26, 2006
 Citigroup Financial Services Conference 200631 slides · Feb 1, 2006
 Fox-Pitt, Kelton Global Financial Services Conference 200529 slides · Nov 8, 2005
 Ryan Beck 2005 Financial Services Conference17 slides · Nov 2, 2005