Amsouth Bancorporation — Merger or Acquisition (August 2006)
41 slides from Amsouth Bancorporation's merger presentation, Aug 22, 2006
Slide 1: Filed by AmSouth Bancorporation Pursuant to Rule 425
Filed by AmSouth Bancorporation Pursuant to Rule 425 under the Securities Act of 1933 and deemed filed pursuant to Rule 14a-6(b) under the Securities Exchange Act of 1934 Subject Company: AmSouth Bancorporation Commission File No.: 1-7476 FORWARD LOOKING STATEMENTS This document contains forward-loo

Slide 2: Additional information and participants in solicitation
will contain important information. You may obtain a free copy of the joint proxy statement/prospectus, as well as other filings containing information about Regions Financial and AmSouth, at the SEC’s Web site (http://www.sec.gov). You may also obtain these documents, free of charge, by accessing R
Slide 3: Regions & AmSouth
REGIONS &... AMSOUTH
Slide 4: Original Merger Presentation
Original Merger Presentation 2
Slide 5: The New Regions
The New Regions “Creating Shareholder Value Through… Improved Financial Returns, Enhanced Growth Opportunities, Increased Scale and Superior Execution” May 25, 2006 3
Slide 6: Forward Looking Statements
Forward Looking Statements This presentation contains forward-looking statements made pursuant to the safe-harbor provisions of the Private Securities Litigation Act of 1995. These include statements as to the benefits of the proposed merger between Regions Financial and AmSouth (the "Merger"), incl
Slide 7: Additional Information
Additional Information The proposed Merger will be submitted to Regions Financial's and AmSouth's stockholders for their consideration. Regions Financial has filed a registration statement, which includes a joint proxy statement / prospectus sent to each company's stockholders, and each of Regions F
Slide 8: Transaction Rationale – The Power of the Combination
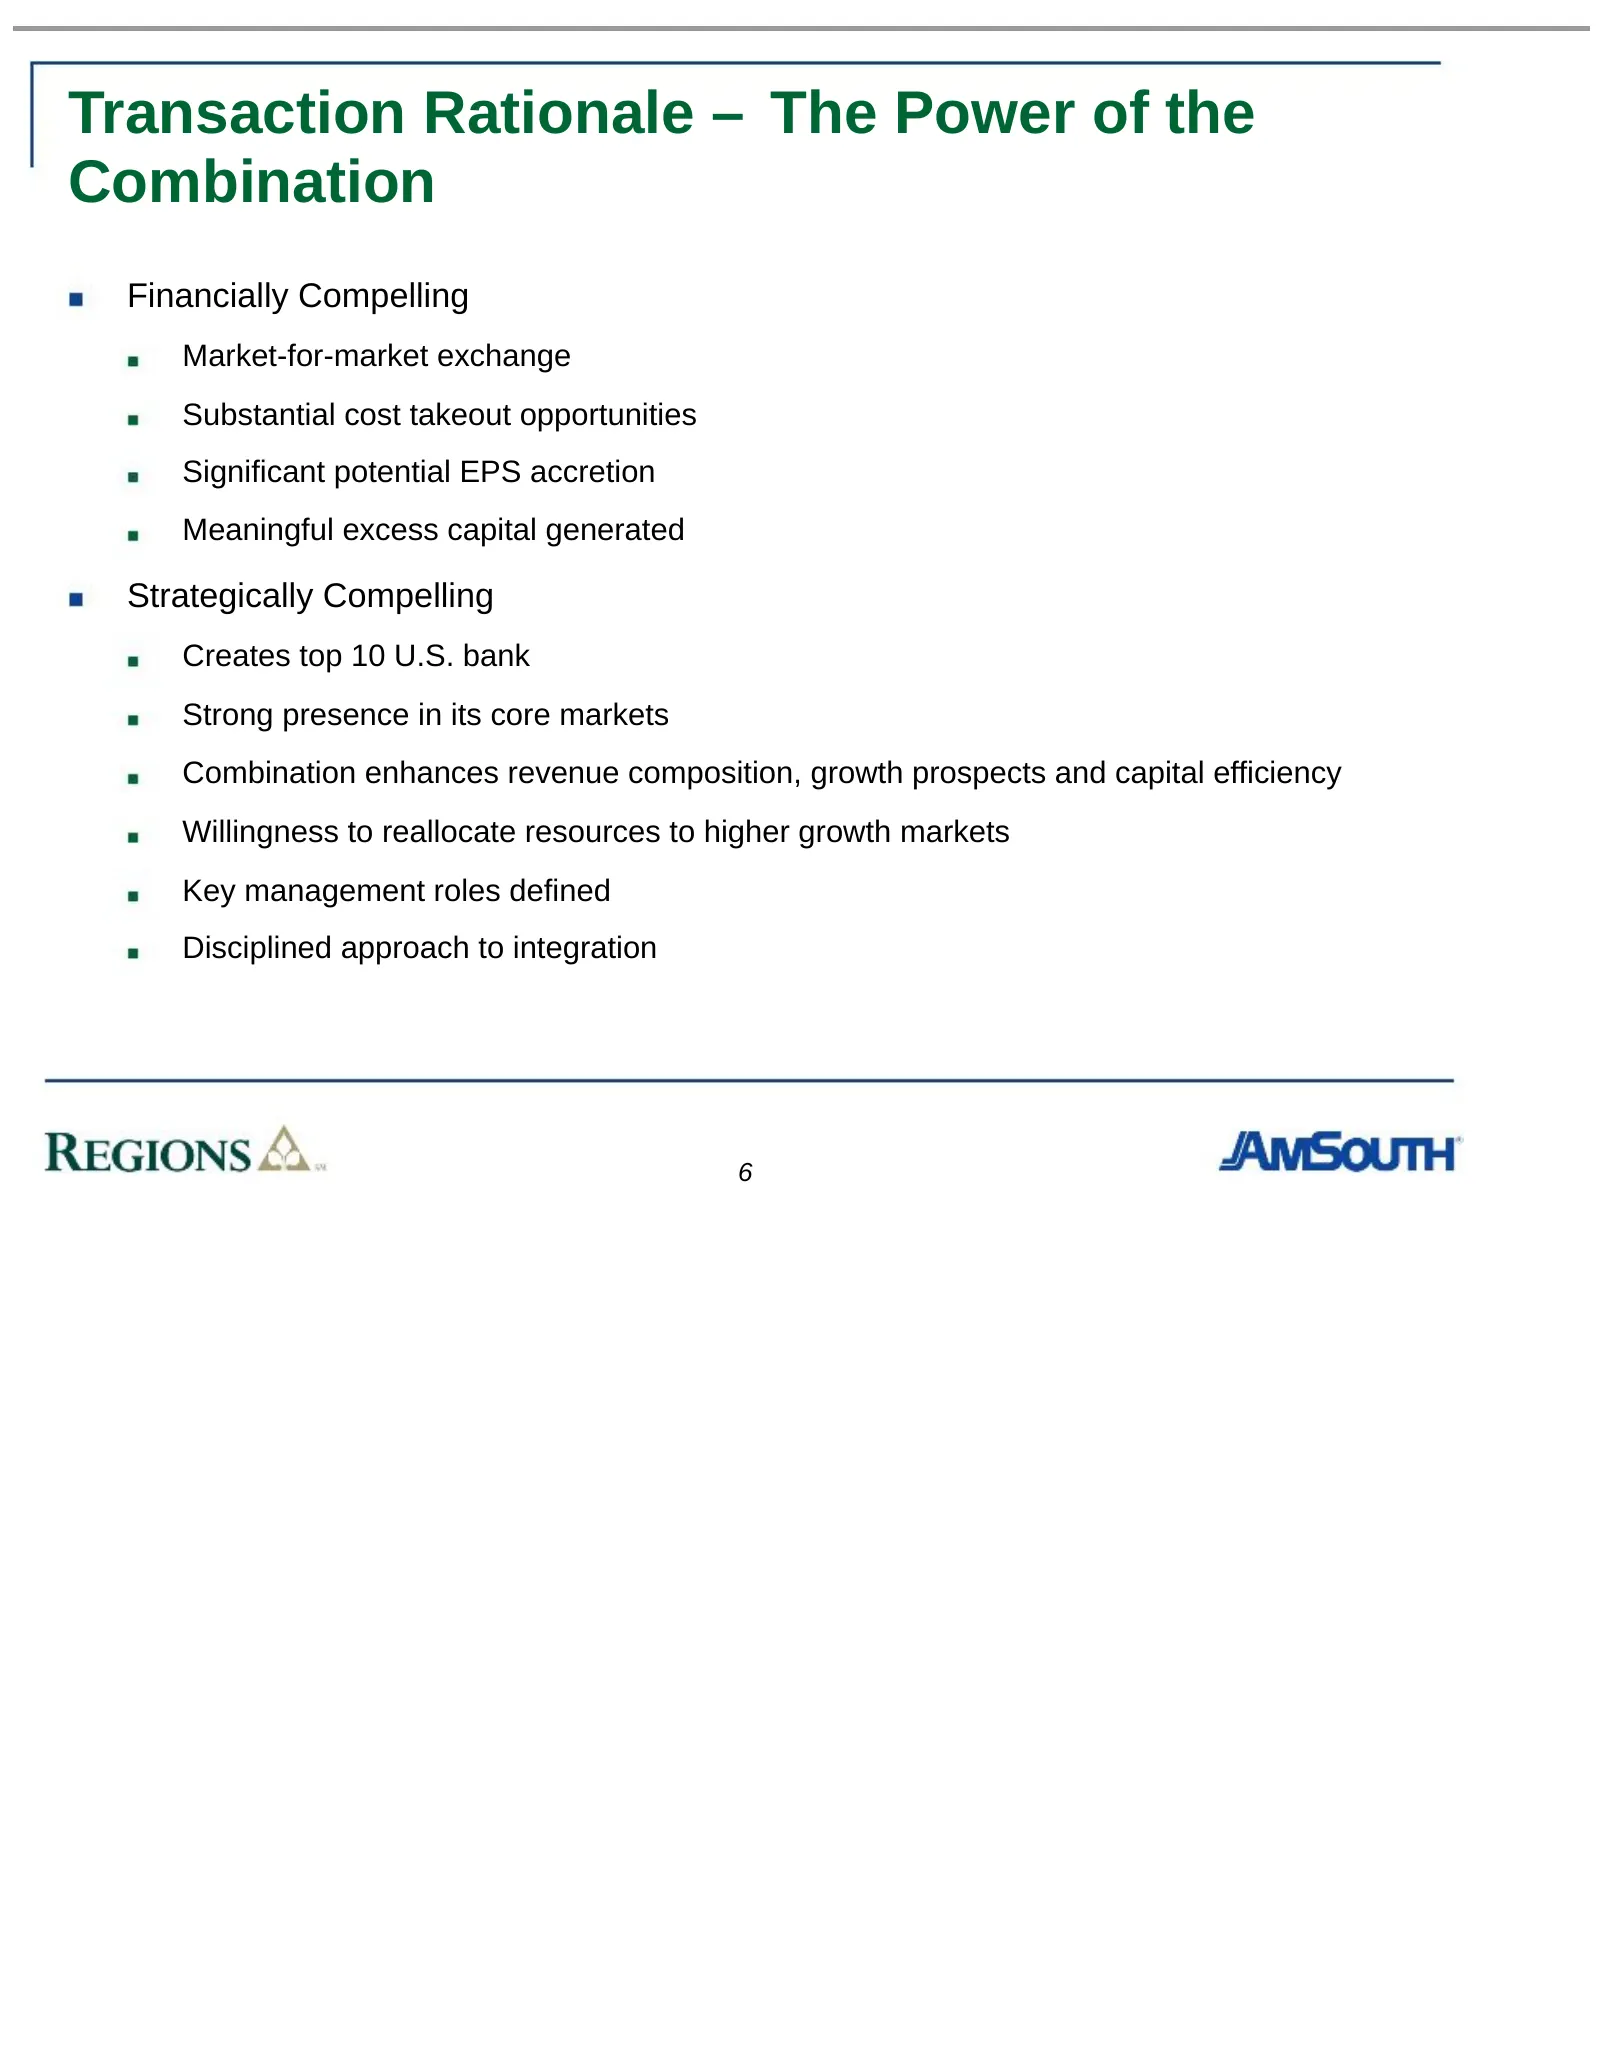
Transaction Rationale – The Power of the Combination Financially Compelling Market-for-market exchange Substantial cost takeout opportunities Significant potential EPS accretion Meaningful excess capital generated Strategically Compelling Creates top 10 U.S. bank Strong presence in its core markets
Slide 9: Transaction Summary
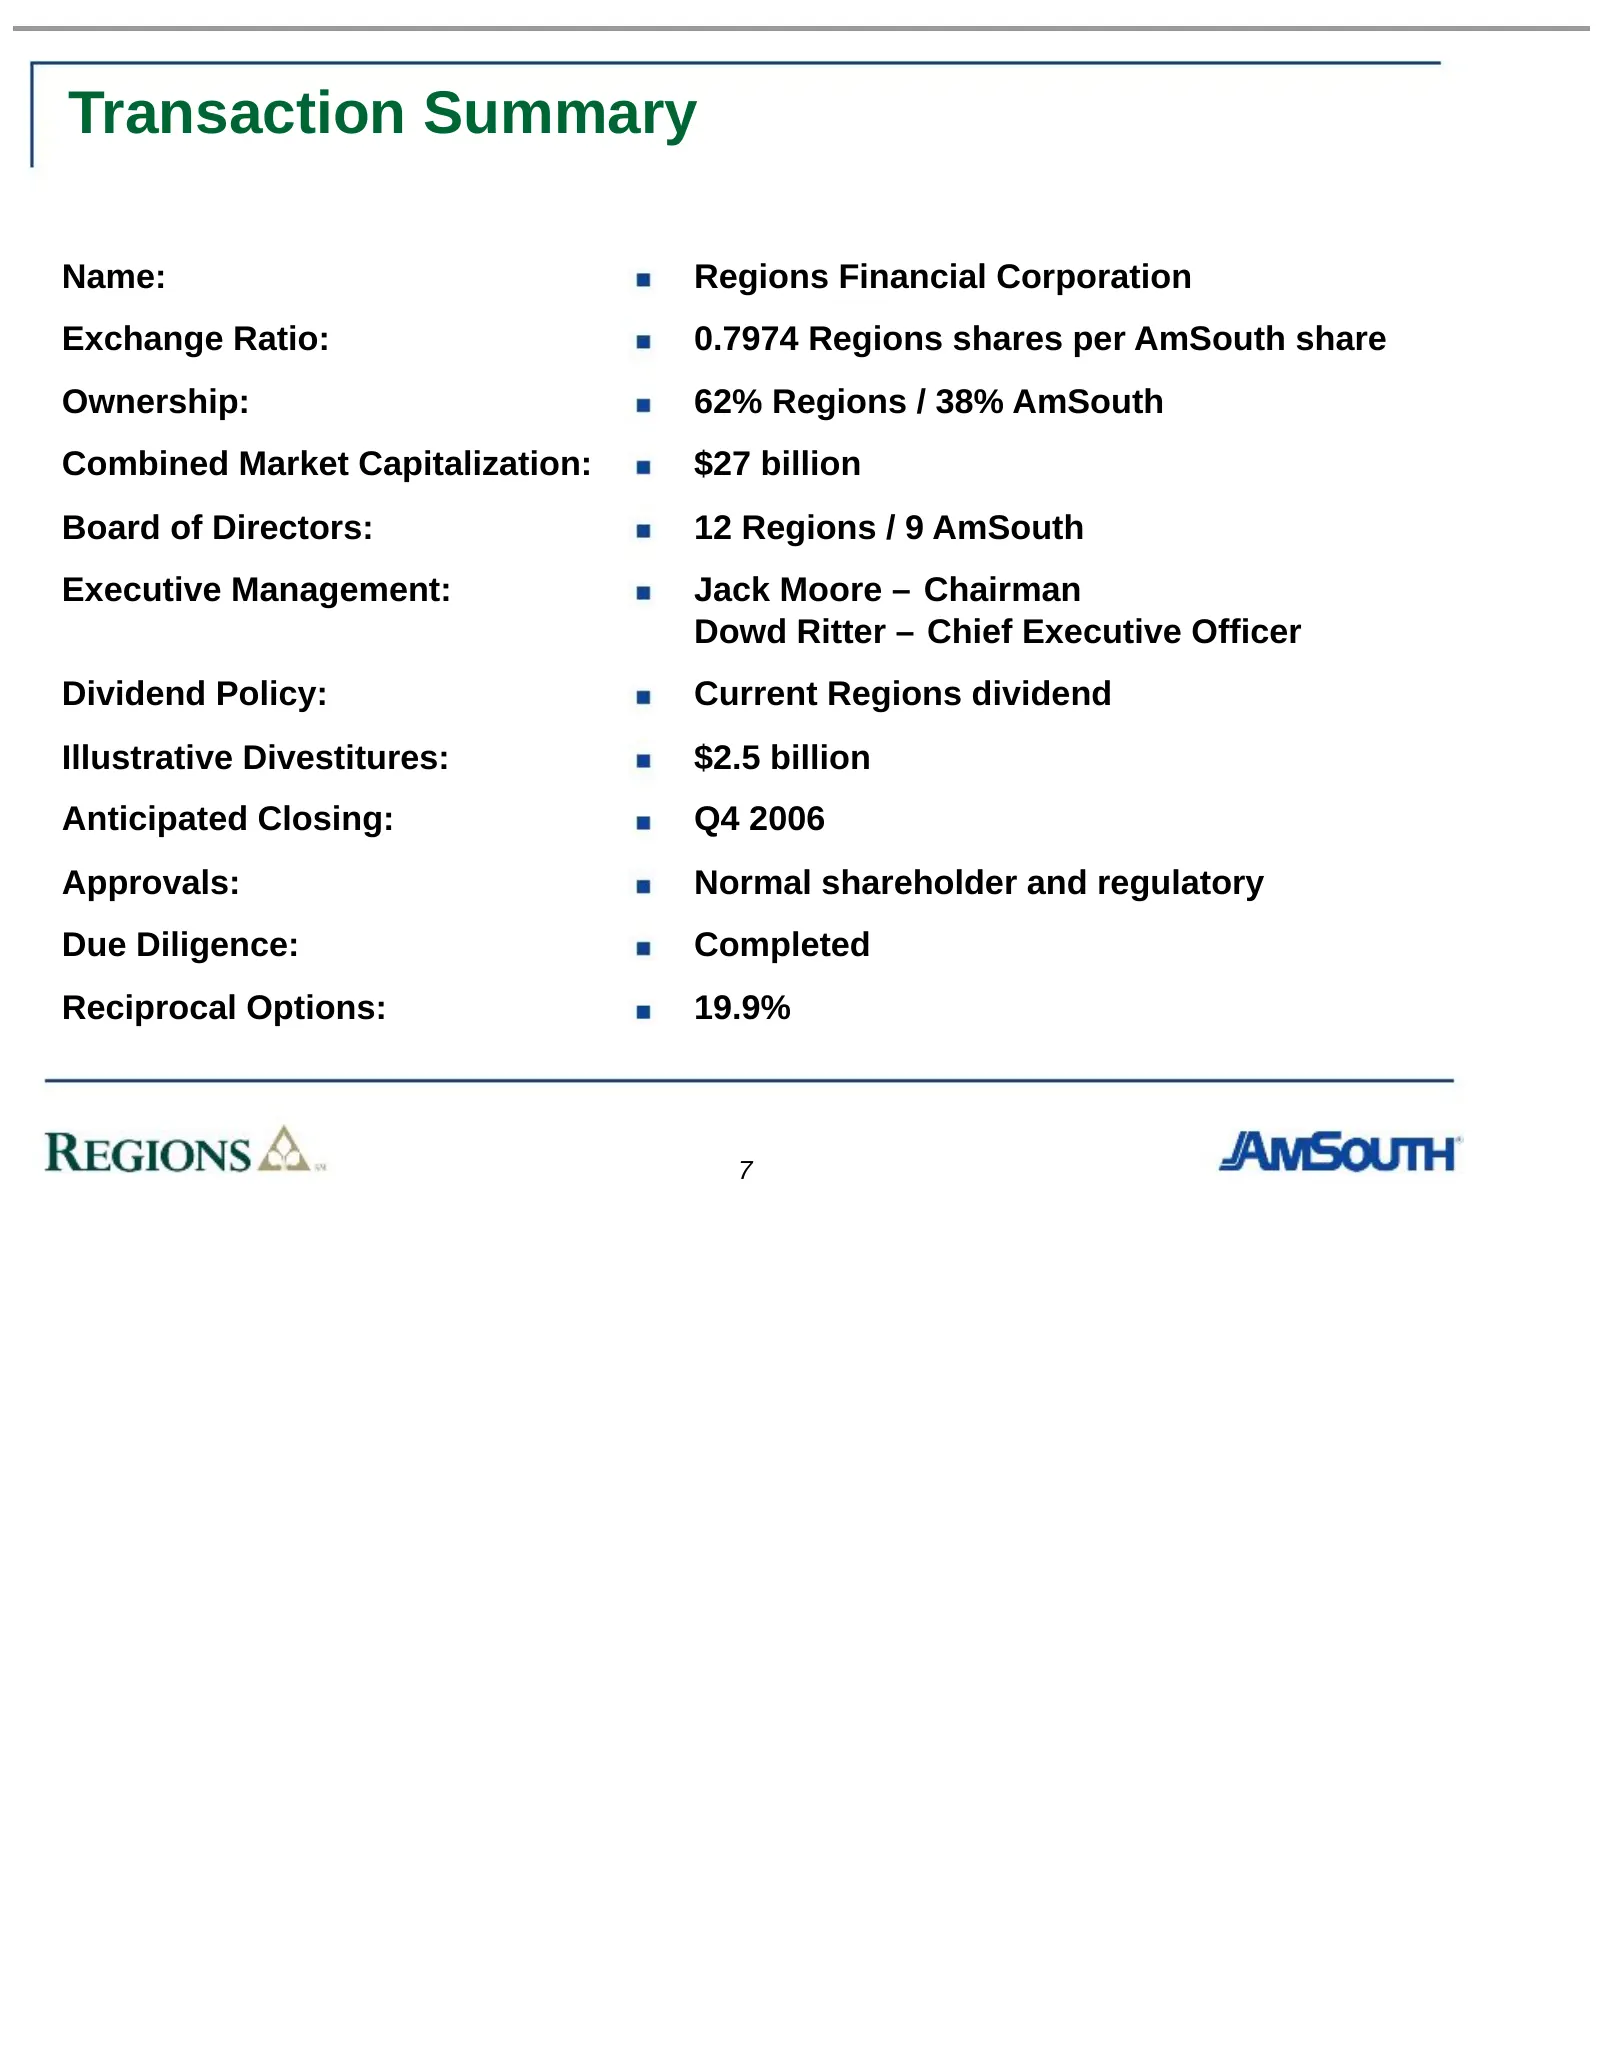
Transaction Summary Name: Regions Financial Corporation Exchange Ratio: 0.7974 Regions shares per AmSouth share Ownership: 62% Regions / 38% AmSouth Combined Market Capitalization: $27 billion Board of Directors: 12 Regions / 9 AmSouth Executive Management: Jack Moore – Chairman Dowd Ritter – Chief
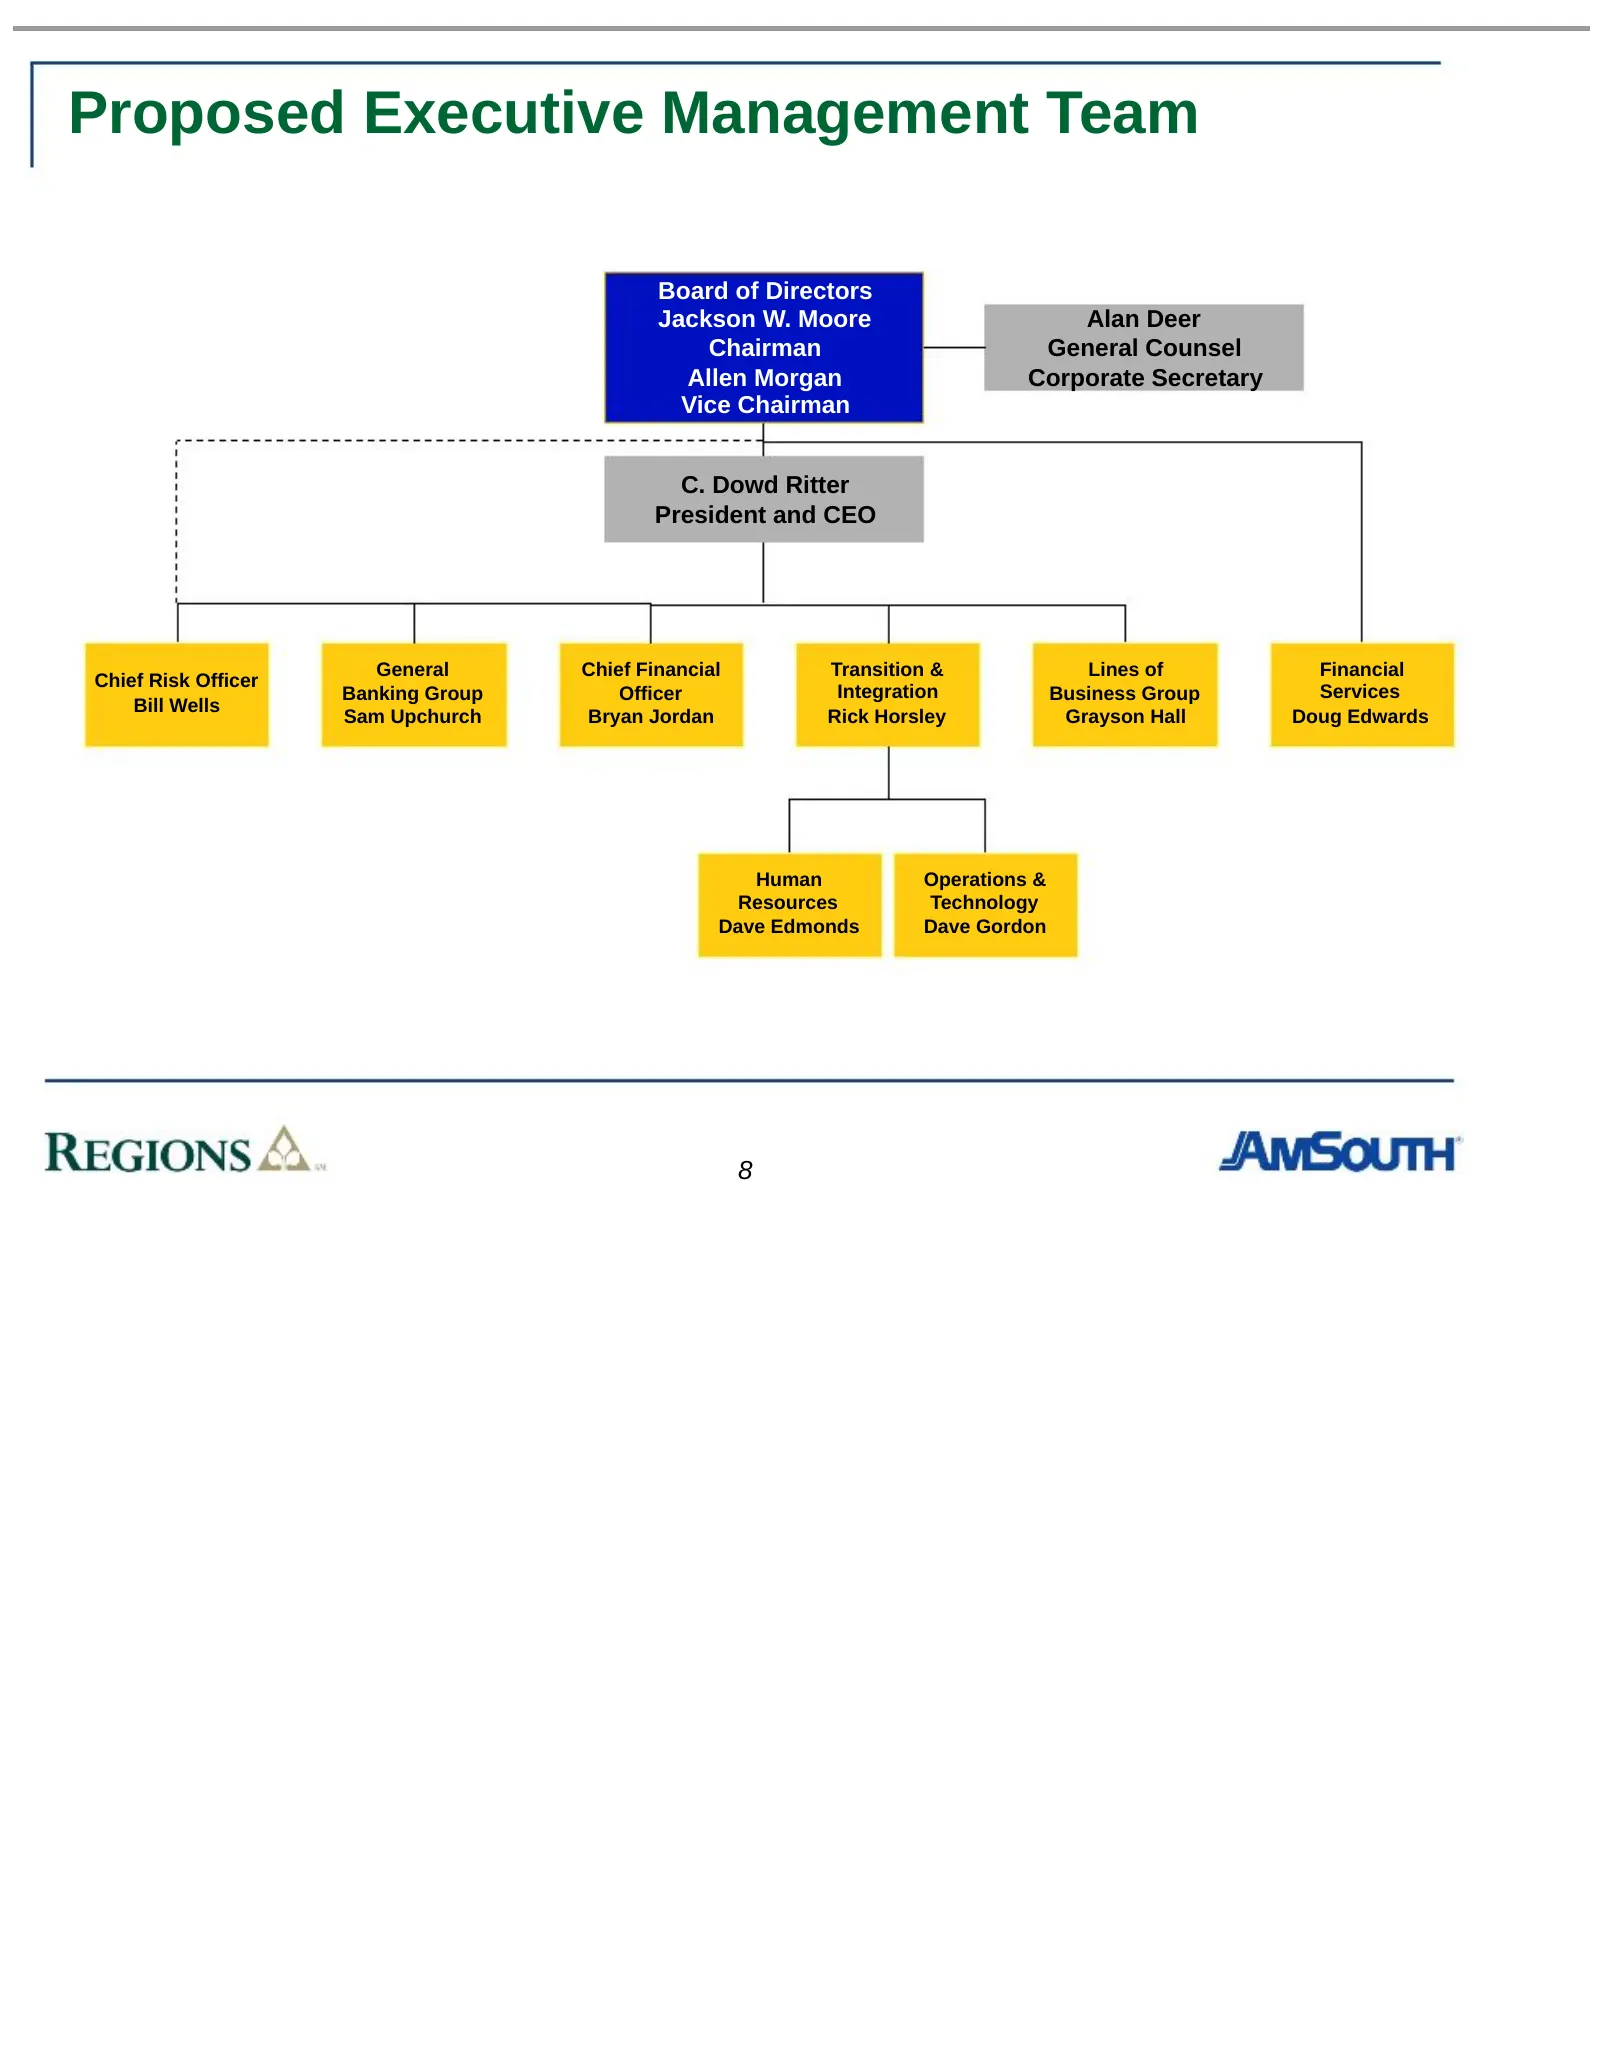
Slide 10: Proposed Executive Management Team
Proposed Executive Management Team Board of Directors Jackson W. Moore Alan Deer Chairman General Counsel Allen Morgan Corporate Secretary Vice Chairman C. Dowd Ritter President and CEO General Chief Financial Transition & Lines of Financial Chief Risk Officer Banking Group Officer Integration Busin
Slide 11: Integration and Strategic Vision
Integration and Strategic Vision Strategic combination of like-minded partners with a shared vision of the future Execution risk mitigated by similar operating models and conservative transaction structure Draw on successful integration track records of both organizations Communicate consistently wi
Slide 12: Combined Franchise Footprint
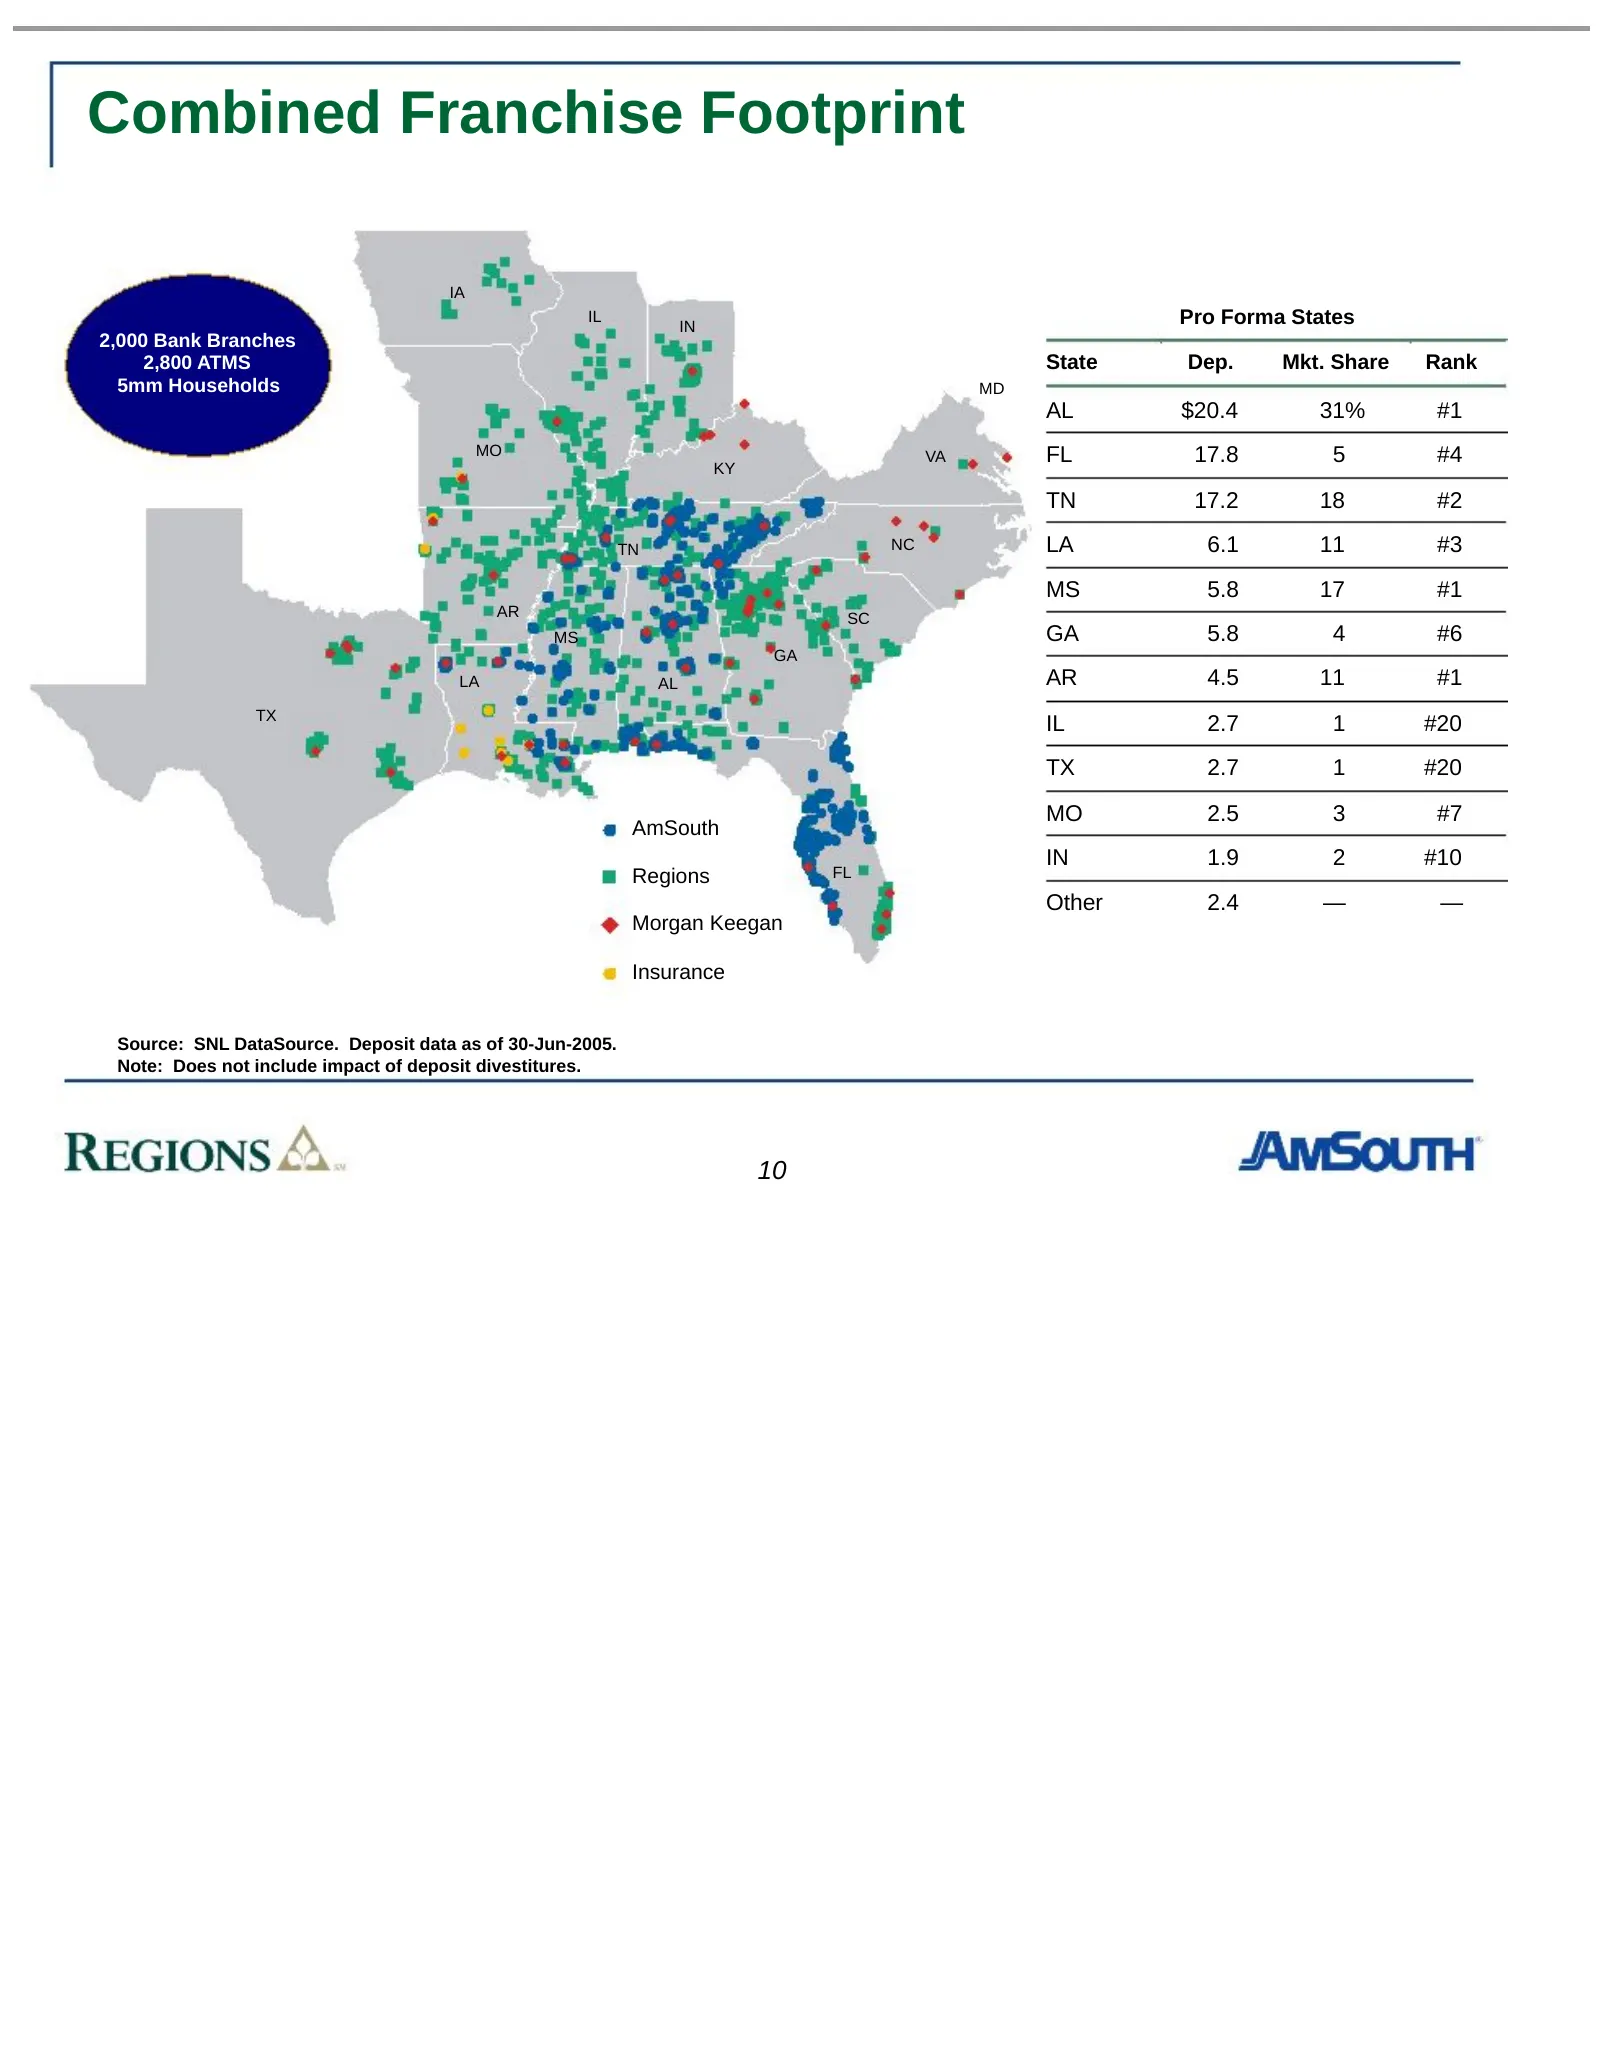
Combined Franchise Footprint IA IL IN Pro Forma States 2,000 Bank Branches 2,800 ATMS State Dep. Mkt. Share Rank 5mm Households MD AL $20.4 31% #1 MO VA FL 17.8 5 #4 KY TN 17.2 18 #2 TN NC LA 6.1 11 #3 MS 5.8 17 #1 AR SC MS GA 5.8 4 #6 GA LA AL AR 4.5 11 #1 TX IL 2.7 1 #20 TX 2.7 1 #20 MO 2.5 3 #7 A
Slide 13: Combination Creates Scale and Regional Leadership
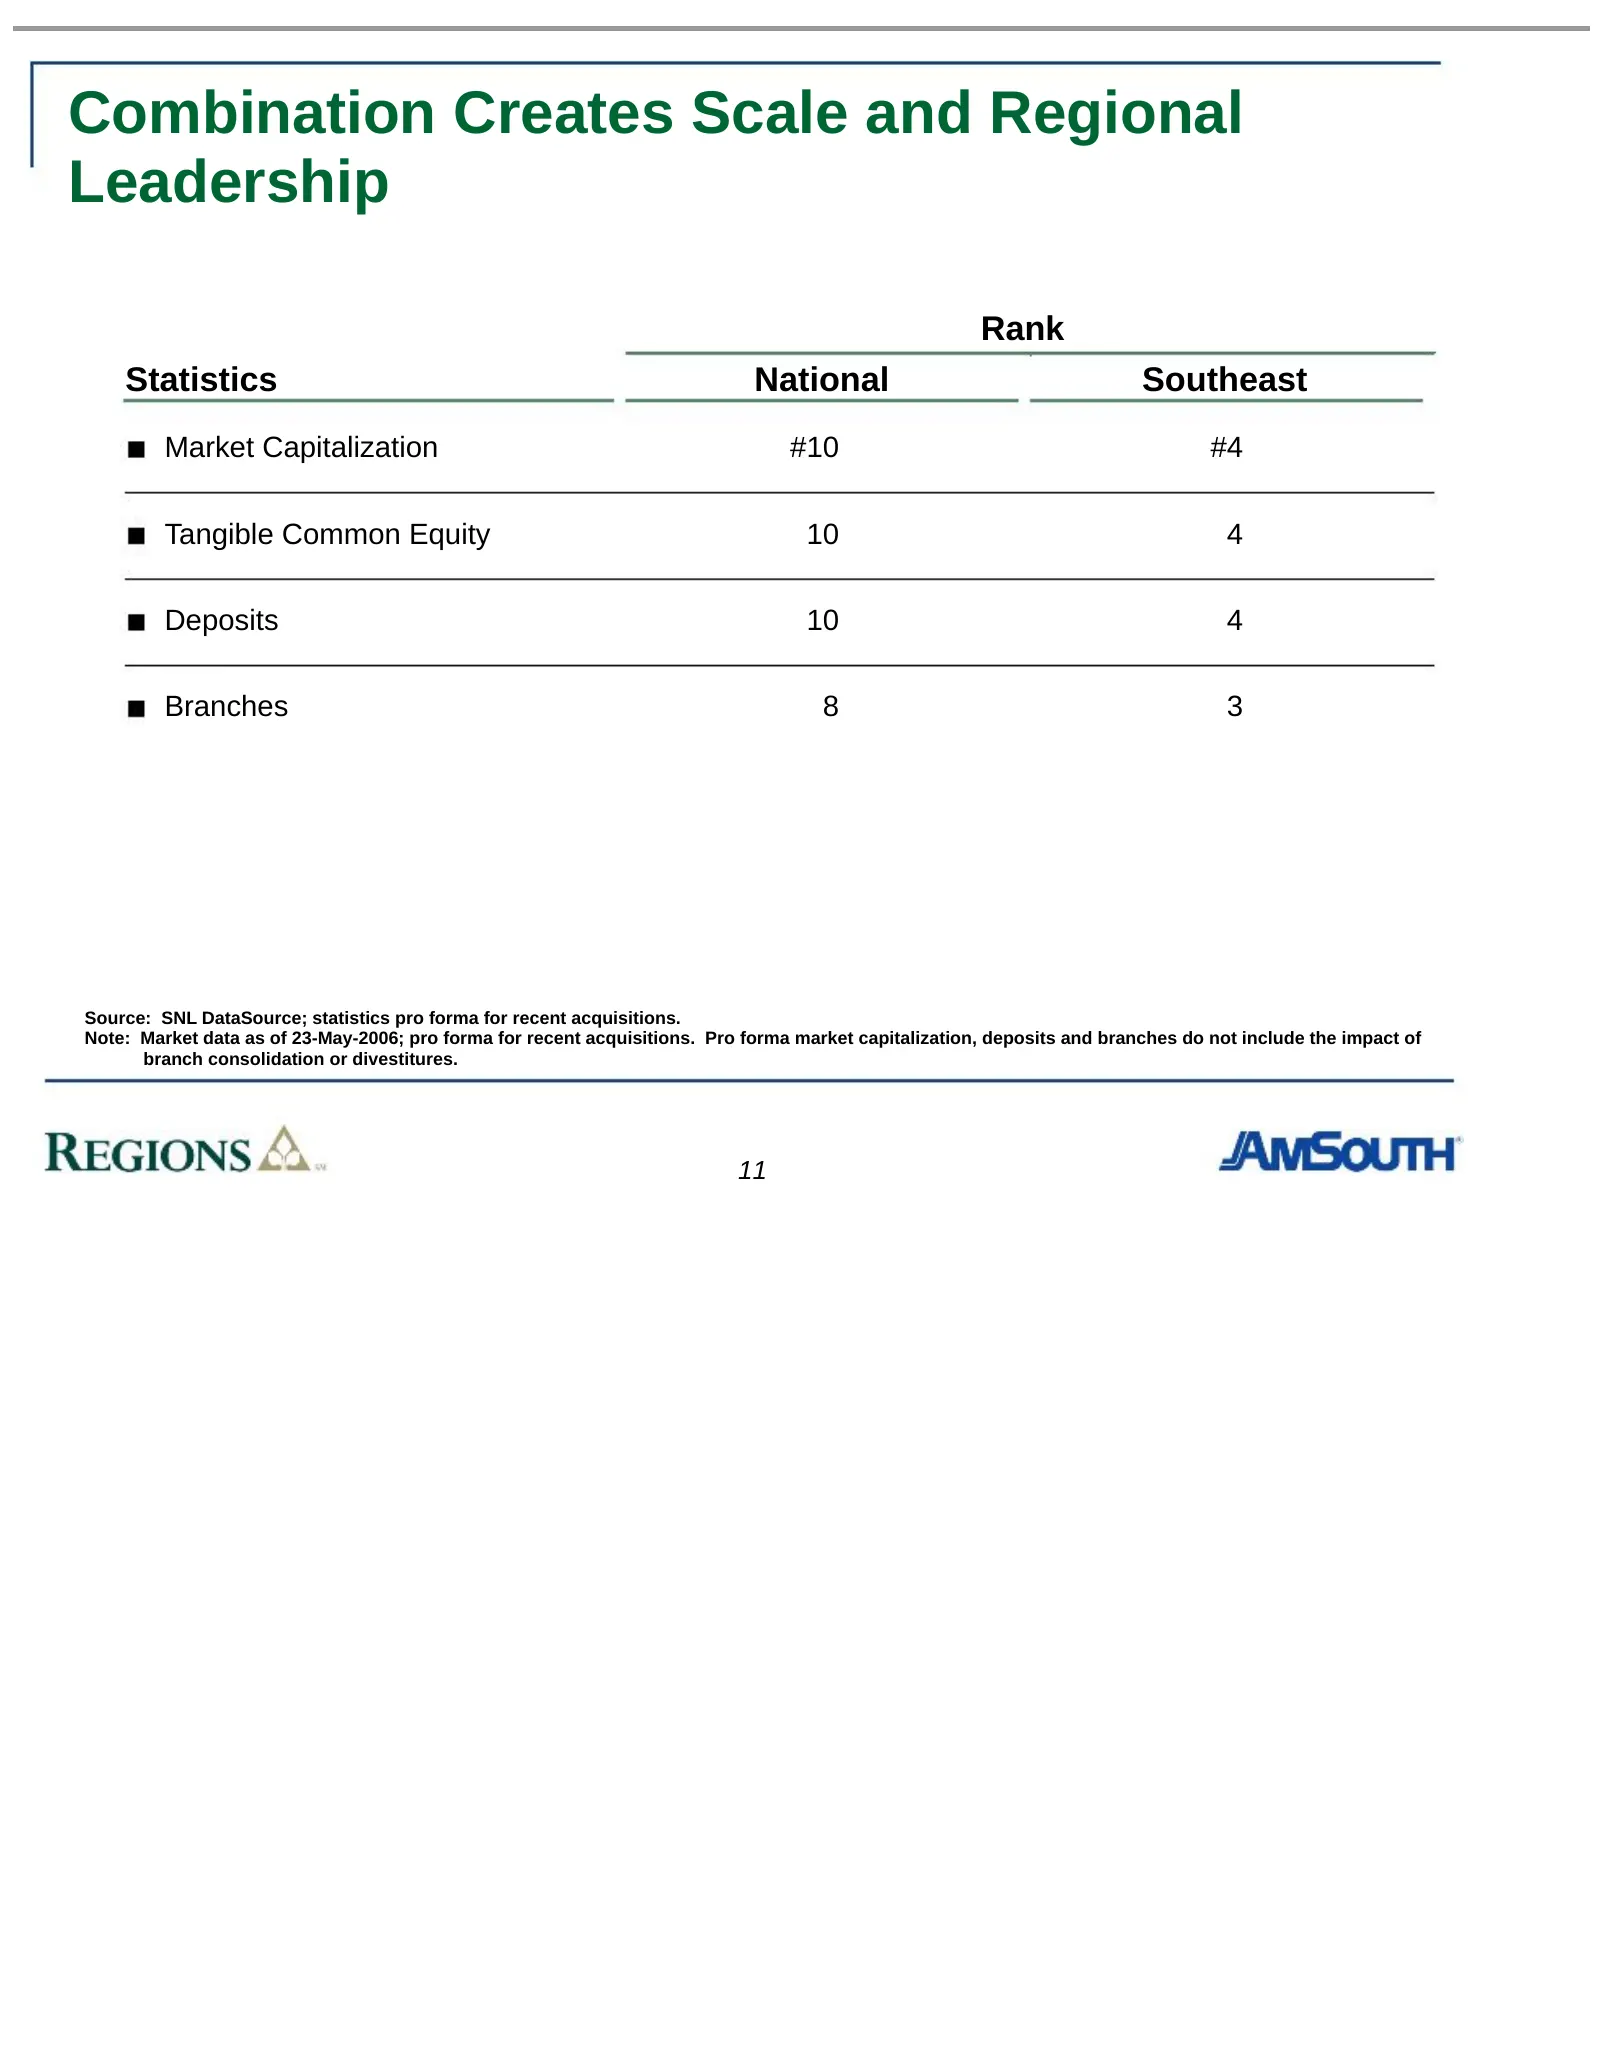
Combination Creates Scale and Regional Leadership Rank Statistics National Southeast Market Capitalization #10 #4 Tangible Common Equity 10 4 Deposits 10 4 Branches 8 3 Source: SNL DataSource; statistics pro forma for recent acquisitions. Note: Market data as of 23-May-2006; pro forma for recent acq
Slide 14: Strengthens Presence in Key MSAs
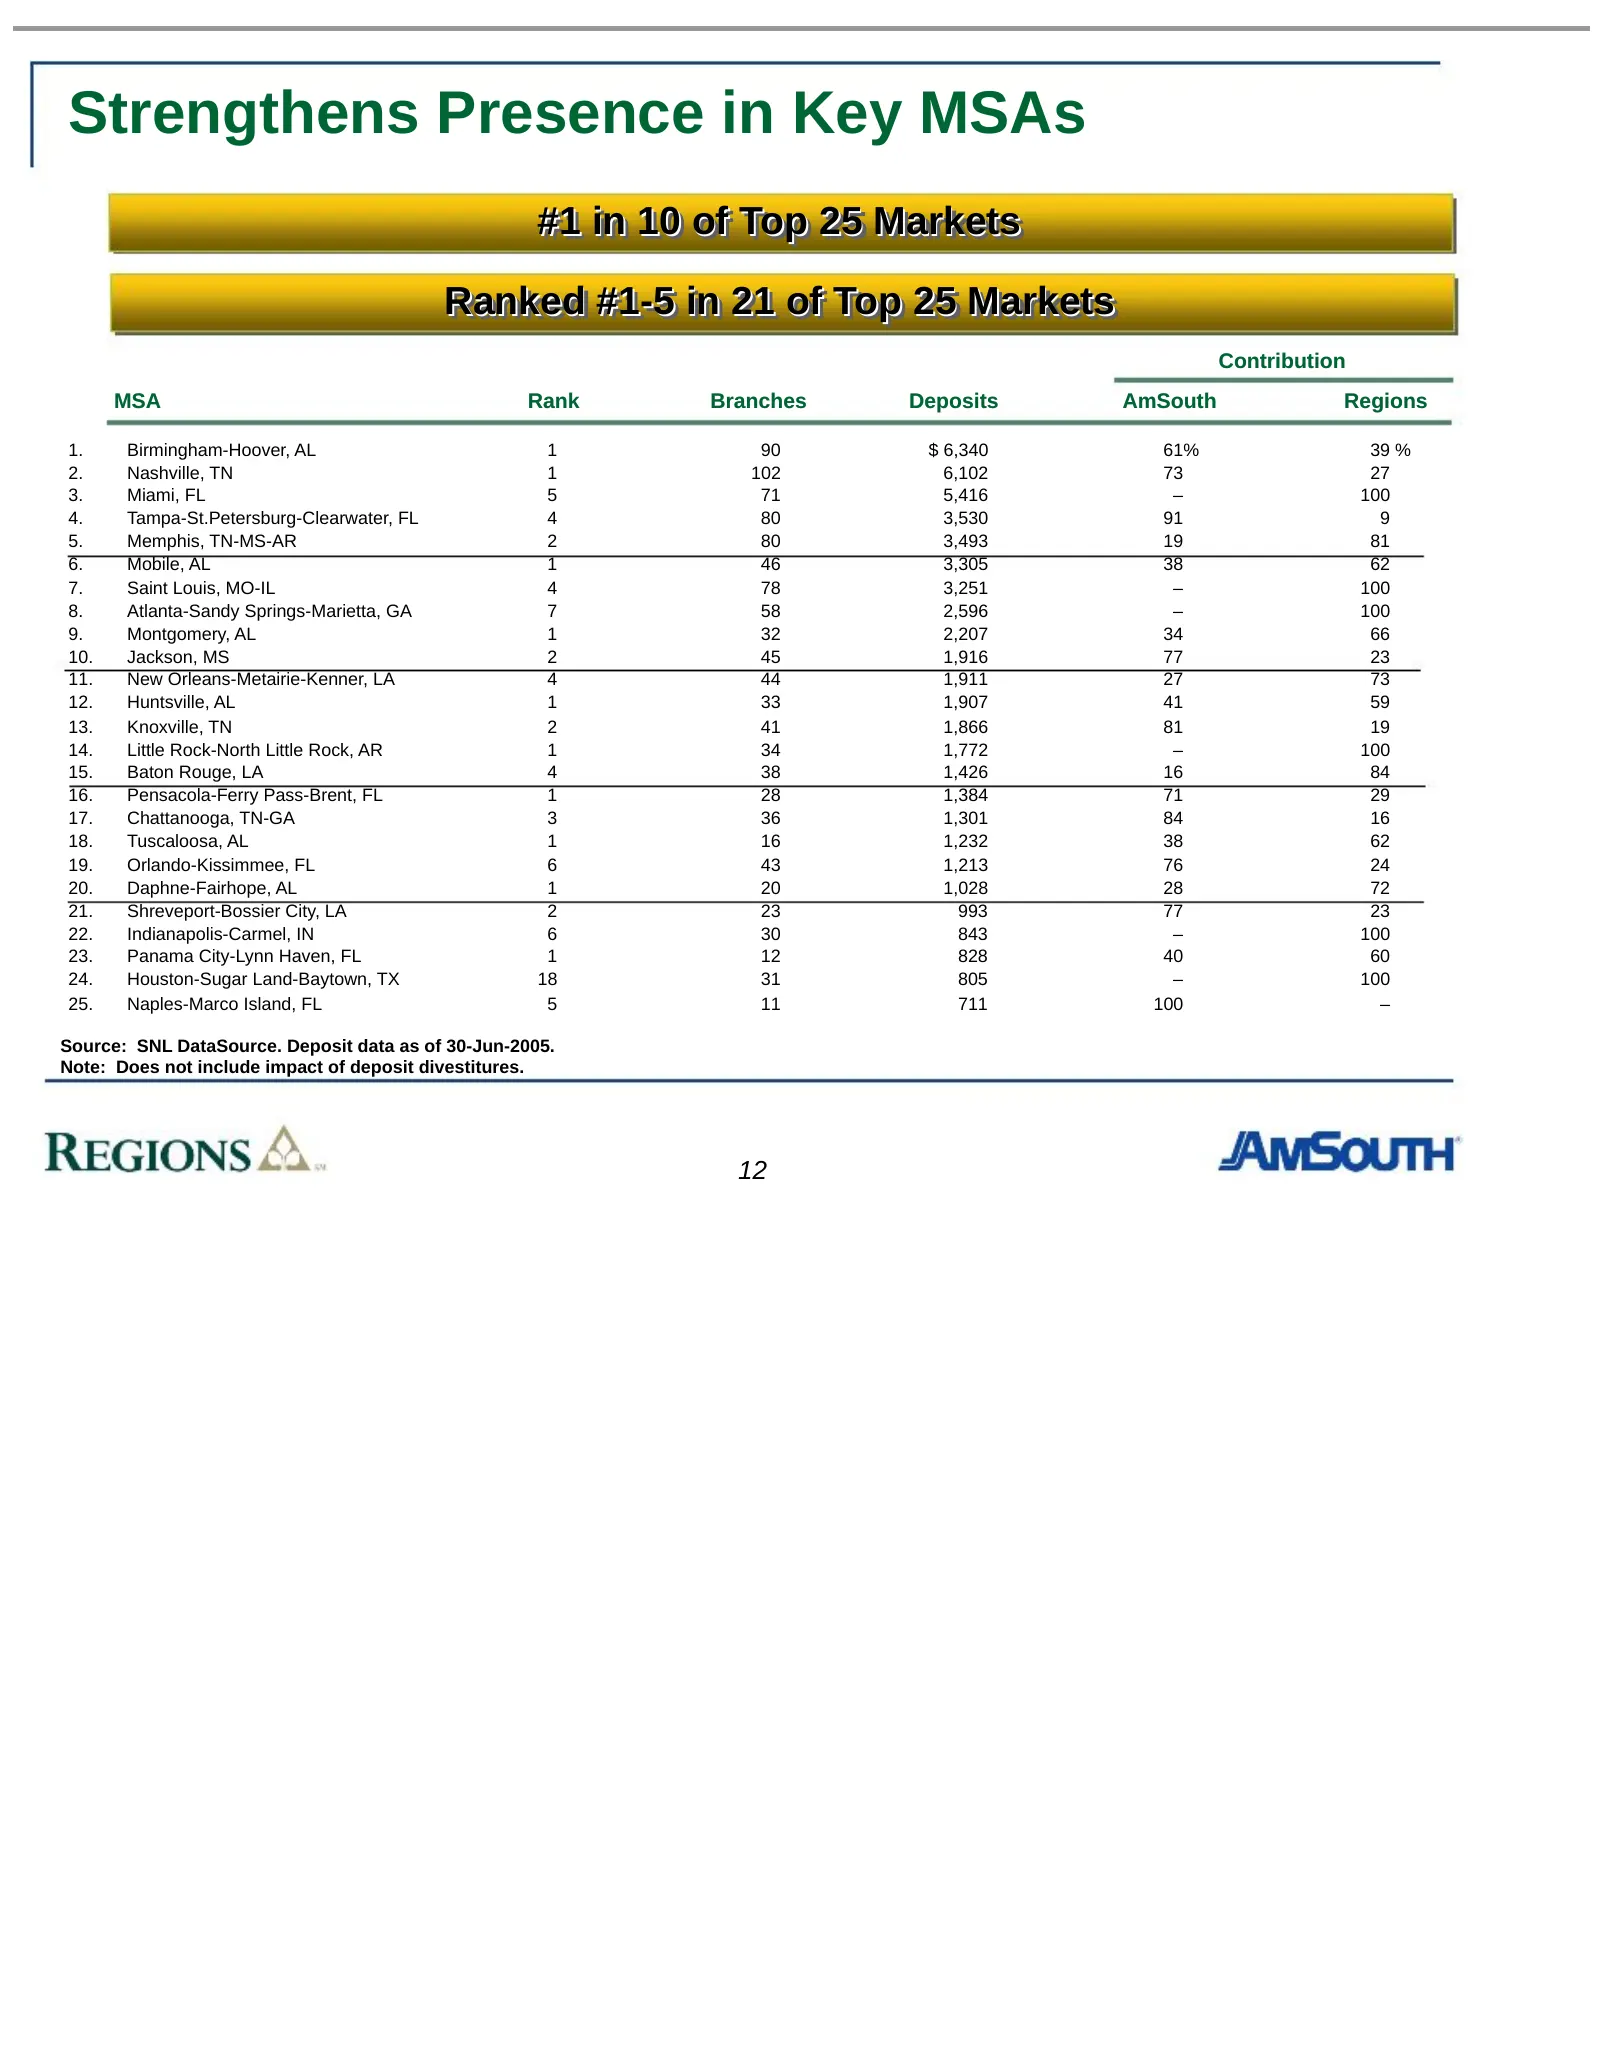
Strengthens Presence in Key MSAs #1 #1 in in 10 10 of of Top Top 25 25 Markets Markets Ranked Ranked #1-5 #1-5 in in 21 21 of of Top Top 25 25 Markets Markets Contribution MSA Rank Branches Deposits AmSouth Regions 1. Birmingham-Hoover, AL 1 90 $ 6,340 61% 39 % 2. Nashville, TN 1 102 6,102 73 27 3.
Slide 15: Combination Creates Strategic Opportunities
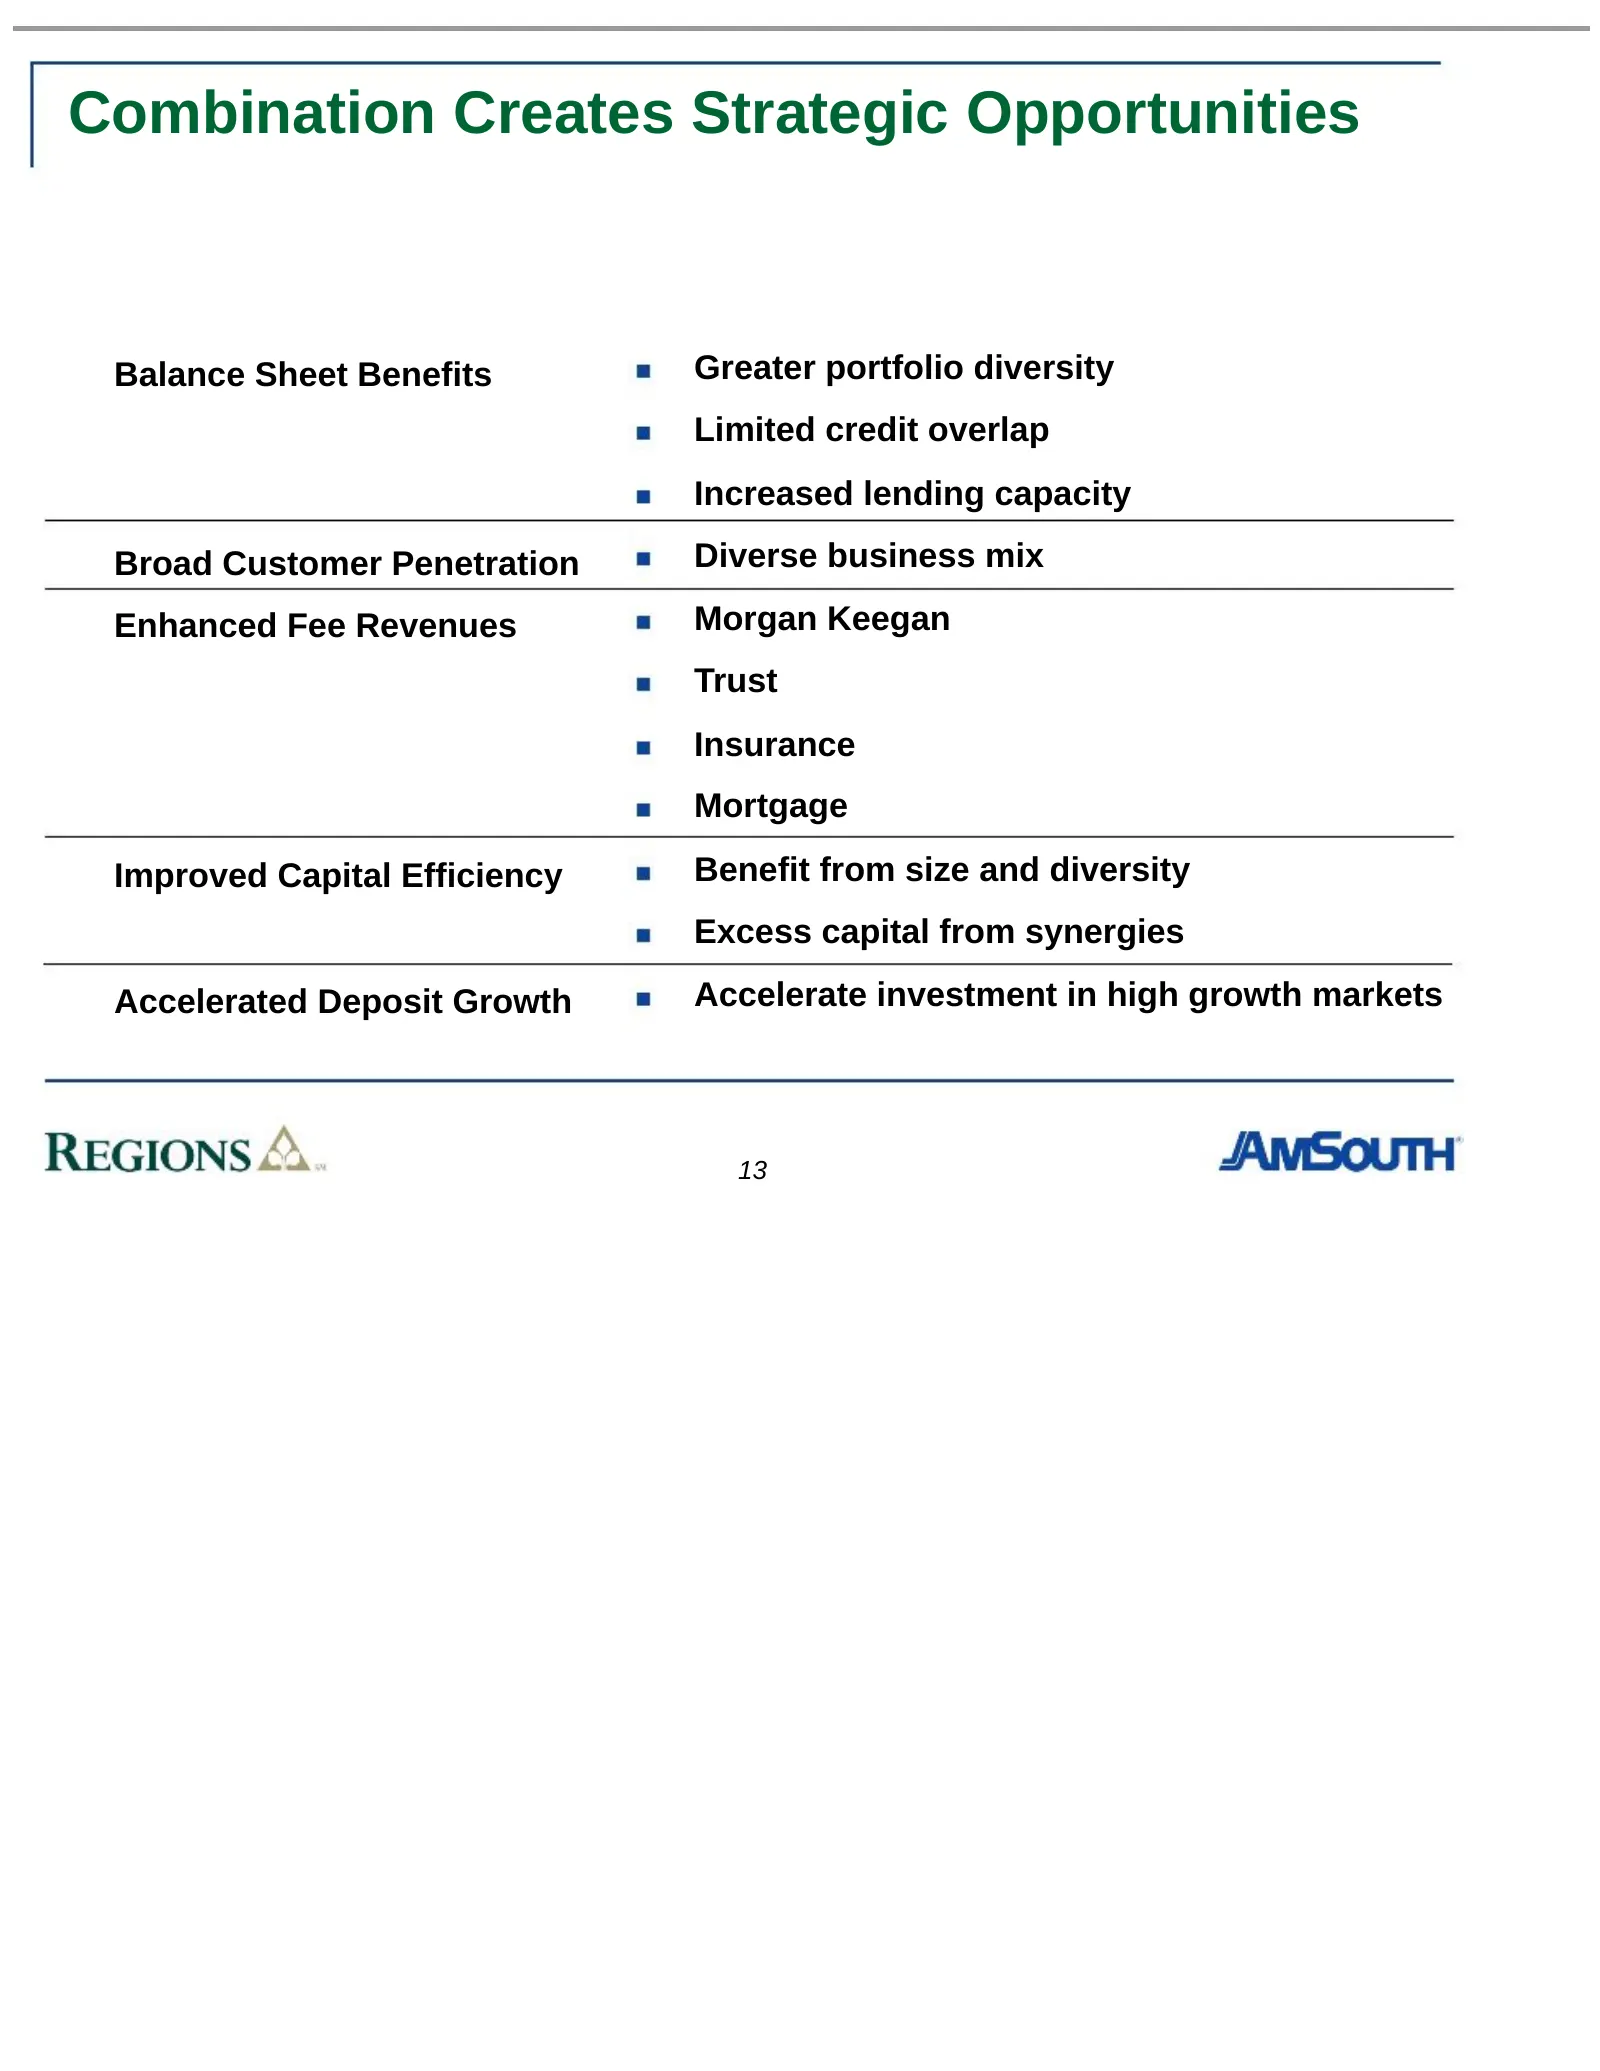
Combination Creates Strategic Opportunities Balance Sheet Benefits Greater portfolio diversity Limited credit overlap Increased lending capacity Broad Customer Penetration Diverse business mix Enhanced Fee Revenues Morgan Keegan Trust Insurance Mortgage Improved Capital Efficiency Benefit from size
Slide 16: A Balanced Loan Portfolio
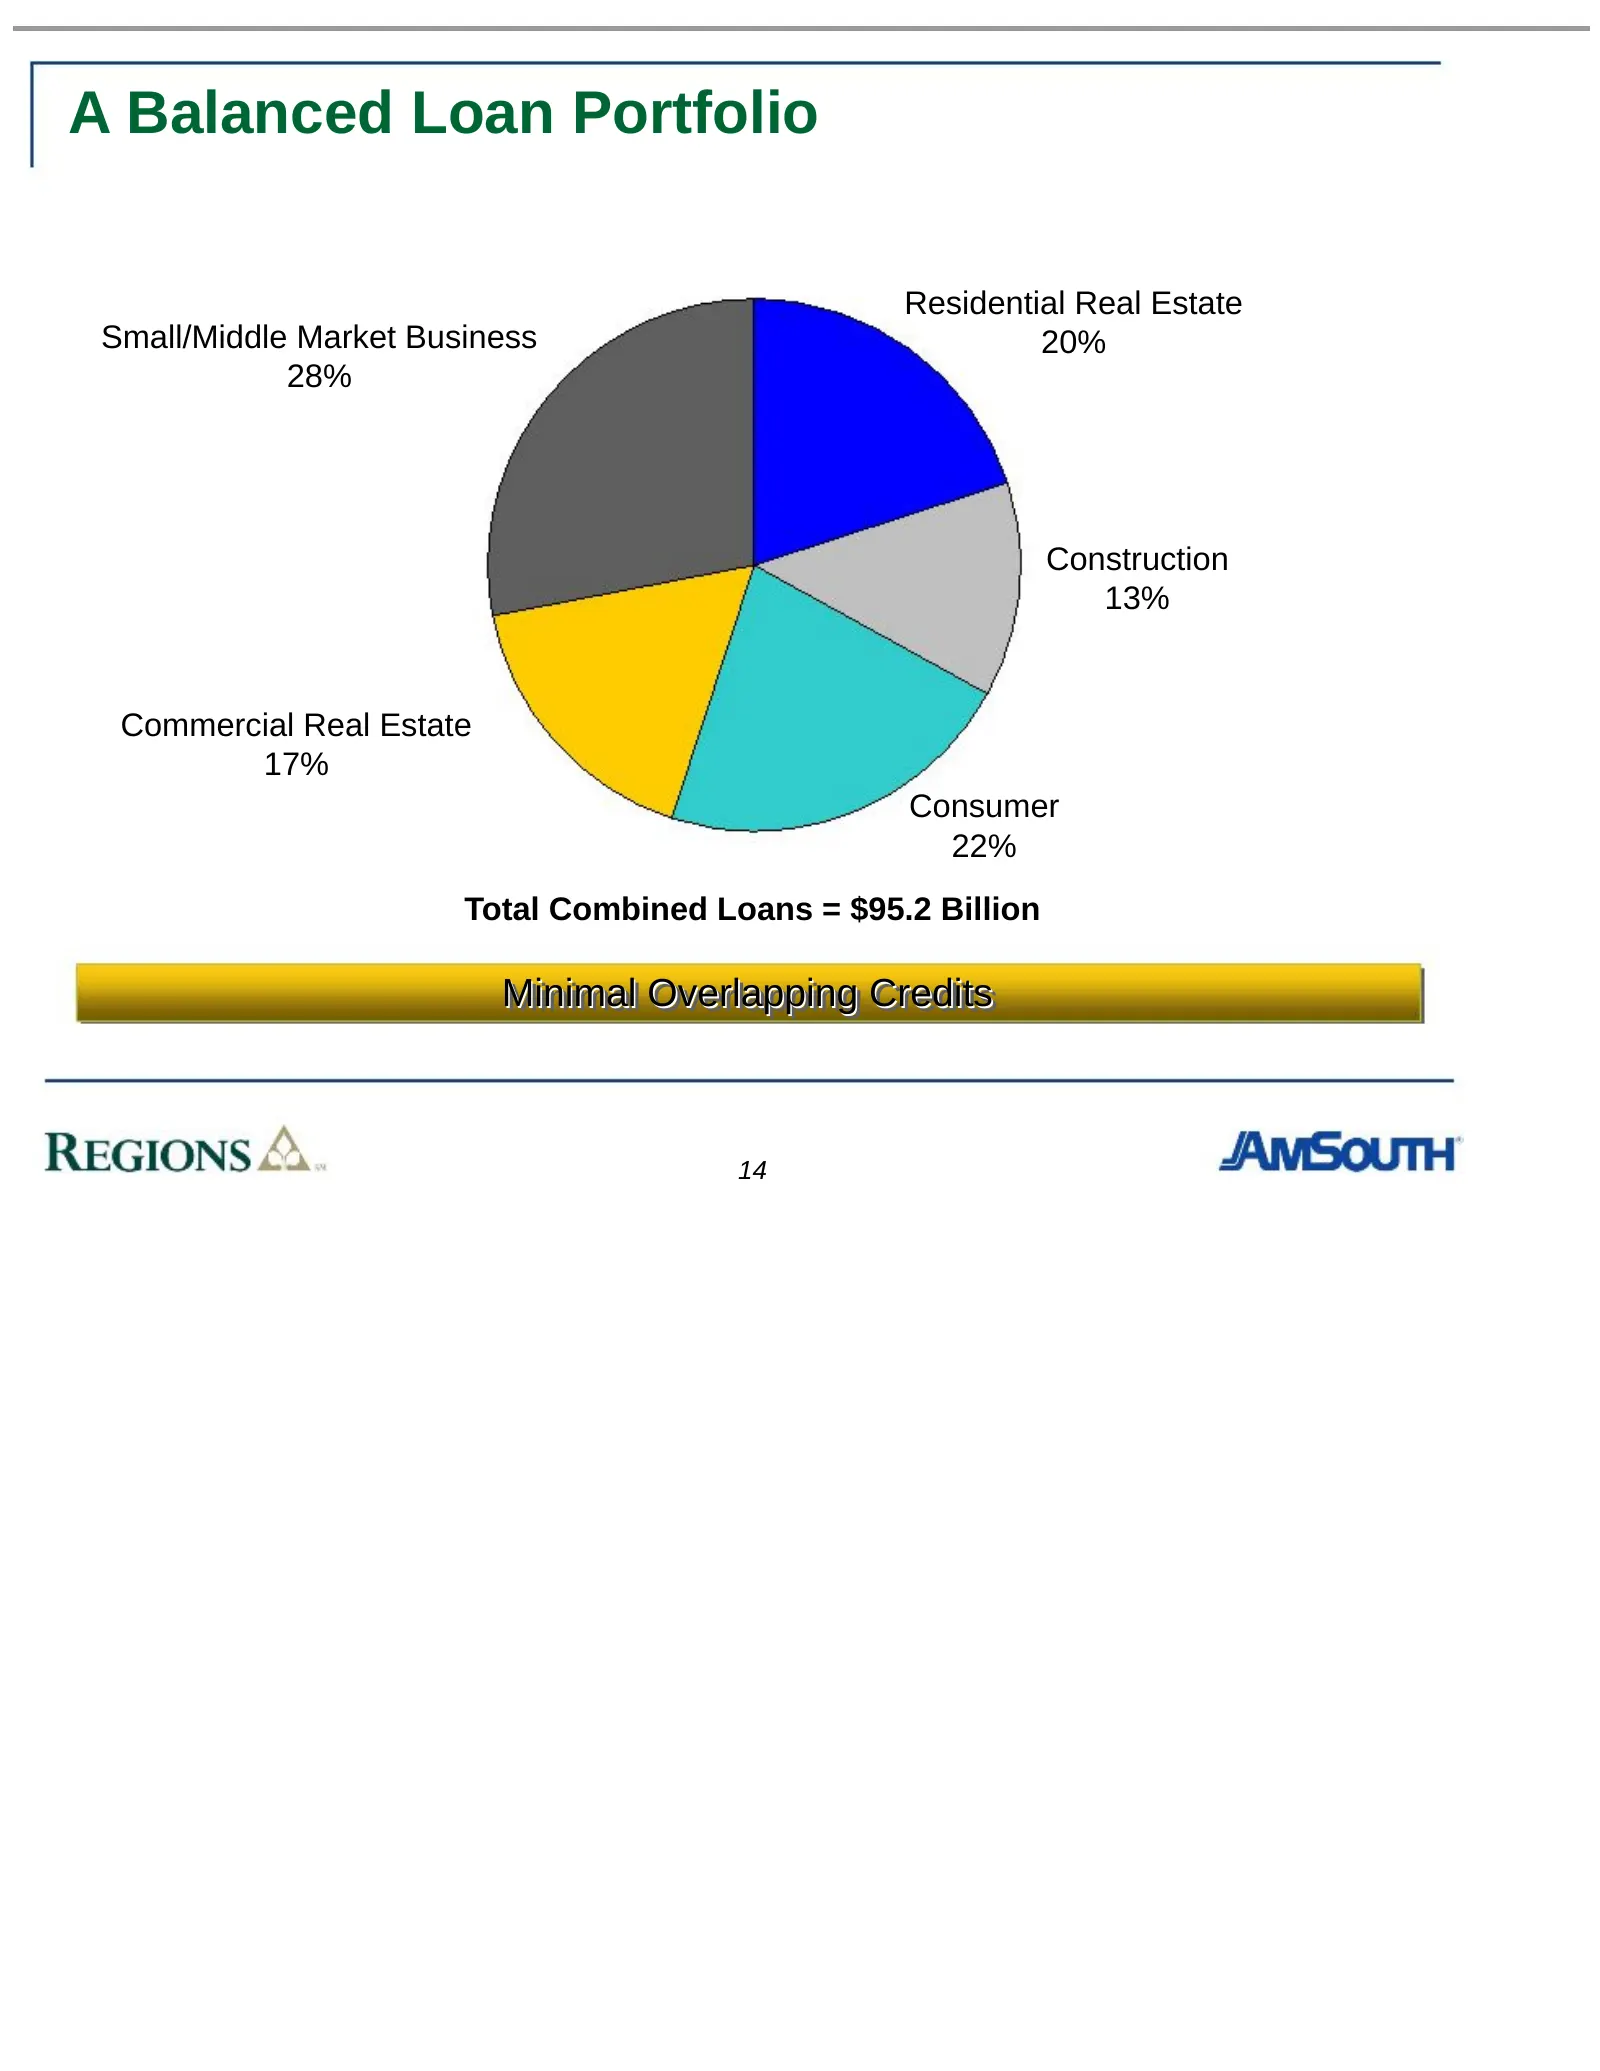
A Balanced Loan Portfolio Residential Real Estate Small/Middle Market Business 20% 28% Construction 13% Commercial Real Estate 17% Consumer 22% Total Combined Loans = $95.2 Billion Minimal Minimal Overlapping Overlapping Credits Credits 14
Slide 17: Leading Regional Brokerage Platform to be Levered Across AmSouth Franchise
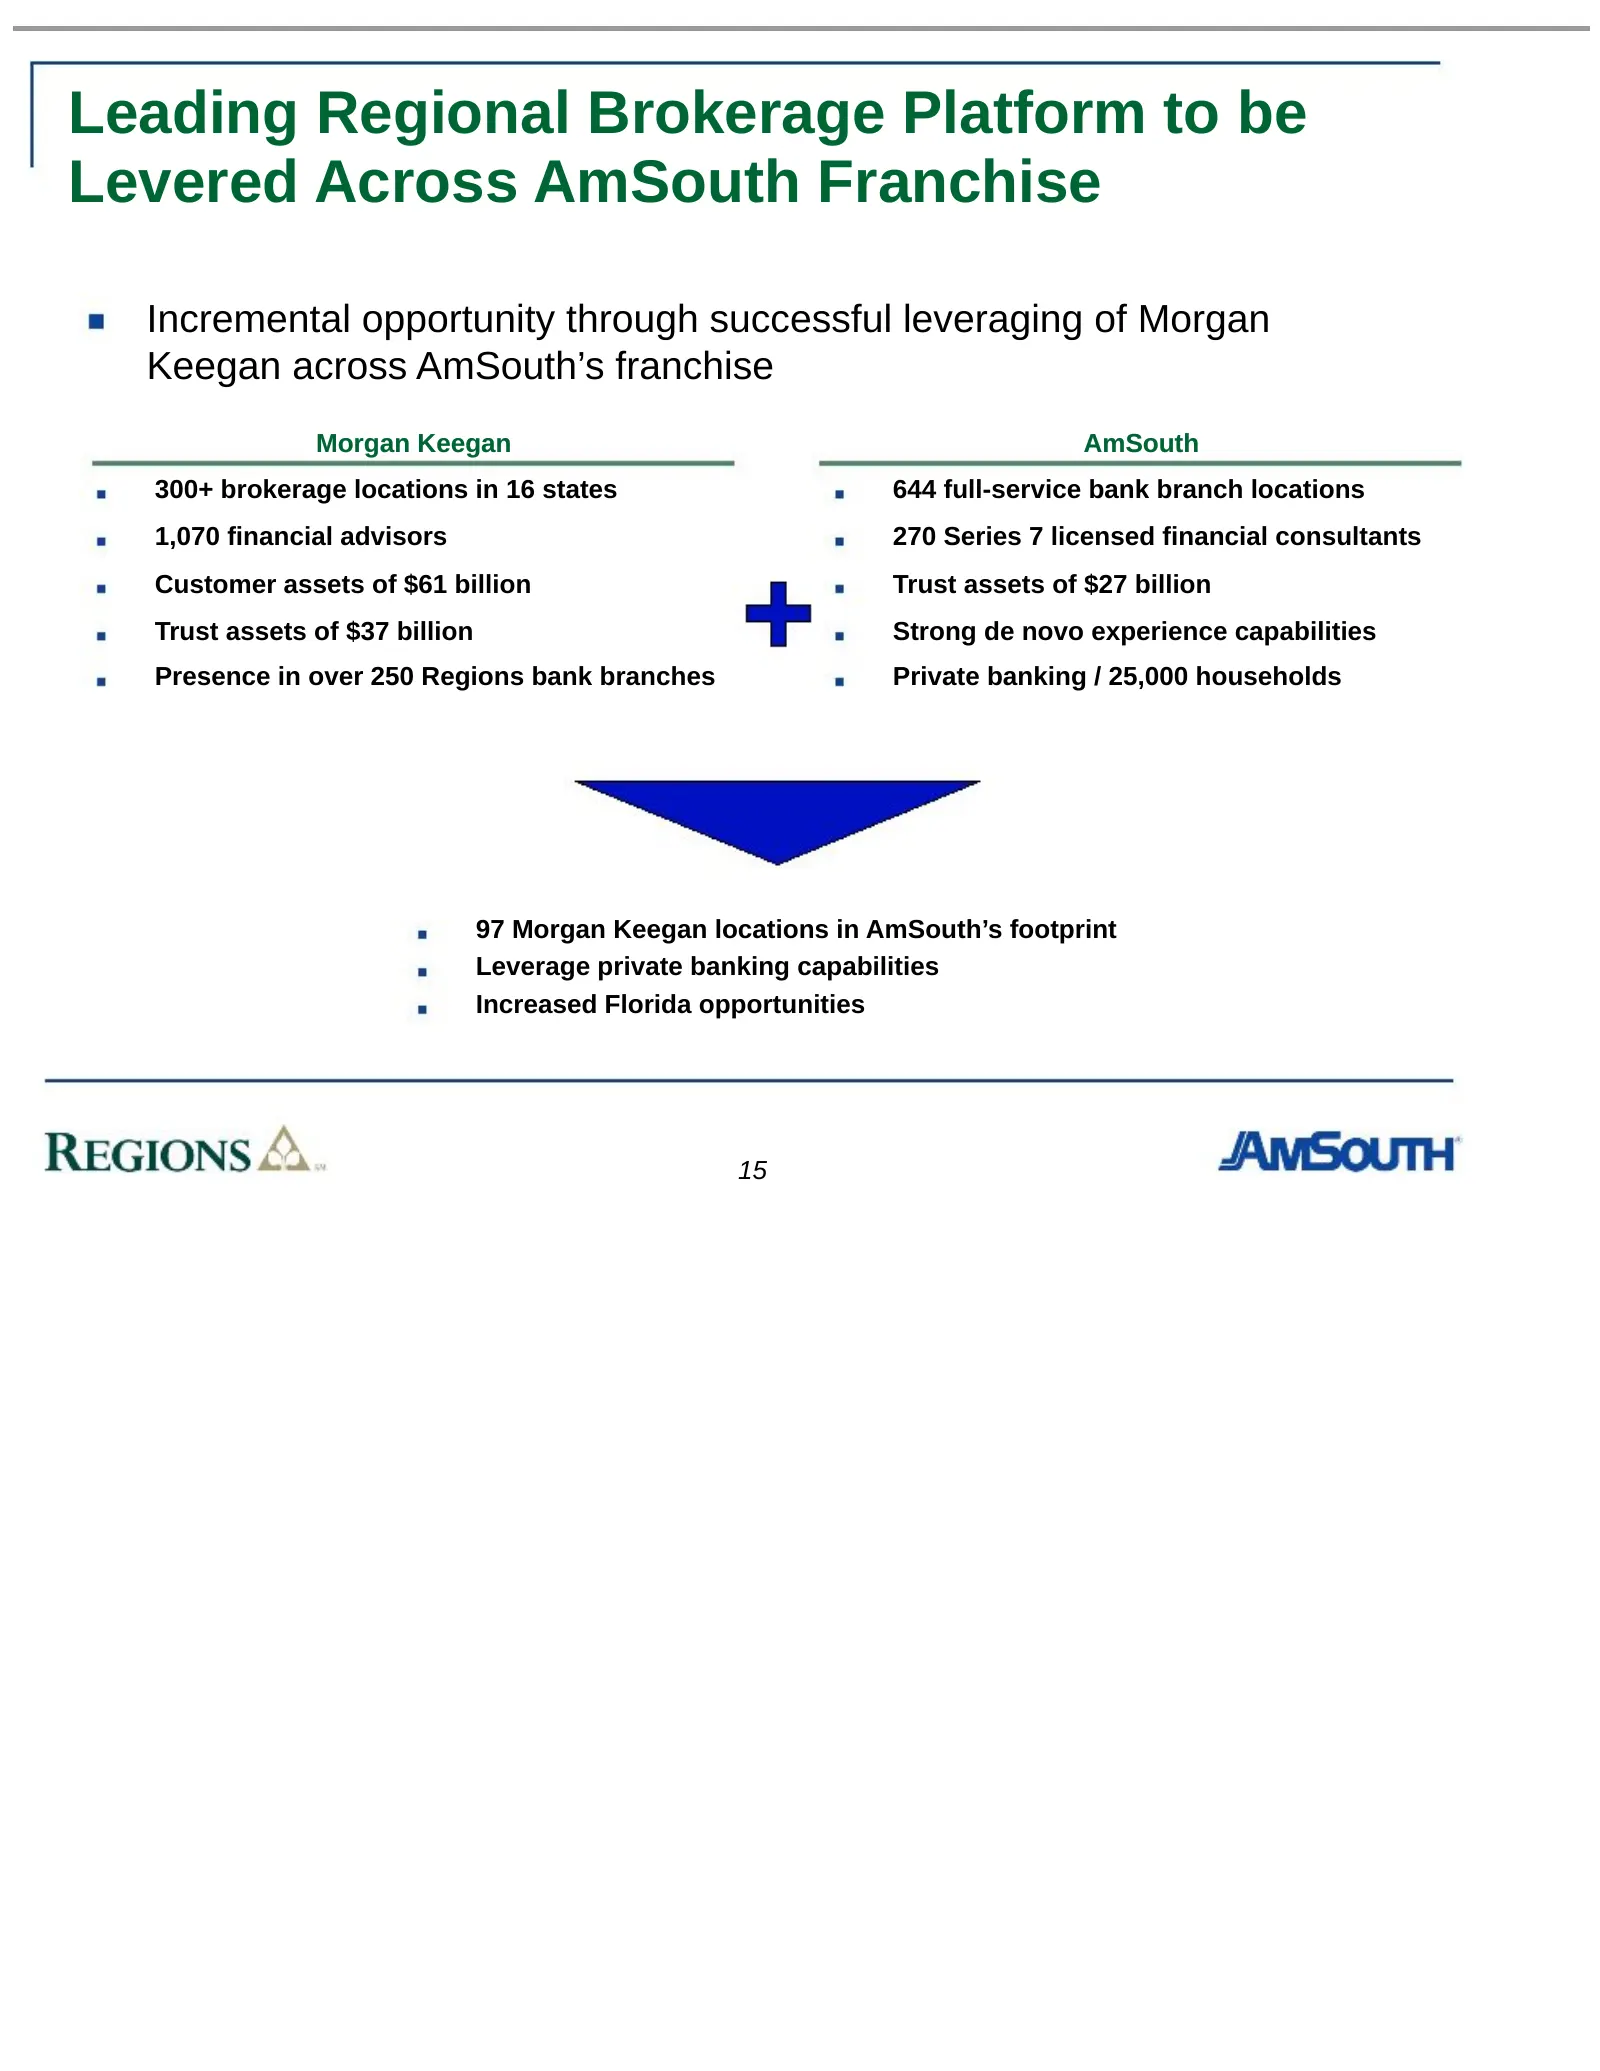
Leading Regional Brokerage Platform to be Levered Across AmSouth Franchise Incremental opportunity through successful leveraging of Morgan Keegan across AmSouth’s franchise Morgan Keegan AmSouth 300+ brokerage locations in 16 states 644 full-service bank branch locations 1,070 financial advisors 270
Slide 18: AmSouth's Successful De Novo Branching Track Record in Florida
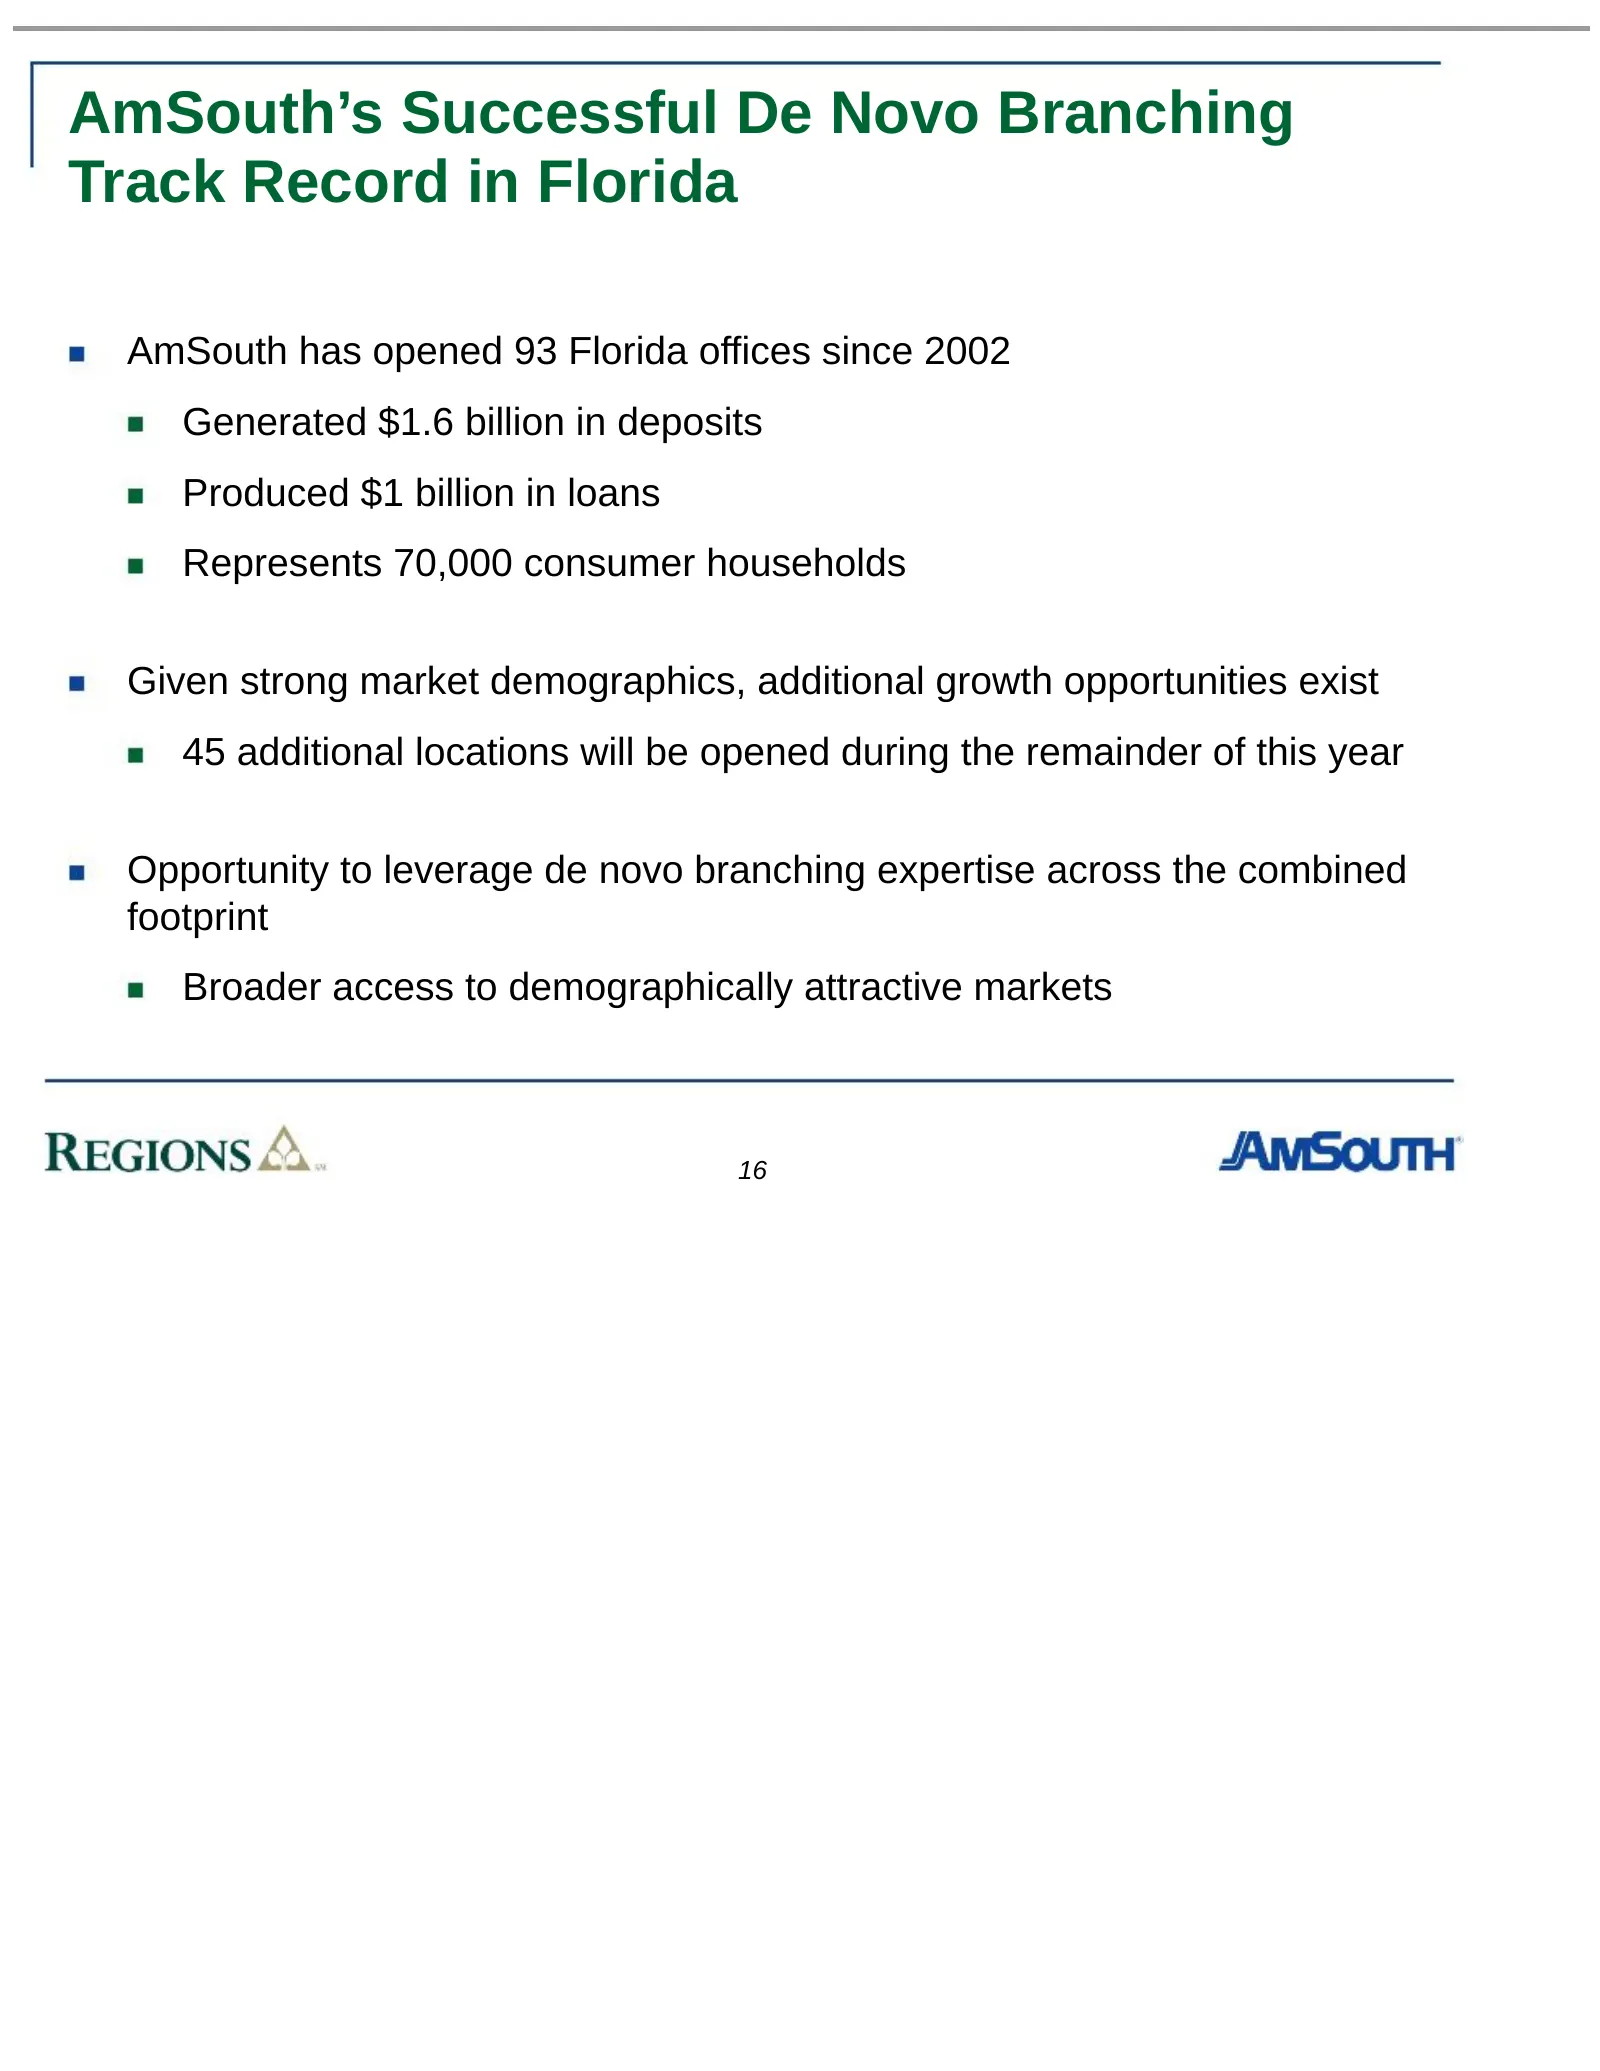
AmSouth’s Successful De Novo Branching Track Record in Florida AmSouth has opened 93 Florida offices since 2002 Generated $1.6 billion in deposits Produced $1 billion in loans Represents 70,000 consumer households Given strong market demographics, additional growth opportunities exist 45 additional
Slide 19: Enhanced Capital Generation and Efficiency
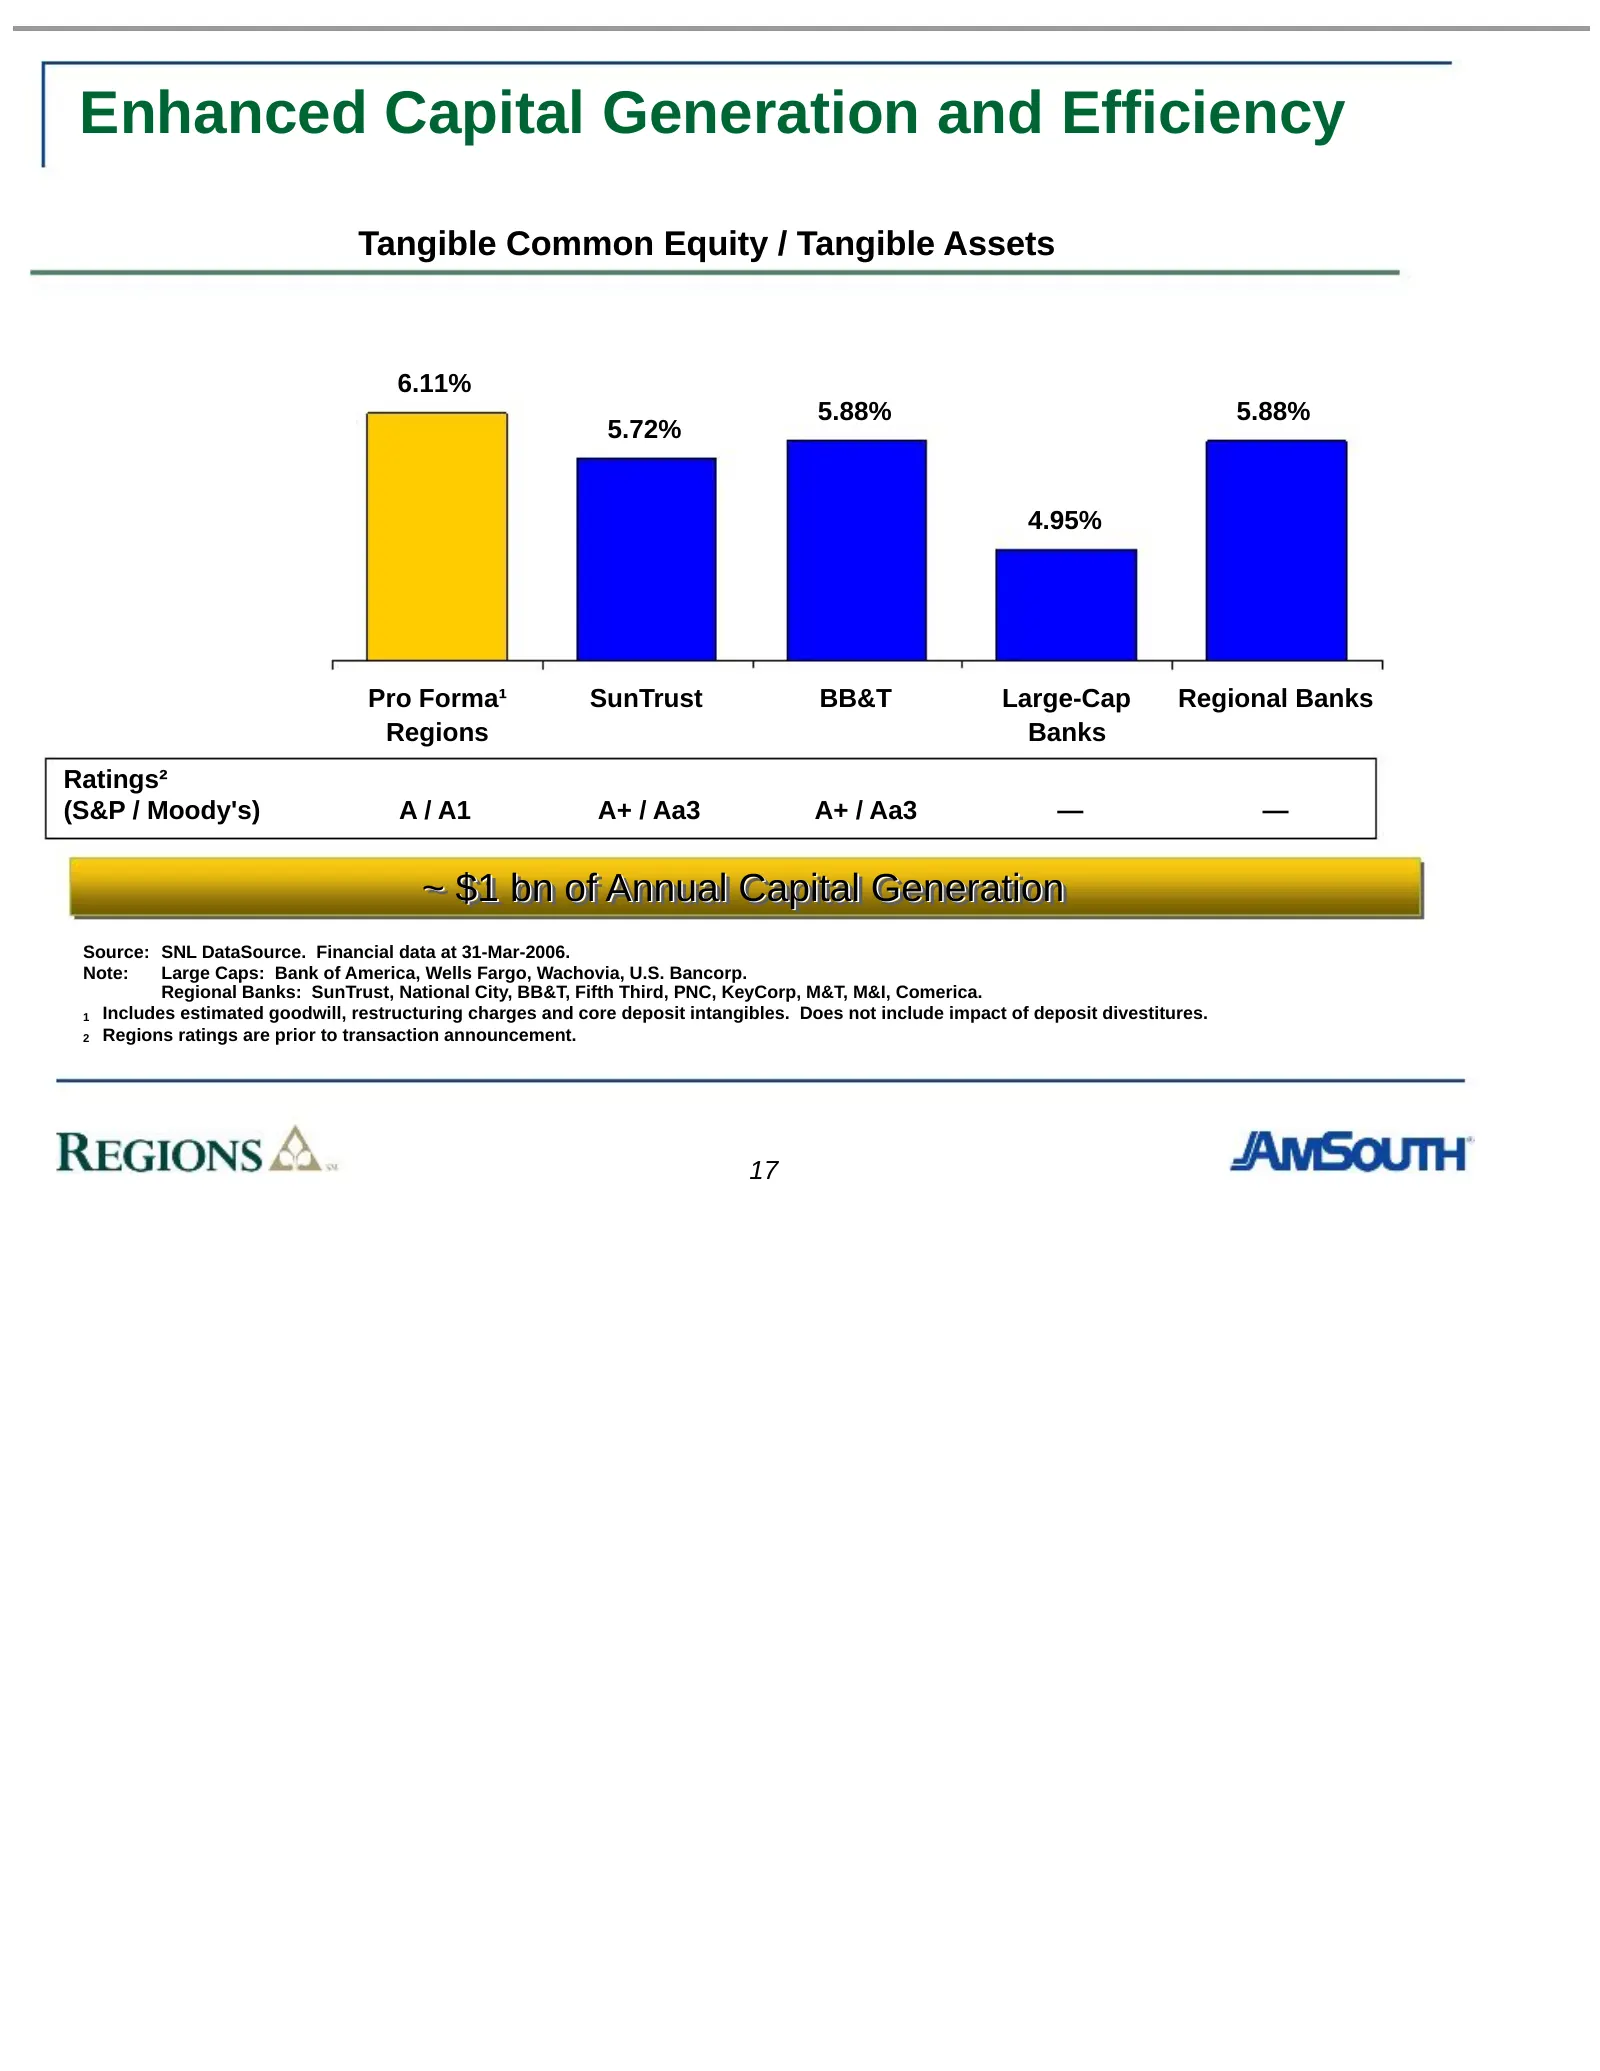
Enhanced Capital Generation and Efficiency Tangible Common Equity / Tangible Assets 6.11% 5.88% 5.88% 5.72% 4.95% Pro Forma¹ SunTrust BB&T Large-Cap Regional Banks Regions Banks Ratings² (S&P / Moody's) A / A1 A+ / Aa3 A+ / Aa3 — — ~~ $1 $1 bn bn of of Annual Annual Capital Capital Generation Genera
Slide 20: Pro Forma Financial Impact
Pro Forma Financial Impact 18
Slide 21: Transaction Assumptions
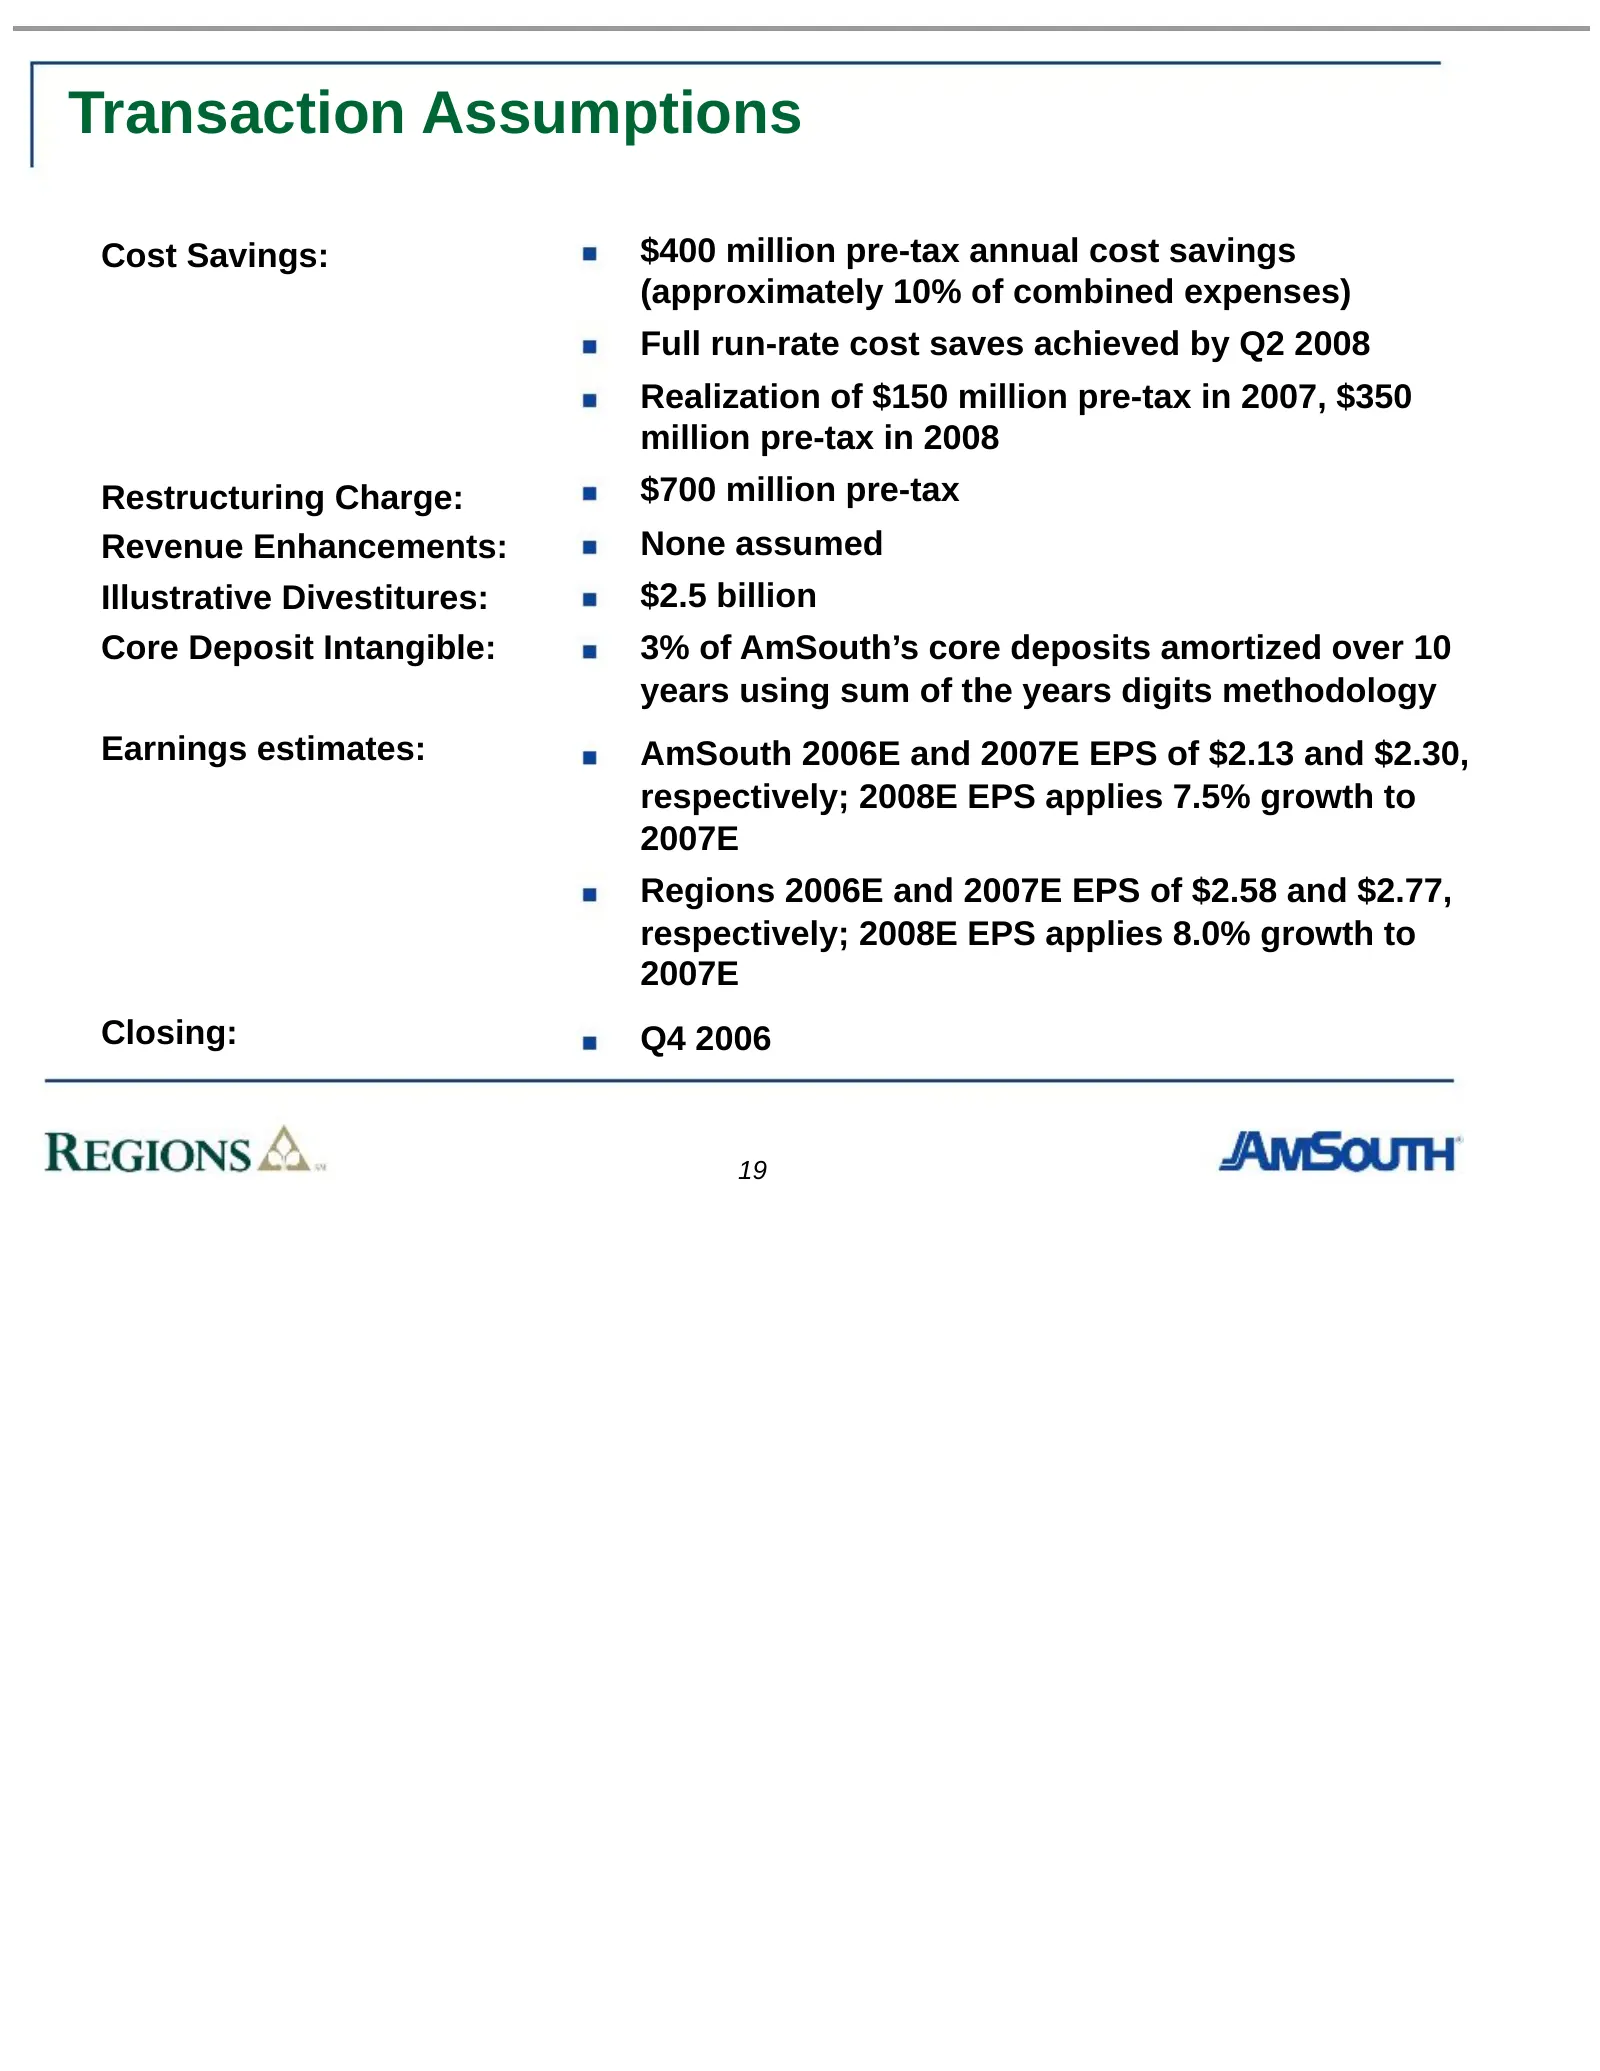
Transaction Assumptions Cost Savings: $400 million pre-tax annual cost savings (approximately 10% of combined expenses) Full run-rate cost saves achieved by Q2 2008 Realization of $150 million pre-tax in 2007, $350 million pre-tax in 2008 Restructuring Charge: $700 million pre-tax Revenue Enhancemen
Slide 22: Pro Forma Financial Results
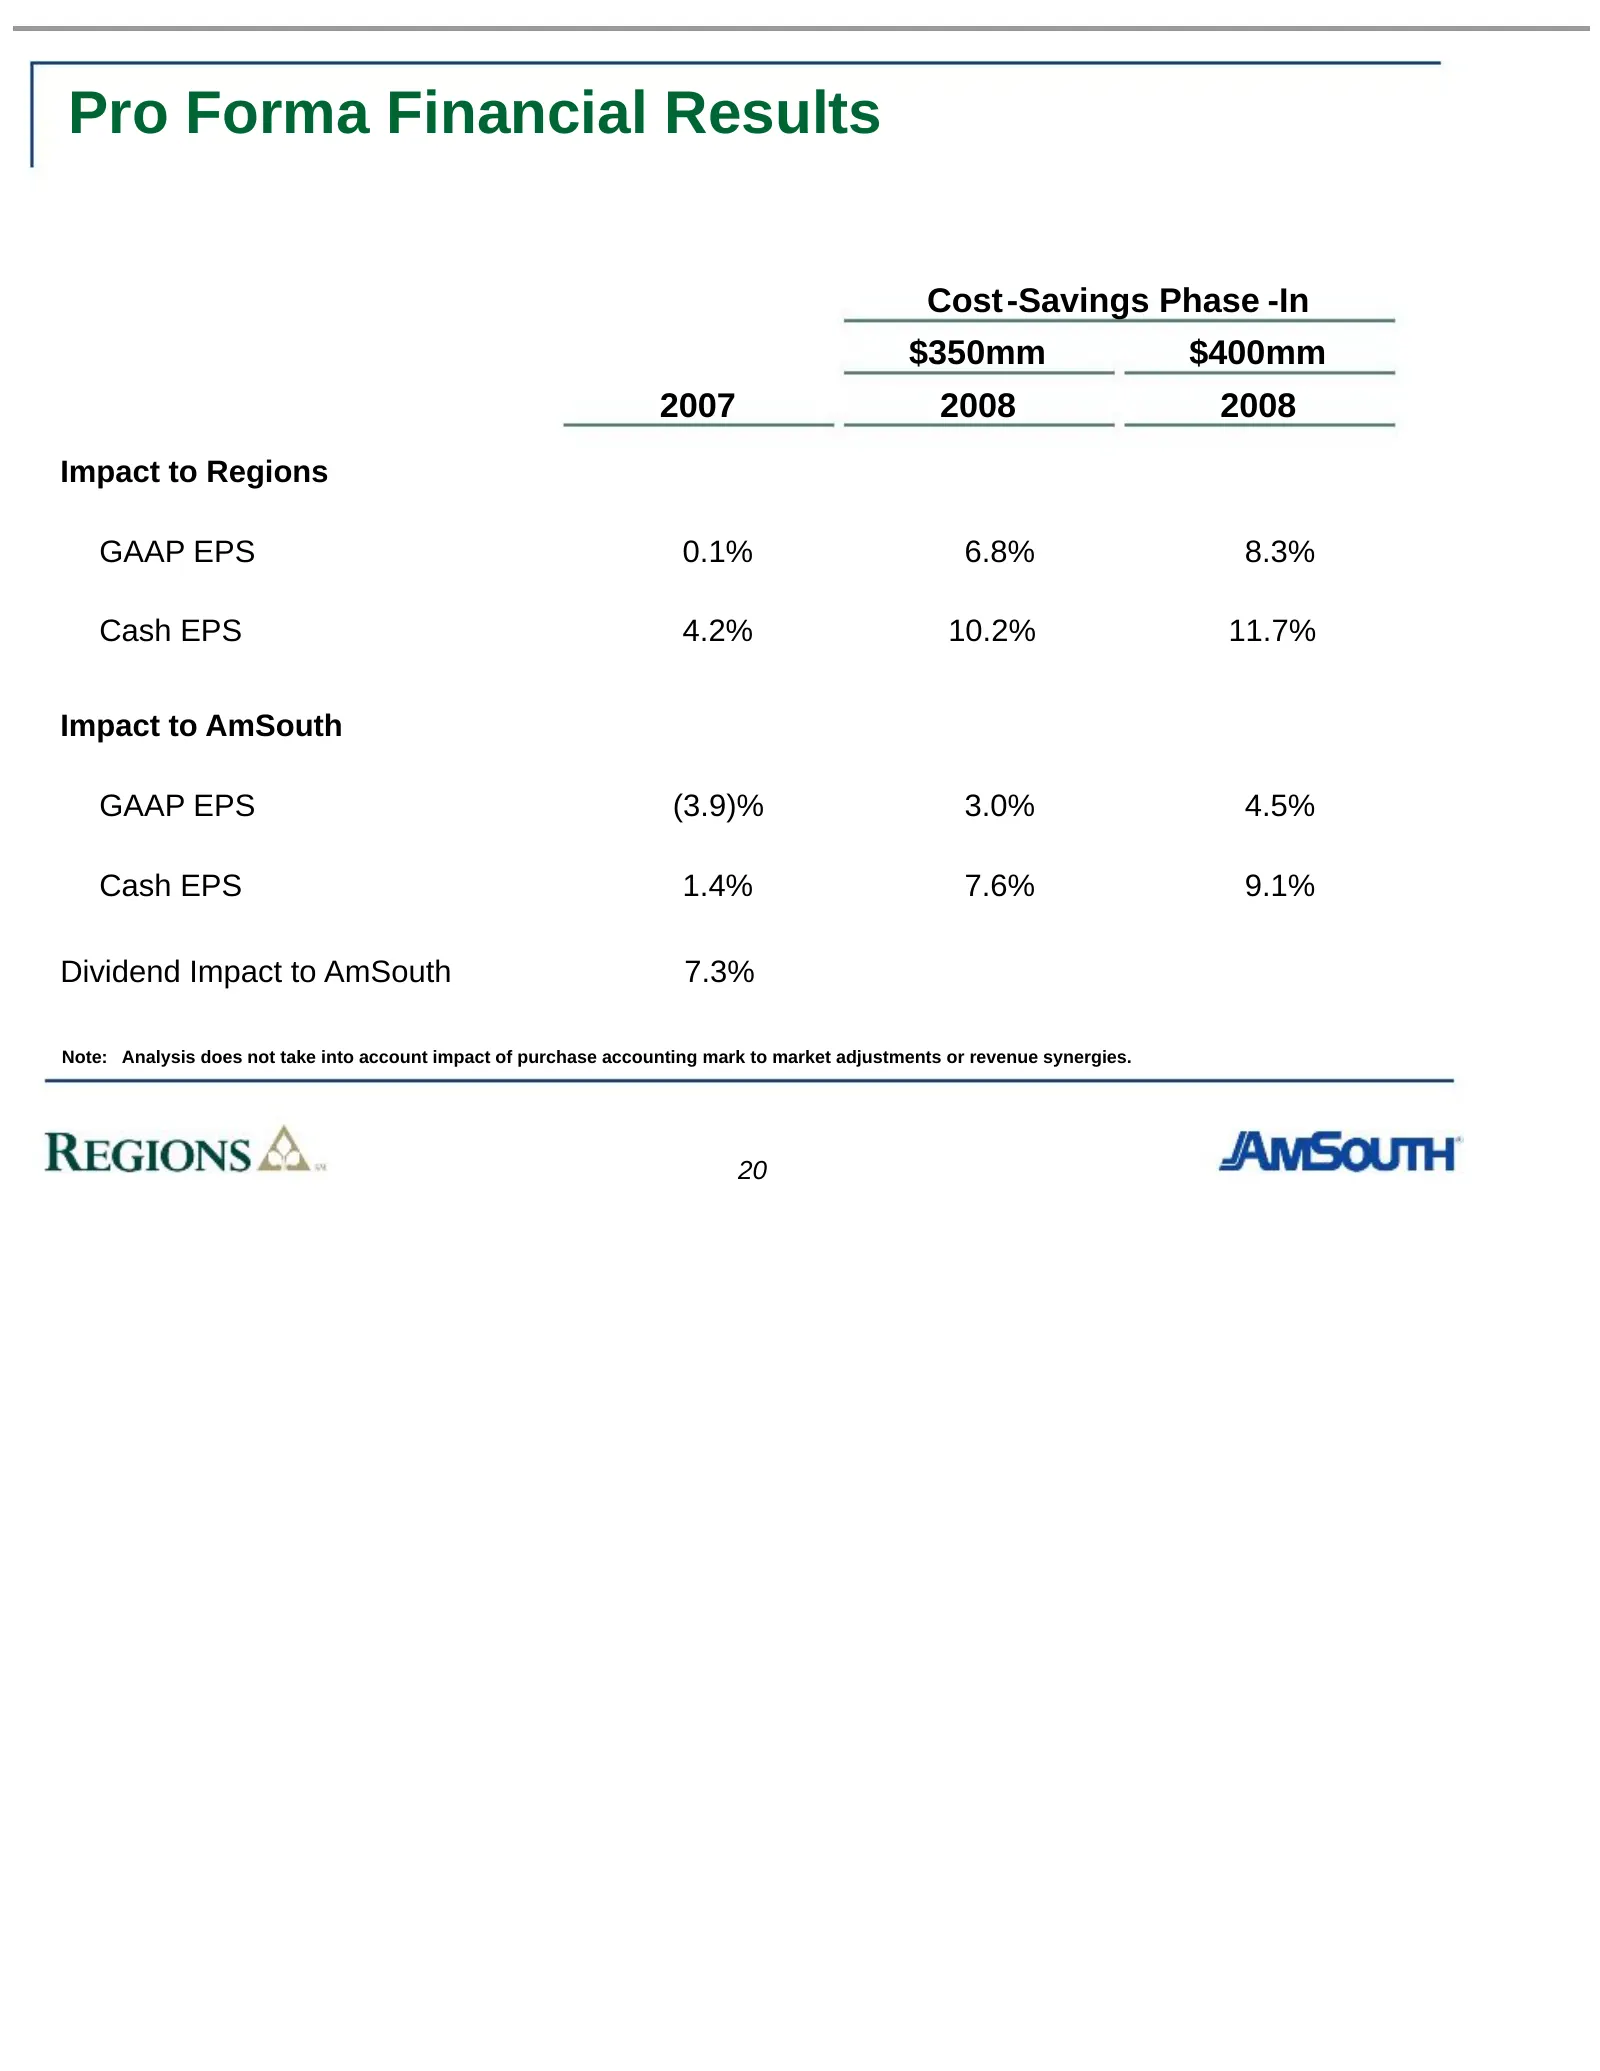
Pro Forma Financial Results Cost -Savings Phase -In $350mm $400mm 2007 2008 2008 Impact to Regions GAAP EPS 0.1% 6.8% 8.3% Cash EPS 4.2% 10.2% 11.7% Impact to AmSouth GAAP EPS (3.9)% 3.0% 4.5% Cash EPS 1.4% 7.6% 9.1% Dividend Impact to AmSouth 7.3% Note: Analysis does not take into account impact of
Slide 23: Substantial Synergies with Low Integration Risk
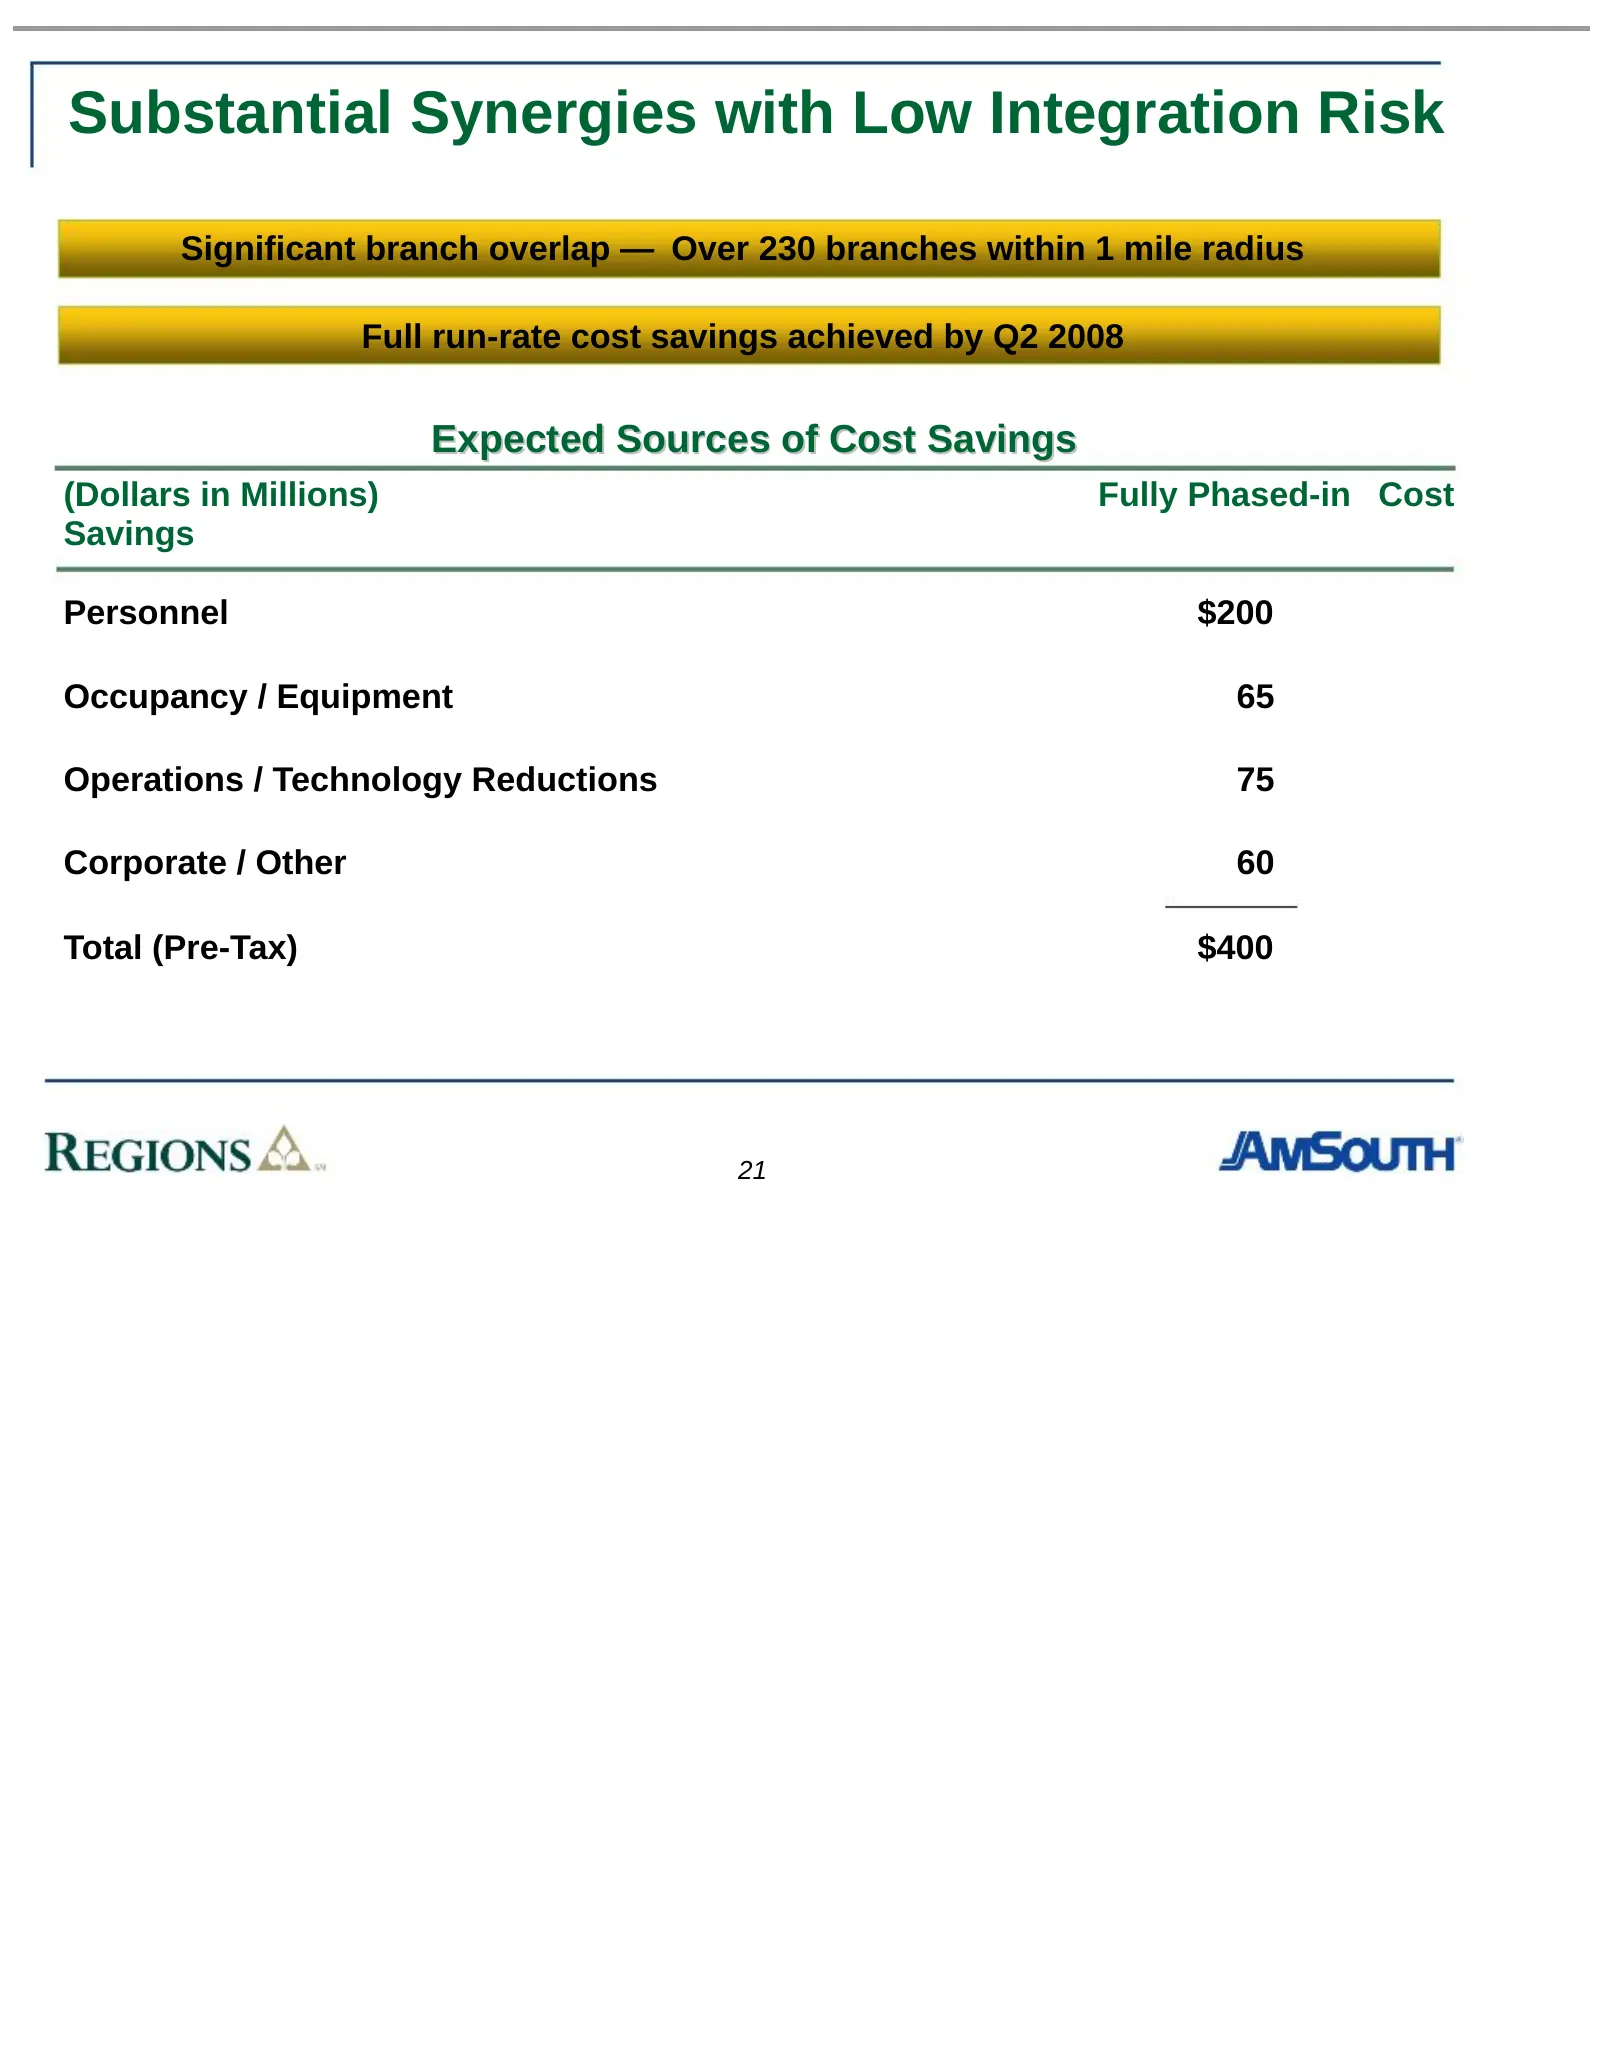
Substantial Synergies with Low Integration Risk Significant branch overlap — Over 230 branches within 1 mile radius Full run-rate cost savings achieved by Q2 2008 Expected Sources of Cost Savings (Dollars in Millions) Fully Phased-in Cost Savings Personnel $200 Occupancy / Equipment 65 Operations /
Slide 24: Cost Savings Value Creation for Shareholders
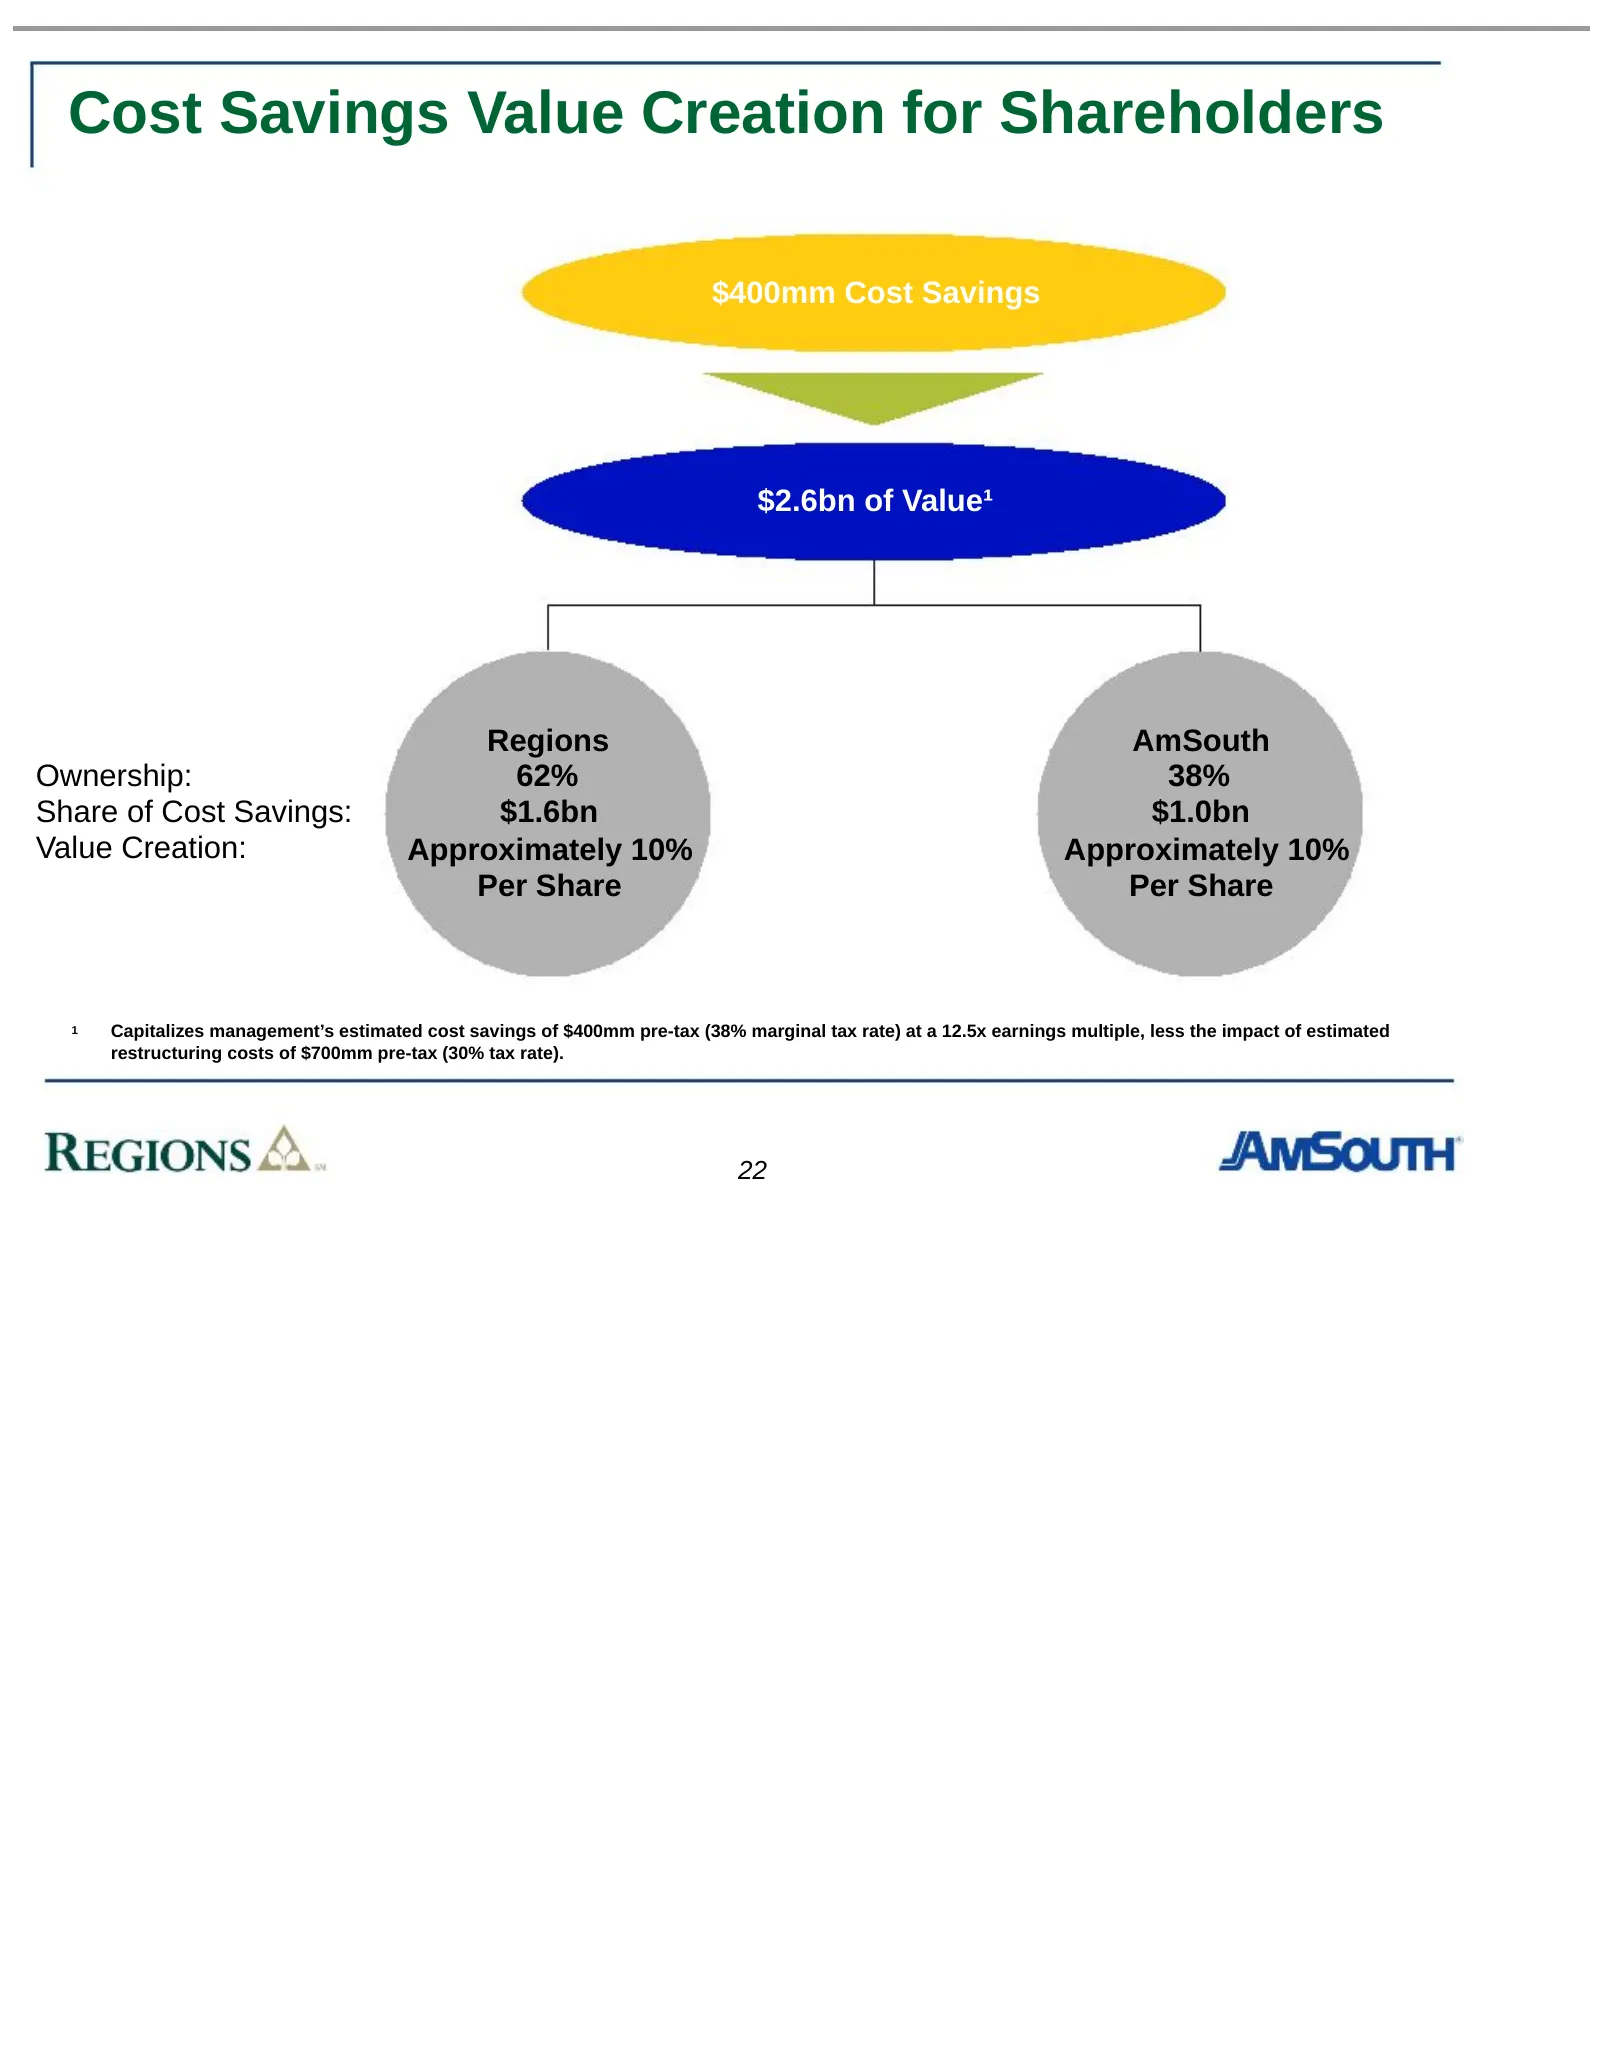
Cost Savings Value Creation for Shareholders $400mm Cost Savings $2.6bn of Value¹ Regions AmSouth Ownership: 62% 38% Share of Cost Savings: $1.6bn $1.0bn Value Creation: Approximately 10% Approximately 10% Per Share Per Share 1 Capitalizes management’s estimated cost savings of $400mm pre-tax (38% m
Slide 25: Deliberate, Disciplined Approach to Combining Financial Models
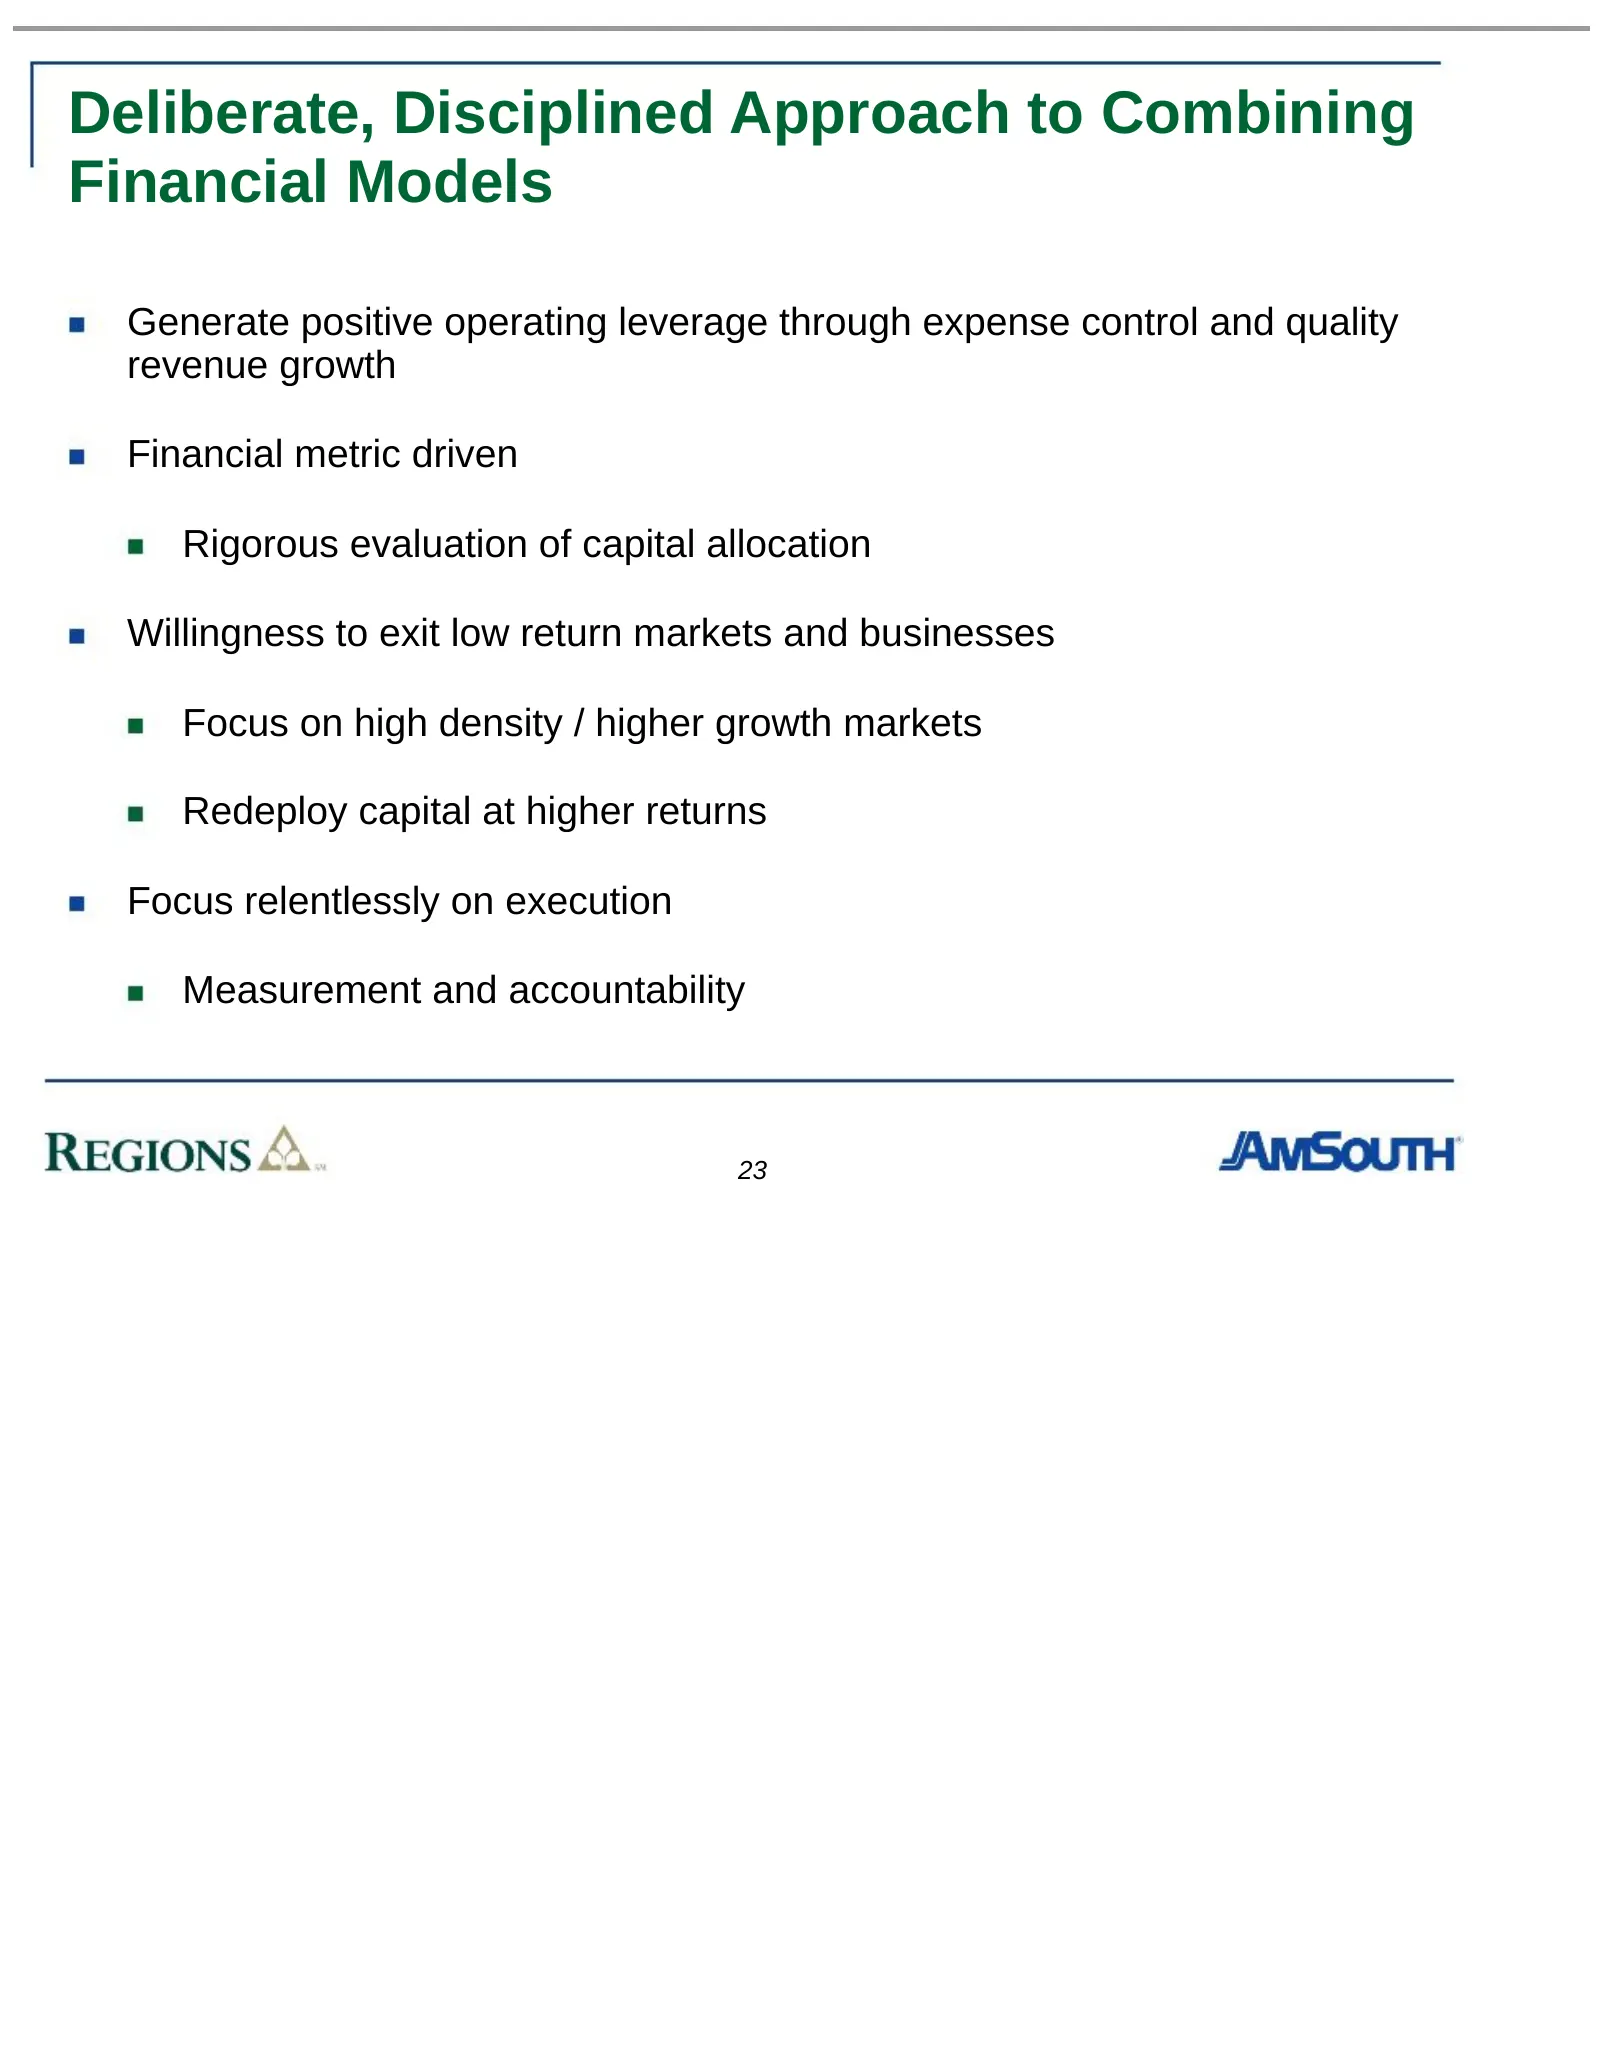
Deliberate, Disciplined Approach to Combining Financial Models Generate positive operating leverage through expense control and quality revenue growth Financial metric driven Rigorous evaluation of capital allocation Willingness to exit low return markets and businesses Focus on high density / highe
Slide 26: Transaction Rationale – The Power of the Combination
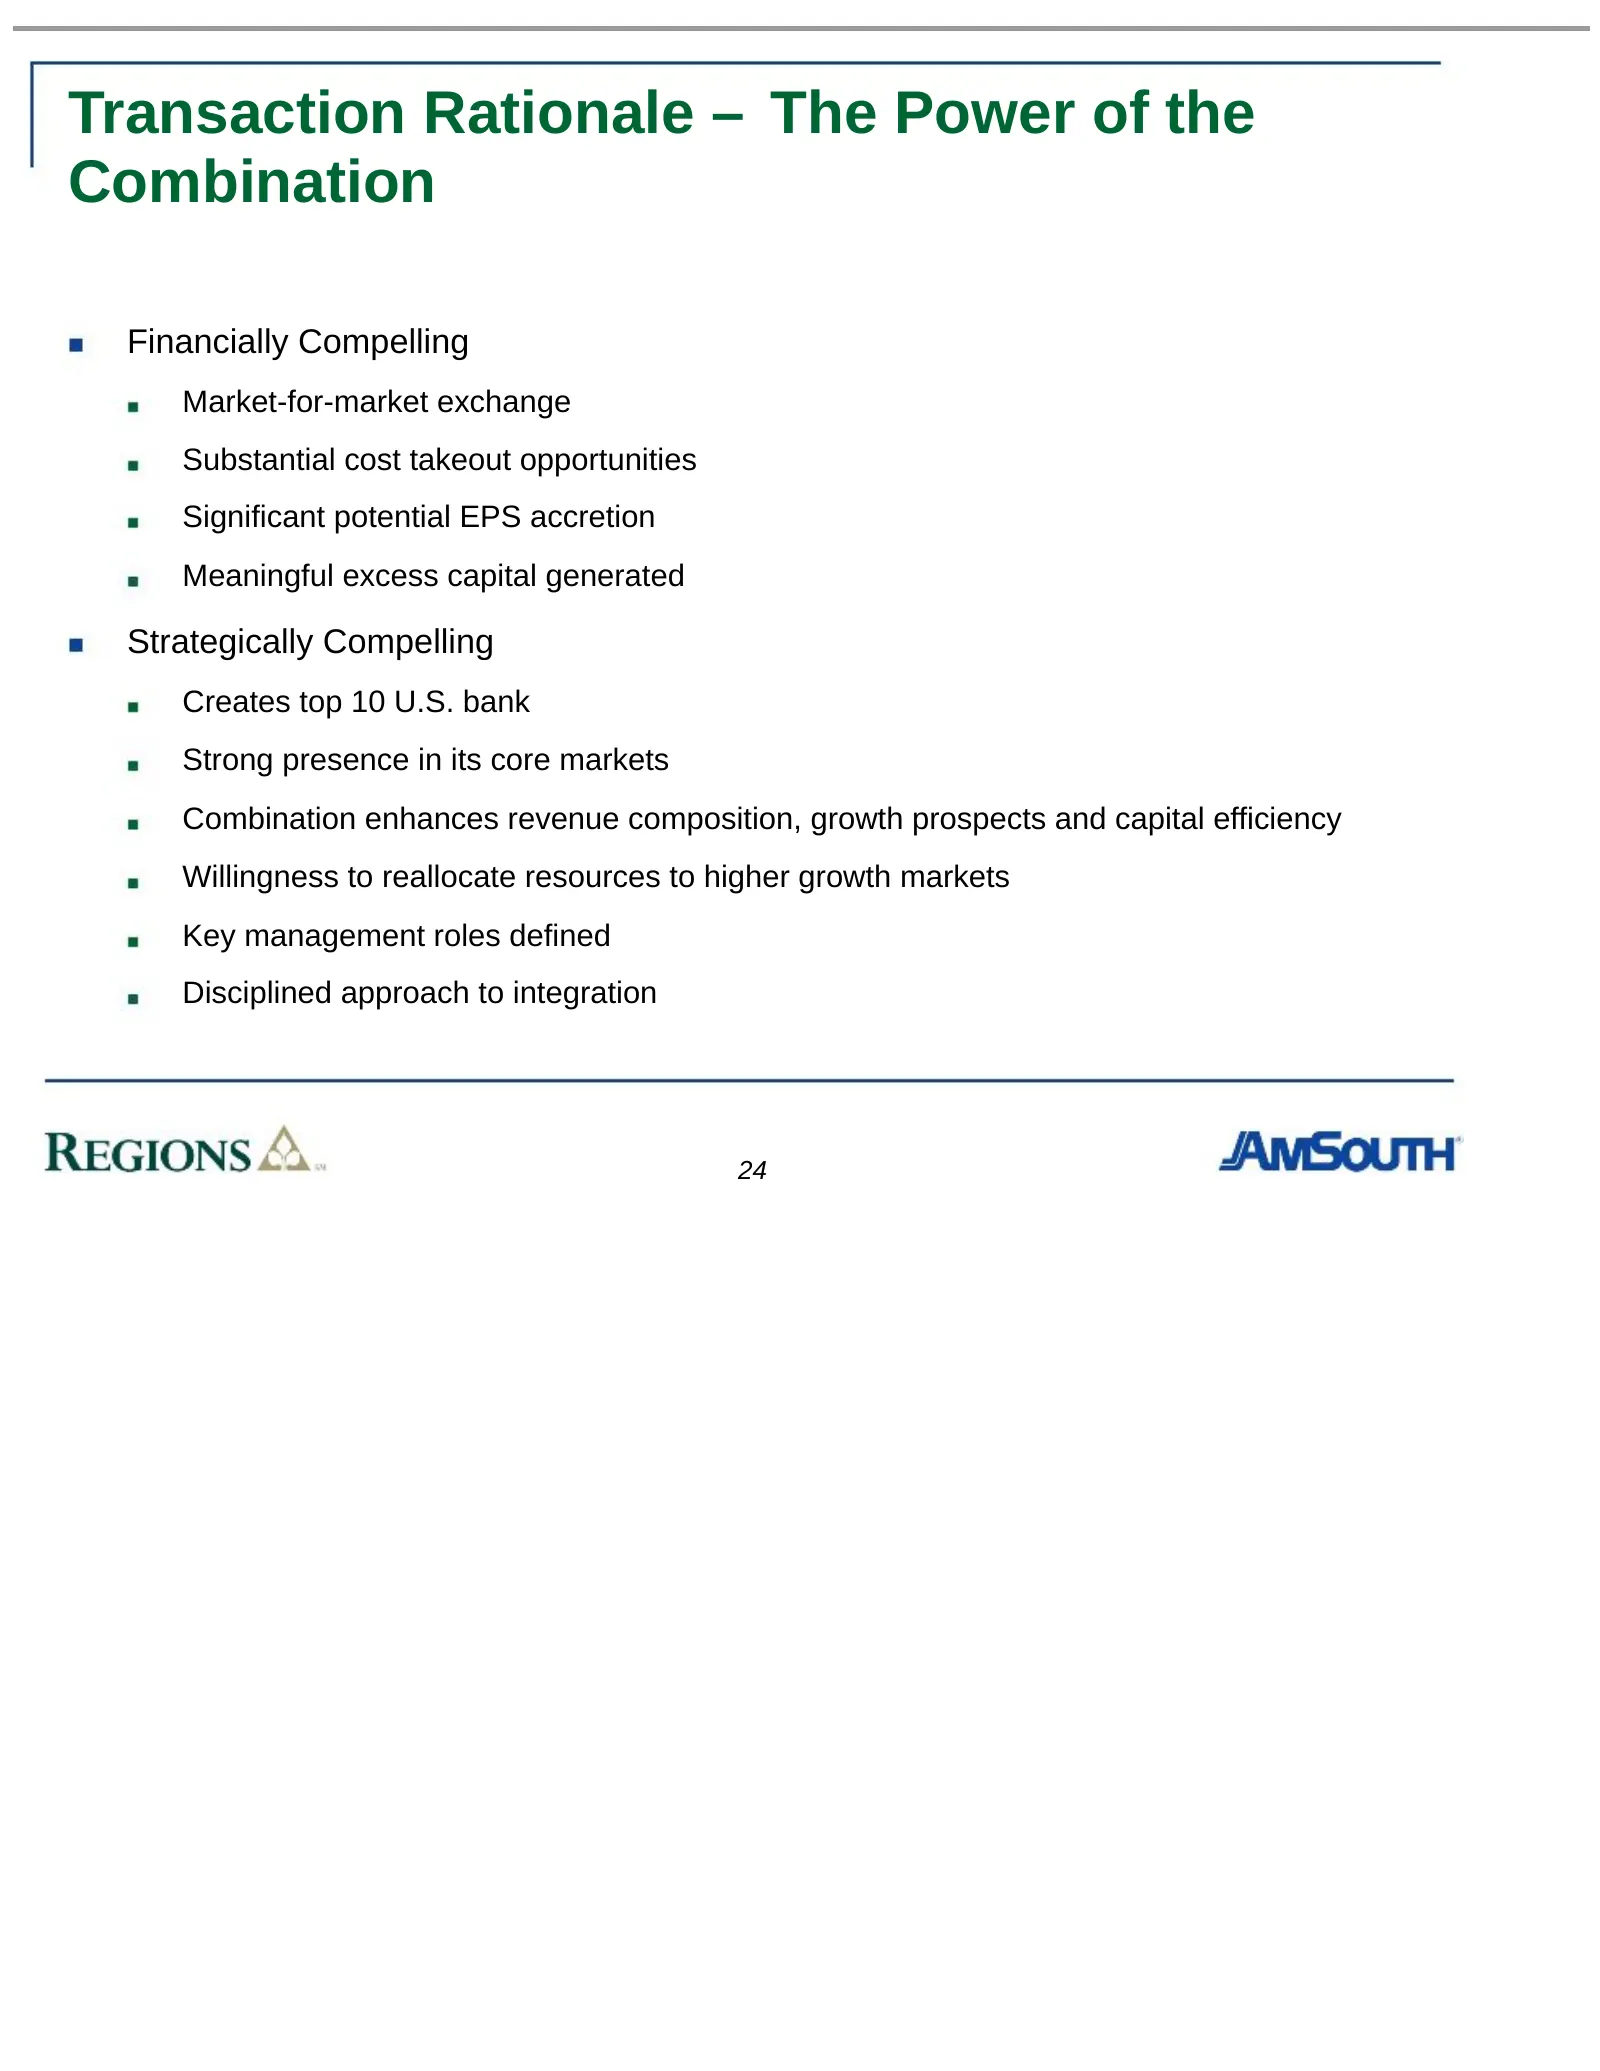
Transaction Rationale – The Power of the Combination Financially Compelling Market-for-market exchange Substantial cost takeout opportunities Significant potential EPS accretion Meaningful excess capital generated Strategically Compelling Creates top 10 U.S. bank Strong presence in its core markets
Slide 27: Appendix
Appendix REGIONS 2. 0s
Slide 28: Combined Balance Sheet
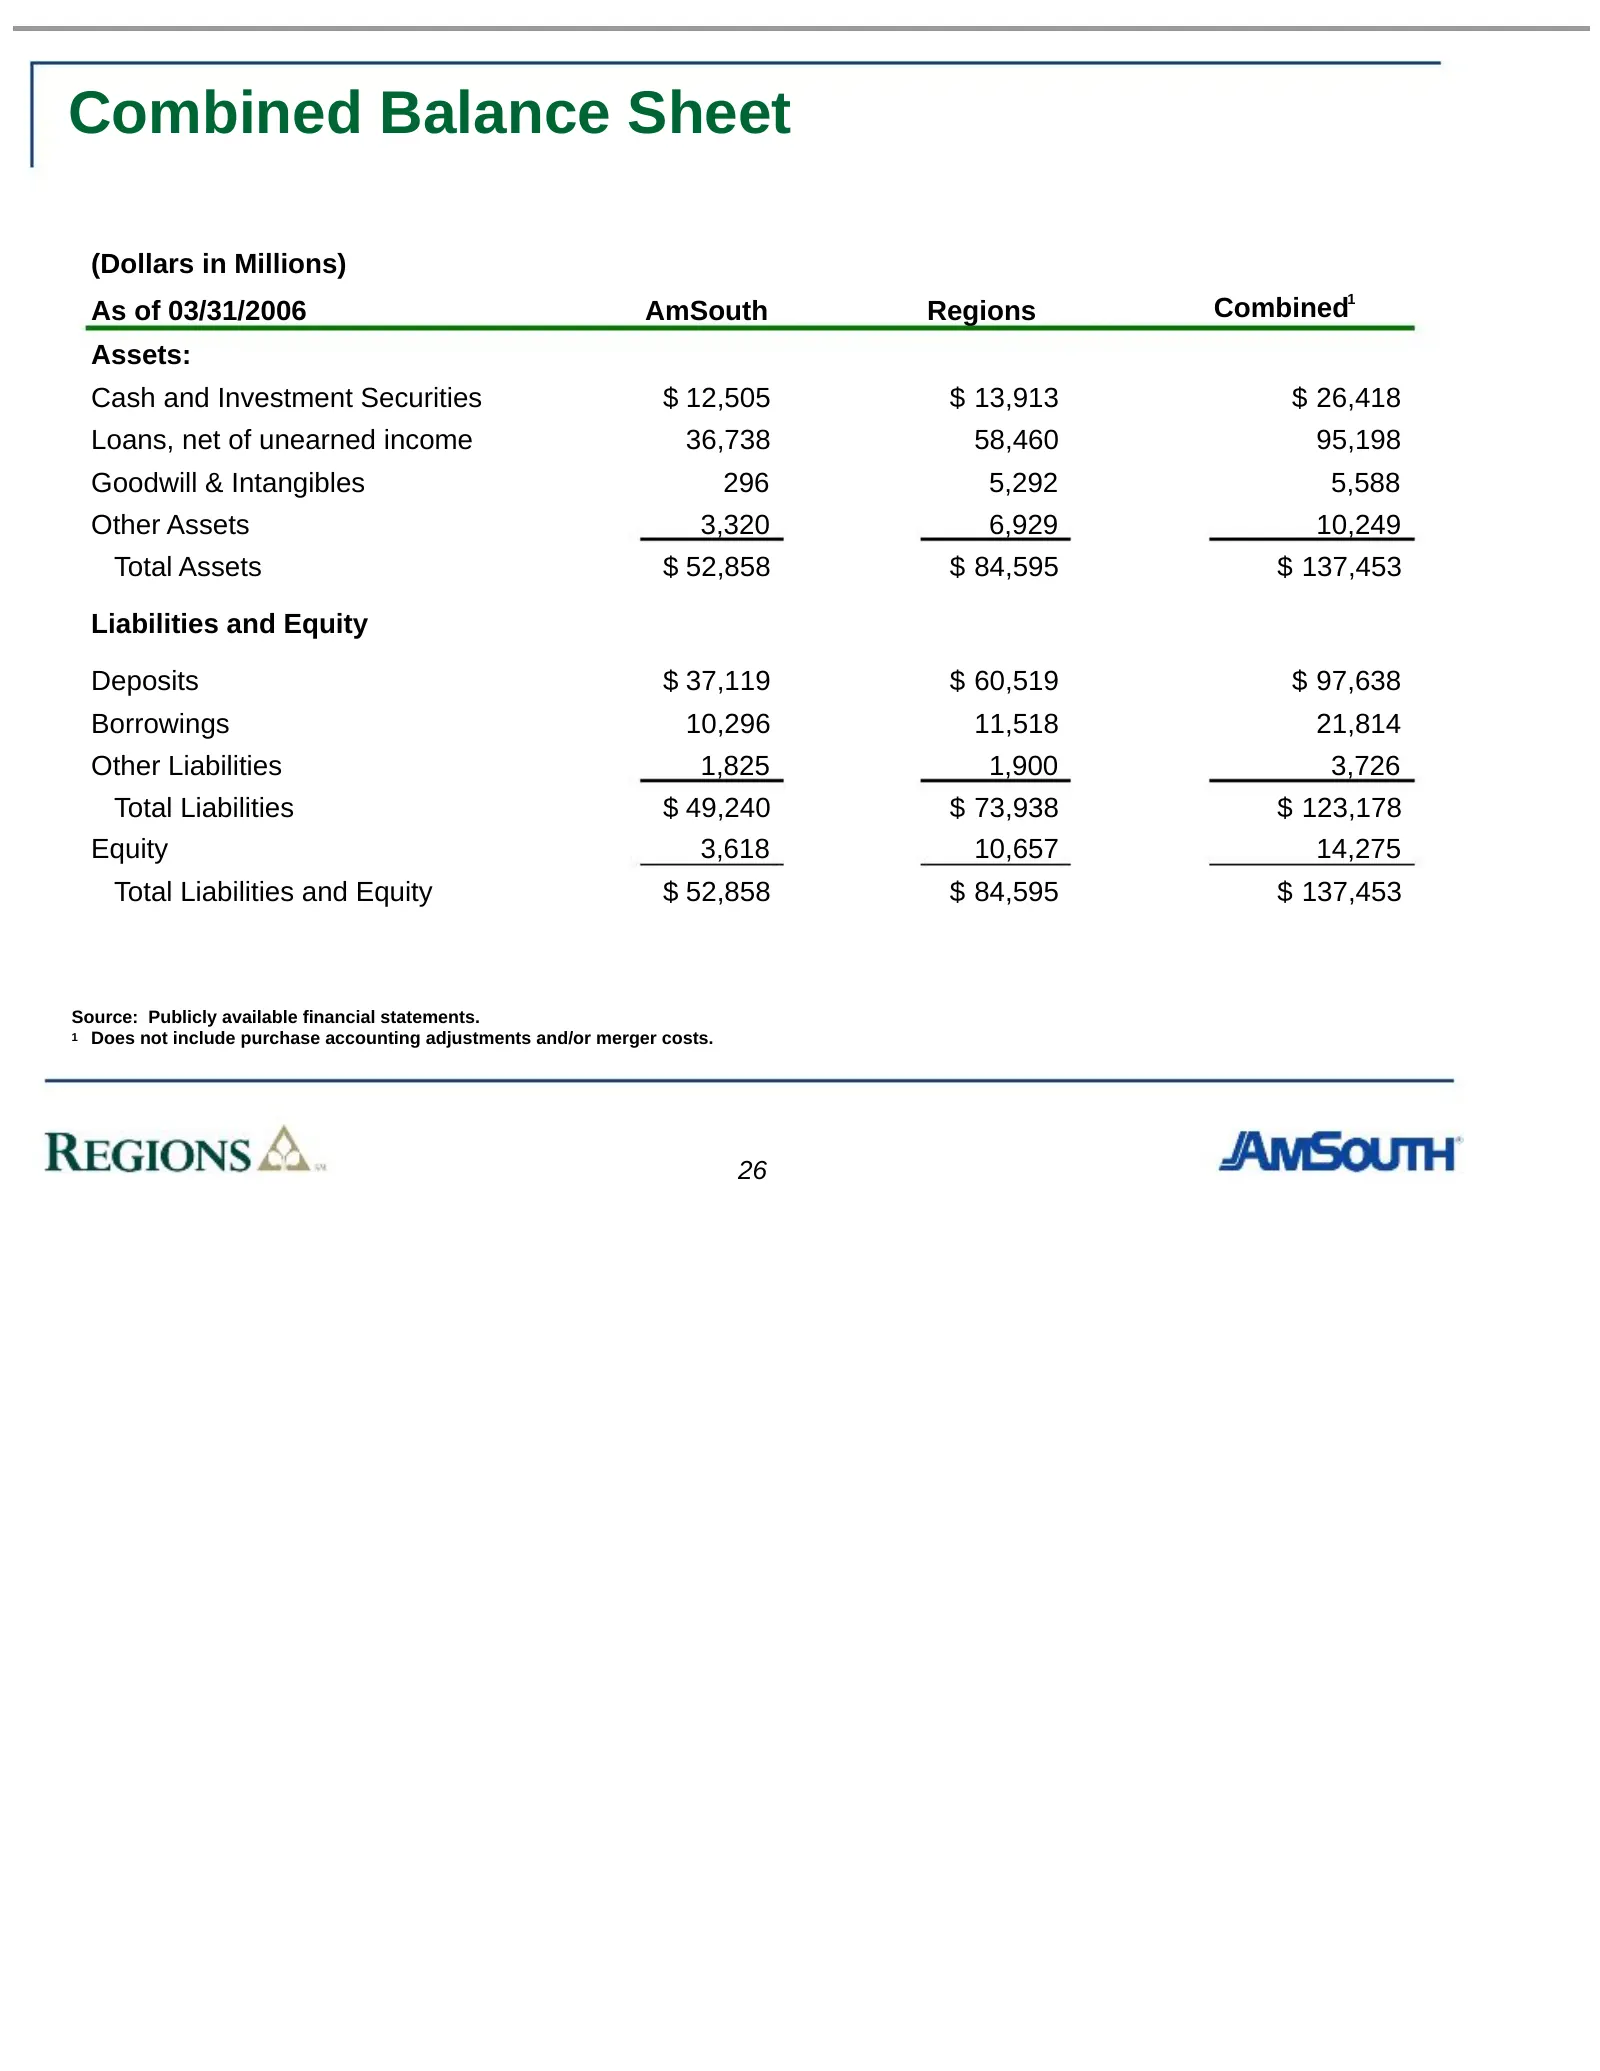
Combined Balance Sheet (Dollars in Millions) As of 03/31/2006 AmSouth Regions Combined1 Assets: Cash and Investment Securities $ 12,505 $ 13,913 $ 26,418 Loans, net of unearned income 36,738 58,460 95,198 Goodwill & Intangibles 296 5,292 5,588 Other Assets 3,320 6,929 10,249 Total Assets $ 52,858 $
Slide 29: Loan Composition
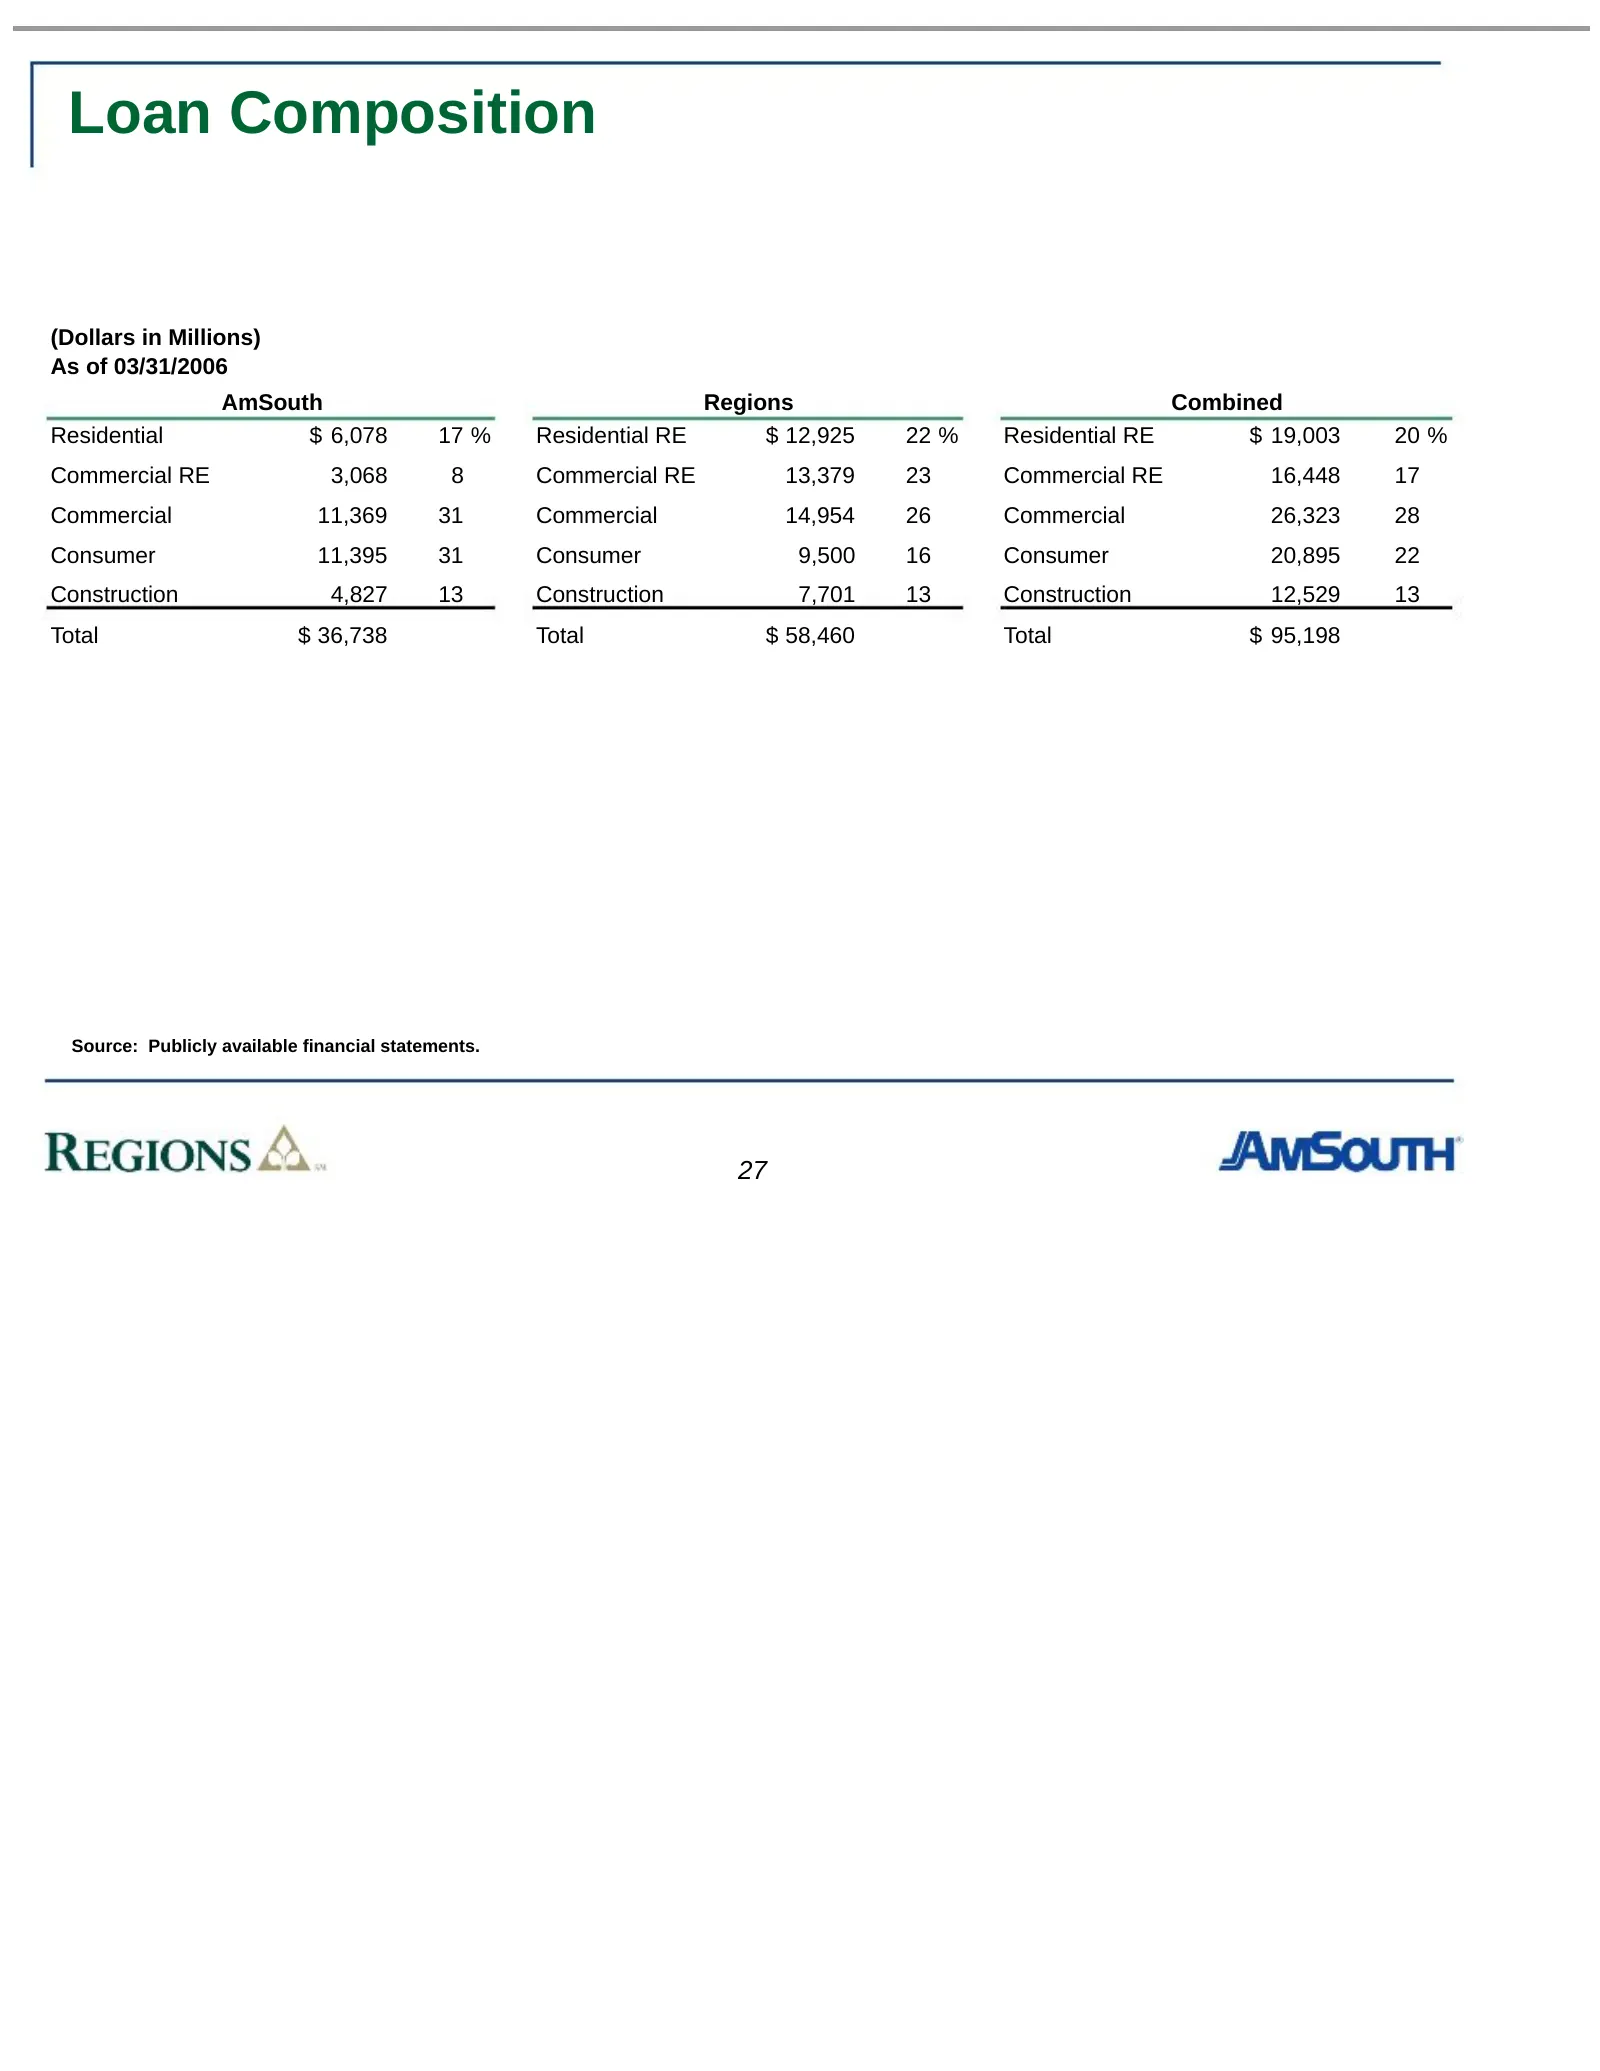
Loan Composition (Dollars in Millions) As of 03/31/2006 AmSouth Regions Combined Residential $ 6,078 17 % Residential RE $ 12,925 22 % Residential RE $ 19,003 20 % Commercial RE 3,068 8 Commercial RE 13,379 23 Commercial RE 16,448 17 Commercial 11,369 31 Commercial 14,954 26 Commercial 26,323 28 Con
Slide 30: Strengthened Balance Sheet / Diversified Portfolio Improves Credit Risk Profile
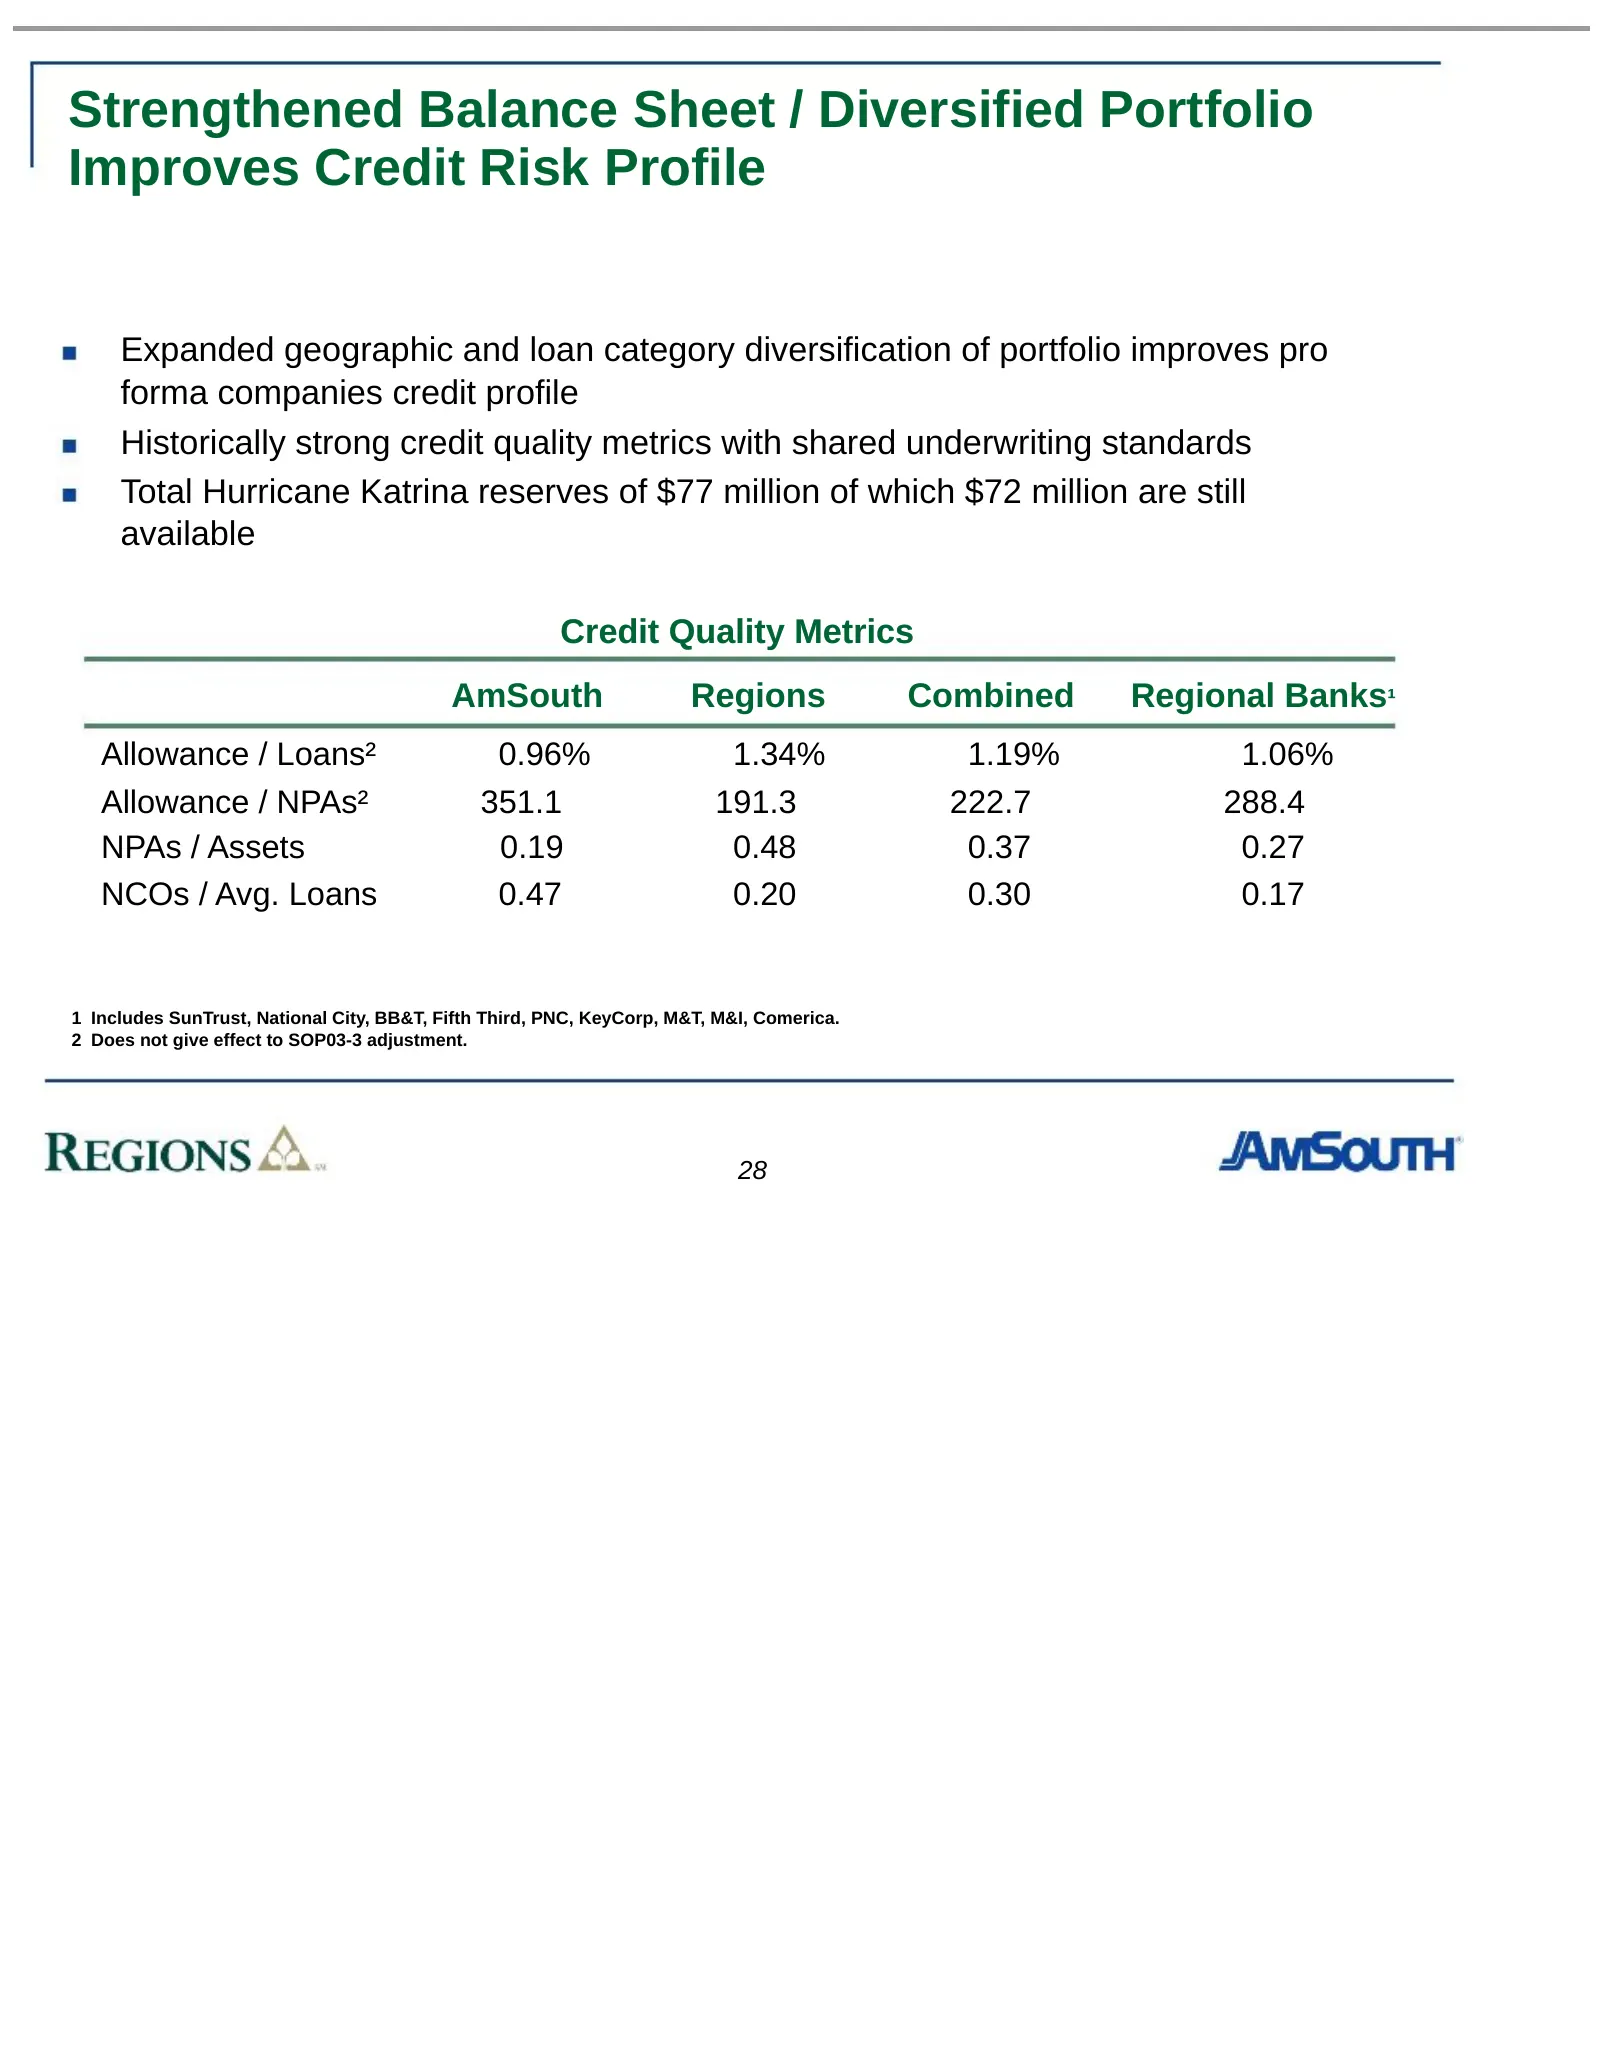
Strengthened Balance Sheet / Diversified Portfolio Improves Credit Risk Profile Expanded geographic and loan category diversification of portfolio improves pro forma companies credit profile Historically strong credit quality metrics with shared underwriting standards Total Hurricane Katrina reserve
Slide 31: Deposit Composition
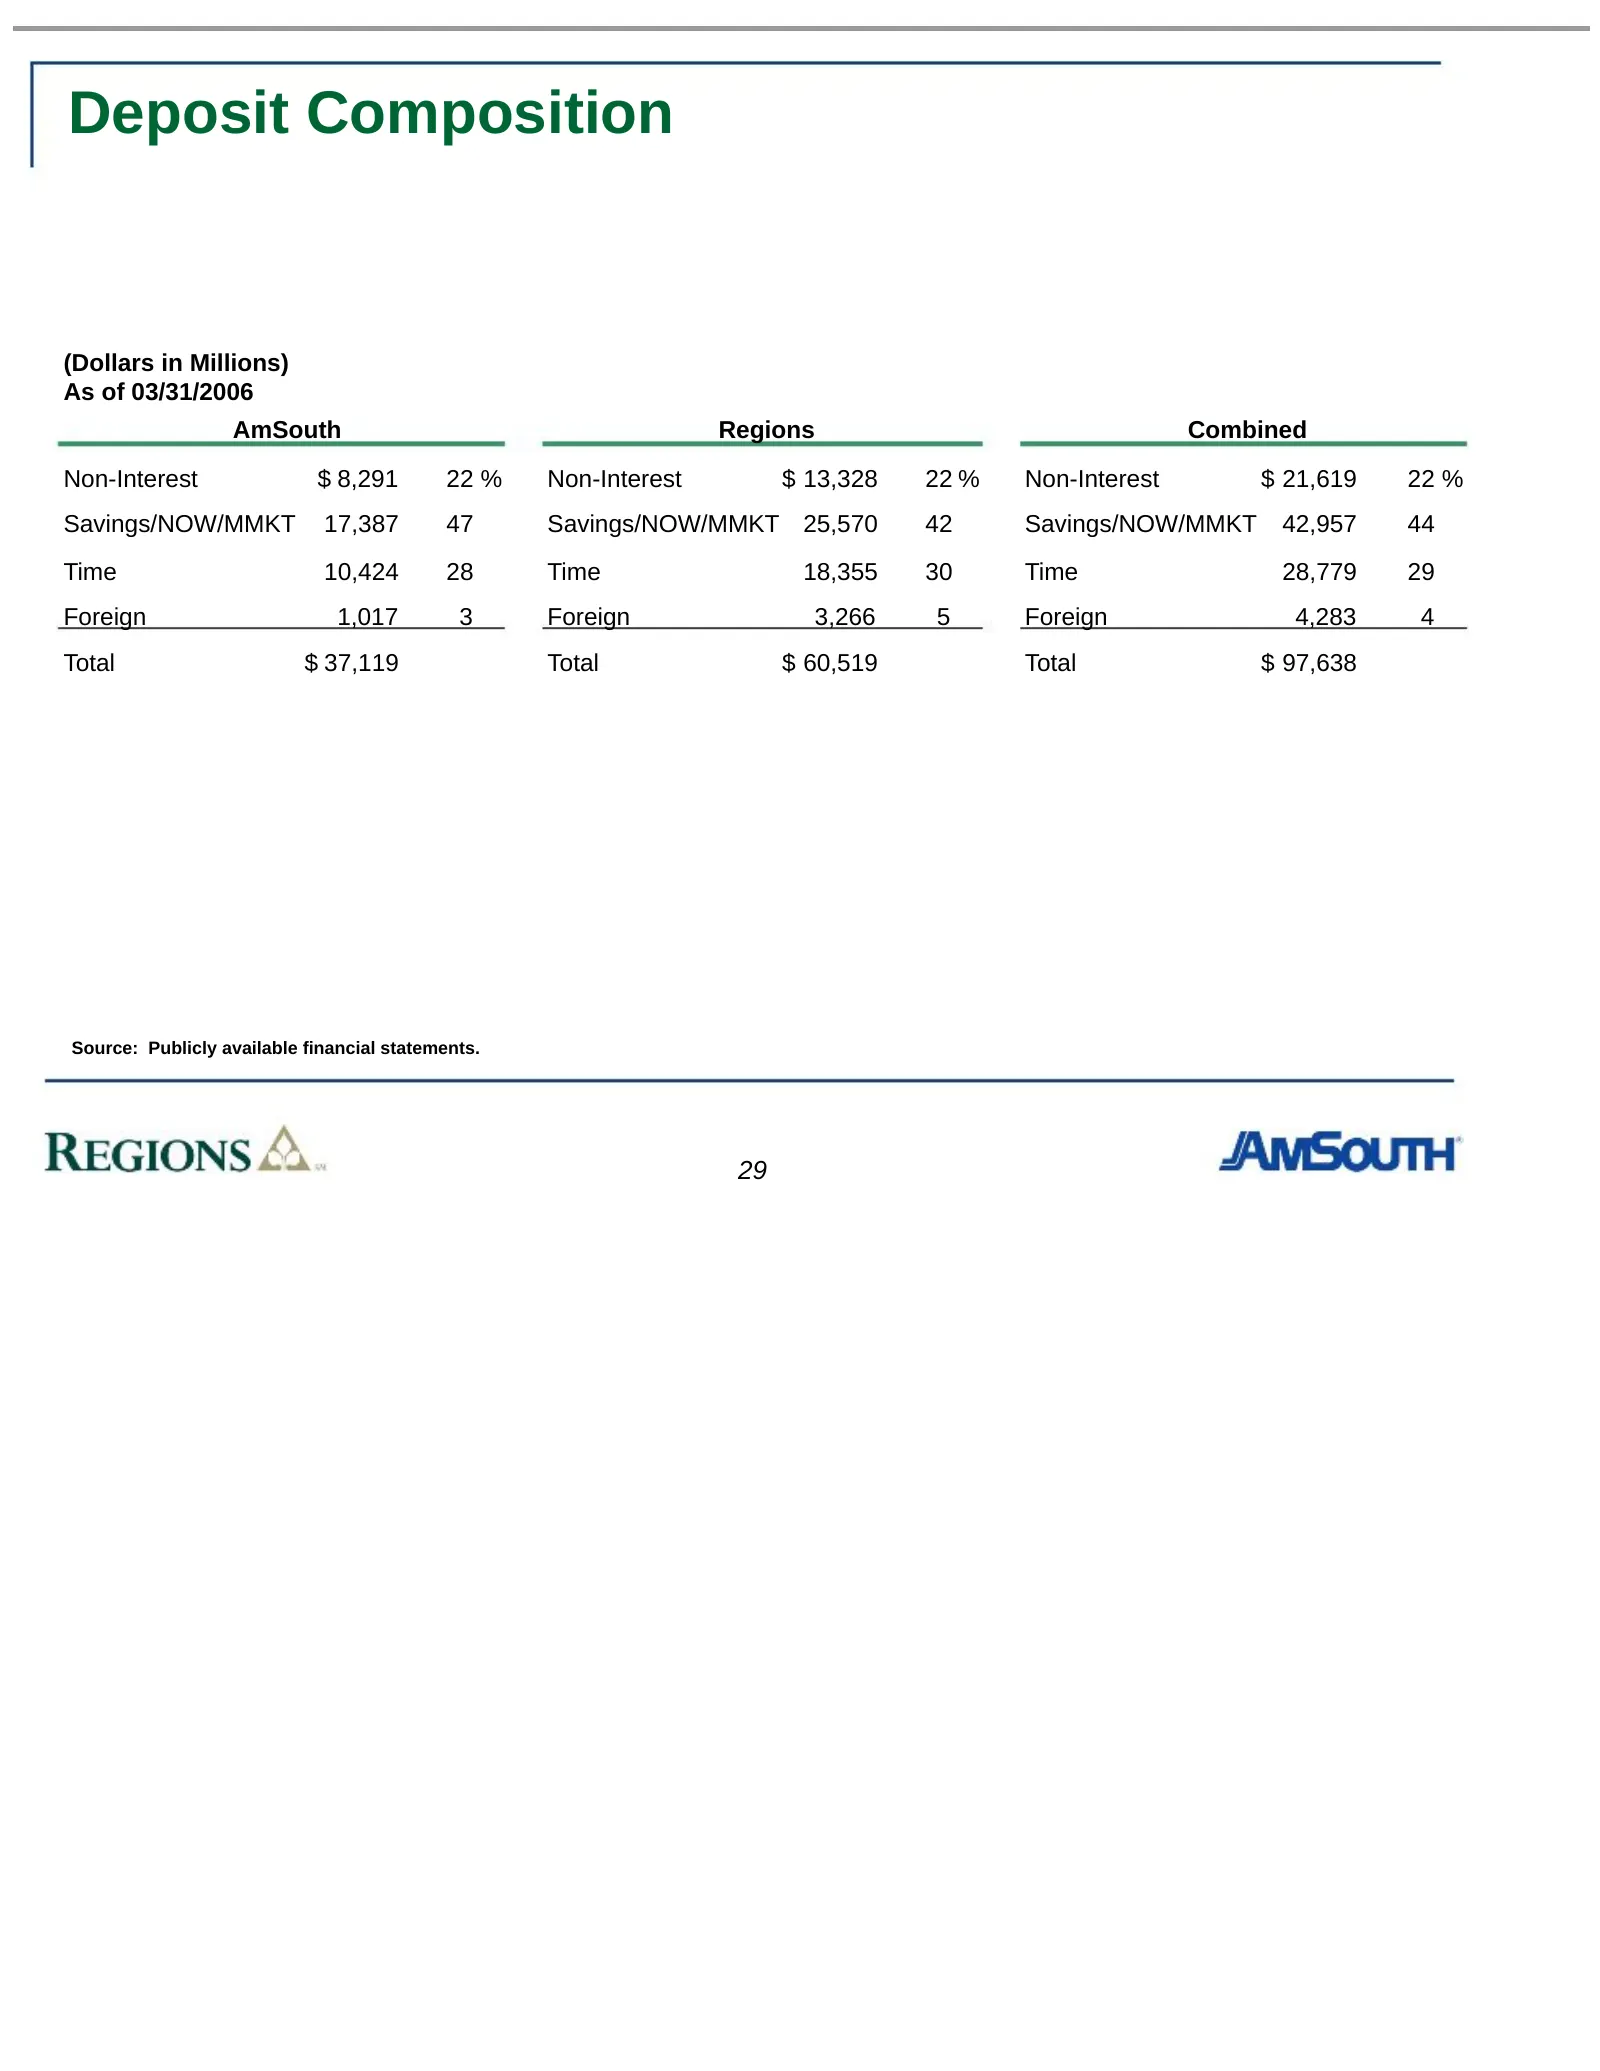
Deposit Composition (Dollars in Millions) As of 03/31/2006 AmSouth Regions Combined Non-Interest $ 8,291 22 % Non-Interest $ 13,328 22 % Non-Interest $ 21,619 22 % Savings/NOW/MMKT 17,387 47 Savings/NOW/MMKT 25,570 42 Savings/NOW/MMKT 42,957 44 Time 10,424 28 Time 18,355 30 Time 28,779 29 Foreign 1,
Slide 32: Pro Forma Financial Results
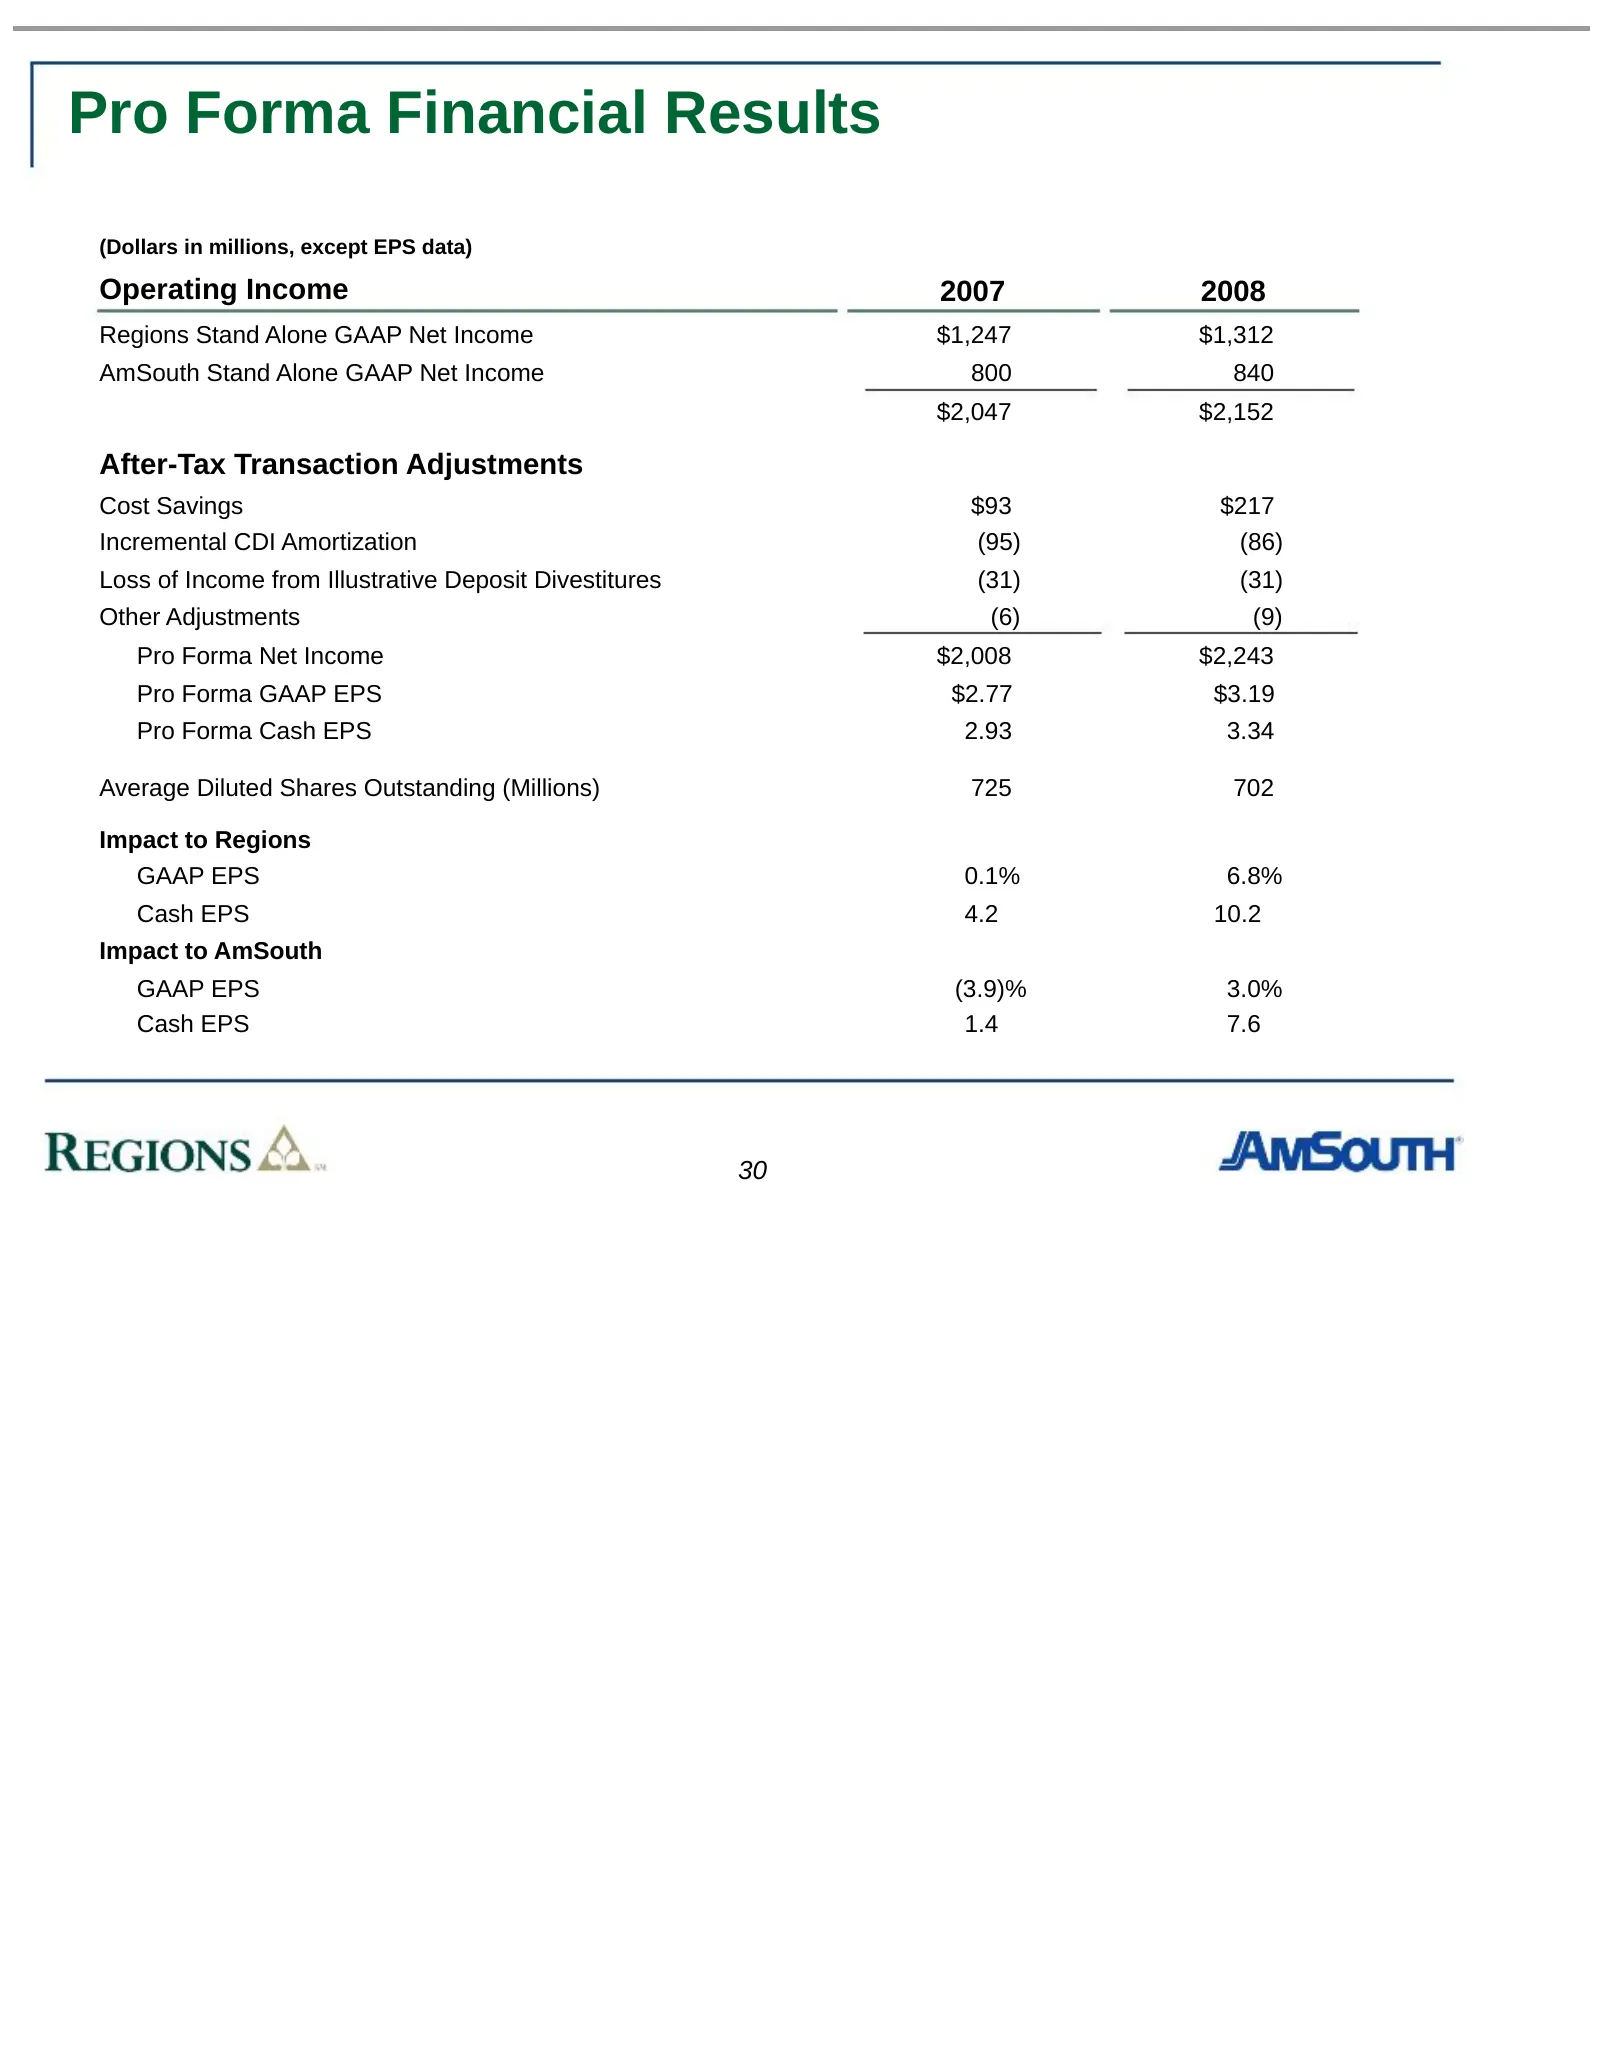
Pro Forma Financial Results (Dollars in millions, except EPS data) Operating Income 2007 2008 Regions Stand Alone GAAP Net Income $1,247 $1,312 AmSouth Stand Alone GAAP Net Income 800 840 $2,047 $2,152 After-Tax Transaction Adjustments Cost Savings $93 $217 Incremental CDI Amortization (95) (86) Los
Slide 33: Merger Status
Merger Status REGIONS 2. a1
Slide 34: Accomplishments
Accomplishments Since the deal was announced in May, numerous activities have been completed or are underway: Key accomplishments to date include: Analyst Calls and Conferences Key Organizational Announcements Matrix Management 477 Leadership Decisions Announced Merger Integration process initiated
Slide 35: Objectives
Objectives A set of integration objectives was developed to clearly define and measure the goals for a successful integration Integrate the business systems and processes of the combined organization to deliver the following: Enhanced efficiency Retention of customers and associates Minimized change
Slide 36: Guiding Principles
Guiding Principles A set of guiding principles was developed to focus the direction of the decision-making efforts throughout the life cycle of the integration. Leverage the strengths of both legacy organizations to create a combined organization with better products and operating excellence Utilize
Slide 37: Success Metrics
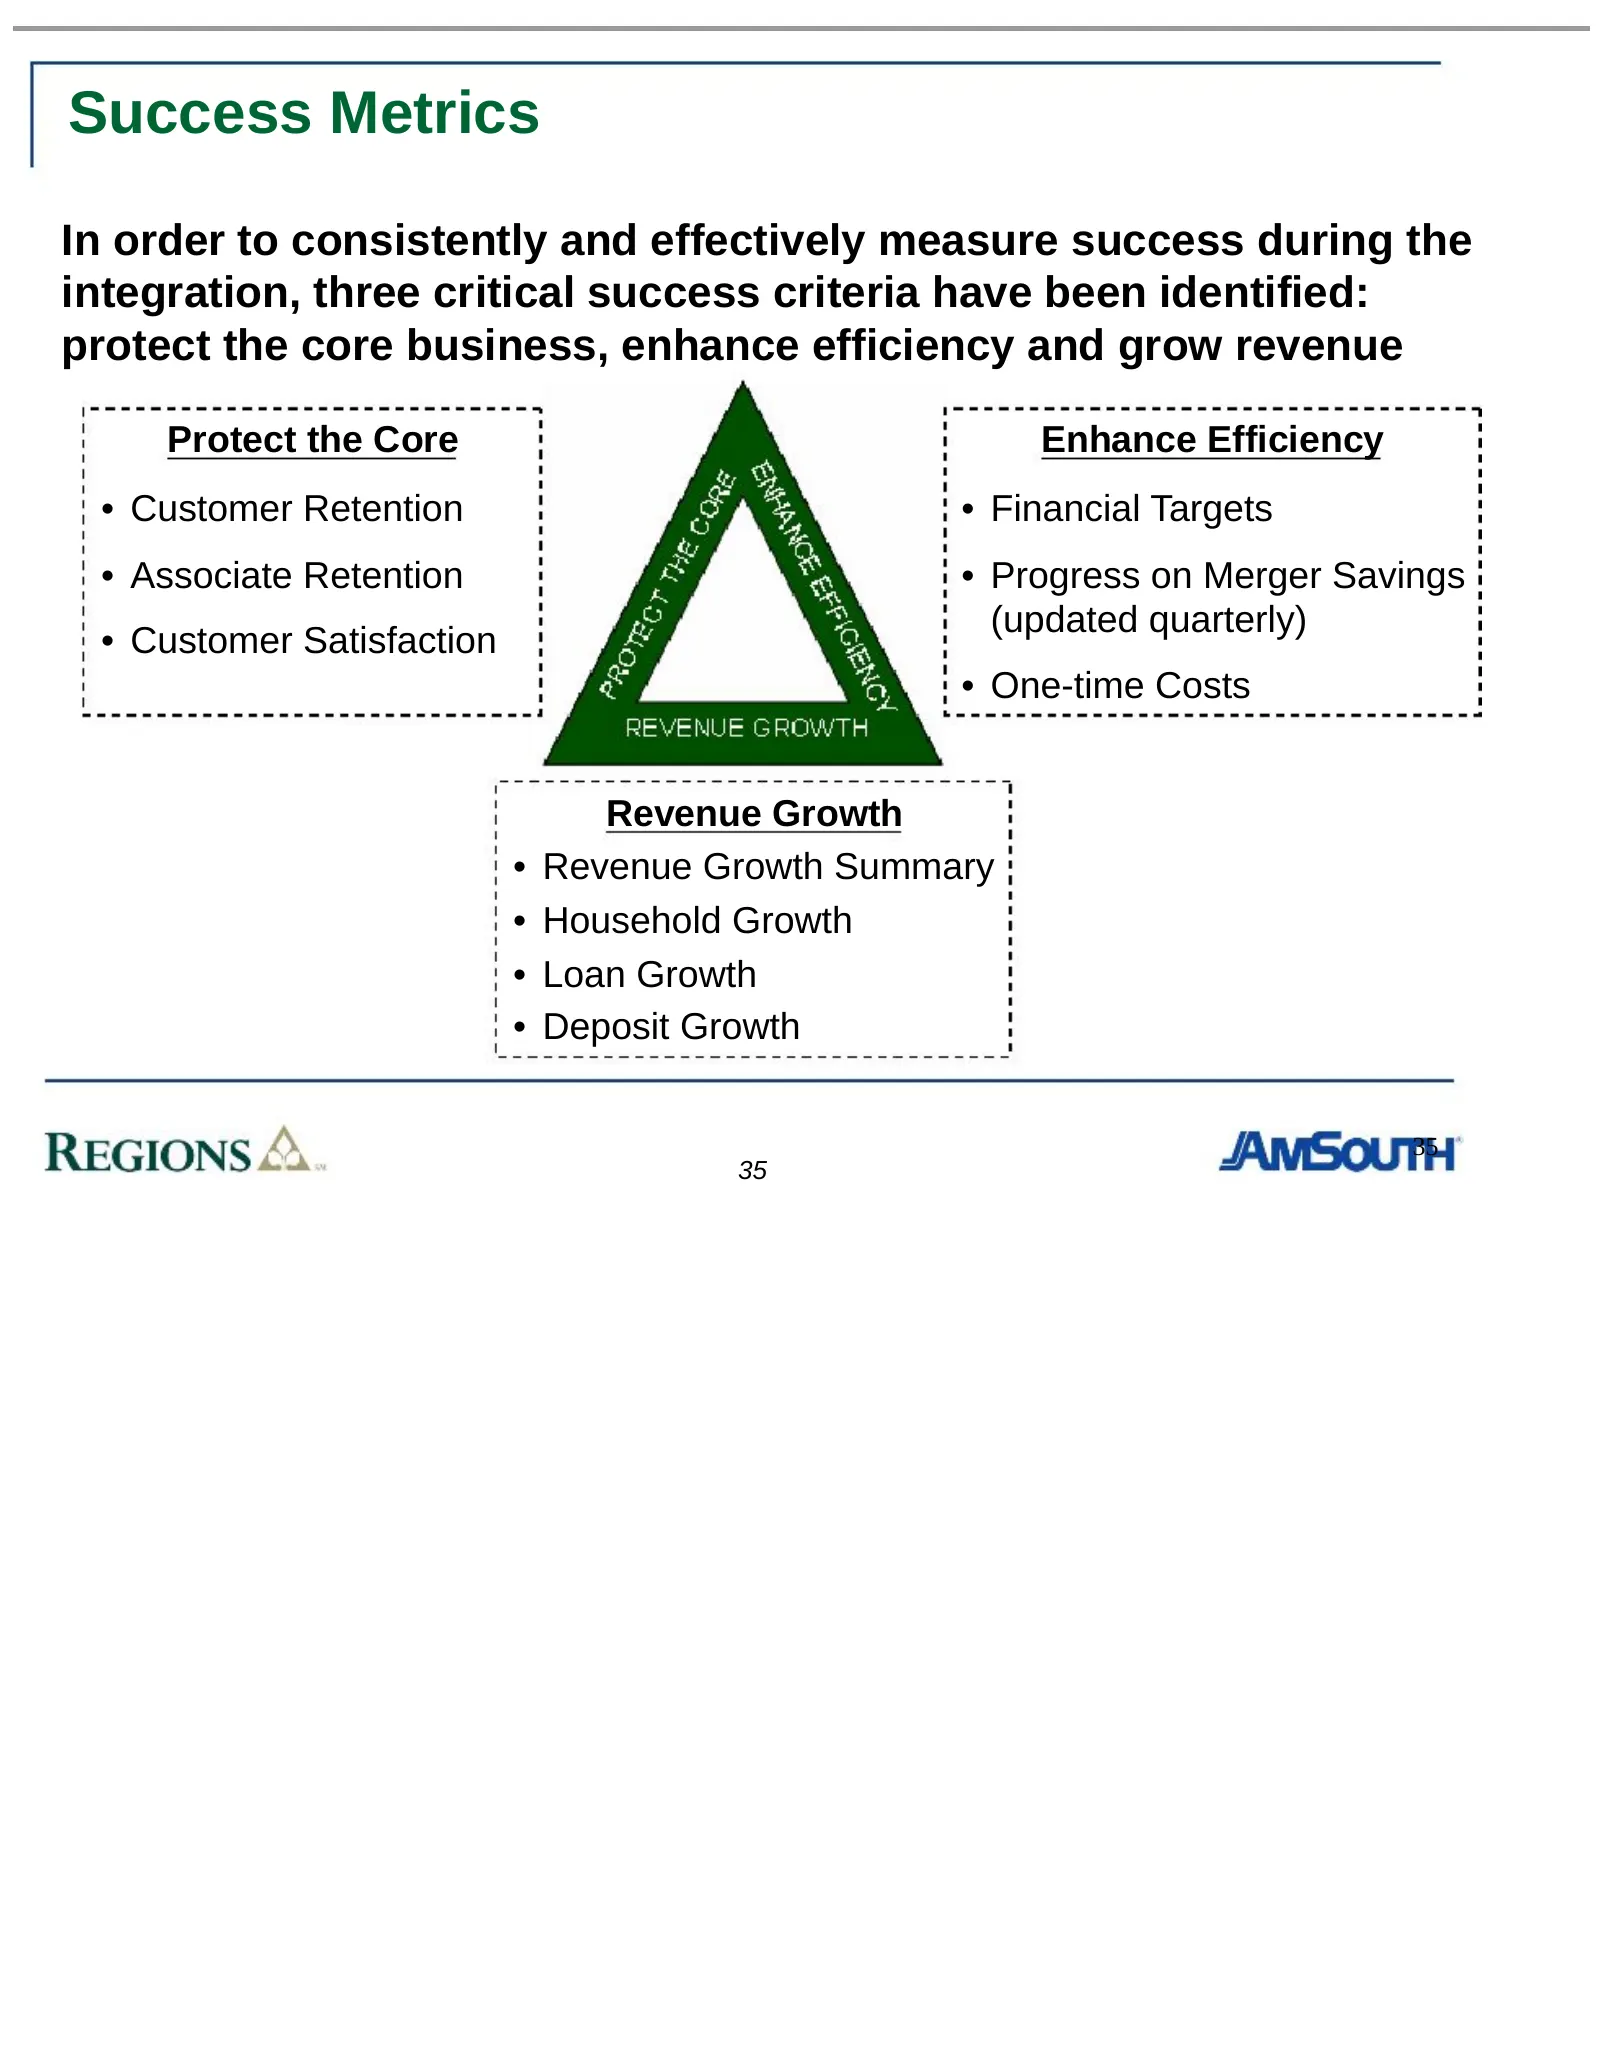
Success Metrics In order to consistently and effectively measure success during the integration, three critical success criteria have been identified: protect the core business, enhance efficiency and grow revenue Protect the Core Enhance Efficiency • Customer Retention • Financial Targets • Associa
Slide 38: Divestiture Process
Divestiture Process Potential Bidders Offering Memorandum Purchase Agreement Due Diligence – Online Data Room 36
Slide 39: Principal Issues
Principal Issues Customer Retention Creation of new competitor Personnel Retention of associates Creating the appropriate business climate Rules of engagement 12 month restriction on soliciting divested customers or associates Keeping a Focused Perspective Prescriptive process, driven by DOJ and the
Slide 40: Branch Expansion – 2006 Status
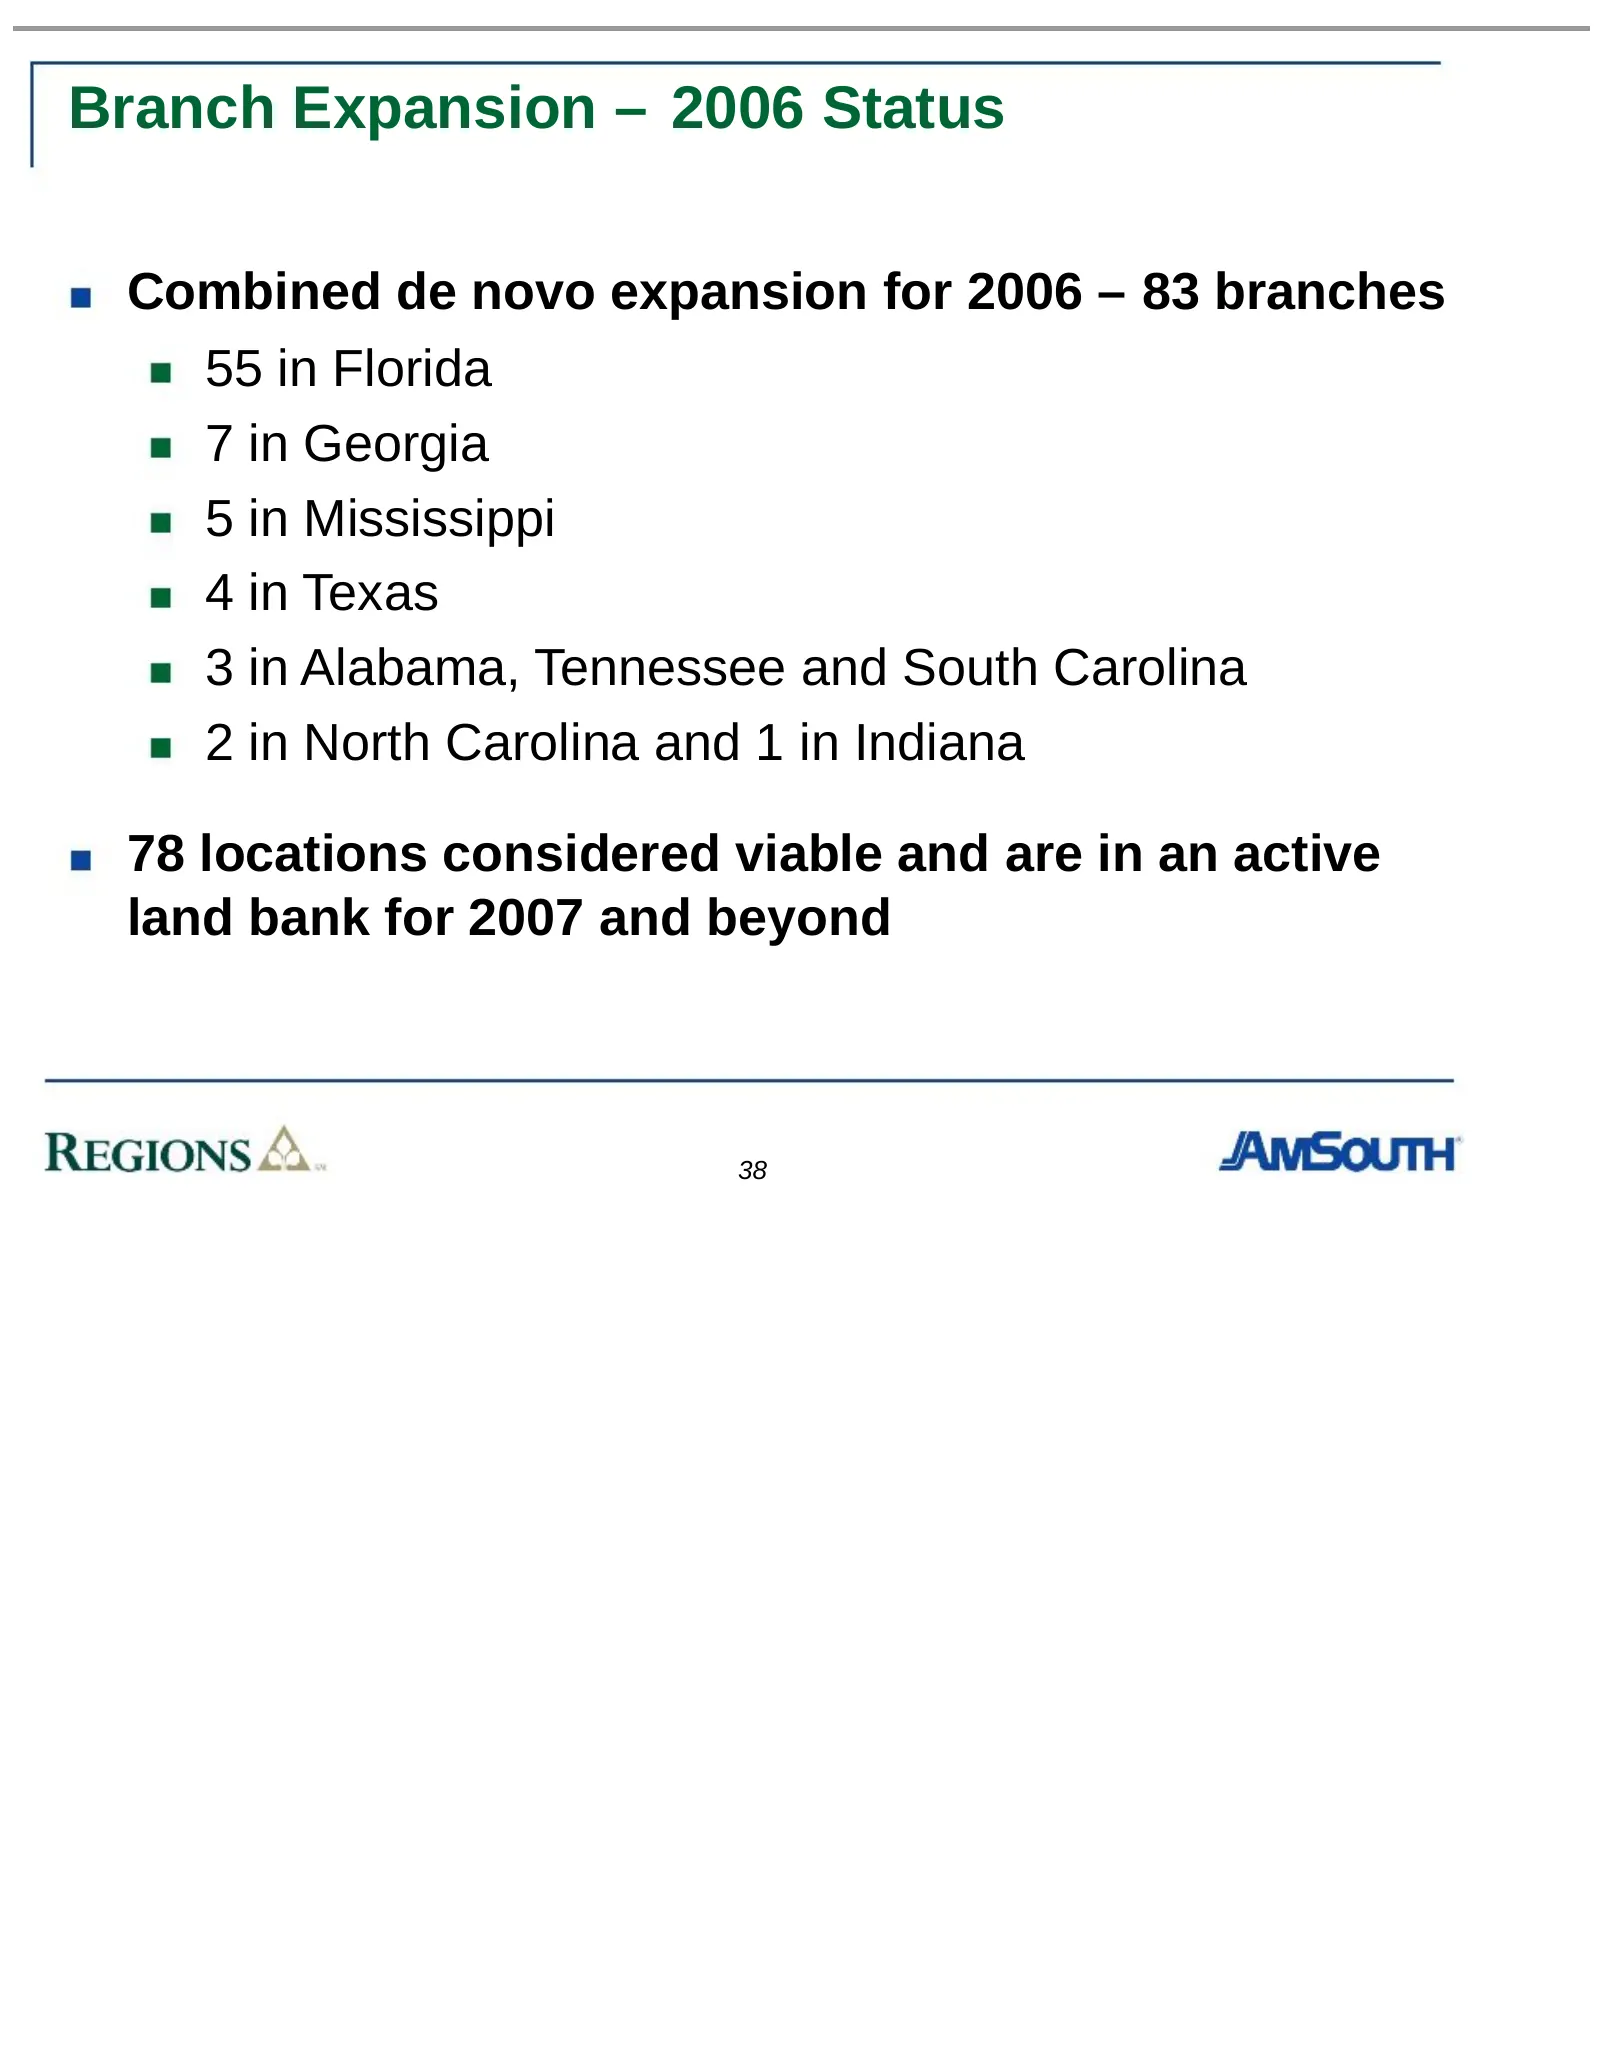
Branch Expansion – 2006 Status Combined de novo expansion for 2006 – 83 branches 55 in Florida 7 in Georgia 5 in Mississippi 4 in Texas 3 in Alabama, Tennessee and South Carolina 2 in North Carolina and 1 in Indiana 78 locations considered viable and are in an active land bank for 2007 and beyond 38
Slide 41: Branch Expansion – 2007 and Beyond
Branch Expansion – 2007 and Beyond Continue focus on branch expansion Follow rigorous process for site selection, planning and profitability 2007 – Open 50 new branches 2008 – Open 100 new branches 39
Source: SEC EDGAR · 425 filed Aug 22, 2006
More decks from Amsouth Bancorporation
 Merger or Acquisition (October 2006)10 slides · Oct 3, 2006
 Regions Financial — Merger or Acquisition (May 2006)28 slides · May 26, 2006
 Shareholder Meeting (April 2006)17 slides · Apr 20, 2006
 Citigroup Financial Services Conference 200631 slides · Feb 1, 2006
 Fox-Pitt, Kelton Global Financial Services Conference 200529 slides · Nov 8, 2005
 Ryan Beck 2005 Financial Services Conference17 slides · Nov 2, 2005