Amsouth Bancorporation — Citigroup Financial Services Conference 2006
31 slides from Amsouth Bancorporation's conference presentation, Feb 1, 2006

Slide 1: Citigroup Financial Services Conference February 1, 2006
Citigroup Financial Services Conference February 1, 2006 Exhibit 99.1 Citigroup Financial Services Conference February 1, 2006

Slide 2: Safe Harbor
Safe Harbor Safe Harbor Statements in this presentation that are not purely historical are forward-looking statements (as defined in the Private Securities Litigation Reform Act of 1995), including any statements regarding descriptions of management’s plans, objectives or goals for future operations

Slide 3: Presentation Topics
Presentation Topics Presentation Topics • AmSouth profile • Strategic plan highlights • Well positioned for growth – Balance sheet strength – Lower risk profile • Growth opportunities • 2005 financial performance
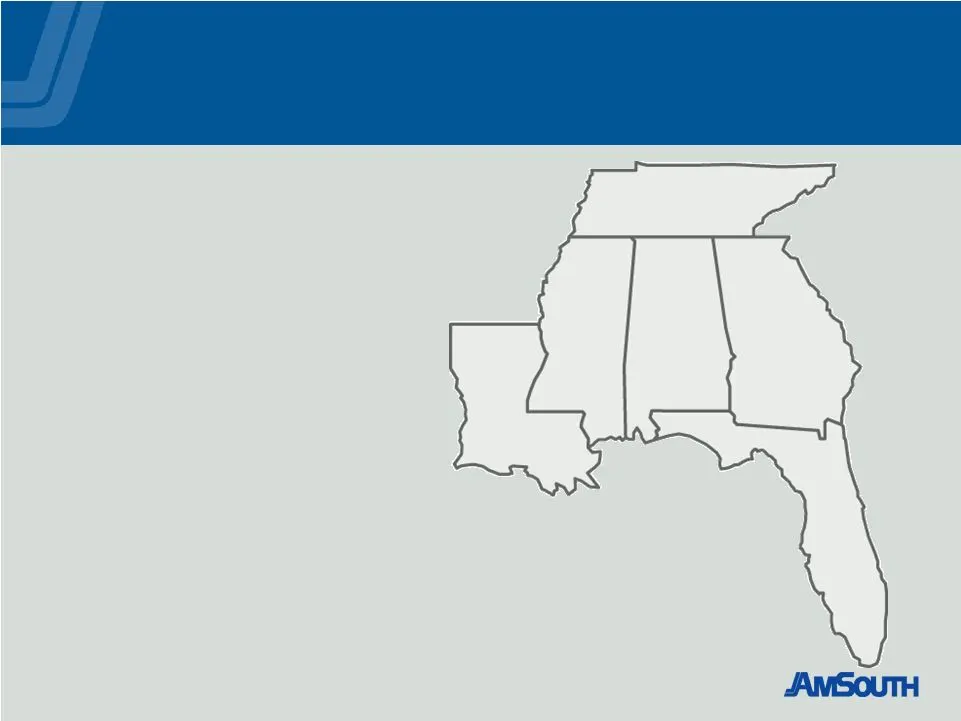
Slide 4: AmSouth Maintains a Leadership Position in Attractive Markets
AmSouth Maintains a Leadership Position in Attractive Markets AmSouth Maintains a Leadership Position in Attractive Markets • $9 billion Market Cap • $52 billion in Assets • 684 Branches • 1,200 ATMs • 1.8 million Households • 12,300 Employees

Slide 5: Leading Businesses in Southeast
Leading Businesses in Southeast Leading Businesses in Southeast • Trust assets - $27 billion • Annuity sales - $770 million • Small business lending - $3.6 billion • Consumer lending - $17 billion • Equipment leasing - $2 billion • Electronic banking – more than 1.2 million registered users

Slide 6: Strategic Initiatives
Strategic Initiatives Strategic Initiatives • Sustain growth in Consumer Banking • Continue aggressive growth in Business Banking • Grow Commercial Banking business with improved credit quality • Double contribution from Wealth Management • Double Florida’s contribution • Emphasize sales productivit
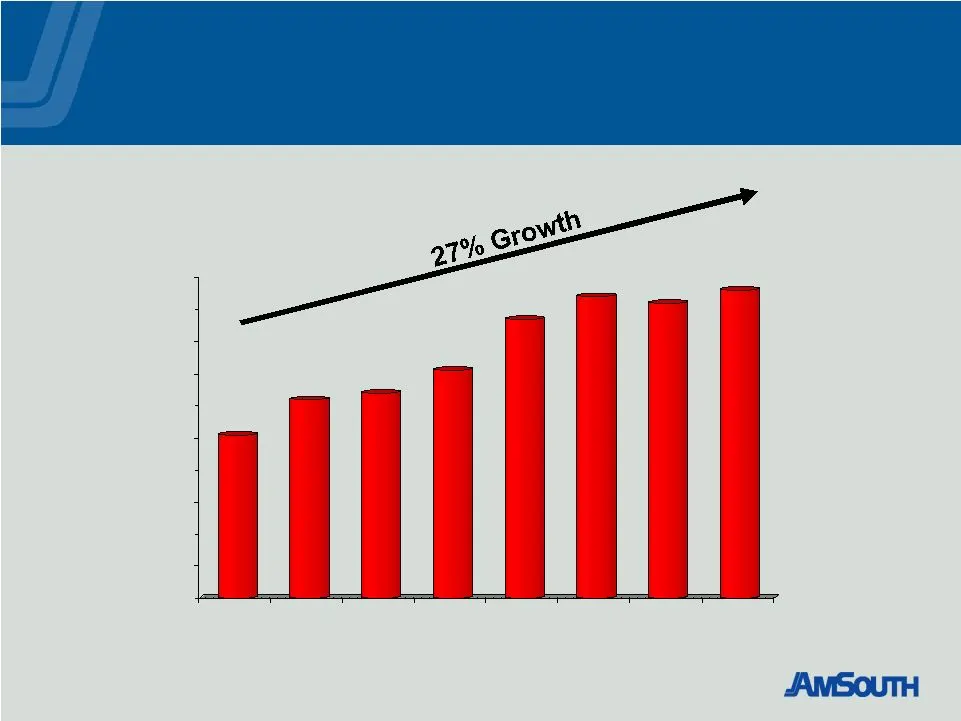
Slide 7: Strong Low-Cost Deposit Growth
Strong Low-Cost Deposit Growth Strong Low-Cost Deposit Growth $20.1 $21.2 $21.4 $22.1 $23.7 $24.4 $24.2 $24.6 $15 $16 $17 $18 $19 $20 $21 $22 $23 $24 $25 1Q04 2Q04 3Q04 4Q04 1Q05 2Q05 3Q05 4Q05 Billions

Slide 8: Solid Business Banking Results
Solid Business Banking Results Solid Business Banking Results • 24 month Business Banking growth – Loans - 23% – Deposits - 35% • Over 800,000 small businesses in our markets… we currently bank 1 in 4 of these

Slide 9: High Quality Commercial Banking Growth
High Quality Commercial Banking Growth • 24 month Commercial growth – Loans - 24% – Deposits – 44% • Cumulative Commercial Real Estate production during the past 24 months - $13.0 billion • Strong credit quality High Quality Commercial Banking Growth

Slide 10: Significant Wealth Management Opportunities…
Significant Wealth Management Opportunities… • Well positioned with a new business model and the right products and services • Strong private client household growth – 32% since plan inception Significant Wealth Management Opportunities…

Slide 11: Florida branch expansion
Florida branch expansion Florida branch expansion • 85 branches opened since January 2002 • 225 Florida branches, most in any of our states • 54 new Florida branches scheduled to open in 2006 • 15 month break-even • Leading growth market for Wealth Management, Small Business, Commercial and Commerci
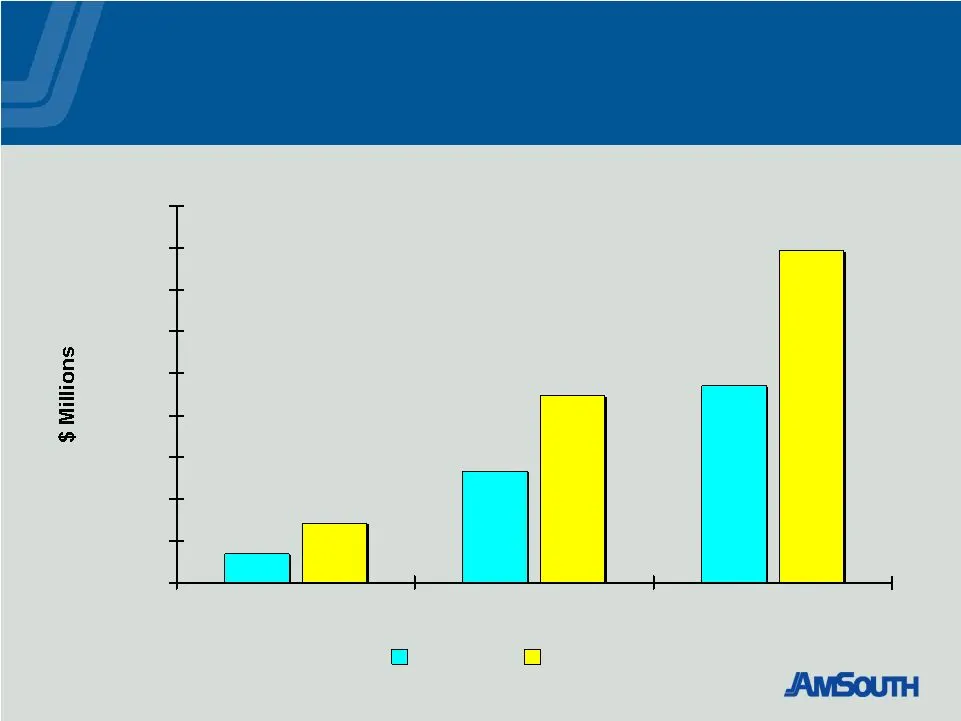
Slide 12: Florida results from branches opened in the last four years
Florida results from branches opened in the last four years Florida results from branches opened in the last four years $136 $535 $943 $285 $894 $1,589 $0 $200 $400 $600 $800 $1,000 $1,200 $1,400 $1,600 $1,800 2003 2004 2005 Loans Deposits

Slide 13: Our balance sheet is strong and well positioned for growth
Our balance sheet is strong and well positioned for growth
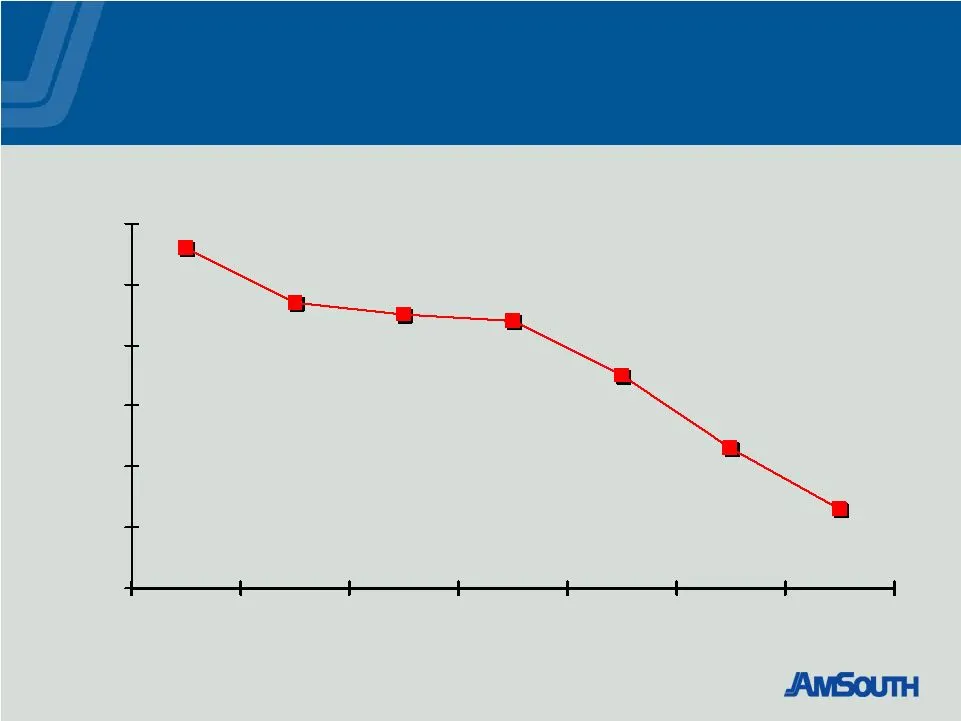
Slide 14: Improving Earning Asset Mix
Improving Earning Asset Mix Improving Earning Asset Mix 28.6% 26.5% 25.3% 24.3% 27.5% 27.4% 27.7% 23% 24% 25% 26% 27% 28% 29% 2Q04 3Q04 4Q04 1Q05 2Q05 3Q05 4Q05 Investment Securities to Total Earnings Assets
Slide 15: Favorable Shift in Funding Mix
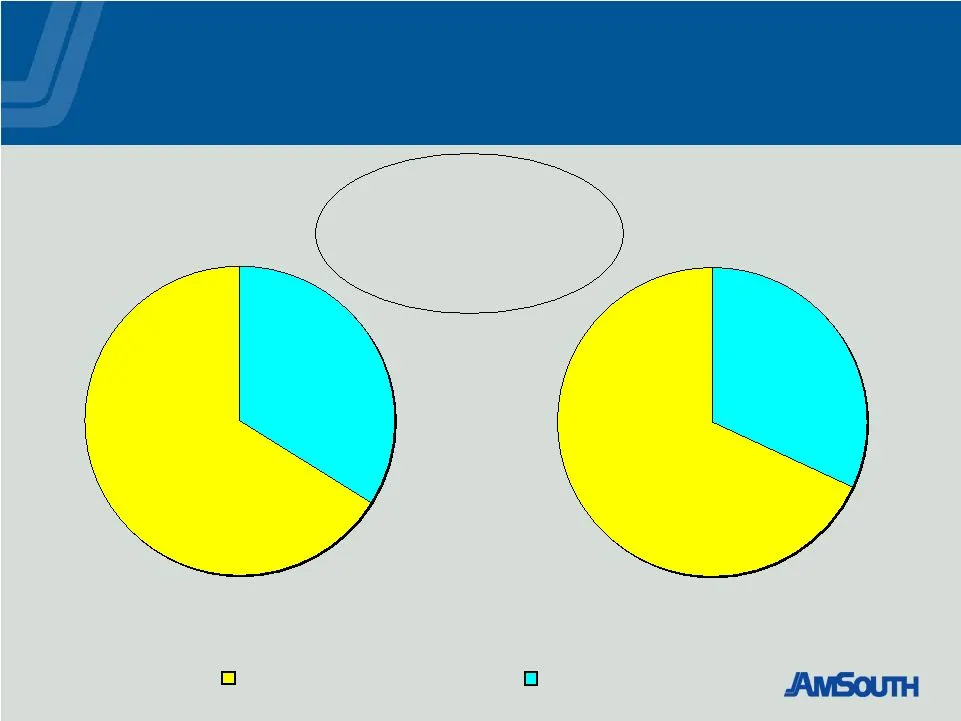
Favorable Shift in Funding Mix Favorable Shift in Funding Mix Low cost deposits have grown 11.4% in the last twelve months Low Cost Deposits Other Deposits 66% 34% 68% 32% 4Q04 4Q05
Slide 16: Neutral Interest Rate Sensitivity Position
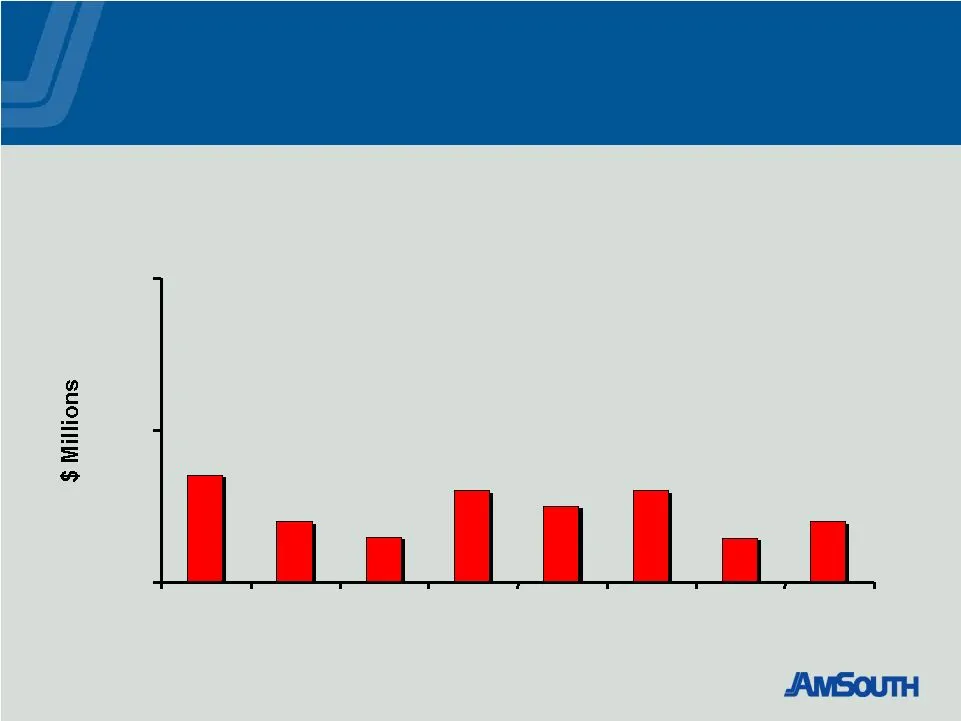
Neutral Interest Rate Sensitivity Position Neutral Interest Rate Sensitivity Position 100 Basis Point Increase in Interest Rates $ Impact to Net Interest Income $0 $10 $20 1Q04 2Q04 3Q04 4Q04 1Q05 2Q05 3Q05 4Q05
Slide 17: Loan Loss Experience
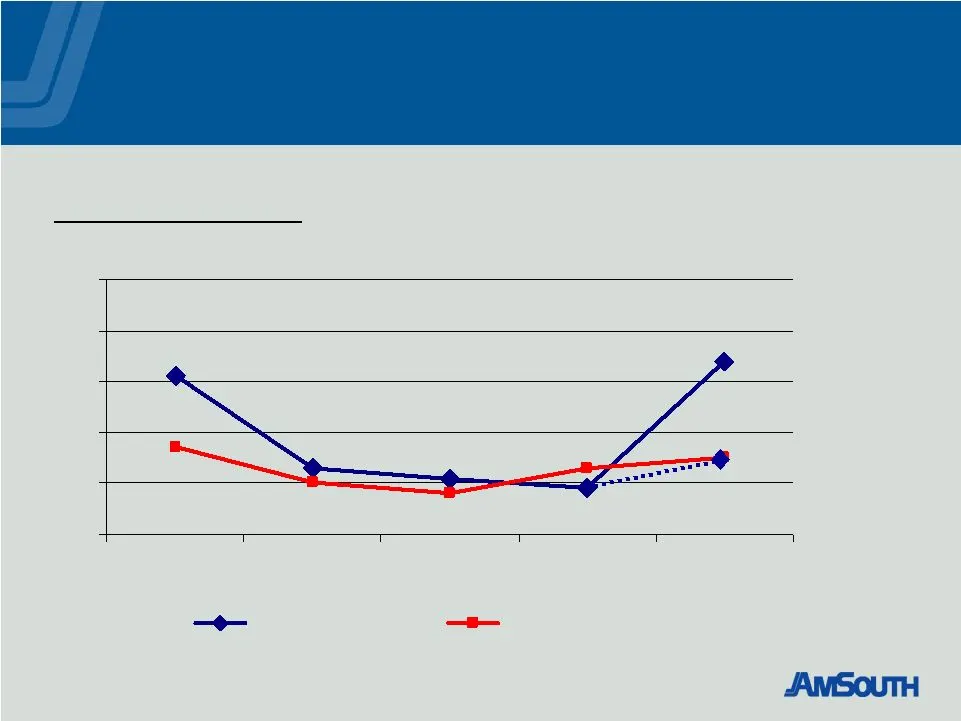
Loan Loss Experience Loan Loss Experience 0.44% 0.41% 0.23% 0.21% 0.19% 0.25% 0.27% 0.20% 0.18% 0.23% 0.10% 0.20% 0.30% 0.40% 0.50% 0.60% 4Q04 1Q05 2Q05 3Q05 4Q05 AmSouth Mid Cap Peer Group Net Charge-Off Ratio (As Reported) (Without $18 mm single credit) 0.24%
Slide 18: Nonperforming Asset Levels Better Than Peers
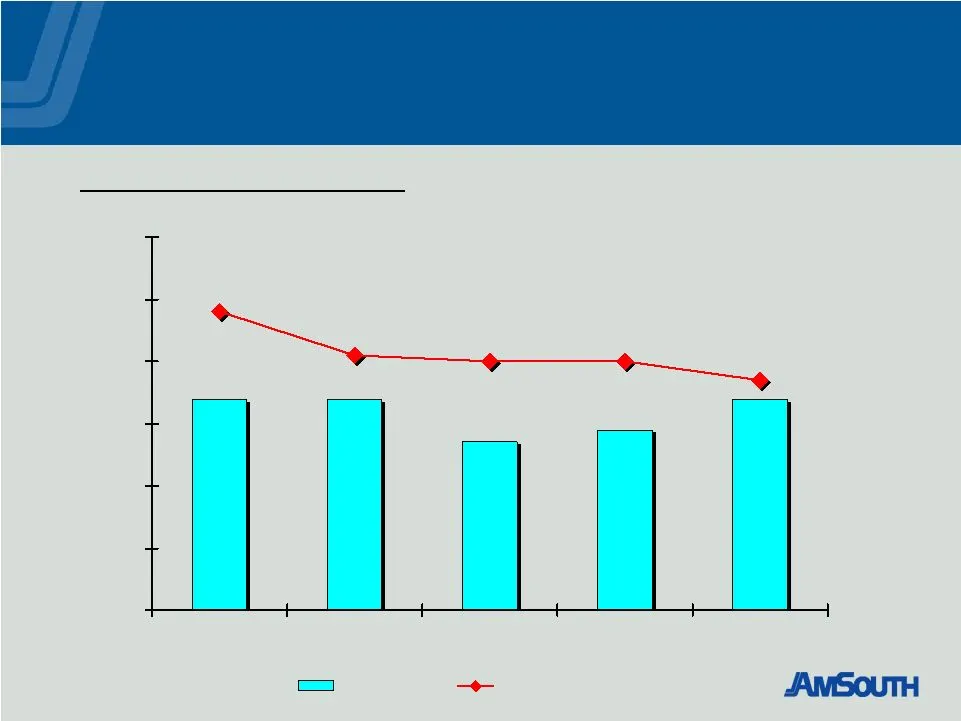
Nonperforming Asset Levels Better Than Peers Nonperforming Asset Levels Better Than Peers 0.34% 0.34% 0.27% 0.29% 0.34% 0.48% 0.41% 0.40% 0.40% 0.37% 0.00% 0.10% 0.20% 0.30% 0.40% 0.50% 0.60% 4Q04 1Q05 2Q05 3Q05 4Q05 AmSouth Mid Cap Peer Group Nonperforming Assets Ratio

Slide 19: Accruing Loans Days Past Due
Accruing Loans 90 Days Past Due Accruing Loans 90 Days Past Due ($’s in millions) 12/31/05 9/30/05 Increase As reported Revised* As reported From Revised Residential First Mortgages $53.1 $21.0 $19.7 $1.3 Total $86.1 $54.0 $52.4 $1.6 * Revised figures exclude the Katrina past due amounts which have

Slide 20: We are in outstanding markets with the right products
We are in outstanding markets with the right products
Slide 21: AmSouth Market Assessment
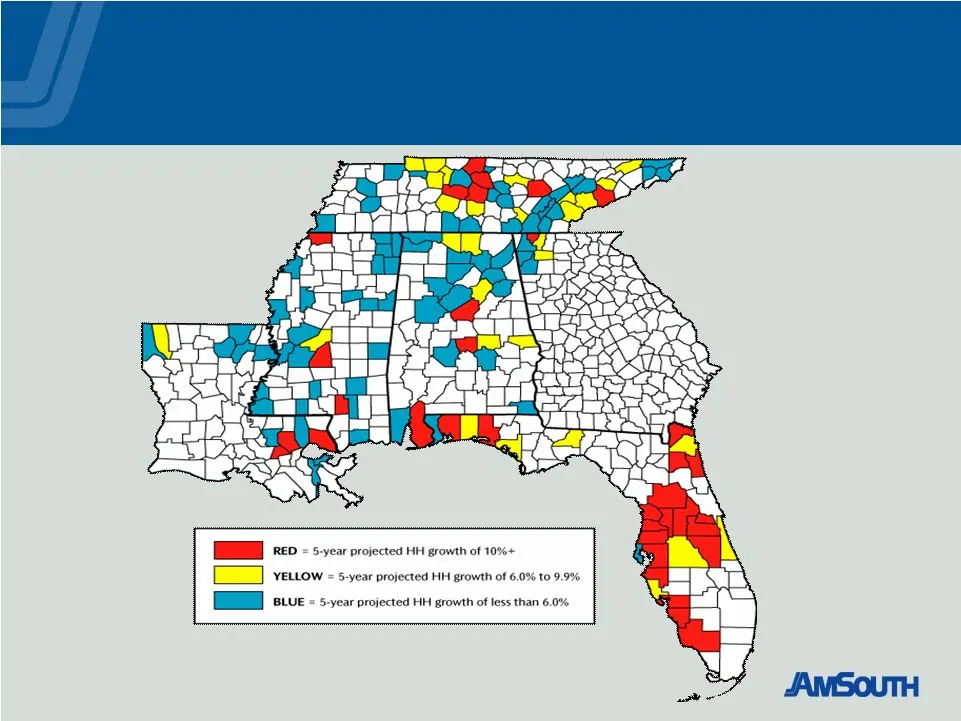
AmSouth Market Assessment AmSouth Market Assessment
Slide 22: Florida – Current Operations
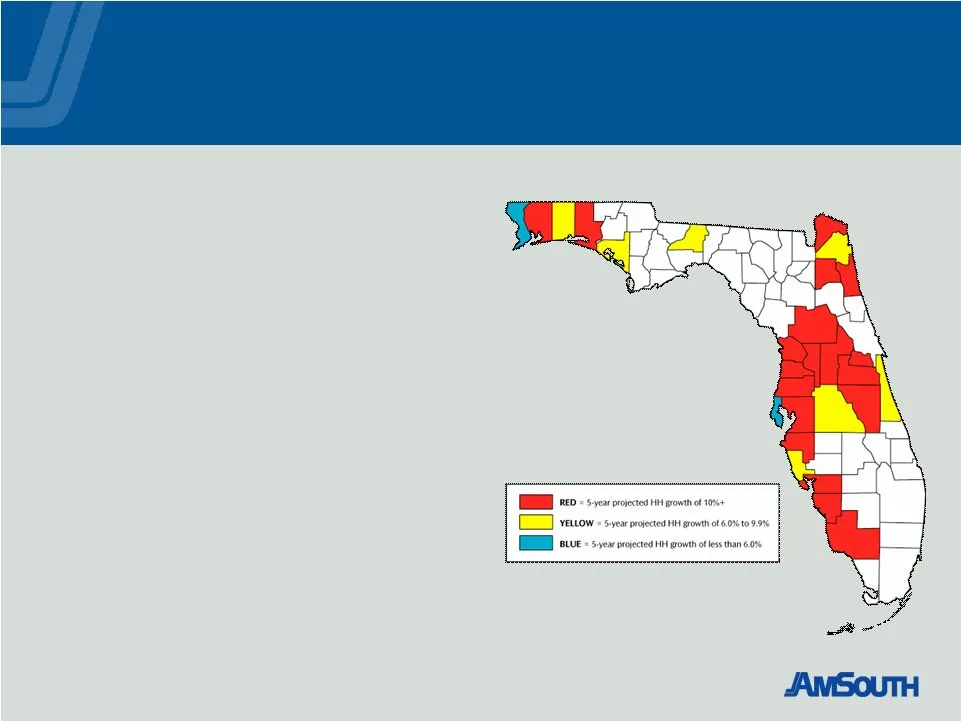
Florida – Current Operations Florida – Current Operations • Loans - $9.2 billion, 27% of total company • Deposits - $9.4 billion, 26% of total company • Branches – 225, 33% of entire network • Households – Consumer – 29% of total company – Business banking – 35% of total company

Slide 23: Why expand further in Florida?
Why expand further in Florida? Why expand further in Florida? • Highest growth rate among top 10 most populous states • Over 250,000 new jobs created last year • Evolving economic diversification • AmSouth average Florida growth – 4Q04 to 4Q05 – Loans - $1.6 billion or 20% – Deposits - $1.6 billion
Slide 24: Strong Market Opportunities
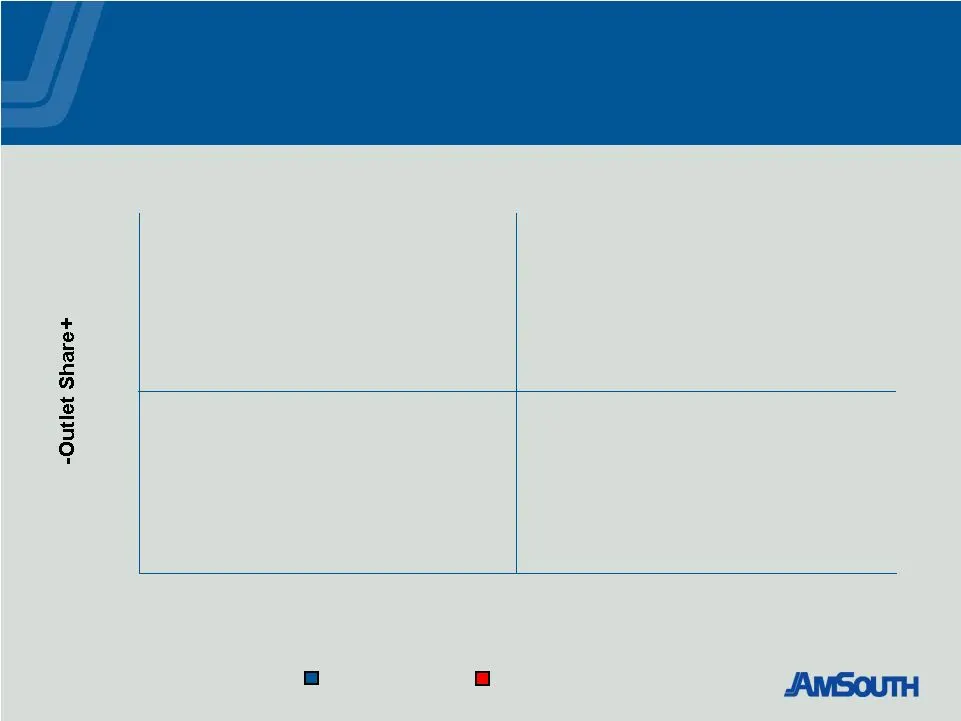
Strong Market Opportunities Strong Market Opportunities Middle TN 12% East TN 11% North Central AL 11% MS/North LA 11% Branches Outlet Share South AL/LA 7% West TN 6% West FL 7 % North FL 8% Central FL 5% Southwest FL 6% -Projected HH Growth+ 15% 13% 11% 9% 7% 5% 3% 0.0% 2.0% 4.0% 6.0% 8.0% 10.0% 12

Slide 25: 2006 Branch Expansion Plan
2006 Branch Expansion Plan 2006 Branch Expansion Plan • 64 Branches – Full year 2006 – First Quarter 13 – Florida 2 – Other high growth markets – Remaining quarters 41 – Florida 8 – Other high growth markets

Slide 26: Florida Residential Real Estate
Florida Residential Real Estate Florida Residential Real Estate • 49% of single family lending is in Florida • Home equity - $3.0 billion – Average FICO – – Average LTV – 75% • Residential first mortgage - $3.8 billion – Average FICO – – Average LTV – 72%

Slide 27: Florida Commercial Real Estate
Florida Commercial Real Estate Florida Commercial Real Estate • 47% of commercial real estate is in Florida - $3.3 billion • Florida is 50% of our economic footprint • Diversified portfolio – 28% single family builders - $924 million – 23% condominium loans – $759 million 95% presold 20% nonrefundab

Slide 28: 2005 Performance Highlights
2005 Performance Highlights 2005 Performance Highlights 4Q05 2005 • Diluted earnings per share $0.52 $2.04 • Net income $182.1 million $725.7 million • Return on equity 20.4% 20.4% • Net interest margin 3.37% 3.38% • Efficiency ratio 51.7% 52.0% • Charge-off ratio 0.44% 0.27% • Non-performing asset

Slide 29: 2006 Earnings Guidance
2006 Earnings Guidance 2006 Earnings Guidance • 2006 earnings per share range $2.11 to $2.17 • General assumptions: – Stable economy – Moderately rising interest rate environment – Flat equity markets • Other factors: – Higher net interest income reflecting a relatively stable net interest margin –
Slide 30: Outstanding Record of Dividend Growth
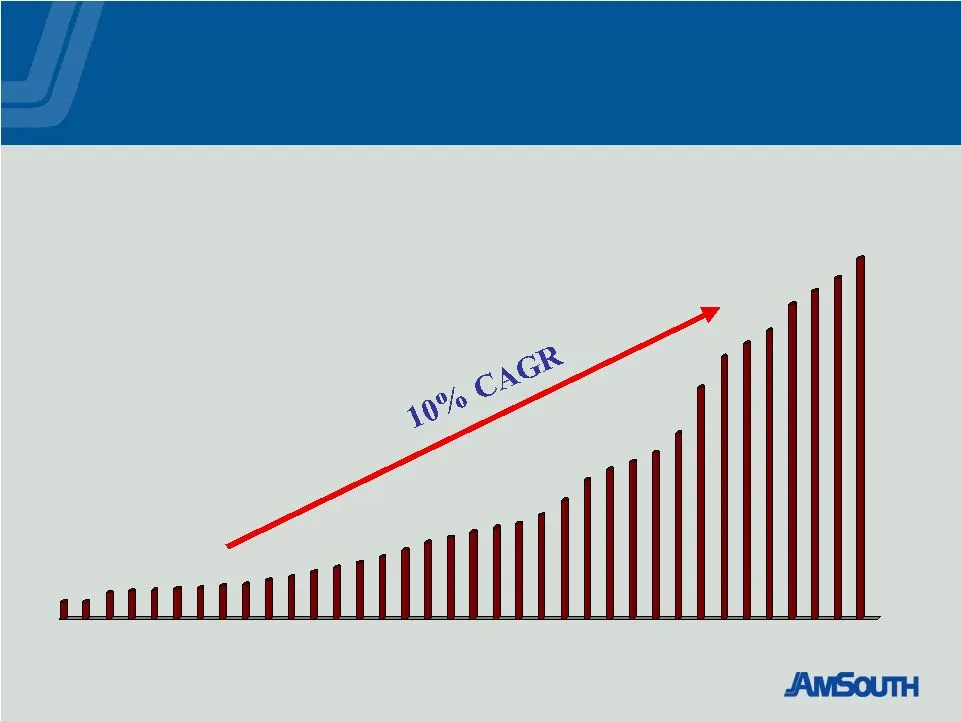
Outstanding Record of Dividend Growth Outstanding Record of Dividend Growth 35 Years of Higher Dividends Current Yield = 3.8% Mergent’s “Dividend Achiever”
Slide 31: Citigroup Financial Services Conference February 1, 2006
Citigroup Financial Services Conference February 1, 2006 Citigroup Financial Services Conference February 1, 2006
Source: SEC EDGAR · 8-K filed Feb 1, 2006
More decks from Amsouth Bancorporation
 Merger or Acquisition (October 2006)10 slides · Oct 3, 2006
 Merger or Acquisition (August 2006)41 slides · Aug 22, 2006
 Regions Financial — Merger or Acquisition (May 2006)28 slides · May 26, 2006
 Shareholder Meeting (April 2006)17 slides · Apr 20, 2006
 Fox-Pitt, Kelton Global Financial Services Conference 200529 slides · Nov 8, 2005
 Ryan Beck 2005 Financial Services Conference17 slides · Nov 2, 2005