Dennys — Proxy Contest (March 2010)
37 slides from Dennys's proxy contest presentation, Mar 19, 2010
Slide 1: Denny's Corporation Investor Presentation Fourth Quarter 2009
Denny’s Corporation Investor Presentation Fourth Quarter 2009
Slide 2: Forward-Looking Statements & Solicitation Materials
Forward-Looking Statements & Solicitation Materials Denny’s Corporation urges caution in considering its current trends and any outlook on earnings disclosed in this presentation. In addition, certain matters discussed may constitute forward-looking statements. These forward- looking statements invo
Slide 3: Denny's Overview
Denny’s Overview 1. Exceptional Brand Equity 1,551 restaurants; $2.2 billion in systemwide sales 2. Business Model Transformation On-Going Transitioning to a franchised-based business model Much stronger balance sheet; greater financial flexibility 3. Unlocking Long-Term Growth Energized and expandi
Slide 4: Exceptional Brand Equity
Exceptional Brand Equity Exceptional Brand Awareness - An American Icon 97% brand awareness* in the United States nd largest Family Chain in units, sales and market share 24 hours / 7 days a week Value Longevity Open since 1953 Overcame 9 recessions Franchisees average 10 years in the system 40 rest

Slide 5: 2010 Super Bowl
2010 Super Bowl Campaign offered a Free Grand Slam to everyone in the U.S.: 2 million guests 7% more than LY during promo hours 500 newspapers covered the story Grand Slam: 88% of population associate with Denny’s * Source: Brand Tracker, May 2009
Slide 6: Impressive Market Share in Top DMA's
Impressive Market Share in Top DMA’s Top Market Share DMA’s Los Angeles % of Market Share * Peer group includes: IHOP, Mimi’s Café, Marie Callendar, Coco’s, Carrow’s, Waffle House, Shoney’s, Perkins, Friendly’s, Original Pancake, First Watch, Panera Bread and other notable brands. Source: Restaurant
Slide 7: Business Model Transformation On-Going
Business Model Transformation On-Going
Slide 8: Franchise Growth Initiative (FGI)
Franchise Growth Initiative (FGI) Sale of select company restaurants to franchisees based on: Gaining commitments to future unit growth Strengthening company portfolio (sale of lower performing units) Tightening company operating geography Through Q409, Denny’s has sold company units (or 56% of the
Slide 9: Producing Significant Earnings Growth
'09 vs '08 '09 vs '07 2008 B/(W) 2007 B/(W) 2009 ($ in millions) Total Operating Revenue 608.1 760.3 (20%) 939.4 (35%) Adjusted Income before Tax 30.0 23.2 29% 10.5 186% Producing Significant Earnings Growth (1) See appendix for reconciliation of Net Income to Adjusted EBITDA and Adjusted Income bef
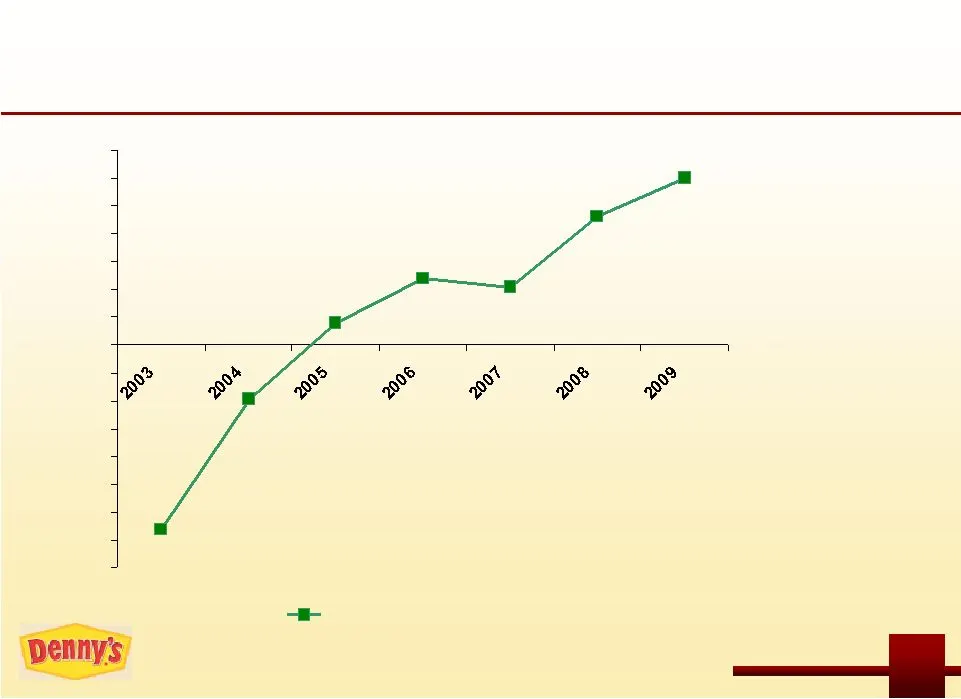
Slide 10: Growth of 'Recurring' Earnings Even in Challenging Economy
Growth of ‘Recurring’ Earnings Even in Challenging Economy Note: Adjusted Income before tax is a non-GAAP measure that management believes best reflects on-going earnings due to the significant impact on our P&L from non-operating, nonrecurring and non cash items ($M) -40 -35 -30 -25 -20 -15 -10 -5
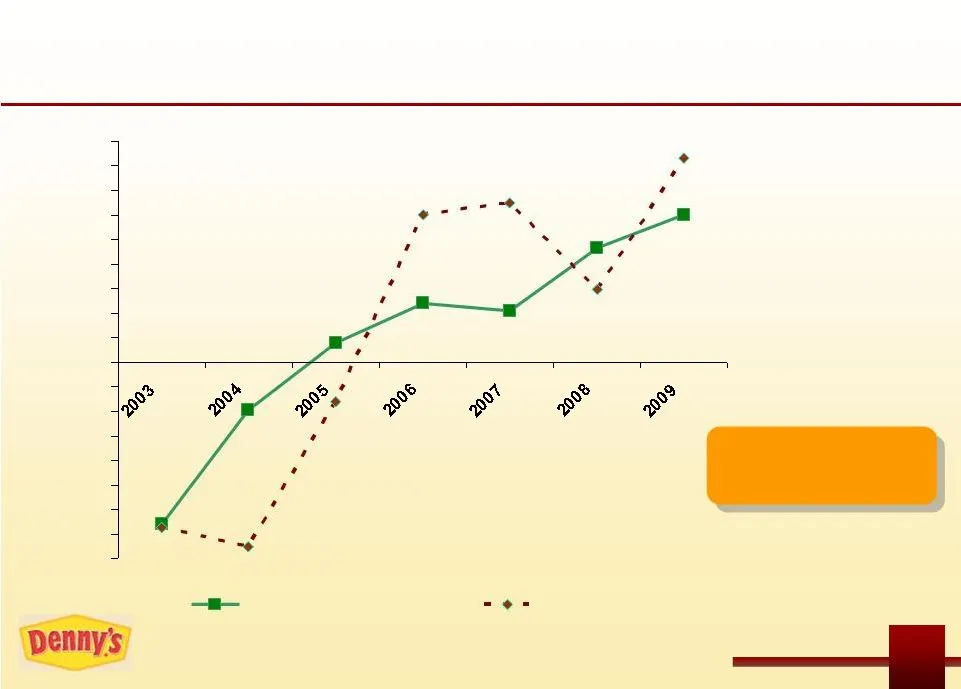
Slide 11: Net Income Trend is Up
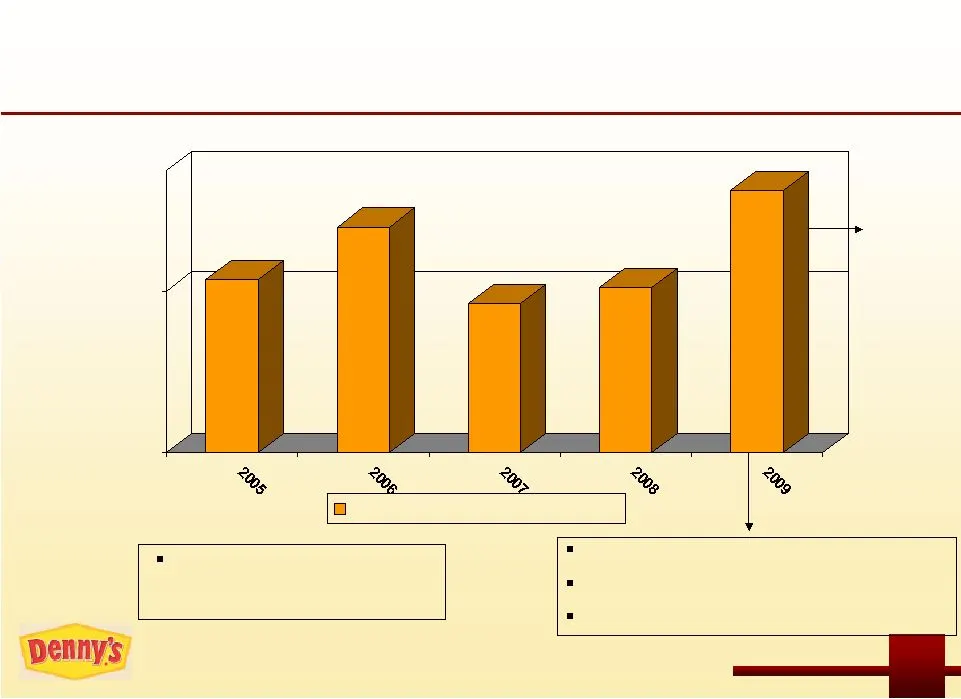
Net Income Trend is Up Note: Adjusted Income before tax is a non-GAAP measure that management believes best reflects on-going earnings due to the significant impact on our P&L from non-operating, nonrecurring and non cash items ($M) Volatility has been driven by the gain on sales of assets -40 -35 -
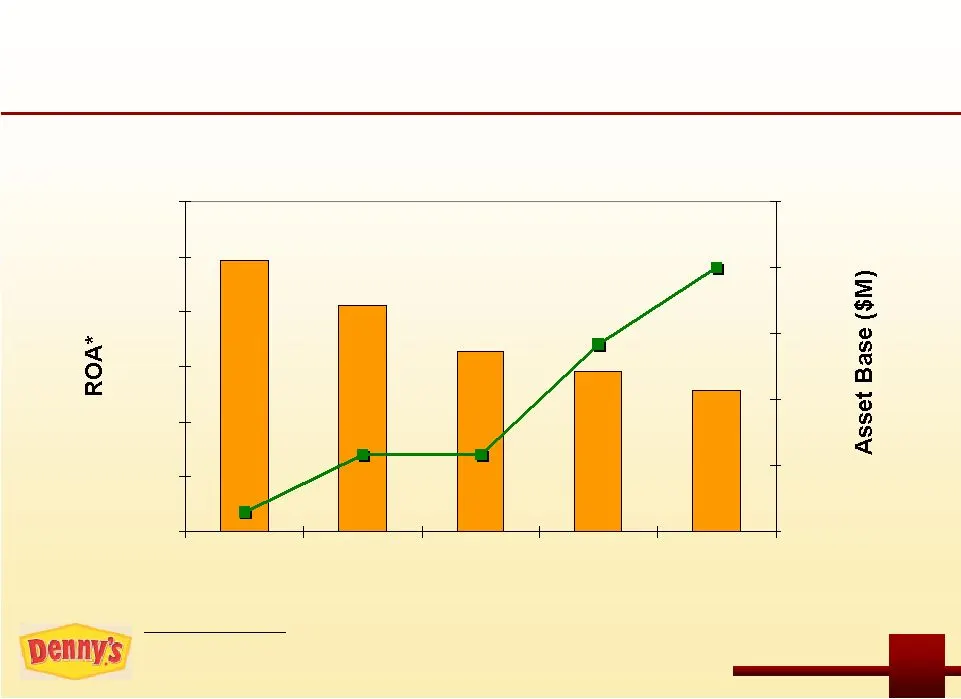
Slide 12: Return on Assets Improving
Return on Assets* Improving * Return on Assets (ROA) = LTM Adjusted Income Before Taxes divided by Total Assets at End of Period. Note: Adjusted Income before tax is a non-GAAP measure that management believes best reflects on-going earnings due to the significant impact on our P&L from non-operatin
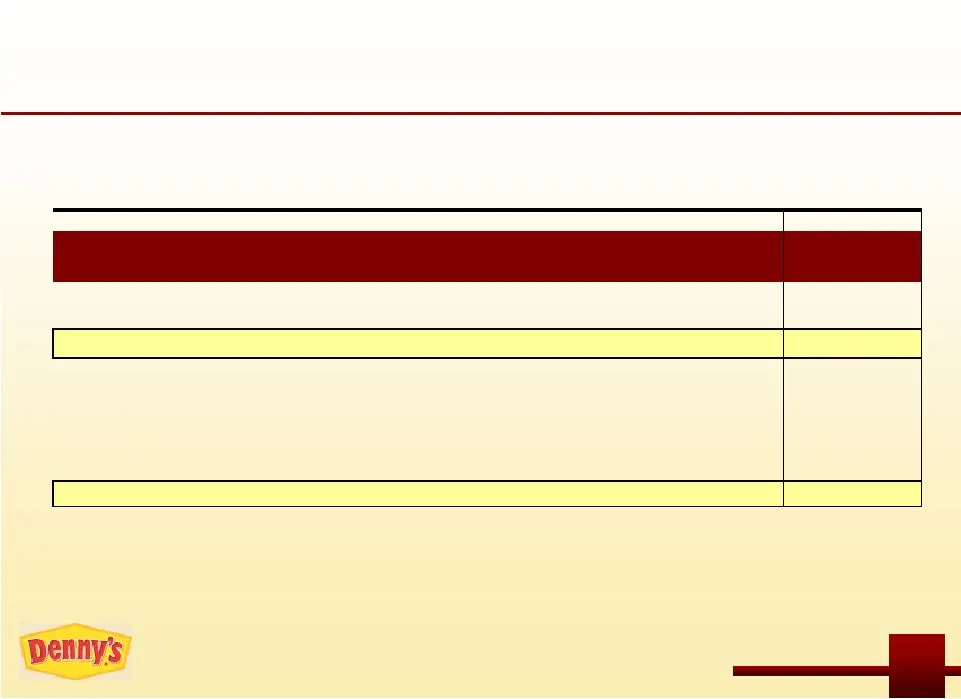
Slide 13: Emerging Model is Focused on Delivering Free Cash Flow
2005-2009 2005 2006 2007 2008 2009 Change Emerging Model is Focused on Delivering Free Cash Flow ($ in millions) Adjusted EBITDA (1) $107.6 $119.5 $92.9 $88.4 $85.2 ($22.4) Cash Interest Expense (48.2) (50.9) (38.5) (31.6) (29.3) +18.9 Cash Taxes (1.3) (1.3) (2.3) (1.1) (0.6) + 0.7 Capital Expenditu
Slide 14: Franchise Profit Contribution has Surpassed Company Restaurants
2006-2009 2006 2007 2008 Change 2009 Franchise Profit Contribution has Surpassed Company Restaurants ($ in millions) Equivalent Company Units -49% Co. Restaurant Profit $122.6 $98.7 $78.2 -42% Co. Restaurant Profit Margin 14% 12% 12% Equivalent Franchise Units 1,027 1,049 1,186 24% Franchise Profit
Slide 15: Meaningful Franchise Margin Being Captured
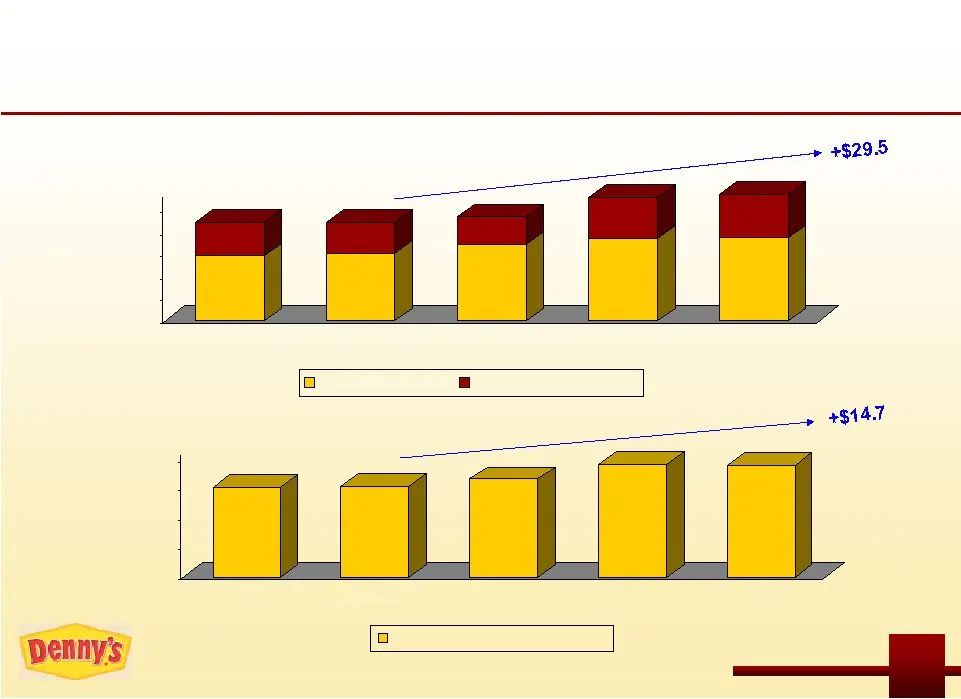
$30.8 $28.4 $25.3 $37.0 $43.5 ($ in millions) Meaningful Franchise Margin Being Captured $61.0 $61.8 $66.7 $77.1 $76.5 $0.0 $20.0 $40.0 $60.0 $80.0 Franchise Operating Margin $59.0 $61.3 $69.5 $75.0 $75.6 $0.0 $20.0 $40.0 $60.0 $80.0 $100.0 Royalties & Fees Occupancy Revenue
Slide 16: Denny's has a High Percentage of Franchise Units
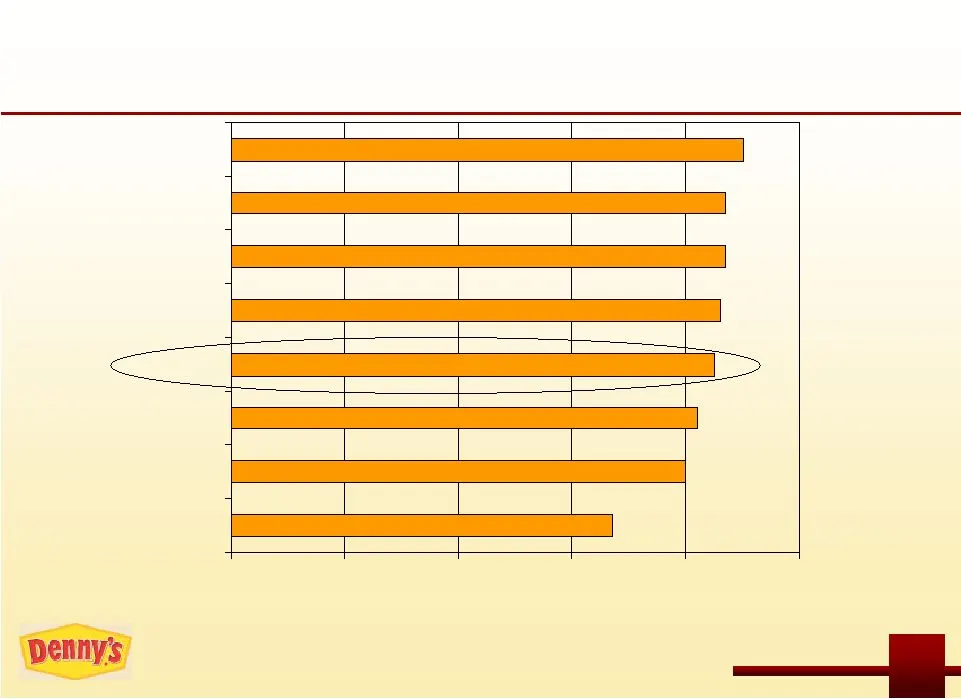
Denny’s has a High Percentage of Franchise Units Franchised Units, % of Total Units (2008) Source: NRN, YE2008, Denny’s YE2009 0% 20% 40% 60% 80% 100% CKR Sonic YUM Denny's Burger King McDonald's DineEquity Domino's
Slide 17: Company Margins Improving
Company Margins Improving Percent of Sales Cost containment and food margin focus Leverage from increased check average Sale of lower performing assets 2007 saw material cost pressures in minimum wages, commodities, and utilities 1.1ppts due to favorable Workers’ Compensation claims development 12.3
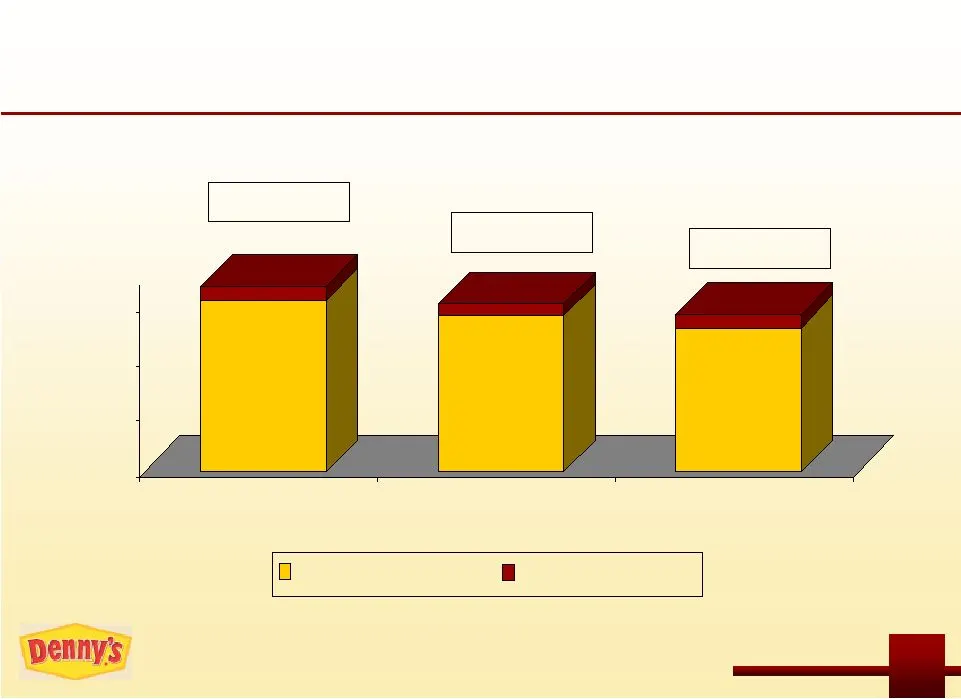
Slide 18: Franchised Focused Organization Resulting in a Reduction in G&A
$4.8 $4.1 $4.7 Franchised Focused Organization Resulting in a Reduction in G&A ($M) $67.4 $61.0 $57.3 $62.6 $56.9 $52.6 $0.0 $20.0 $40.0 $60.0 Other G&A Expenses Stock Based Comp
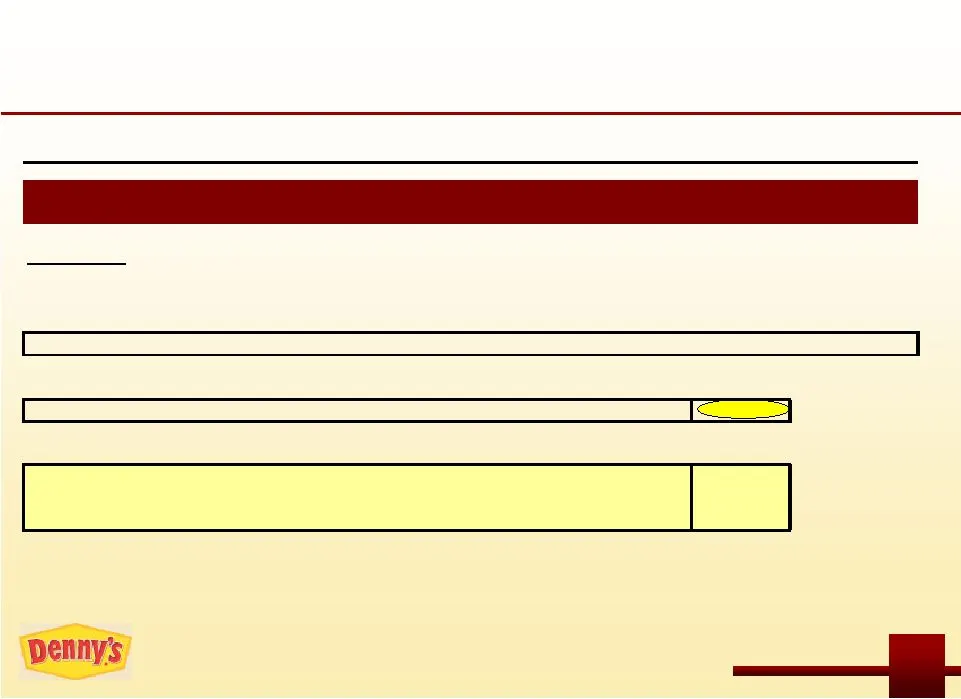
Slide 19: Significant Debt Reduction of $275 Million
2005-09 2005 2006 2007 2008 Change 2009 Significant Debt Reduction of $275 Million ($ in millions) Total Debt Credit Facility 342.8 245.6 152.5 126.7 (262.8) Capital Leases & Other 36.0 32.7 25.4 26.0 (12.3) Senior Notes 175.0 175.0 175.0 175.0 0.0 Total Funded Debt $553.8 $453.3 $353.0 $327.6 ($275
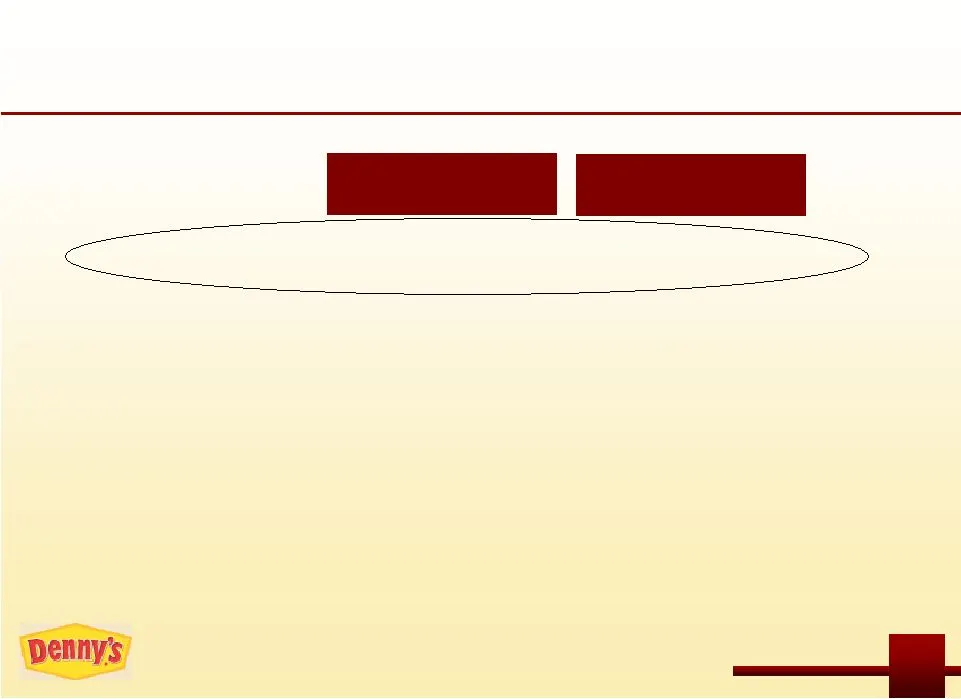
Slide 20: Paying Down Debt Driving Favorable Leverage
3.3x 3.3x 6.0x 1.3x Paying Down Debt Driving Favorable Leverage Comparisons • Denny’s • Cracker Barrel • DineEquity • Bob Evans Total Debt / LTM EBITDA Adjusted Debt / LTM EBITDAR Source: Bank of America, as of LTM 2/17/10. 3.8x 4.4x 6.4x 2.2x (1) See appendix for reconciliation of Net Income to LTM
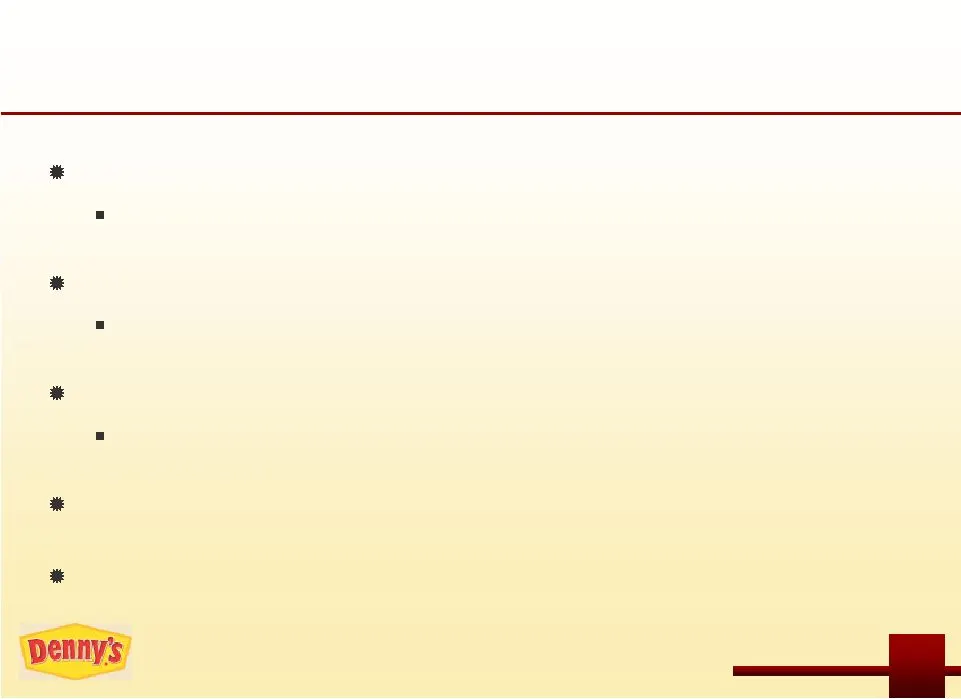
Slide 21: Sufficient Liquidity and No Near-Term Maturities
$50 Million Revolving Credit Facility Maturity December Revolver fully available with no current balance $80 Million Term Loan Maturity March 2012 Pre-paid by $180 million since origination in 12/06 $175 Million 10% Senior Notes Maturity October 2012 Callable as of 10/09 at 102.5 Credit Agreements P
Slide 22: Real breakfast 24/7
1 BOW id | Real breakfast 24/7. |
Slide 23: Aggressively Developing Programs to Spur Unit Development
Aggressively Developing Programs to Spur Unit Development The Franchise Growth Initiative The Market Growth Incentive Plan (MGIP) The New & Emerging Market Incentive Plan Travel Center relationships Franchisee commitments to build future restaurants ( 58 opened) Driving Sales on the Platforms of ‘Re
Slide 24: Stimulating Growth Through Unit Development
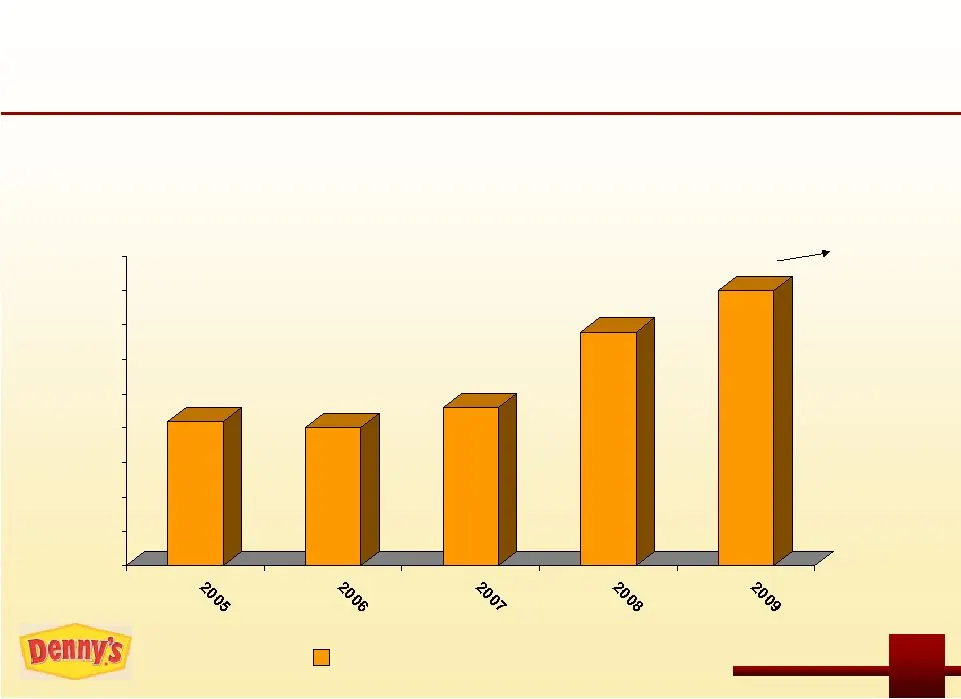
Stimulating Growth Through Unit Development Programs Most openings since 2001 Denny’s unit development has grown by 74% as compared to 2007 New Restaurant Openings
Slide 25: 95% of new Denny's units opened by franchisees
95% of new Denny’s units since the beginning of 2008 have been opened by franchisees Opened 39 new franchise restaurants LTM 4Q09 a 122% increase in franchise development compared with 2007 new franchisees have been brought into the system since 2007 Strong new franchisees have entered the Denny’s s
Slide 26: Denny's Opportunities
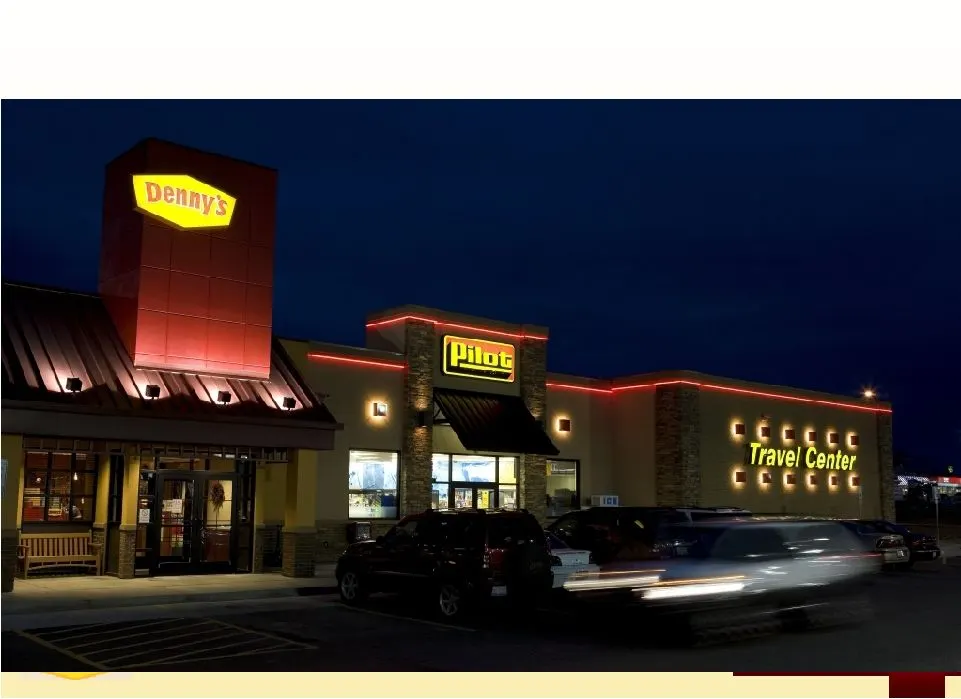
Denny’s Opportunities Markets (DMAs) Where Denny’s is Either not Present or Underdeveloped New York / Boston / Charlotte 6 in each Atlanta Nashville/ Cincinnati Travel Centers: 6 Denny’s units open with Pilot, the largest Travel Center operator in the US – Denny’s sales index above system averages R
Slide 27: First PILOT co-location in Mt. Vernon, Illinois
First PILOT co-location in Mt. Vernon, Illinois
Slide 28: Prototype Opened March 2008 and Ranks #1 - Lowest Cost
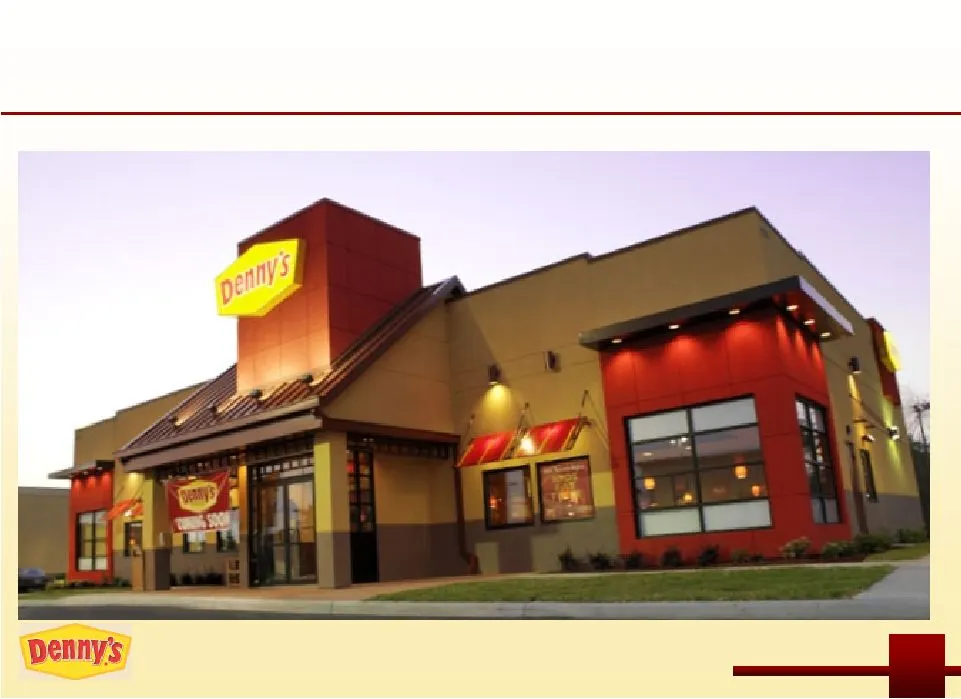
Prototype Opened March 2008 and Ranks #1* - Lowest Cost * Source: ‘Restaurant Research’ – Billion Dollar Restaurant Chain Data Report - New Build Costs * Lowest Cost in Family Segment
Slide 29: Denny's System Same-Store Sales Historically Outperform
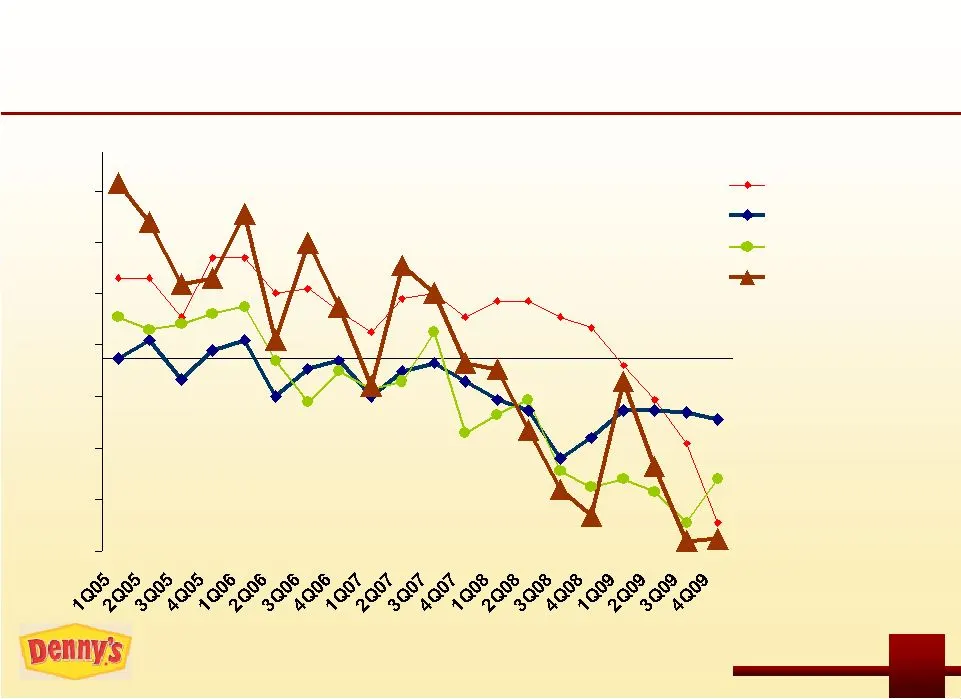
Denny’s System Same-Store Sales Historically Outperform Note: Industry data taken from published reports of 28 selected public restaurant chains (some averages and estimates are used). -7.5% -5.5% -3.5% -1.5% 0.5% 2.5% 4.5% 6.5% Quick-Service Midscale Casual Denny's System
Slide 30: Committed to Driving Sales
Committed to Driving Sales Compelling New Limited Time Only Products & Program Offerings Pipeline of new LTO entrees across all dayparts with a focus on breakfast Attractive Entry Prices and Value is a Critical Component Entry price points across all dayparts Regional value promotions supported by l
Slide 31: Current On-Air Module - Starting @ $4.99
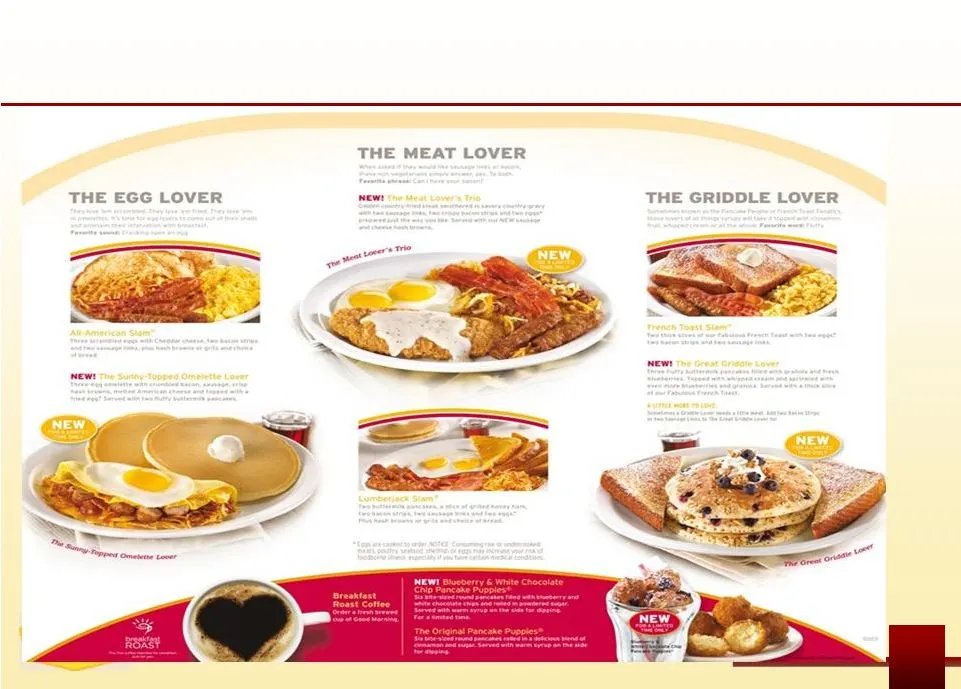
Current On-Air Module – Starting @ $4.99
Slide 32: Driving Incremental Revenue and Profit
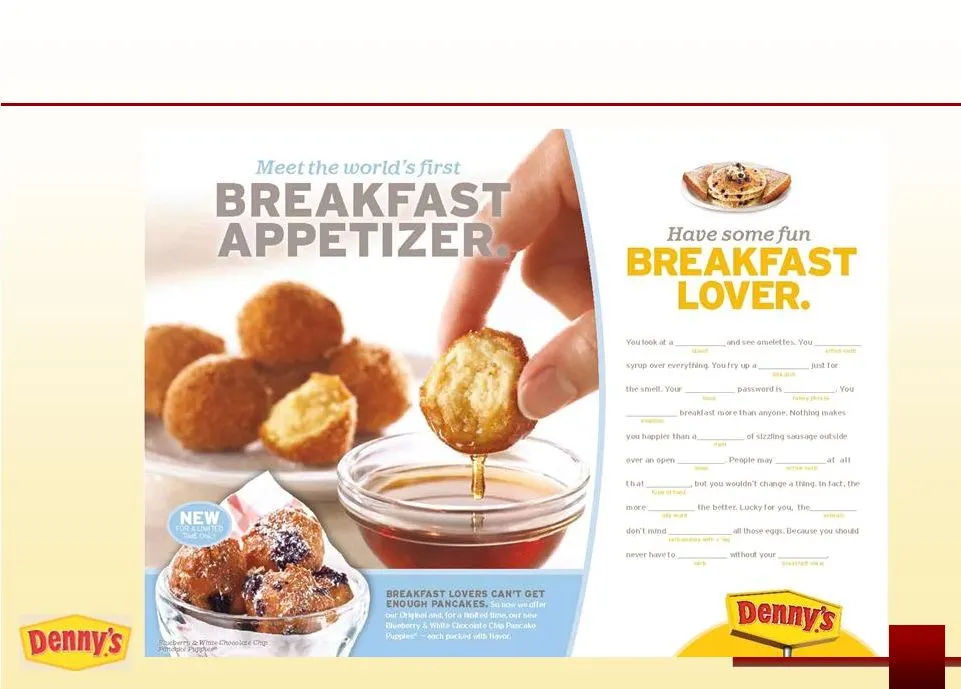
Driving Incremental Revenue and Profit Starting @ $1.99
Slide 33: Real breakfast 24/7
1 BOW id | Real breakfast 24/7. |
Slide 34: Denny's Investment Highlights
Denny’s Investment Highlights 1. Exceptional Brand Equity 2. Business Model Transformation On-Going 3. Unlocking Long-Term Growth 4. Significantly Improved Investment Thesis
Slide 35: Appendix
Appendix
Slide 36: Income and EBITDA Reconciliation
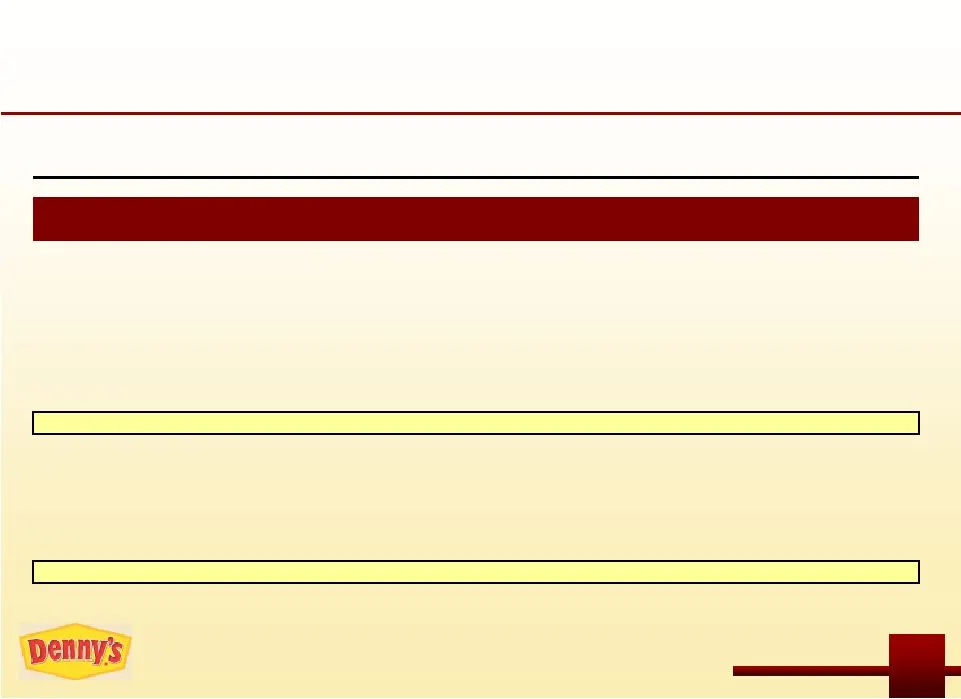
2005 2006 2007 2008 2009 Income and EBITDA Reconciliation ($ in millions) Net income (loss) ($7.3) $30.1 $31.4 $14.7 $41.6 Provision for income taxes 1.2 14.7 4.8 1.6 1.4 Operating gains, losses and other charges, net 3.1 (47.9) (31.1) (6.4) (14.5) Other nonoperating expense, net (0.6) 8.0 0.7 9.2 (
Slide 37: Selling Denny's Lower Performing Company Operating Units
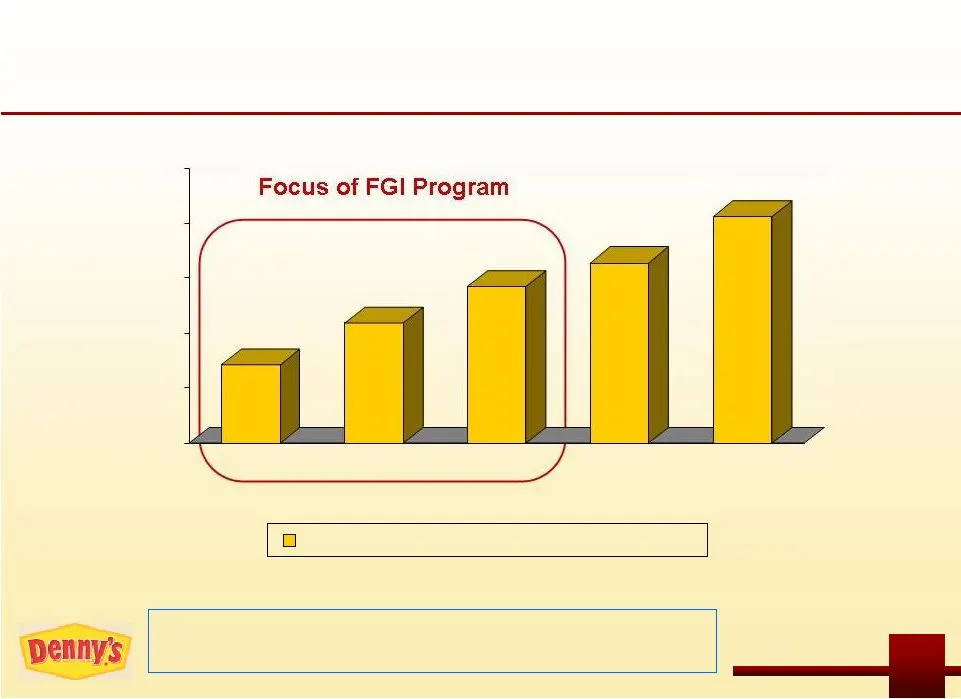
Selling Denny’s Lower Performing Company Operating Units 7.1% 10.9% 14.3% 16.4% 20.6% 0.0% 5.0% 10.0% 15.0% 20.0% 25.0% $1.2MM $1.4MM $1.6MM $1.8MM $2.4MM AUV in millions Company Restaurant Operating Margin Note: Each column represents 1/5 of the 520 company restaurants prior to the FGI program divi
Source: SEC EDGAR · DEFA14A filed Mar 19, 2010
More decks from Dennys Corp
 Investor Presentation (August 2025)30 slides · Aug 4, 2025
 Investor Presentation (May 2025)32 slides · May 2025
 Investor Presentation (February 2025)32 slides · February 2025
 Investor Presentation (January 2025)32 slides · Jan 13, 2025
 Investor Day (October 2024)137 slides · Oct 22, 2024
 Q2 2024 Earnings Presentation22 slides · Jul 30, 2024