National Penn Bancshares — KBW 2012 Boston Bank Conference
39 slides from National Penn Bancshares's conference presentation, Feb 29, 2012

Slide 1: National Penn Bancshares, Inc. (NPBC)
National Penn Bancshares, Inc. (NPBC) Strong, Clean, Efficient KBW 2012 Boston Bank Conference 4Q / Year-Ended 12.31.11

Slide 2: Safe Harbor Regarding Forward Looking Statements
Safe Harbor Regarding Forward Looking Statements This presentation contains forward-looking information about National Penn Bancshares, Inc. that is intended to be covered by the safe harbor for forward-looking statements provided by the Private Securities Litigation Reform Act of 1995. Forward-look

Slide 3: National Penn Snapshot
National Penn Snapshot l Founded 1874, headquartered in eastern PA l NASDAQ ticker: NPBC l Total assets: $8.5 billion l Branch offices: 122 l FTE employees: ~ 1,700 l Market cap*: $1.3 billion l Average daily trading volume (52 week)*: ~ 820,000 shares l One month average share price*: $8.89 l TBV m
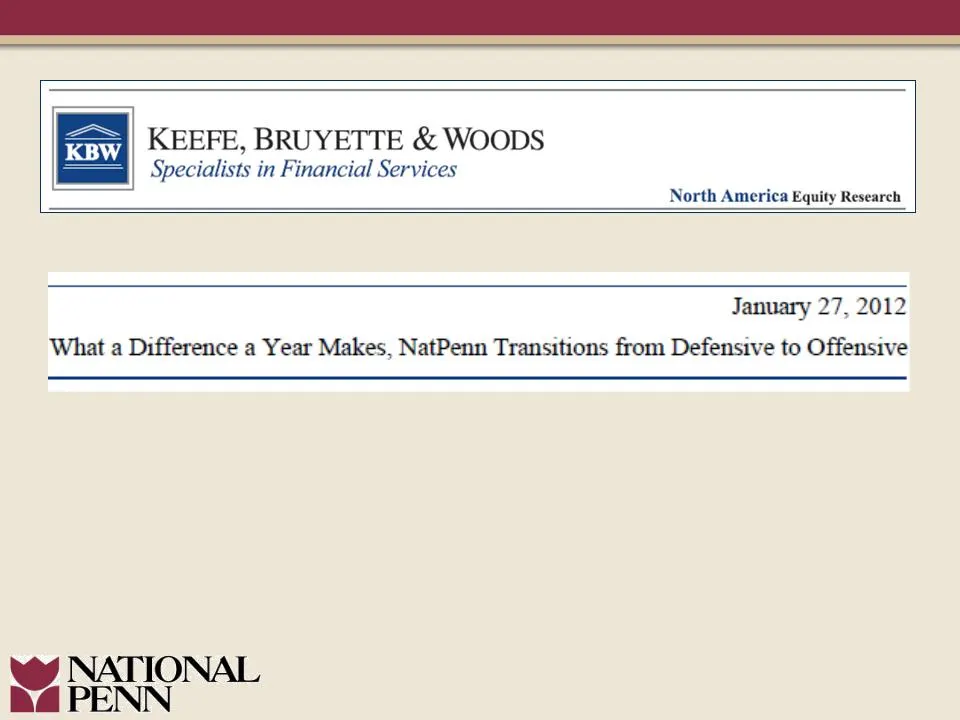
Slide 4: KBW Research: NatPenn Transitions from Defensive to Offensive
KEEFE, BRUYETTE & WOODS Specialists in Financial Services North America Equity Research January 27, 2012 What a Difference a Year Makes, NatPenn Transitions from Defensive to Offensive NATIONAL 4 PENN

Slide 5: 2011 was a year of solid financial performance
“ For National Penn, 2011 was a year of solid financial performance and accomplishments despite a still recovering economy. We executed our strategic initiatives, and as a result we remain strong, clean, and efficient and positioned for growth in 2012! ” - Scott V. Fainor, President and CEO

Slide 6: 2011 Strategic Accomplishments
2011 Strategic Accomplishments ü Restored core earnings power ü Restored strong asset quality ü Enhanced strong capital levels ü Enhanced strong risk management culture ü Increased common stock cash dividend three consecutive quarters
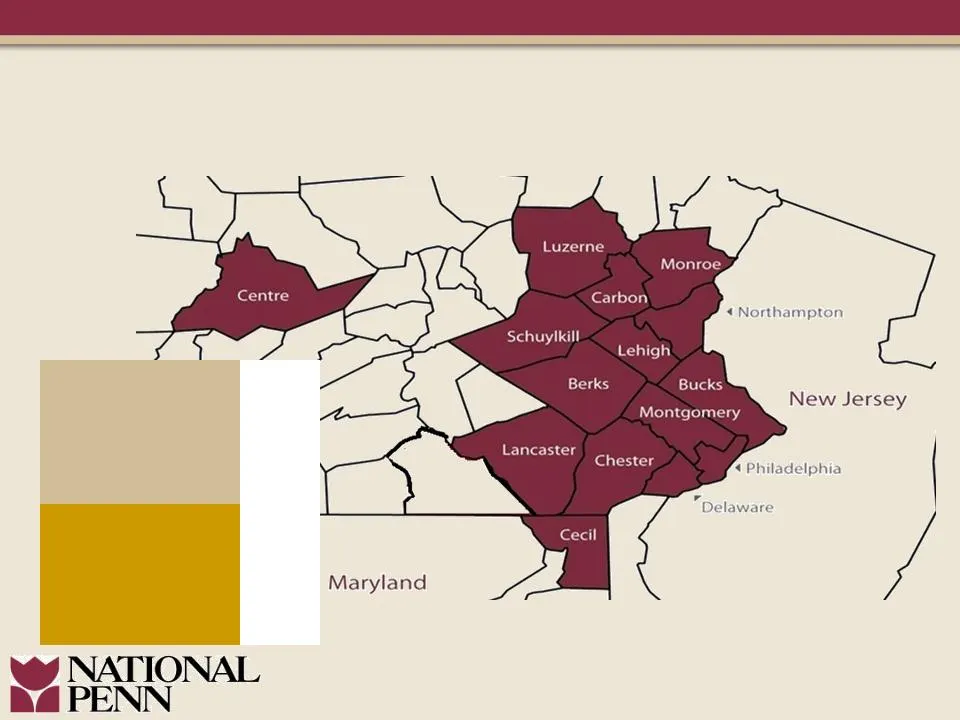
Slide 7: Concentrated Presence in Demographically Attractive Markets
5.99% 0.37% 5.08% 13.20% 0.55% 1.84% 8.88% 6.81% 8.90% 22.05% 1.82% 1.36% 1.20% 5.44% 16.52% NPBC Market Median HH Income* ($000) $63.5 Pennsylvania Median HH Income* ($000) $52.7 Nationwide Median HH Income* ($000) $54.4 NPBC Market Projected Income Growth* 14.2% Pennsylvania Projected Income Growt
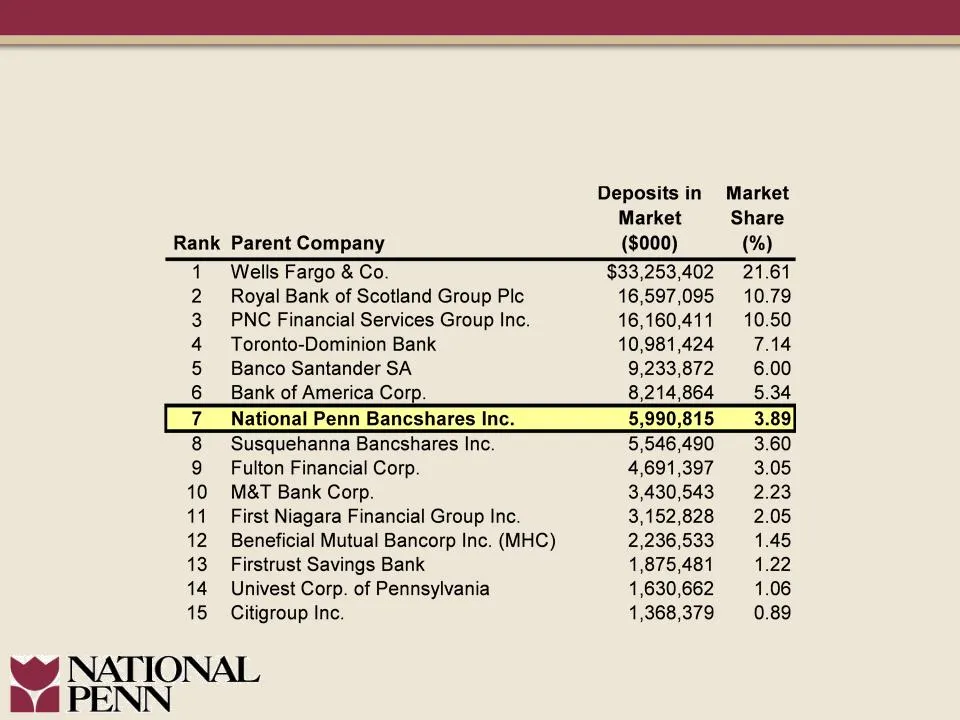
Slide 8: Market Disruption Opportunity
Source: SNL Financial / FDIC - pro-forma data as of June 30, 2011. Market Disruption Opportunity Deposit Market Share Analysis—Total NPBC PA Market Area (by County)
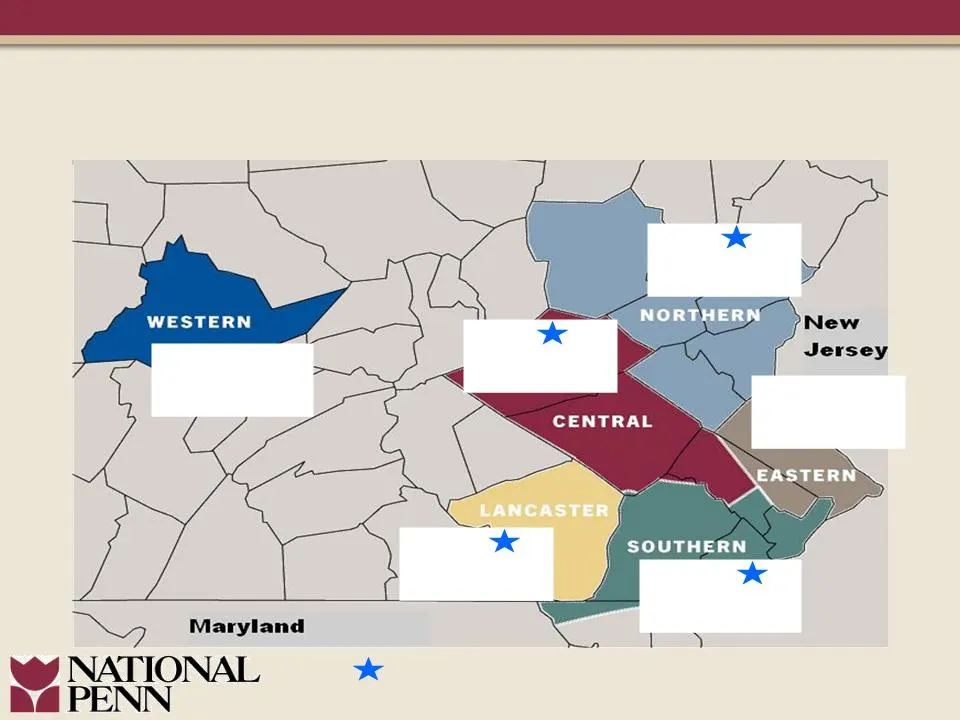
Slide 9: Regionally Positioned for Growth
Regionally Positioned for Growth Network of 122 Branch Offices L. Cyr l Commercial: 23 l Retail: 30 T. Jordan l Commercial: 13 l Retail: 3 S. Gamble l Commercial: 26 l Retail: 32 B. Rush l Commercial: 11 l Retail: 11 P. Gray l Commercial: 24 l Retail: 52 D. Richards l Commercial: 6 l Retail: 7 Regio
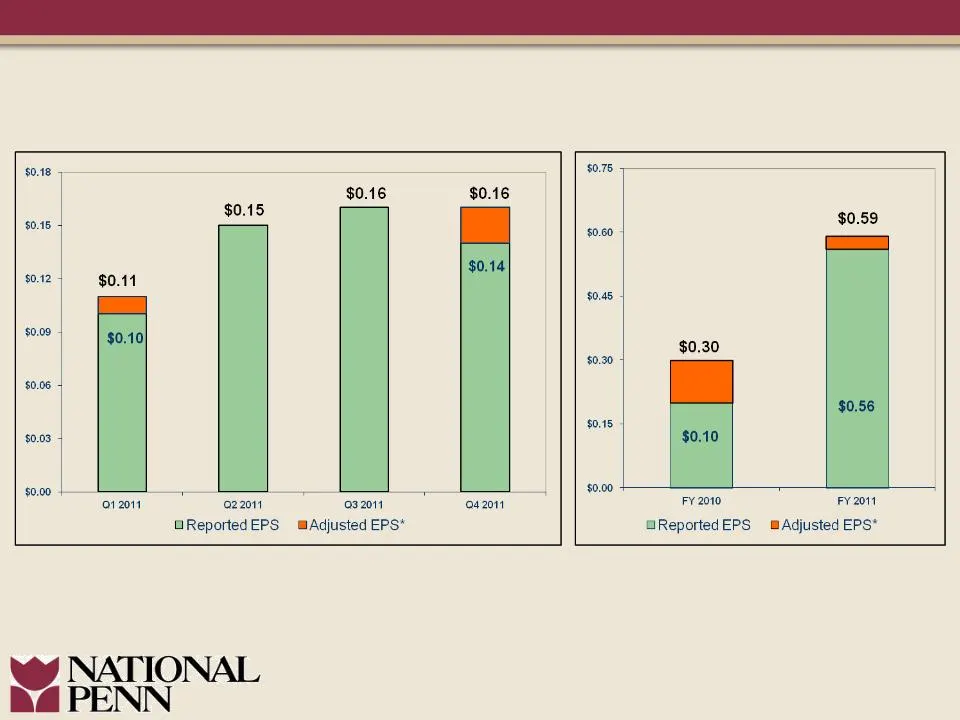
Slide 10: Positive Adjusted Earnings Per Share Trend
Positive Adjusted Earnings Per Share * Trend *Refer to Appendix for reconciliation of Non-GAAP measure. Quarterly Trend Full Year
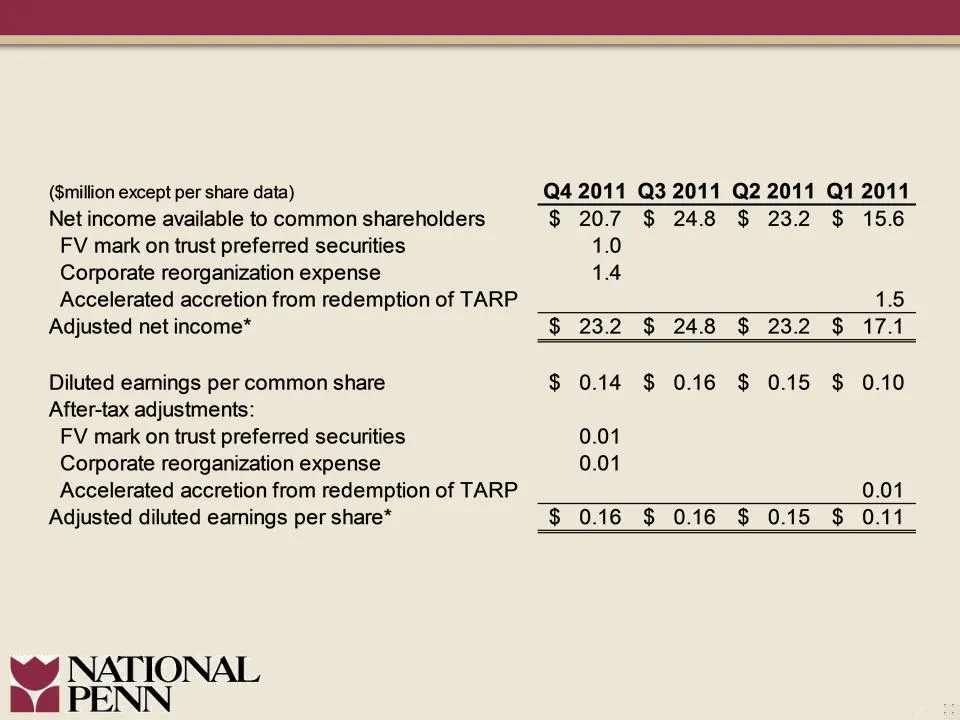
Slide 11: Consistent Quarterly Earnings
Consistent Quarterly Earnings *A non-GAAP measure.
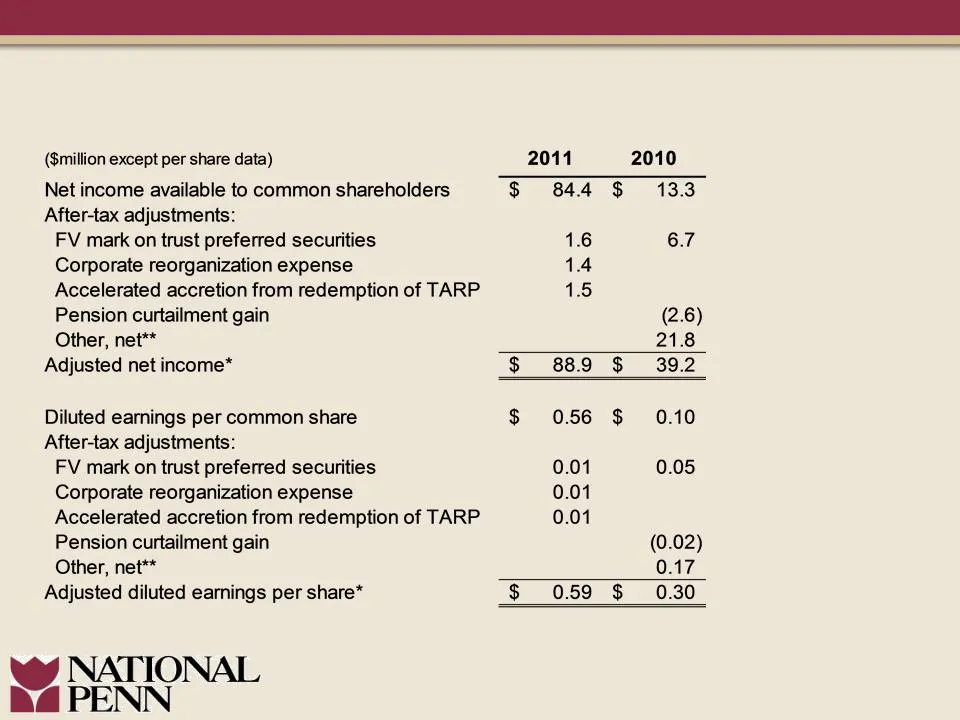
Slide 12: Improved Full Year Earnings
Improved Full Year Earnings *A non-GAAP measure. **Includes adjustments related to BOLI and Christiana Bank & Trust Company divestiture.
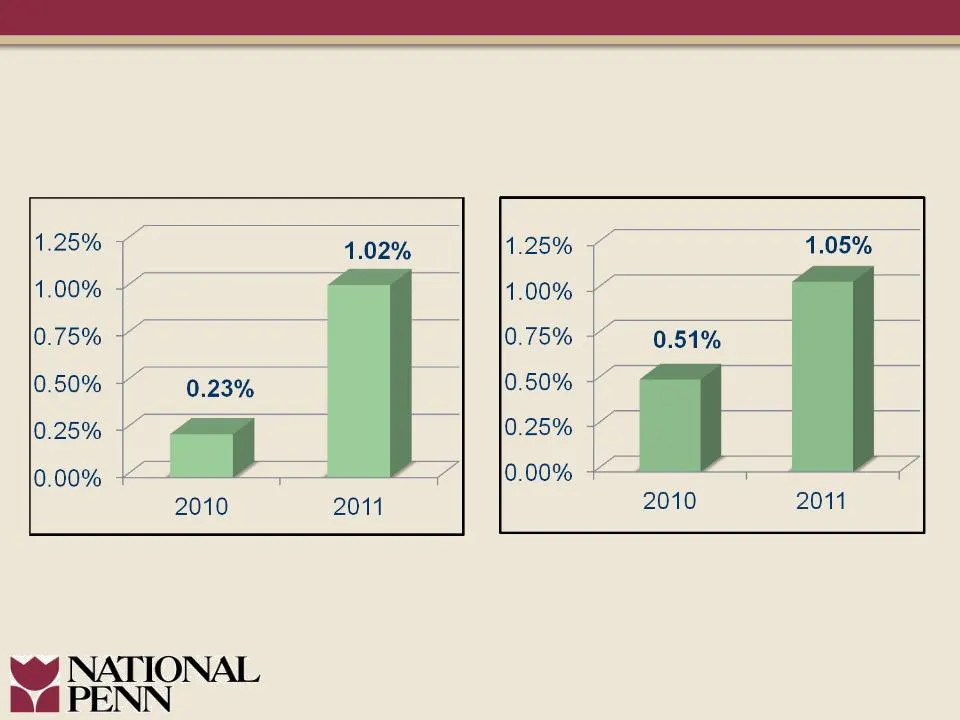
Slide 13: Improved Return on Assets
Improved Return on Assets Adjusted ROA * Reported ROA *Refer to Appendix for reconciliation of Non-GAAP measure.
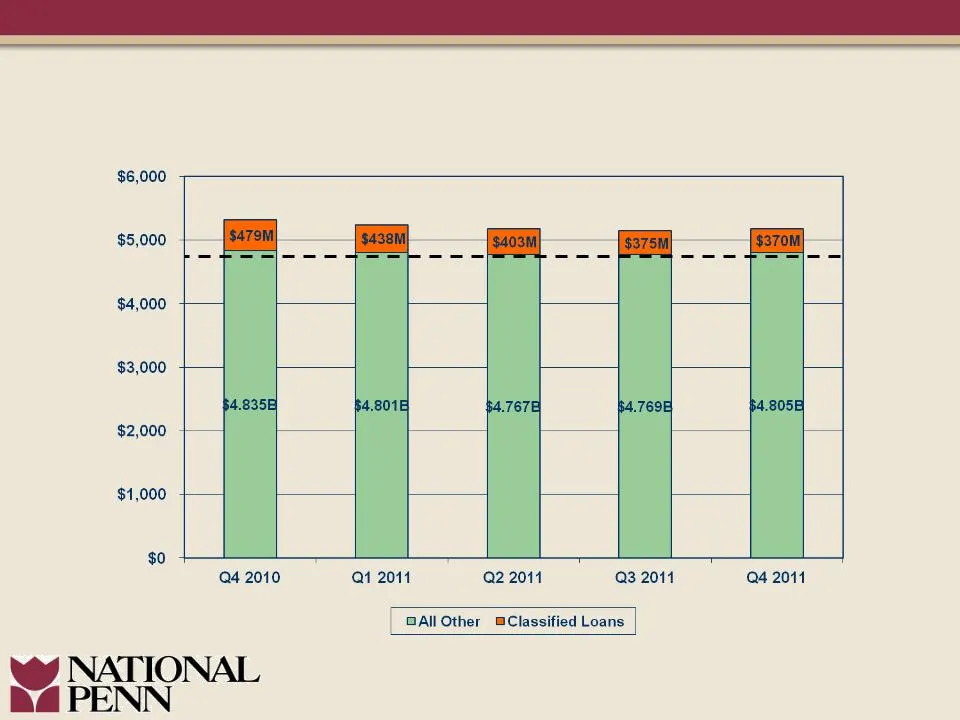
Slide 14: Loan Trends
Loan Trends ($million) Excludes loans held for sale.
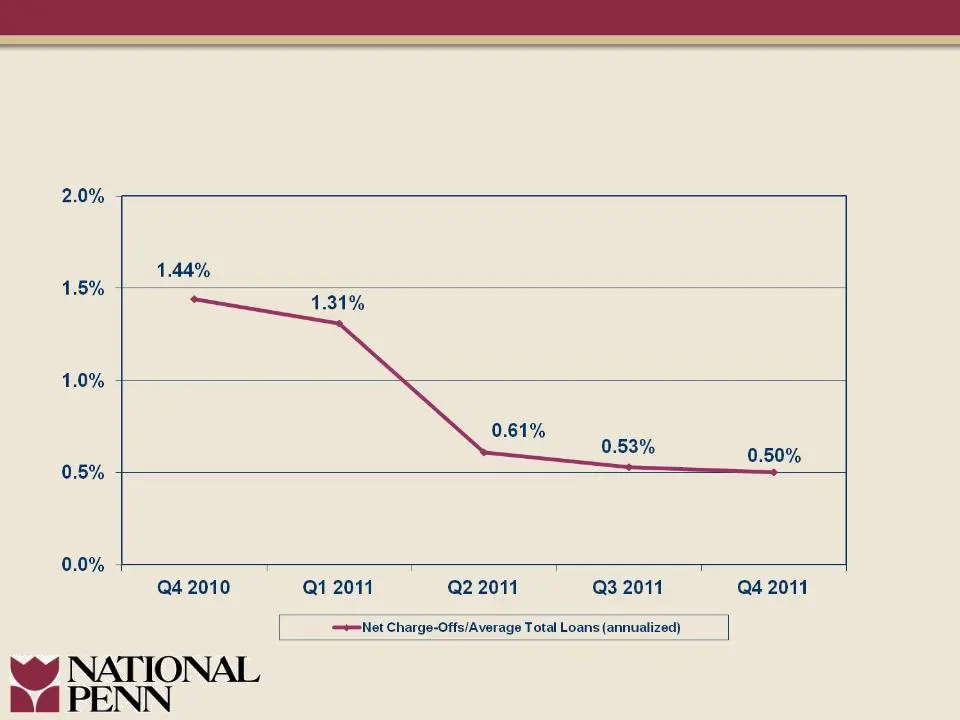
Slide 15: Sustained Asset Quality Improvement
Sustained Asset Quality Improvement Net Charge-Offs/Average Loans
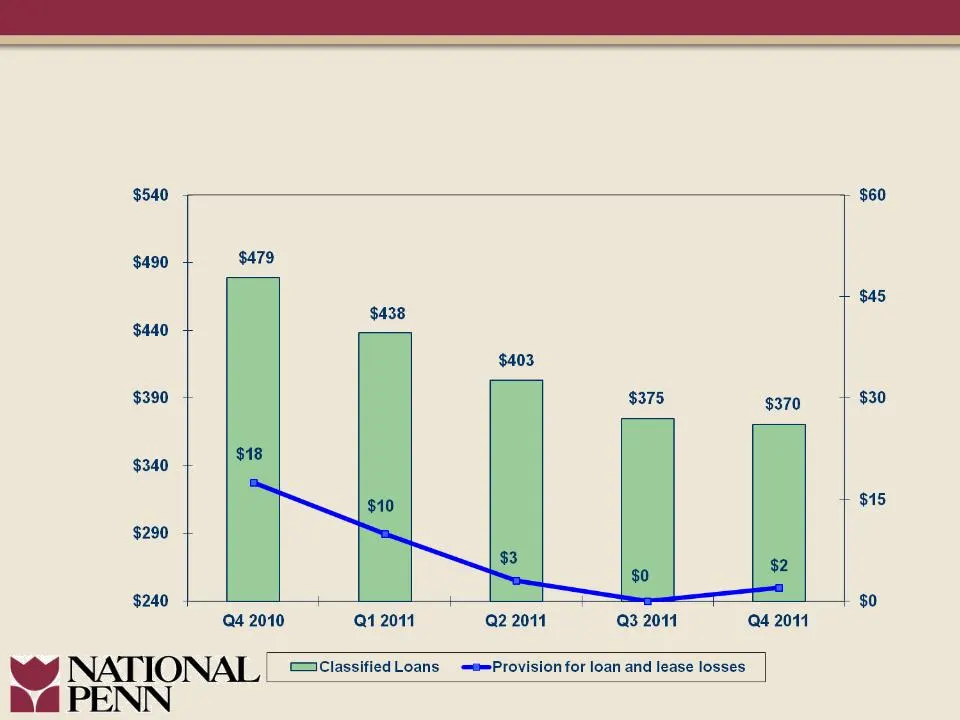
Slide 16: Sustained Asset Quality Improvement
Sustained Asset Quality Improvement Classified Loans & Provision Trends ($million) ($million)
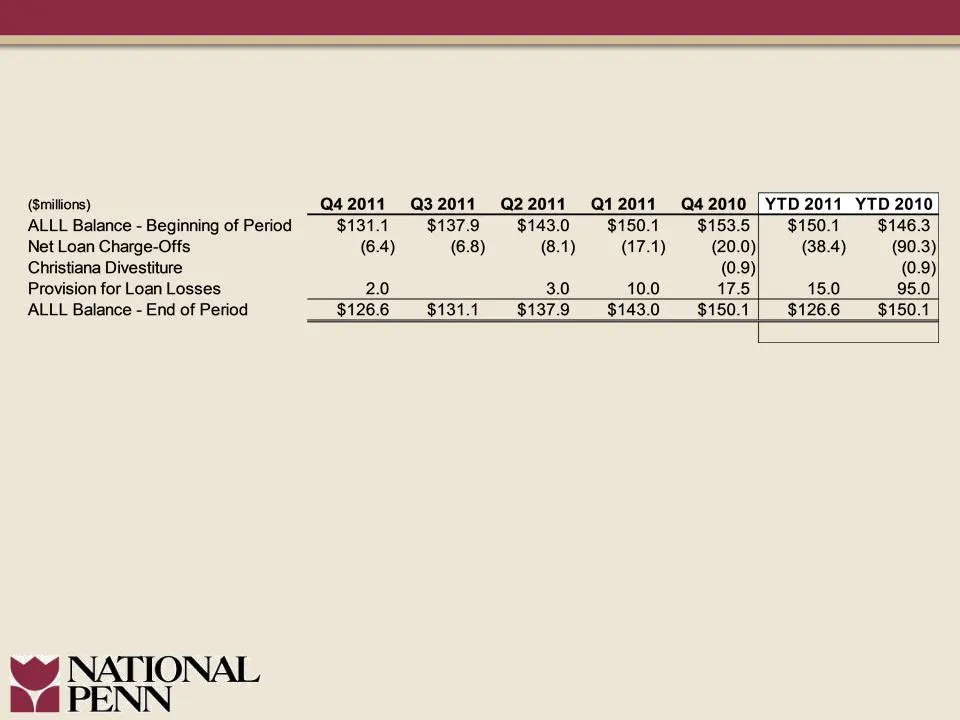
Slide 17: Allowance for Loan Losses Rollforward
(Smillions) ALLL Balance - Beginning of Period Net Loan Charge-Offs Christiana Divestiture Provision for Loan Losses ALLL Balance - End of Period NATIONAL PENN Q4 2011 Q32011__Q22011 _Q12011 _Q4.2010 [YTD 2011 YTD 2010 $131.1 $1379 $1430 $1501 $1535|[ $150.1 $1463 (6.4) (6.8) (8.1) (17.1) (20.0))_ ~
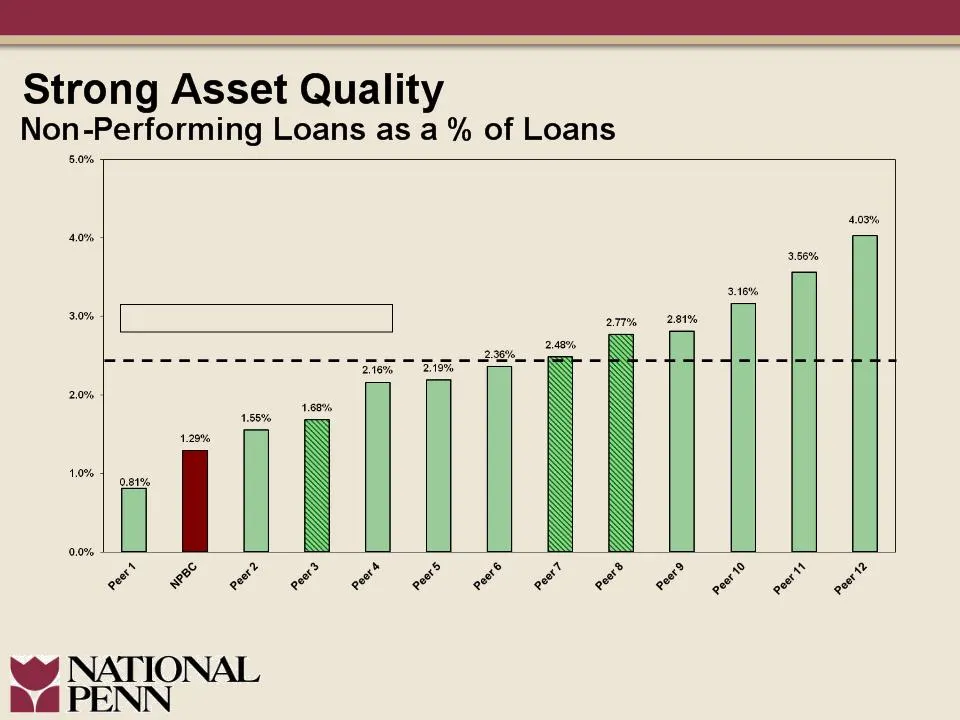
Slide 18: Non-Performing Loans vs. Peers
-----MRQ Peer Average = 2.46% NPL’s include non-accrual loans plus renegotiated loans. Peer data per SNL Financial and company earnings reports as of most recent quarter (MRQ) available (striped columns represent data as of 9/30/11; all other columns are as of 12/31/11). Refer to the Appendix within
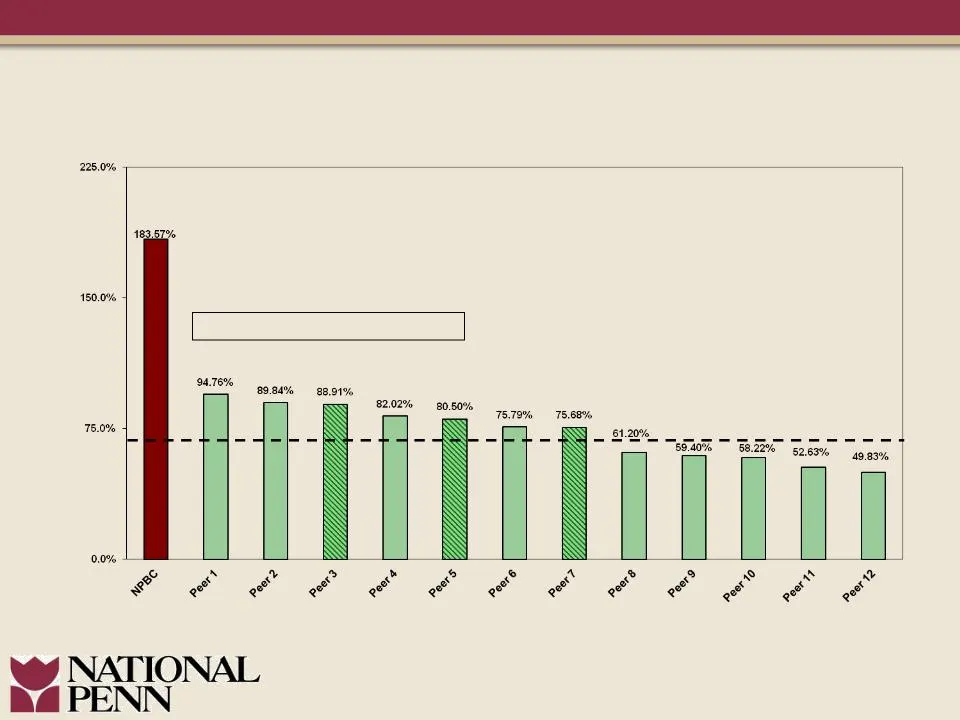
Slide 19: Strong Reserve Coverage
Strong Reserve Coverage ALLL as a % of Non-Performing Loans -----MRQ Peer Average = 72.40% NPL’s include non-accrual loans plus renegotiated loans. Peer data per SNL Financial and company earnings reports as of most recent quarter (MRQ) available (striped columns represent data as of 9/30/11; all ot
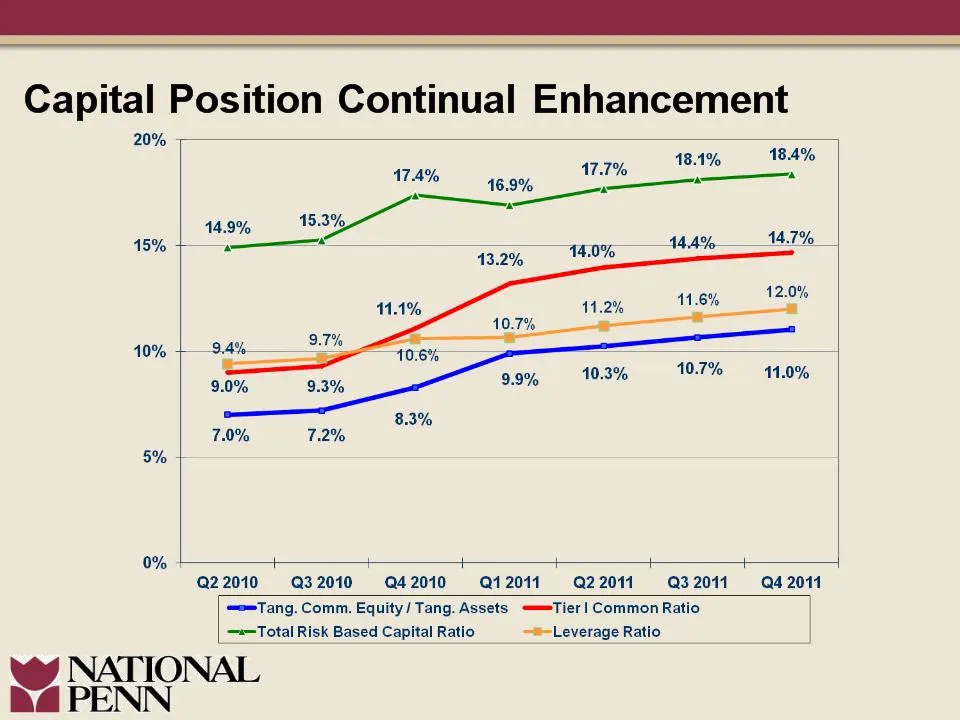
Slide 20: Capital Position Continual Enhancement
Capital Position Continual Enhancement 20% 18.1% 18.4% 174% 7.1% 15% 10% + 5% 0% + Q22010 Q32010 42010 12011 22011 = Q32011 a4 2011 —=Tang. Comm. Equity/Tang. Assets. —=Tier! Common Ratio =Total Risk Based Capital Ratio —=-Leverage Ratio NATIONAL M4 PENN
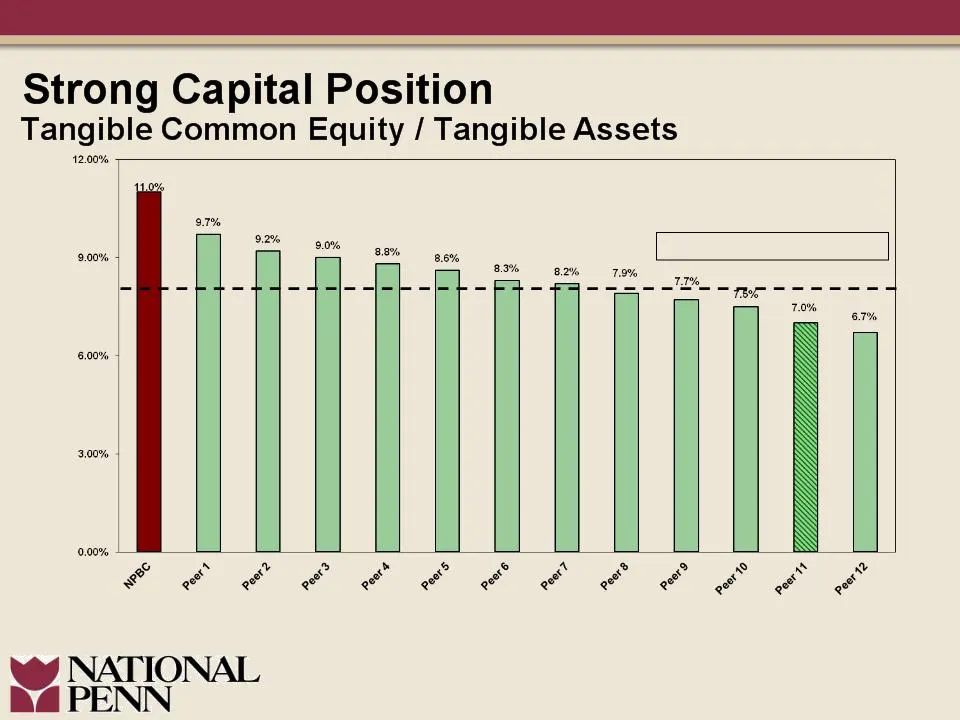
Slide 21: Capital Ratio vs. Peers
-----MRQ Peer Average = 8.2% Peer data per SNL Financial as of most recent quarter (MRQ) available (striped columns represent data as of 9/30/11; all other columns are as of 12/31/11). Refer to the Appendix within this presentation for 2009 proxy peer listing.
Slide 22: Capital Ratio vs. Peers
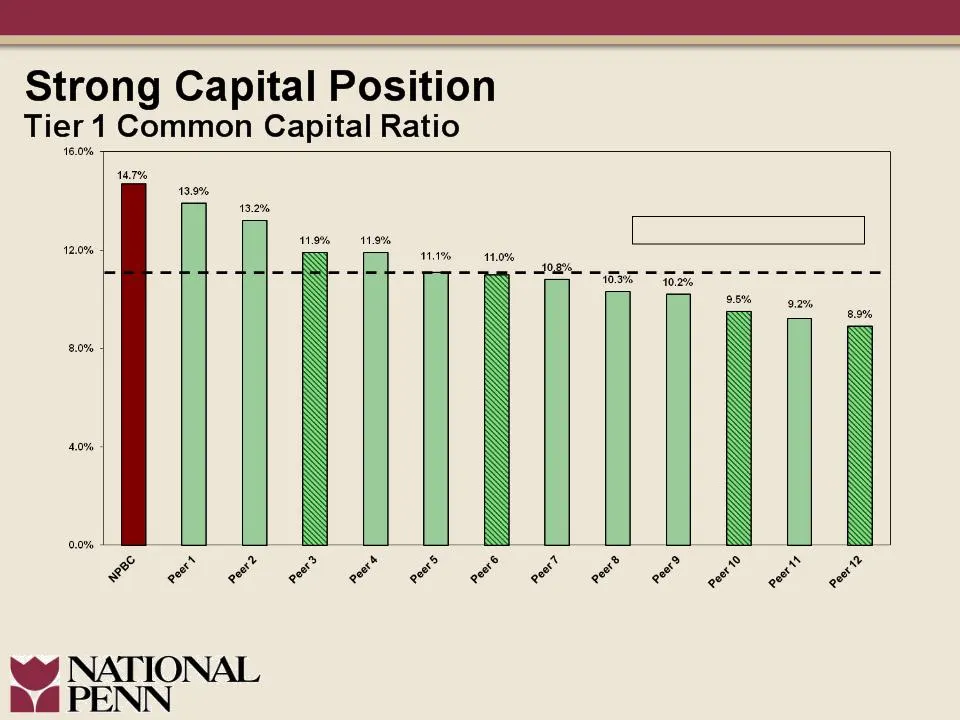
-----MRQ Peer Average = 11.0% Peer data per SNL Financial as of most recent quarter (MRQ) available (striped columns represent data as of 9/30/11; all other columns are as of 12/31/11). Refer to the Appendix within this presentation for 2009 proxy peer listing.
Slide 23: Enhance Shareholder Value Through Capital Management Opportunities
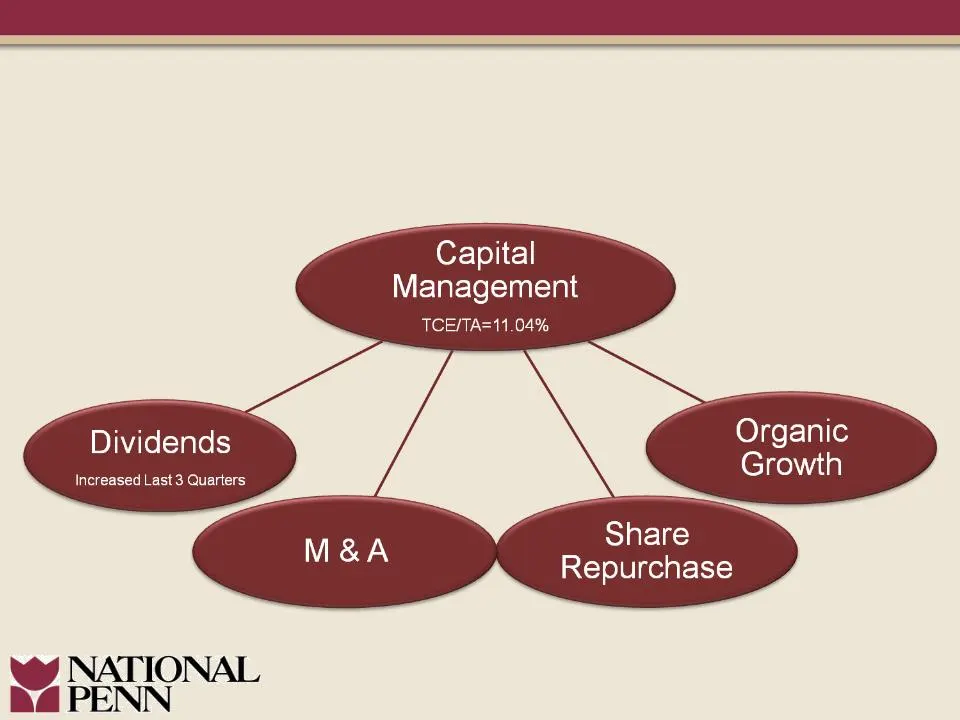
Enhance Shareholder Value Through Capital Management Opportunities

Slide 24: Strategic Acquisition Considerations
Strategic Acquisition Considerations • Relevant size • Relative risk • Operating leverage • Franchise value
Slide 25: Deposit Mix: Transaction and Time Deposits
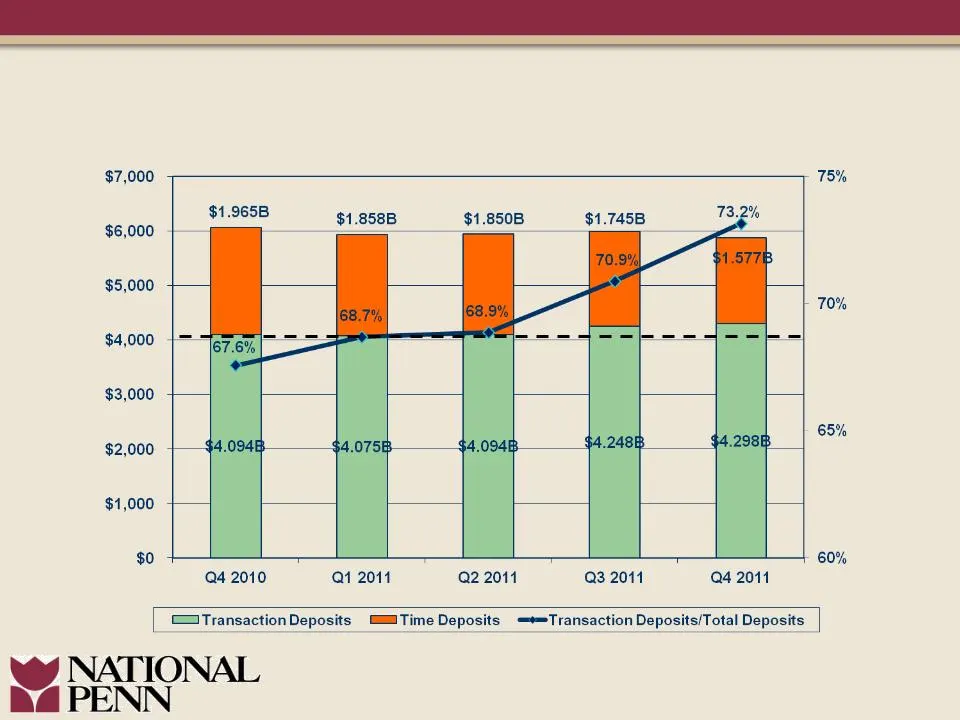
$7,000 75% $6,000 $1.858B $1.850B $1.745B $5,000 70% $4,000 $3,000 65% $2,000 $1,000 $0 60% Q4 2010 Q1 2011 Q2 2011 Q3 2011 Q4 2011 | =TransactionDeposits GEATime Deposits —-=Transaction Deposits/Total Deposits
Slide 26: Net Interest Margin
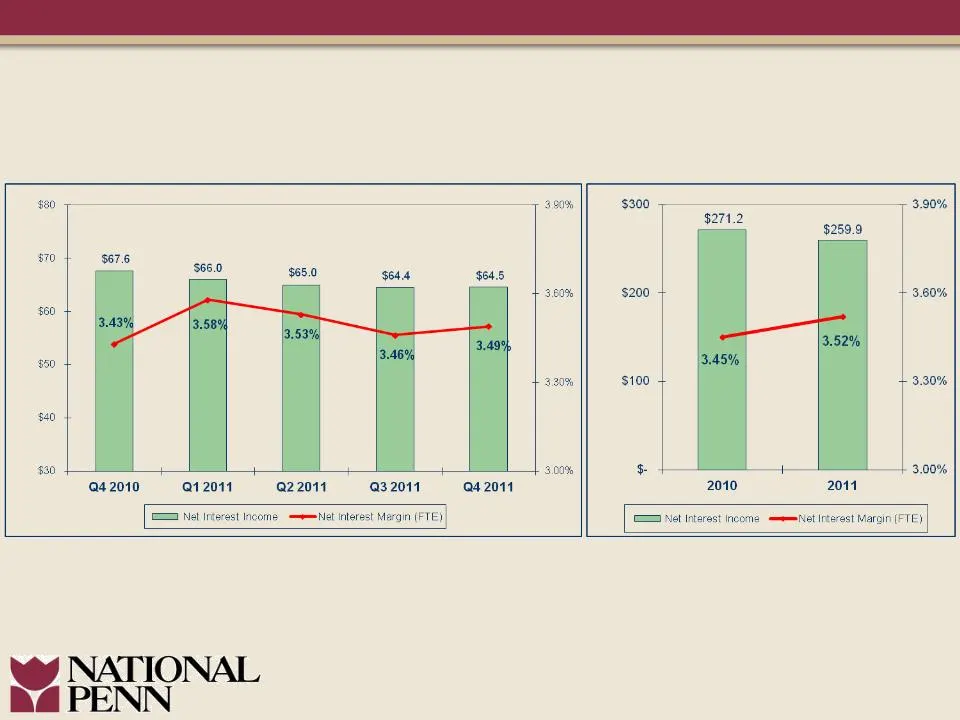
Net Interest Margin ($million) ($million)

Slide 27: Net Interest Margin Drivers
Net Interest Margin Drivers • Economic conditions § Loan growth • Extended low interest rate environment § Deposit re-pricing § Prepayment speeds § Redeployment rates
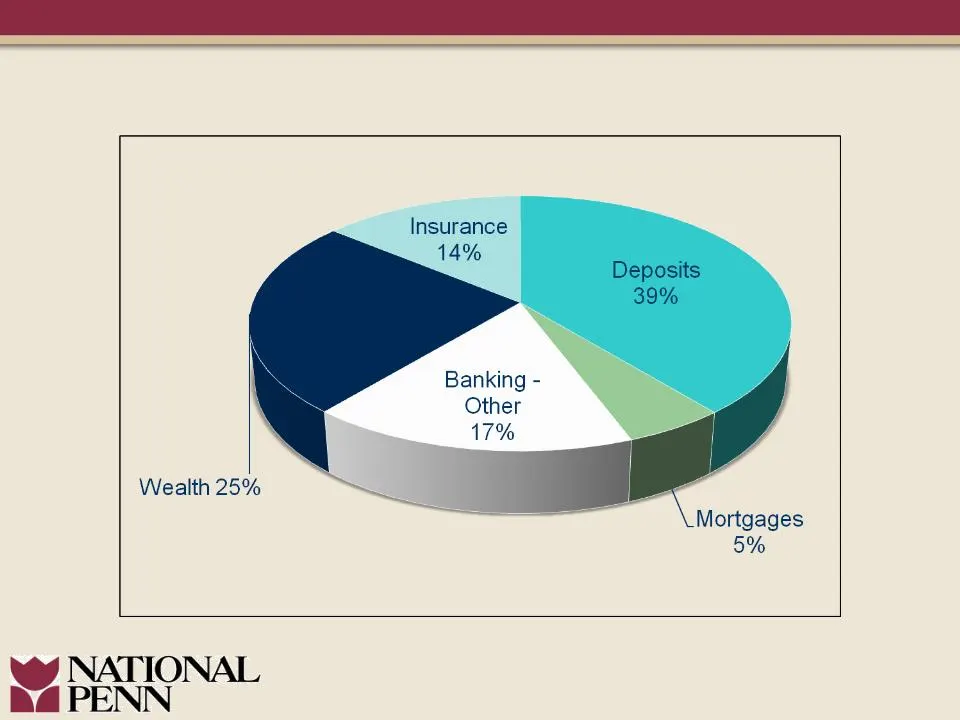
Slide 28: 2011 Core Non-Interest Income Mix
2011 Core Non-Interest Income* Mix *Refer to “Non-Interest Income” slide for reconciliation of Non-GAAP measure.
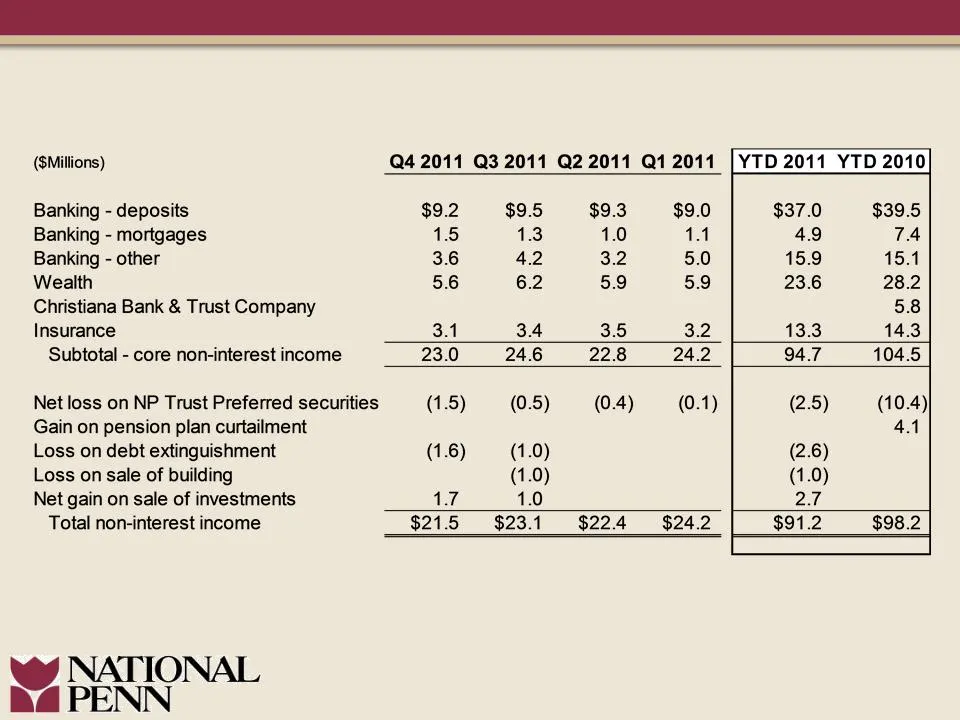
Slide 29: Non-Interest Income
($Millions) Q4 2011 Q3 2011 Q2 2011 Q1 2011 | YTD 2011 YTD 2010 Banking - deposits $9.2 $9.5 $9.3 $9.0 $37.0 $39.5 Banking - mortgages 15 1.3 1.0 1.1 49 74 Banking - other 3.6 42 32 5.0 15.9 15.1 Wealth 5.6 6.2 5.9 5.9 23.6 28.2 Christiana Bank & Trust Company 5.8 Insurance 3.1 3.4 3.5 3.2 13.3 14.3
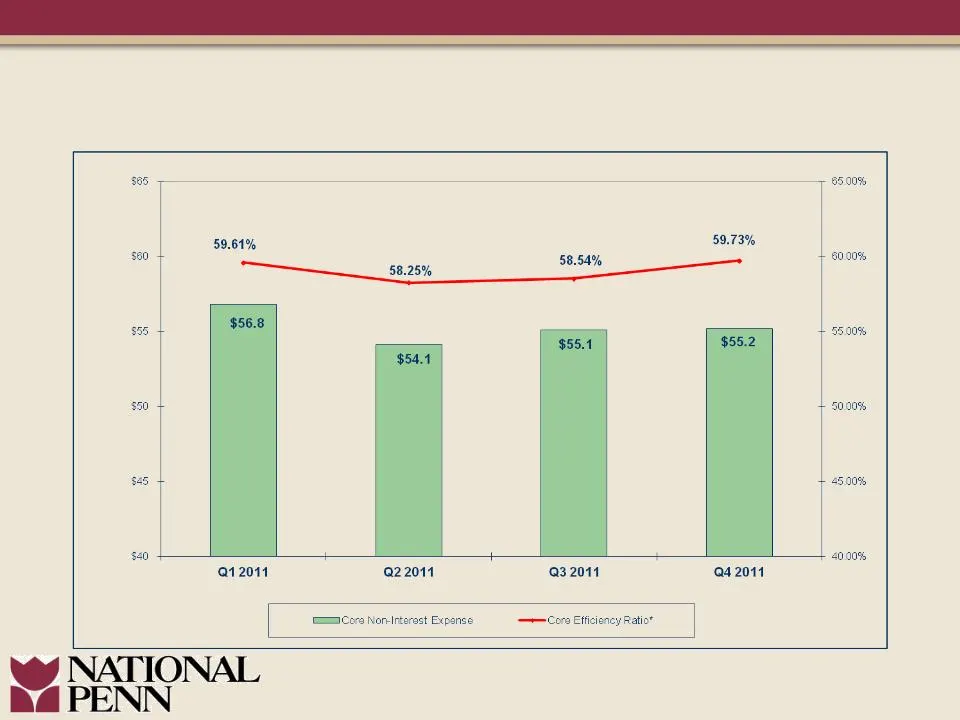
Slide 30: Expense Management Maintained
Expense Management Maintained ($million) *Refer to Appendix for reconciliation of Non-GAAP measure.

Slide 31: Delivering on Strategic Objectives
Delivering on Strategic Objectives ü Completed Warburg Pincus Investment § $150 million investment completed January 7, 2011 § At market price with no equity enhancements ü Repaid TARP in-full ü Redeemed TARP warrants ü Enhanced strength of the balance sheet § De-risked balance sheet § Enhanced capi

Slide 32: Enhancing Shareholder Value
• Generate quality loan growth - win market share • Manage net interest margin during low interest rate environment • Continue to focus on efficiencies • Maintain strong asset quality • Prudently manage capital Enhancing Shareholder Value

Slide 33: Investment Considerations
Investment Considerations ü Transparency ü Level of accountability ü Patient and disciplined approach ü “Option rich” position for the future

Slide 34: National Penn
NATIONAL 4 PENN
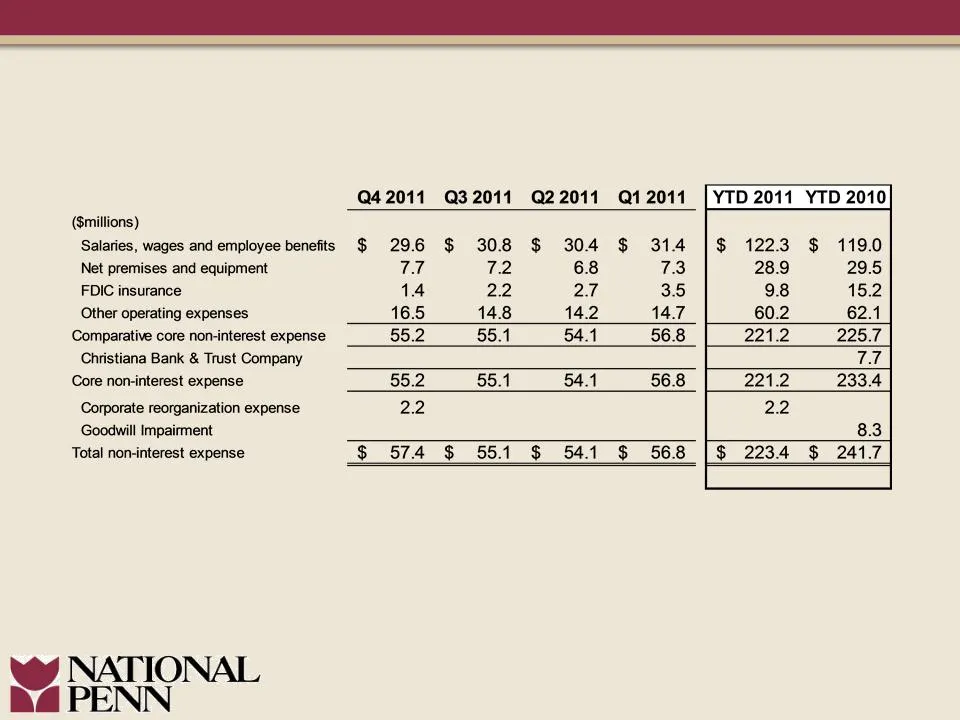
Slide 35: Non-Interest Expense
Q4 2011 Q32011 Q22011 Q12011 | YTD 2011 YTD 2010 (Smillions) Salaries, wages and employee benefits $ 296 $ 308 $ 304 $ 314 |$ 1223 $ 119.0 Net premises and equipment 77 72 68 73 28.9 29.5 FDIC insurance 14 22 PAYS 3.5 9.8 15.2 Other operating expenses 16.5 14.8 14.2 147 60.2 62.1 Comparative core no
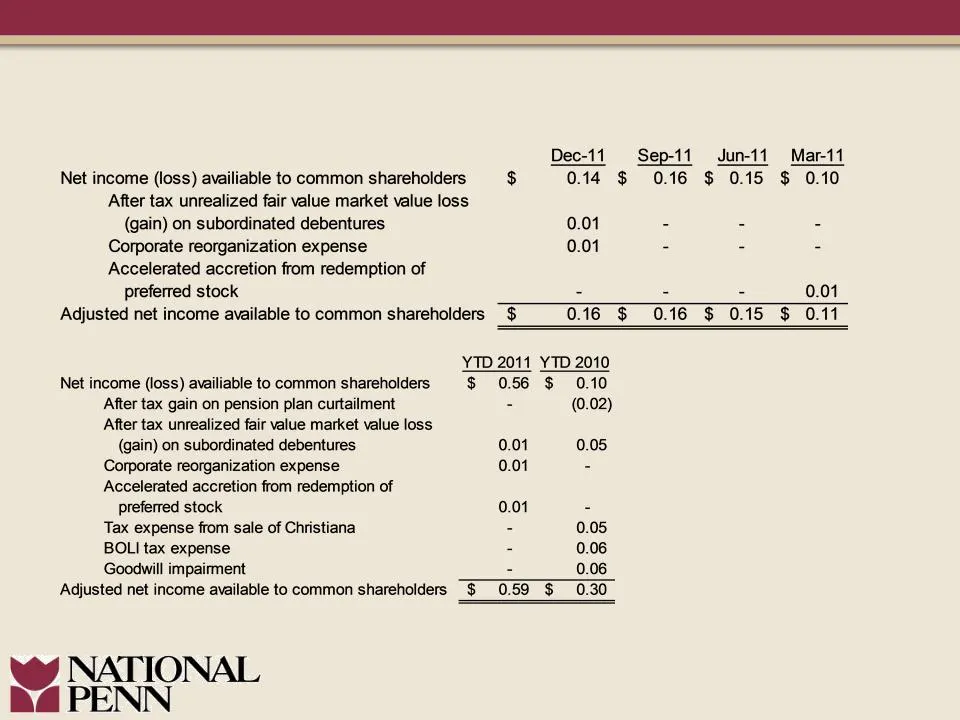
Slide 36: Reconciliation of Non-GAAP Measures
Reconciliation of Non-GAAP Measures
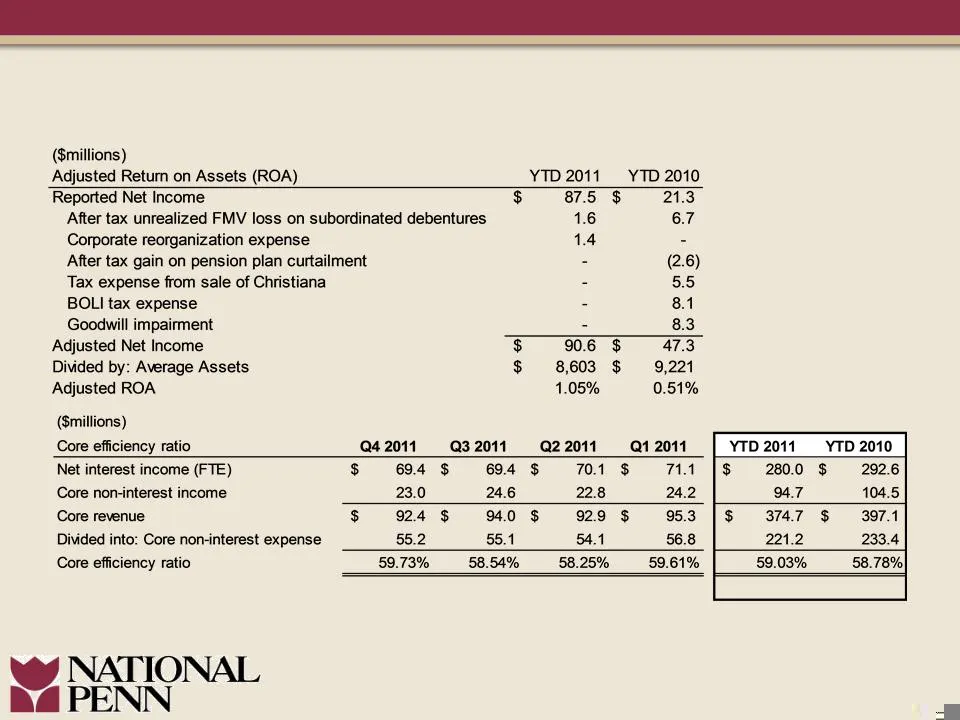
Slide 37: Reconciliation of Non-GAAP Measures
Reconciliation of Non-GAAP Measures

Slide 38: NPBC Peer Data - 2009 Proxy Statement
Peer Ticker Assets as of 12/31/11 (billions) BancorpSouth, Inc. BXS $13.0 F.N.B Corporation FNB 9.8 First Midwest Bancorp, Inc. FMBI 8.0 First Niagara Financial Group, Inc. FNFG 32.8 FirstMerit Corporation FMER 14.4 Fulton Financial Corporation FULT 16.4 MB Financial, Inc. MBFI 9.8 Old National Banc

Slide 39
Source: SEC EDGAR · 8-K filed Feb 29, 2012
More decks from National Penn Bancshares
 BB&T Global Financial Services Conference (September 2015)33 slides · Sep 16, 2015
 Merger or Acquisition (August 2015)13 slides · Aug 18, 2015
 Q2 2015 Earnings Presentation17 slides · Jul 23, 2015
 Q1 2015 Earnings Presentation18 slides · Apr 24, 2015
 Investor Presentation (February 2015)36 slides · Feb 11, 2015
 Q4 2014 Earnings Presentation16 slides · Jan 22, 2015