Dennys — Investor Presentation (October 2019)
41 slides from Dennys's investor presentation, Oct 30, 2019
Slide 1: Investor Presentation November and December 2019
INVESTOR PRESENTATION November and December 2019
Slide 2: Forward-Looking Statements and Non-GAAP Financial Measures
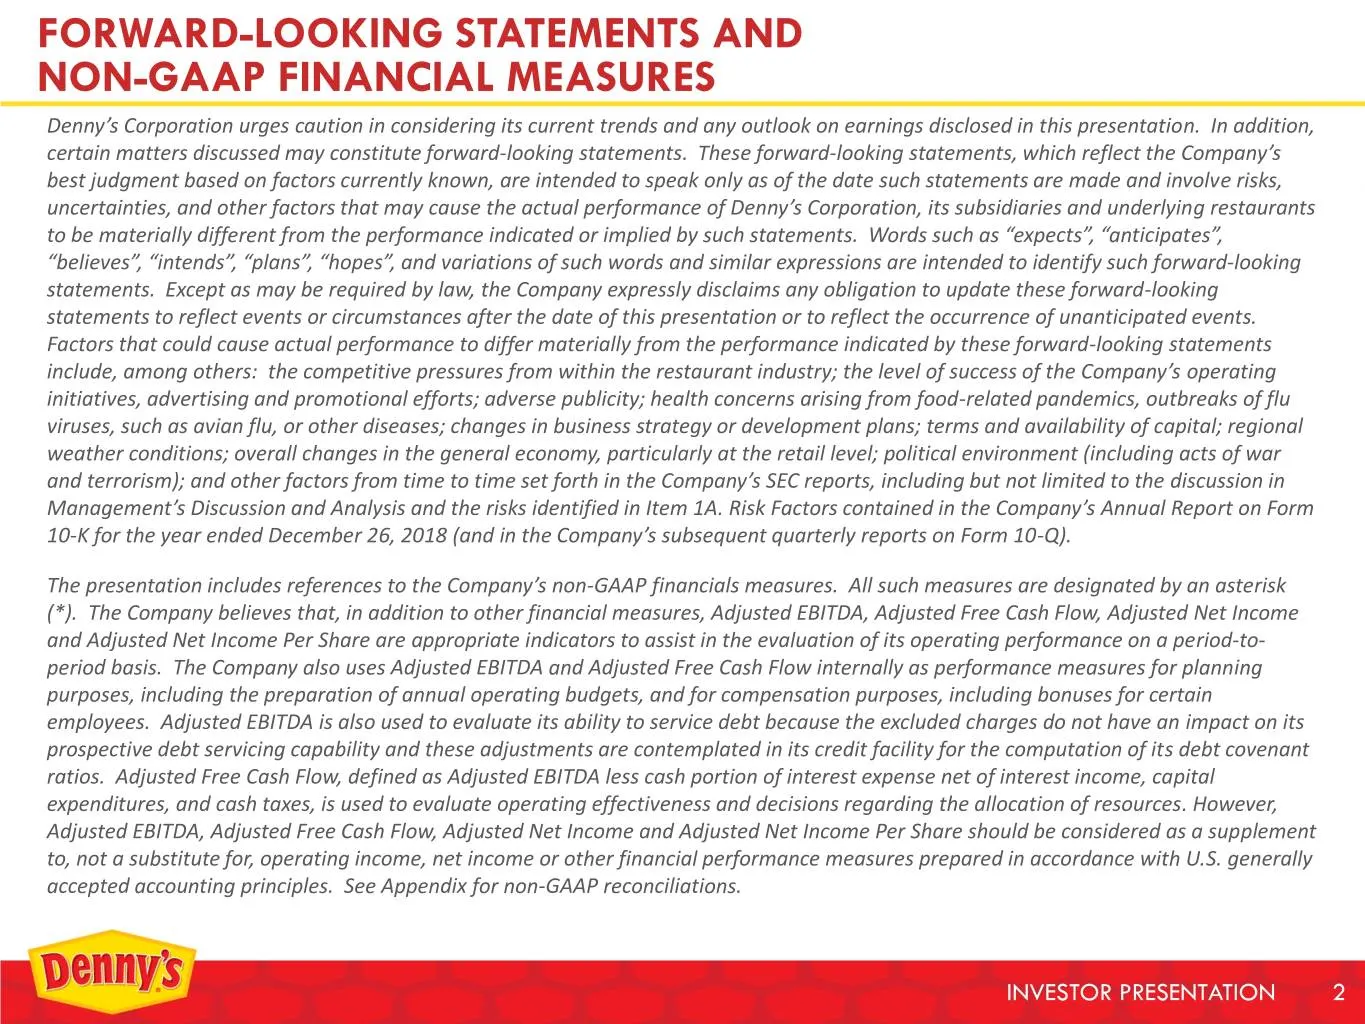
FORWARD-LOOKING STATEMENTS AND NON-GAAP FINANCIAL MEASURES Denny’s Corporation urges caution in considering its current trends and any outlook on earnings disclosed in this presentation. In addition, certain matters discussed may constitute forward-looking statements. These forward-looking statement
Slide 3: Denny's Investment Highlights
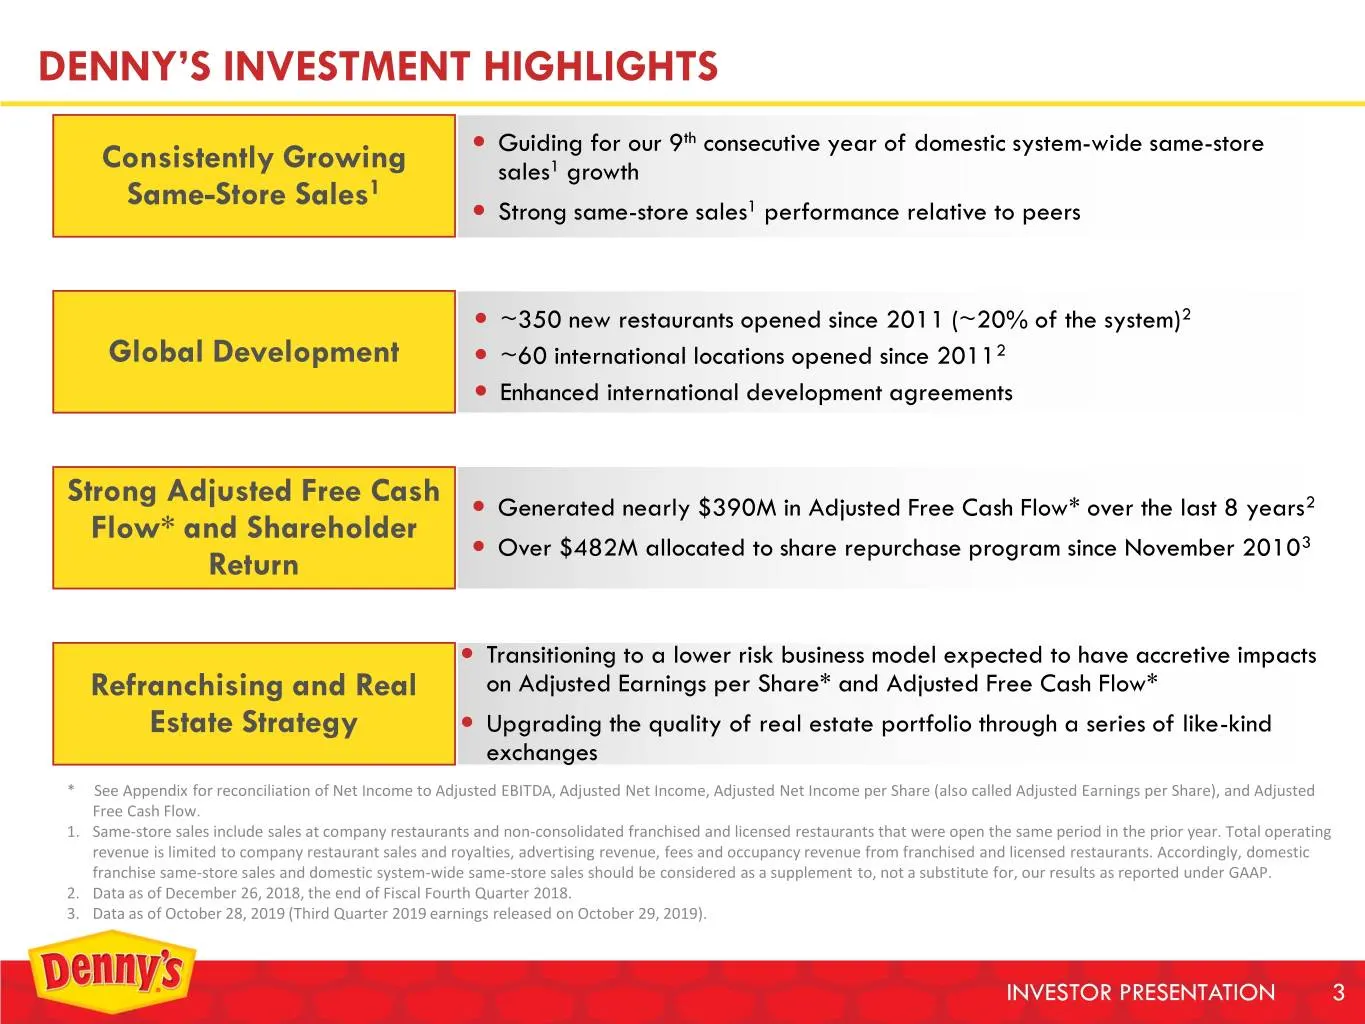
DENNY’S INVESTMENT HIGHLIGHTS Guiding for our 9th consecutive year of domestic system-wide same-store Consistently Growing sales1 growth Same-Store Sales1 Strong same-store sales1 performance relative to peers ~350 new restaurants opened since 2011 (~20% of the system)2 Global Development ~6
Slide 4: Execution of Brand Revitalization Strategy Driving Results
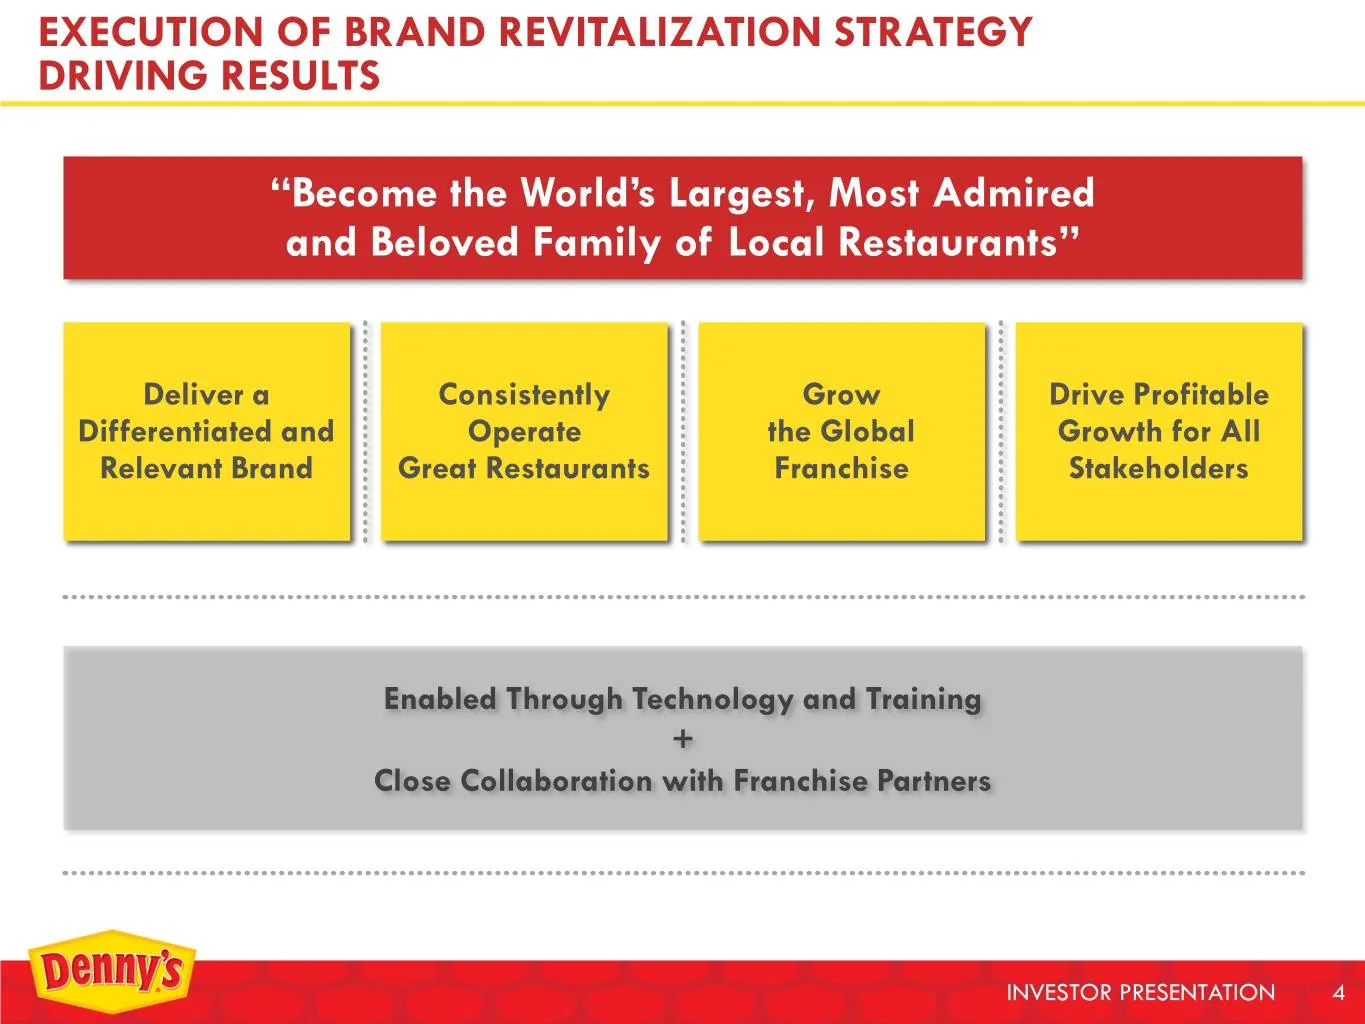
EXECUTION OF BRAND REVITALIZATION STRATEGY DRIVING RESULTS “Become the World’s Largest, Most Admired and Beloved Family of Local Restaurants” Deliver a Consistently Grow Drive Profitable Differentiated and Operate the Global Growth for All Relevant Brand Great Restaurants Franchise Stakeholders Enab
Slide 5: Delivering a Differentiated and Relevant Brand
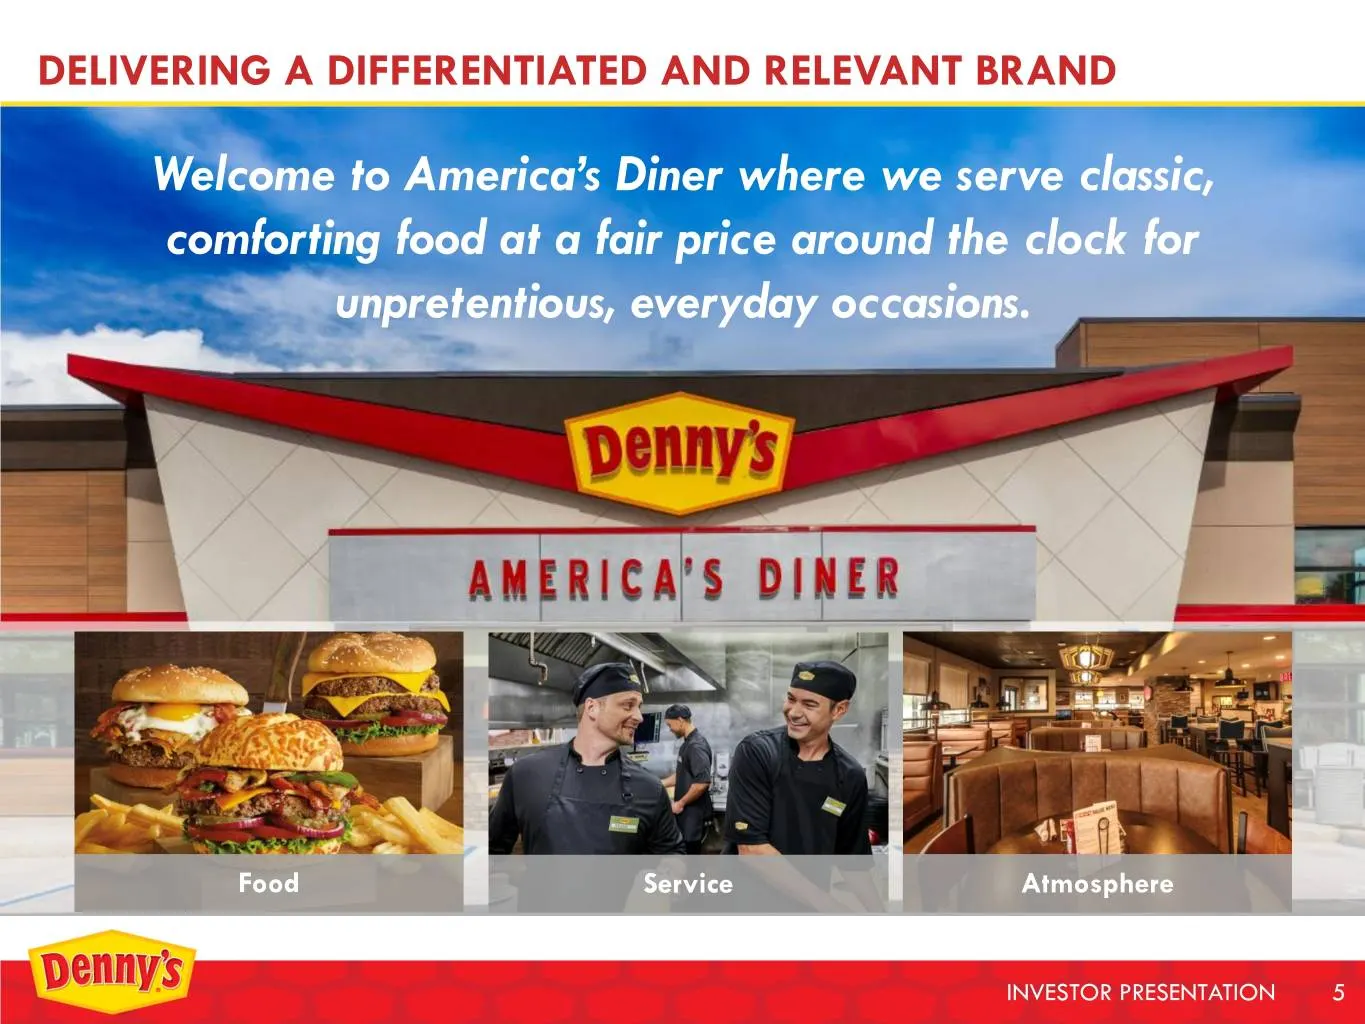
DELIVERING A DIFFERENTIATED AND RELEVANT BRAND Welcome to America’s Diner where we serve classic, comforting food at a fair price around the clock for unpretentious, everyday occasions. Food Service Atmosphere INVESTOR PRESENTATION 5
Slide 6: Menu Evolution to Match Guests' Needs
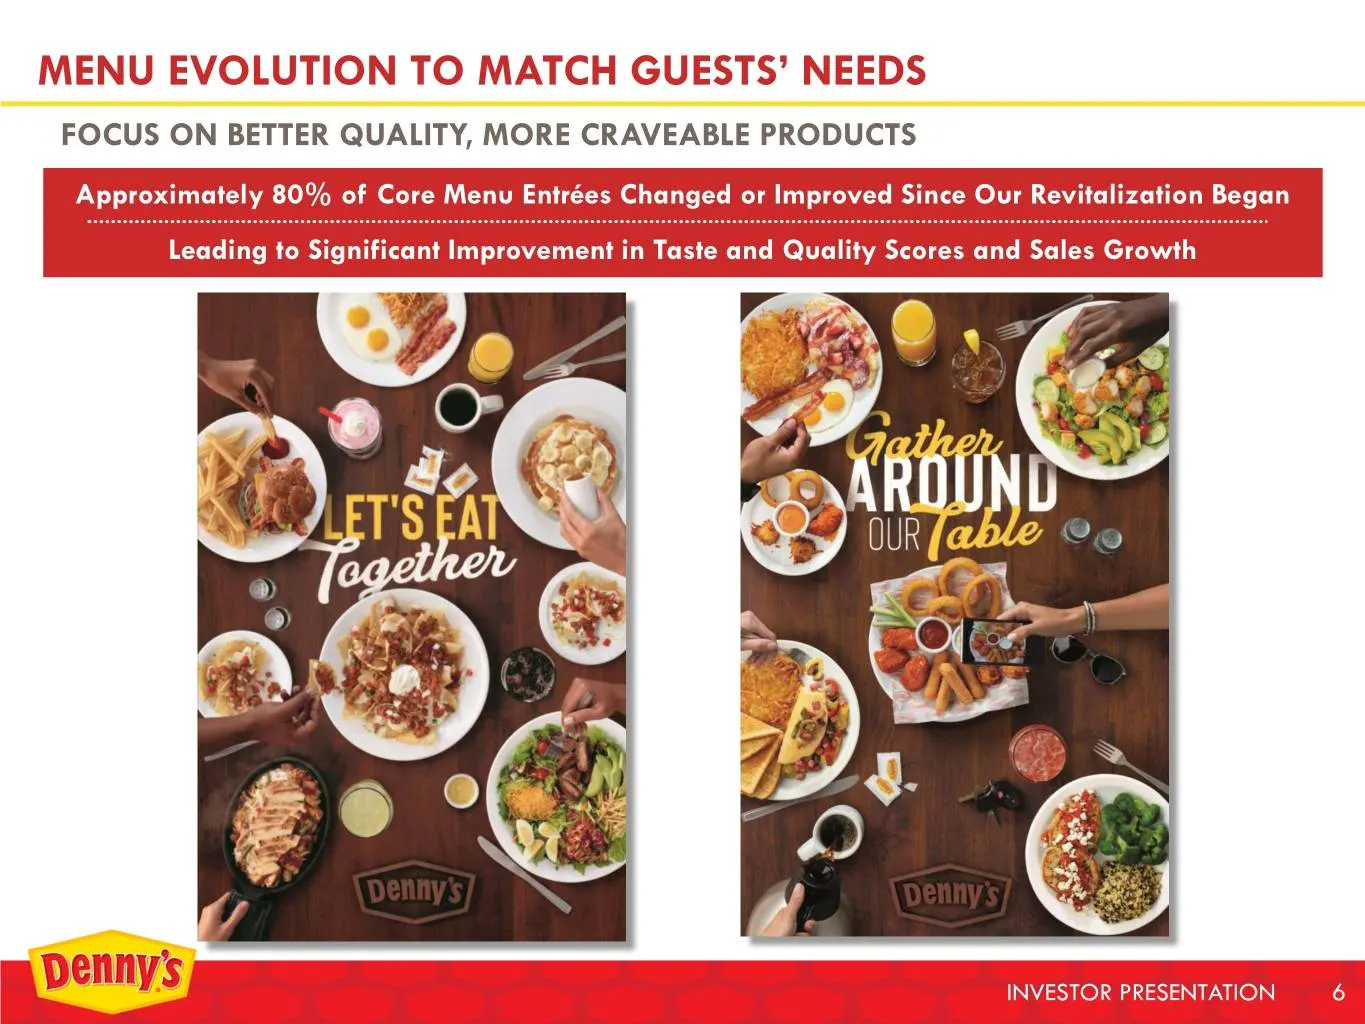
MENU EVOLUTION TO MATCH GUESTS’ NEEDS FOCUS ON BETTER QUALITY, MORE CRAVEABLE PRODUCTS Approximately 80% of Core Menu Entrées Changed or Improved Since Our Revitalization Began Leading to Significant Improvement in Taste and Quality Scores and Sales Growth INVESTOR PRESENTATION 6
Slide 7: Newest Limited Time Only Offerings
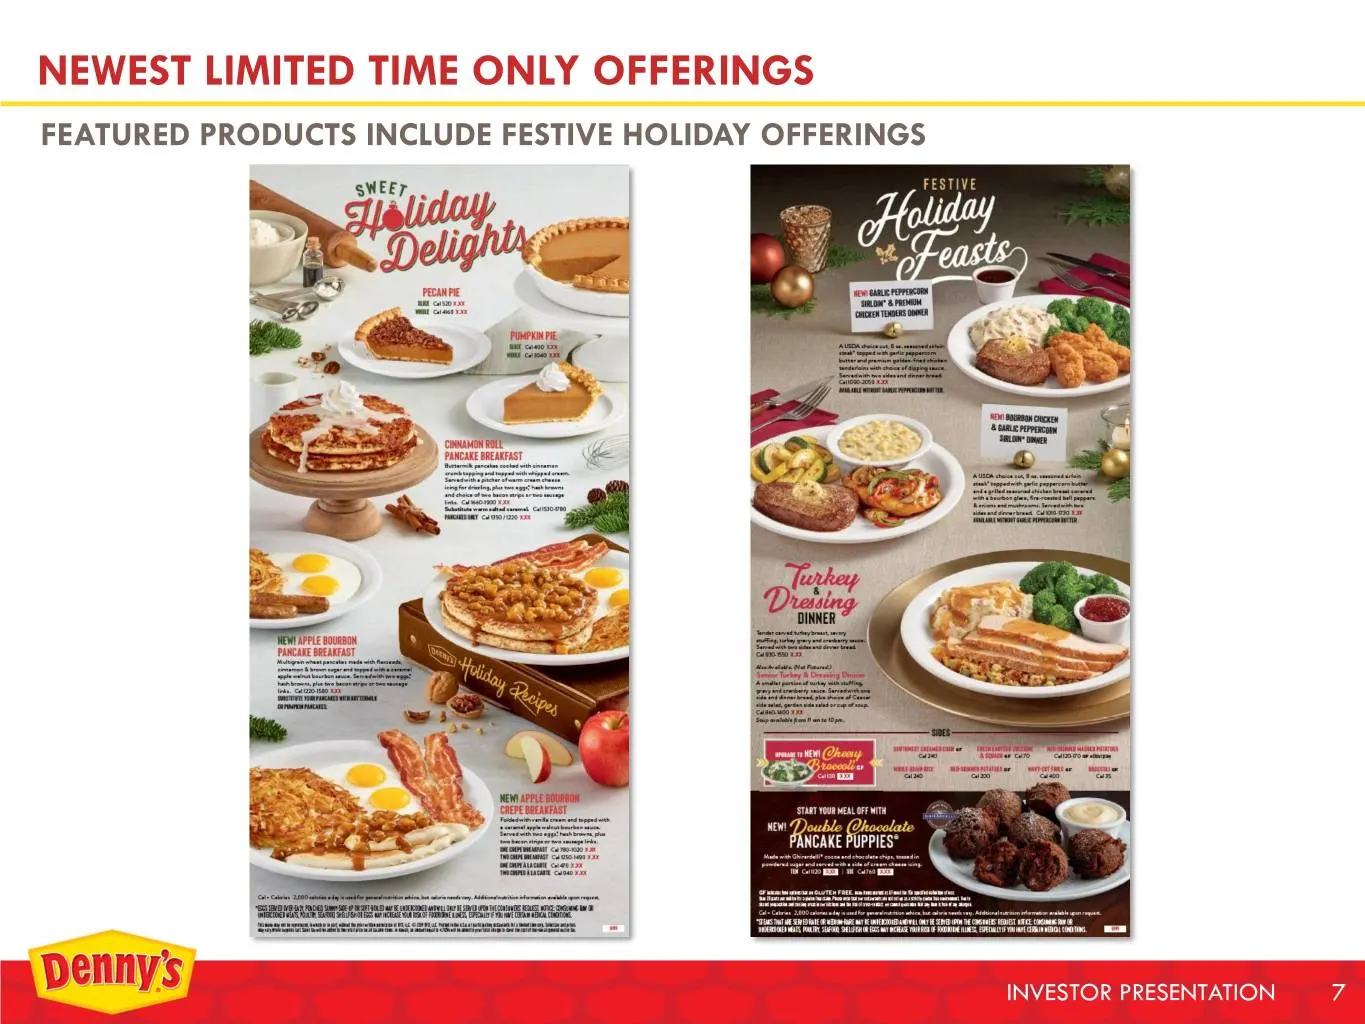
NEWEST LIMITED TIME ONLY OFFERINGS FEATURED PRODUCTS INCLUDE FESTIVE HOLIDAY OFFERINGS INVESTOR PRESENTATION 7
Slide 8: Everyday Value Helping to Drive Traffic
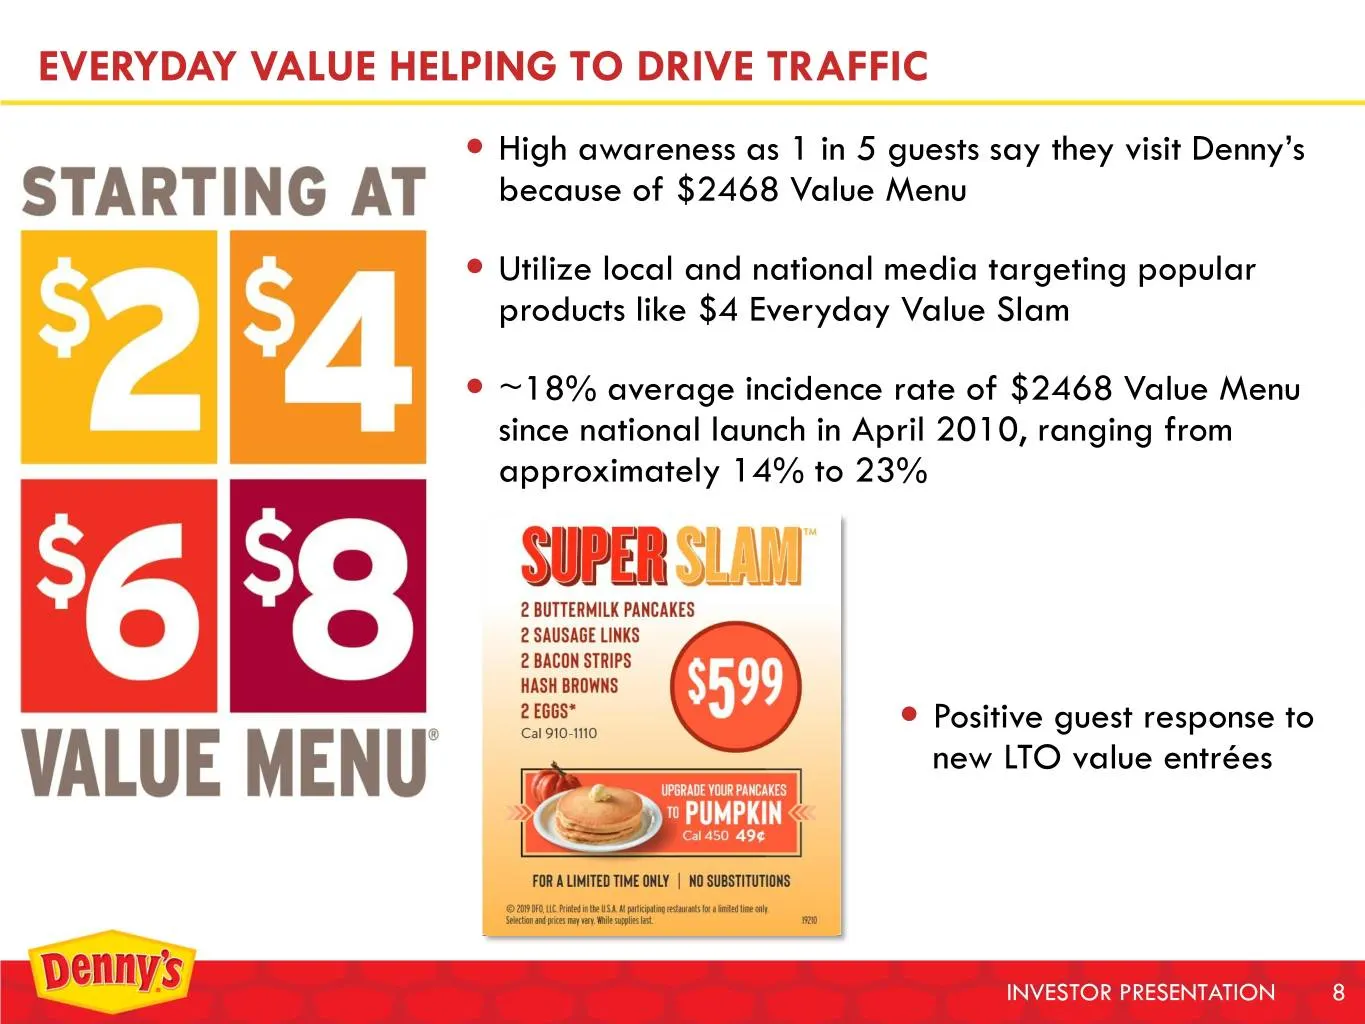
EVERYDAY VALUE HELPING TO DRIVE TRAFFIC High awareness as 1 in 5 guests say they visit Denny’s because of $2468 Value Menu Utilize local and national media targeting popular products like $4 Everyday Value Slam ~18% average incidence rate of $2468 Value Menu since national launch in April 2010
Slide 9: Denny's On Demand
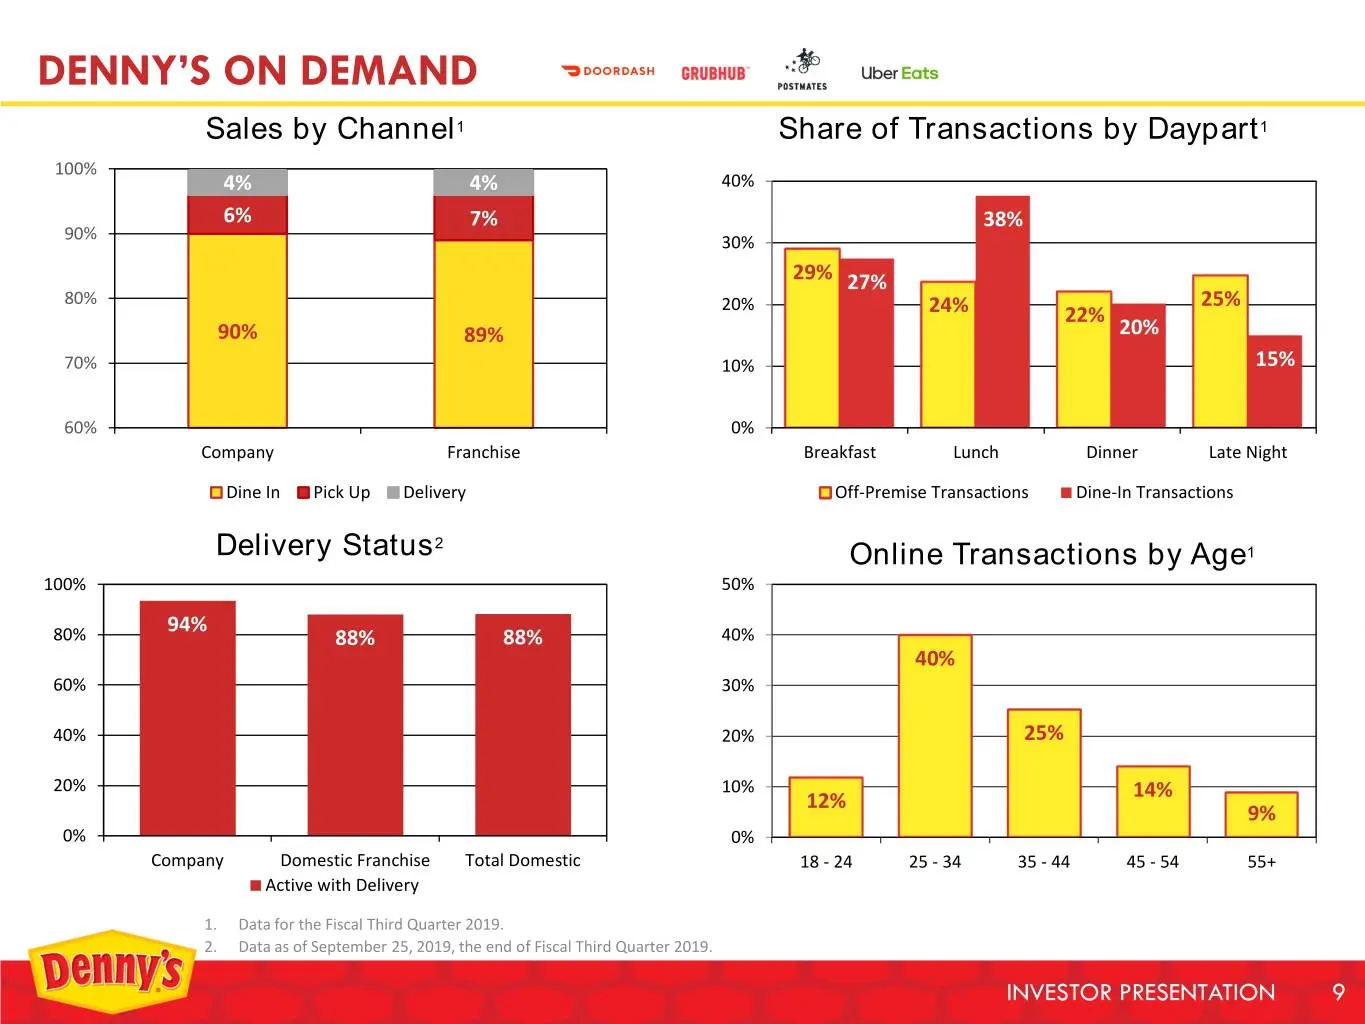
DENNY’S ON DEMAND Sales by Channel1 Share of Transactions by Daypart1 100% 4% 4% 40% 6% 7% 38% 90% 30% 29% 27% 80% 25% 20% 24% 22% 90% 89% 20% 70% 10% 15% 60% 0% Company Franchise Breakfast Lunch Dinner Late Night Dine In Pick Up Delivery Off-Premise Transactions Dine-In Transactions 2 Delivery Stat
Slide 10: The Modern American Family
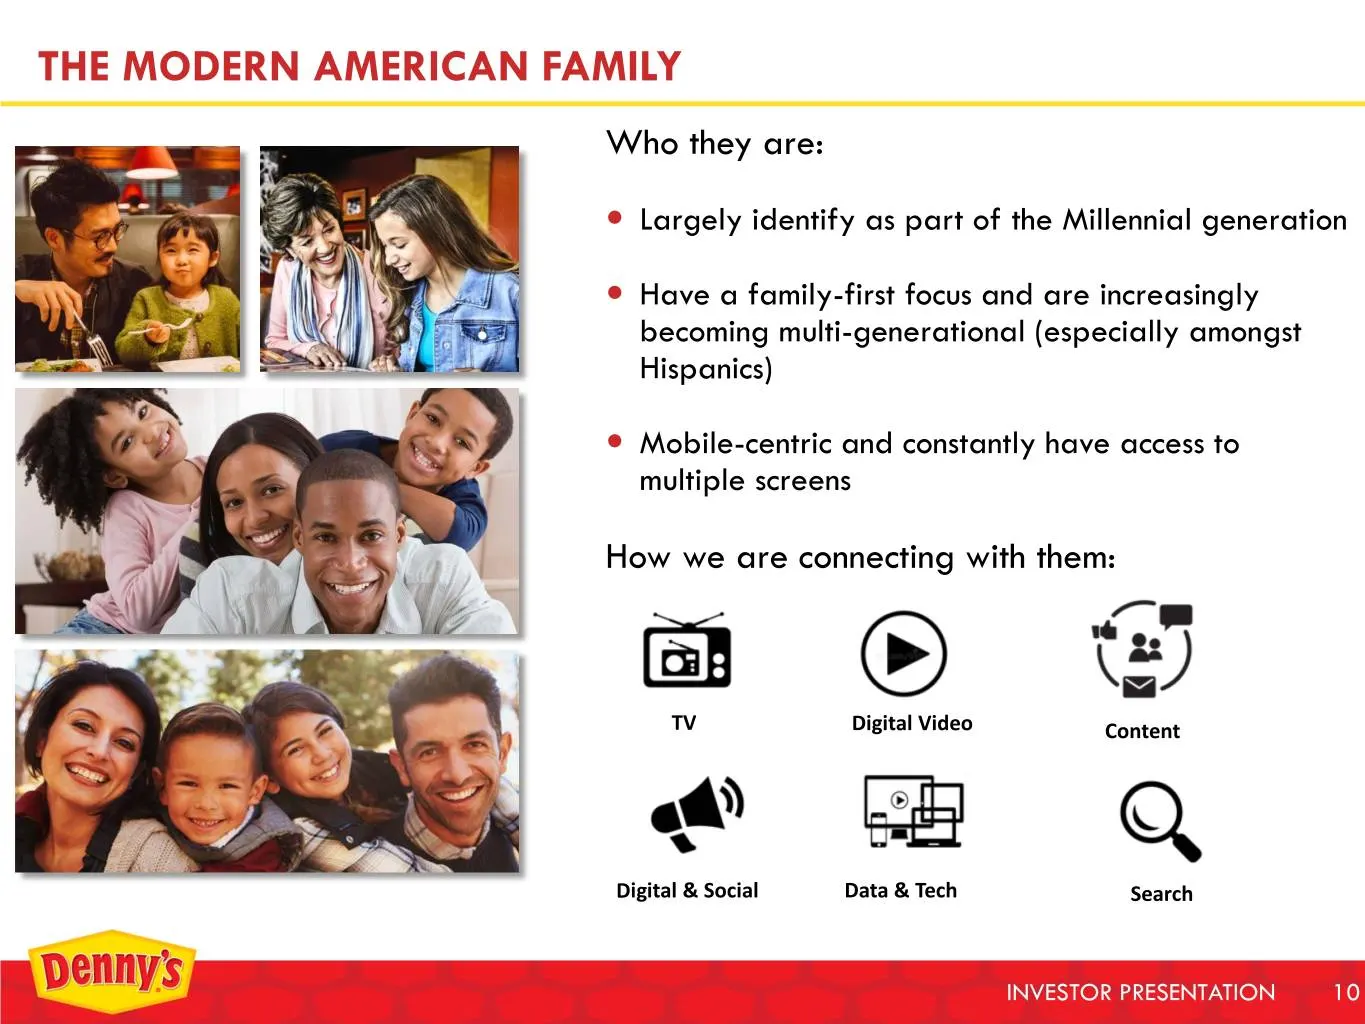
THE MODERN AMERICAN FAMILY Who they are: Largely identify as part of the Millennial generation Have a family-first focus and are increasingly becoming multi-generational (especially amongst Hispanics) Mobile-centric and constantly have access to multiple screens How we are connecting with them
Slide 11: Remodel Program Enhancing Traffic and Scores
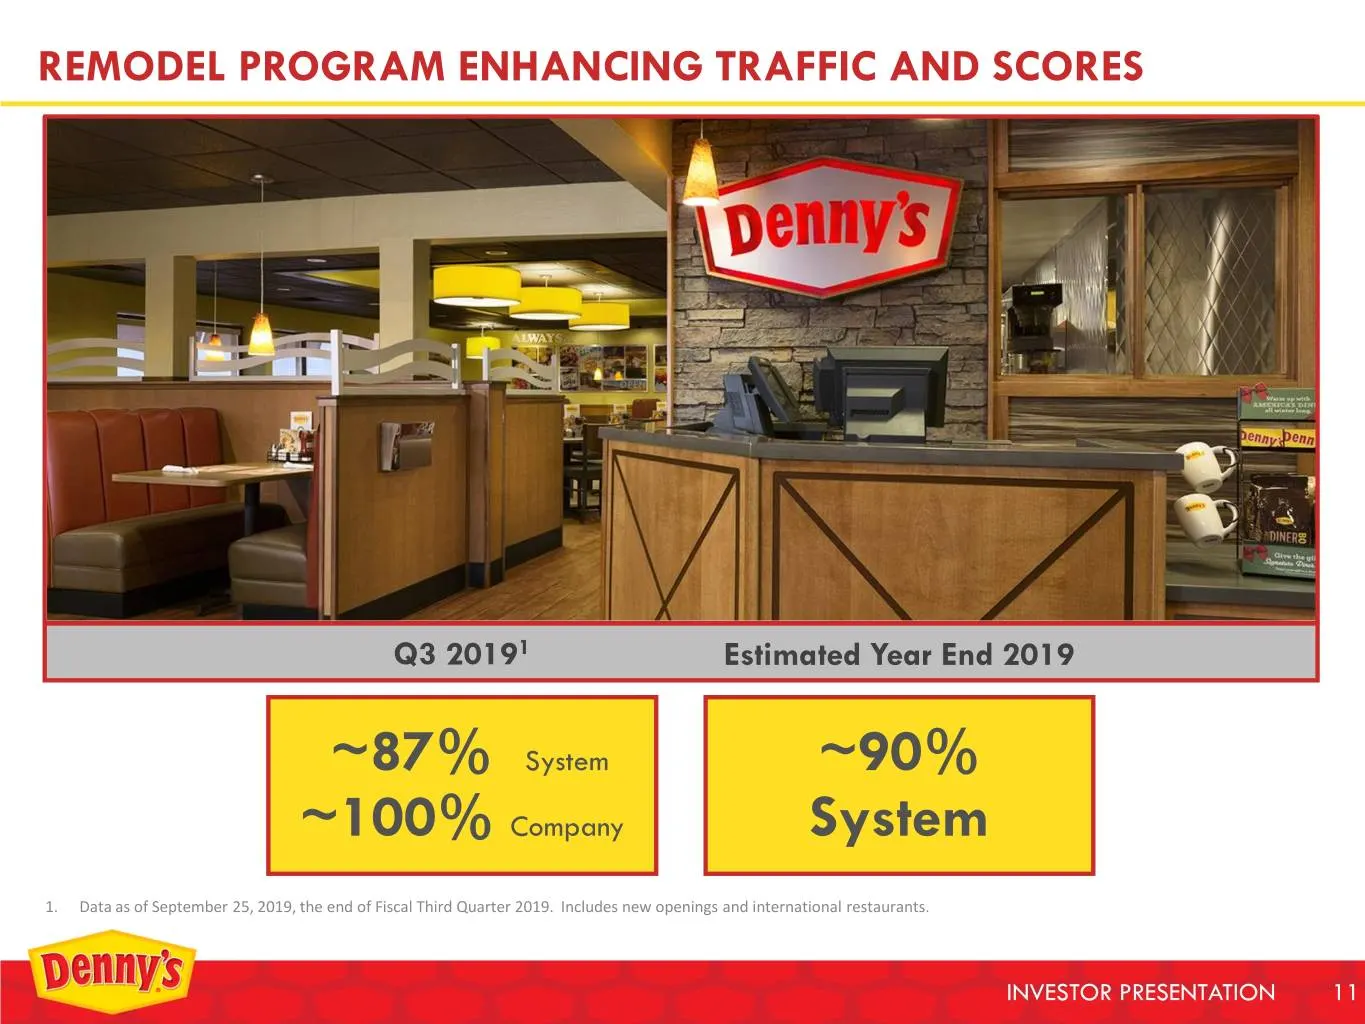
REMODEL PROGRAM ENHANCING TRAFFIC AND SCORES Q3 20191 Estimated Year End 2019 ~87% System ~90% ~100% Company System 1. Data as of September 25, 2019, the end of Fiscal Third Quarter 2019. Includes new openings and international restaurants. INVESTOR PRESENTATION 11
Slide 12: Heritage Remodel Key to Revitalizing Legacy Brand
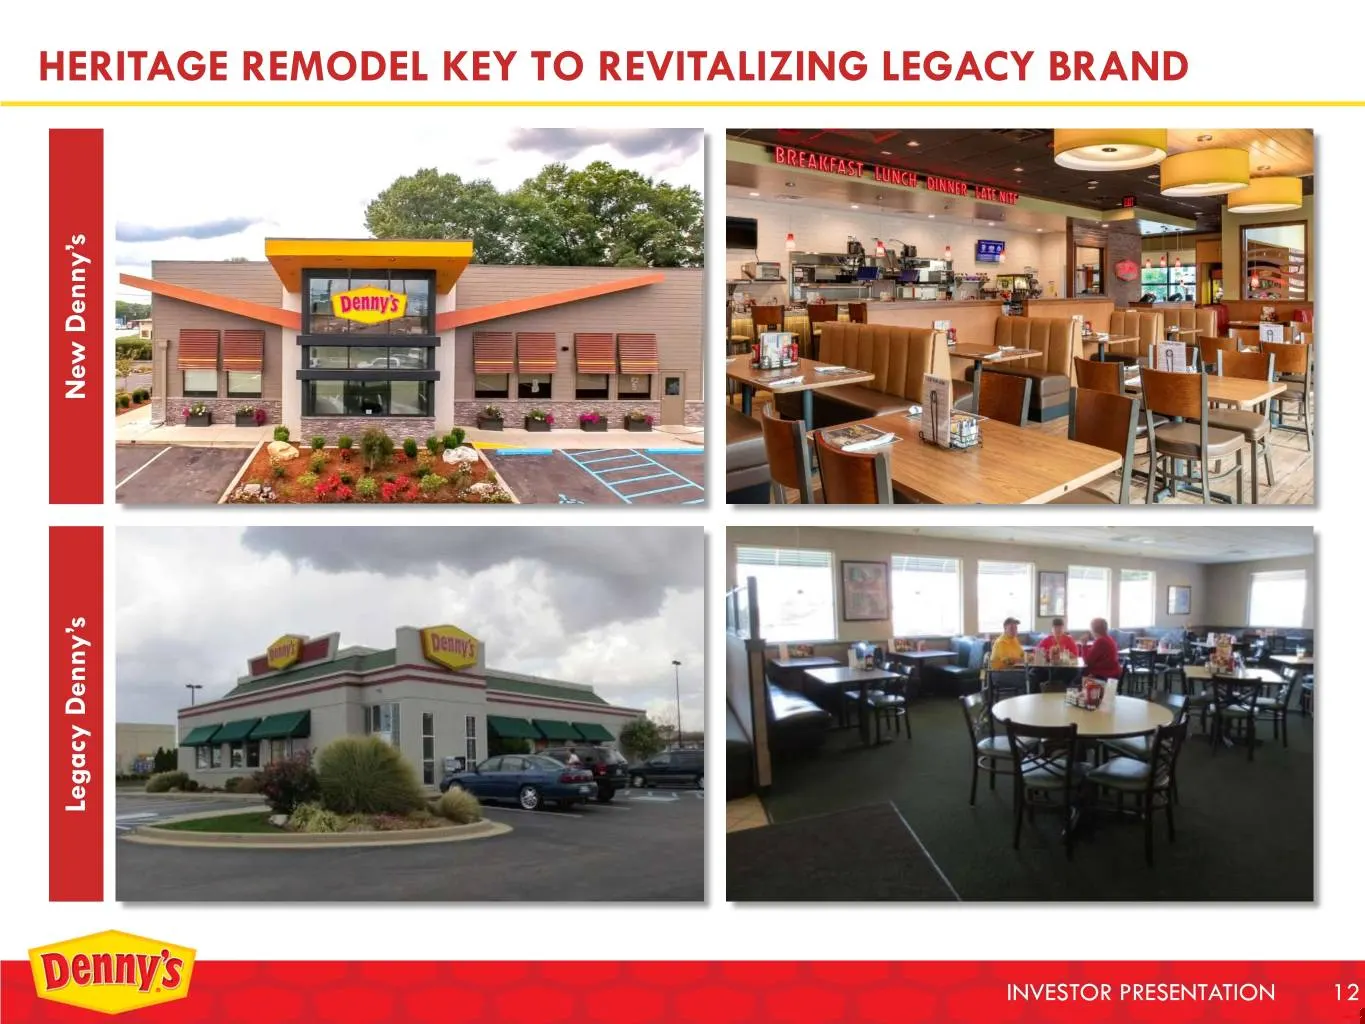
HERITAGE REMODEL KEY TO REVITALIZING LEGACY BRAND New Denny’s New Legacy Denny’s INVESTOR PRESENTATION 12
Slide 13: Focus on Consistently Operating Great Restaurants
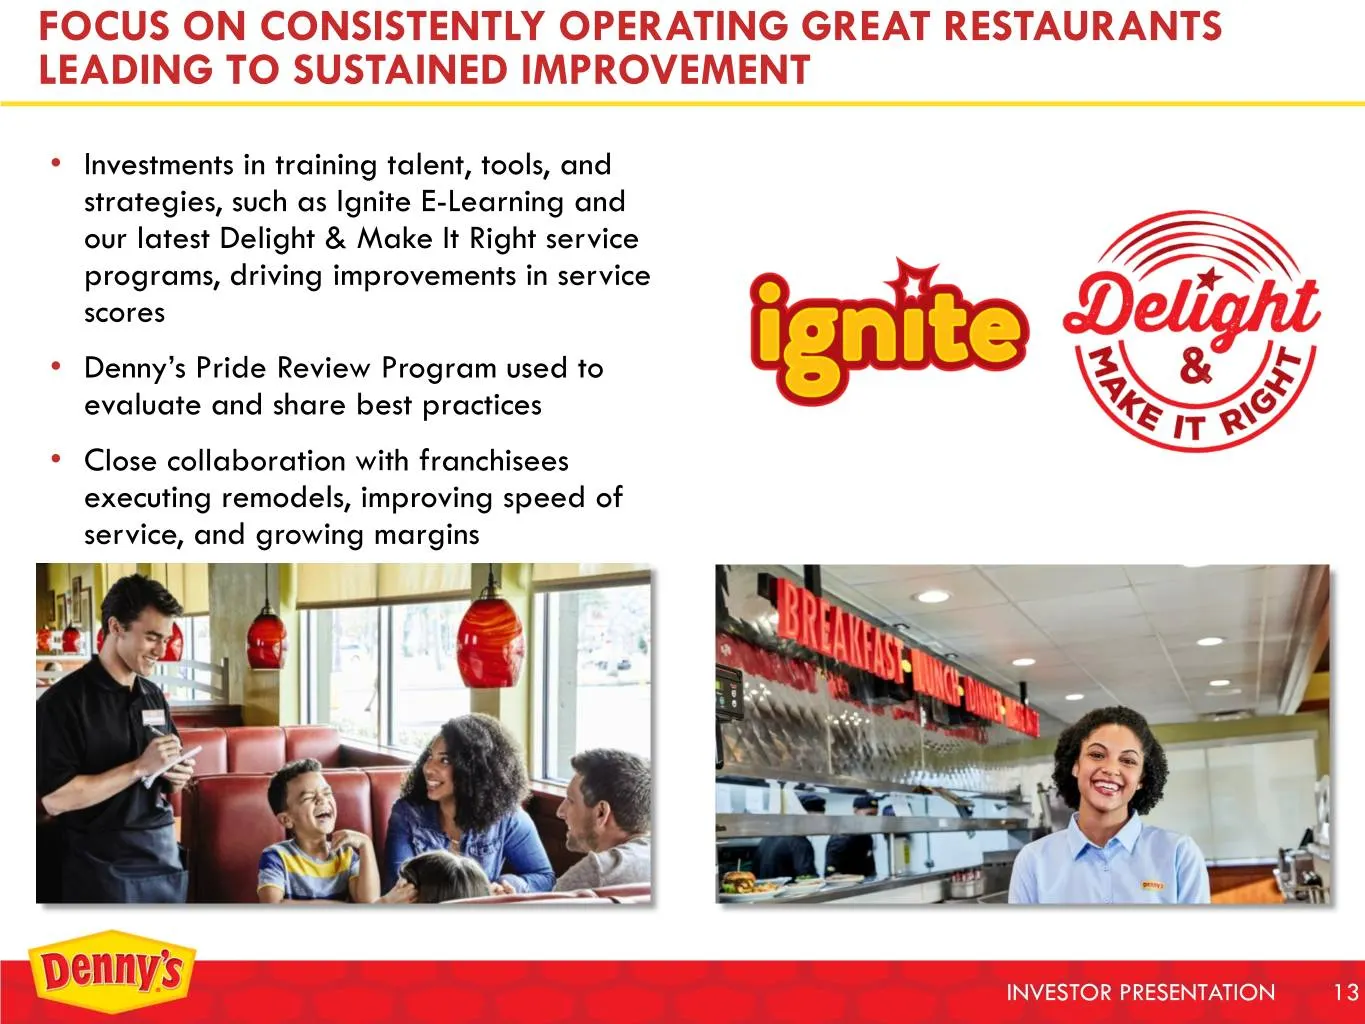
FOCUS ON CONSISTENTLY OPERATING GREAT RESTAURANTS LEADING TO SUSTAINED IMPROVEMENT • Investments in training talent, tools, and strategies, such as Ignite E-Learning and our latest Delight & Make It Right service programs, driving improvements in service scores • Denny’s Pride Review Program used to
Slide 14: Global Development
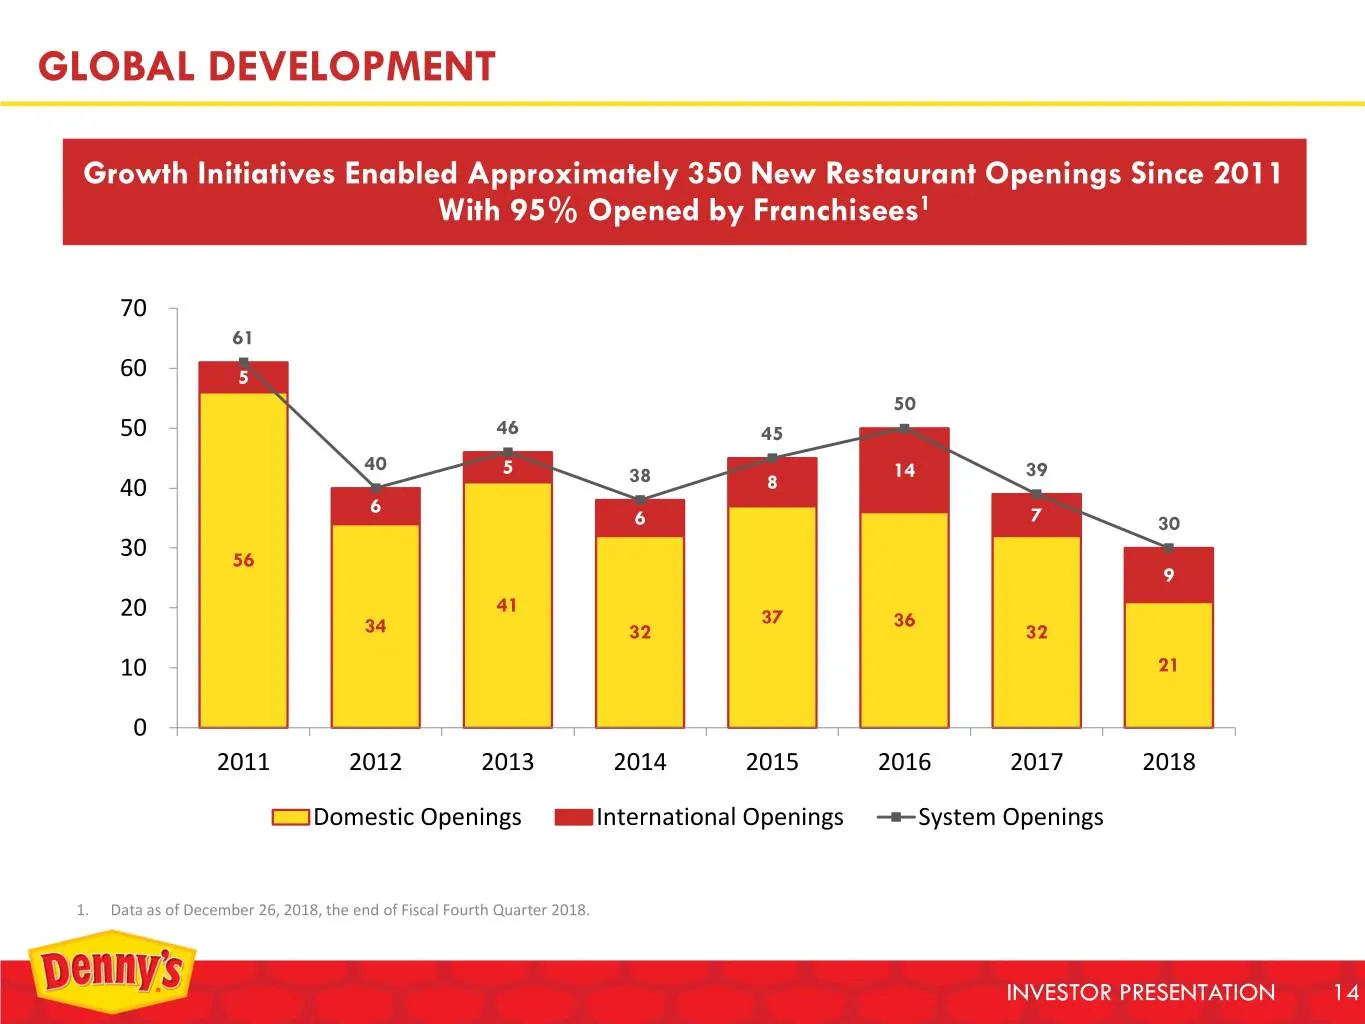
GLOBAL DEVELOPMENT Growth Initiatives Enabled Approximately 350 New Restaurant Openings Since 2011 With 95% Opened by Franchisees1 70 61 60 5 50 50 46 45 40 5 38 14 39 40 8 6 6 7 30 30 56 9 41 20 37 36 34 32 32 10 21 0 2011 2012 2013 2014 2015 2016 2017 2018 Domestic Openings International Openings
Slide 15: Domestic Footprint
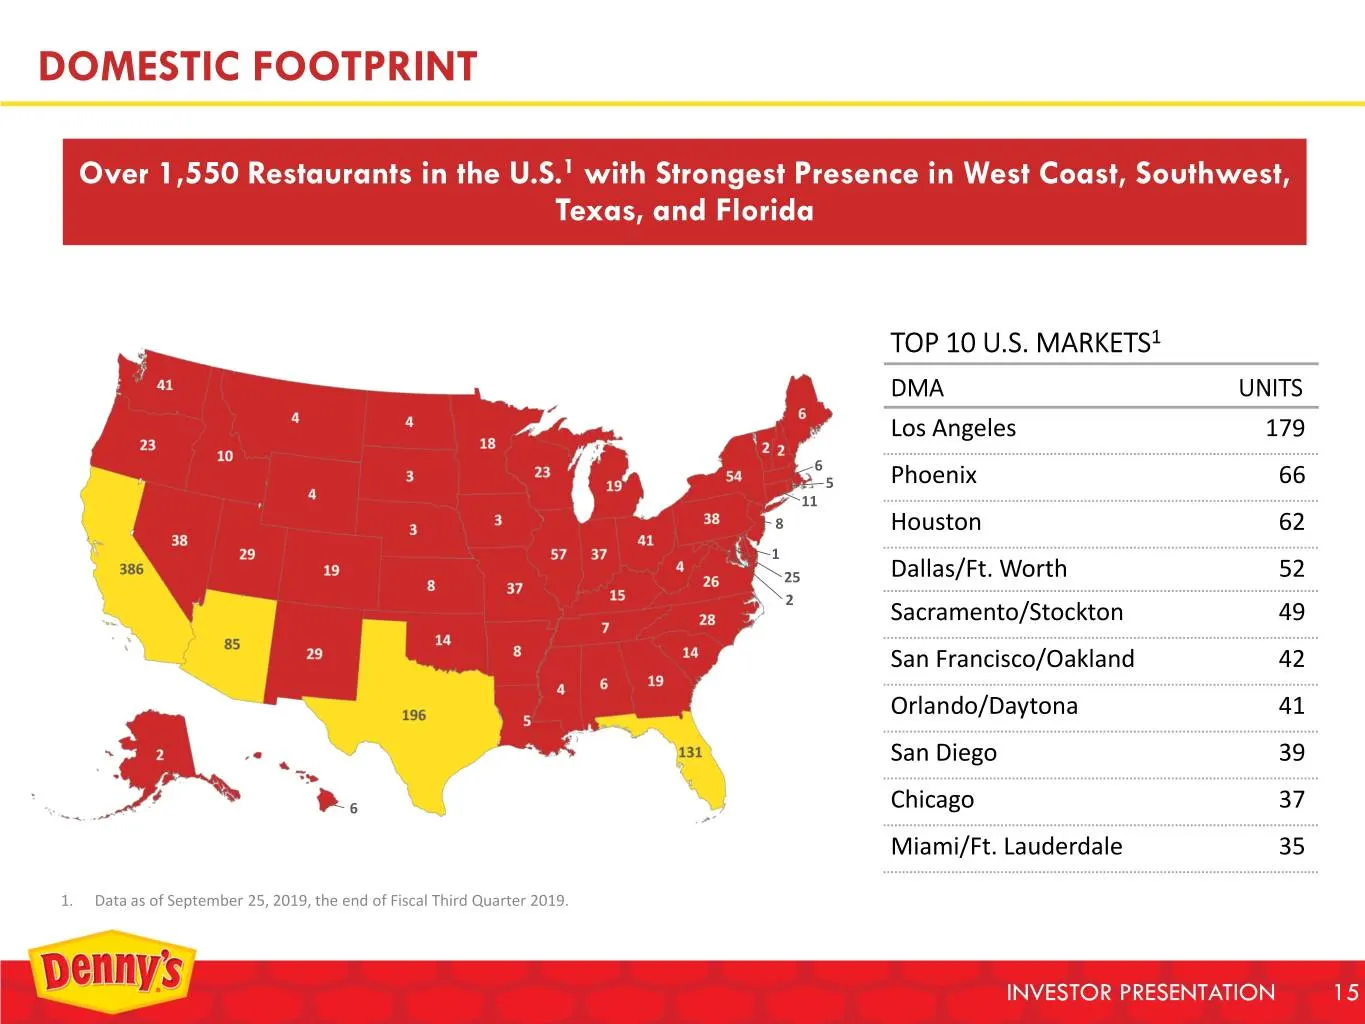
DOMESTIC FOOTPRINT Over 1,550 Restaurants in the U.S.1 with Strongest Presence in West Coast, Southwest, Texas, and Florida TOP 10 U.S. MARKETS1 DMA UNITS Los Angeles 179 6 5 Phoenix 66 11 8 Houston 62 1 25 Dallas/Ft. Worth 52 2 Sacramento/Stockton 49 San Francisco/Oakland 42 Orlando/Daytona 41 San
Slide 16: International Footprint
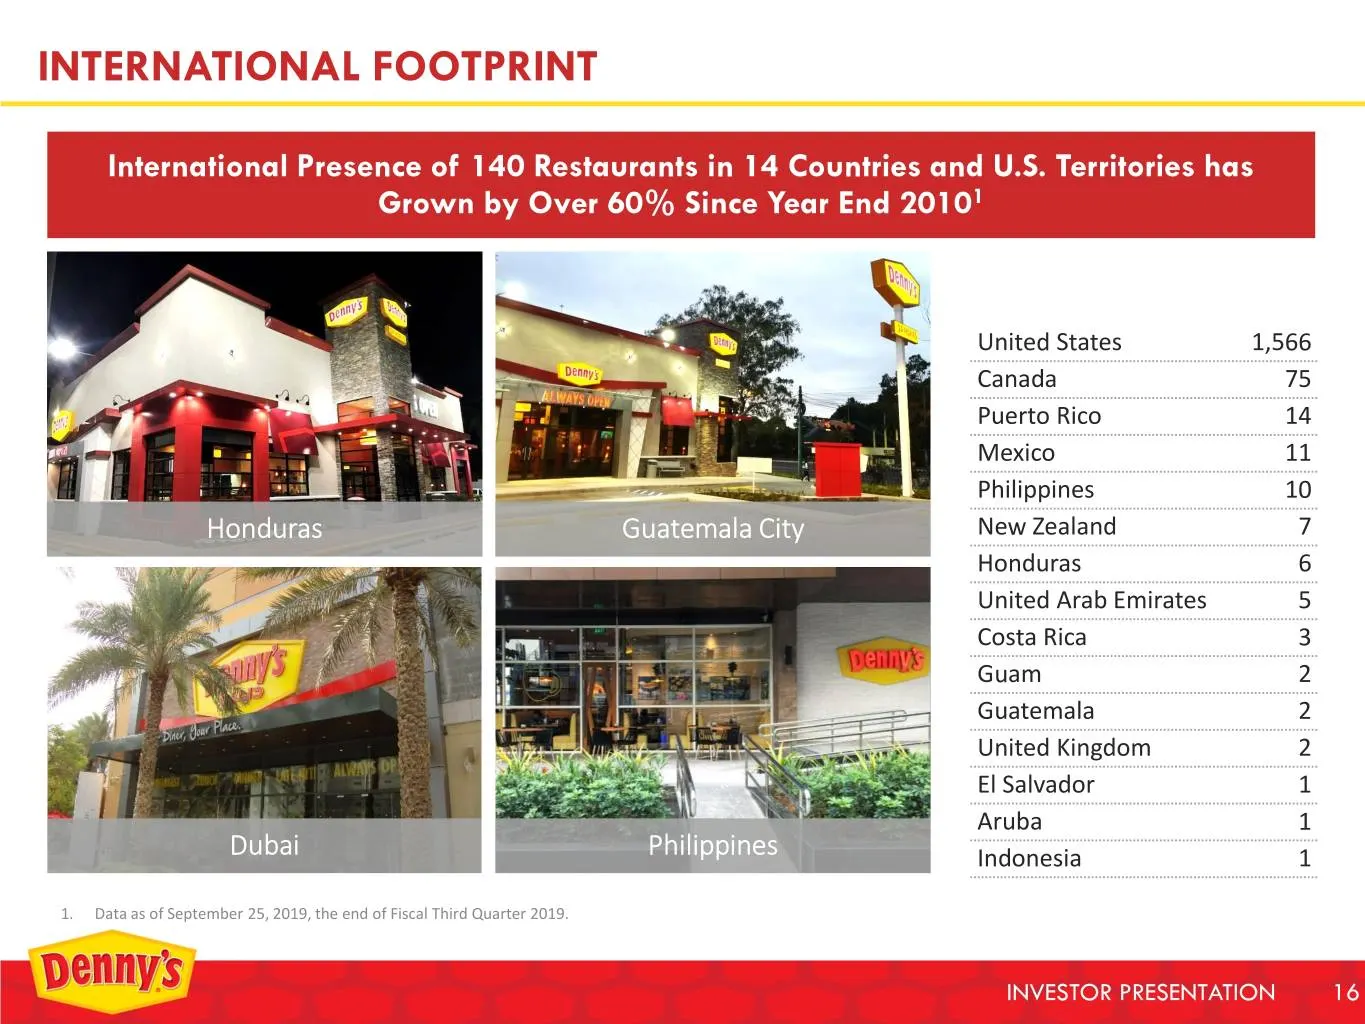
INTERNATIONAL FOOTPRINT International Presence of 140 Restaurants in 14 Countries and U.S. Territories has Grown by Over 60% Since Year End 20101 United States 1,566 Canada 75 Puerto Rico 14 Mexico 11 Philippines 10 Honduras Guatemala City New Zealand 7 Honduras 6 United Arab Emirates 5 Costa Rica 3
Slide 17: Strong Partnership with Franchisees
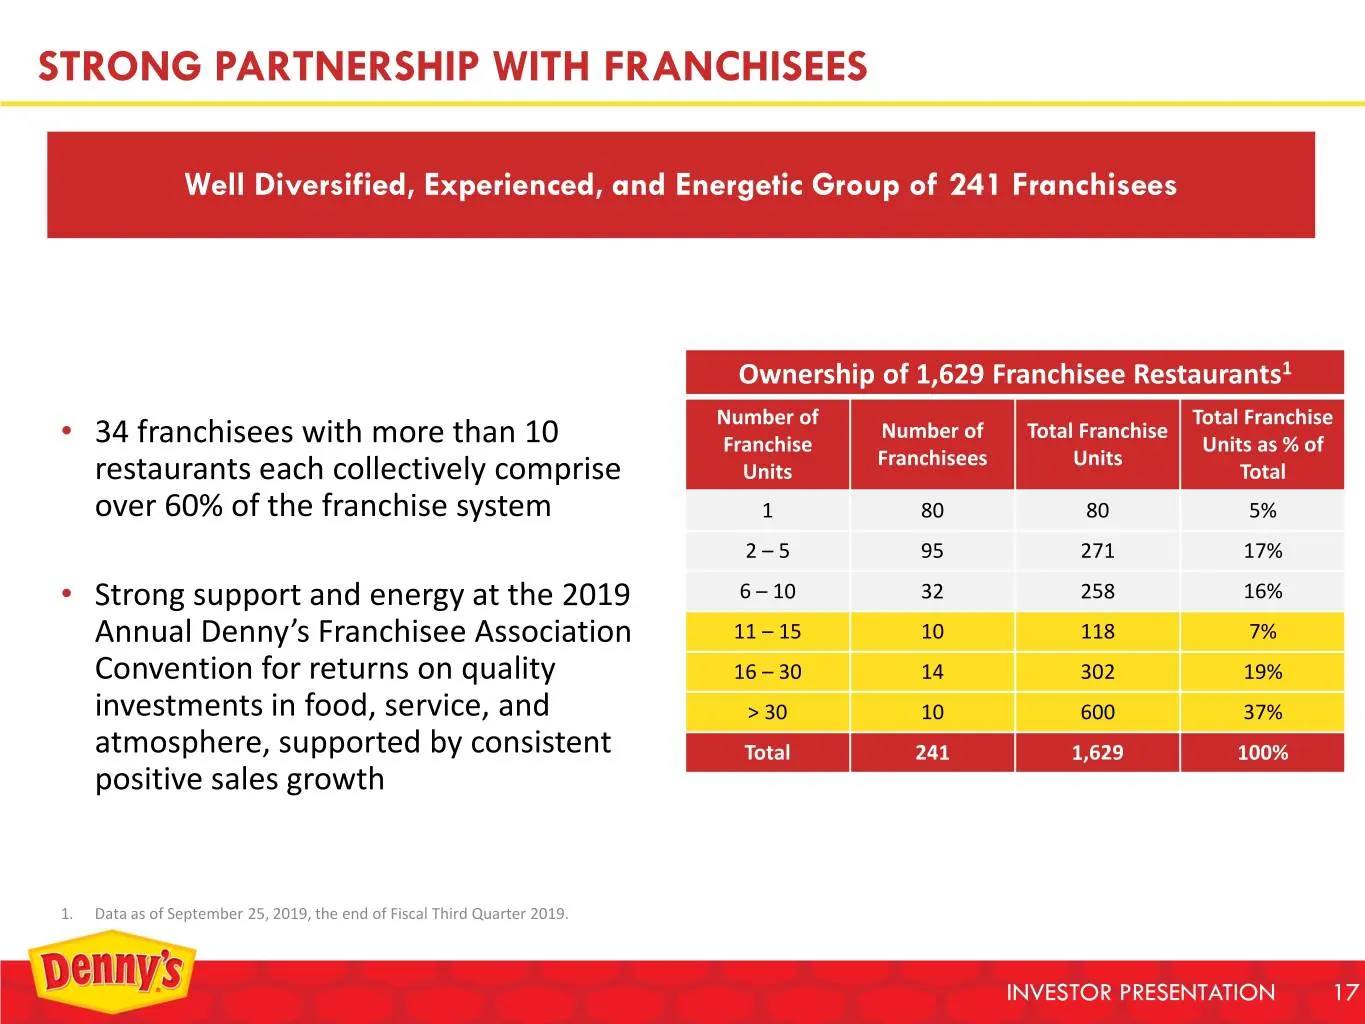
STRONG PARTNERSHIP WITH FRANCHISEES Well Diversified, Experienced, and Energetic Group of 241 Franchisees Ownership of 1,629 Franchisee Restaurants1 Number of Total Franchise Number of Total Franchise • 34 franchisees with more than 10 Franchise Units as % of Franchisees Units restaurants each colle
Slide 18: Strong Collaboration with Franchisees
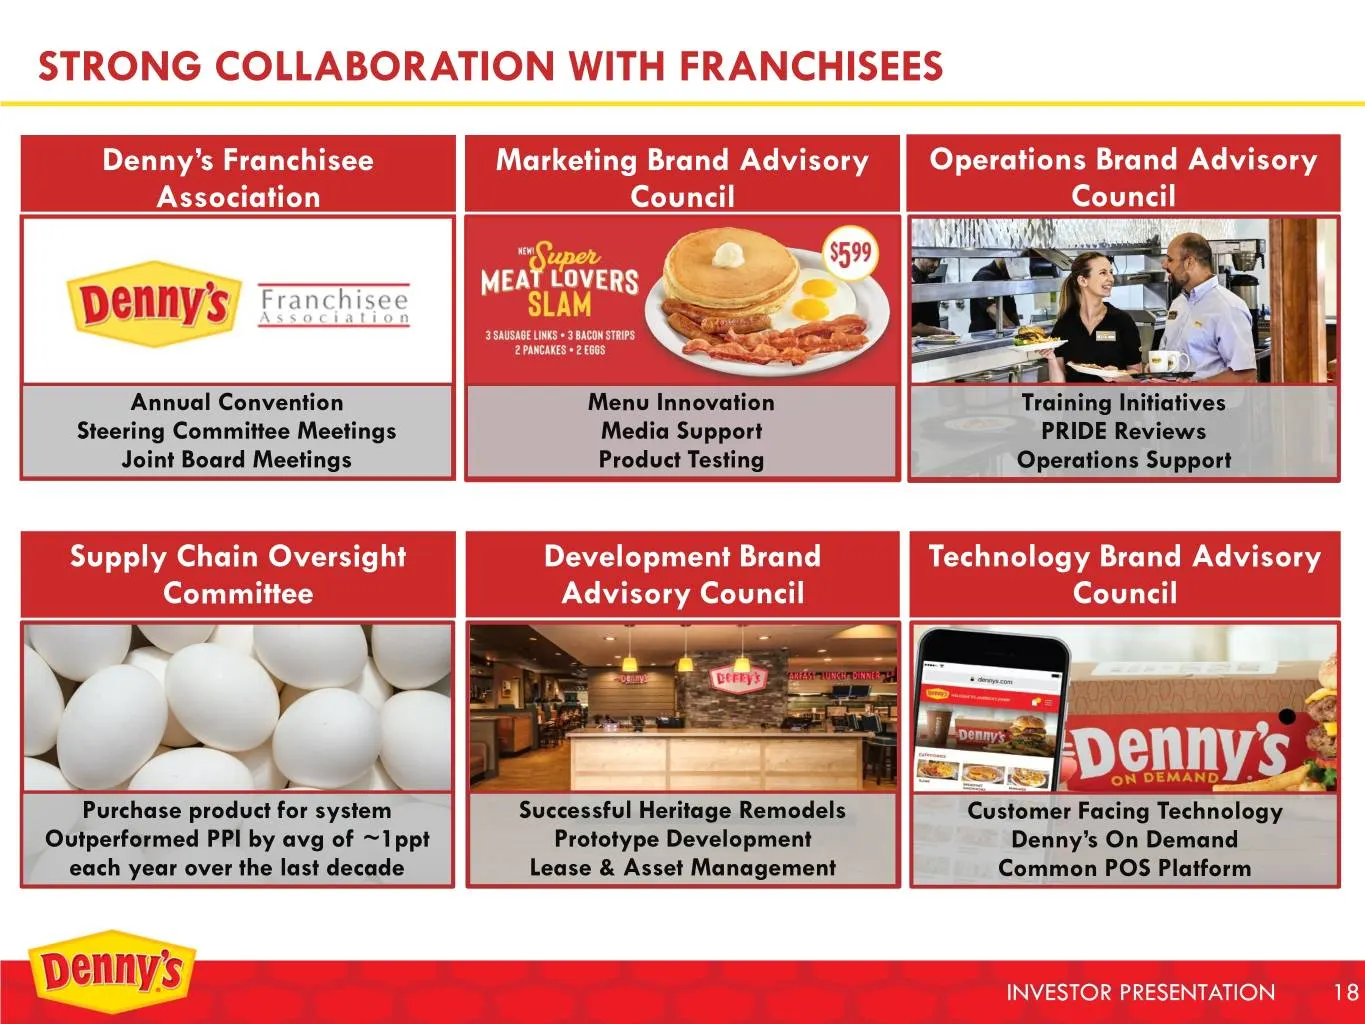
STRONG COLLABORATION WITH FRANCHISEES Denny’s Franchisee Marketing Brand Advisory Operations Brand Advisory Association Council Council Annual Convention Menu Innovation Training Initiatives Steering Committee Meetings Media Support PRIDE Reviews Joint Board Meetings Product Testing Operations Suppo
Slide 19: Refranchising Strategy
REFRANCHISING STRATEGY Divider Slide: Recent Performance INVESTOR PRESENTATION 19
Slide 20: Refranchising Strategy – Objectives
REFRANCHISING STRATEGY – Objectives In October 2018, we announced a plan to transition to a more highly franchised brand over a period of 18 months. We now expect to: Sell 115 to 125 Company operated restaurants, yielding a 96% to 97% franchised model Stimulate growth through 70 to 80 attach
Slide 21: Refranchising Strategy – Annual Impact
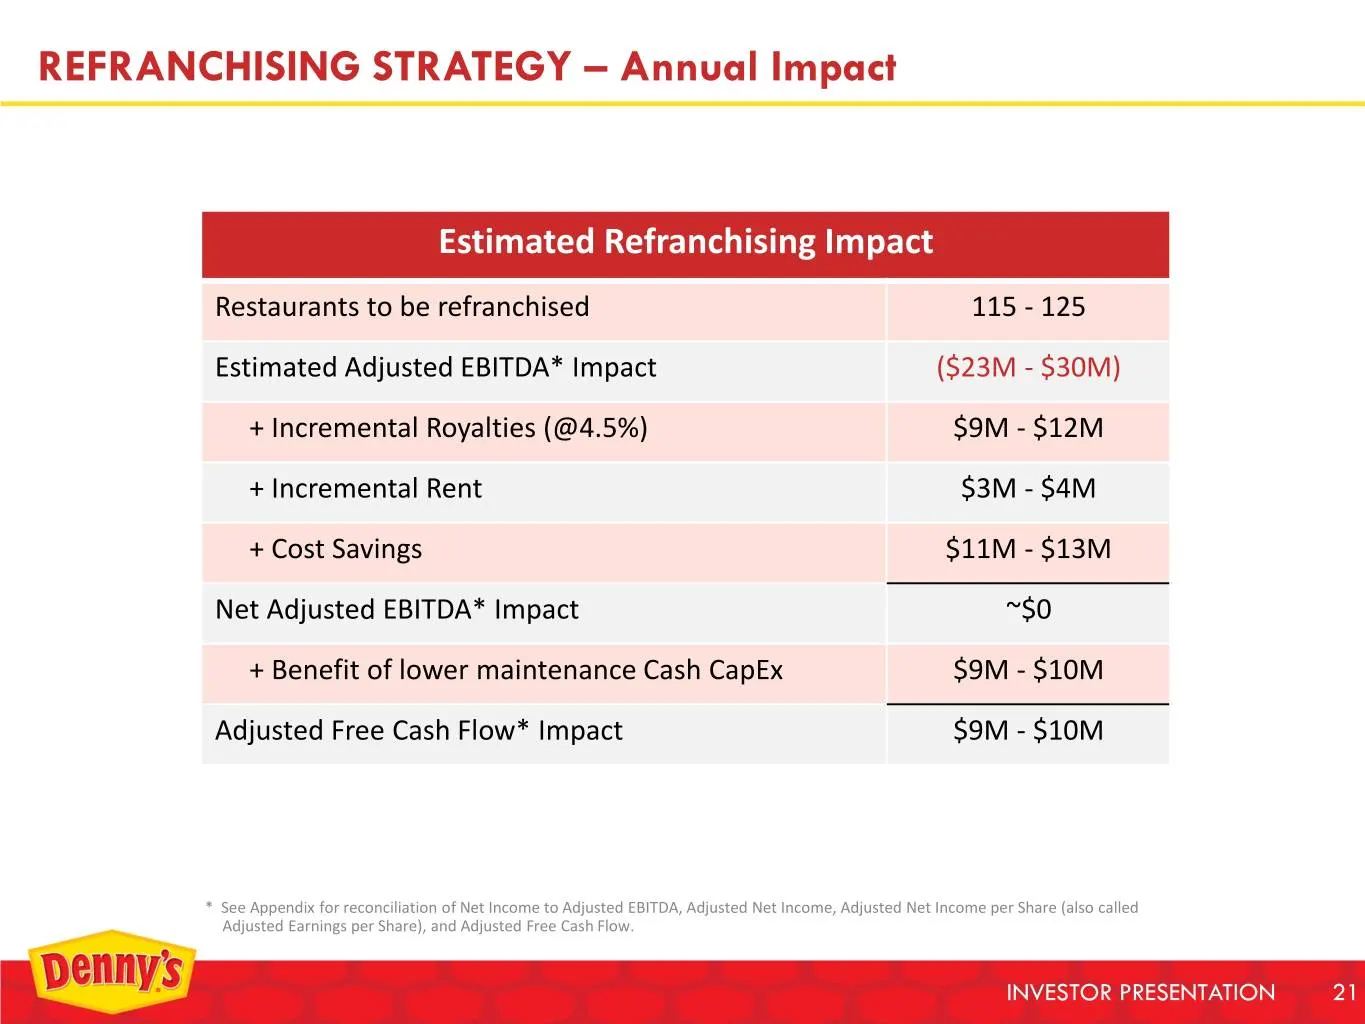
REFRANCHISING STRATEGY – Annual Impact Estimated Refranchising Impact Restaurants to be refranchised 115 - 125 Estimated Adjusted EBITDA* Impact ($23M - $30M) + Incremental Royalties (@4.5%) $9M - $12M + Incremental Rent $3M - $4M + Cost Savings $11M - $13M Net Adjusted EBITDA* Impact ~$0 + Benefit
Slide 22: Refranchising – Restaurant Portfolio
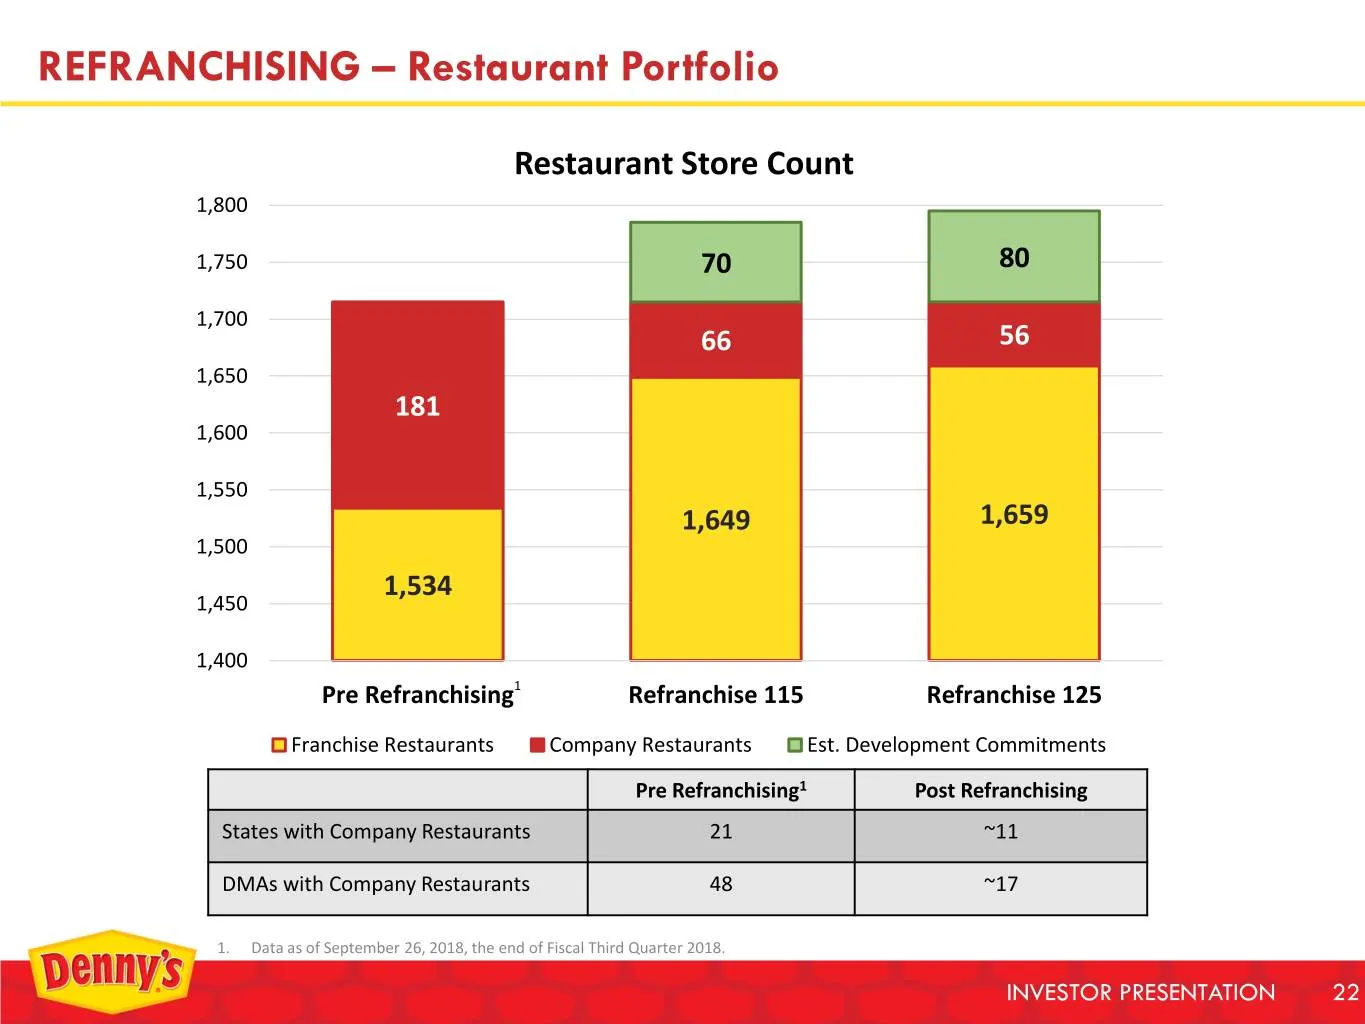
REFRANCHISING – Restaurant Portfolio Restaurant Store Count 1,800 1,750 70 80 1,700 66 56 1,650 181 1,600 1,550 1,649 1,659 1,500 1,534 1,450 1,400 Pre Refranchising1 Refranchise 115 Refranchise 125 Franchise Restaurants Company Restaurants Est. Development Commitments Pre Refranchising1 Post Refran
Slide 23: Refranchising – Company Restaurants & Proceeds
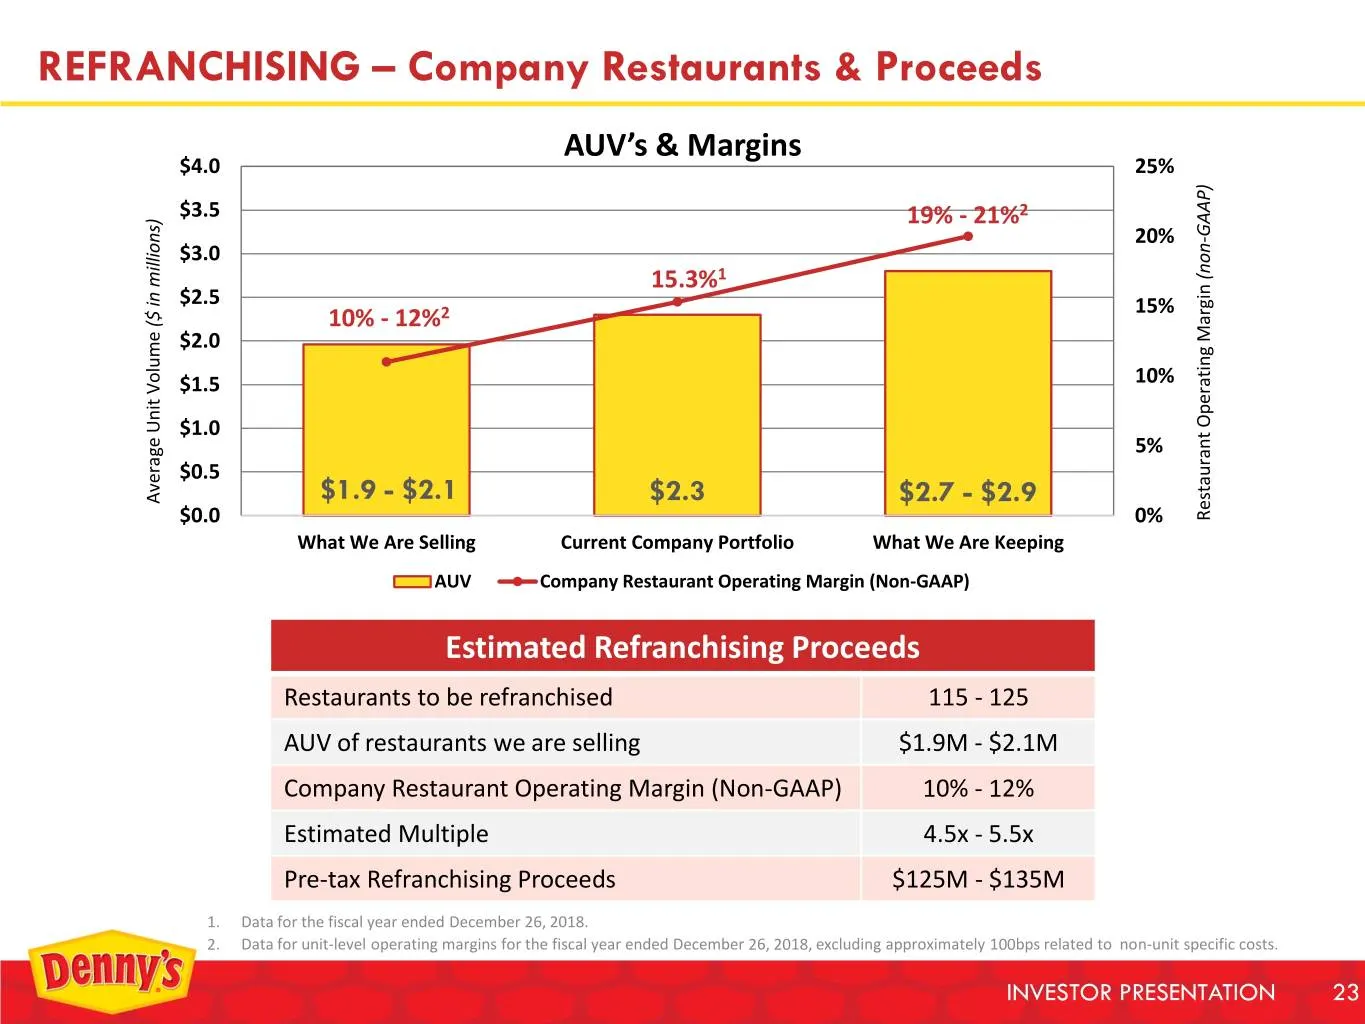
REFRANCHISING – Company Restaurants & Proceeds AUV’s & Margins $4.0 25% $3.5 19% - 21%2 GAAP) 20% - $3.0 15.3%1 (non $2.5 2 15% ($ in millions) in ($ 10% - 12% $2.0 $1.5 10% $1.0 5% $0.5 Average Unit Volume Volume Unit Average $1.9 - $2.1 $2.3 $2.7 - $2.9 $0.0 0% Margin Operating Restaurant What We
Slide 24: Refranchising – Expected Cost Savings
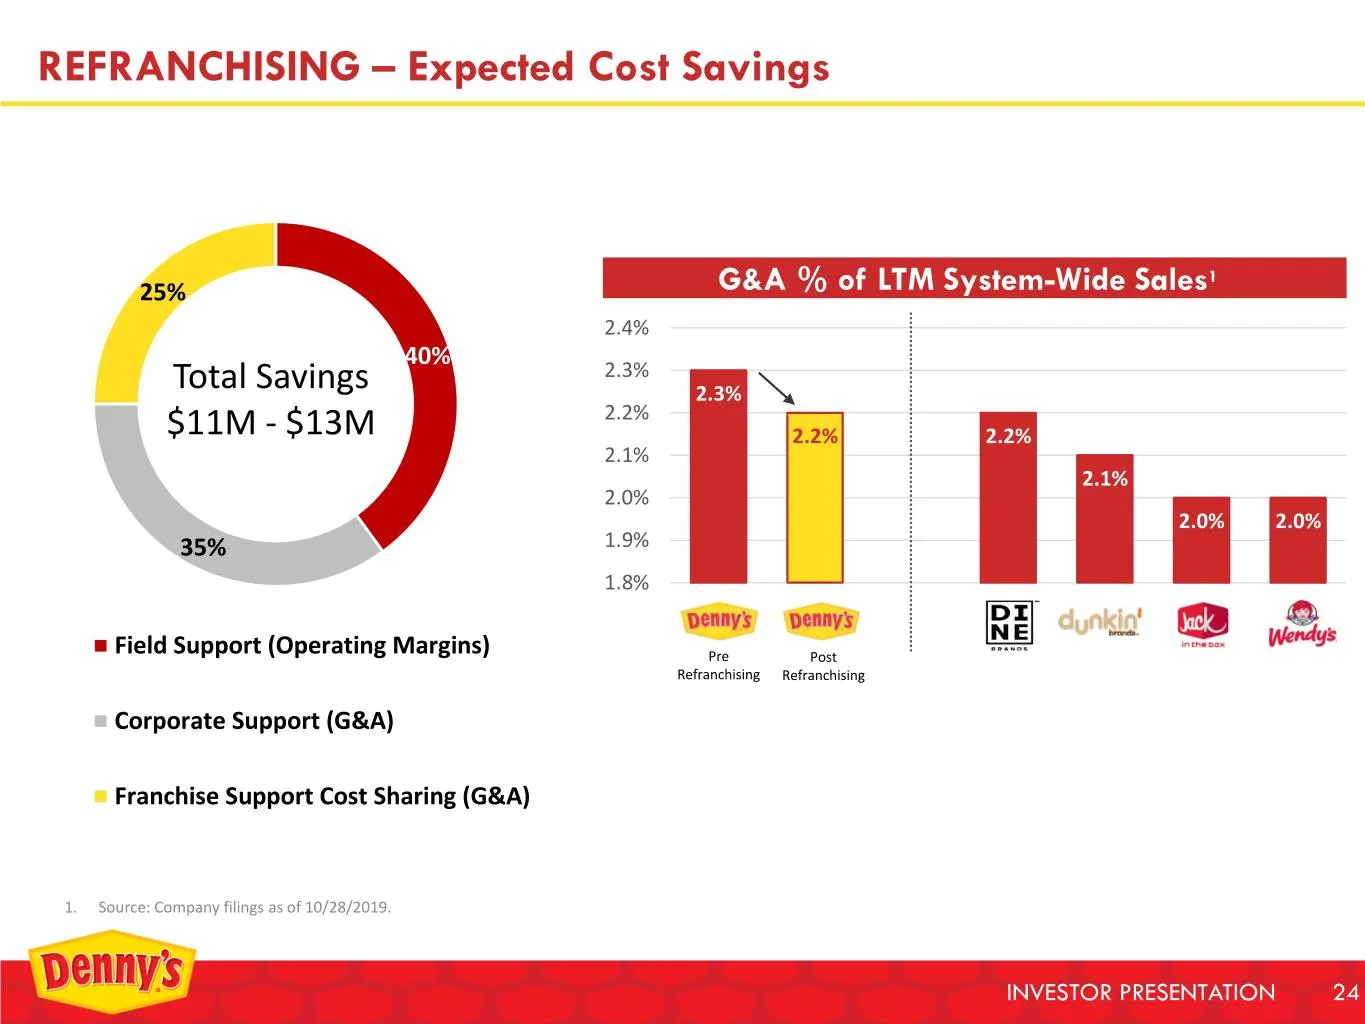
REFRANCHISING – Expected Cost Savings 1 25% G&A % of LTM System-Wide Sales 2.4% 40% 2.3% Total Savings 2.3% 2.2% $11M - $13M 2.2% 2.2% 2.1% 2.1% 2.0% 2.0% 2.0% 35% 1.9% 1.8% Field Support (Operating Margins) Pre Post Refranchising Refranchising Corporate Support (G&A) Franchise Support Cost Sharing
Slide 25: Refranchising – Debt Leverage
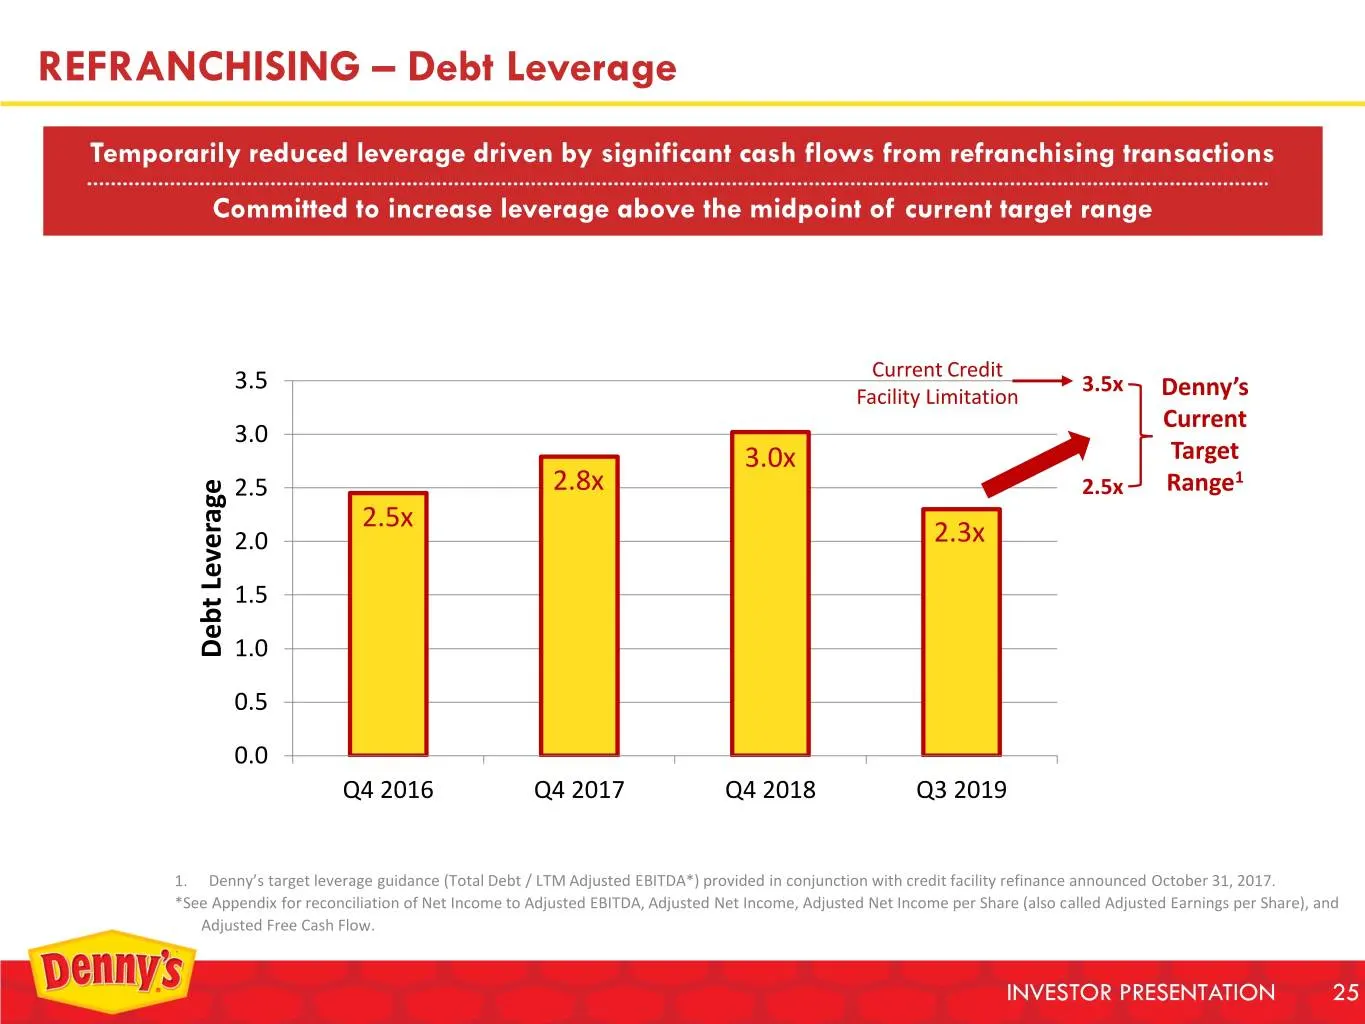
REFRANCHISING – Debt Leverage Temporarily reduced leverage driven by significant cash flows from refranchising transactions Committed to increase leverage above the midpoint of current target range Current Credit 3.5 3.5x Facility Limitation Denny’s Current 3.0 3.0x Target 2.5 2.8x 2.5x Range1 2.5x
Slide 26: Real Estate Strategy – Objectives
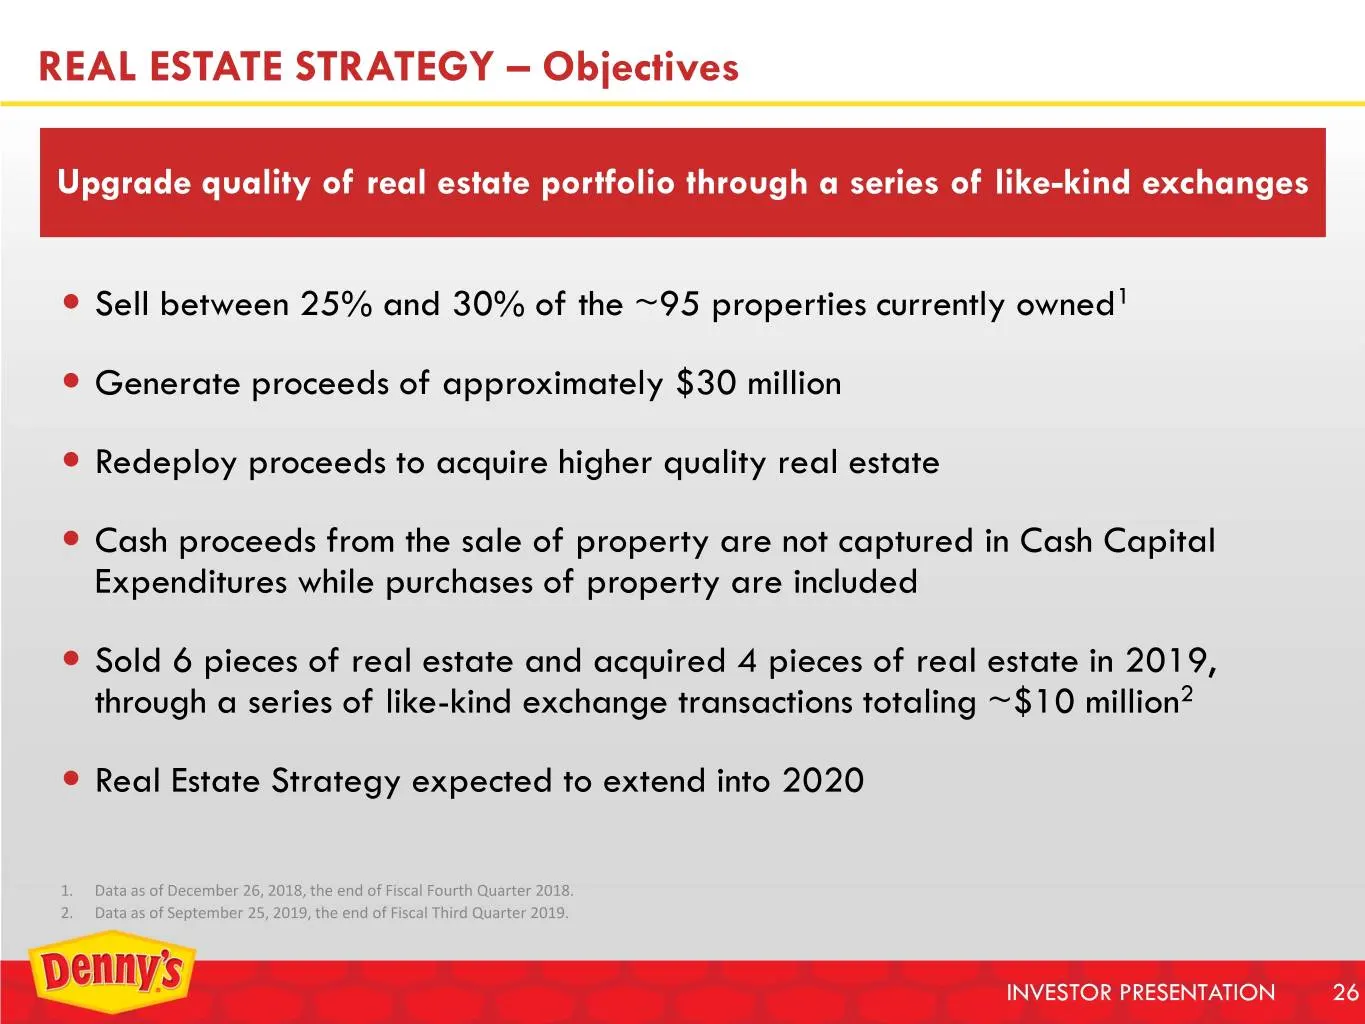
REAL ESTATE STRATEGY – Objectives Upgrade quality of real estate portfolio through a series of like-kind exchanges Sell between 25% and 30% of the ~95 properties currently owned1 Generate proceeds of approximately $30 million Redeploy proceeds to acquire higher quality real estate Cash proce

Slide 27: Recent Performance
RECENT PERFORMANCE Divider Slide: Recent Performance INVESTOR PRESENTATION 27
Slide 28: Total System Sales and Adjusted EBITDA Growth
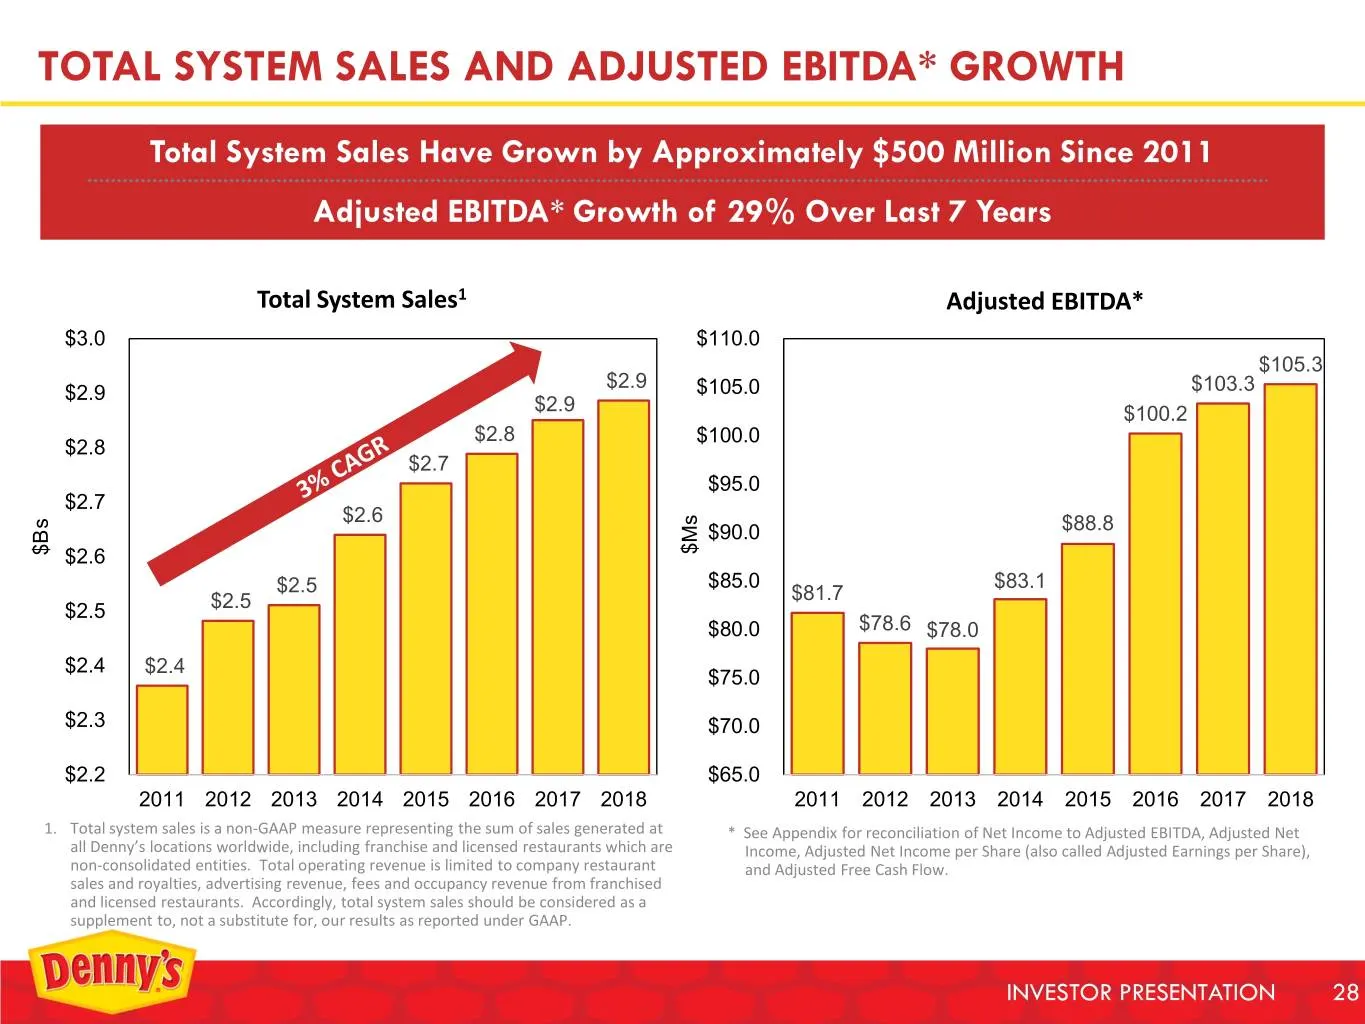
TOTAL SYSTEM SALES AND ADJUSTED EBITDA* GROWTH Total System Sales Have Grown by Approximately $500 Million Since 2011 Adjusted EBITDA* Growth of 29% Over Last 7 Years Total System Sales1 Adjusted EBITDA* $3.0 $110.0 $105.3 $2.9 $2.9 $105.0 $103.3 $2.9 $100.2 $2.8 $100.0 $2.8 $2.7 $95.0 $2.7 $2.6 $88
Slide 29: Company Sales and Margins
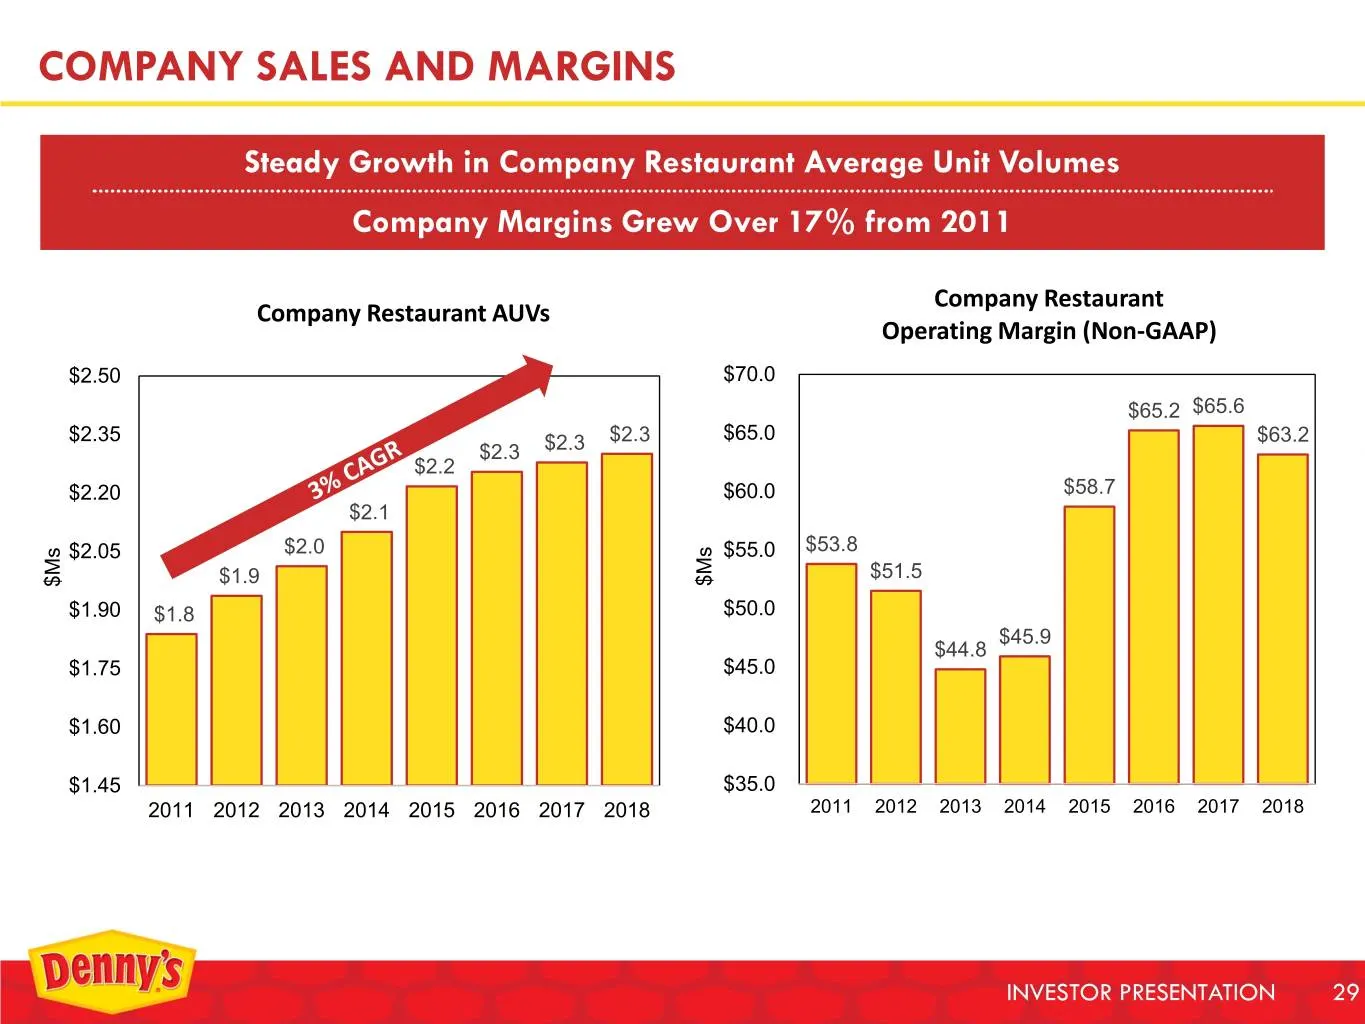
COMPANY SALES AND MARGINS Steady Growth in Company Restaurant Average Unit Volumes Company Margins Grew Over 17% from 2011 Company Restaurant Company Restaurant AUVs Operating Margin (Non-GAAP) $2.50 $70.0 $65.2 $65.6 $2.35 $2.3 $65.0 $63.2 $2.3 $2.3 $2.2 $2.20 $60.0 $58.7 $2.1 $2.05 $2.0 $55.0 $53.
Slide 30: Franchise Sales and Margins
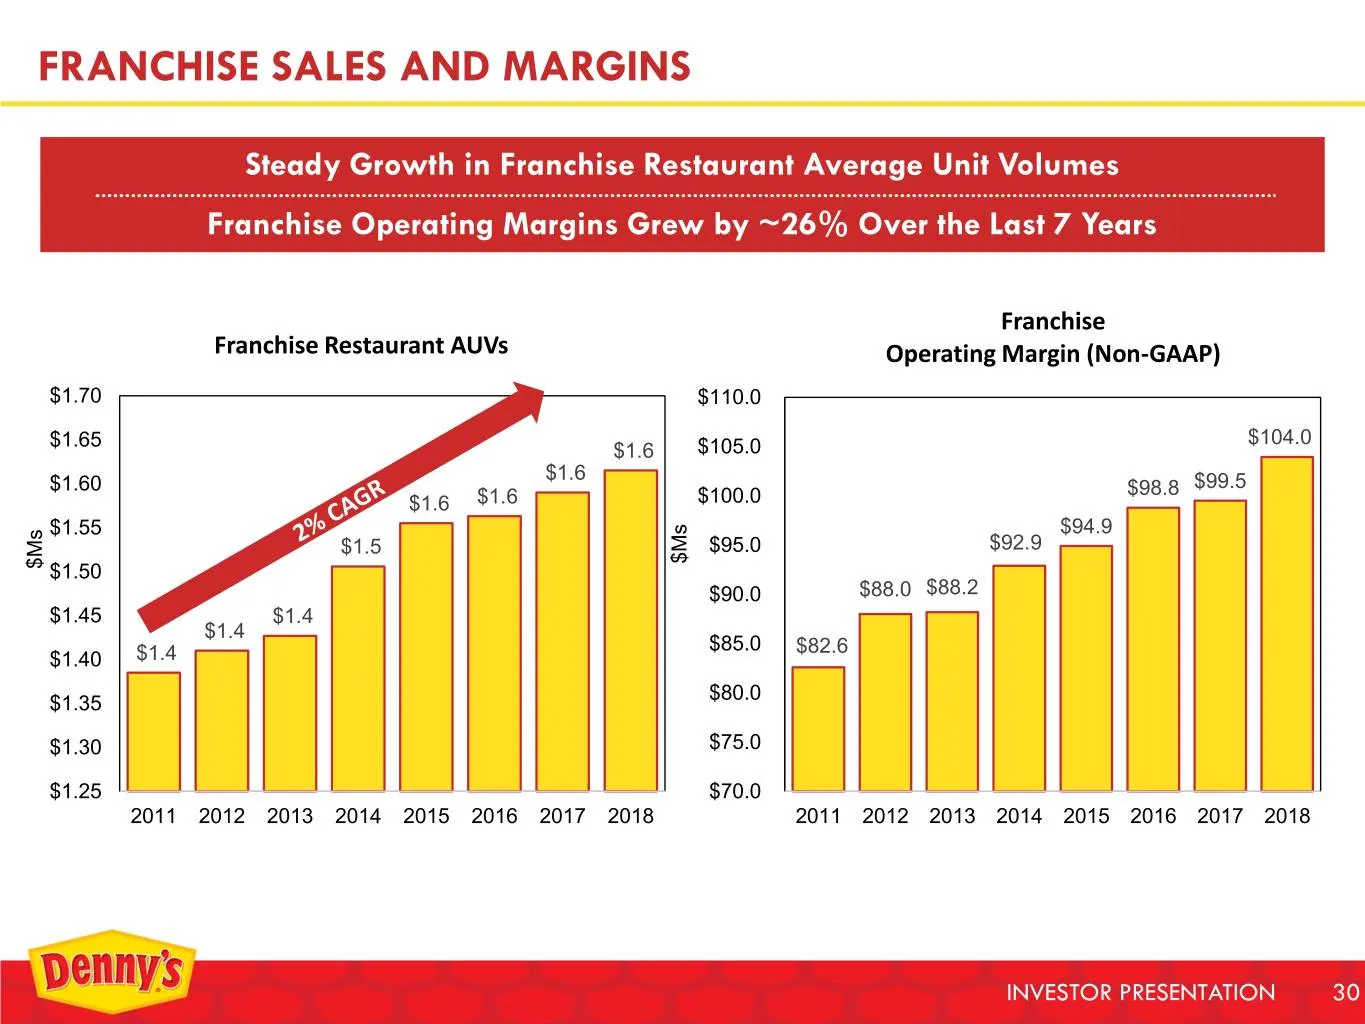
FRANCHISE SALES AND MARGINS Steady Growth in Franchise Restaurant Average Unit Volumes Franchise Operating Margins Grew by ~26% Over the Last 7 Years Franchise Franchise Restaurant AUVs Operating Margin (Non-GAAP) $1.70 $110.0 $1.65 $104.0 $1.6 $105.0 $1.6 $1.60 $98.8 $99.5 $1.6 $1.6 $100.0 $1.55 $9
Slide 31: Consistently Growing Same-Store Sales
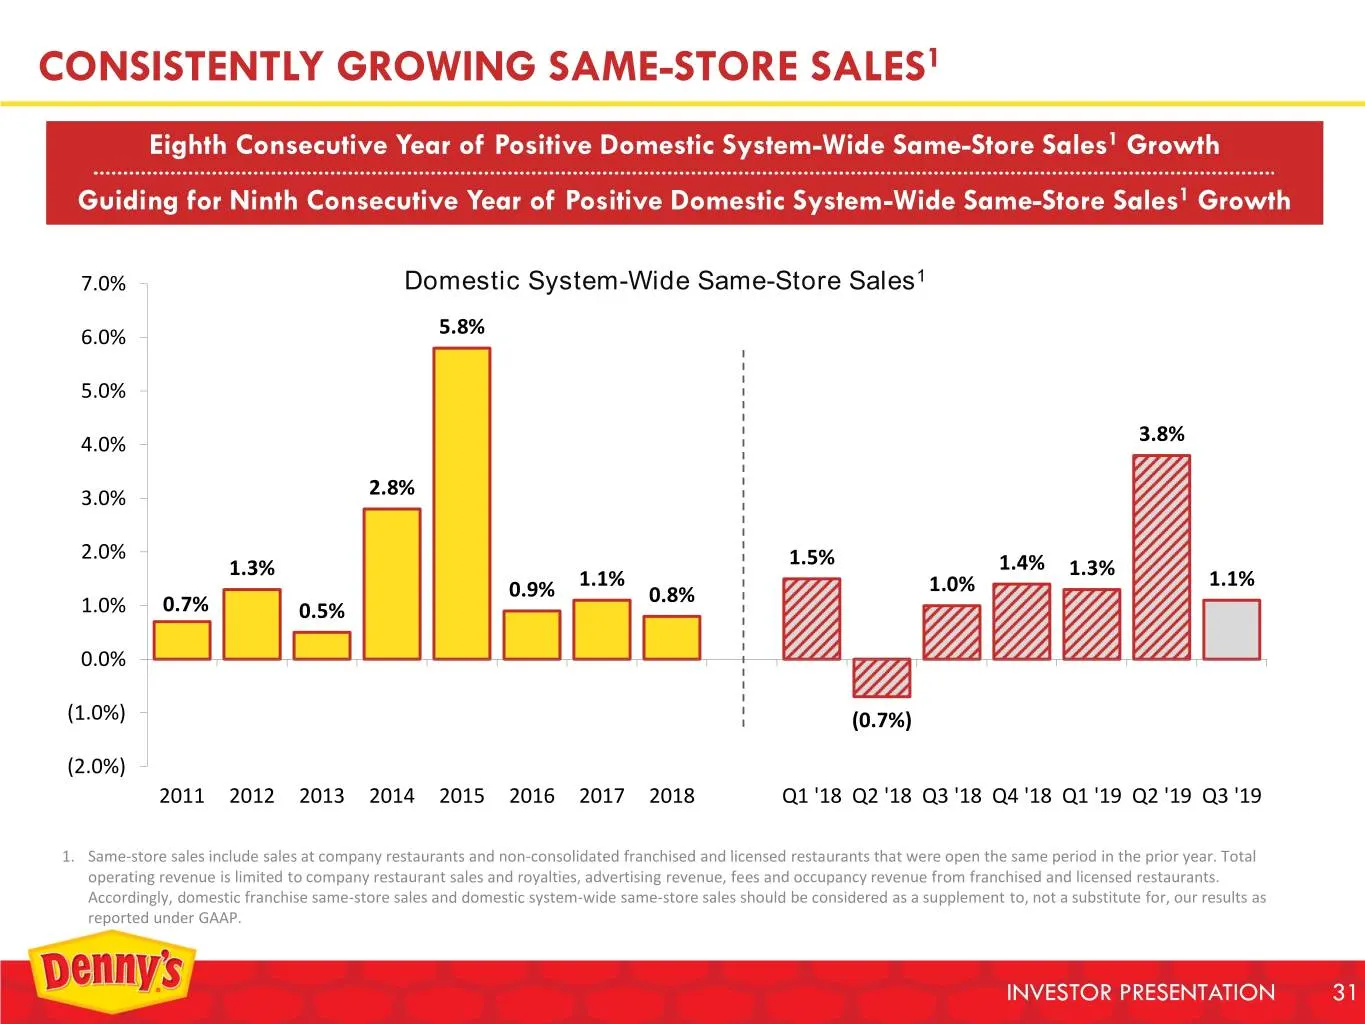
CONSISTENTLY GROWING SAME-STORE SALES1 Eighth Consecutive Year of Positive Domestic System-Wide Same-Store Sales1 Growth Guiding for Ninth Consecutive Year of Positive Domestic System-Wide Same-Store Sales1 Growth 7.0% Domestic System-Wide Same-Store Sales1 6.0% 5.8% 5.0% 4.0% 3.8% 3.0% 2.8% 2.0% 1.
Slide 32: Growing Adjusted Net Income Per Share
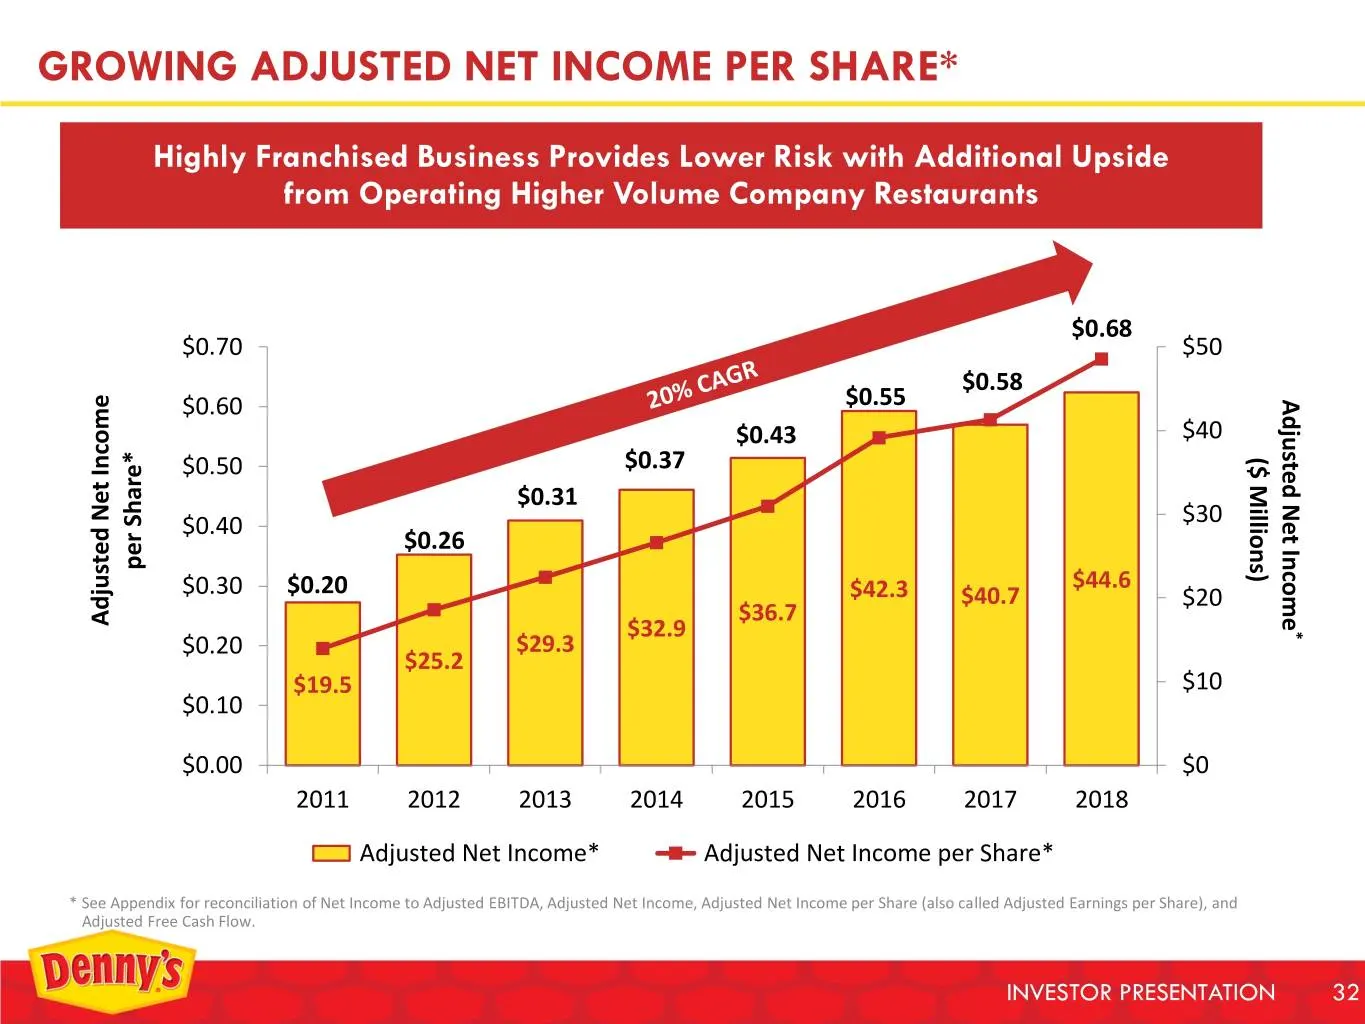
GROWING ADJUSTED NET INCOME PER SHARE* Highly Franchised Business Provides Lower Risk with Additional Upside from Operating Higher Volume Company Restaurants $0.68 $0.70 $50 $0.58 $0.60 $0.55 Adjusted Net Income $0.43 $40 $0.50 $0.37 ($Millions) $0.31 $0.40 $30 $0.26 per Share* per $44.6 $0.30 $0.20
Slide 33: Strong Adjusted Free Cash Flow Generation
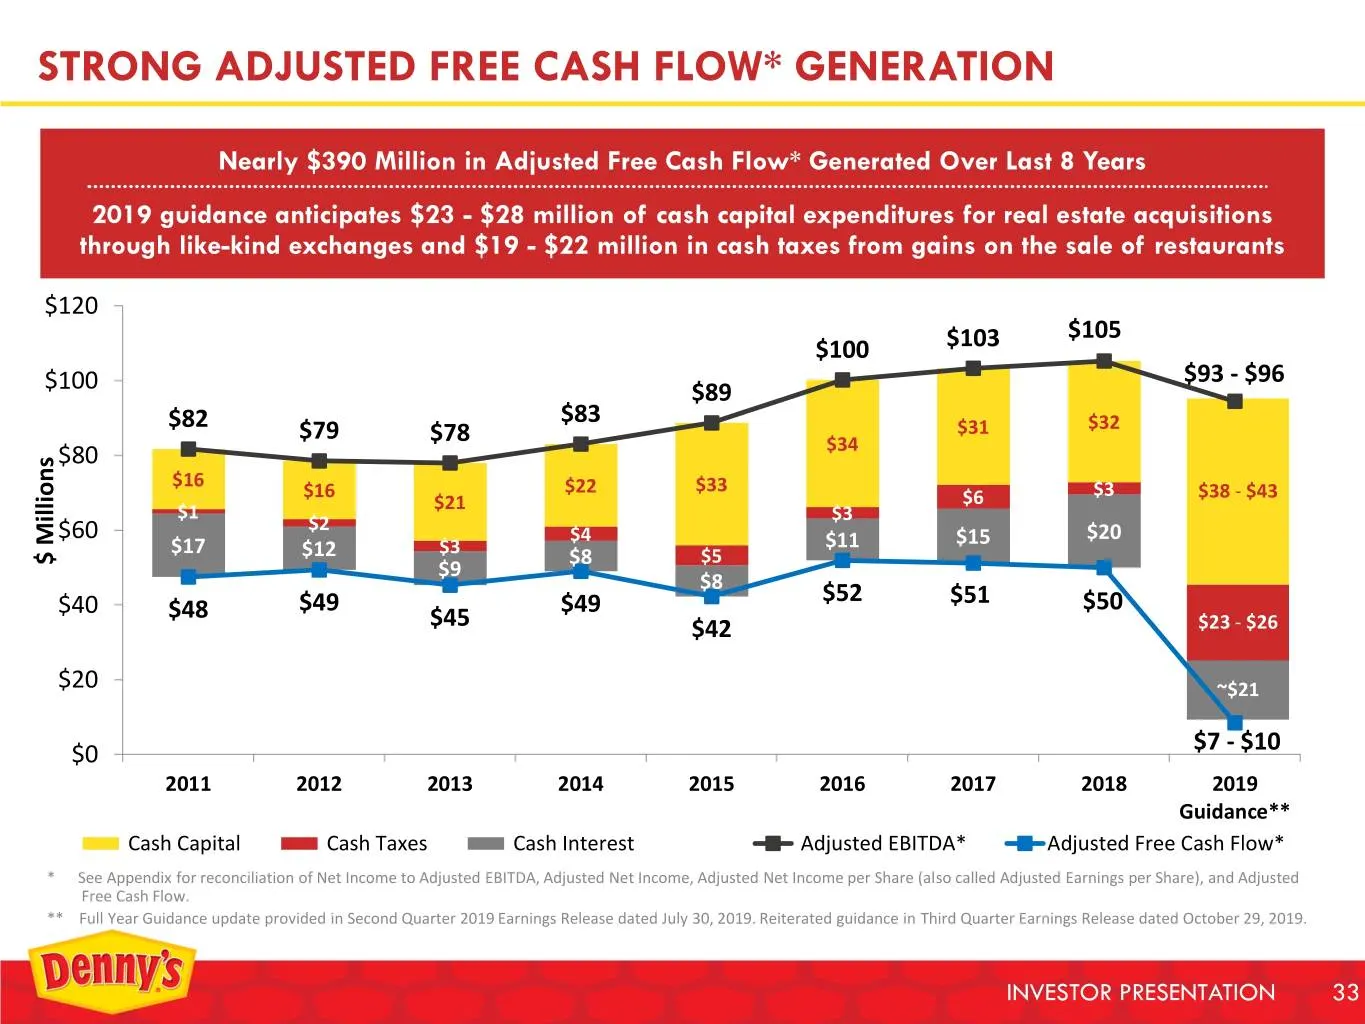
STRONG ADJUSTED FREE CASH FLOW* GENERATION Nearly $390 Million in Adjusted Free Cash Flow* Generated Over Last 8 Years 2019 guidance anticipates $23 - $28 million of cash capital expenditures for real estate acquisitions through like-kind exchanges and $19 - $22 million in cash taxes from gains on t
Slide 34: Solid Balance Sheet with Flexibility
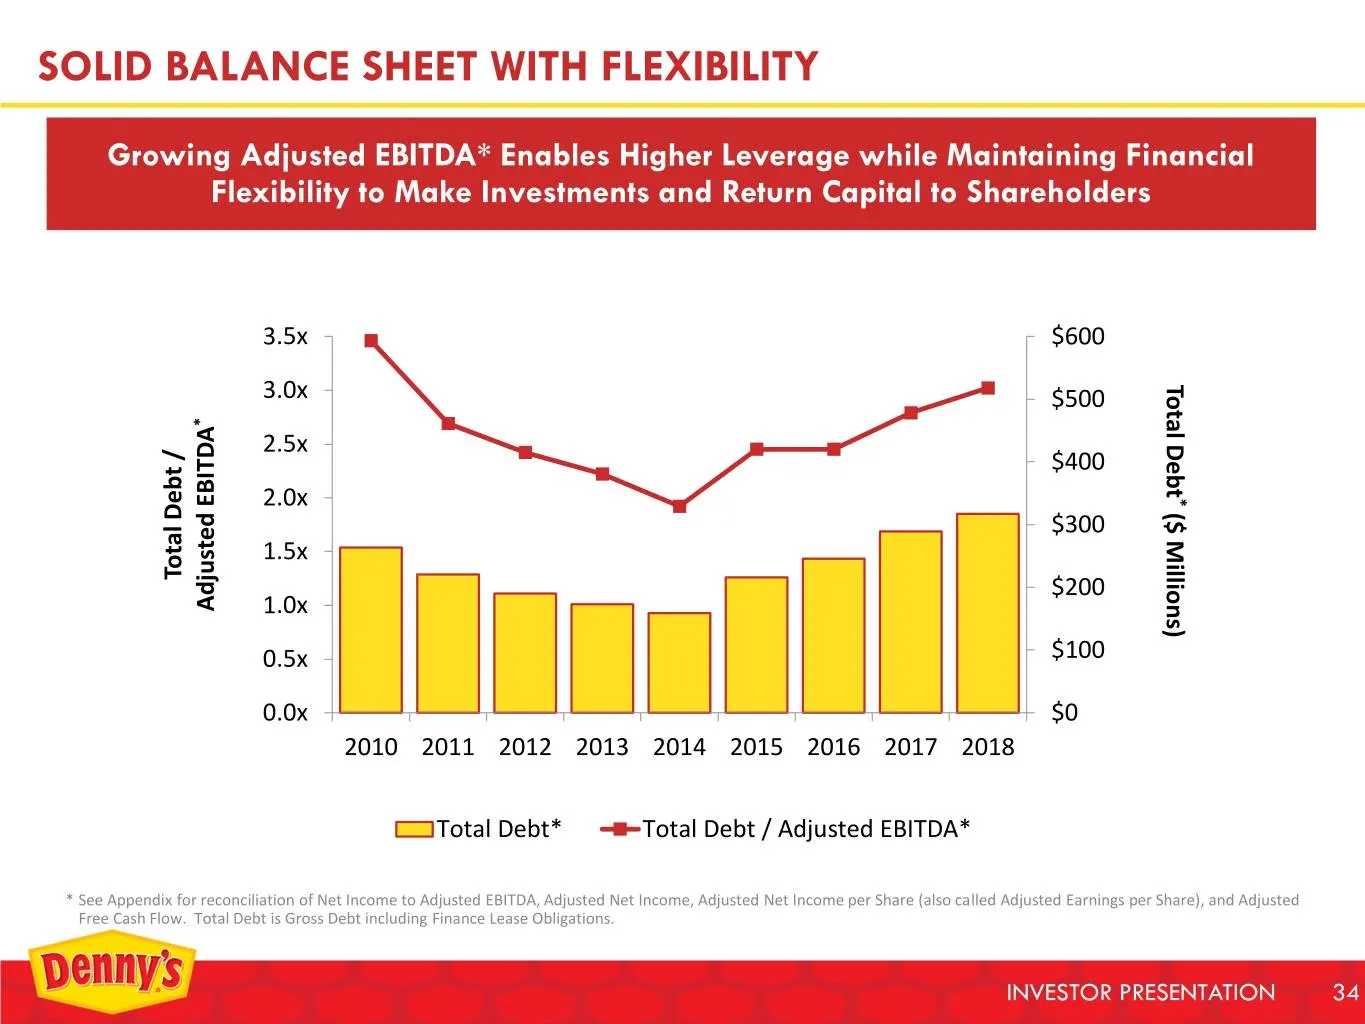
SOLID BALANCE SHEET WITH FLEXIBILITY Growing Adjusted EBITDA* Enables Higher Leverage while Maintaining Financial Flexibility to Make Investments and Return Capital to Shareholders 3.5x $600 Total Debt 3.0x $500 * 2.5x $400 2.0x * $300 ($Millions) 1.5x Total Debt / Debt Total $200 Adjusted EBITDA Ad
Slide 35: Consistently Returning Excess Capital to Shareholders
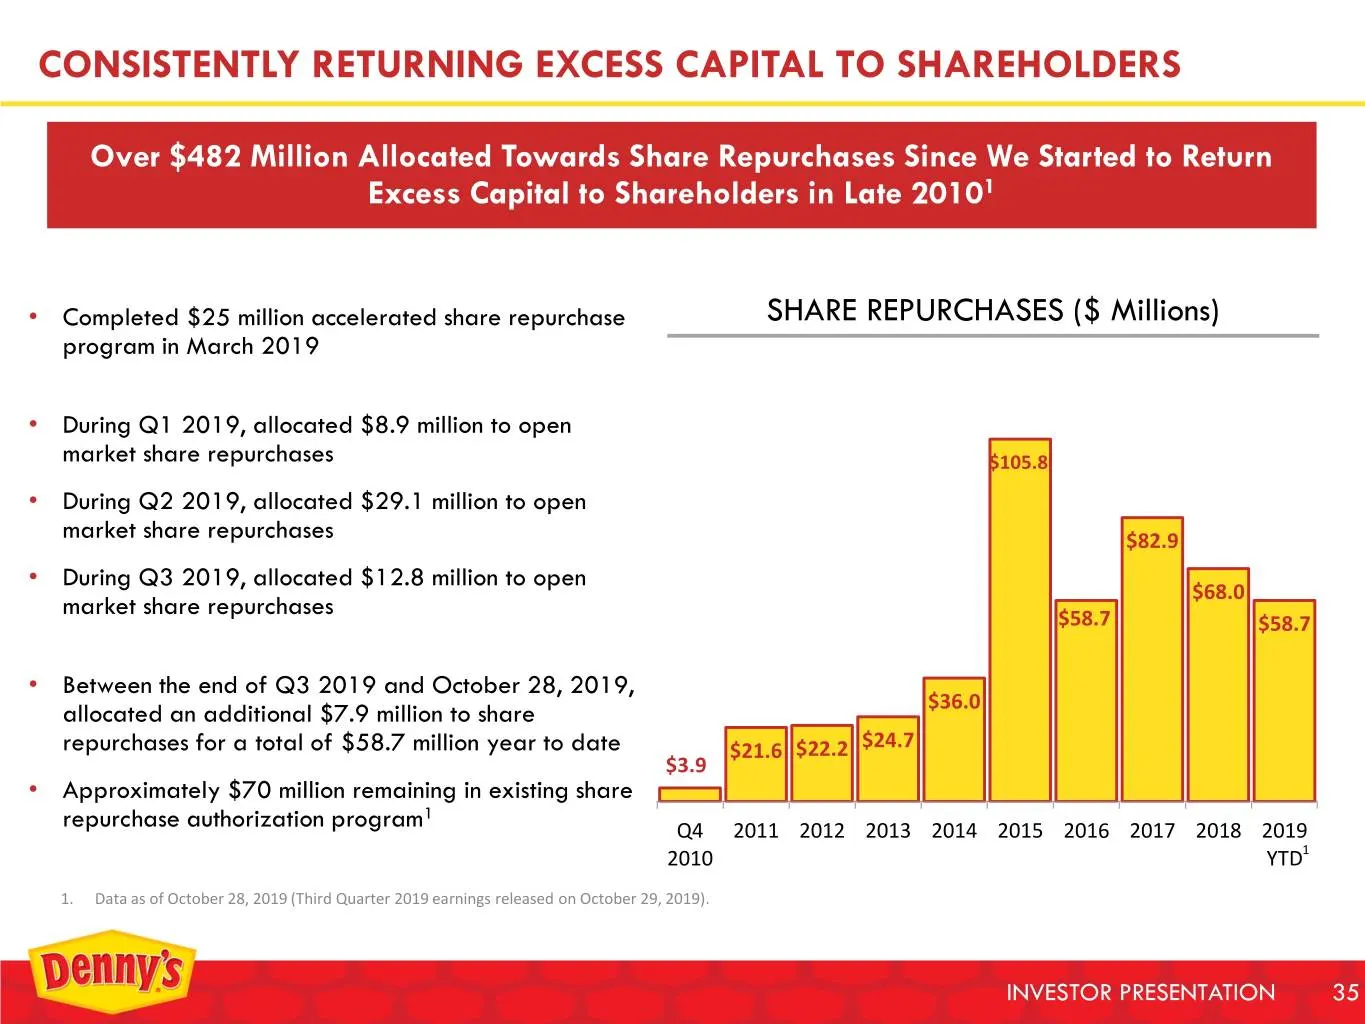
CONSISTENTLY RETURNING EXCESS CAPITAL TO SHAREHOLDERS Over $482 Million Allocated Towards Share Repurchases Since We Started to Return Excess Capital to Shareholders in Late 20101 • Completed $25 million accelerated share repurchase SHARE REPURCHASES ($ Millions) program in March 2019 • During Q1 20
Slide 36: Stock Price Outperformance
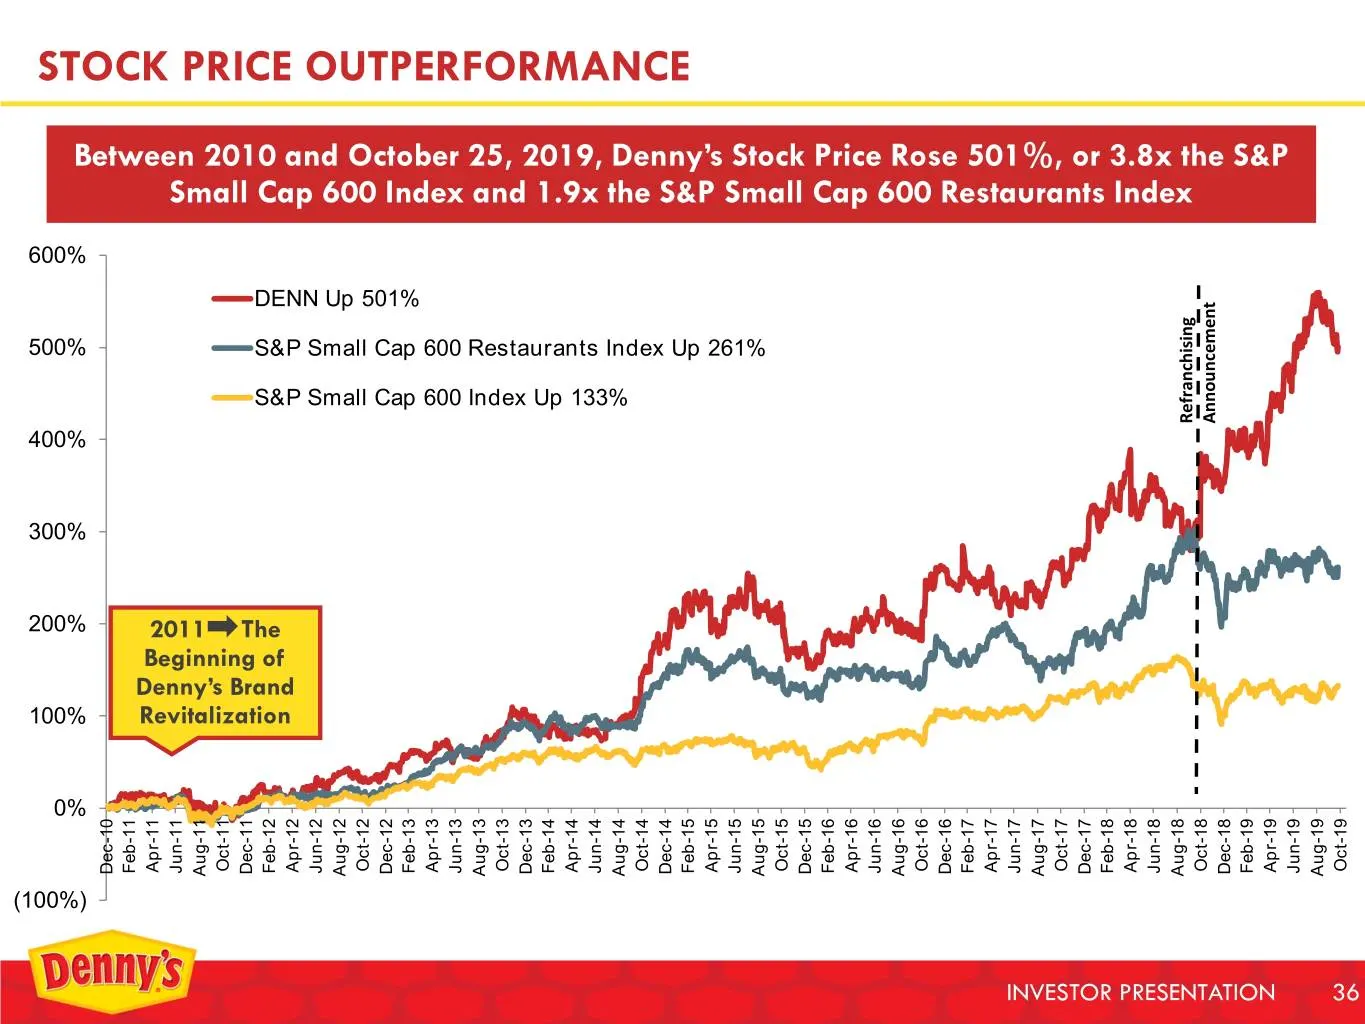
STOCK PRICE OUTPERFORMANCE Between 2010 and October 25, 2019, Denny’s Stock Price Rose 501%, or 3.8x the S&P Small Cap 600 Index and 1.9x the S&P Small Cap 600 Restaurants Index 600% DENN Up 501% 500% S&P Small Cap 600 Restaurants Index Up 261% S&P Small Cap 600 Index Up 133% Refranchising Announcem
Slide 37: Denny's Investment Highlights
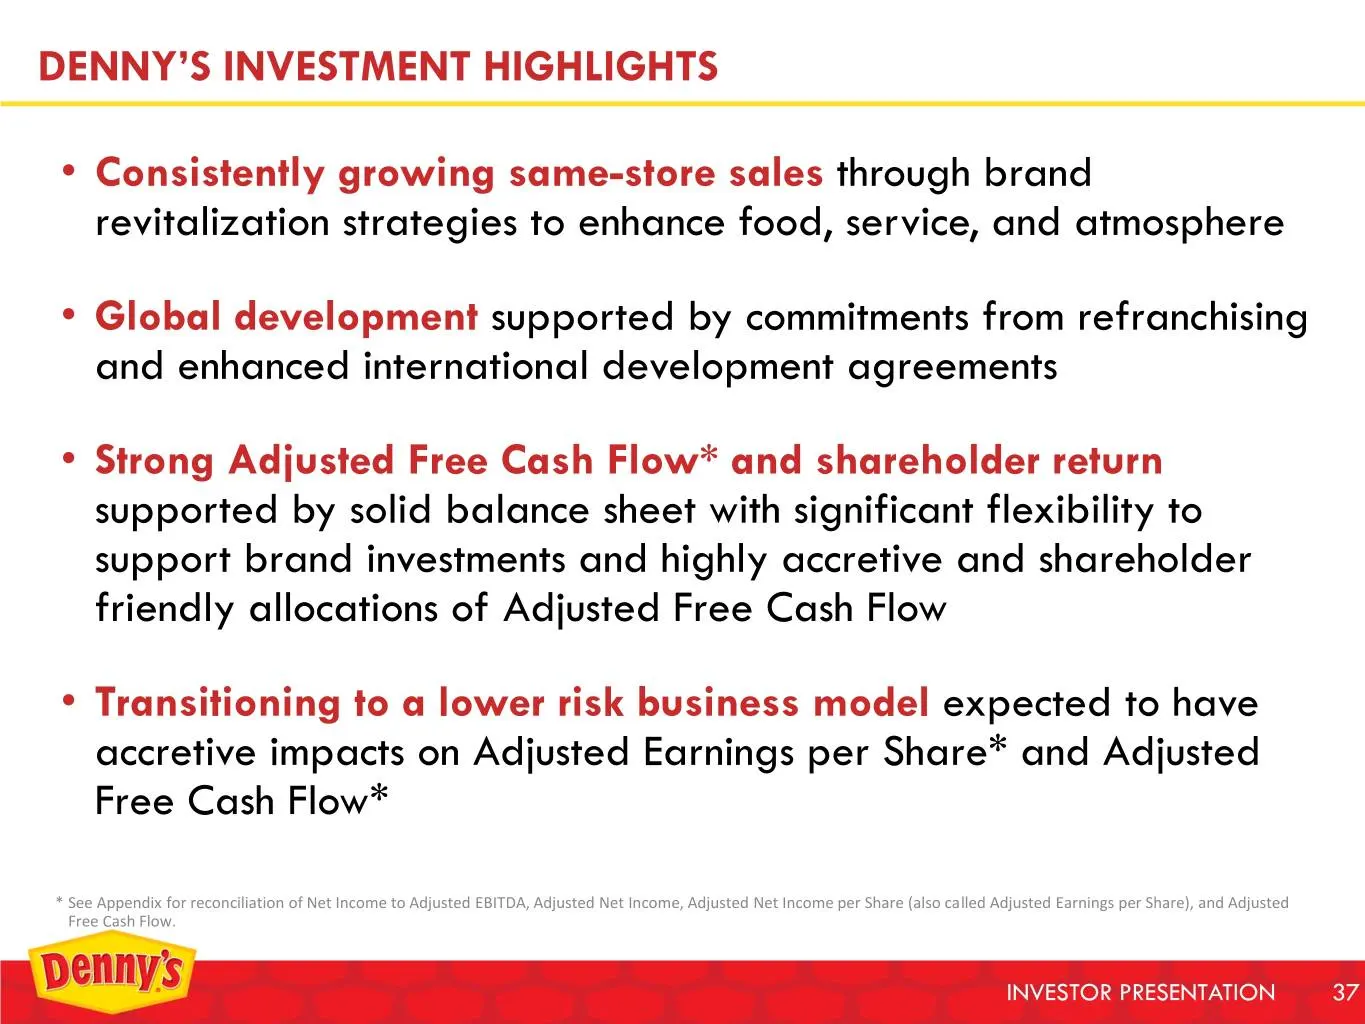
DENNY’S INVESTMENT HIGHLIGHTS • Consistently growing same-store sales through brand revitalization strategies to enhance food, service, and atmosphere • Global development supported by commitments from refranchising and enhanced international development agreements • Strong Adjusted Free Cash Flow*

Slide 38: Appendix
APPENDIX INVESTOR PRESENTATION 38
Slide 39: Experienced and Committed Leadership Team
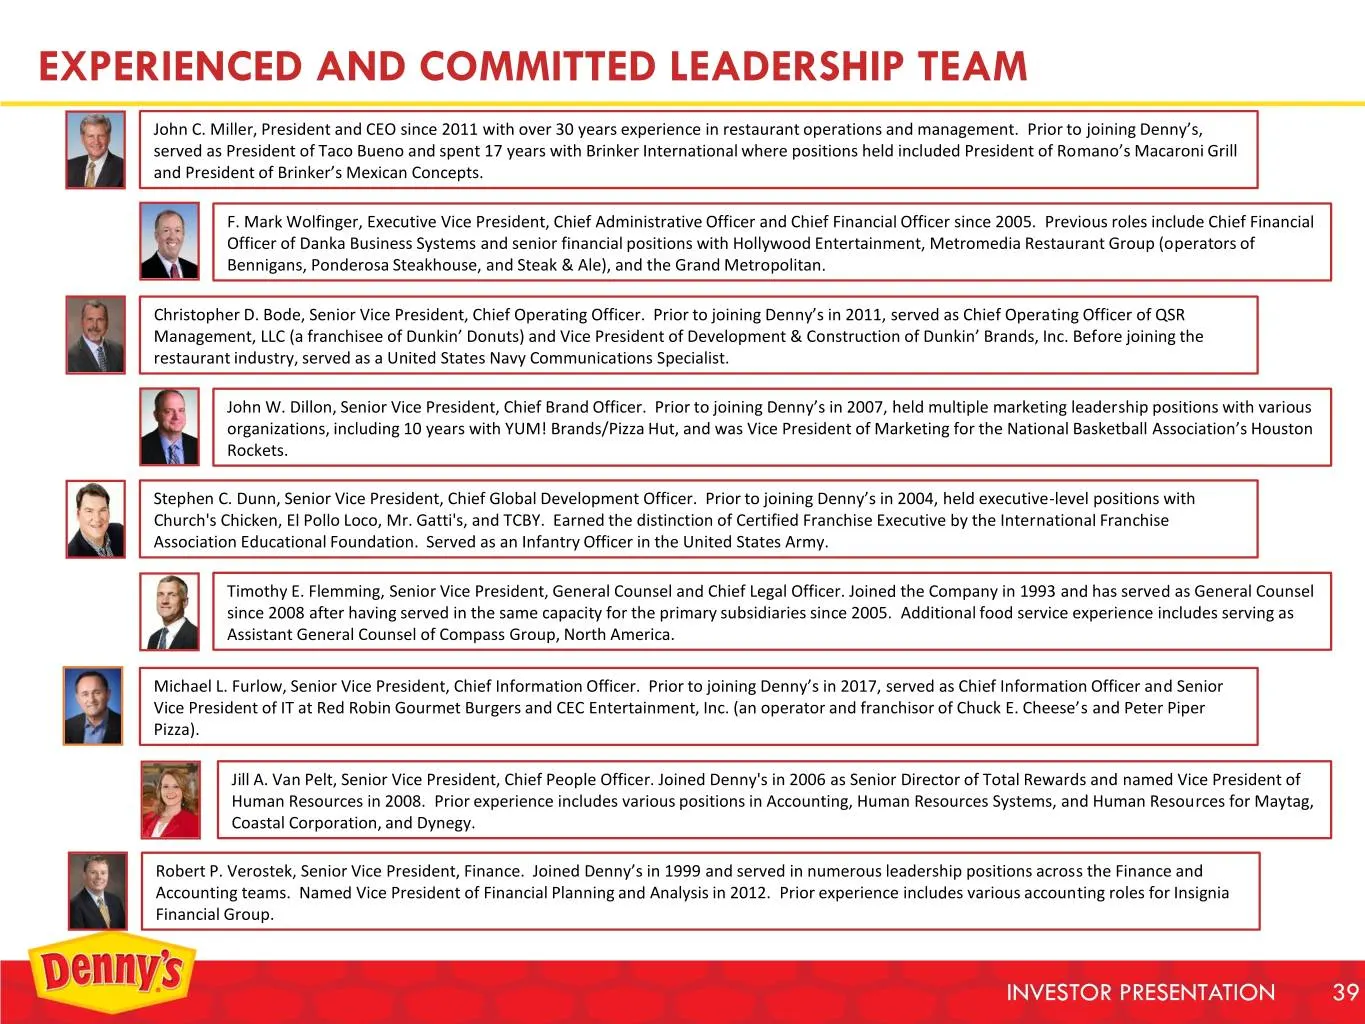
EXPERIENCED AND COMMITTED LEADERSHIP TEAM John C. Miller, President and CEO since 2011 with over 30 years experience in restaurant operations and management. Prior to joining Denny’s, served as President of Taco Bueno and spent 17 years with Brinker International where positions held included Presid

Slide 40: Awards and Commendations
AWARDS AND COMMENDATIONS • National Association of Corporate Directors (NACD) Directorship 100 2017 (Brenda Lauderback) • Latino Leaders Magazine Most Relevant Latinos in Board Service in the Nation 2017 (José Gutiérrez) • Nations Restaurant News Norman Award 2017 (John C. Miller) • TDn2K Global Bes
Slide 41: Non-GAAP Financial Reconciliations
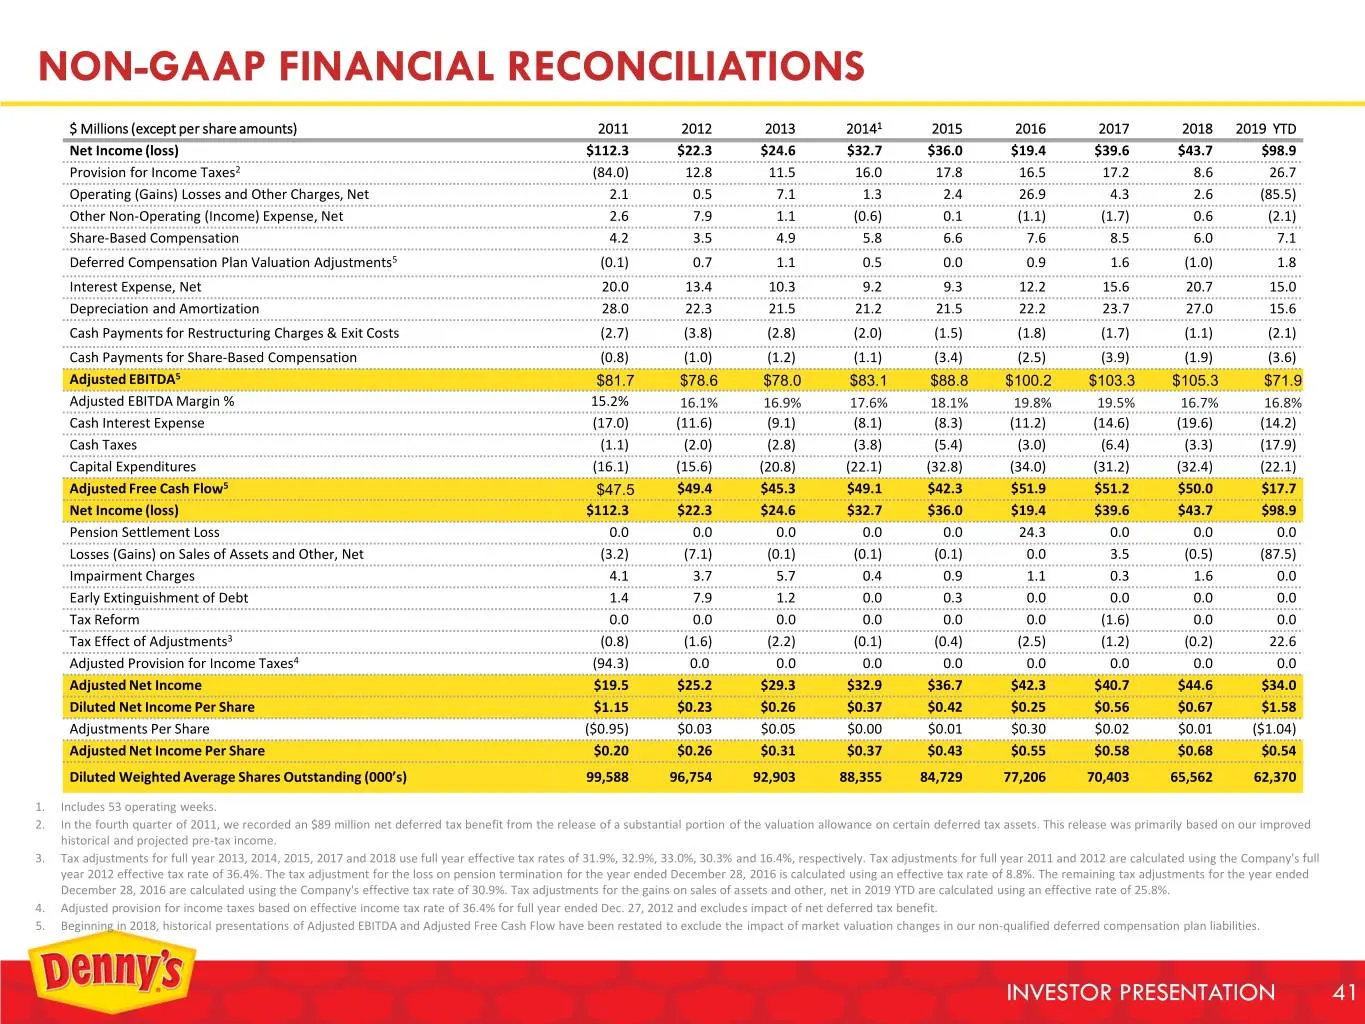
NON-GAAP FINANCIAL RECONCILIATIONS $ Millions (except per share amounts) 2011 2012 2013 20141 2015 2016 2017 2018 2019 YTD Net Income (loss) $112.3 $22.3 $24.6 $32.7 $36.0 $19.4 $39.6 $43.7 $98.9 Provision for Income Taxes2 (84.0) 12.8 11.5 16.0 17.8 16.5 17.2 8.6 26.7 Operating (Gains) Losses and O
Source: SEC EDGAR · 8-K filed Oct 30, 2019
More decks from Dennys Corp
 Investor Presentation (August 2025)30 slides · Aug 4, 2025
 Investor Presentation (May 2025)32 slides · May 2025
 Investor Presentation (February 2025)32 slides · February 2025
 Investor Presentation (January 2025)32 slides · Jan 13, 2025
 Investor Day (October 2024)137 slides · Oct 22, 2024
 Q2 2024 Earnings Presentation22 slides · Jul 30, 2024