TMS International — Investor Presentation (February 2013)
21 slides from TMS International's investor presentation, Feb 19, 2013
Slide 1: Investing in TMS: An Overview
Exhibit 99.1 Investing in TMS: An Overview
Slide 2: Safe harbor provision
Safe harbor provision This presentation includes forward-looking statements within the meaning of Section 27A of the Securities Act of 1933, (the “Exchange Act”), as amended, and Section 21E of the Securities Exchange Act of 1934, as amended, with respect to our financial condition, results of opera
Slide 3: Why invest in TMS?
Why invest in TMS? Market-leading global industrial services provider Significant growth profile Long-term contracted revenue and variable cost structure Experienced and proven management team Superior financial strength and liquidity Strong cash flow generation drives earnings growth 2
Slide 4: TMS enables steel producers to lower costs and generate operational efficiencies
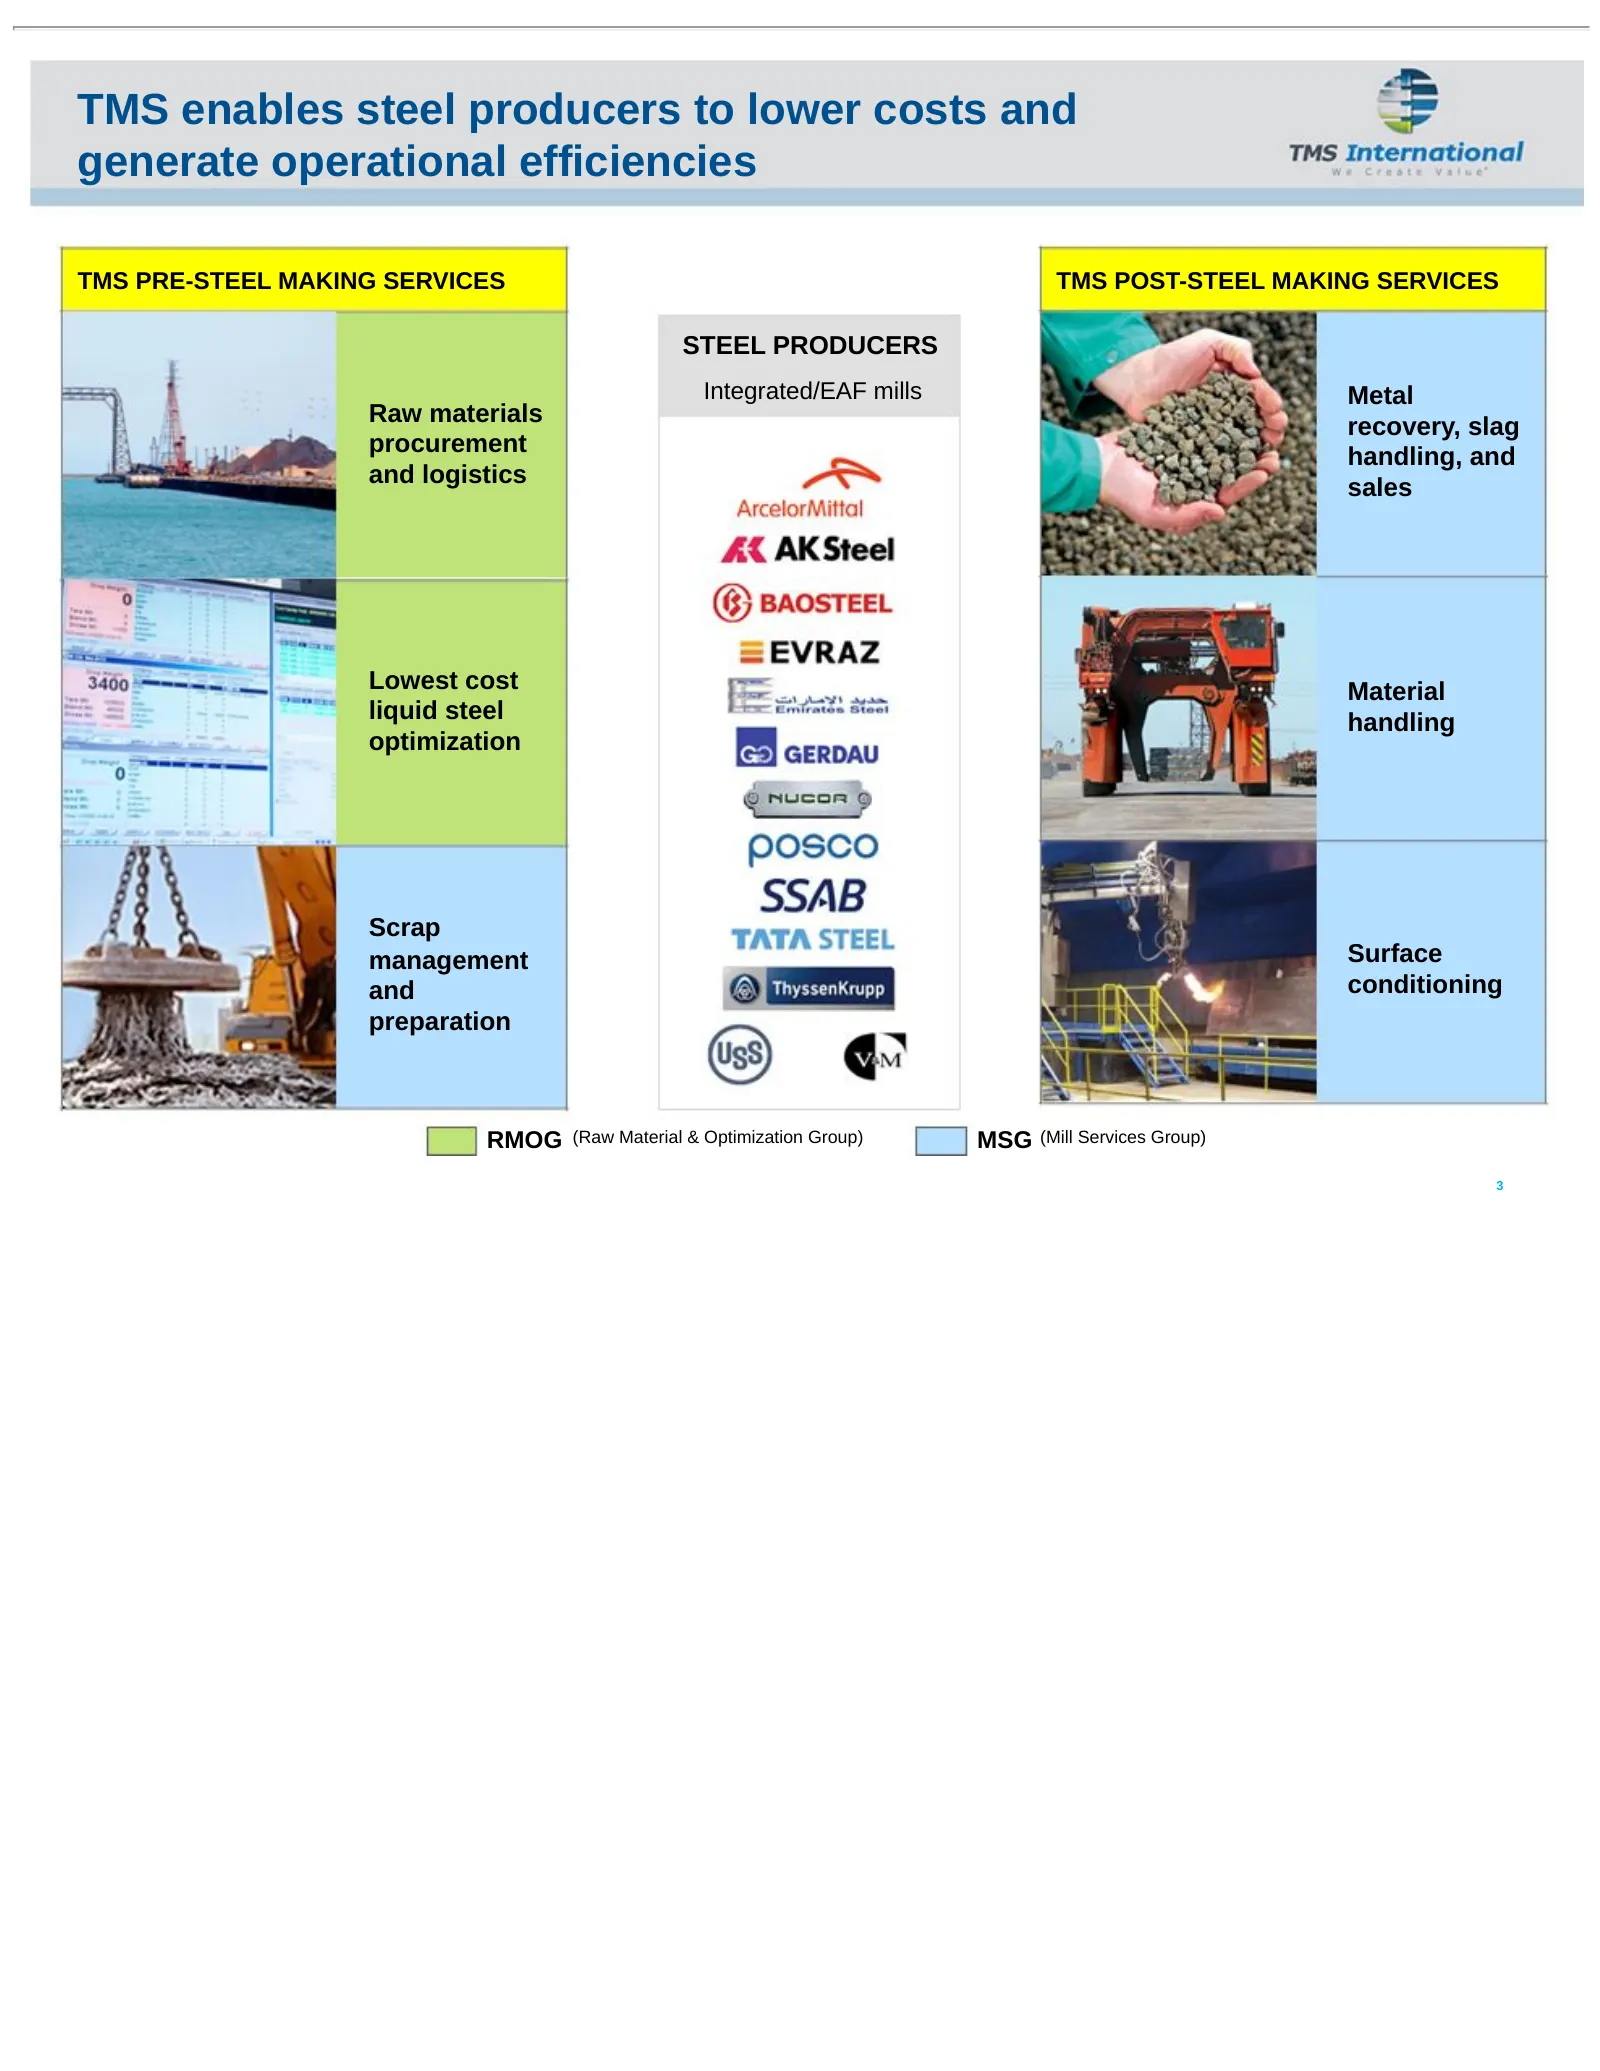
TMS enables steel producers to lower costs and generate operational efficiencies TMS PRE-STEEL MAKING SERVICES TMS POST-STEEL MAKING SERVICES STEEL PRODUCERS Integrated/EAF mills Metal Raw materials recovery, slag procurement handling, and and logistics sales Lowest cost Material liquid steel handli
Slide 5: TMS' global footprint and established platform for growth
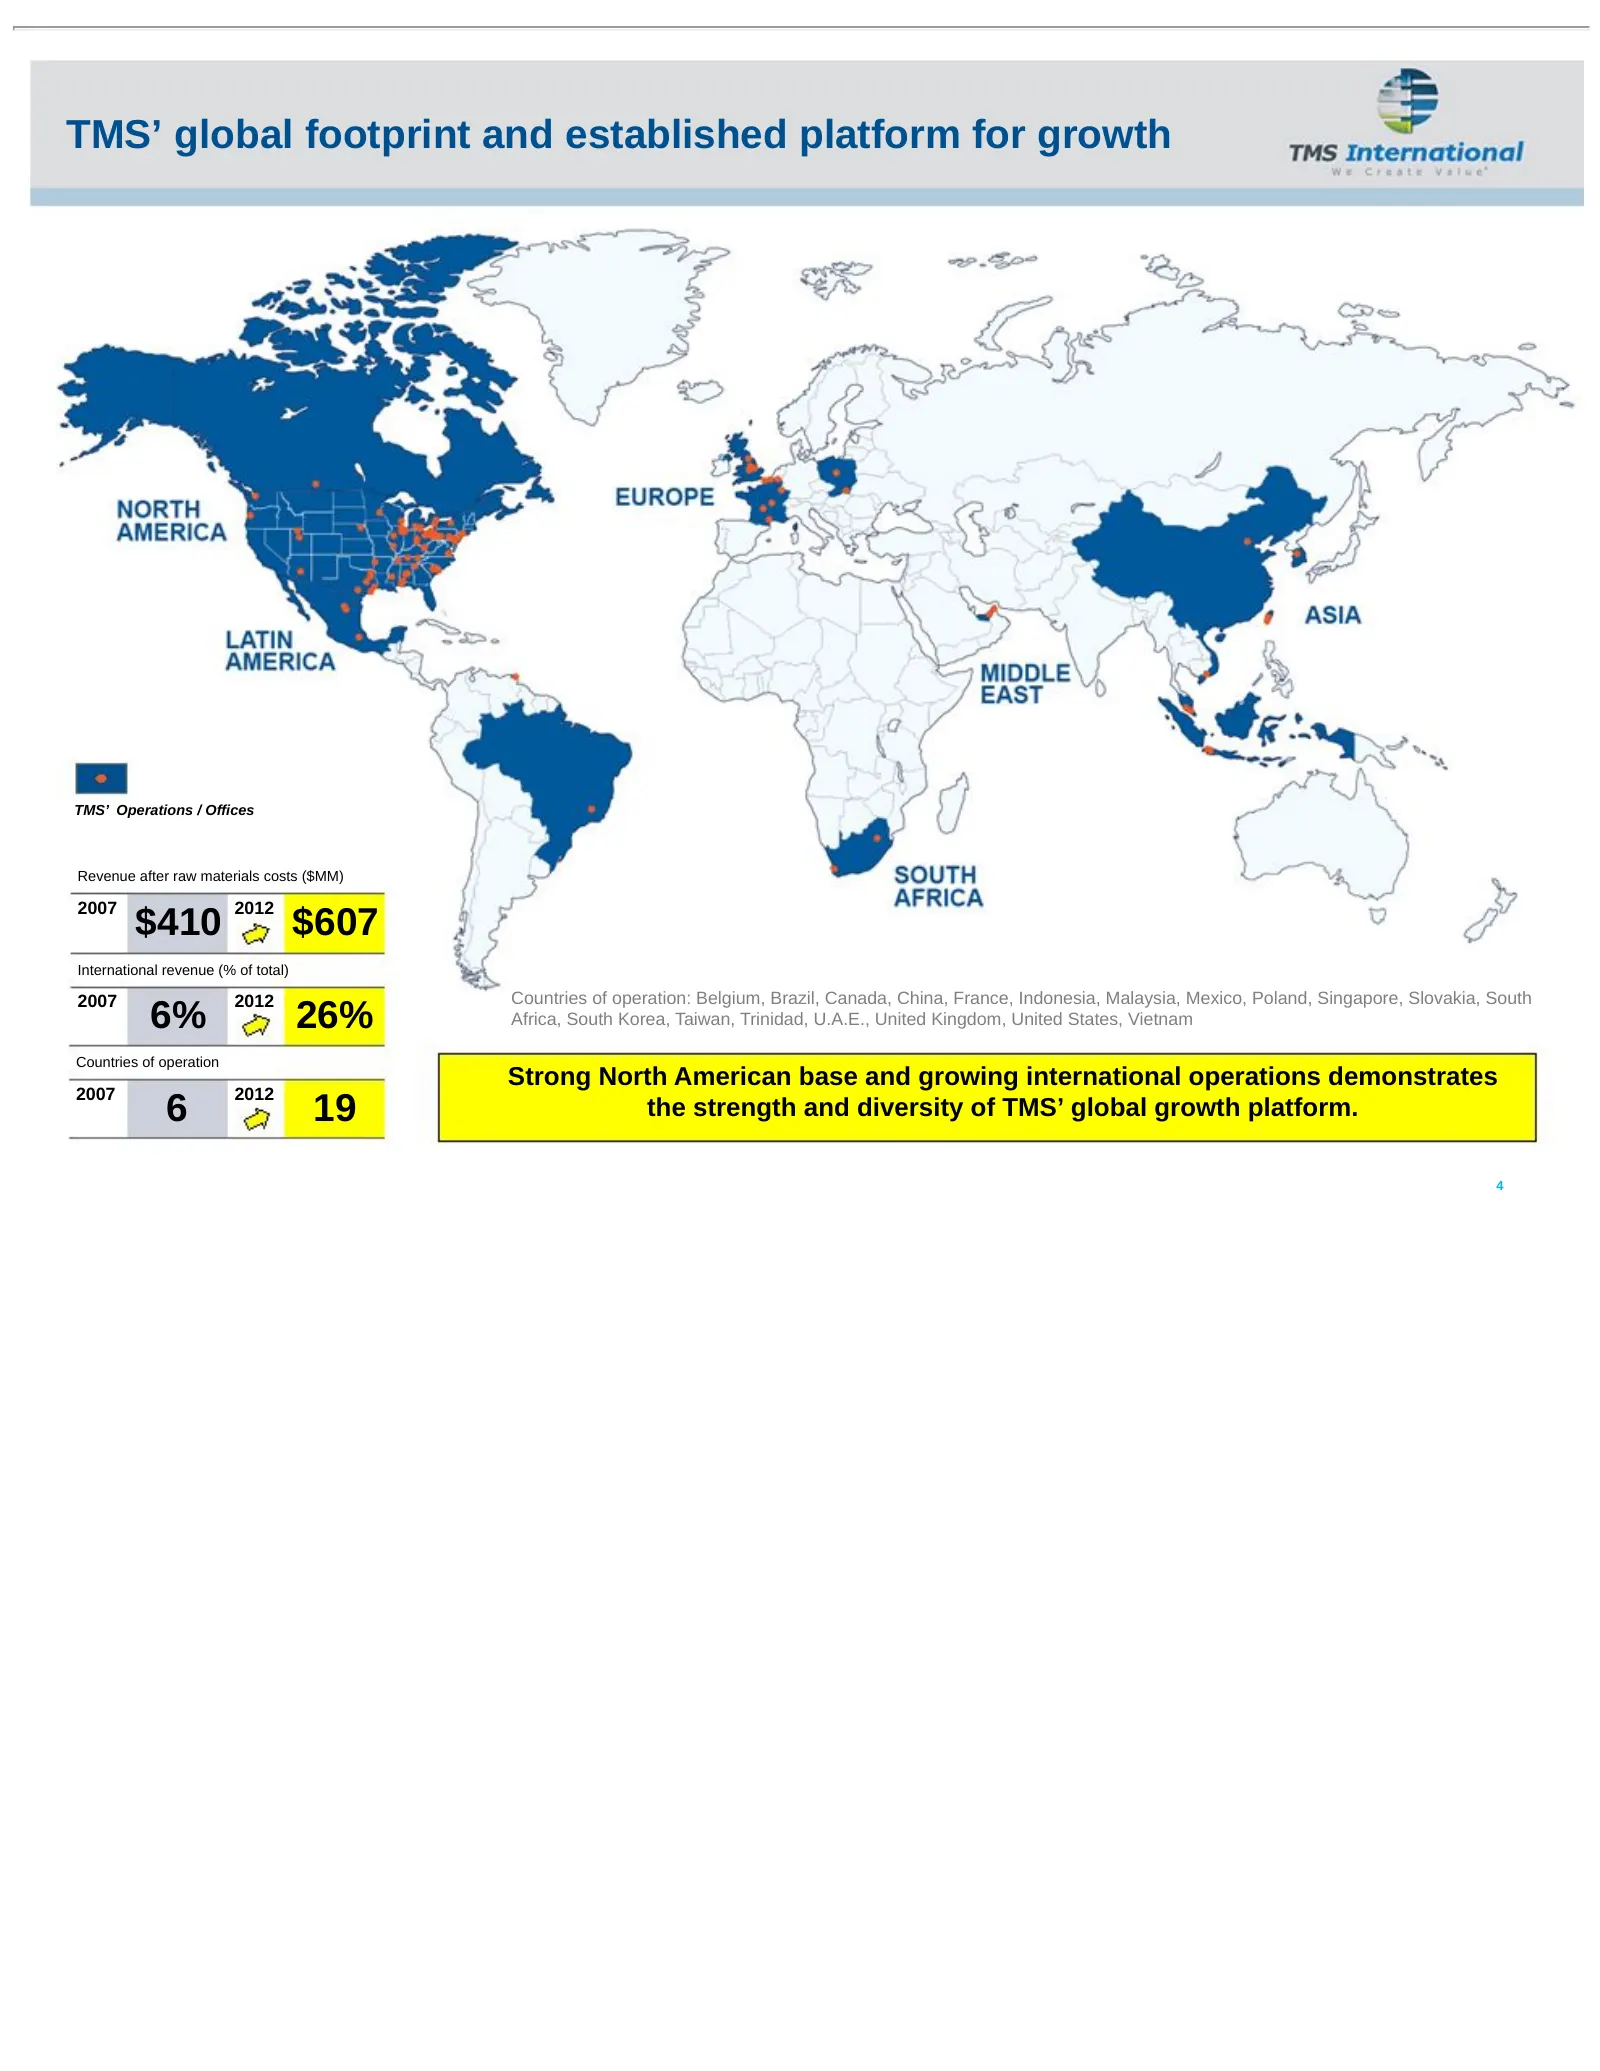
TMS’ global footprint and established platform for growth TMS’ Operations / Offices Revenue after raw materials costs ($MM) 2007 2012 $410 $607 International revenue (% of total) 2007 2012 Countries of operation: Belgium, Brazil, Canada, China, France, Indonesia, Malaysia, Mexico, Poland, Singapore,
Slide 6: TMS – A global growth story
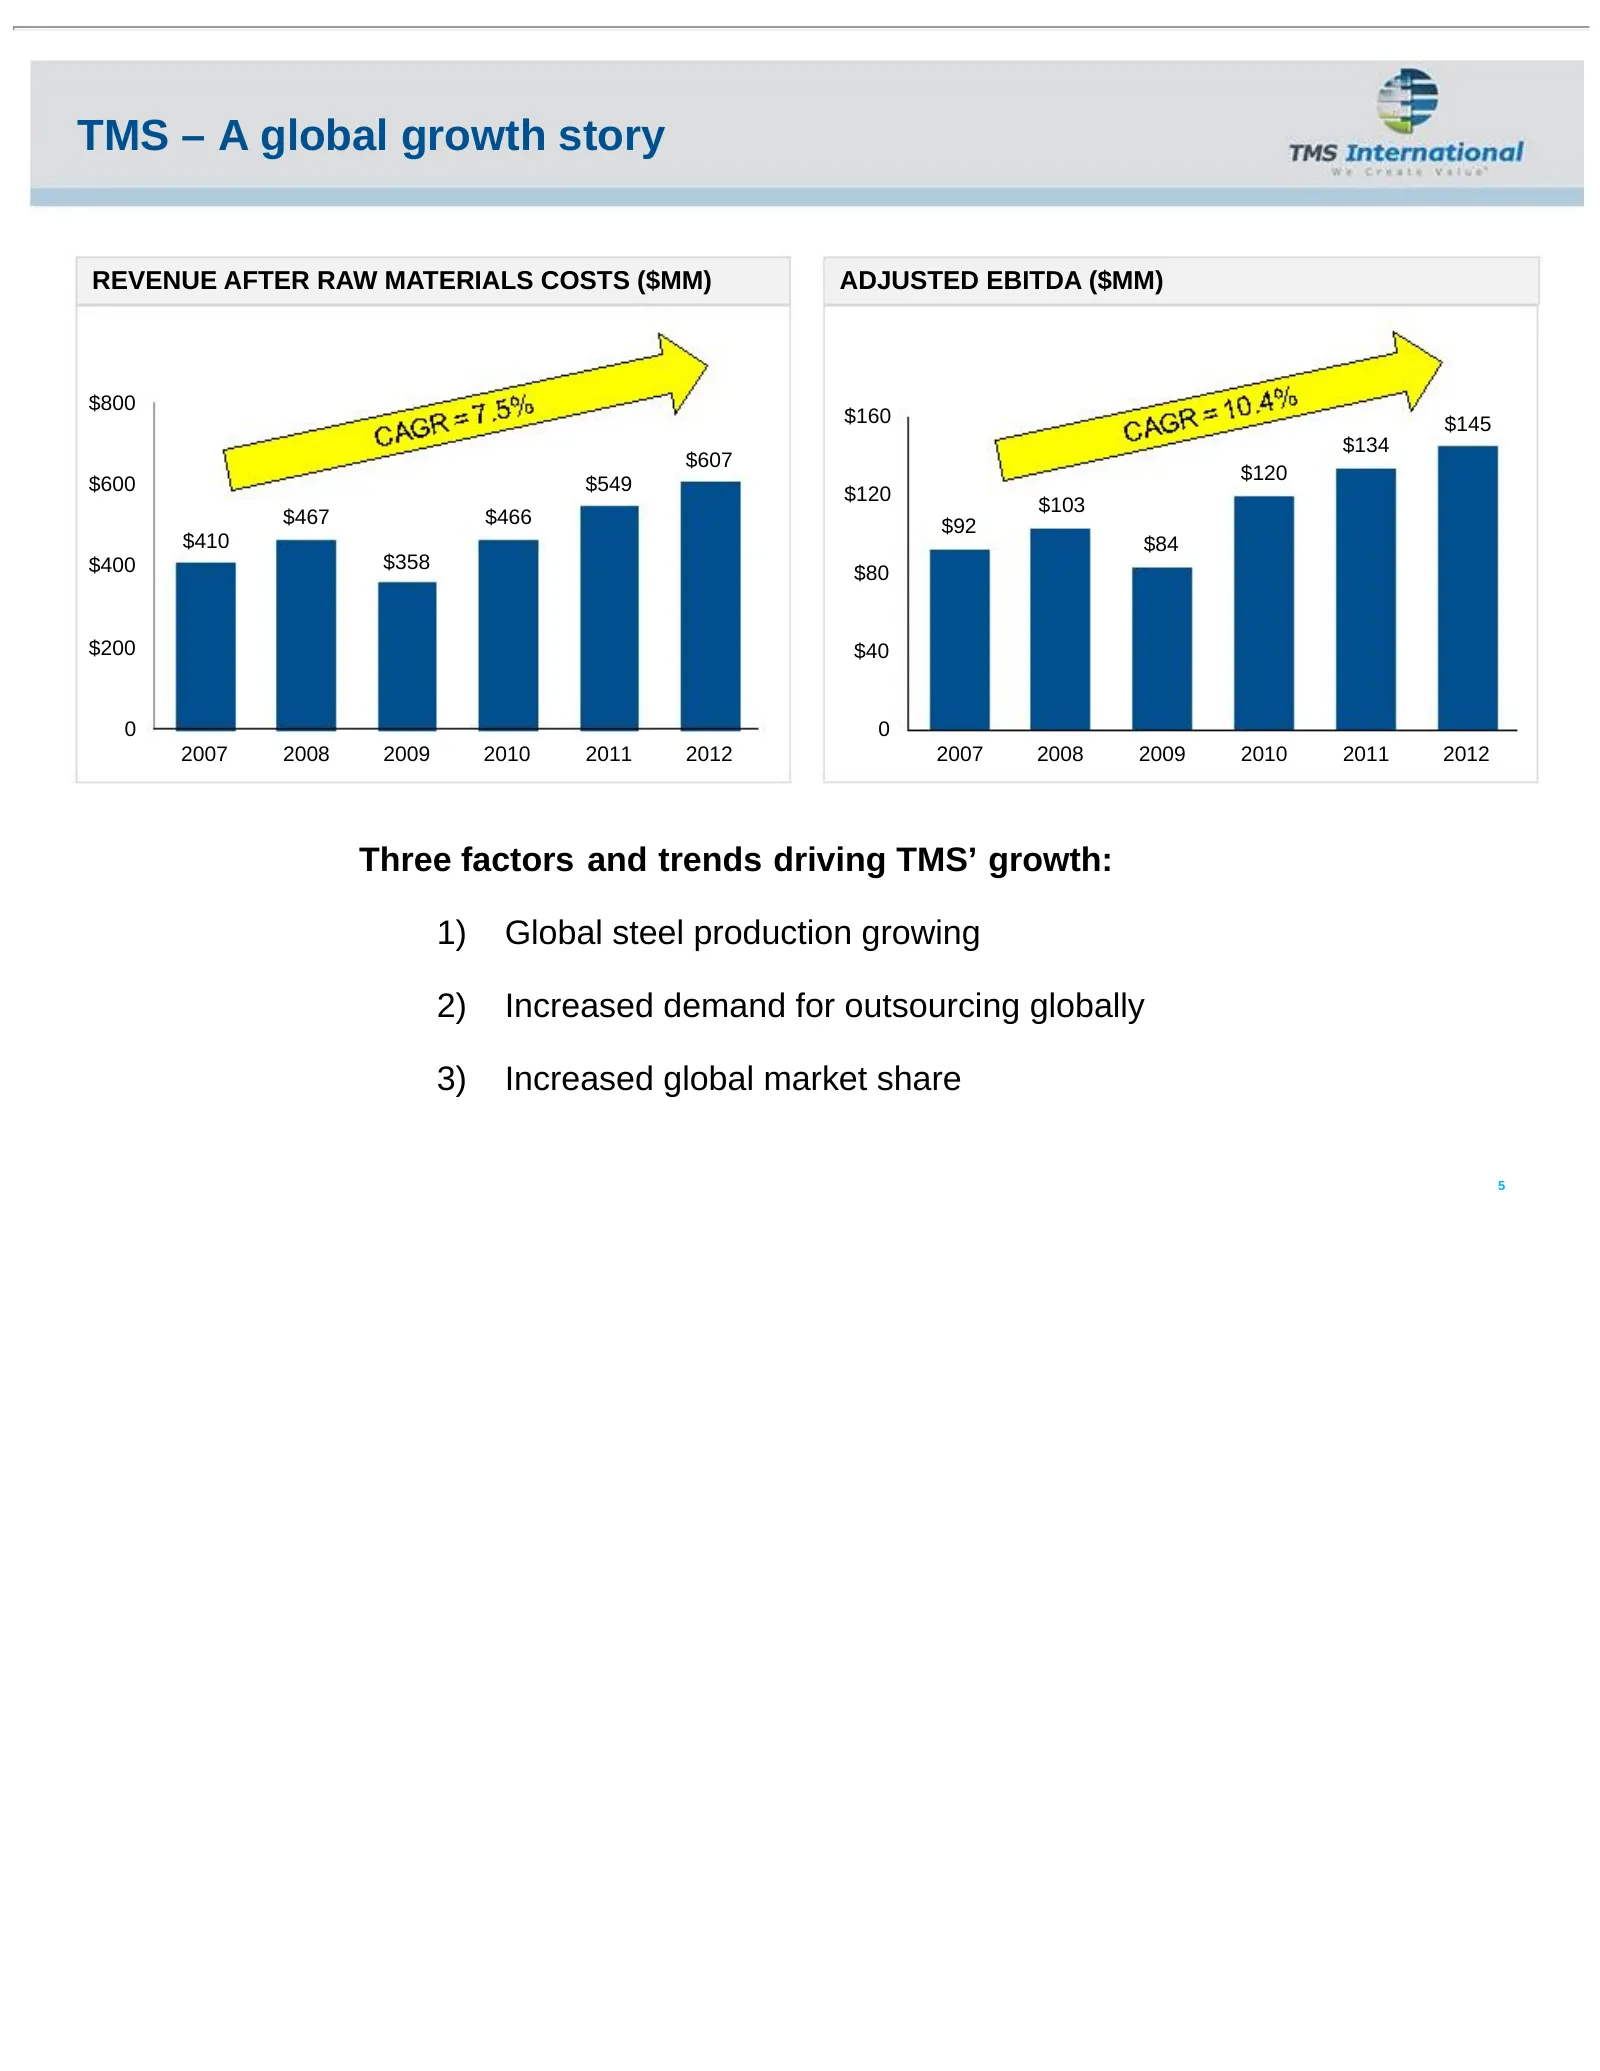
TMS – A global growth story REVENUE AFTER RAW MATERIALS COSTS ($MM) ADJUSTED EBITDA ($MM) $800 $160 $145 $134 $607 $120 $600 $549 $120 $103 $467 $466 $92 $410 $84 $400 $358 $80 $200 $40 0 0 2007 2008 2009 2010 2011 2012 2007 2008 2009 2010 2011 2012 Three factors and trends driving TMS’ growth: 1) G
Slide 7: Global steel production is growing
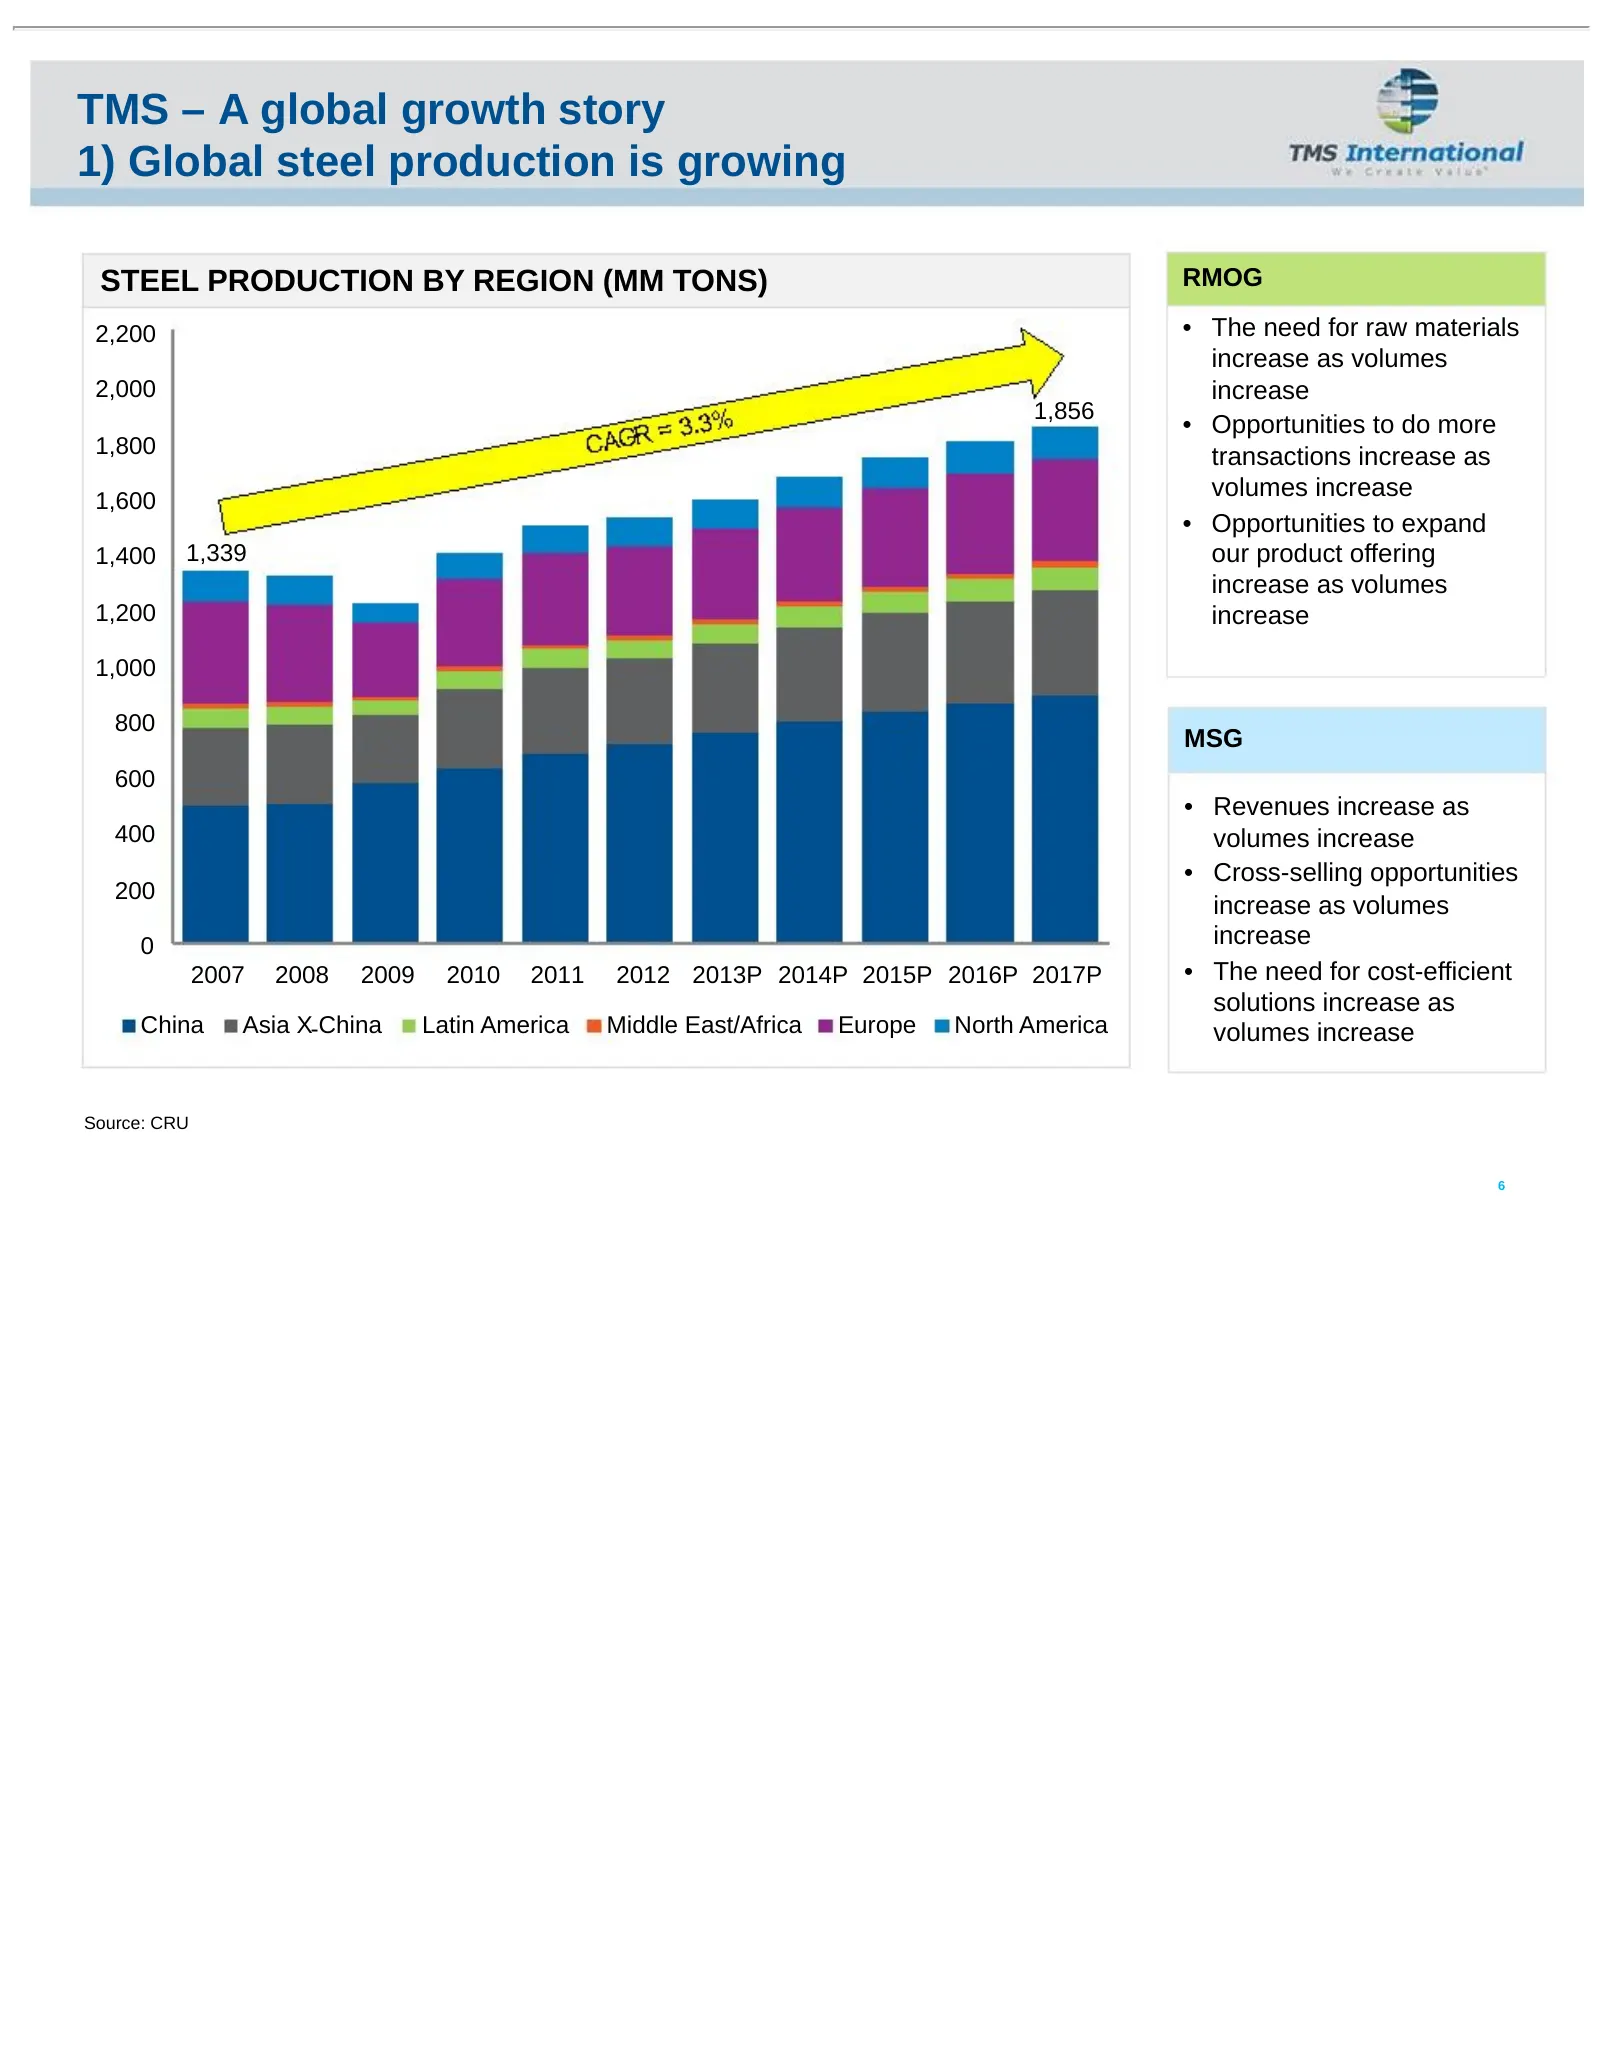
TMS – A global growth story 1) Global steel production is growing STEEL PRODUCTION BY REGION (MM TONS) RMOG 2,200 • The need for raw materials increase as volumes 2,000 increase 1,856 • Opportunities to do more 1,800 transactions increase as volumes increase 1,600 • Opportunities to expand 1,400 1,3
Slide 8: Outsourcing services is gaining acceptance worldwide
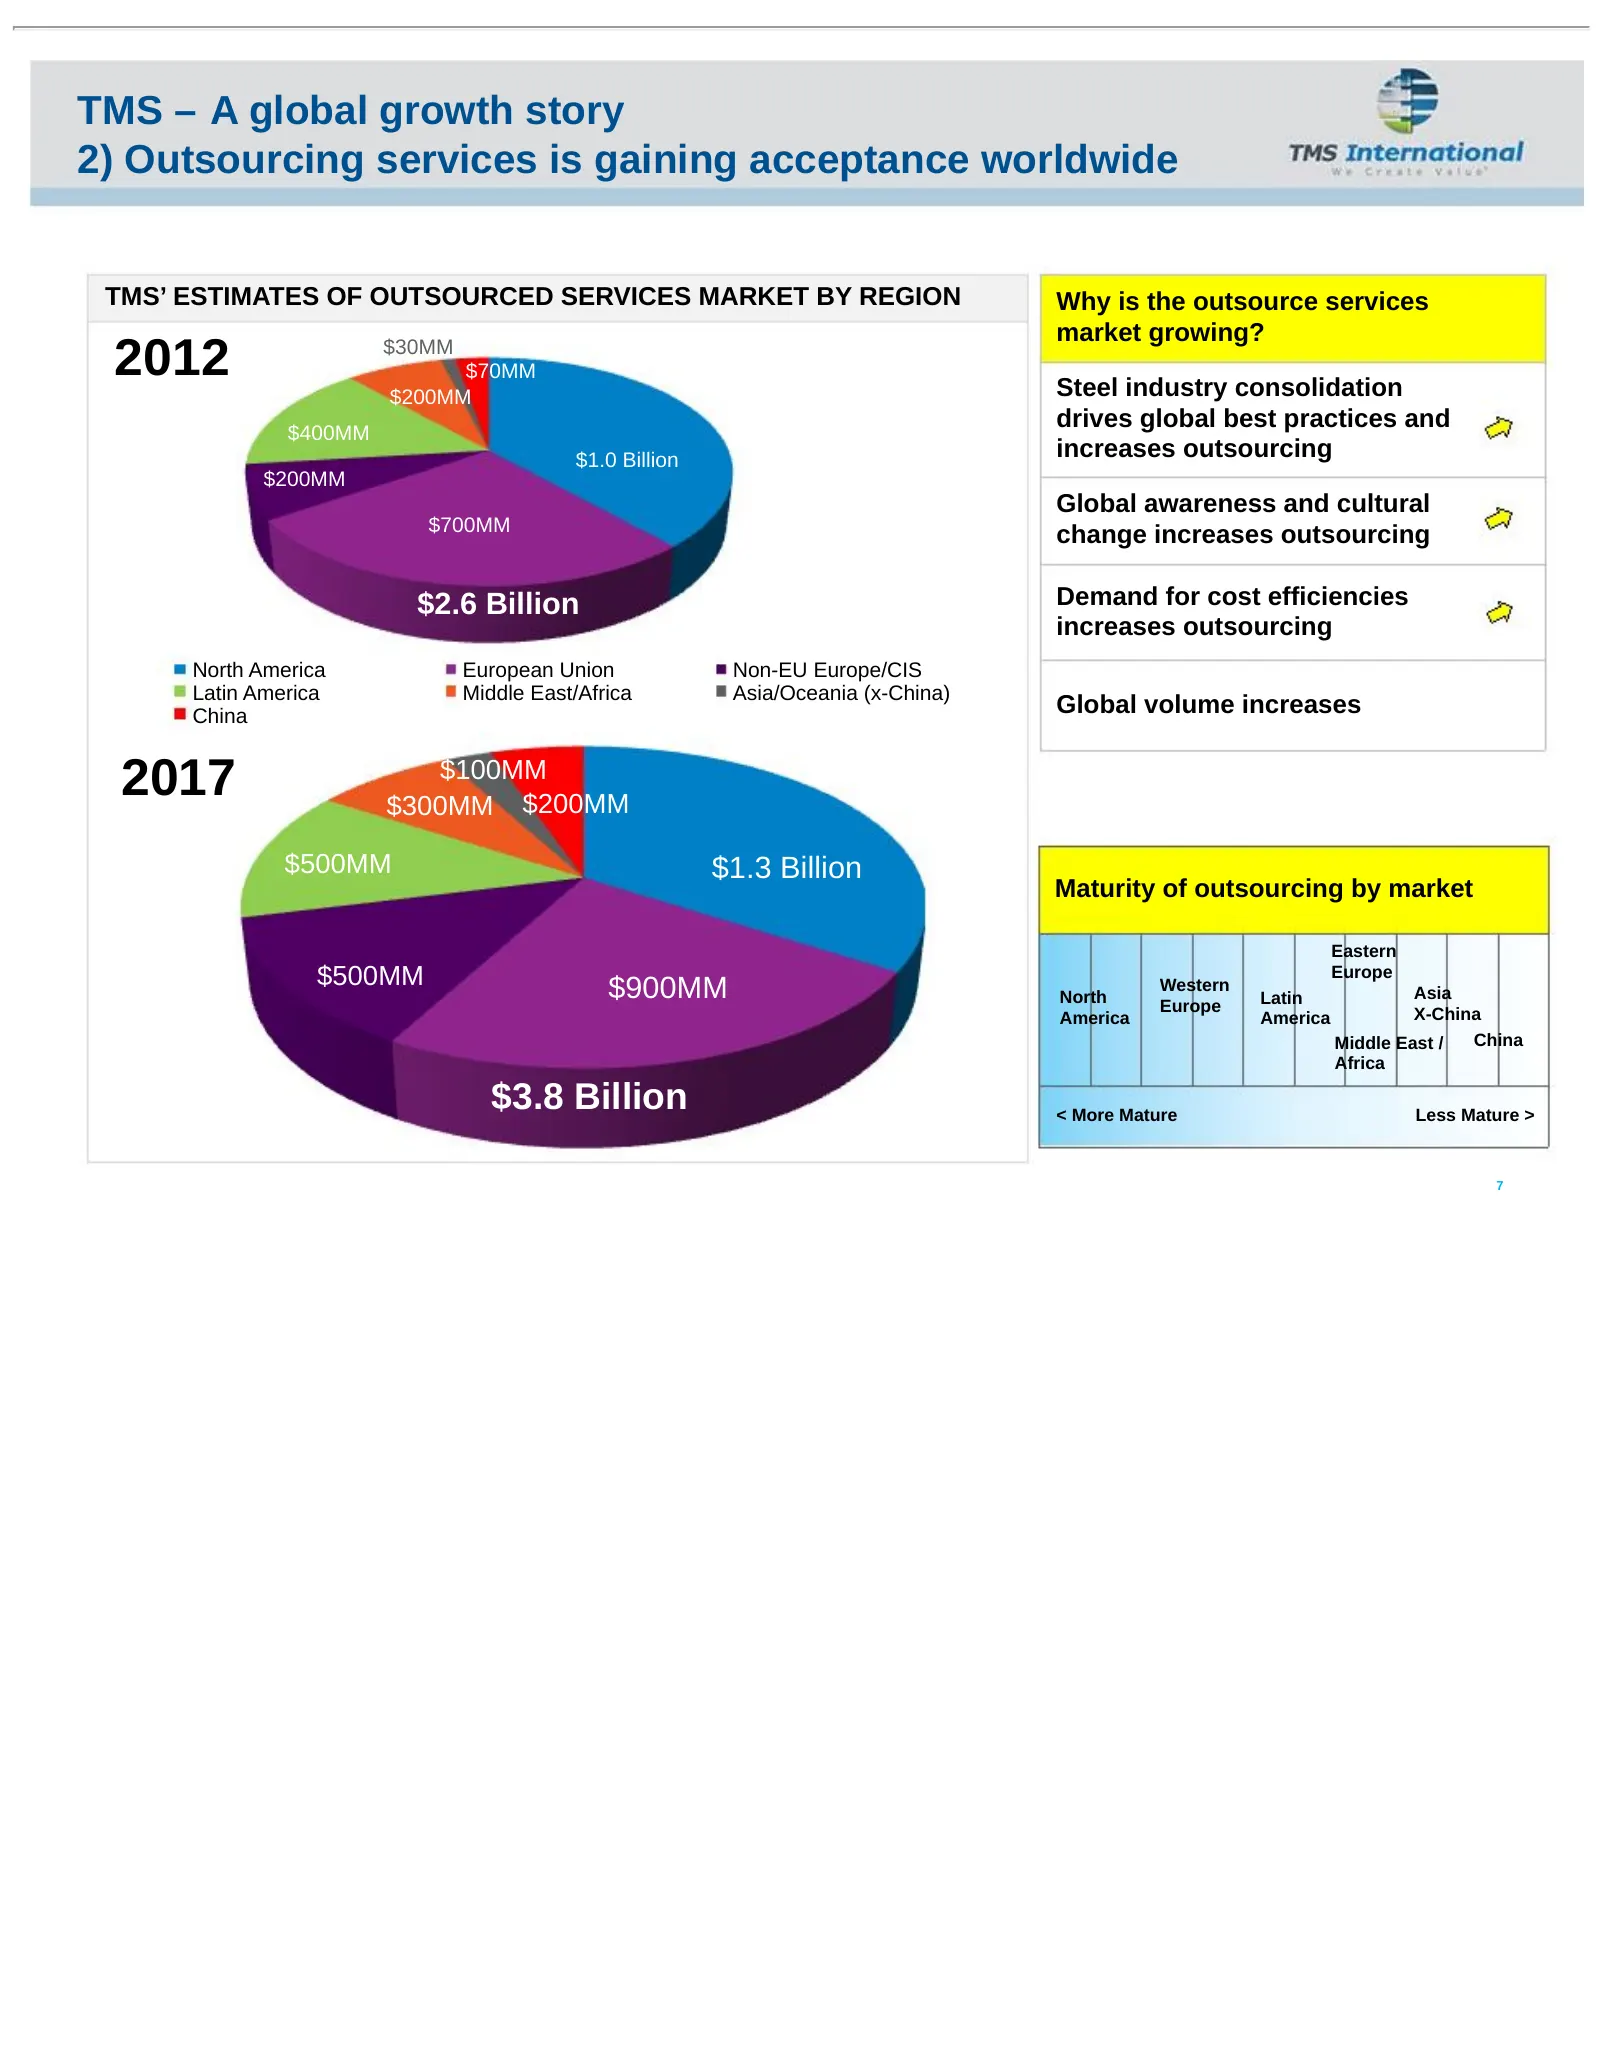
TMS – A global growth story 2) Outsourcing services is gaining acceptance worldwide TMS’ ESTIMATES OF OUTSOURCED SERVICES MARKET BY REGION Why is the outsource services market growing? 2012 $30MM $70MM Steel industry consolidation $200MM $400MM drives global best practices and $1.0 Billion increases
Slide 9: Gaining market share
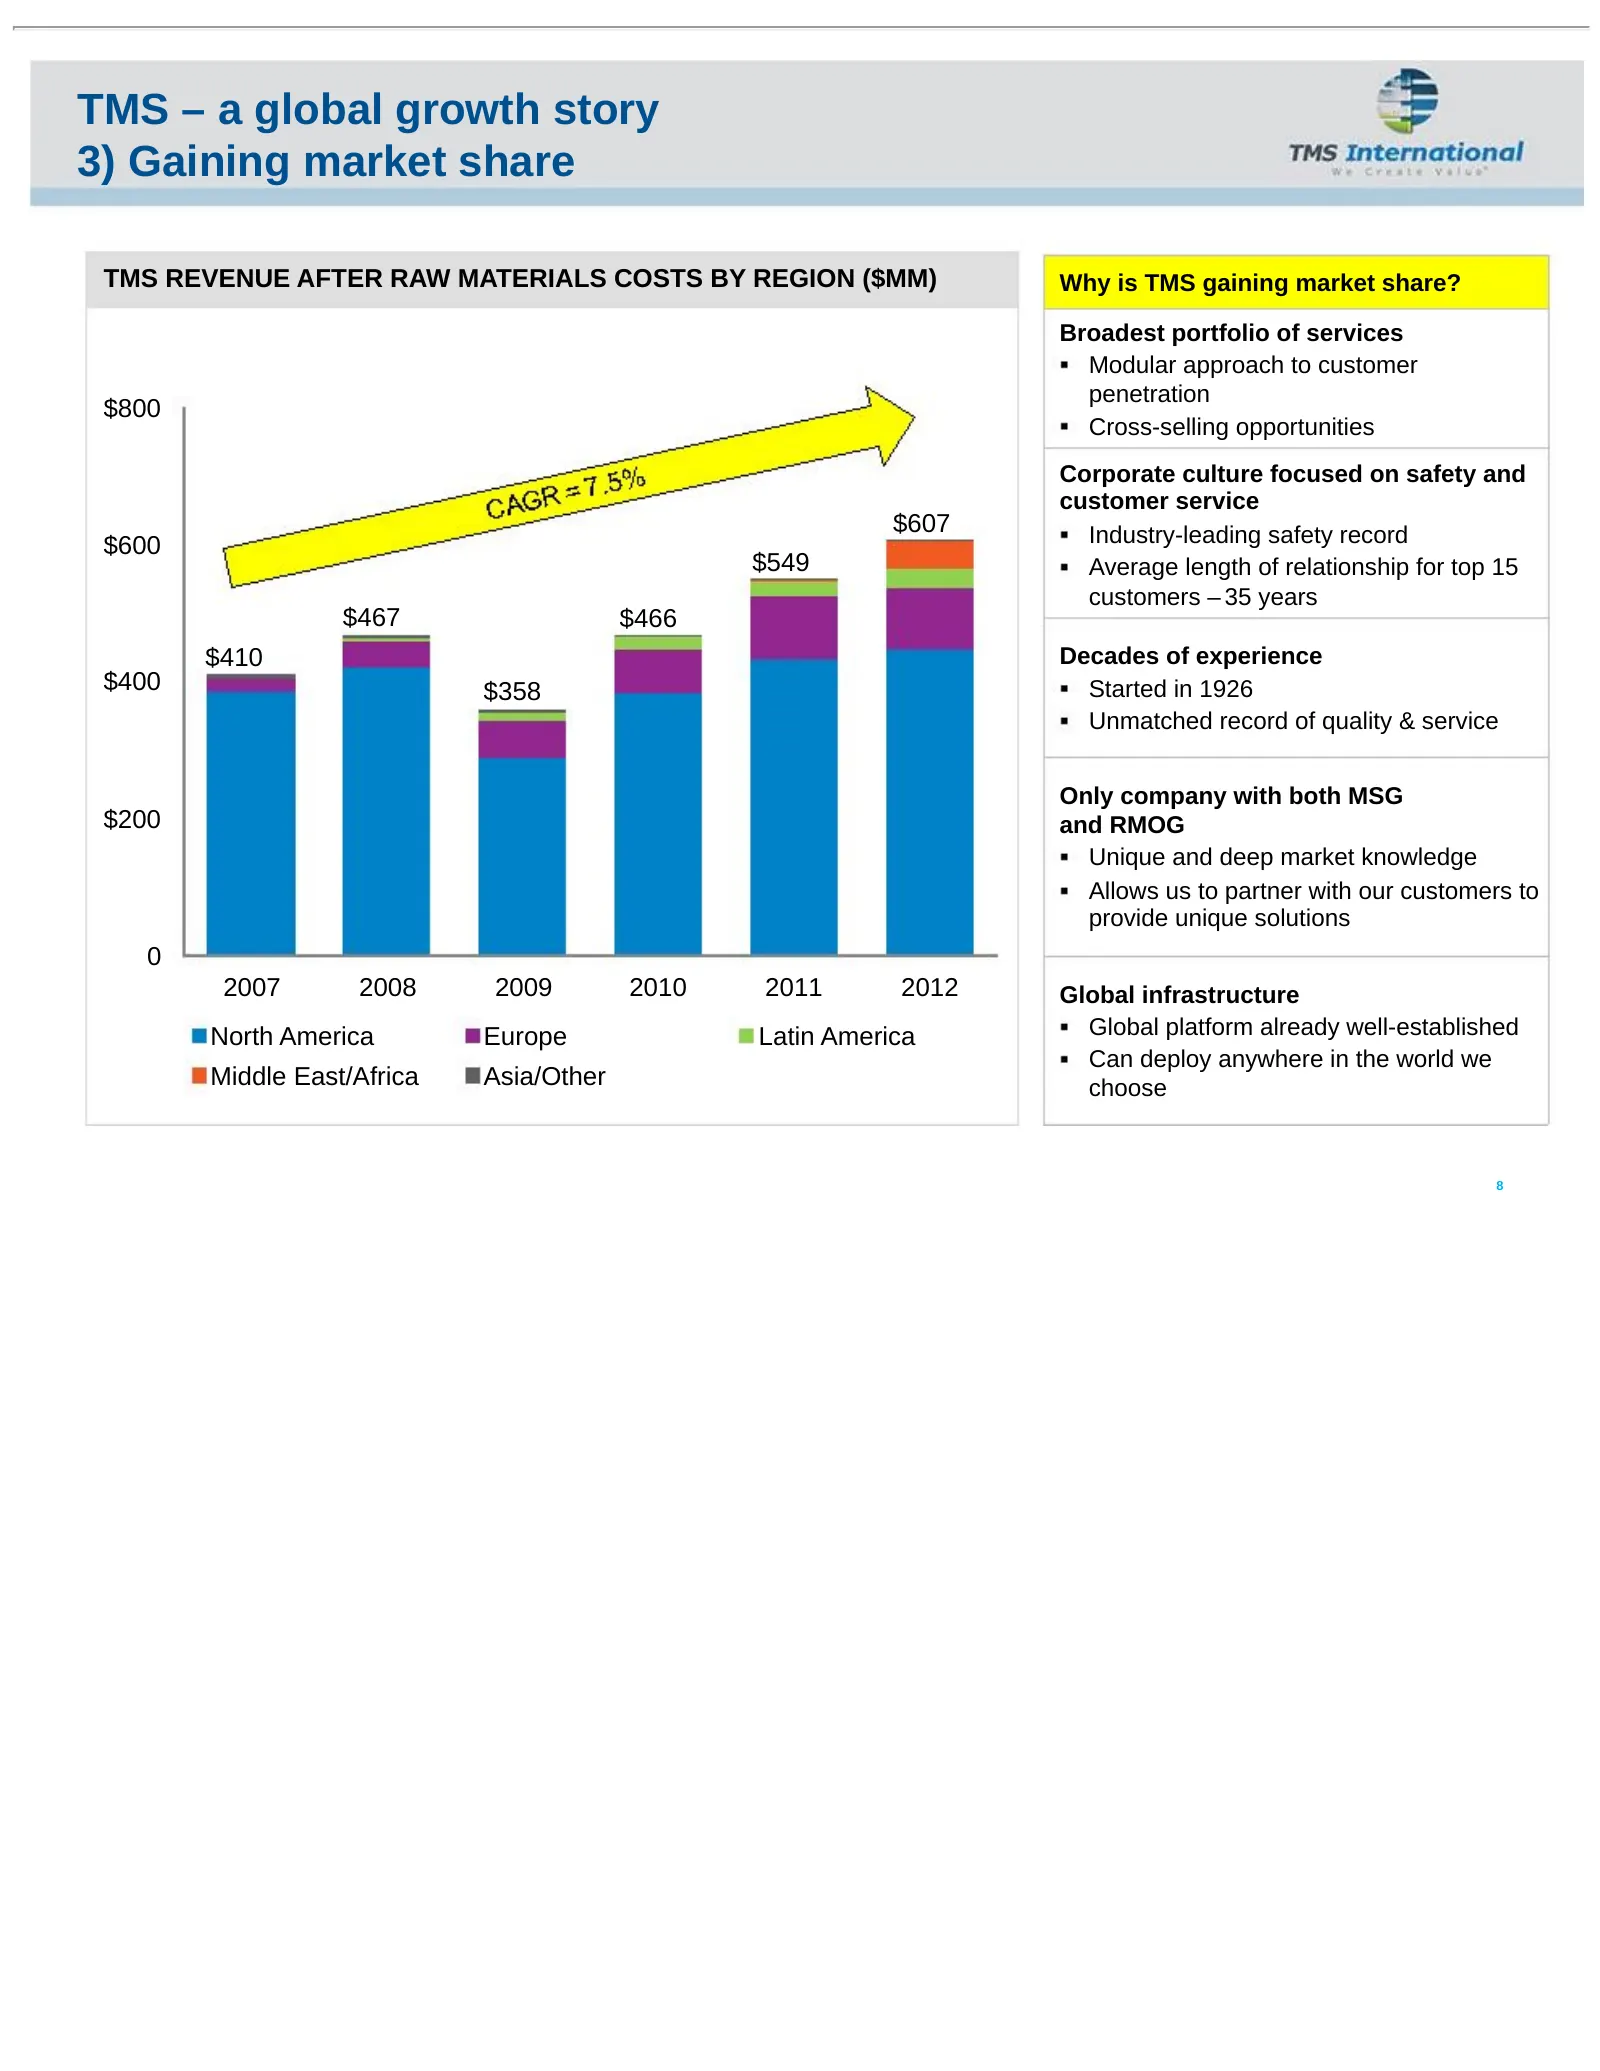
TMS – a global growth story 3) Gaining market share TMS REVENUE AFTER RAW MATERIALS COSTS BY REGION ($MM) Why is TMS gaining market share? Broadest portfolio of services Modular approach to customer penetration $800 Cross-selling opportunities Corporate culture focused on safety and customer service
Slide 10: TMS has the broadest portfolio of services in the industry
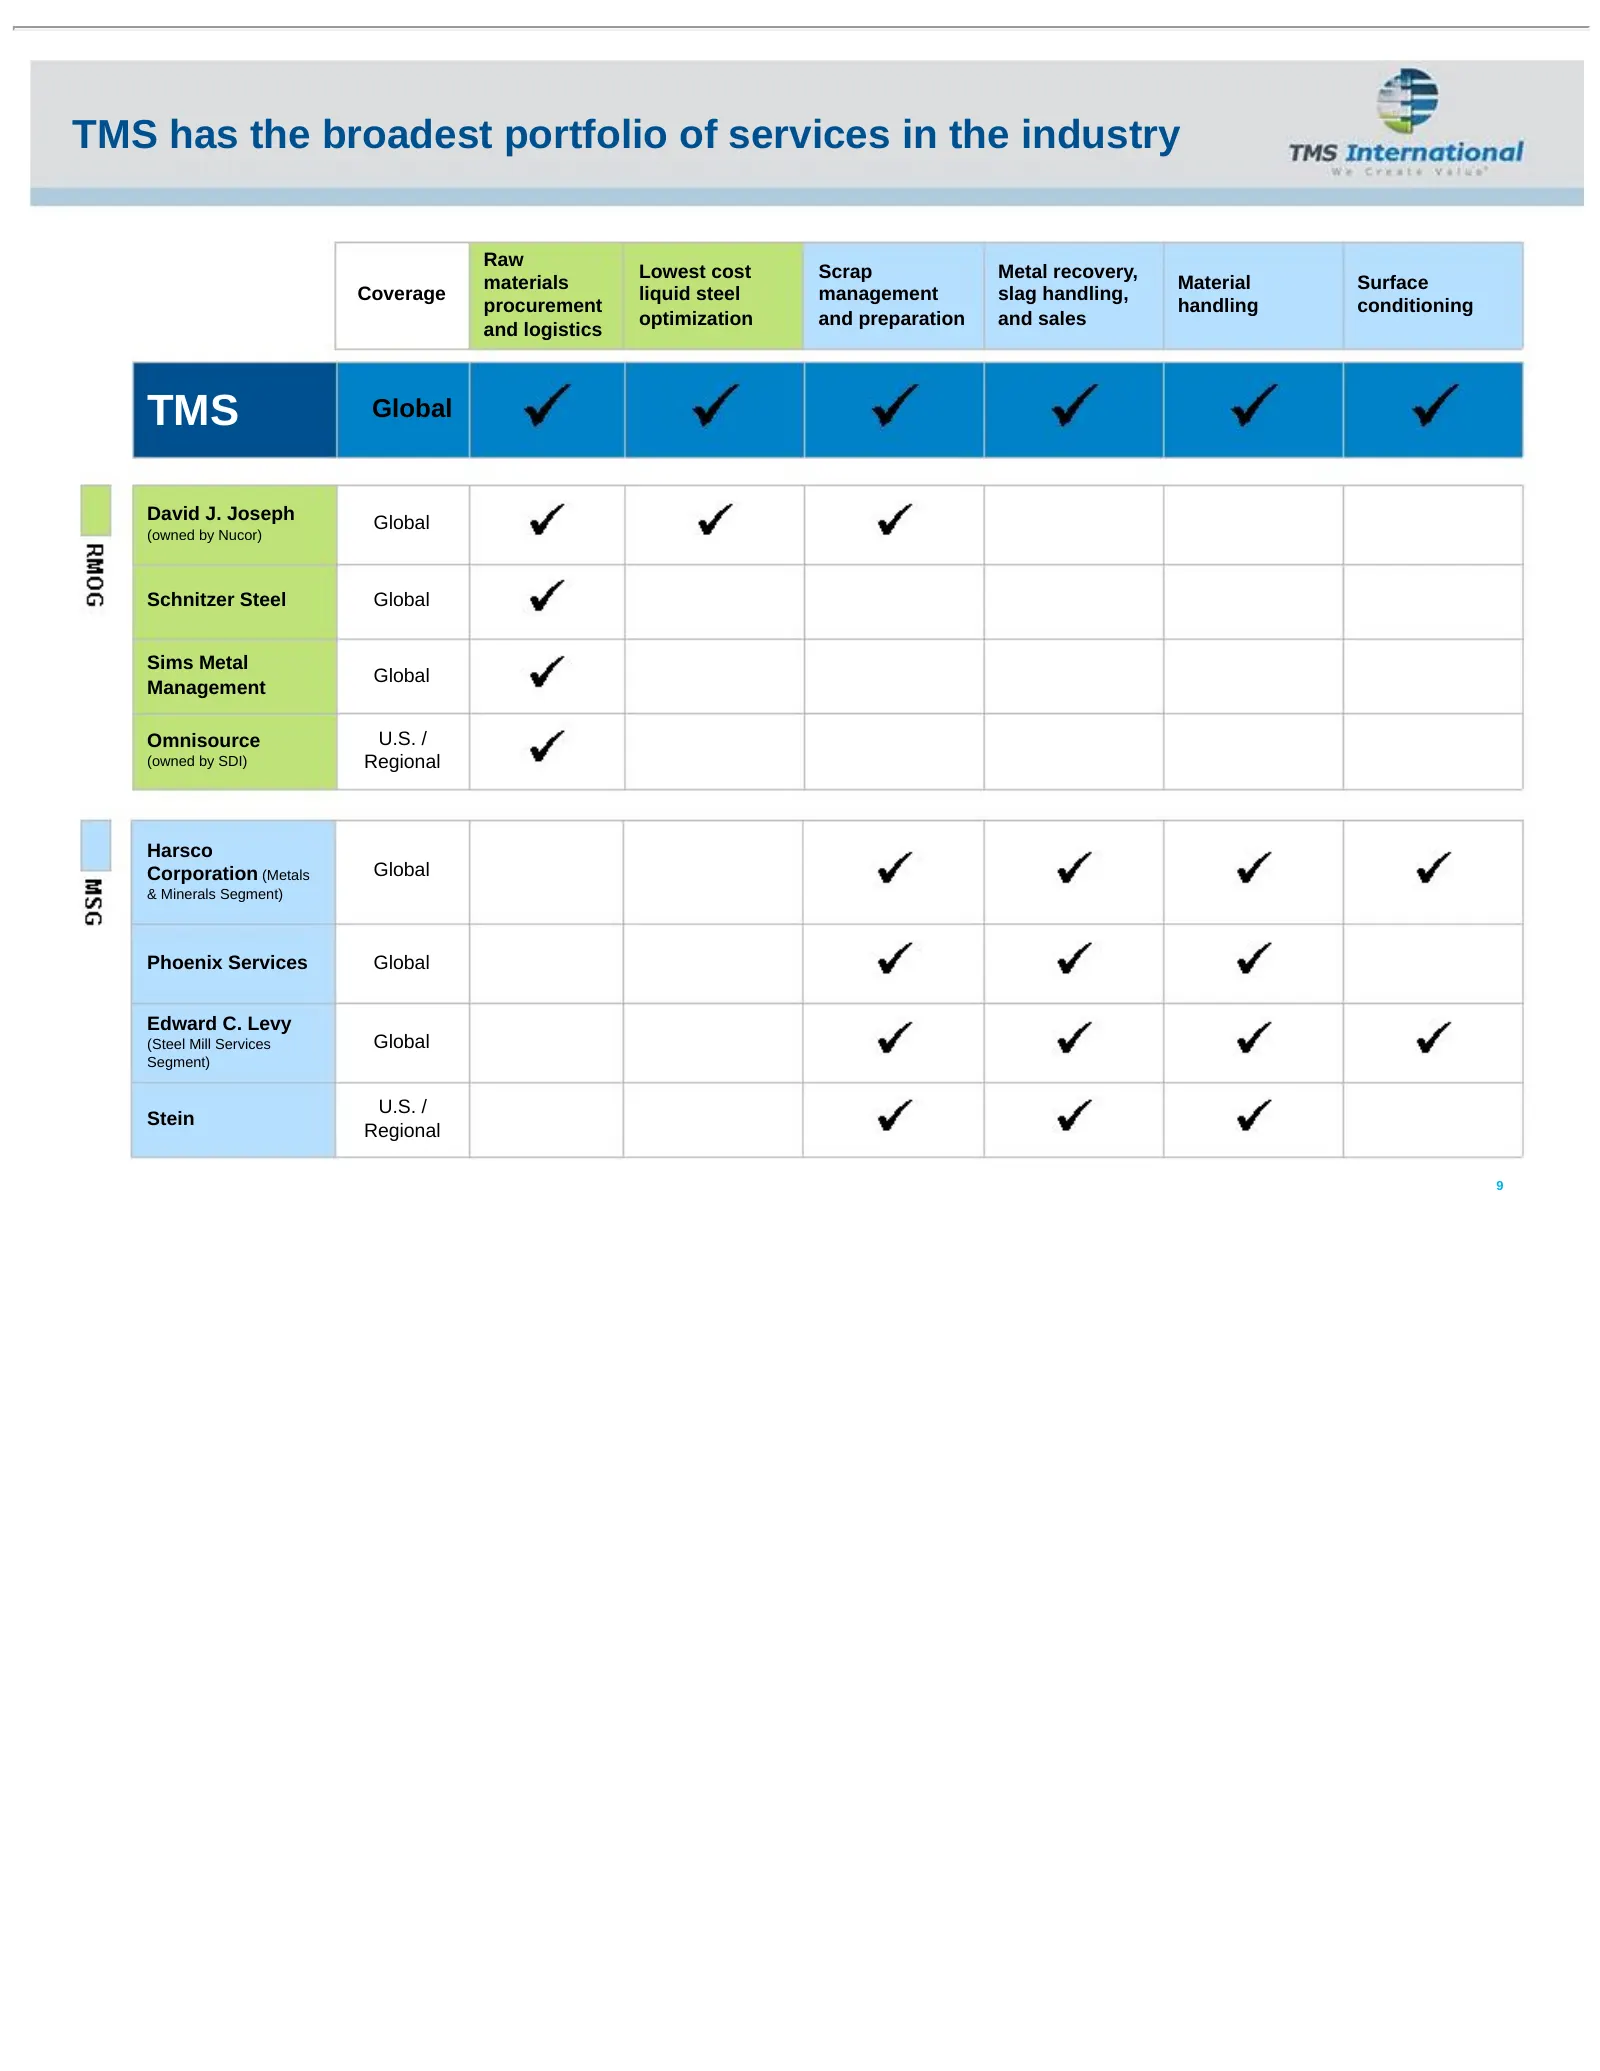
TMS has the broadest portfolio of services in the industry Raw Lowest cost Scrap Metal recovery, materials Material Surface Coverage liquid steel management slag handling, procurement handling conditioning optimization and preparation and sales and logistics TMS Global David J. Joseph Global (owned
Slide 11: MSG operational highlights (2011-2013 YTD)
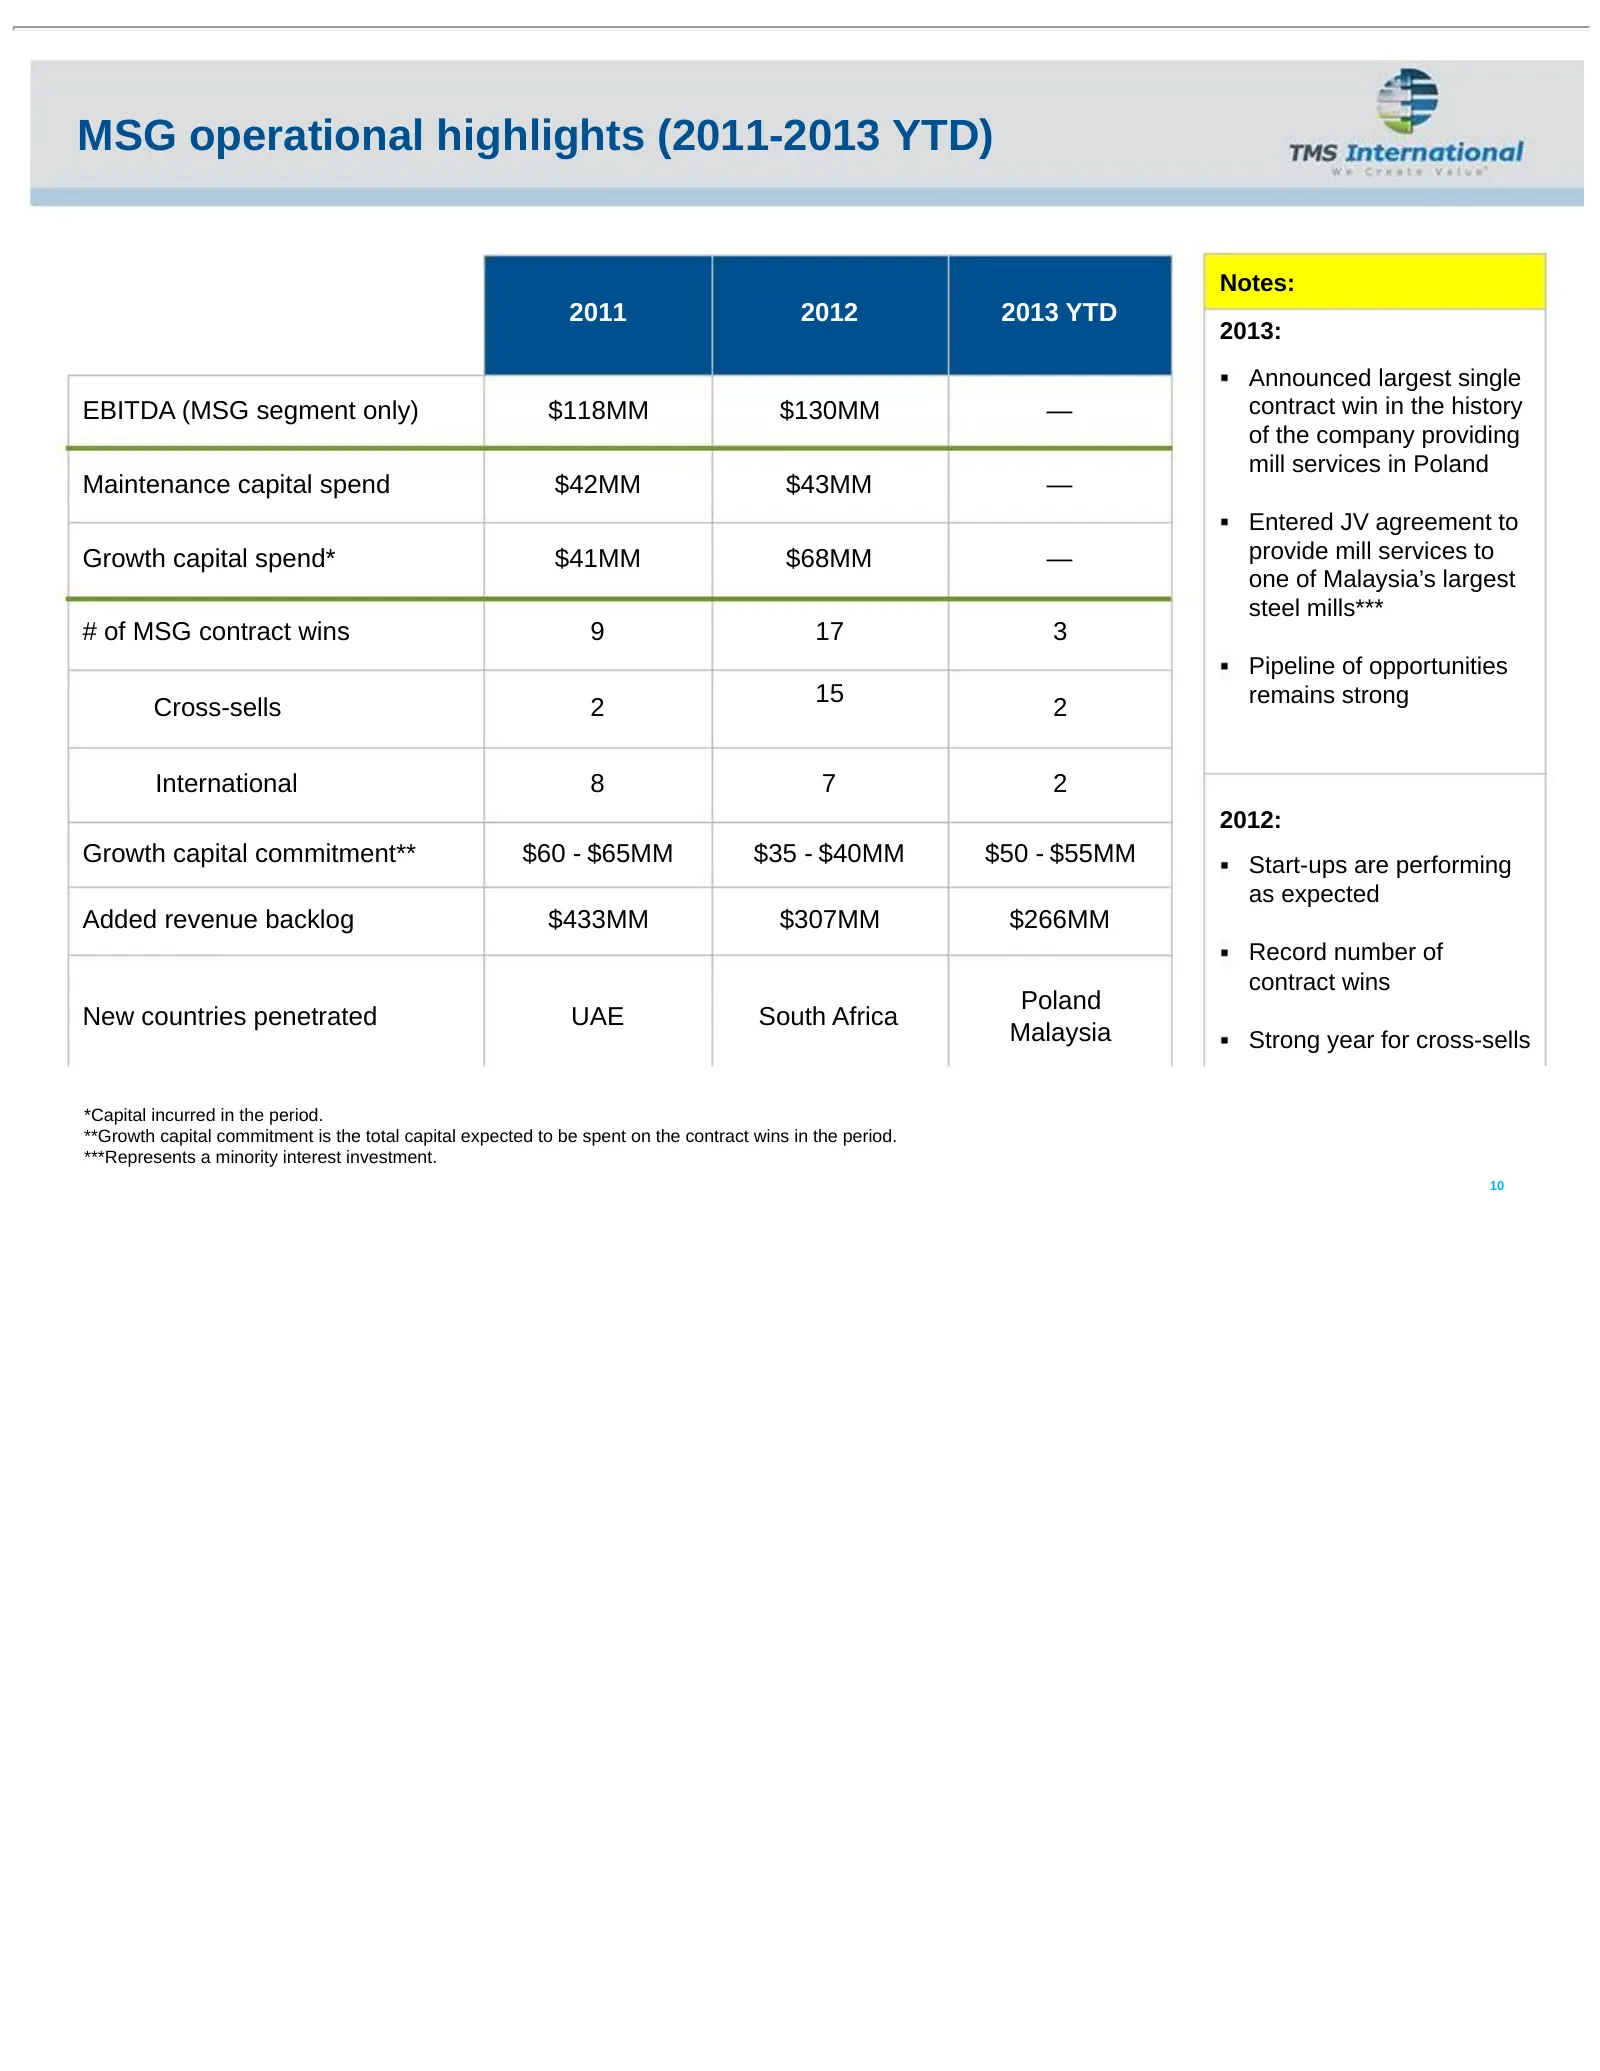
MSG operational highlights (2011-2013 YTD) Notes: 2011 2012 2013 YTD 2013: Announced largest single EBITDA (MSG segment only) $118MM $130MM — contract win in the history of the company providing mill services in Poland Maintenance capital spend $42MM $43MM — Entered JV agreement to Growth capital sp
Slide 12: RMOG operational highlights
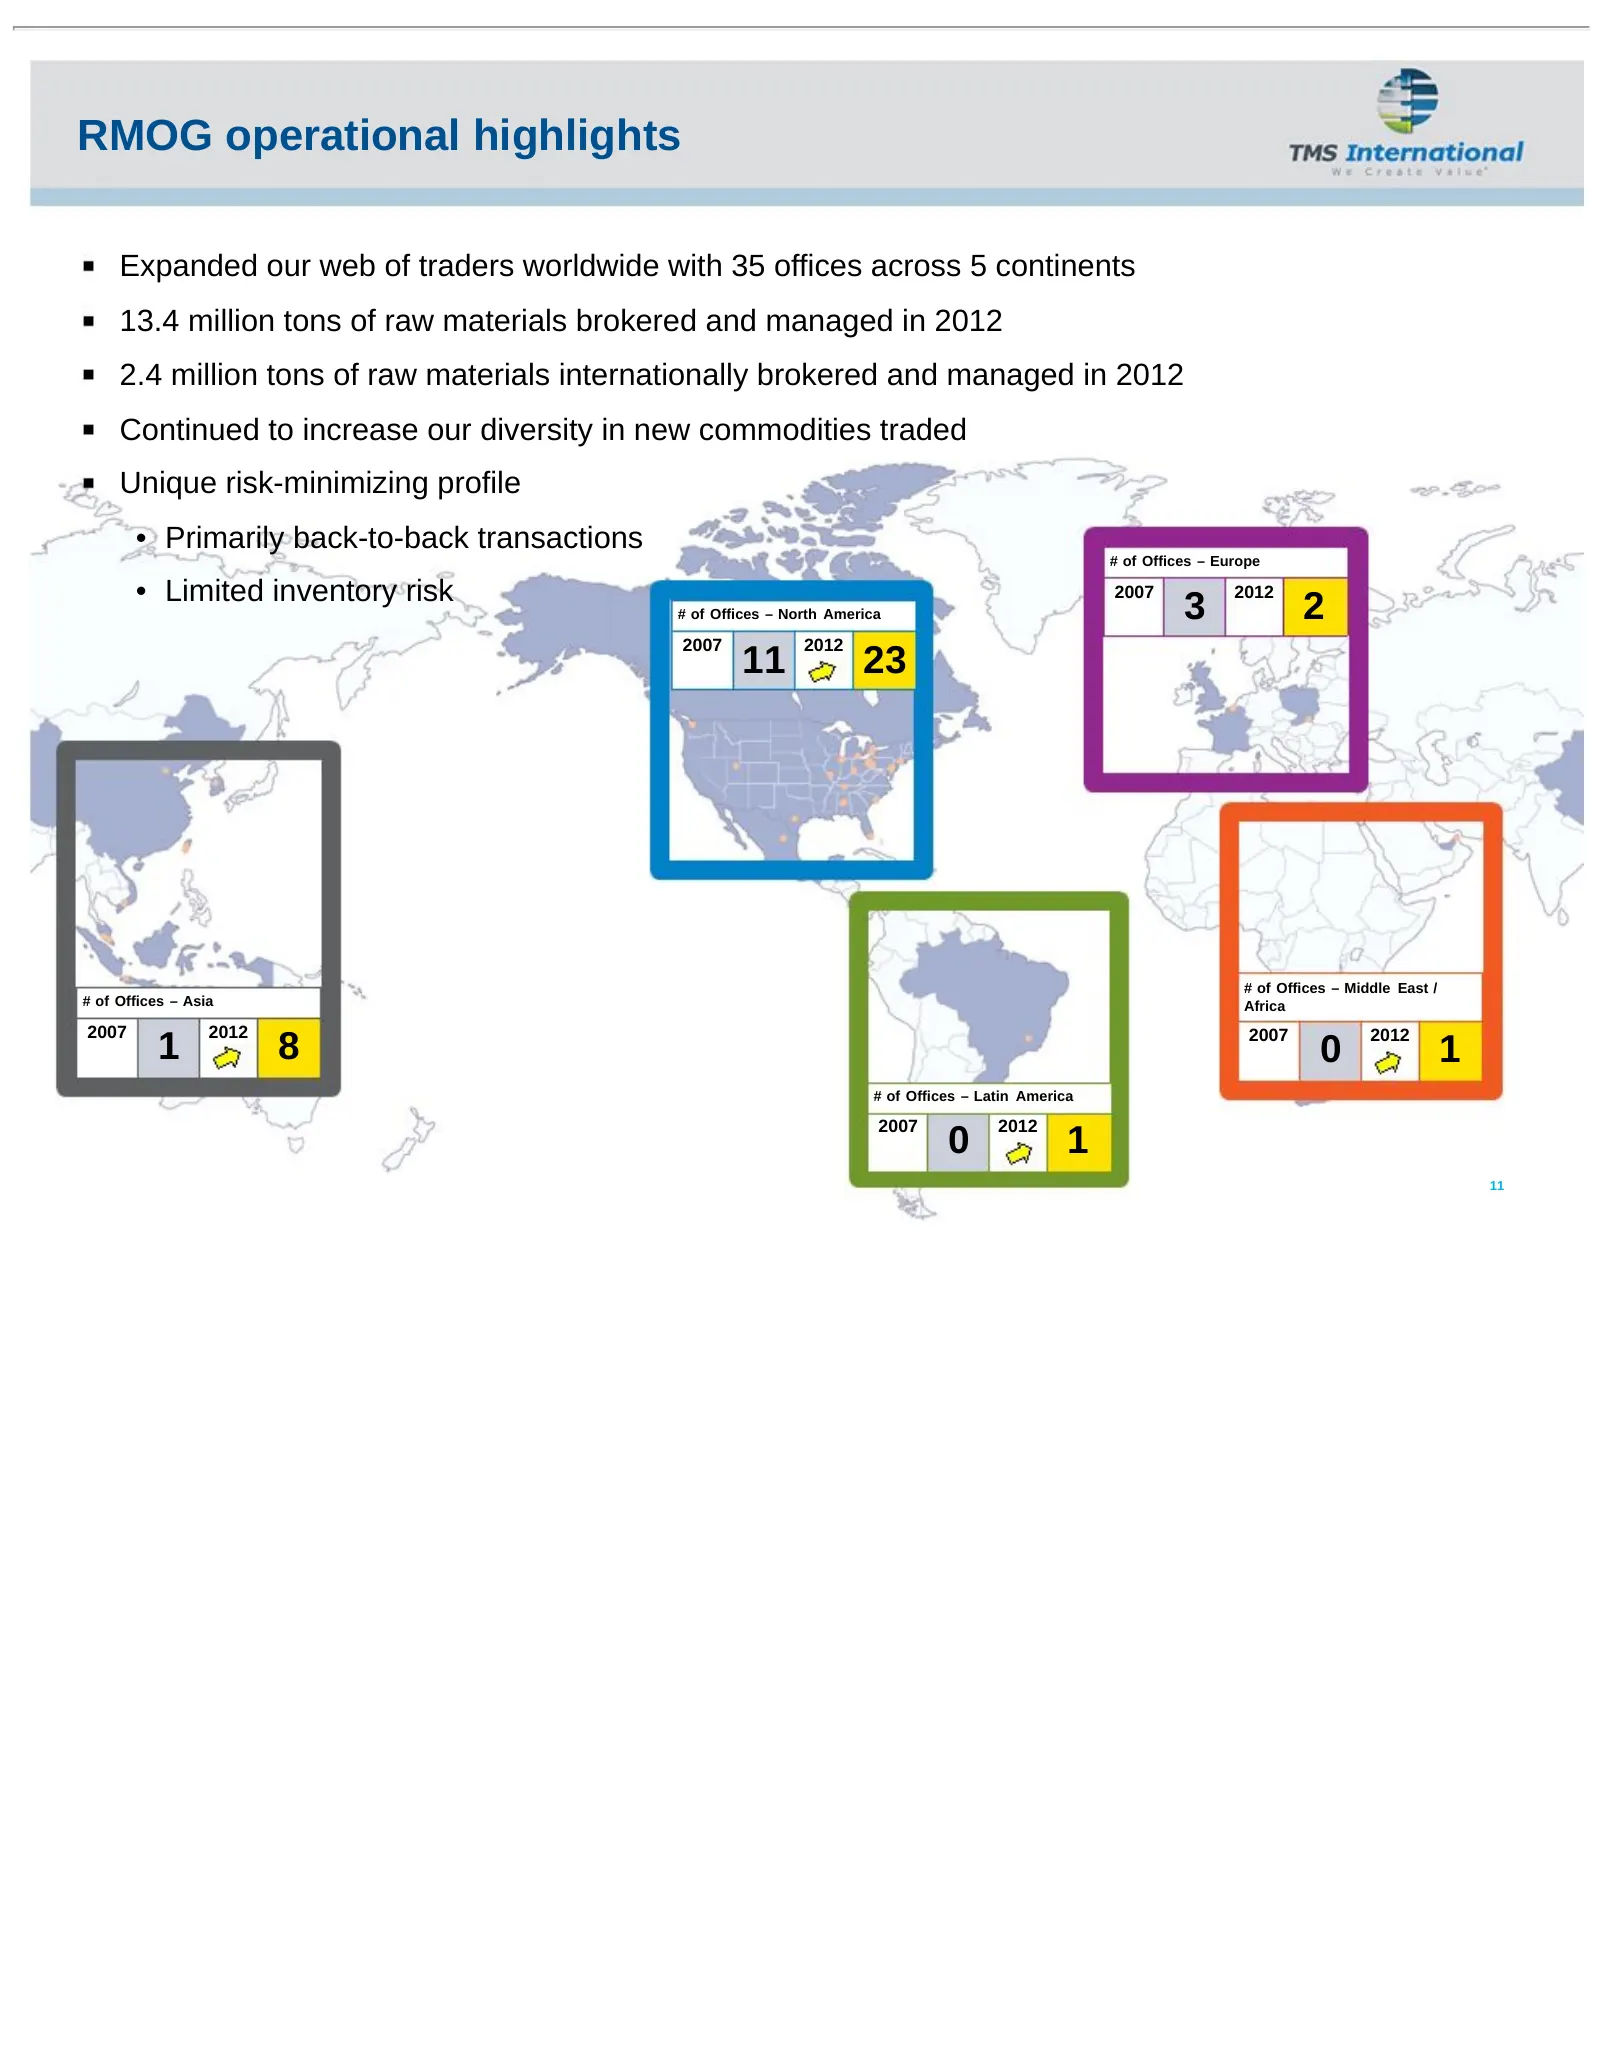
RMOG operational highlights Expanded our web of traders worldwide with 35 offices across 5 continents 13.4 million tons of raw materials brokered and managed in 2012 2.4 million tons of raw materials internationally brokered and managed in 2012 Continued to increase our diversity in new commodities
Slide 13: Unique business model reduces cyclicality and risk
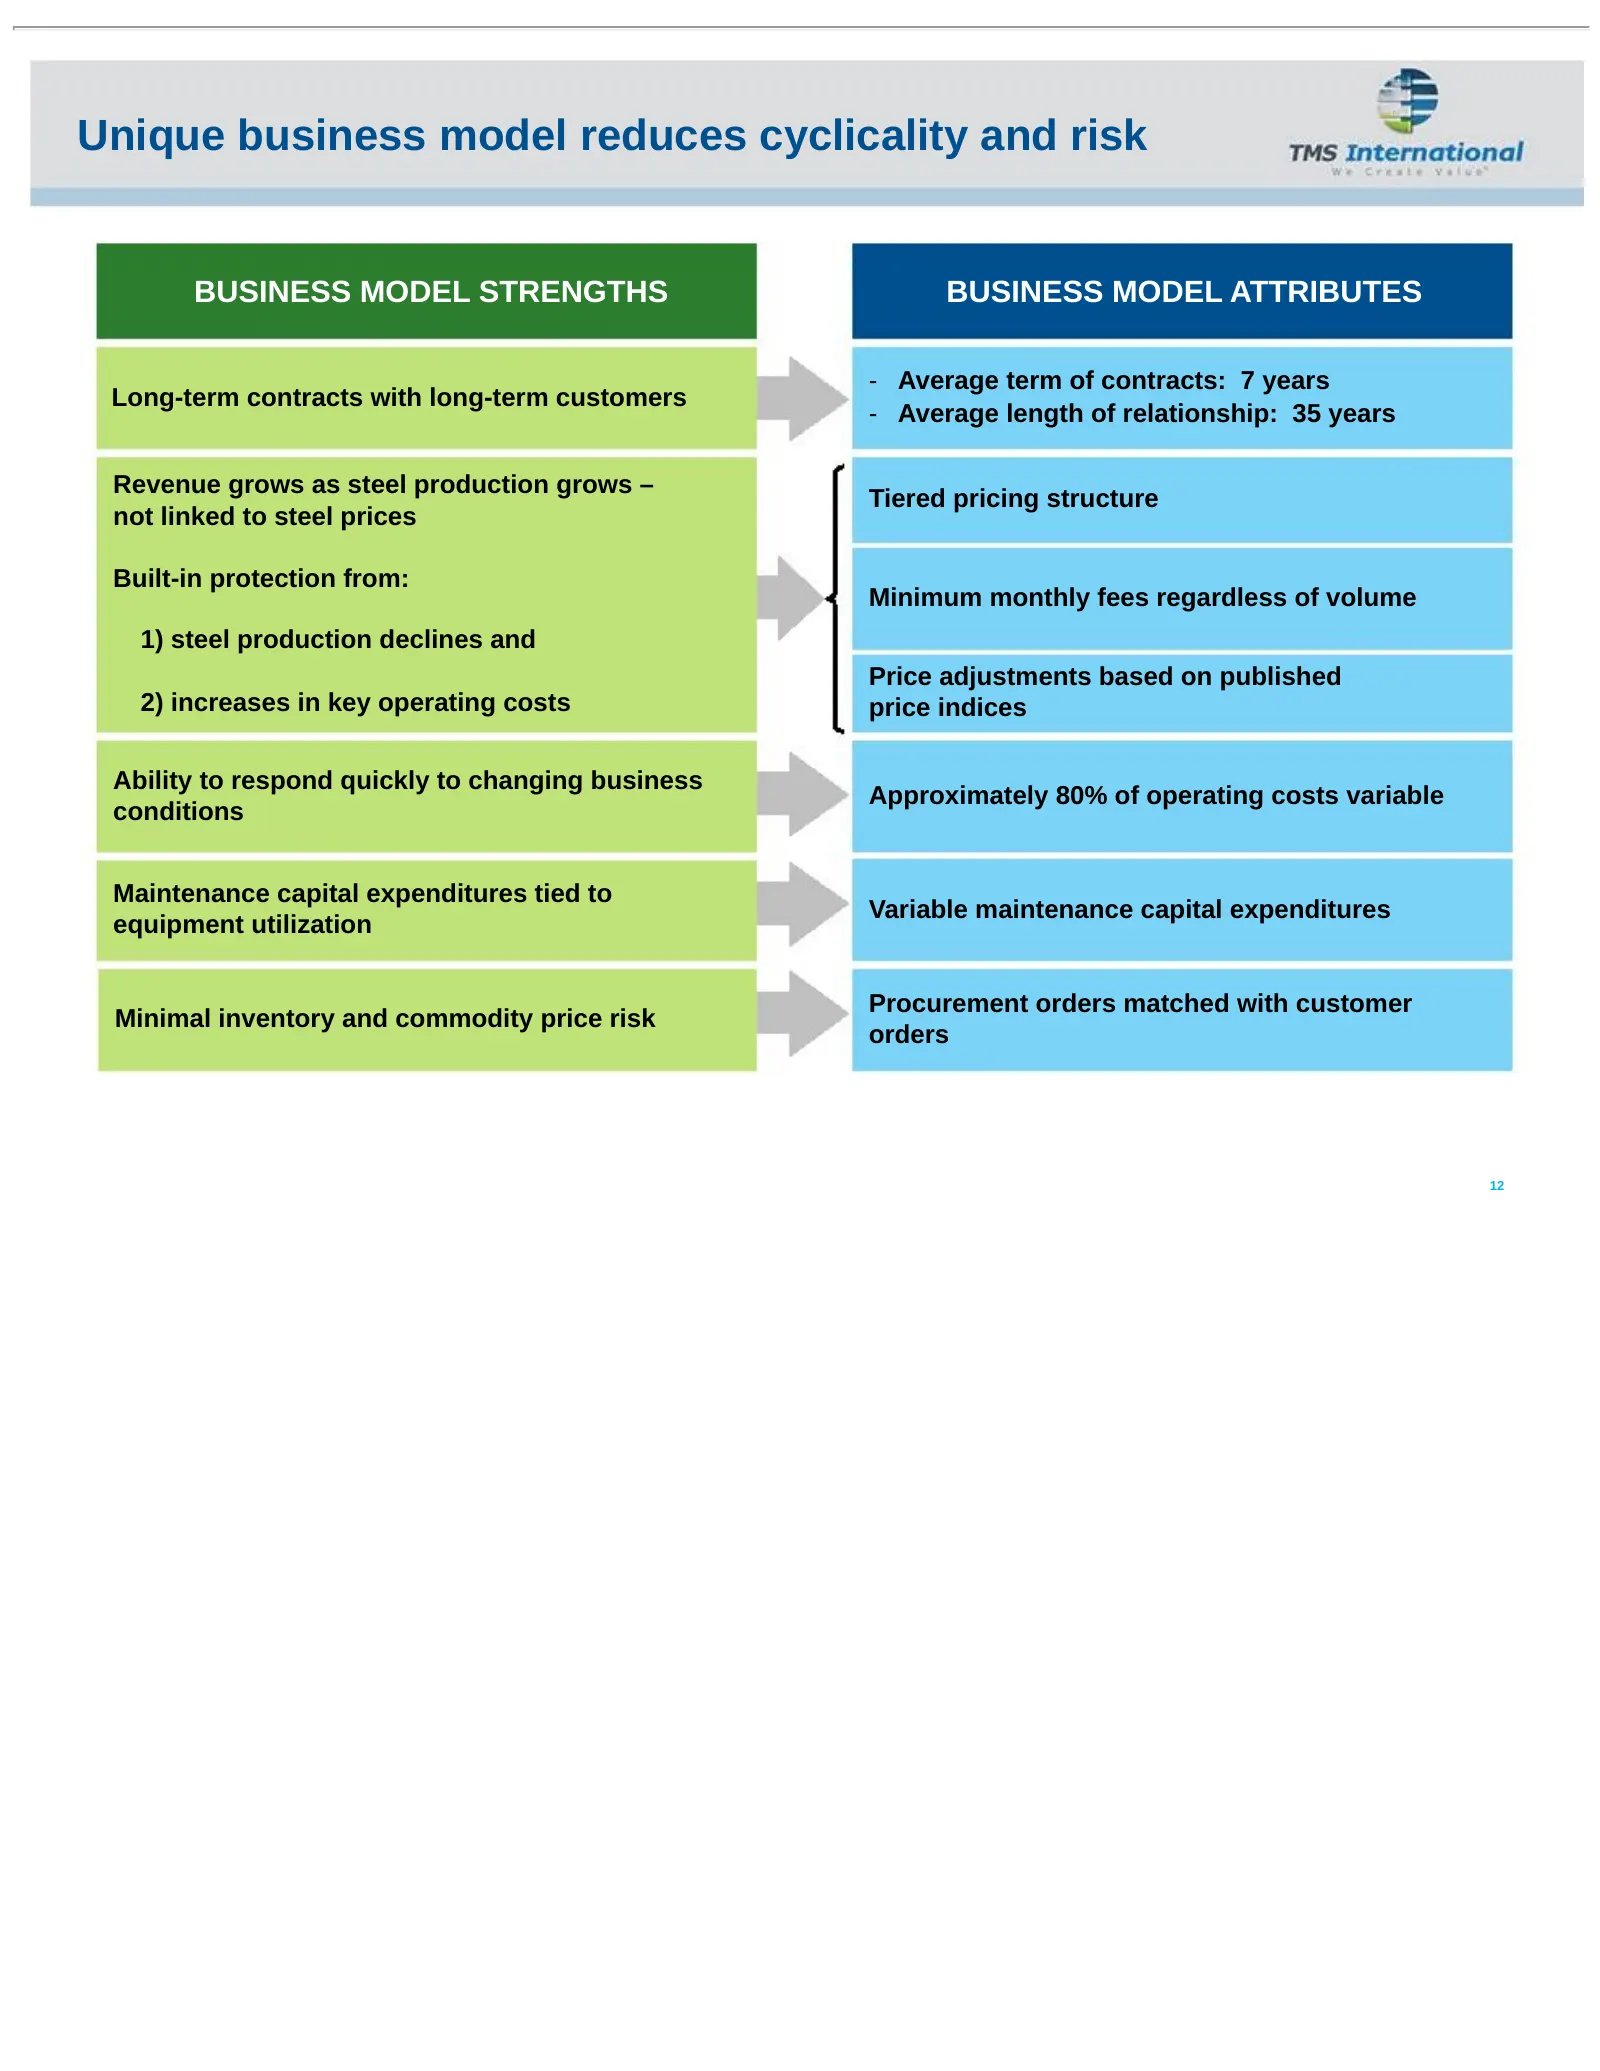
Unique business model reduces cyclicality and risk BUSINESS MODEL STRENGTHS BUSINESS MODEL ATTRIBUTES - Average term of contracts: 7 years Long-term contracts with long-term customers - Average length of relationship: 35 years Revenue grows as steel production grows – Tiered pricing structure not li
Slide 14: Historical financial performance
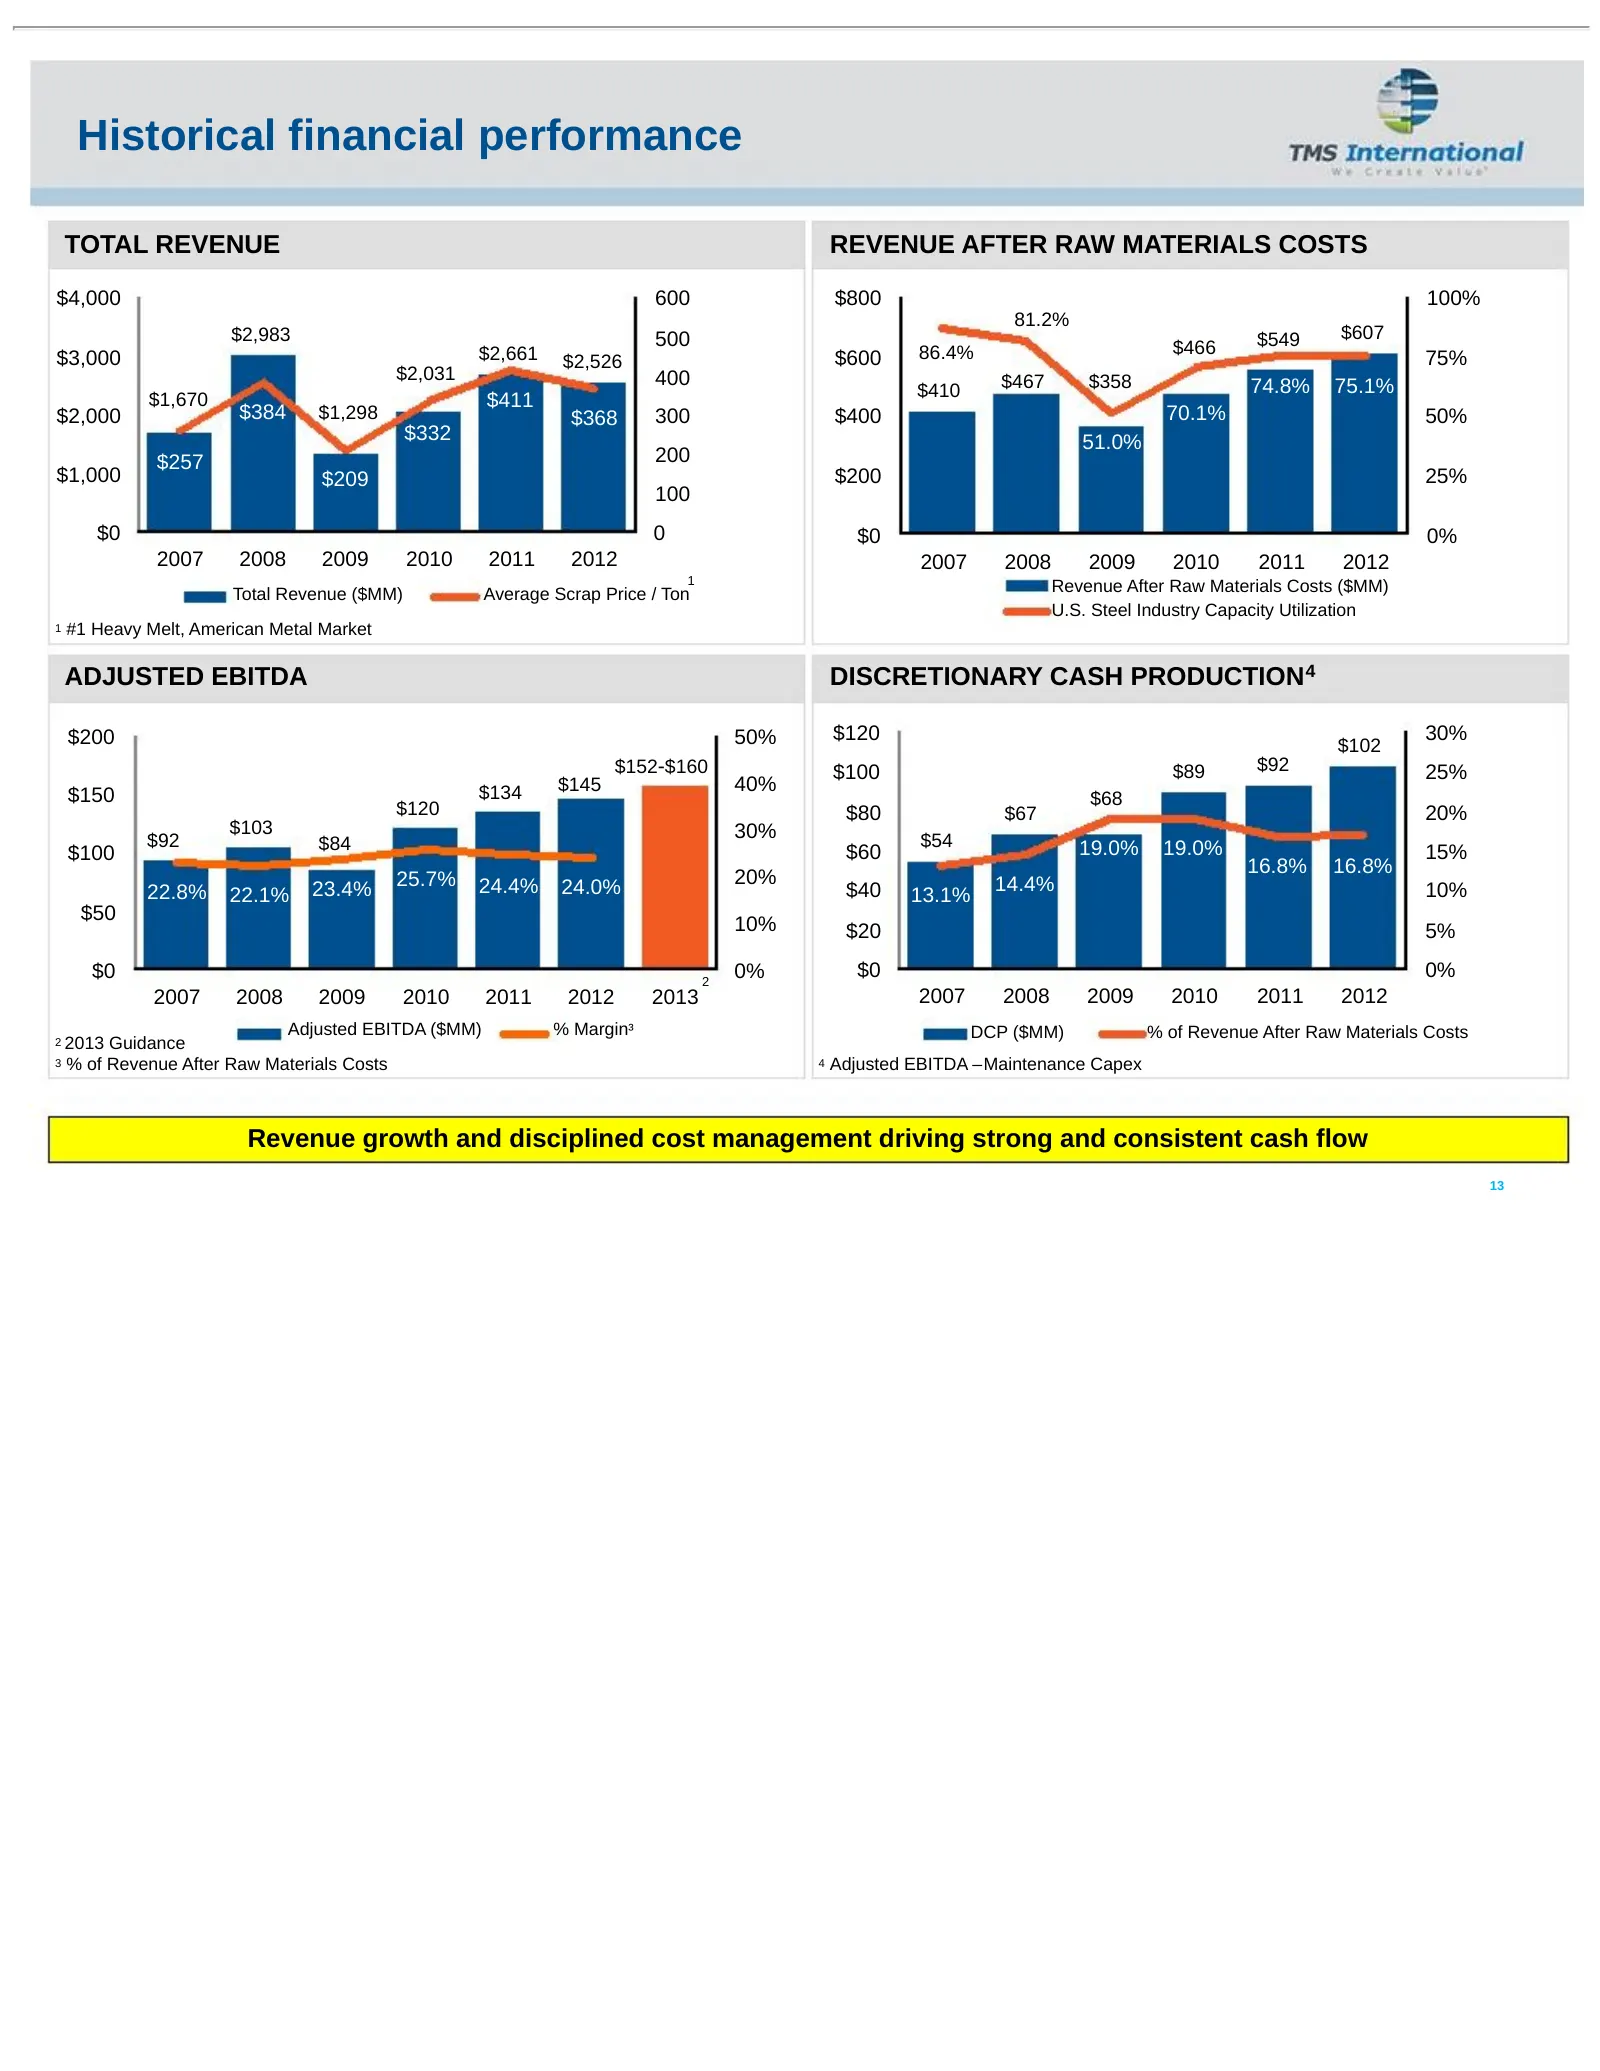
Historical financial performance TOTAL REVENUE REVENUE AFTER RAW MATERIALS COSTS $4,000 600 $800 100% 81.2% $2,983 500 $549 $607 $2,661 86.4% $466 $3,000 $2,526 $600 75% $2,031 400 $467 $358 $410 74.8% 75.1% $1,670 $411 $2,000 $384 $1,298 $368 300 $400 70.1% 50% $332 51.0% $257 200 $1,000 $209 $200
Slide 15: Fourth quarter and full year financial highlights
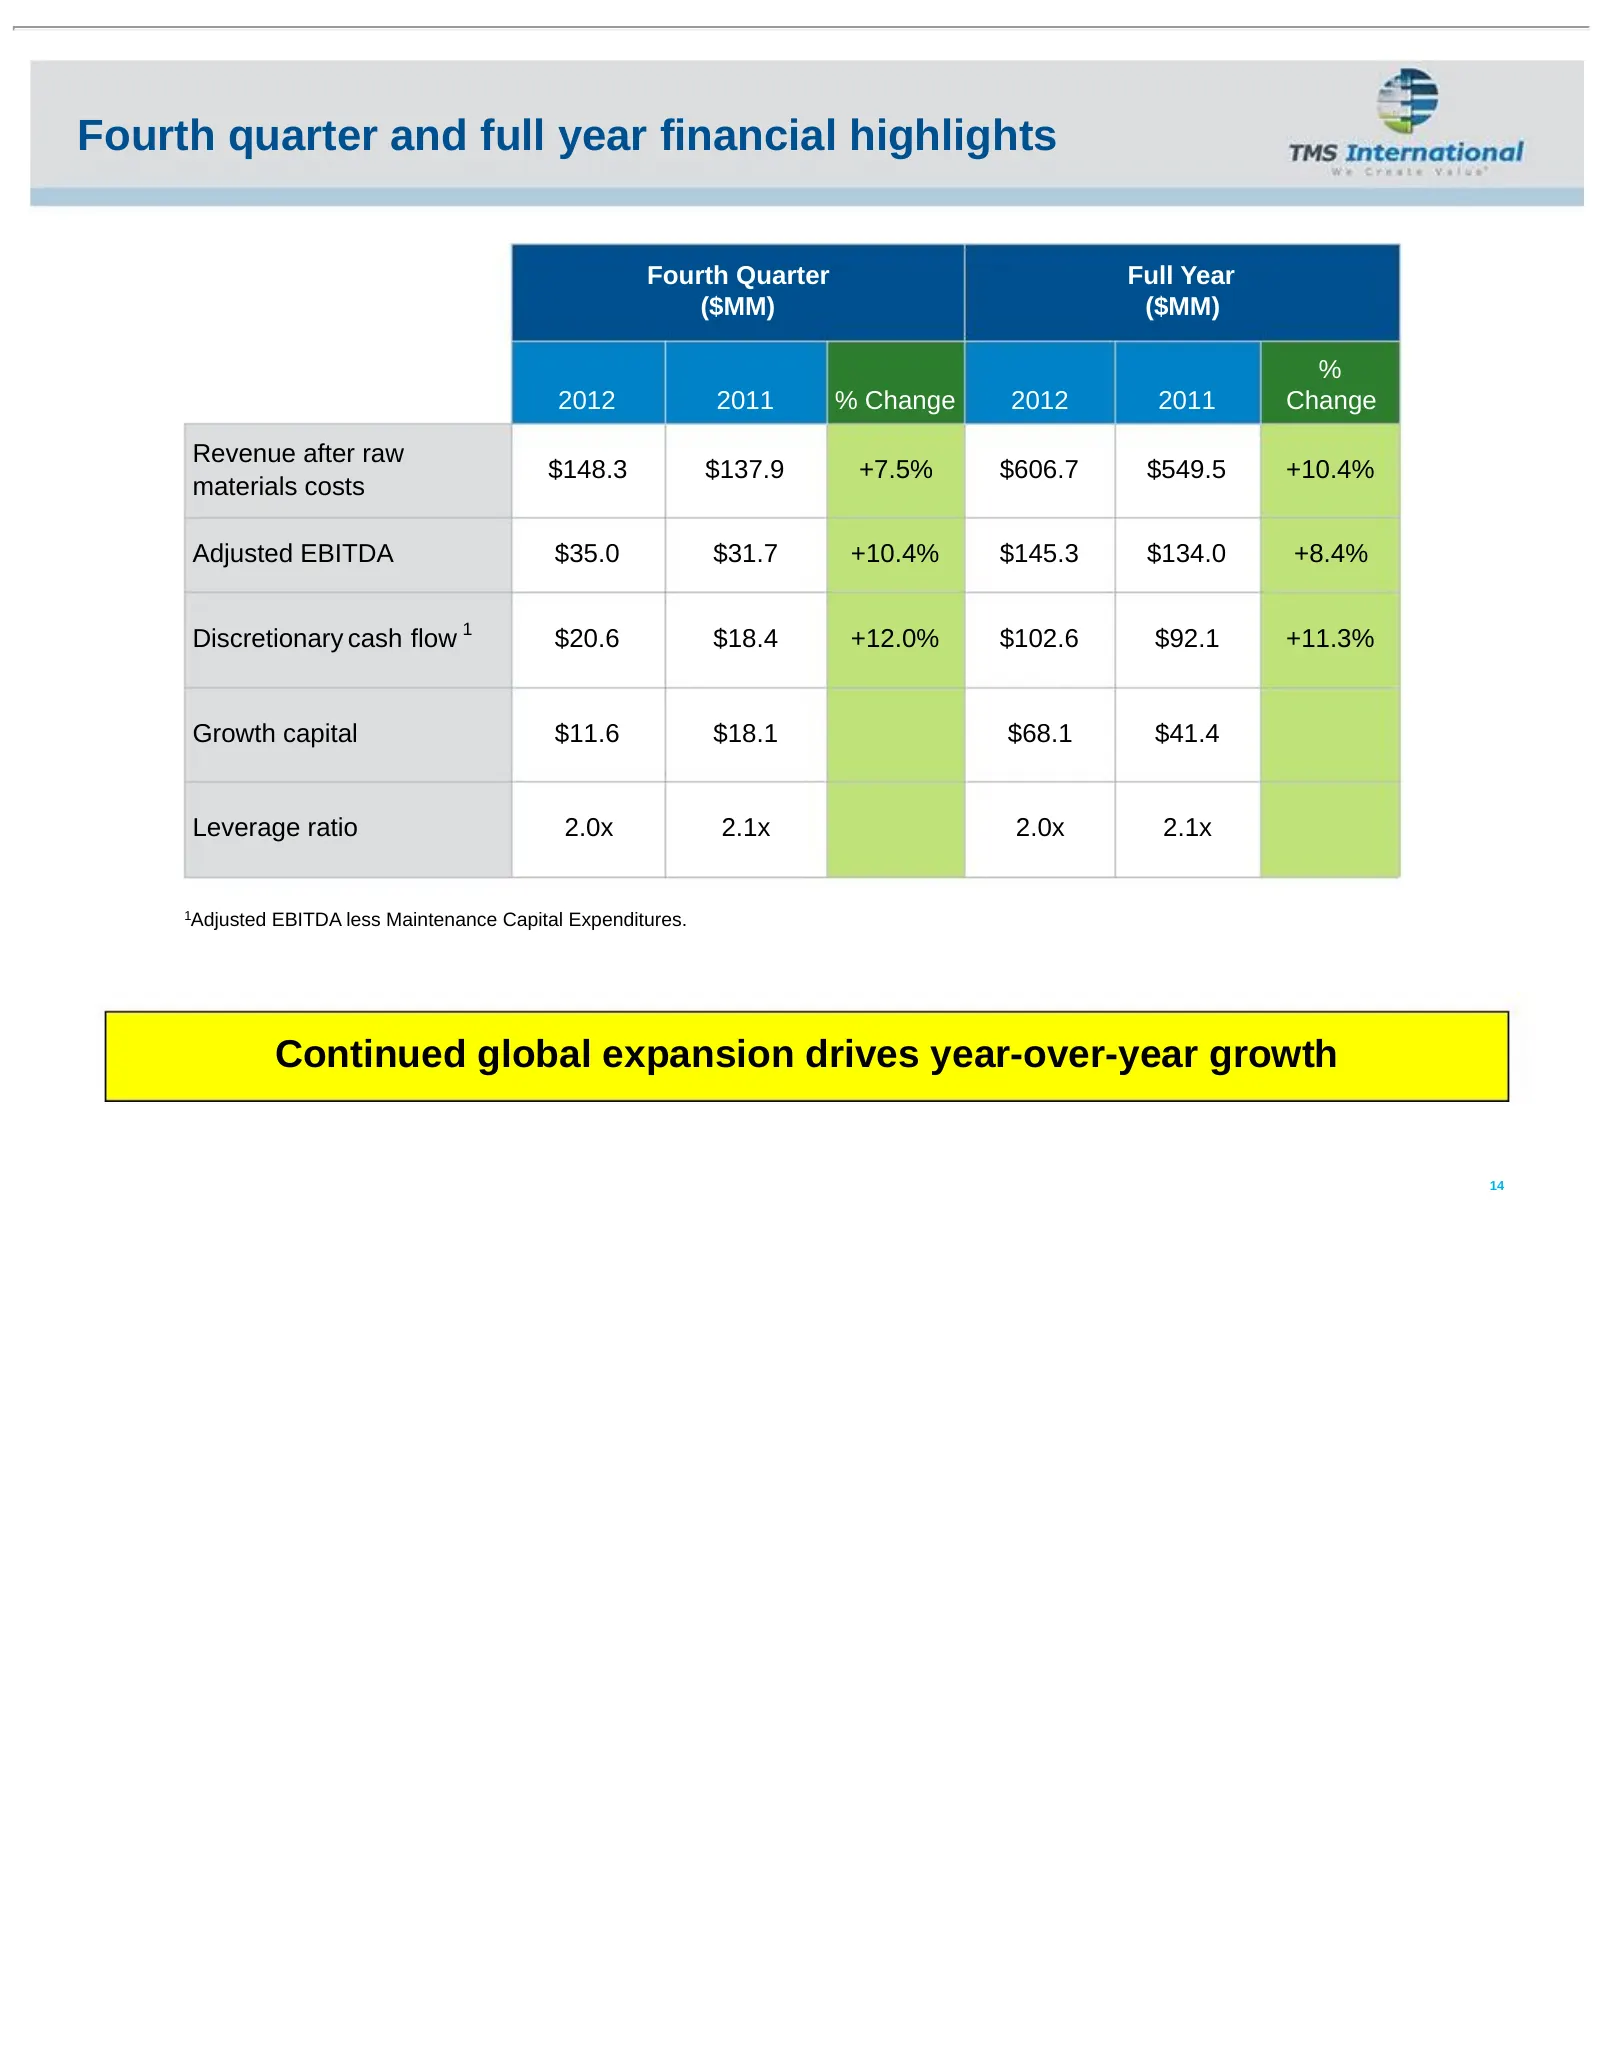
Fourth quarter and full year financial highlights Fourth Quarter Full Year ($MM) ($MM) % 2012 2011 % Change 2012 2011 Change Revenue after raw $148.3 $137.9 +7.5% $606.7 $549.5 +10.4% materials costs Adjusted EBITDA $35.0 $31.7 +10.4% $145.3 $134.0 +8.4% Discretionary cash flow 1 $20.6 $18.4 +12.0%
Slide 16: Concluding remarks
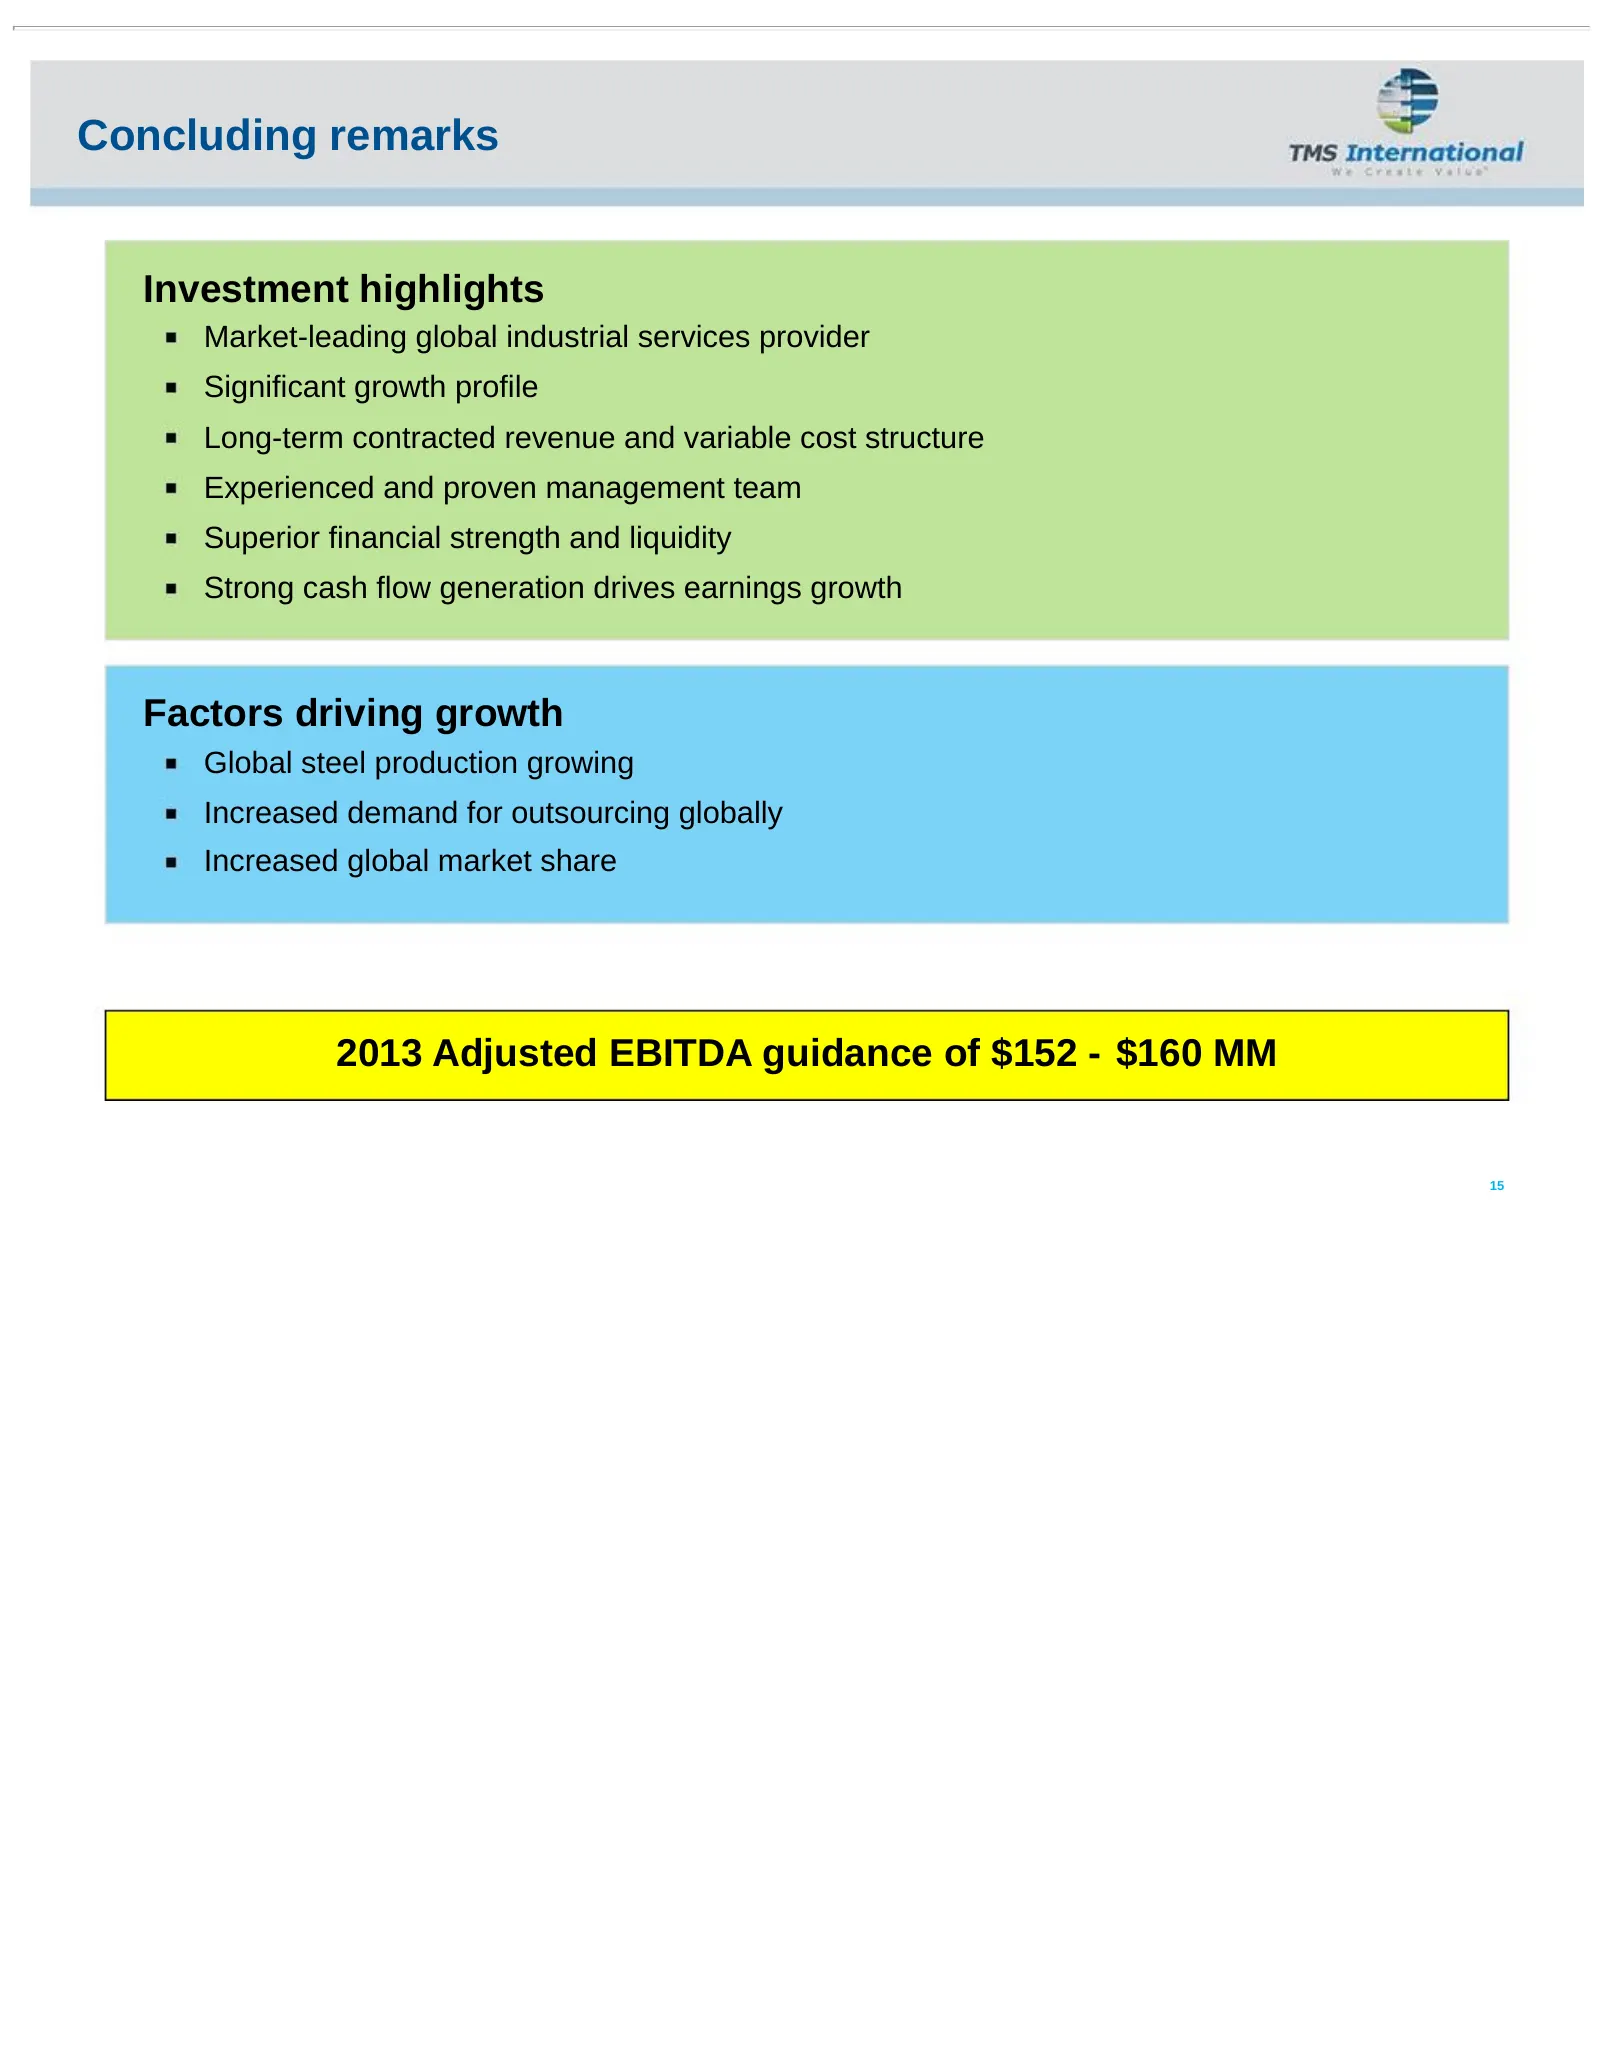
Concluding remarks Investment highlights Market-leading global industrial services provider Significant growth profile Long-term contracted revenue and variable cost structure Experienced and proven management team Superior financial strength and liquidity Strong cash flow generation drives earnings
Slide 17: Appendix
Appendix
Slide 18: Case study: Growing with our customers internationally
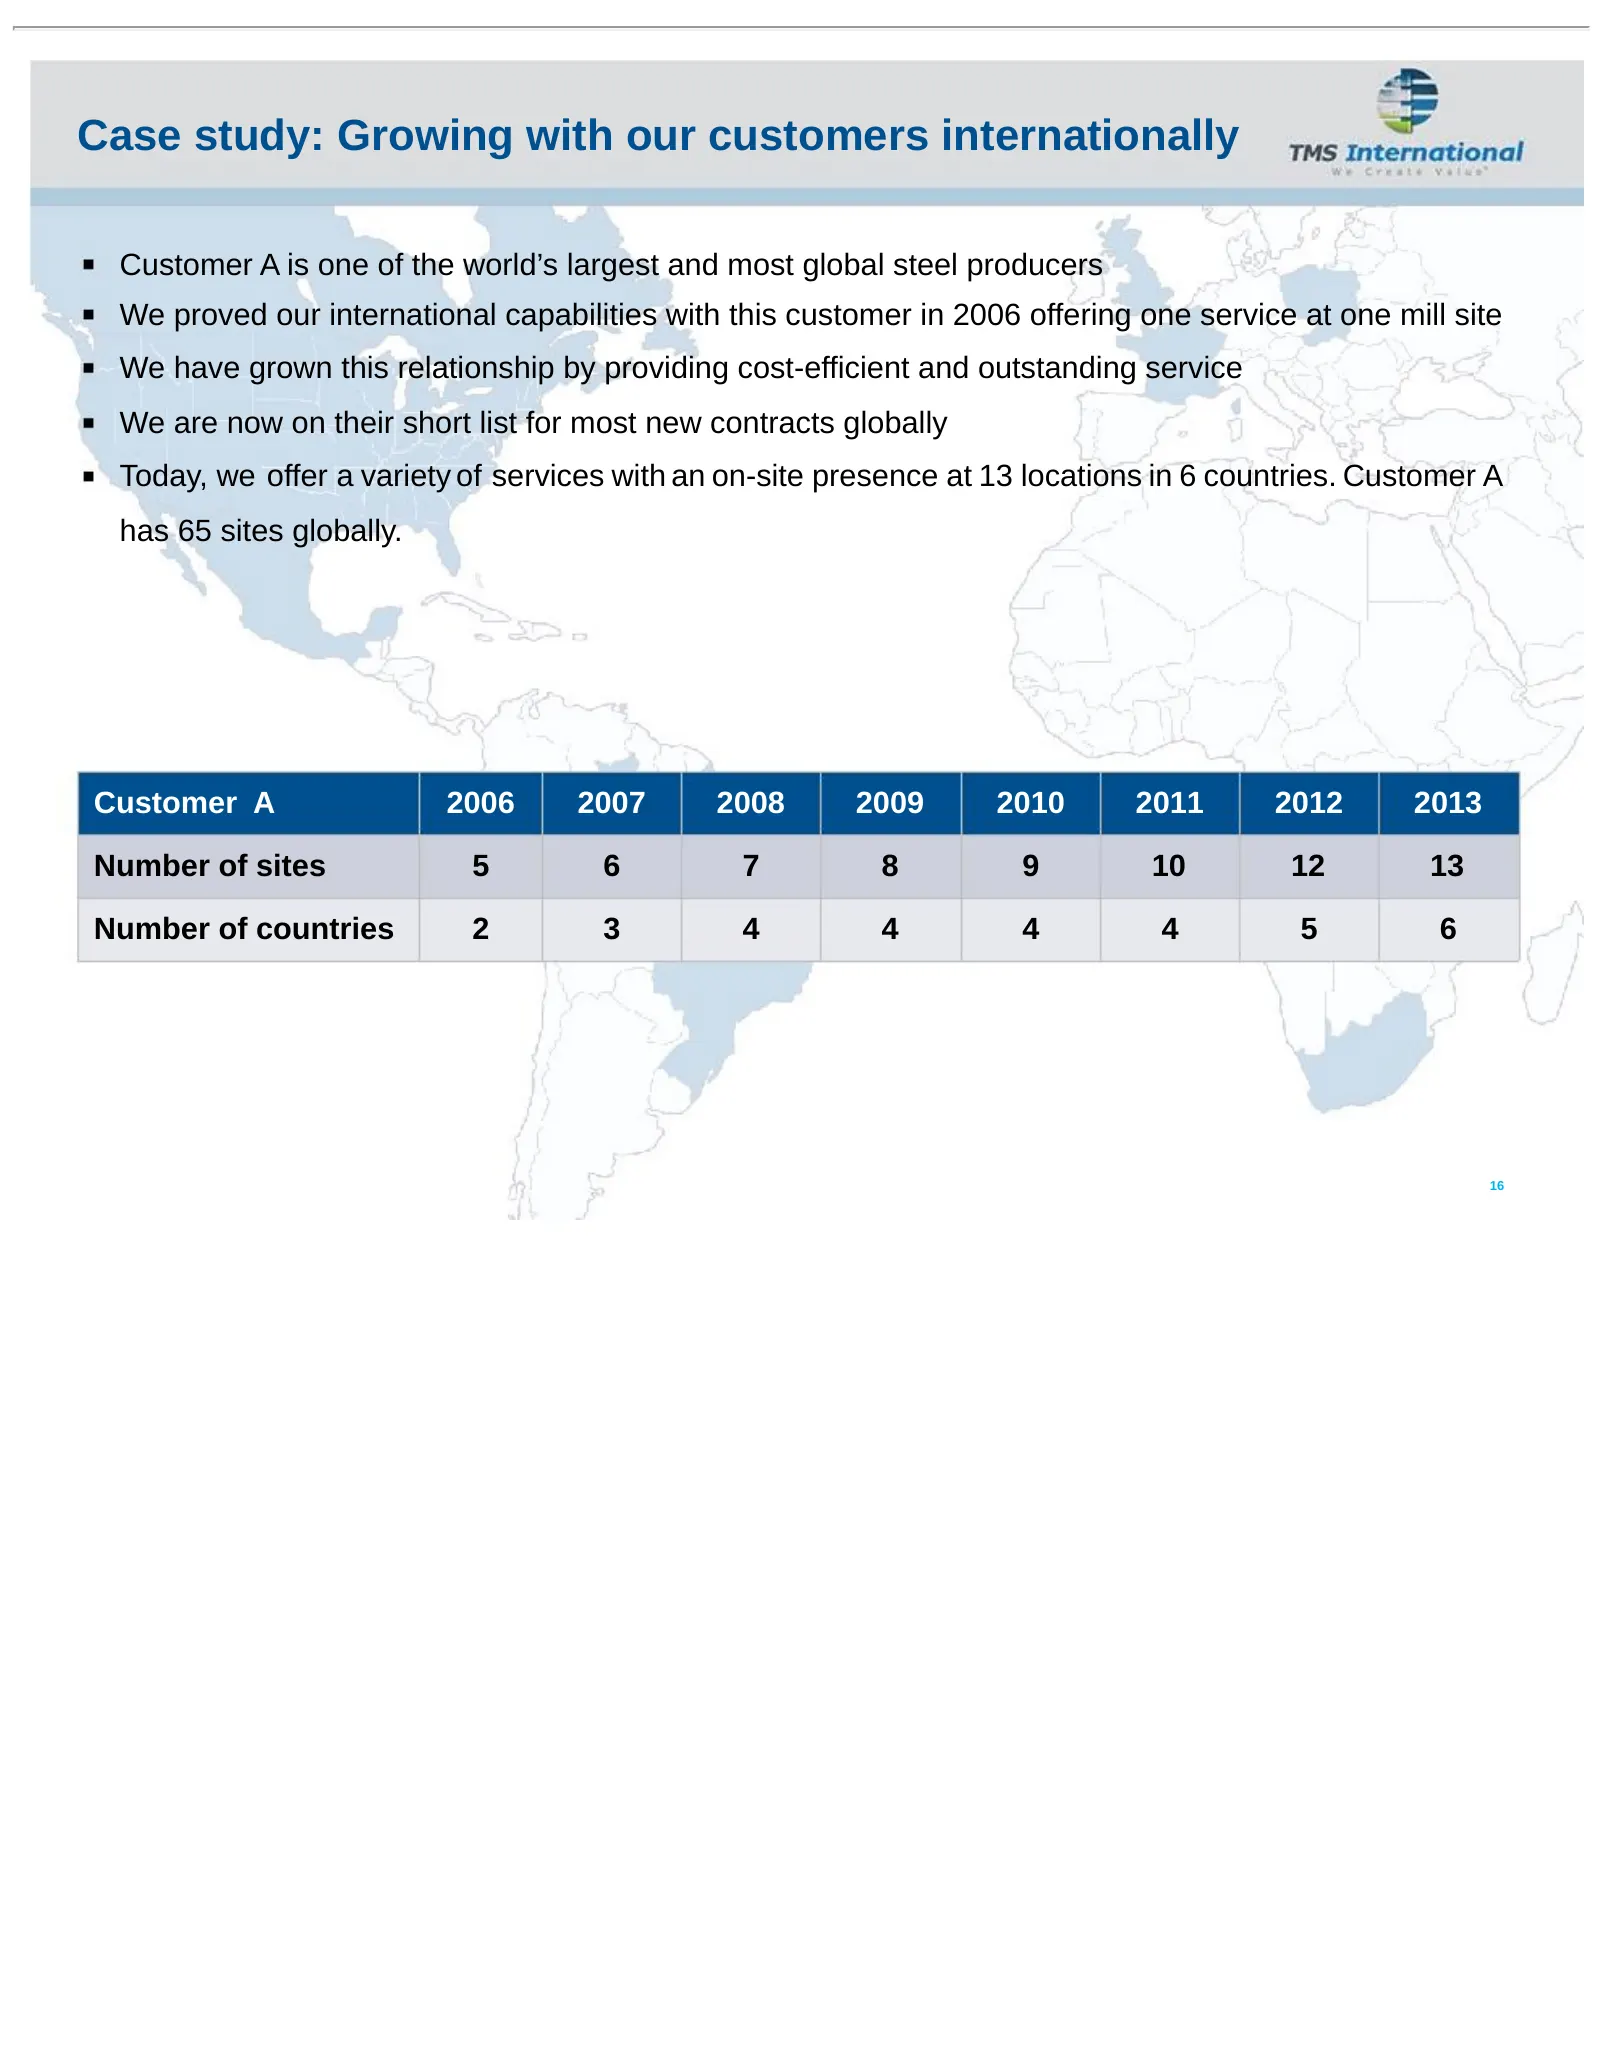
Case study: Growing with our customers internationally Customer A is one of the world’s largest and most global steel producers We proved our international capabilities with this customer in 2006 offering one service at one mill site We have grown this relationship by providing cost-efficient and ou
Slide 19: Case study: Entering the Mexican market
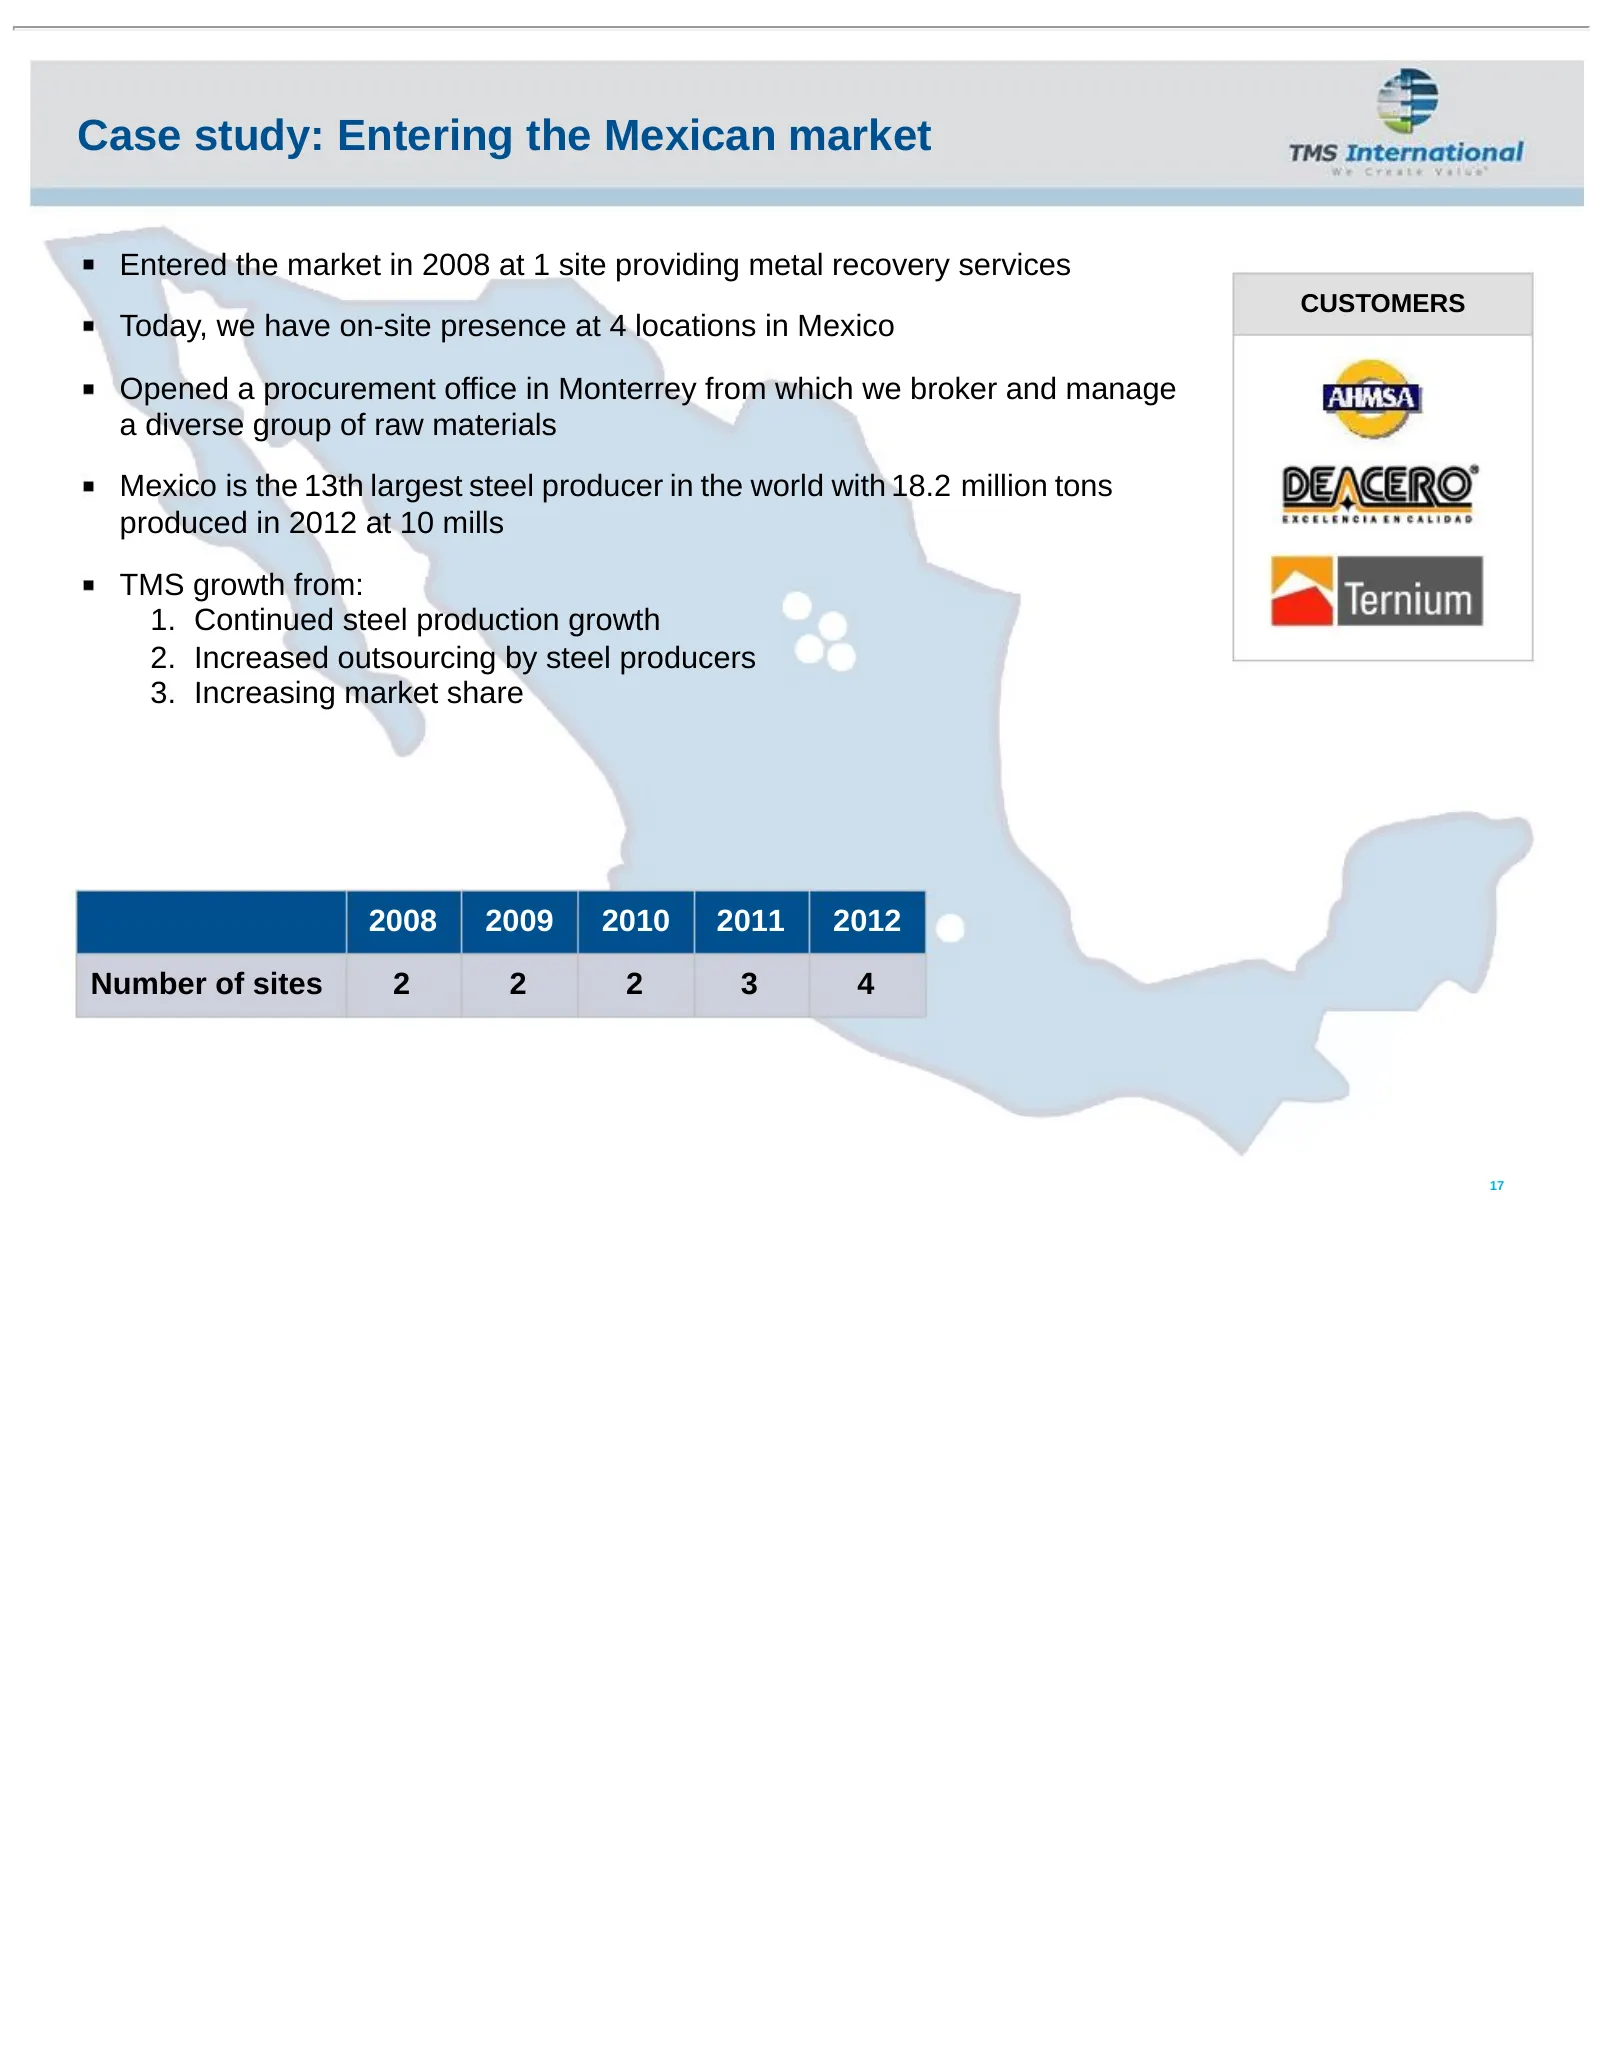
Case study: Entering the Mexican market Entered the market in 2008 at 1 site providing metal recovery services CUSTOMERS Today, we have on-site presence at 4 locations in Mexico Opened a procurement office in Monterrey from which we broker and manage a diverse group of raw materials Mexico is the 13
Slide 20: TMS enables steel producers to lower costs and generate operational efficiencies
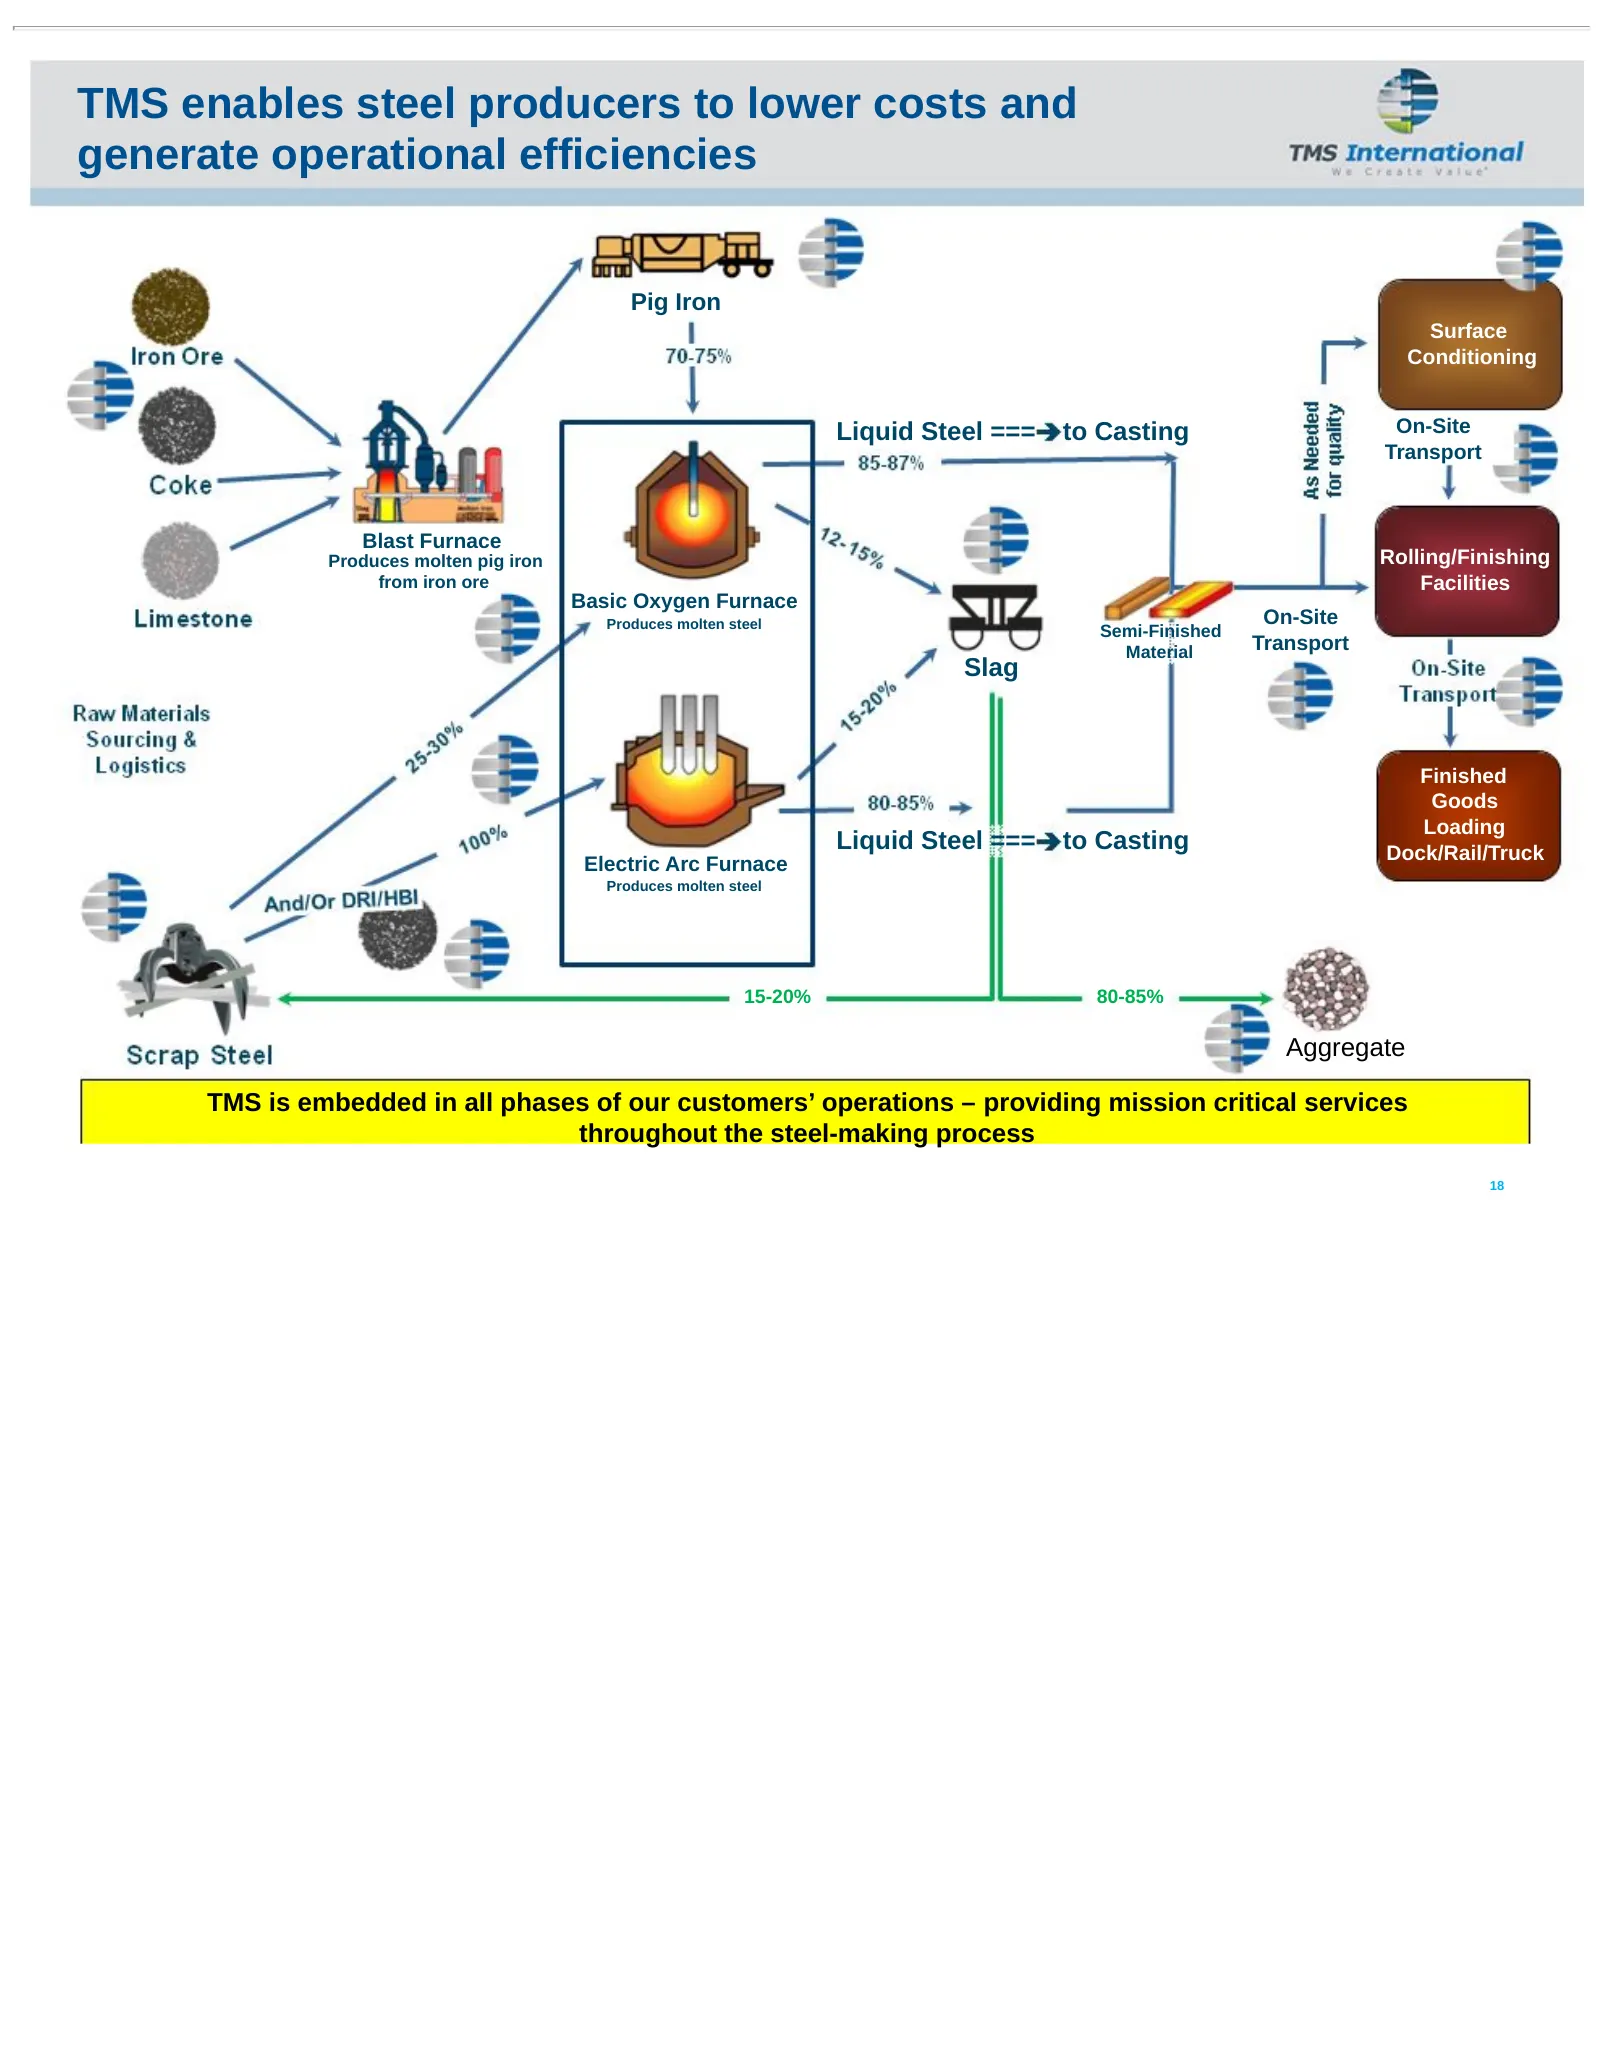
TMS enables steel producers to lower costs and generate operational efficiencies Pig Iron Surface Conditioning Liquid Steel === to Casting On-Site Transport Blast Furnace Produces molten pig iron Rolling/Finishing from iron ore Facilities Basic Oxygen Furnace Produces molten steel On-Site Semi-Finis
Slide 21: mn Tr bi)
mn Tr bi) Tl Hl a wl , wl i ia vill |
Source: SEC EDGAR · 8-K filed Feb 19, 2013