TMS International — FY2012 Earnings Presentation
8 slides from TMS International's earnings presentation, Feb 14, 2013
Slide 1: Fourth Quarter and Full Year 2012 Earnings Call and Webcast
Fourth Quarter and Full Year 2012 Earnings Call and Webcast February 14, 2013 Exhibit 99.2
Slide 2: Fourth quarter and full year 2012 results
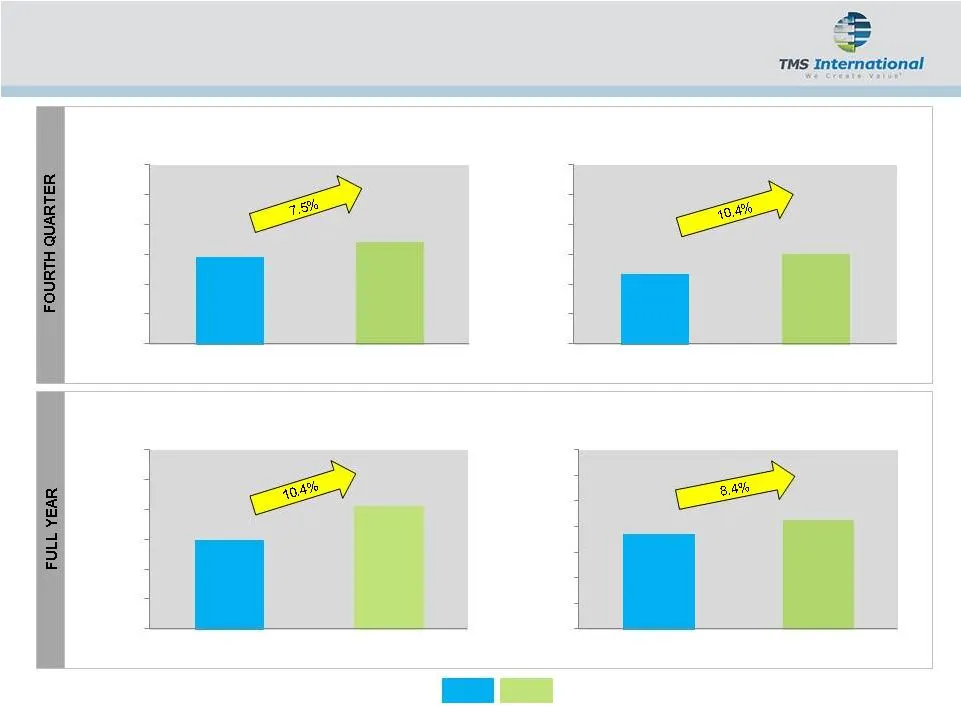
REVENUE AFTER RAW MATERIALS COSTS ($MM) ADJUSTED EBITDA ($MM) Fourth quarter and full year 2012 results REVENUE AFTER RAW MATERIALS COSTS ($MM) ADJUSTED EBITDA ($MM) $549.5 $606.7 $400 $450 $500 $550 $600 $650 $700 $134.0 $145.3 $60 $80 $100 $120 $140 $160 $180 $200 $137.9 $148.3 $80 $100 $120 $140
Slide 3: TMS International
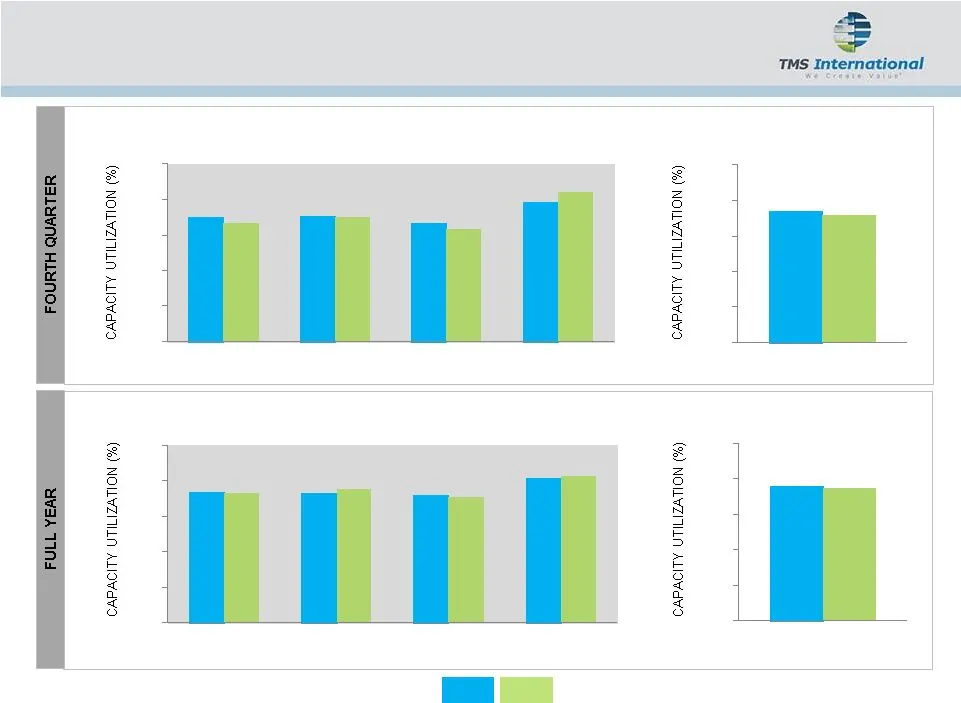
= ia TMS International (66) NOLLWZITILN ALIOWED (66) NOLLWZITILN ALIOWED (66) NOLLWZITILA ALIOWED
Slide 4: MSG operational highlights
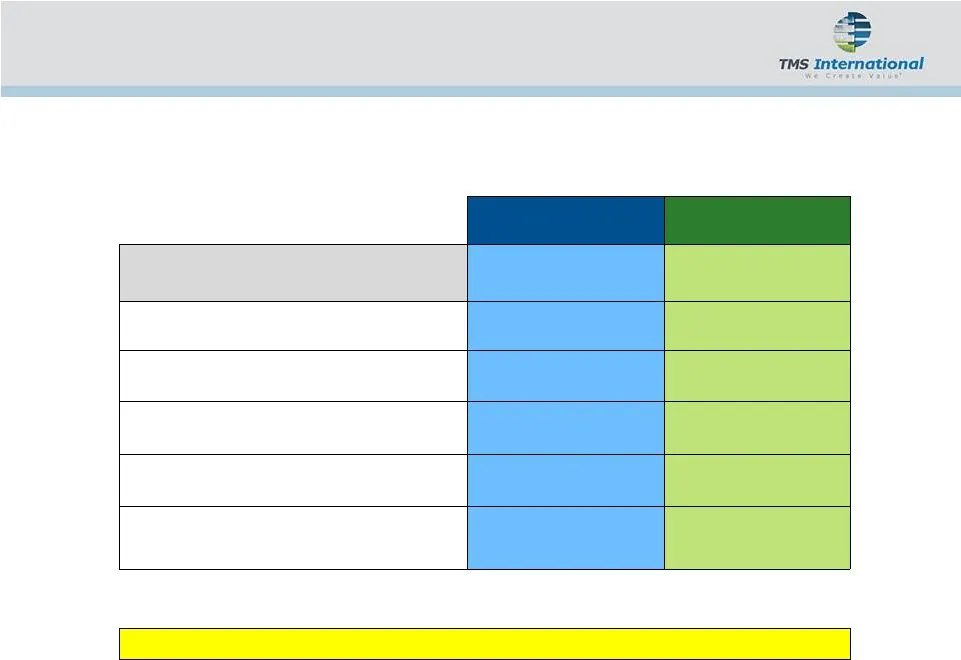
2012 2013 YTD # of MSG contract wins Cross-sells International Growth capital commitment $37MM $50-55MM Additional revenue backlog $308MM $266MM New countries penetrated South Africa Poland Malaysia MSG operational highlights Continued success winning contracts in targeted regions
Slide 5: RMOG operational highlights
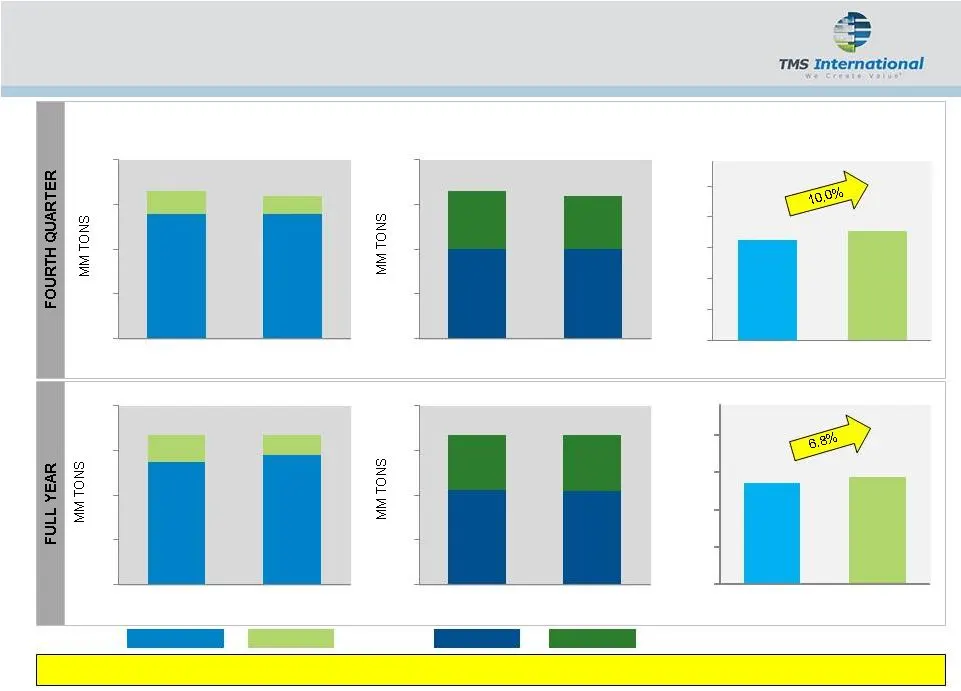
AGENCY NON-AGENCY 8.5 8.4 4.9 5.0 2.0 2.0 1.3 1.2 RMOG operational highlights VOLUME BY CHANNEL 3.3 NORTH AMERICA INTERNATIONAL VOLUME BY GEOGRAPHY 3.2 3.3 3.2 13.4 13.4 13.4 13.4 REVENUE AFTER RAW MATERIALS COSTS ($MM) 10% revenue growth despite flat volumes $0 $5 $10 $15 $20 $25 $16.2 $17.8 $67.2
Slide 6: Fourth quarter and full year financial highlights
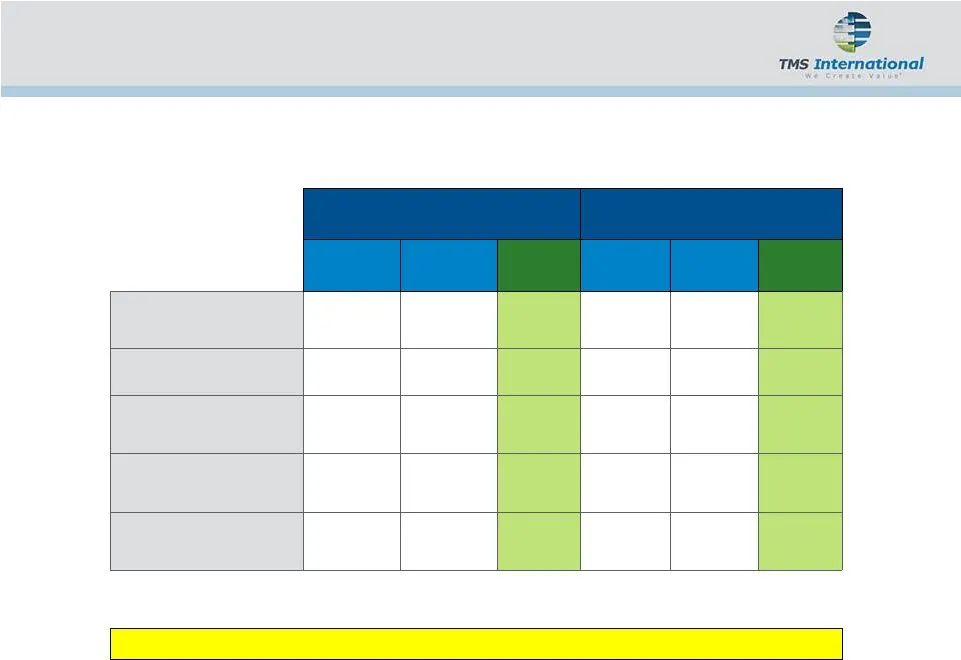
Fourth Quarter ($MM) Full Year ($MM) 2012 2011 % Change 2012 2011 % Change Revenue after raw materials costs $148.3 $137.9 +7.5% $606.7 $549.5 +10.4% Adjusted EBITDA $35.0 $31.7 +10.4% $145.3 $134.0 +8.4% Discretionary cashflow (1) $20.6 $18.4 +12.0% $102.6 $92.1 +11.3% Growth capital $11.6 $18.1 $6
Slide 7: Concluding remarks
Concluding remarks Investment highlights Market-leading global industrial services provider Significant growth profile Long-term contracted revenue and variable cost structure Experienced and proven management team Superior financial strength and liquidity Strong cash flow generation drives earnings

Slide 8: TMS International
= > TMS International TMSinternationalCorp.com,
Source: SEC EDGAR · 8-K filed Feb 14, 2013