TMS International — Q1 2013 Earnings Presentation
8 slides from TMS International's earnings presentation, Apr 25, 2013
Slide 1: First Quarter 2013 Earnings Call and Webcast
First Quarter 2013 Earnings Call and Webcast April 25, 2013 Exhibit 99.2
Slide 2: First Quarter 2013 Results
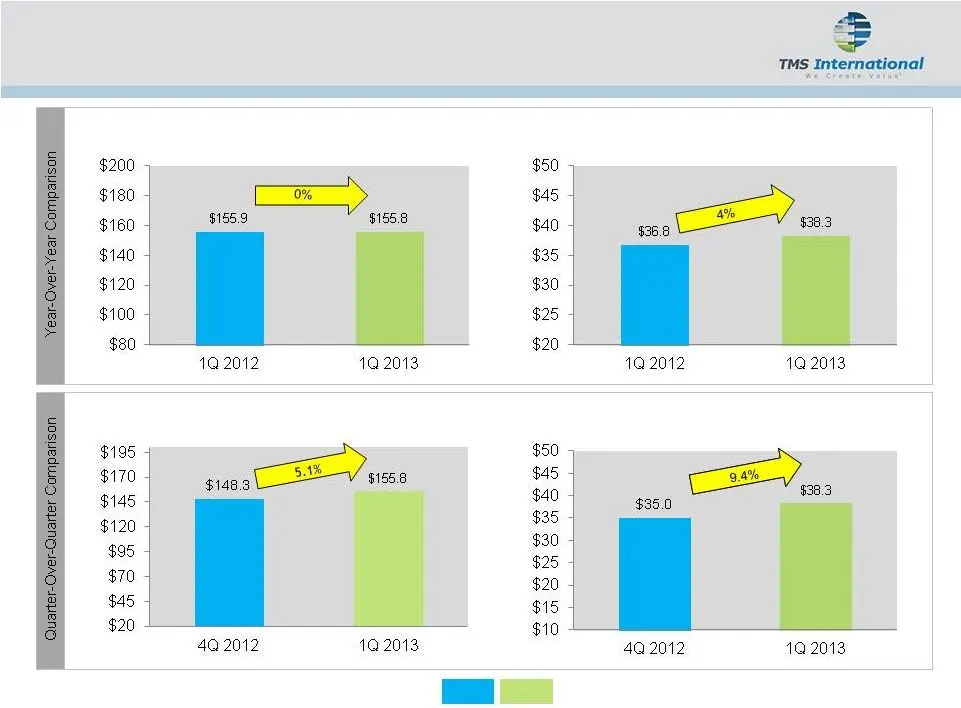
REVENUE AFTER RAW MATERIALS COSTS ($MM) ADJUSTED EBITDA ($MM) First Quarter 2013 Results REVENUE AFTER RAW MATERIALS COSTS ($MM) ADJUSTED EBITDA ($MM)
Slide 3: Operating Environment Summary
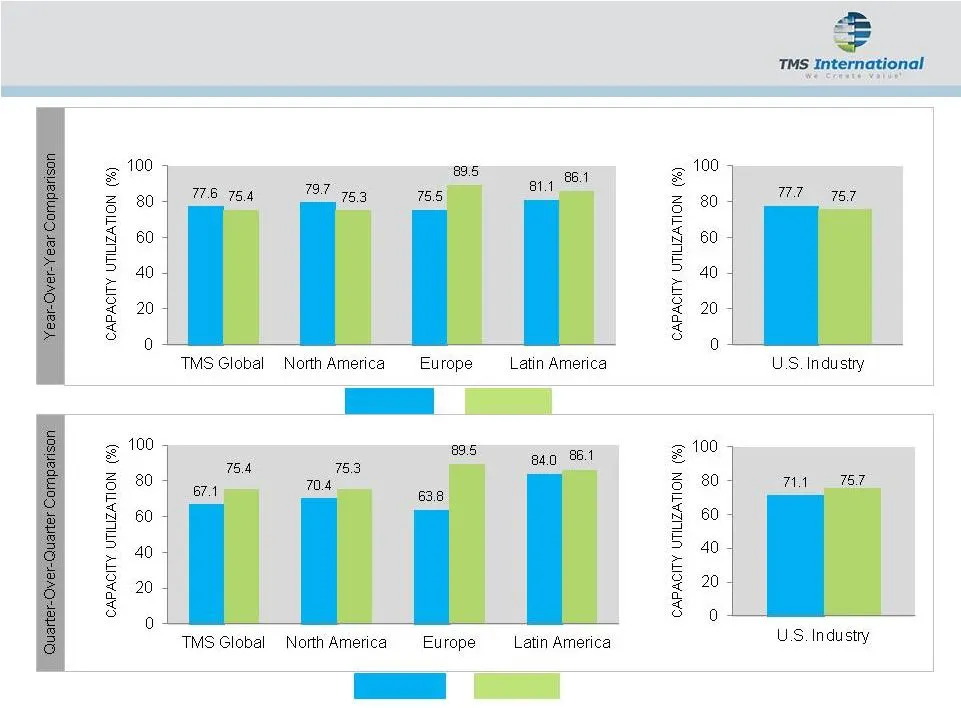
Operating Environment Summary 1Q 2013 1Q 2012 TMS CUSTOMERS BY REGION TMS CUSTOMERS BY REGION 4Q 2012 1Q 2013
Slide 4: MSG Operational Highlights
MSG Operational Highlights Continued success winning contracts in targeted regions Began Services in Poland March 1, 2013 Began Services in Poland March 1, 2013 Alabama and Mexico Update Alabama and Mexico Update Contract Renewals Update Contract Renewals Update
Slide 5: RMOG Operational Highlights
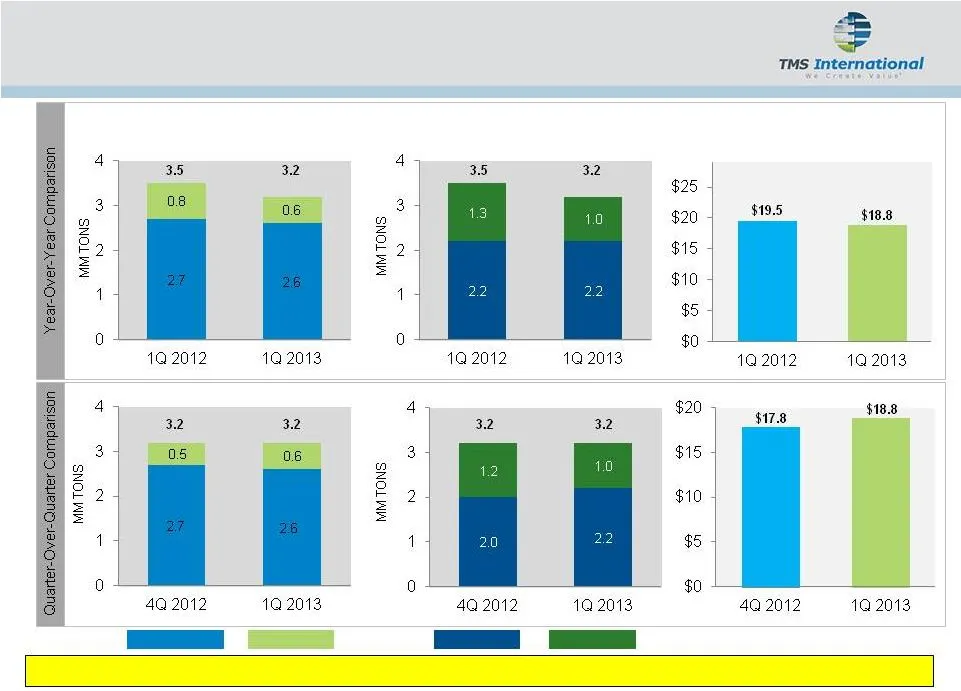
AGENCY NON-AGENCY RMOG Operational Highlights VOLUME BY CHANNEL NORTH AMERICA INTERNATIONAL VOLUME BY GEOGRAPHY REVENUE AFTER RAW MATERIALS COSTS ($MM) EBITDA UP 8% FROM 4 TH QUARTER 2012 DESPITE FLAT VOLUMES
Slide 6: First Quarter Financial Highlights
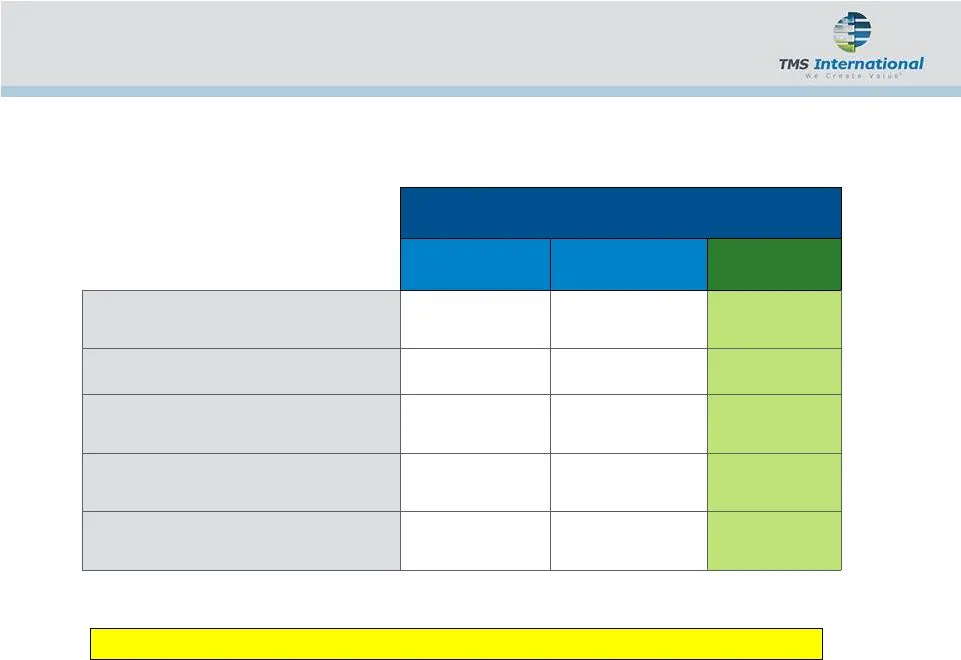
First Quarter ($MM) 2013 2012 % Change Revenue After Raw Materials Costs $155.8 $155.9 0% Adjusted EBITDA $38.3 $36.8 4.0% Discretionary Cash Flow (1) $28.0 $29.1 (3.8)% Growth Capital $10.3 $25.5 Leverage Ratio 2.0x 2.1x (1) Adjusted EBITDA less Maintenance Capital Expenditures. First Quarter Finan
Slide 7: Concluding Remarks
Concluding Remarks New contract performance and continued cost management drives solid 1Q 2013, despite challenges at some locations and lower North American production volumes year-over-year Revenue After Raw Materials Costs was comparable with 1Q 2012, EBITDA up 4% Adjusted EPS was $0.22 in 1Q 201

Slide 8: TMS International
= > TMS International TMSinternationalCorp.com,
Source: SEC EDGAR · 8-K filed Apr 25, 2013