TMS International — Q2 2013 Earnings Presentation
8 slides from TMS International's earnings presentation, Aug 1, 2013

Slide 1: Second Quarter 2013 Earnings Call and Webcast
Second Quarter 2013 Earnin g s Call and Webcast Au g ust 1, 2013 Exhibit 99.2
Slide 2: Second Quarter 2013 Results
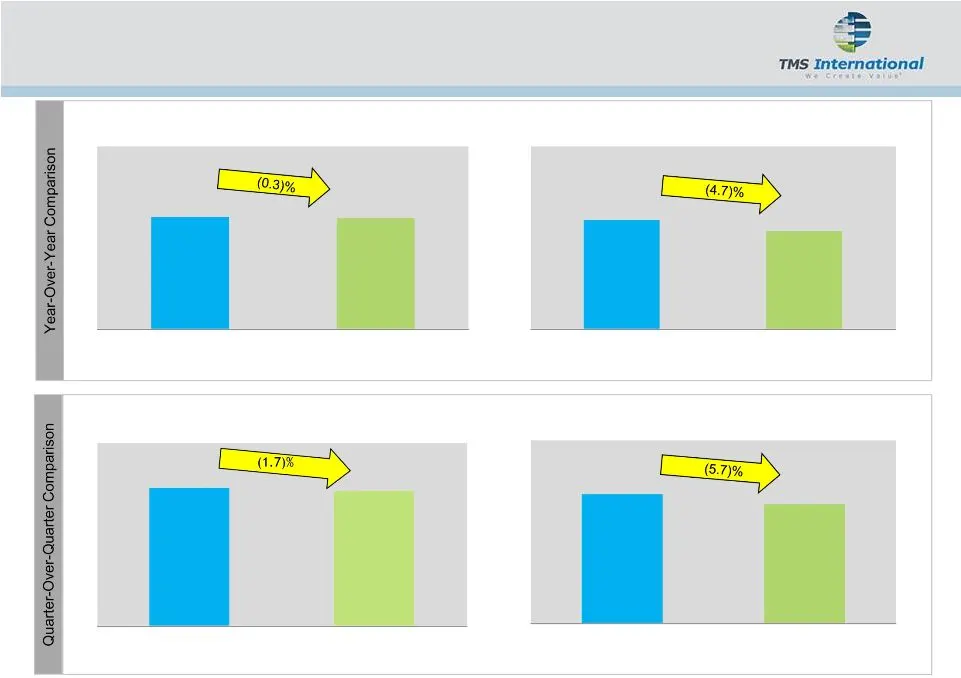
REVENUE AFTER RAW MATERIALS COSTS ($MM) ADJUSTED EBITDA ($MM) Second Quarter 2013 Results REVENUE AFTER RAW MATERIALS COSTS ($MM) ADJUSTED EBITDA ($MM) 153.6 153.1 37.8 36.1 155.8 153.1 38.3 36.1 2Q 2012 2Q 2013 2Q 2013 2Q 2012 1Q 2013 1Q 2013 2Q 2013 2Q 2013
Slide 3: Operating Environment Summary
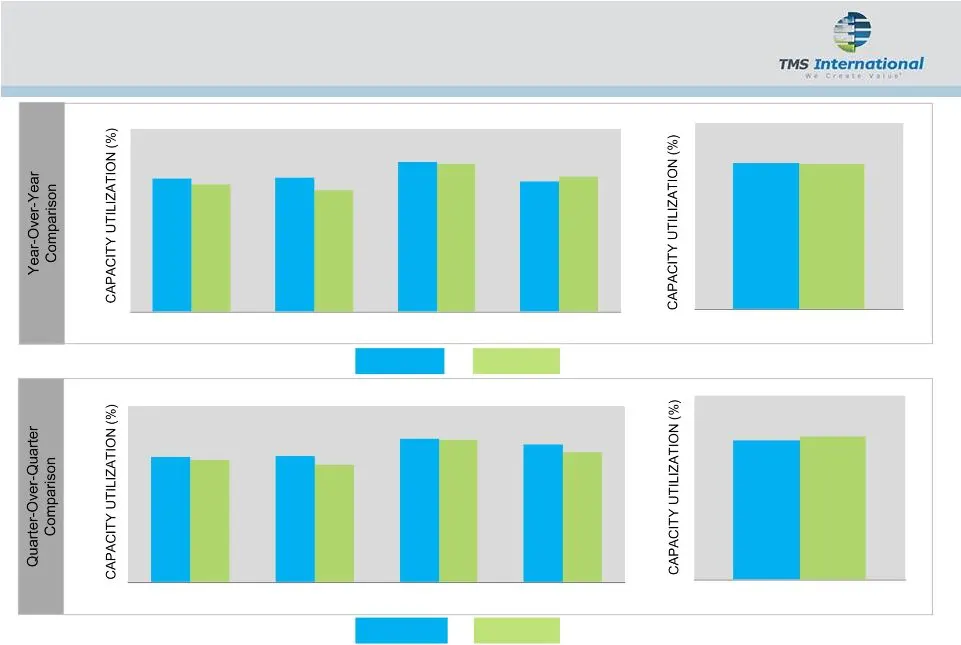
Operating Environment Summary 2Q 2013 2Q 2012 TMS CUSTOMERS BY REGION ¹ TMS CUSTOMERS BY REGION ¹ 1Q 2013 2Q 2013 ² ² (1) Capacity utilization data excludes two greenfield mills (one in North America and one in Latin America) that are currently ramping up production. (2) North America capacity utili
Slide 4: MSG Operational Highlights
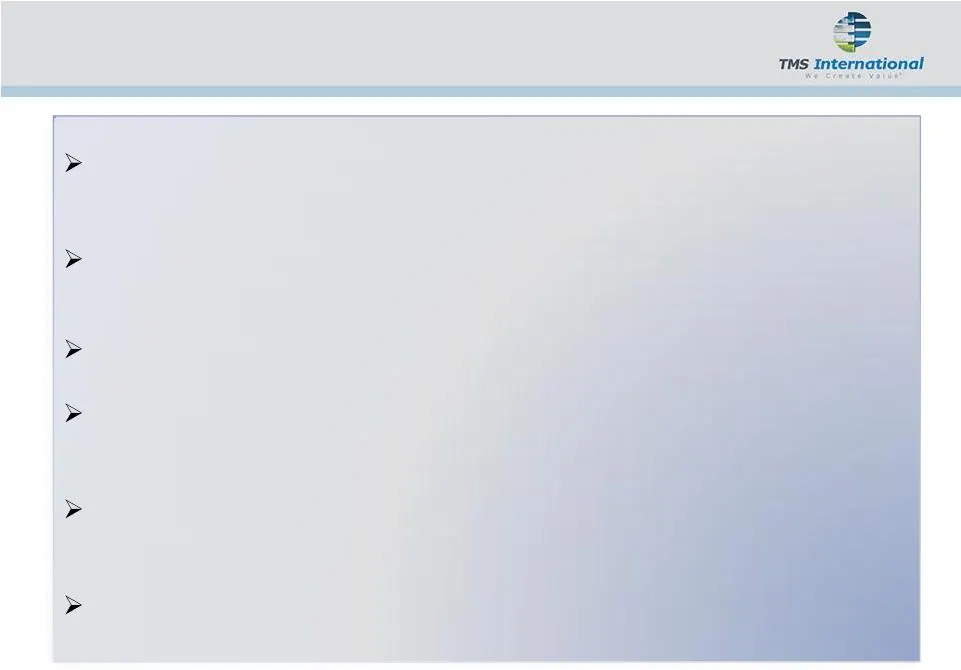
MSG Operational Highlights North American same-site results decreased due to three temporary outages and a non-recurring arbitration award received in 2Q 2012 Increased production year-over-year at customer sites in Latin America, South Africa and UAE New contracts continue to perform well Increased
Slide 5: RMOG Operational Highlights
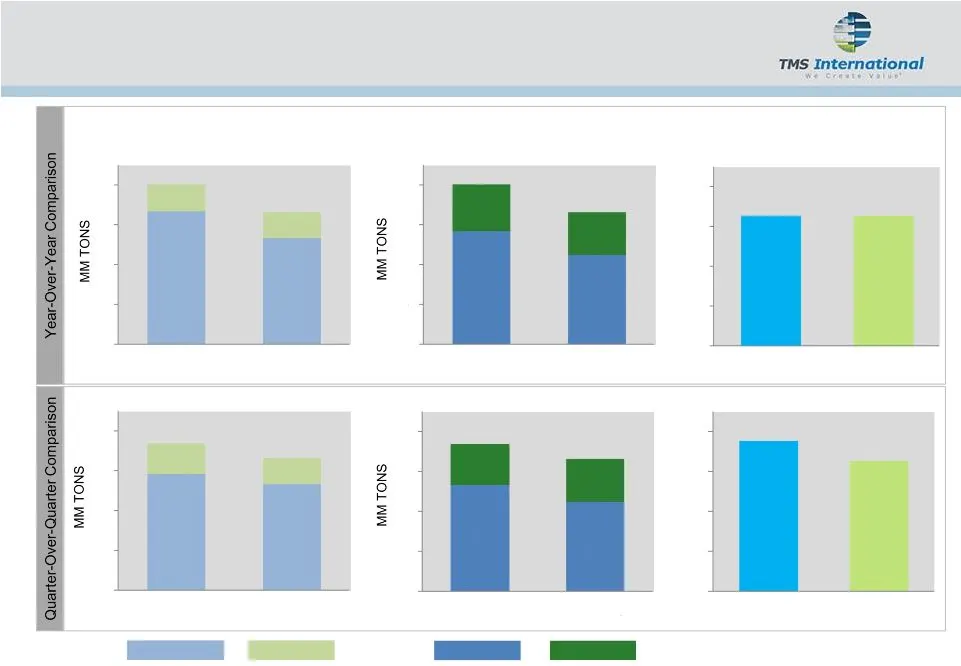
AGENCY NON-AGENCY 0.7 0.7 0.7 3.3 2.7 2.7 1.1 1.2 2.9 2.2 2.2 2.7 1.0 1.1 0.8 2.9 RMOG Operational Highlights VOLUME BY CHANNEL 4.0 NORTH AMERICA INTERNATIONAL VOLUME BY GEOGRAPHY 3.3 4.0 3.3 3.7 3.7 3.3 3.3 REVENUE AFTER RAW MATERIALS COSTS ($MM) 16.4 16.4 18.8 16.4 2Q 2012 2Q 2013 2Q 2012 2Q 2013
Slide 6: Second Quarter Financial Highlights
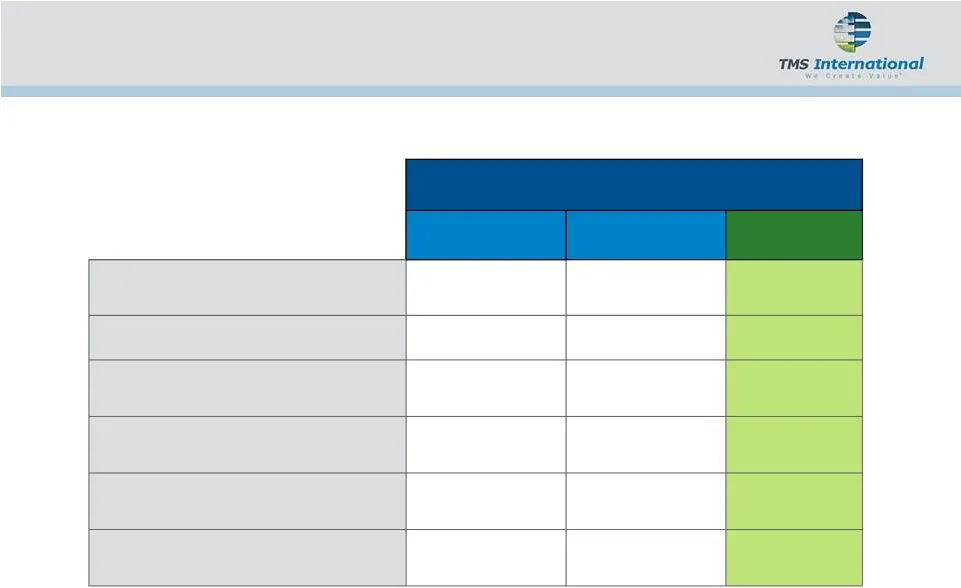
Second Quarter ($MM) 2013 2012 % Change Revenue After Raw Materials Costs $153.1 $153.6 (0.3)% Adjusted EBITDA $36.1 $37.8 (4.7)% Discretionary Cash Flow $25.7 $28.6 (10.3)% Growth Capital $5.0 $12.6 Net Debt $278.8 $283.5 Net Leverage Ratio 1.9x 2.0x (1) Adjusted EBITDA less Maintenance Capital Exp
Slide 7: Concluding Remarks
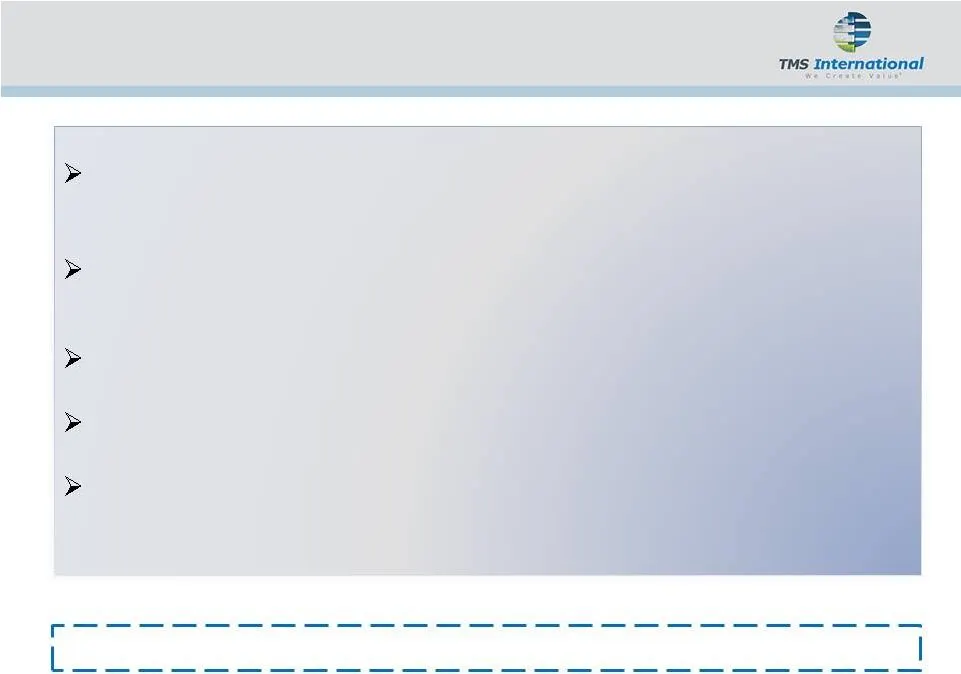
Concluding Remarks 2013 Adjusted EBITDA Guidance of $150-$155 million Challenging quarter due to temporary site outages in North America and lower volumes in brokerage business We and our customers are optimistic for improvement in production volumes in second half of 2013 New contracts continue to

Slide 8: TMS International
= > TMS International TMSinternationalCorp.com,
Source: SEC EDGAR · 8-K filed Aug 1, 2013