Dennys — Investor Presentation (January 2022)
43 slides from Dennys's investor presentation, Jan 10, 2022
Slide 1: Investor Presentation January 2022
INVESTOR PRESENTATION January 2022
Slide 2: Forward-looking statements caution
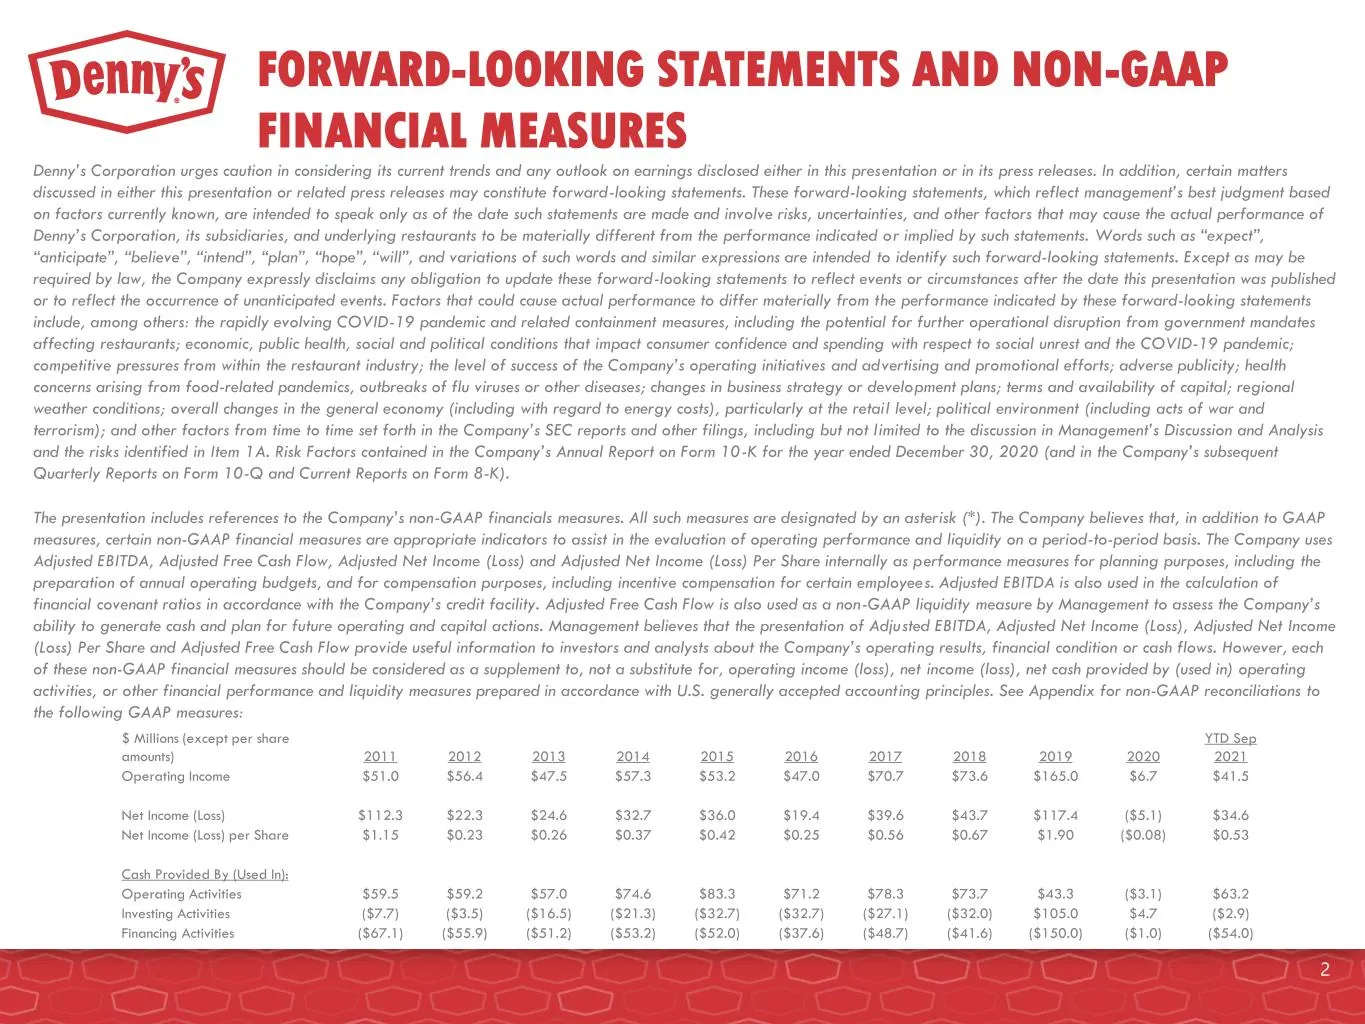
Denny’s Corporation urges caution in considering its current trends and any outlook on earnings disclosed either in this presentation or in its press releases. In addition, certain matters discussed in either this presentation or related press releases may constitute forward-looking statements. Thes
Slide 3: Denny's Investment Highlights
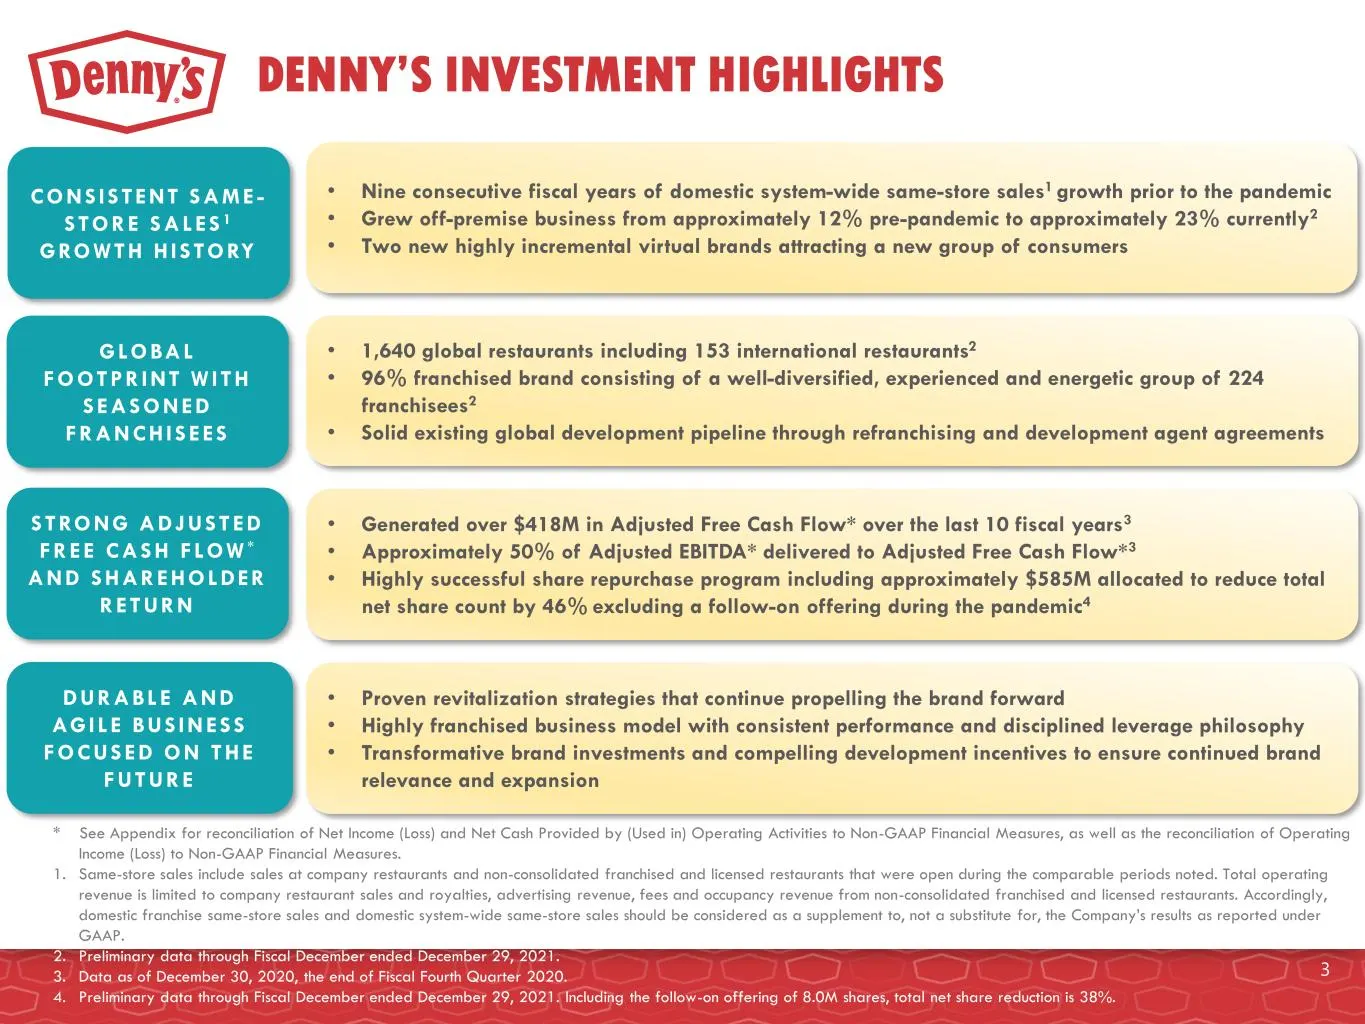
• Proven revitalization strategies that continue propelling the brand forward • Highly franchised business model with consistent performance and disciplined leverage philosophy • Transformative brand investments and compelling development incentives to ensure continued brand relevance and expansion
Slide 4: 2021 Preliminary Results
2021 PRELIMINARY RESULTS 4 4
Slide 5: 2021 Preliminary Highlights
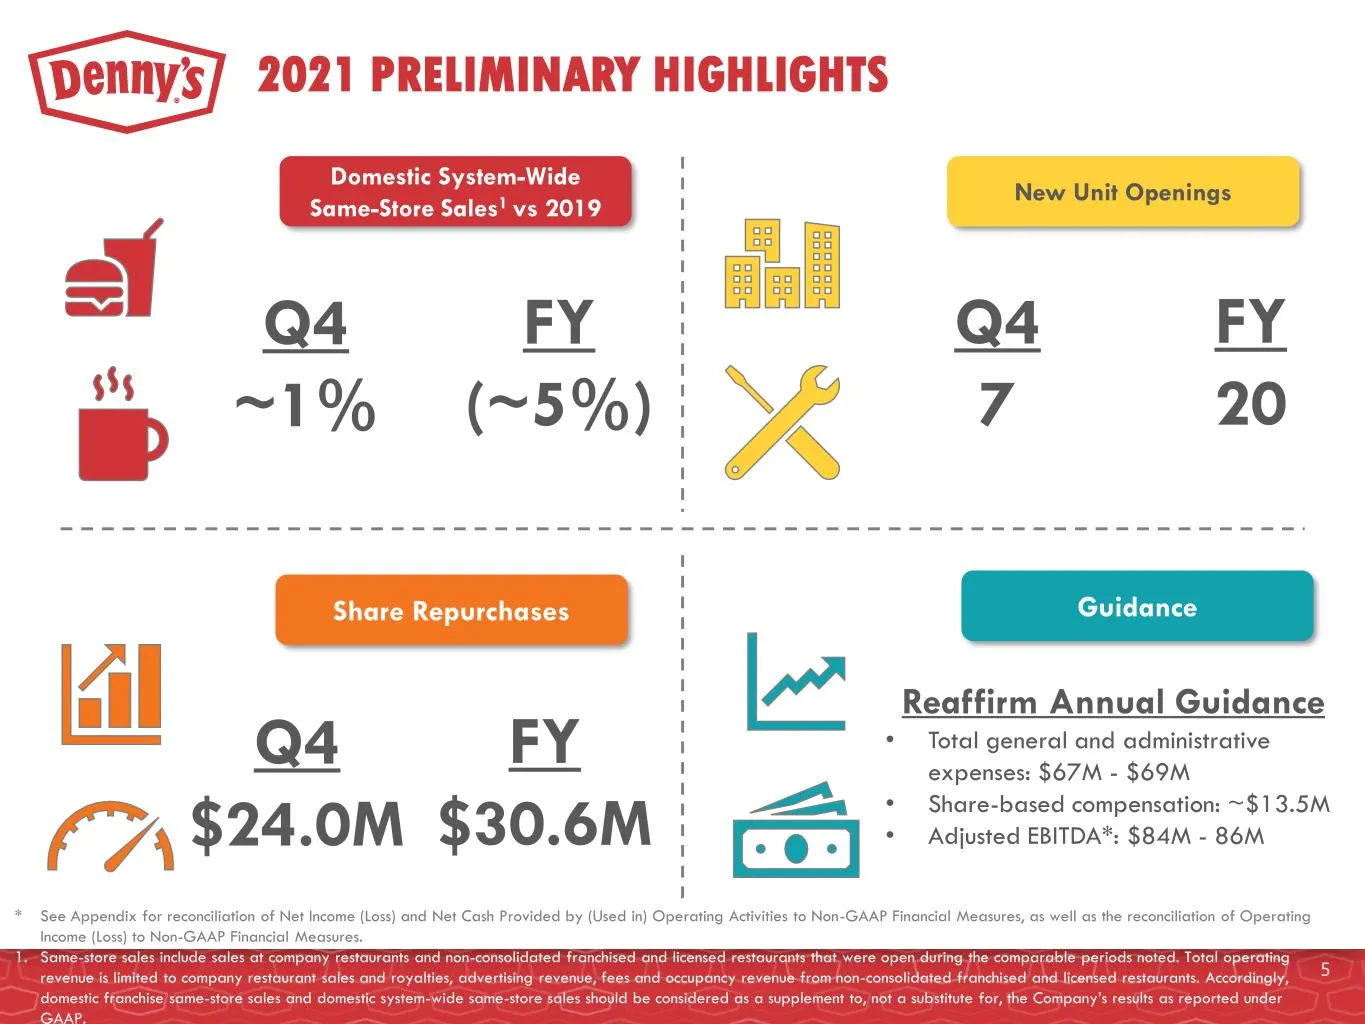
2021 PRELIMINARY HIGHLIGHTS * See Appendix for reconciliation of Net Income (Loss) and Net Cash Provided by (Used in) Operating Activities to Non-GAAP Financial Measures, as well as the reconciliation of Operating Income (Loss) to Non-GAAP Financial Measures. 1. Same-store sales include sales at com
Slide 6: Operations and Sales Trends
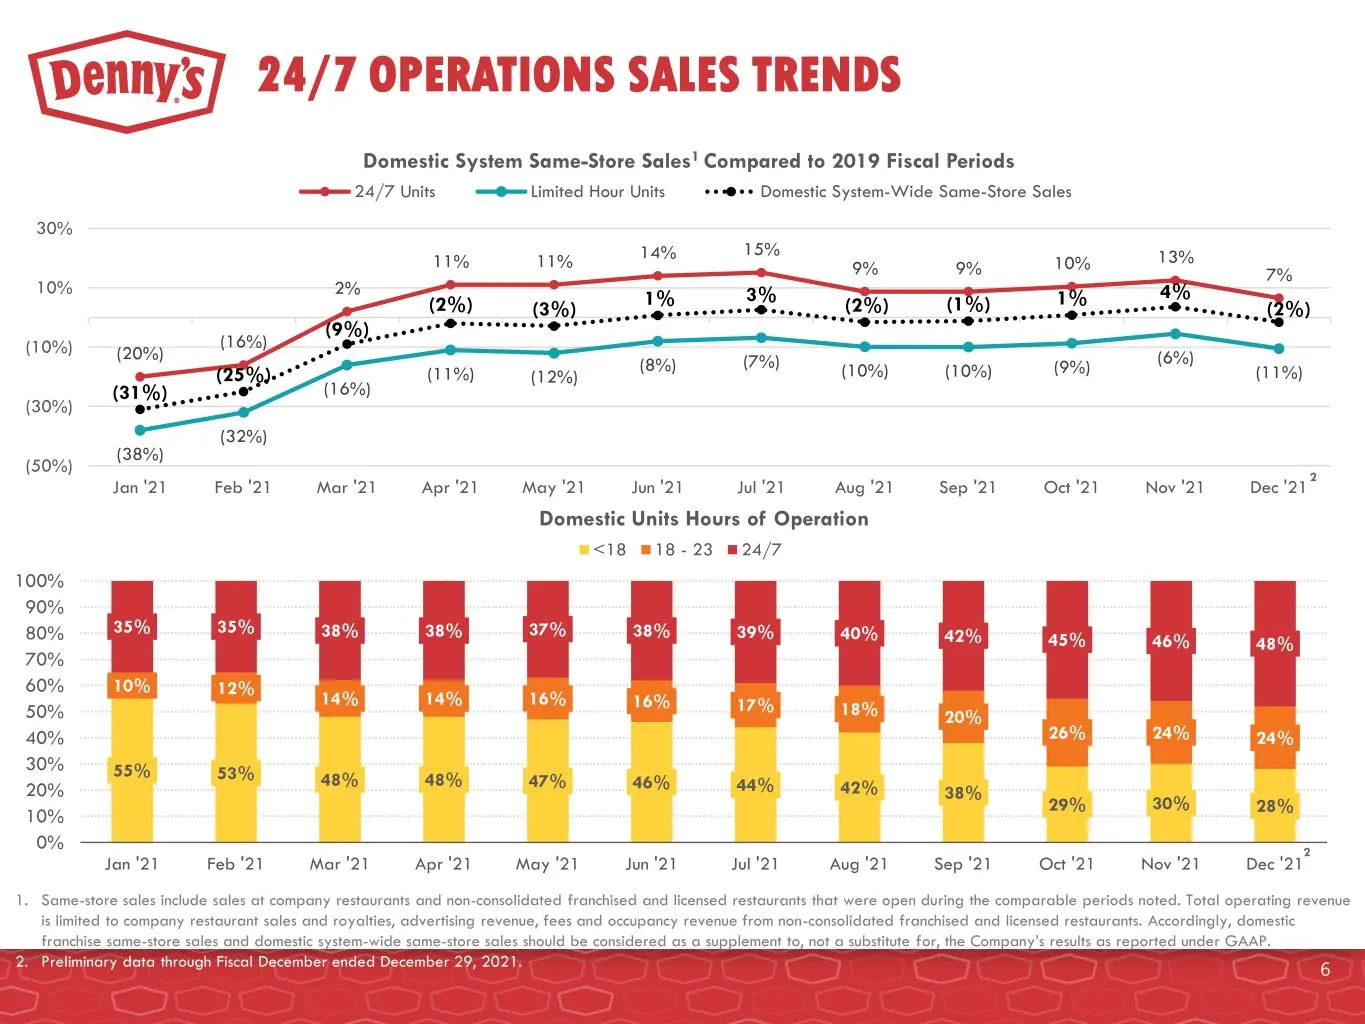
55% 53% 48% 48% 47% 46% 44% 42% 38% 29% 30% 28% 10% 12% 14% 14% 16% 16% 17% 18% 20% 26% 24% 24% 35% 35% 38% 38% 37% 38% 39% 40% 42% 45% 46% 48% 0% 10% 20% 30% 40% 50% 60% 70% 80% 90% 100% Jan '21 Feb '21 Mar '21 Apr '21 May '21 Jun '21 Jul '21 Aug '21 Sep '21 Oct '21 Nov '21 Dec '21 Domestic Units H
Slide 7: Off-Premise Sales Remain Strong at ~23% of Total Sales
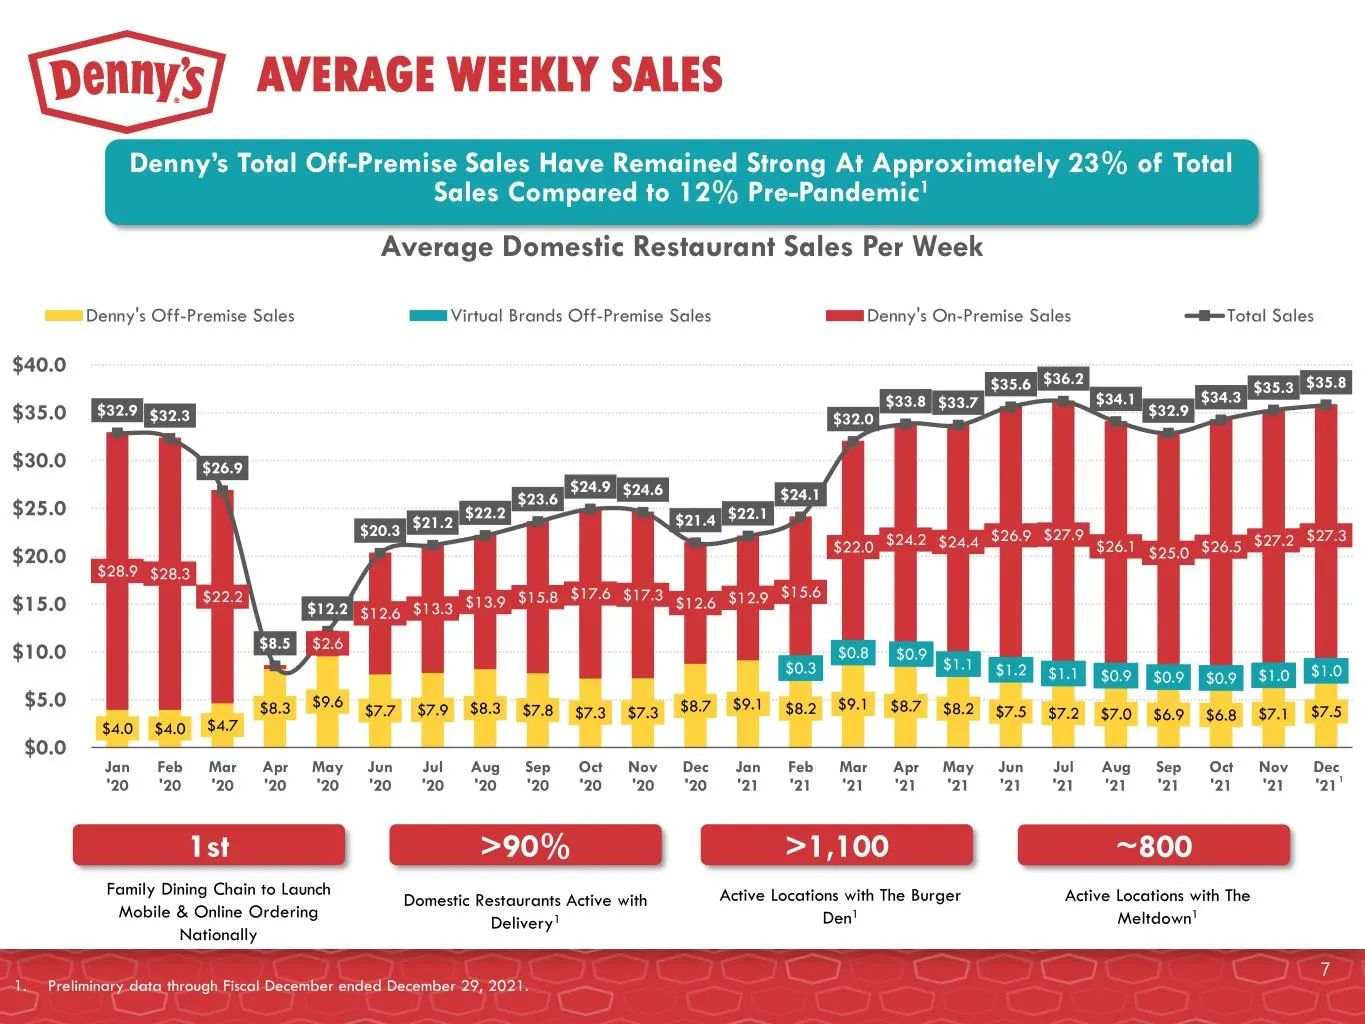
Denny’s Total Off-Premise Sales Have Remained Strong At Approximately 23% of Total Sales Compared to 12% Pre-Pandemic1 AVERAGE WEEKLY SALES $4.0 $4.0 $4.7 $8.3 $9.6 $7.7 $7.9 $8.3 $7.8 $7.3 $7.3 $8.7 $9.1 $8.2 $9.1 $8.7 $8.2 $7.5 $7.2 $7.0 $6.9 $6.8 $7.1 $7.5 $0.3 $0.8 $0.9 $1.1 $1.2 $1.1 $0.9 $0.9
Slide 8: Third Party Delivery Over 50% of Off-Premise Sales
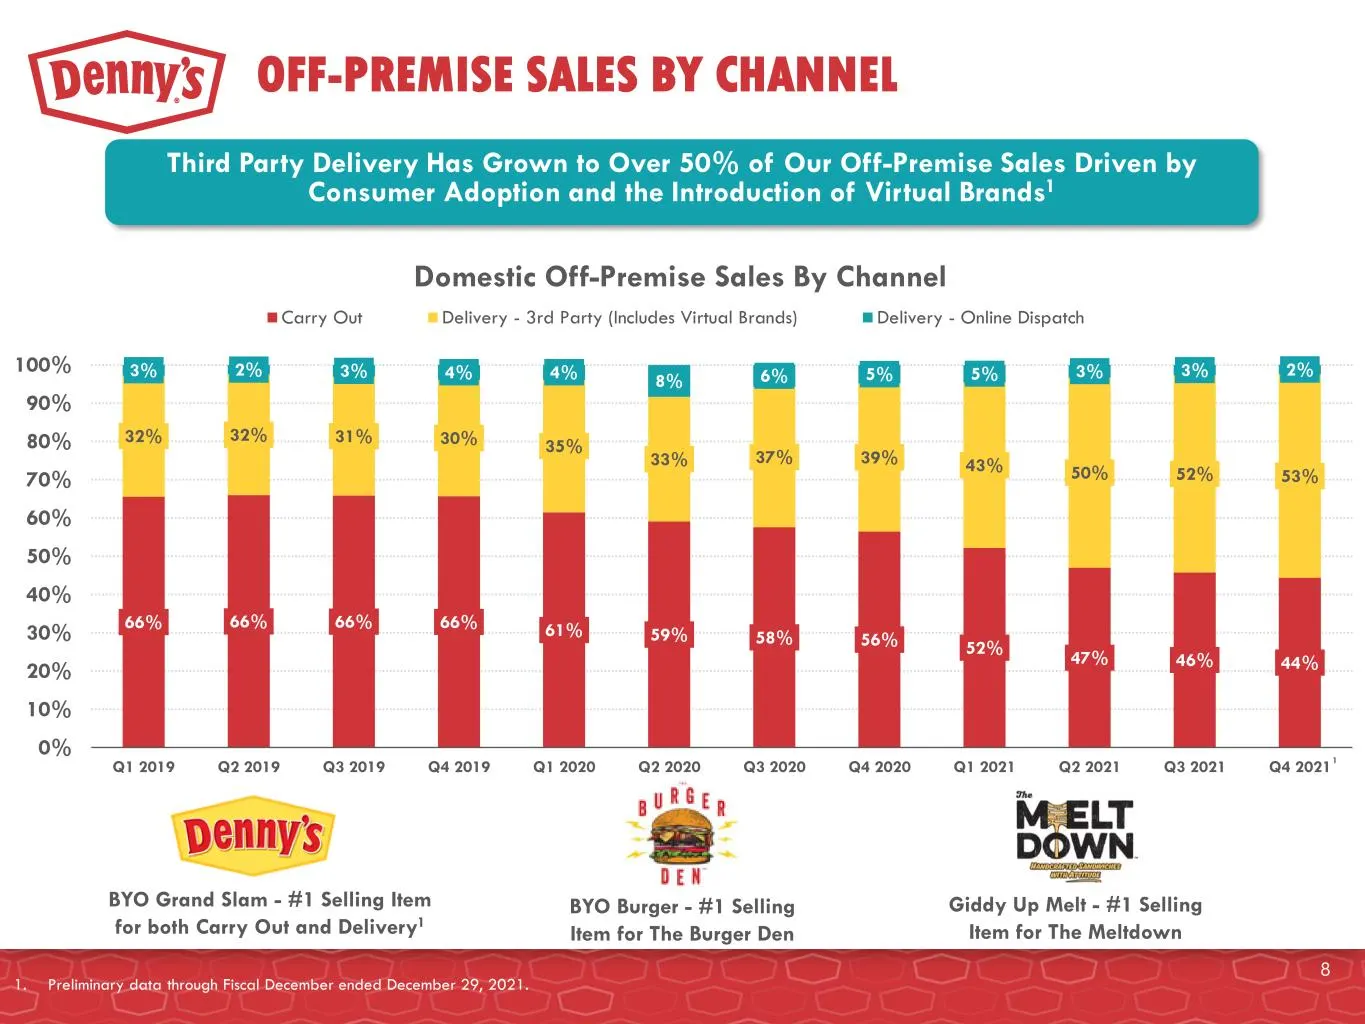
Third Party Delivery Has Grown to Over 50% of Our Off-Premise Sales Driven by Consumer Adoption and the Introduction of Virtual Brands1 OFF-PREMISE SALES BY CHANNEL 66% 66% 66% 66% 61% 59% 58% 56% 52% 47% 46% 44% 32% 32% 31% 30% 35% 33% 37% 39% 43% 50% 52% 53% 3% 2% 3% 4% 4% 8% 6% 5% 5% 3% 3% 2% 0%
Slide 9: Virtual Brands
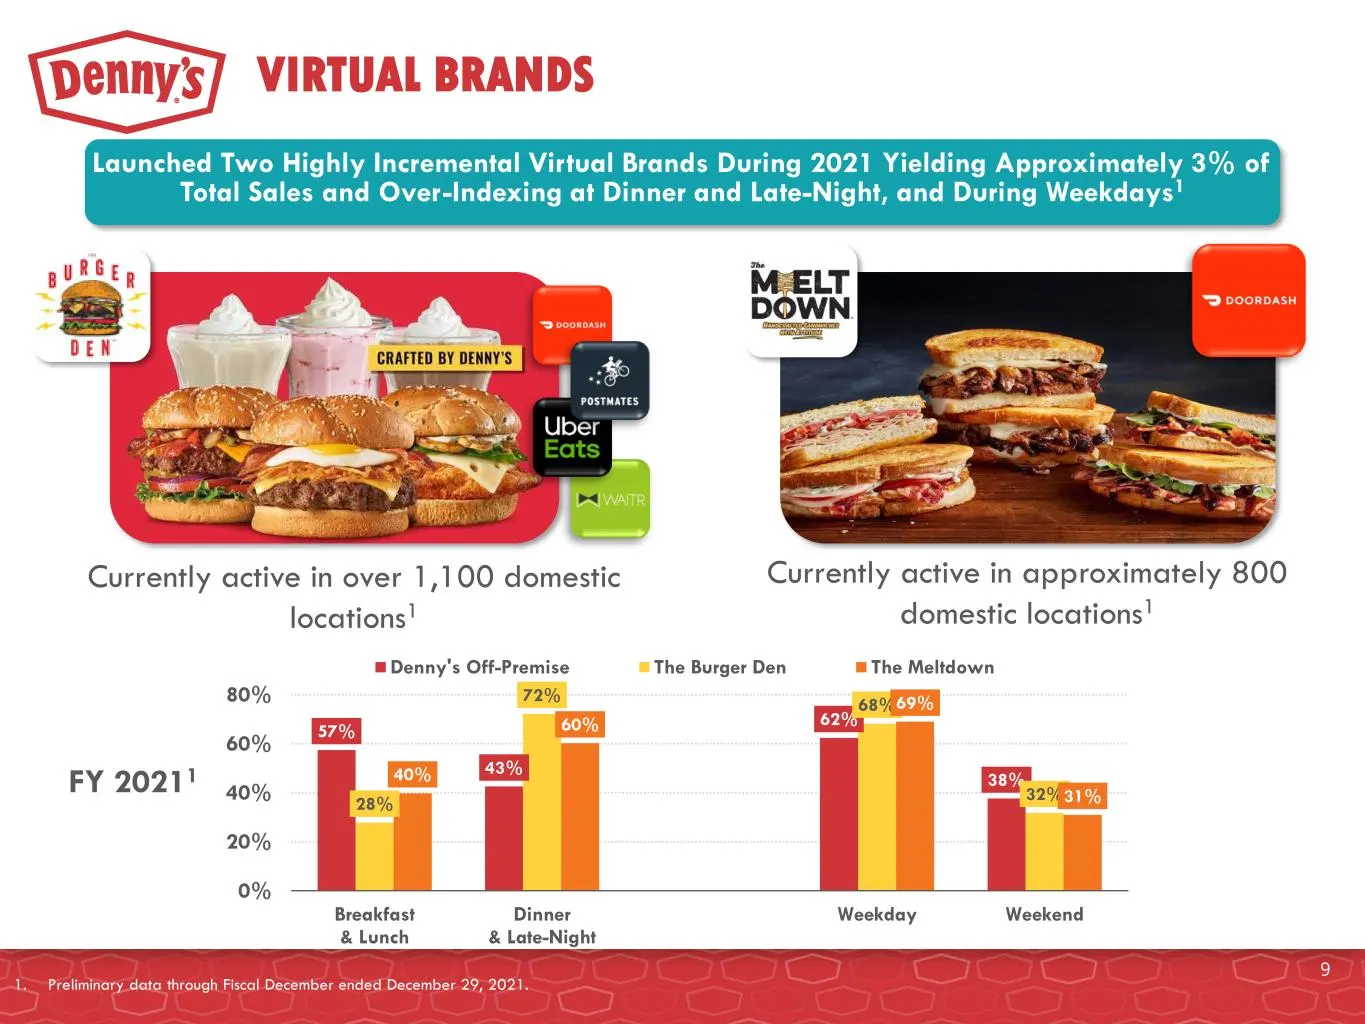
VIRTUAL BRANDS 9 Launched Two Highly Incremental Virtual Brands During 2021 Yielding Approximately 3% of Total Sales and Over-Indexing at Dinner and Late-Night, and During Weekdays1 Currently active in approximately 800 domestic locations1 Currently active in over 1,100 domestic locations1 57% 43% 6
Slide 10: Core Menu Approximately 25% Smaller
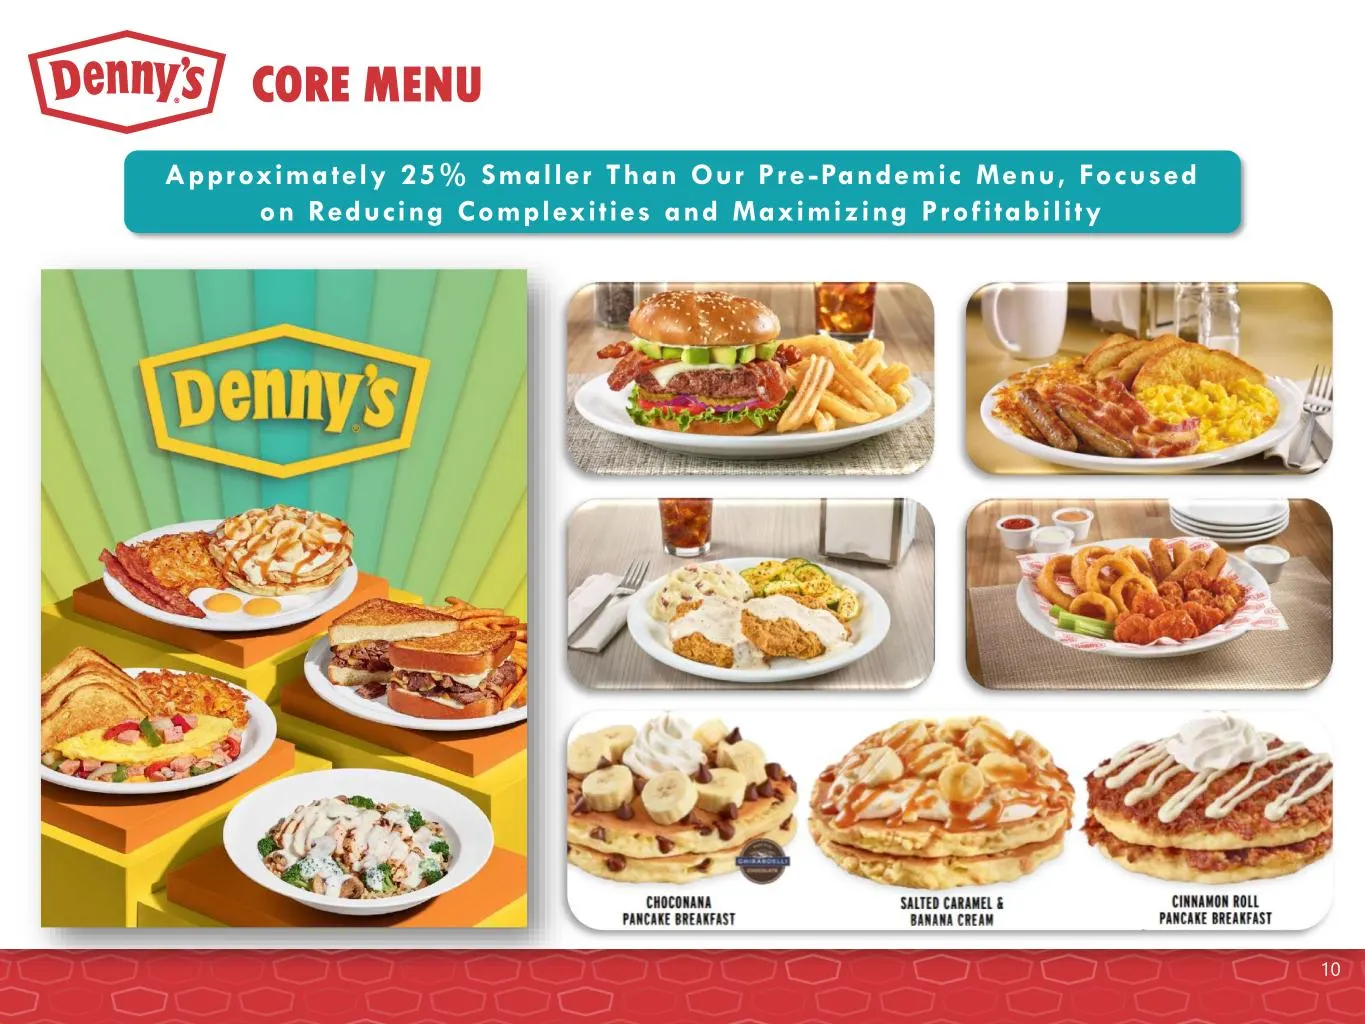
CORE MENU Approximately 25% Smaller Than Our Pre -Pandemic Menu, Focused on Reducing Complexit ies and Maximizing Profi tabil i ty 10
Slide 11: Denny's Domestic Footprint
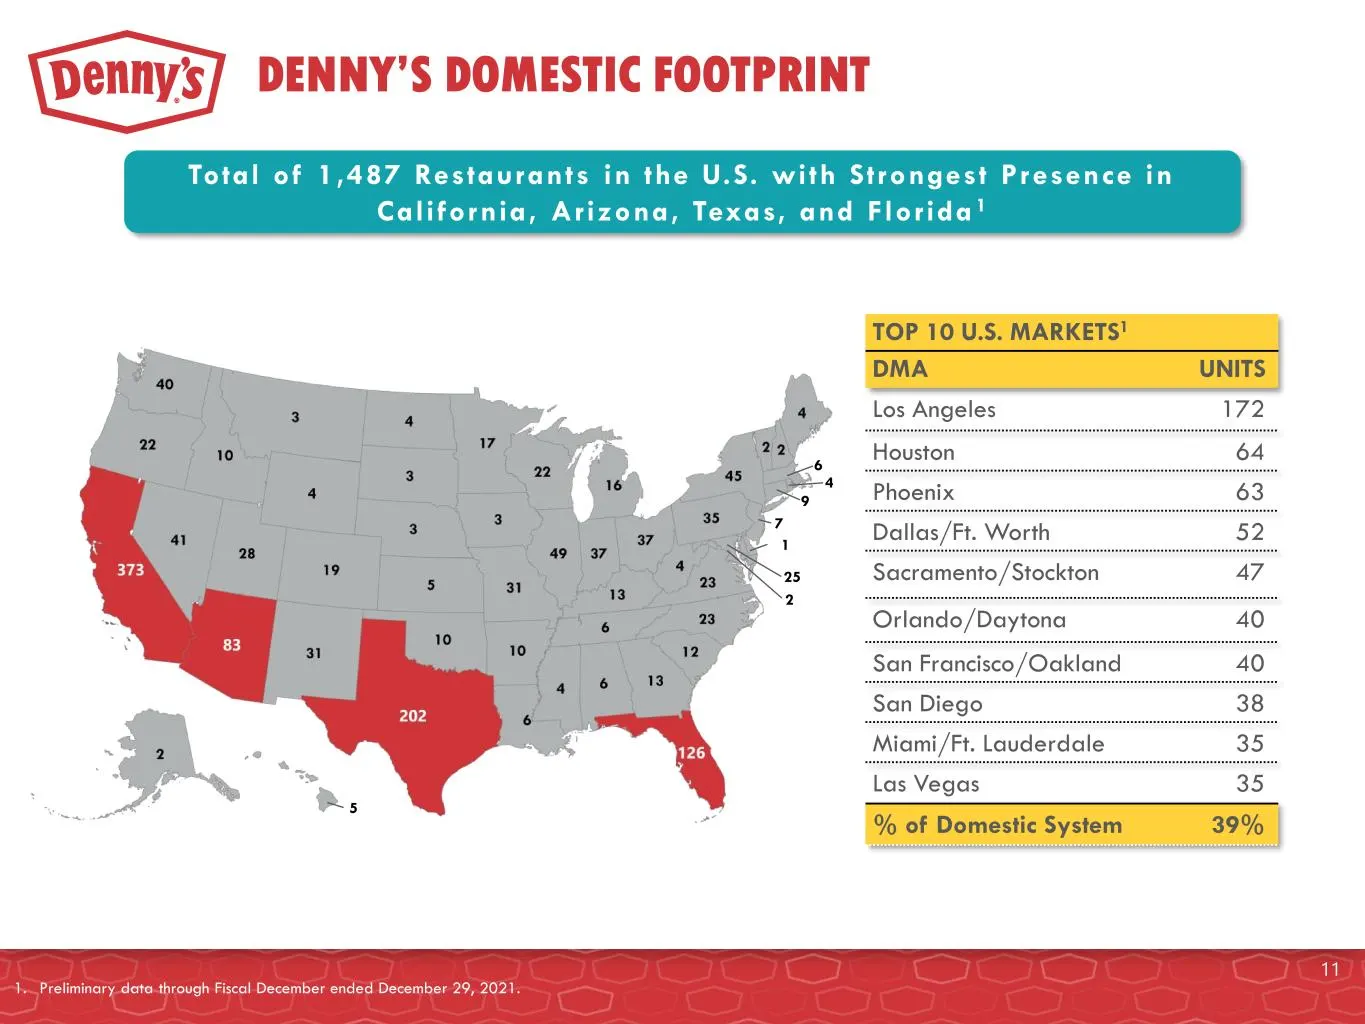
DENNY’S DOMESTIC FOOTPRINT Total of 1,487 Restaurants in the U.S. with Strongest Presence in California, Arizona, Texas, and Florida 1 TOP 10 U.S. MARKETS1 DMA UNITS Los Angeles 172 Houston 64 Phoenix 63 Dallas/Ft. Worth 52 Sacramento/Stockton 47 Orlando/Daytona 40 San Francisco/Oakland 40 San Diego
Slide 12: Denny's International Footprint
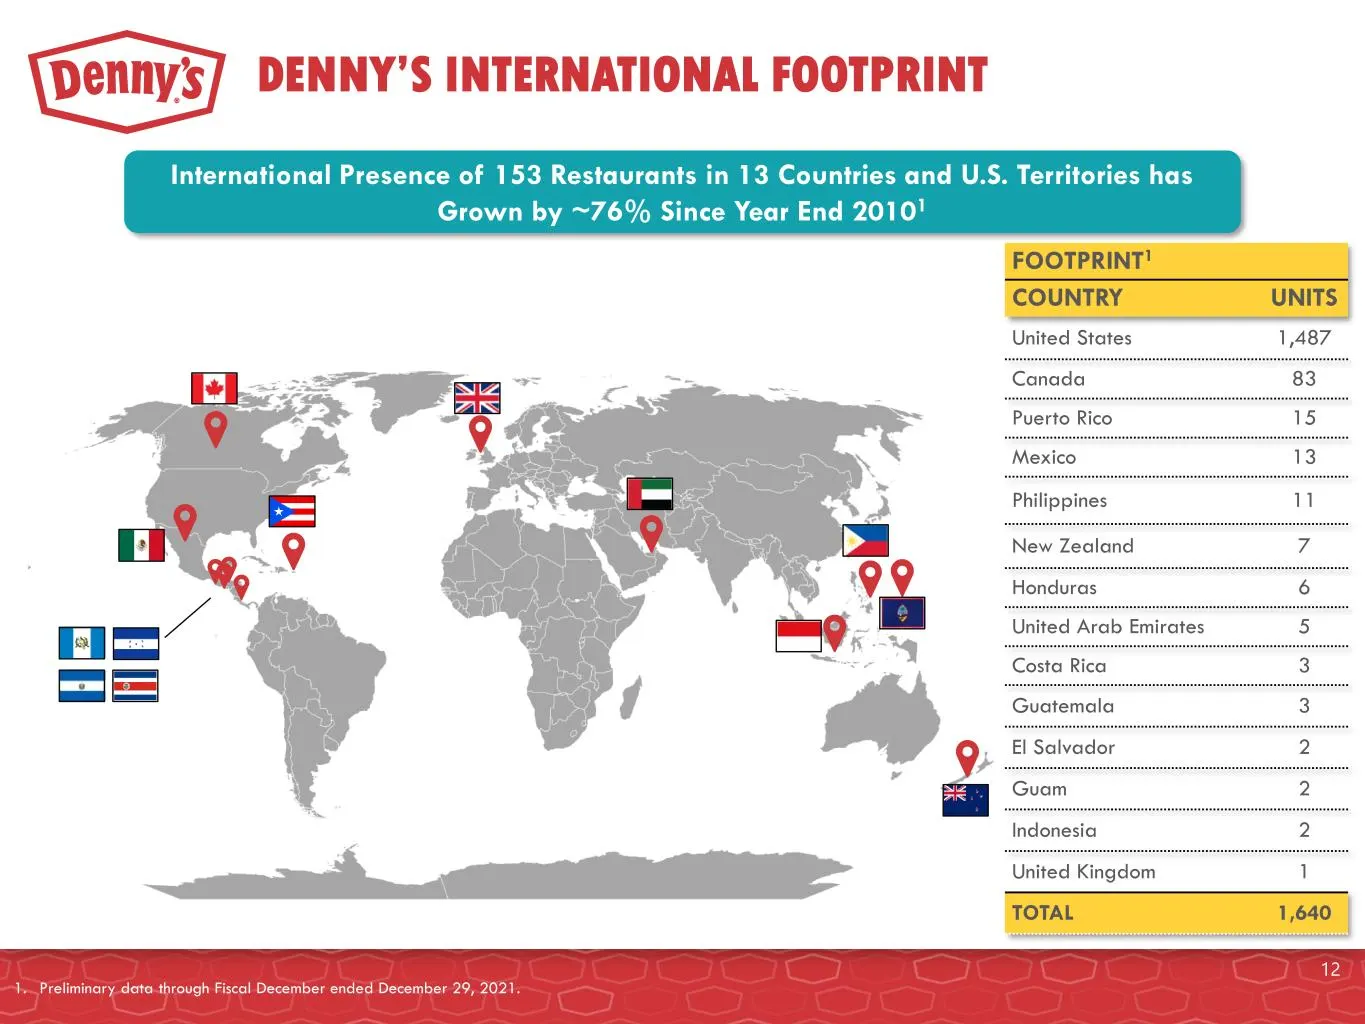
DENNY’S INTERNATIONAL FOOTPRINT 12 International Presence of 153 Restaurants in 13 Countries and U.S. Territories has Grown by ~76% Since Year End 20101 FOOTPRINT1 COUNTRY UNITS United States 1,487 Canada 83 Puerto Rico 15 Mexico 13 Philippines 11 New Zealand 7 Honduras 6 United Arab Emirates 5 Cost
Slide 13: Strong Partnership with Franchisees
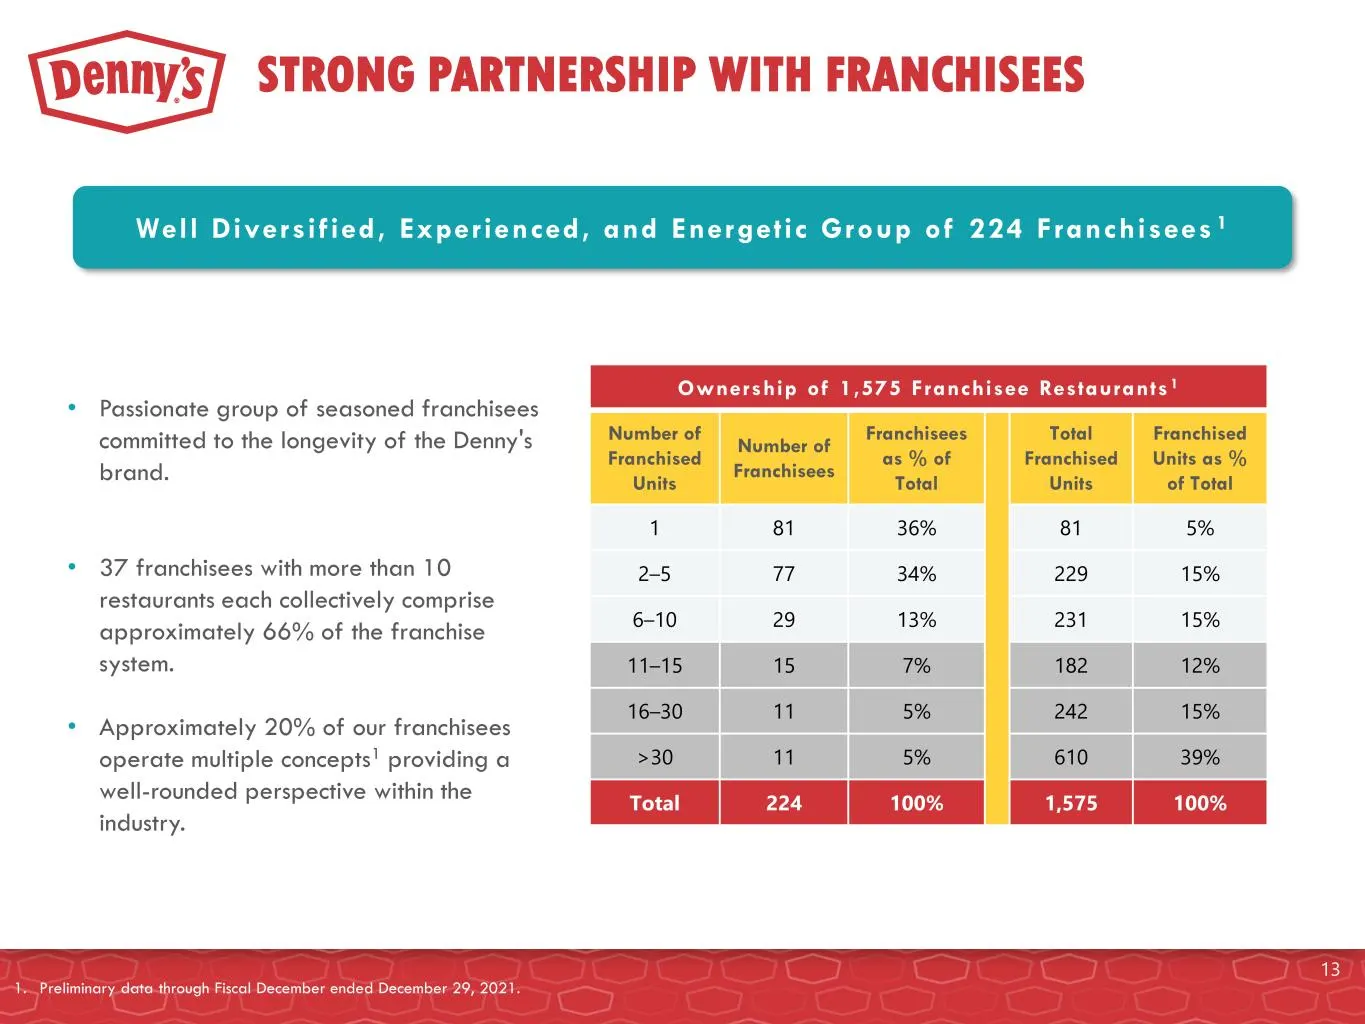
STRONG PARTNERSHIP WITH FRANCHISEES Well Diversif ied, Experienced, and Energetic Group of 224 Franchisees 1 Ownership of 1,575 Franchisee Restaurants 1 Number of Franchised Units Number of Franchisees Franchisees as % of Total Total Franchised Units Franchised Units as % of Total 1 81 36% 81 5% 2–5

Slide 14: A Durable and Agile Brand Focused on the Future
A DURABLE AND AGILE BRAND FOCUSED ON THE FUTURE 14
Slide 15: Brand Revitalization Strategies
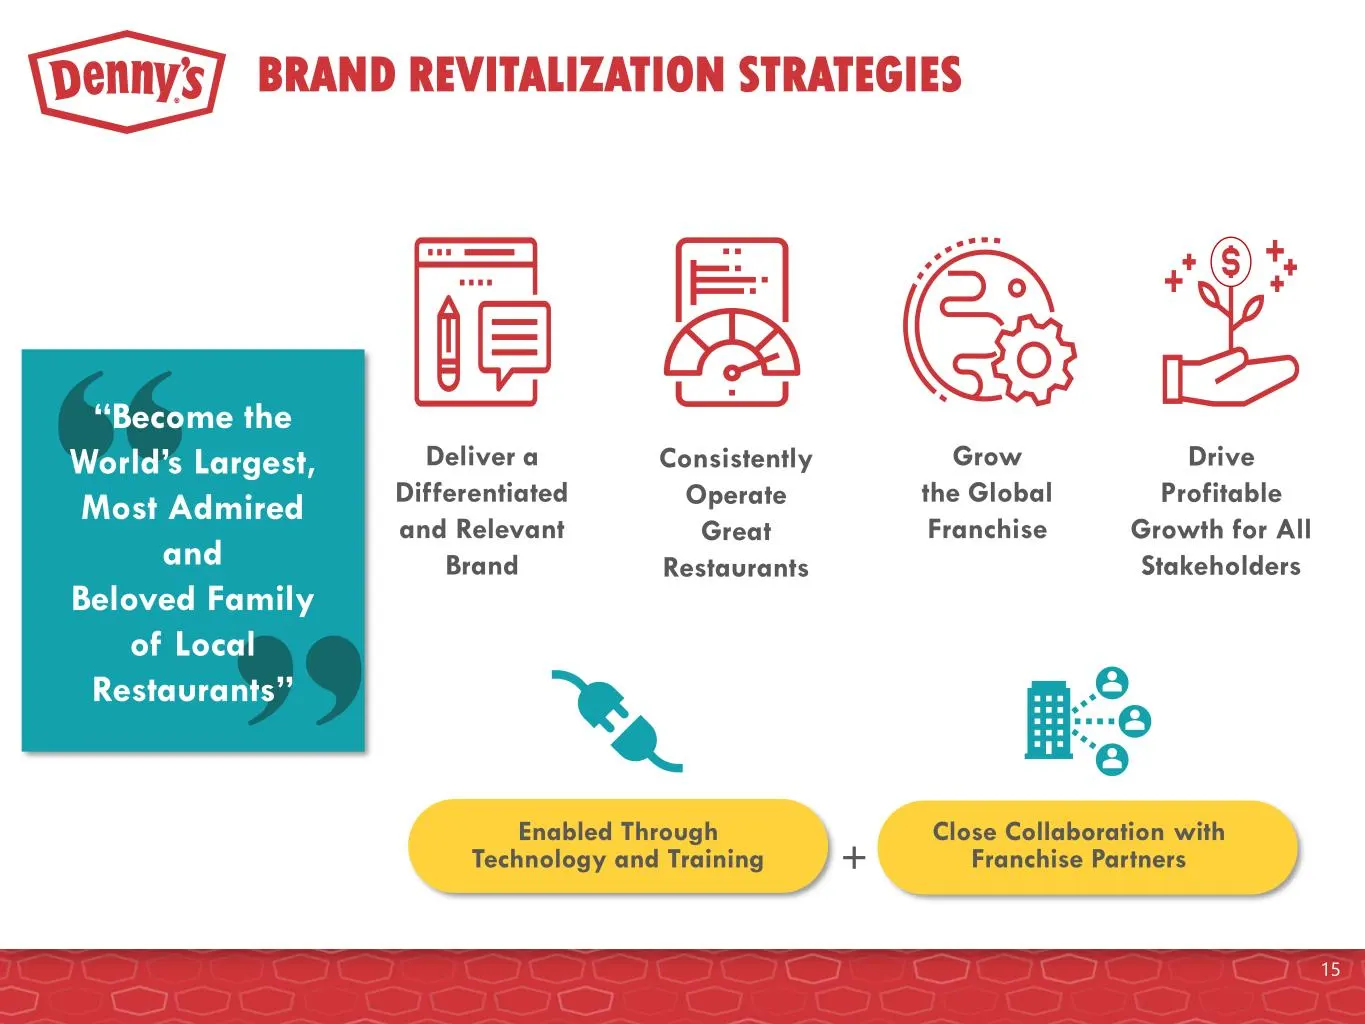
BRAND REVITALIZATION STRATEGIES Deliver a Differentiated and Relevant Brand Consistently Operate Great Restaurants Grow the Global Franchise Drive Profitable Growth for All Stakeholders Enabled Through Technology and Training Close Collaboration with Franchise Partners+ “Become the World’s Largest,
Slide 16: Deliver Differentiated Brand & Operate Great Restaurants
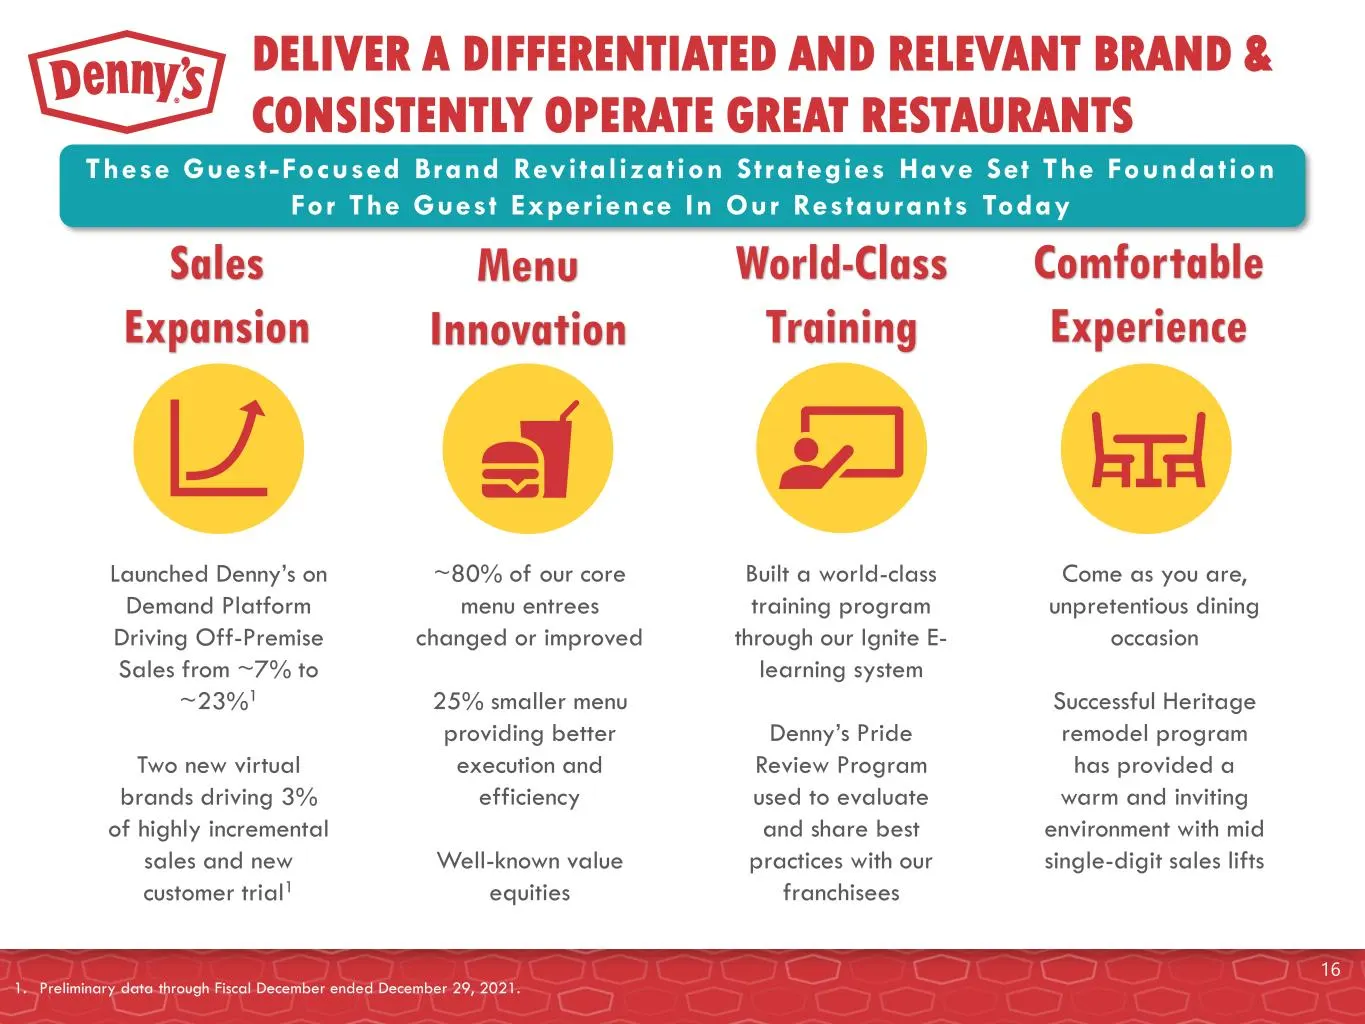
DELIVER A DIFFERENTIATED AND RELEVANT BRAND & CONSISTENTLY OPERATE GREAT RESTAURANTS These Guest-Focused Brand Revital iza tion Stra tegies Have Set The Foundation For The Guest Experience In Our Restaurants Today Sales Expansion Menu Innovation World-Class Training Comfortable Experience Launched D
Slide 17: Grow the Global Franchise
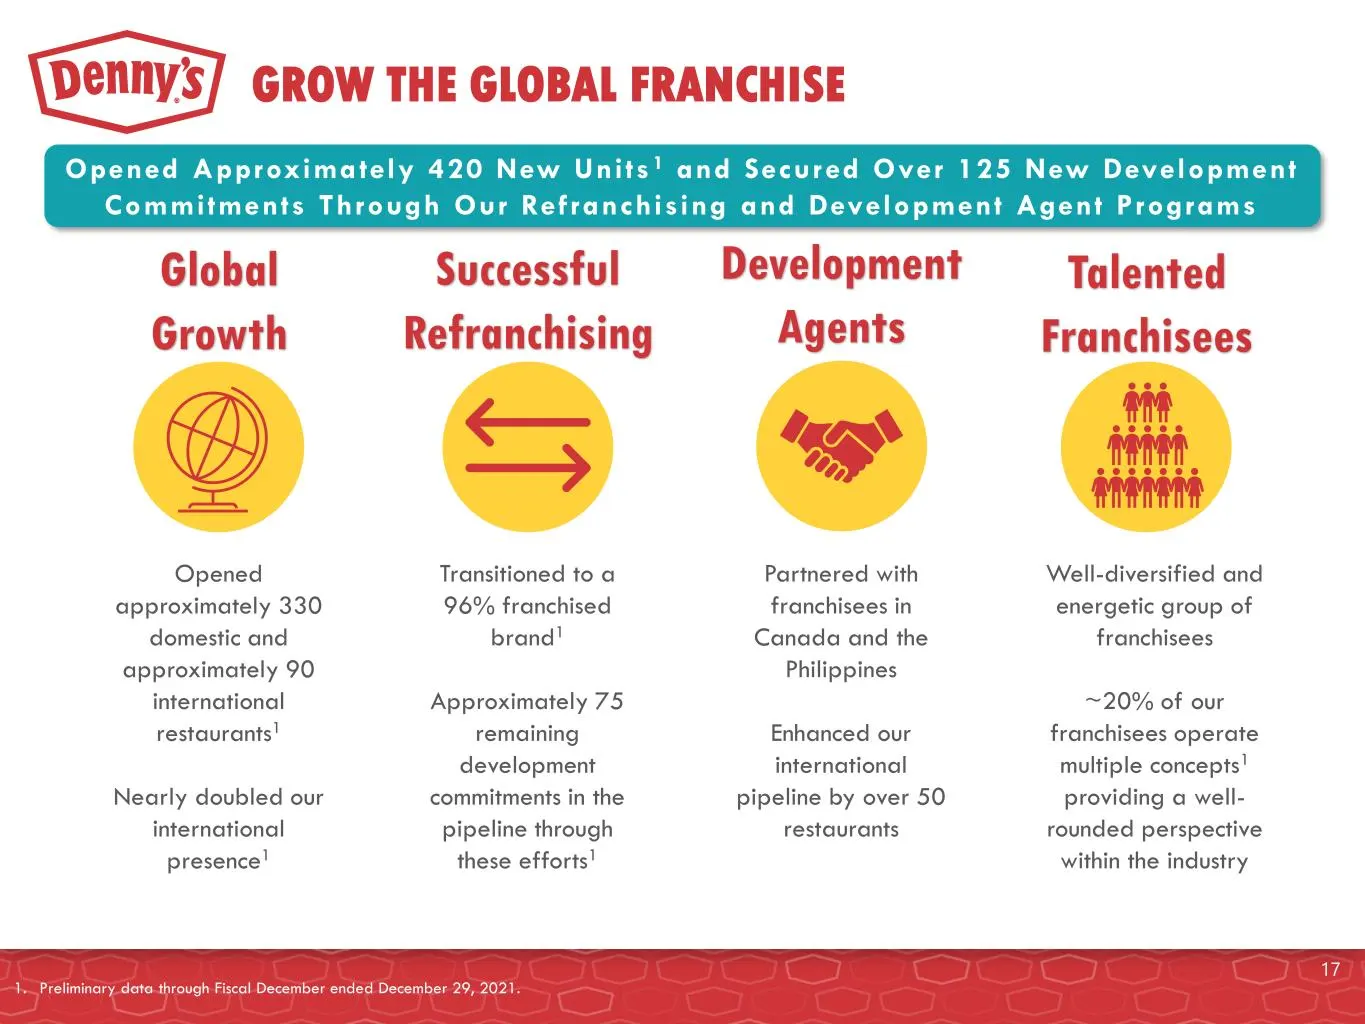
GROW THE GLOBAL FRANCHISE Opened Approximately 420 New Units 1 and Secured Over 125 New Development Commitments Through Our Refranchising and Development Agent Programs Global Growth Successful Refranchising Development Agents Talented Franchisees Opened approximately 330 domestic and approximately
Slide 18: Drive Profitable Growth for All Stakeholders
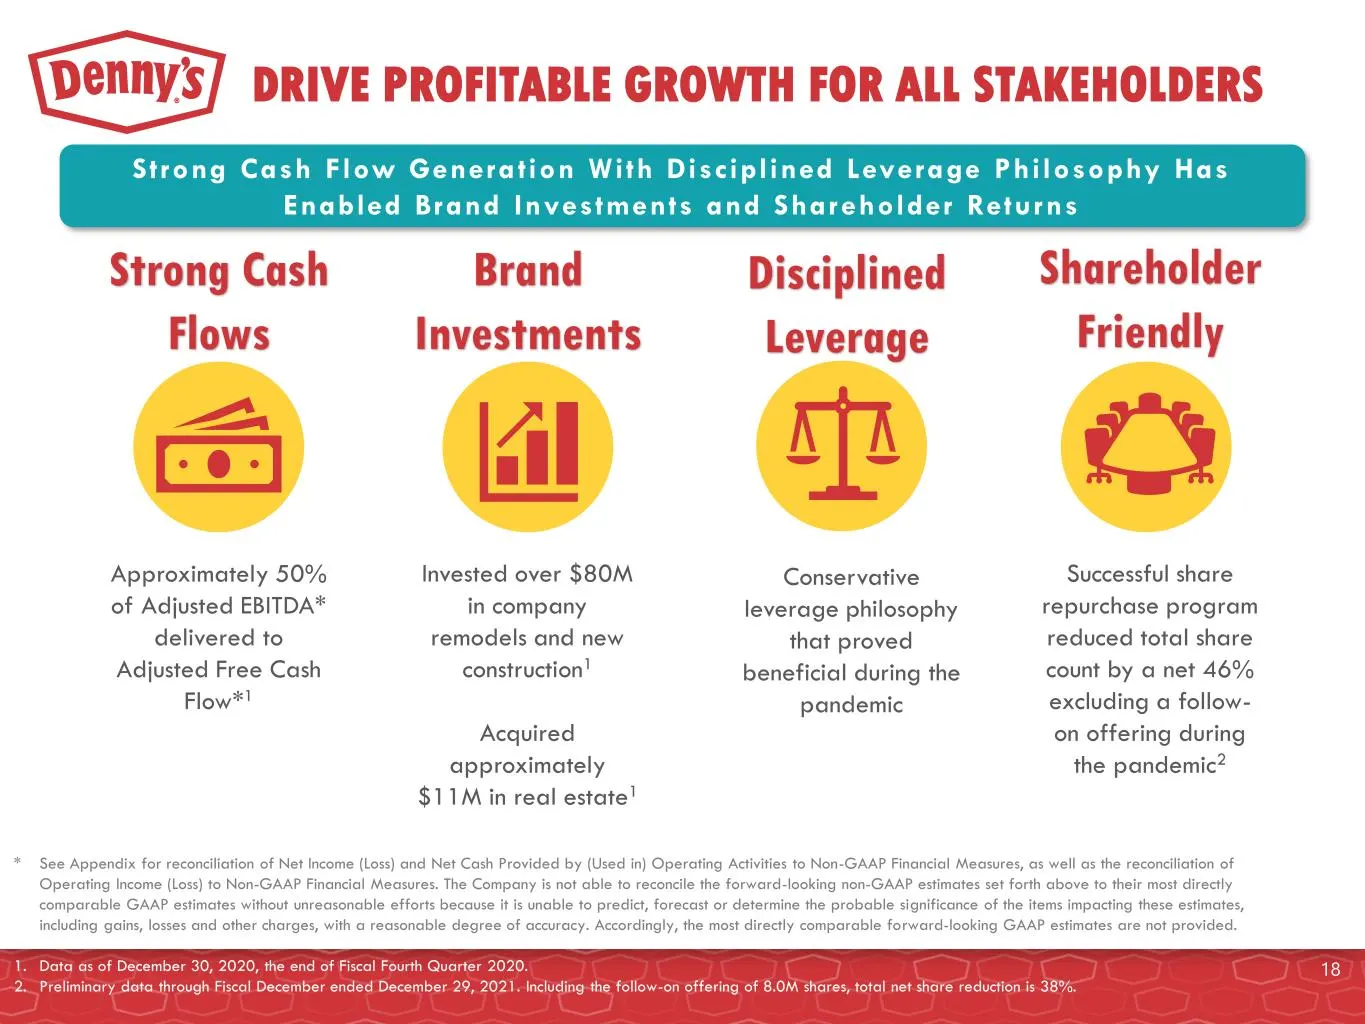
DRIVE PROFITABLE GROWTH FOR ALL STAKEHOLDERS Strong Cash Flow Genera tion With Discipl ined Leverage Philosophy Has Enabled Brand Investments and Shareholder Returns Strong Cash Flows Brand Investments Shareholder Friendly Disciplined Leverage Approximately 50% of Adjusted EBITDA* delivered to Adjus
Slide 19: Transformative Brand Investments on the Horizon
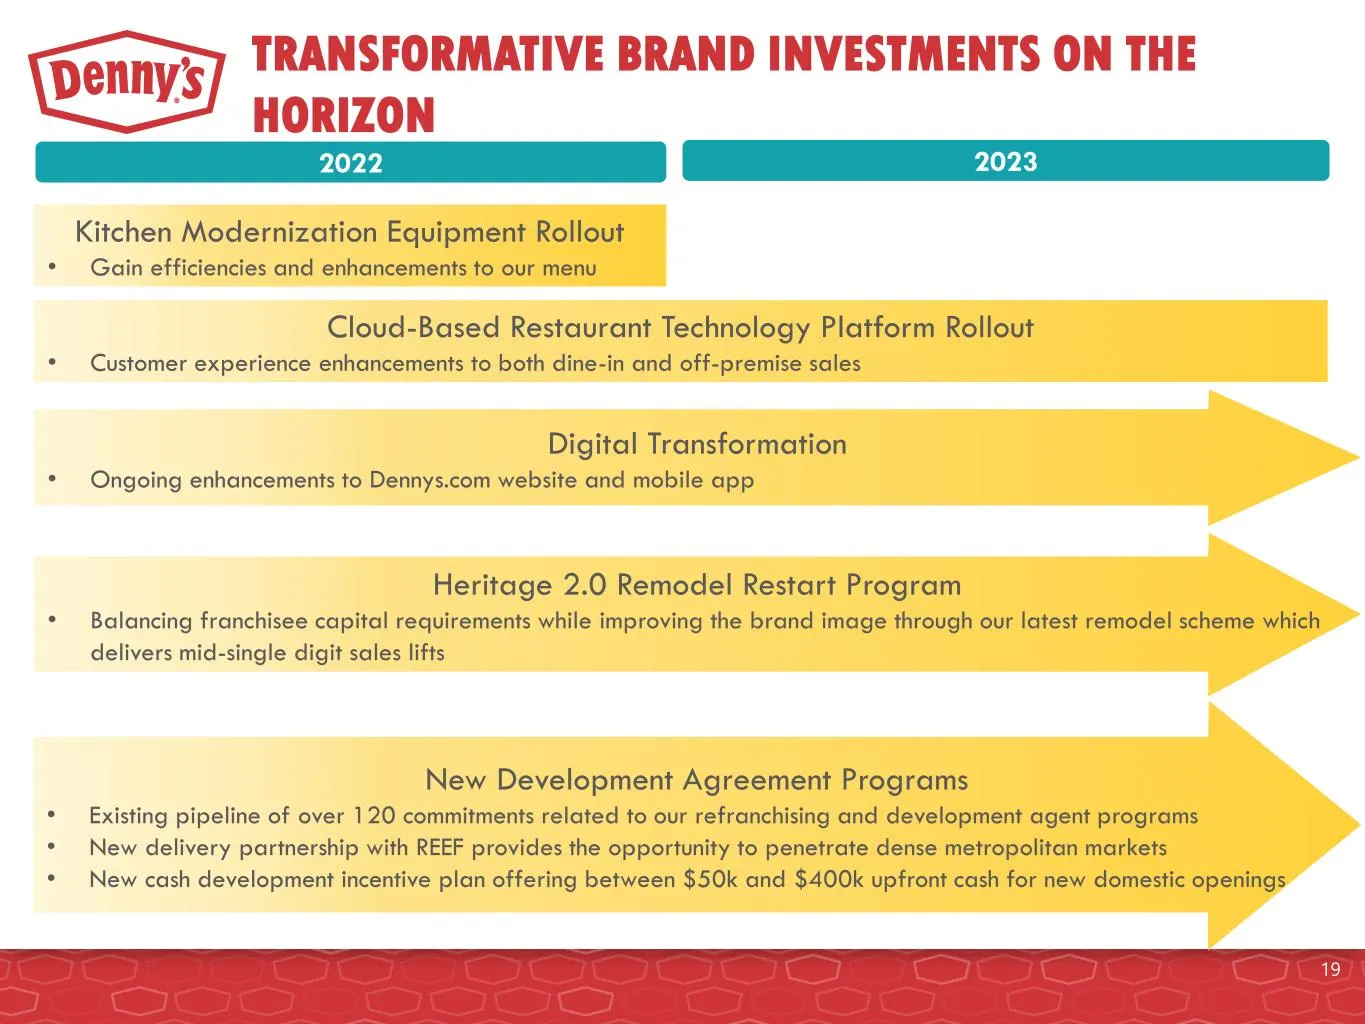
TRANSFORMATIVE BRAND INVESTMENTS ON THE HORIZON Cloud-Based Restaurant Technology Platform Rollout • Customer experience enhancements to both dine-in and off-premise sales Kitchen Modernization Equipment Rollout • Gain efficiencies and enhancements to our menu Heritage 2.0 Remodel Restart Program •
Slide 20: Kitchen Modernization & Technology Transformation Rollouts
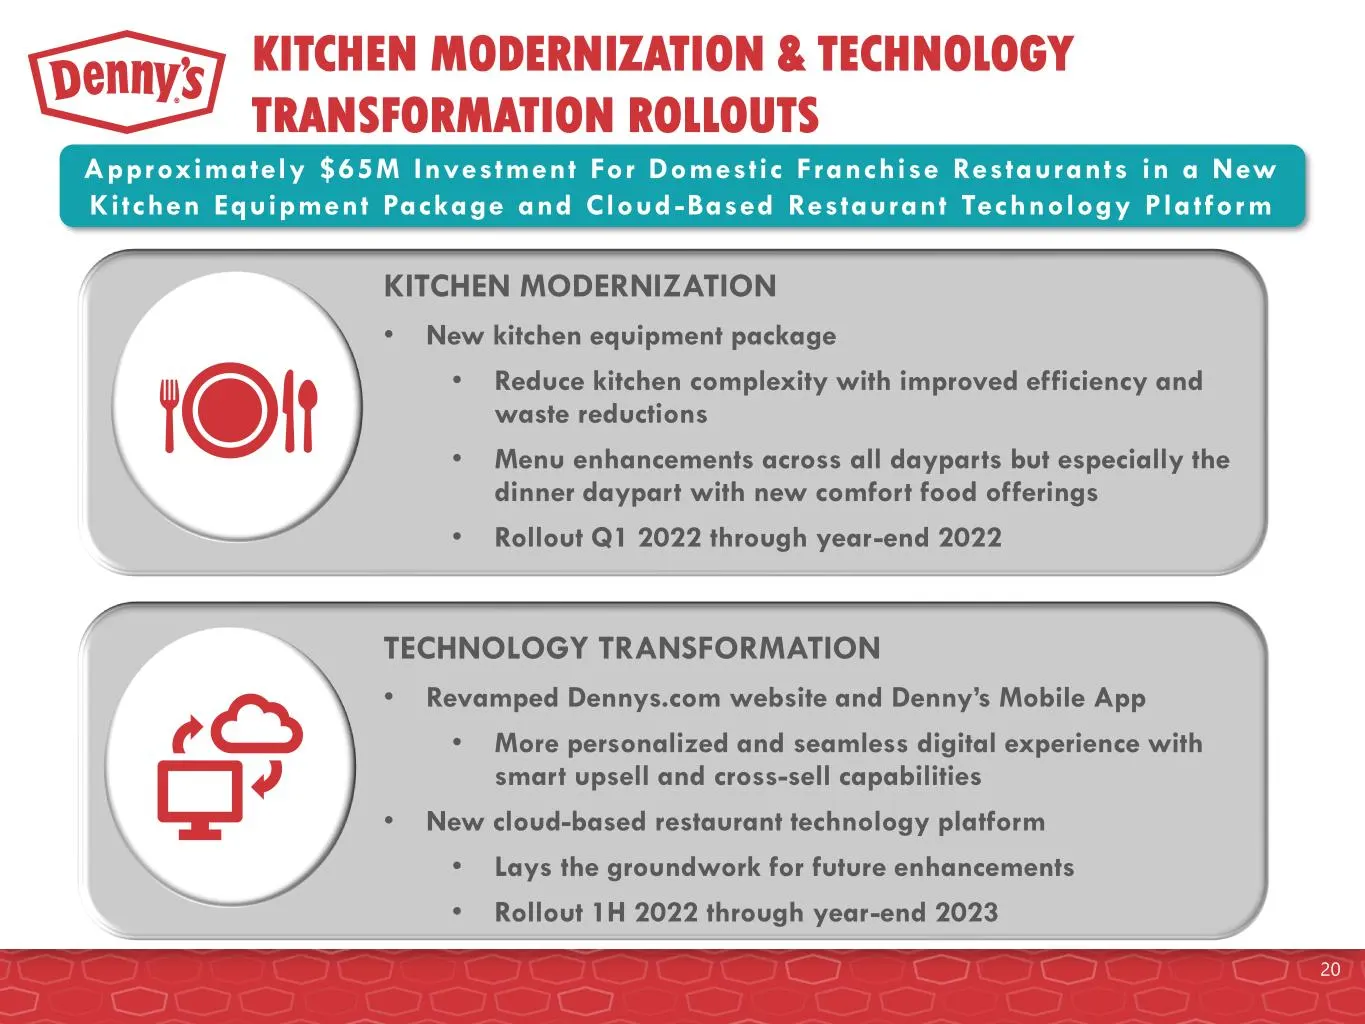
KITCHEN MODERNIZATION & TECHNOLOGY TRANSFORMATION ROLLOUTS Approximately $65M Investment For Domestic Franchise Restaurants in a New Kitchen Equipment Package and Cloud -Based Restaurant Technology Pla tform KITCHEN MODERNIZATION • New kitchen equipment package • Reduce kitchen complexity with impro
Slide 21: Heritage 2.0 Remodel Restart Program
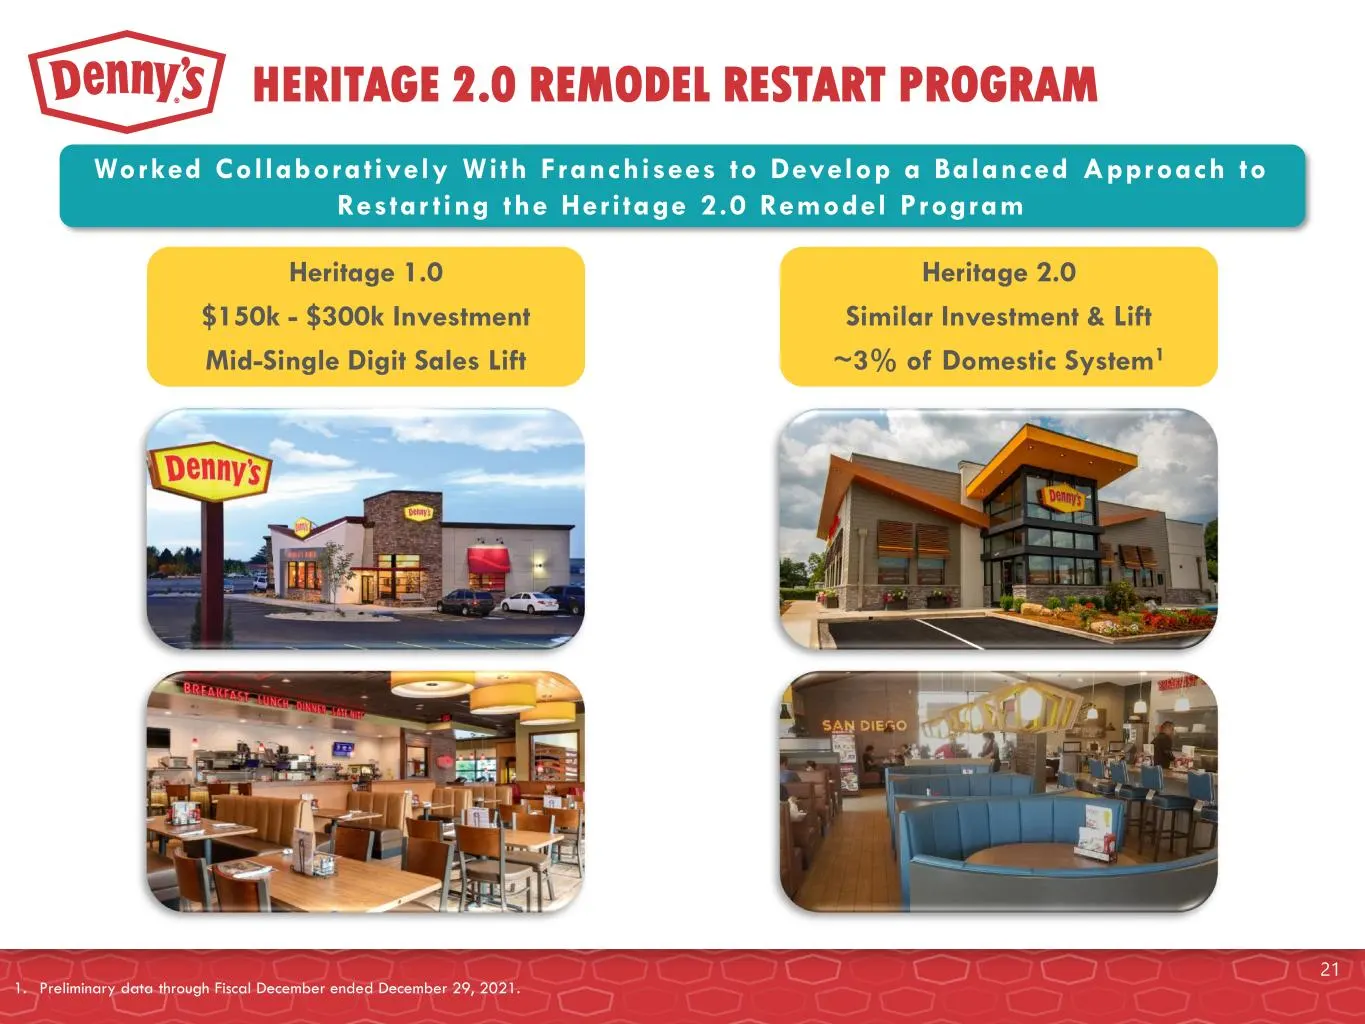
HERITAGE 2.0 REMODEL RESTART PROGRAM Worked Collabora tively With Franchisees to Develop a Balanced Approach to Restar t ing the Heri tage 2.0 Remodel Program Heritage 1.0 $150k - $300k Investment Mid-Single Digit Sales Lift Heritage 2.0 Similar Investment & Lift ~3% of Domestic System1 21 1. Prelim
Slide 22: New Development Agreement Programs
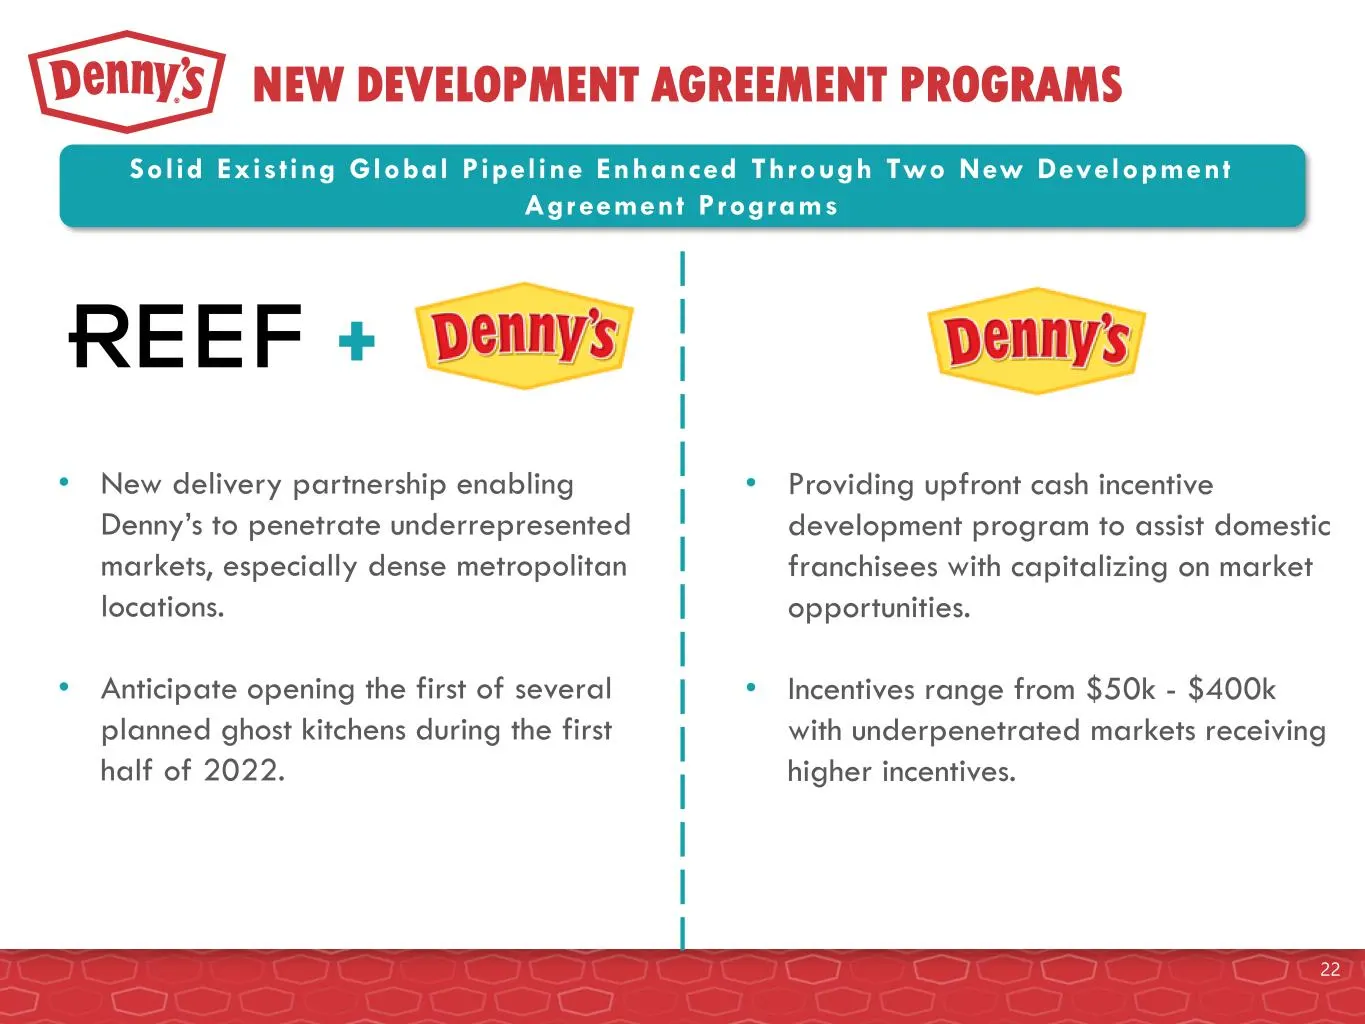
NEW DEVELOPMENT AGREEMENT PROGRAMS Solid Exist ing Global Pipeline Enhanced Through Two New Development Agreement Programs 22 • New delivery partnership enabling Denny’s to penetrate underrepresented markets, especially dense metropolitan locations. • Anticipate opening the first of several planned
Slide 23: Unlocking Capital to Fund Brand Investments
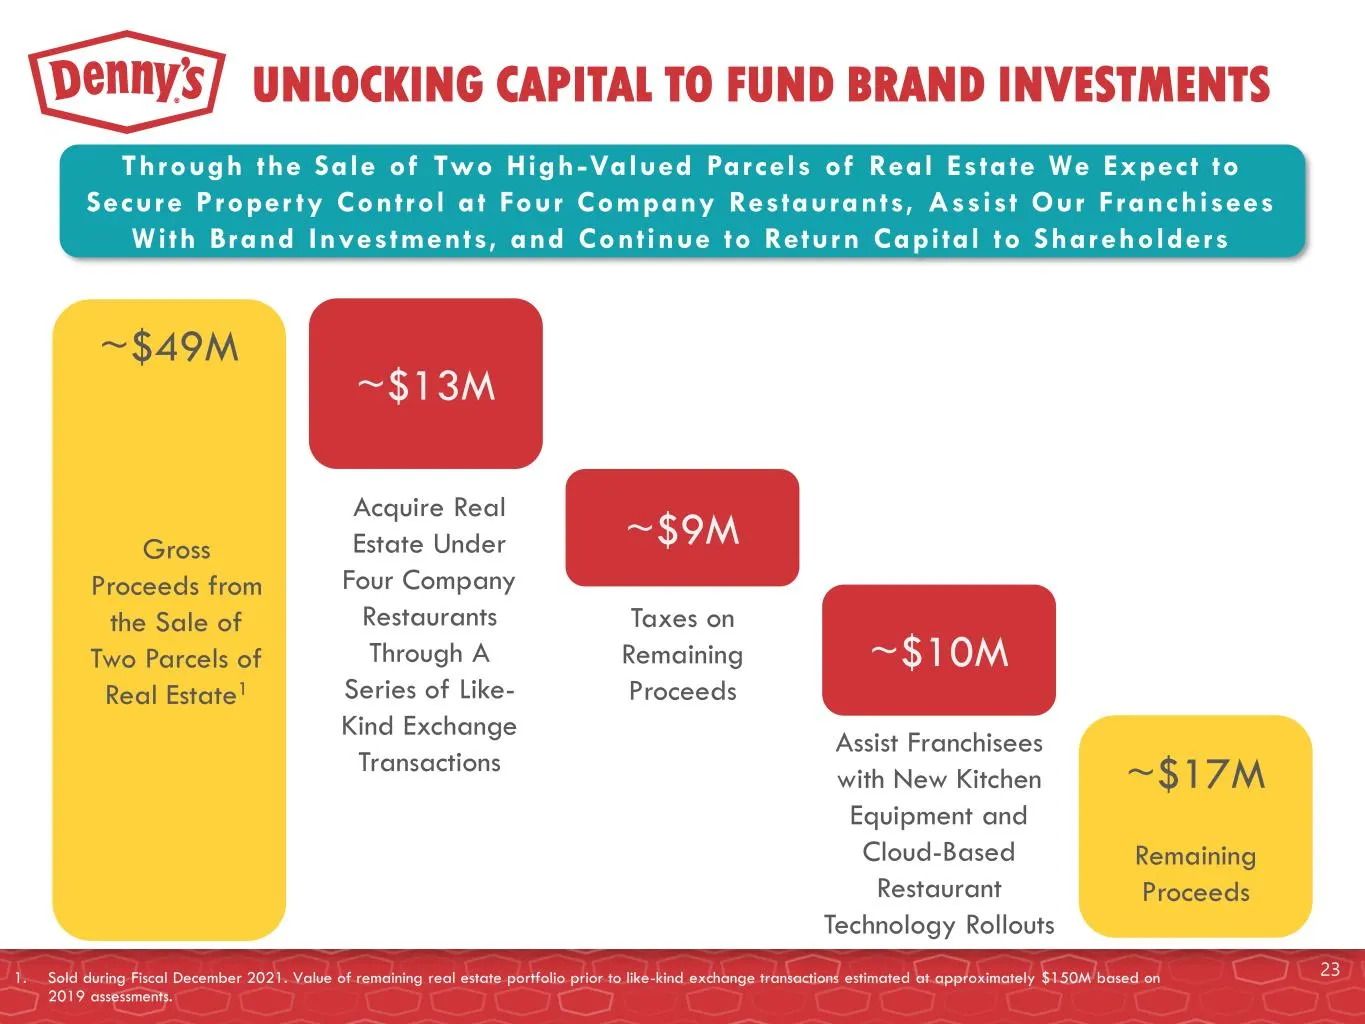
UNLOCKING CAPITAL TO FUND BRAND INVESTMENTS ~$49M Through the Sale of Two High -Valued Parcels of Real Esta te We Expect to Secure Proper ty Control a t Four Company Restaurants, Assist Our Franchisees With Brand Investments, and Continue to Return Capital to Shareholders Gross Proceeds from the Sal
Slide 24: Strong Collaboration with Franchisees
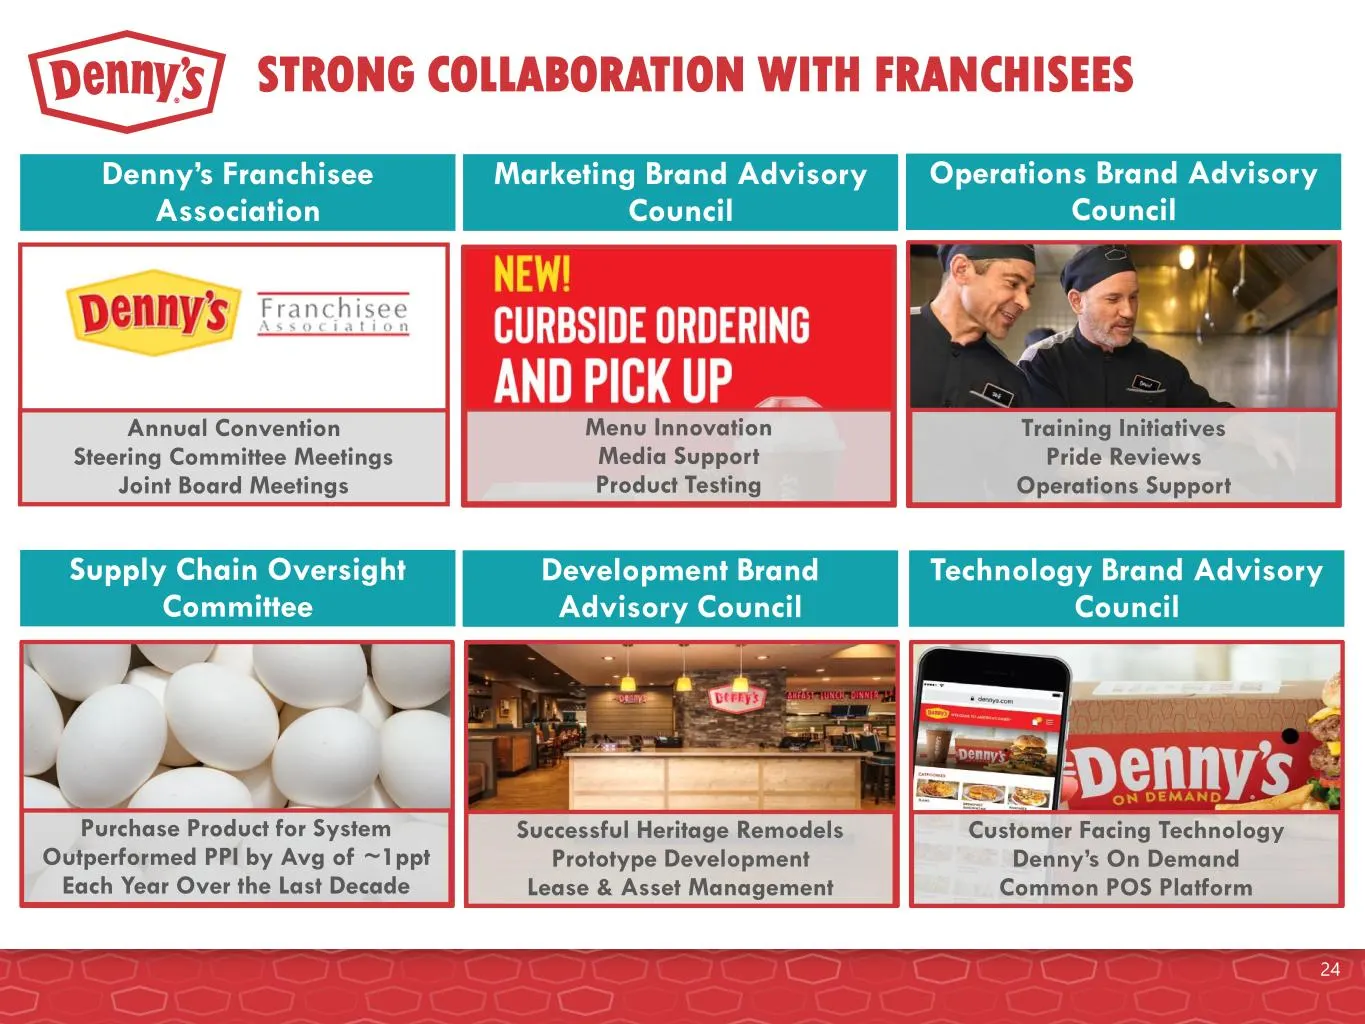
STRONG COLLABORATION WITH FRANCHISEES Marketing Brand Advisory Council Operations Brand Advisory Council Supply Chain Oversight Committee Development Brand Advisory Council Denny’s Franchisee Association Technology Brand Advisory Council Training Initiatives Pride Reviews Operations Support Purchase

Slide 25: Historical Performance
HISTORICAL PERFORMANCE 25
Slide 26: Total System Sales and Adjusted EBITDA
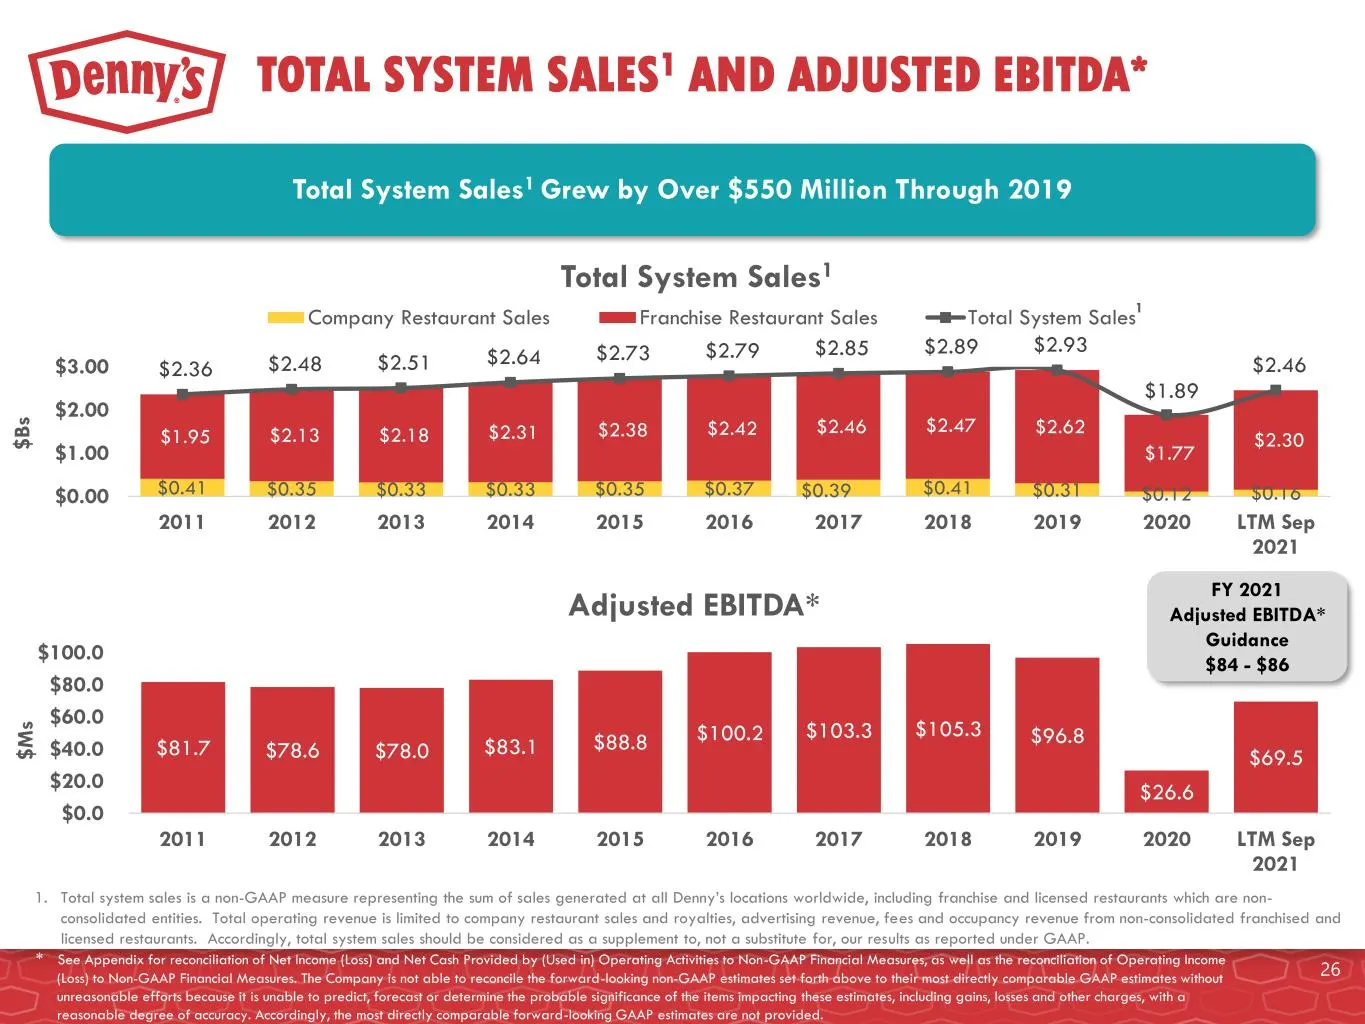
TOTAL SYSTEM SALES1 AND ADJUSTED EBITDA* 1. Total system sales is a non-GAAP measure representing the sum of sales generated at all Denny’s locations worldwide, including franchise and licensed restaurants which are non- consolidated entities. Total operating revenue is limited to company restaurant
Slide 27: Franchised and Company Restaurant Sales
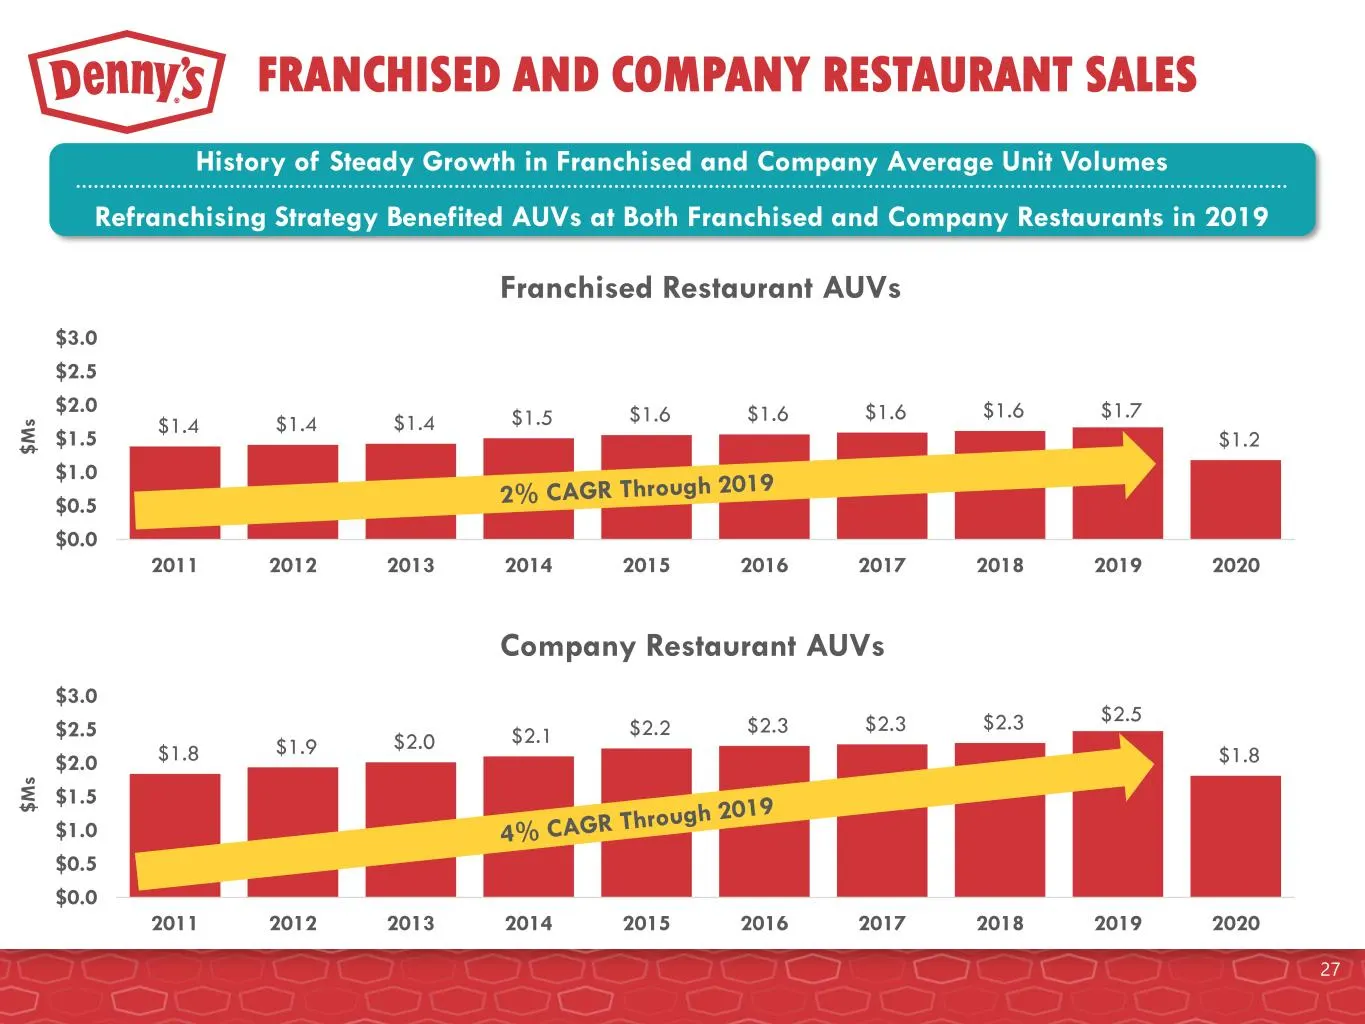
$1.8 $1.9 $2.0 $2.1 $2.2 $2.3 $2.3 $2.3 $2.5 $1.8 $0.0 $0.5 $1.0 $1.5 $2.0 $2.5 $3.0 2011 2012 2013 2014 2015 2016 2017 2018 2019 2020 Company Restaurant AUVs FRANCHISED AND COMPANY RESTAURANT SALES History of Steady Growth in Franchised and Company Average Unit Volumes Refranchising Strategy Benefi
Slide 28: Franchise and Company Margins
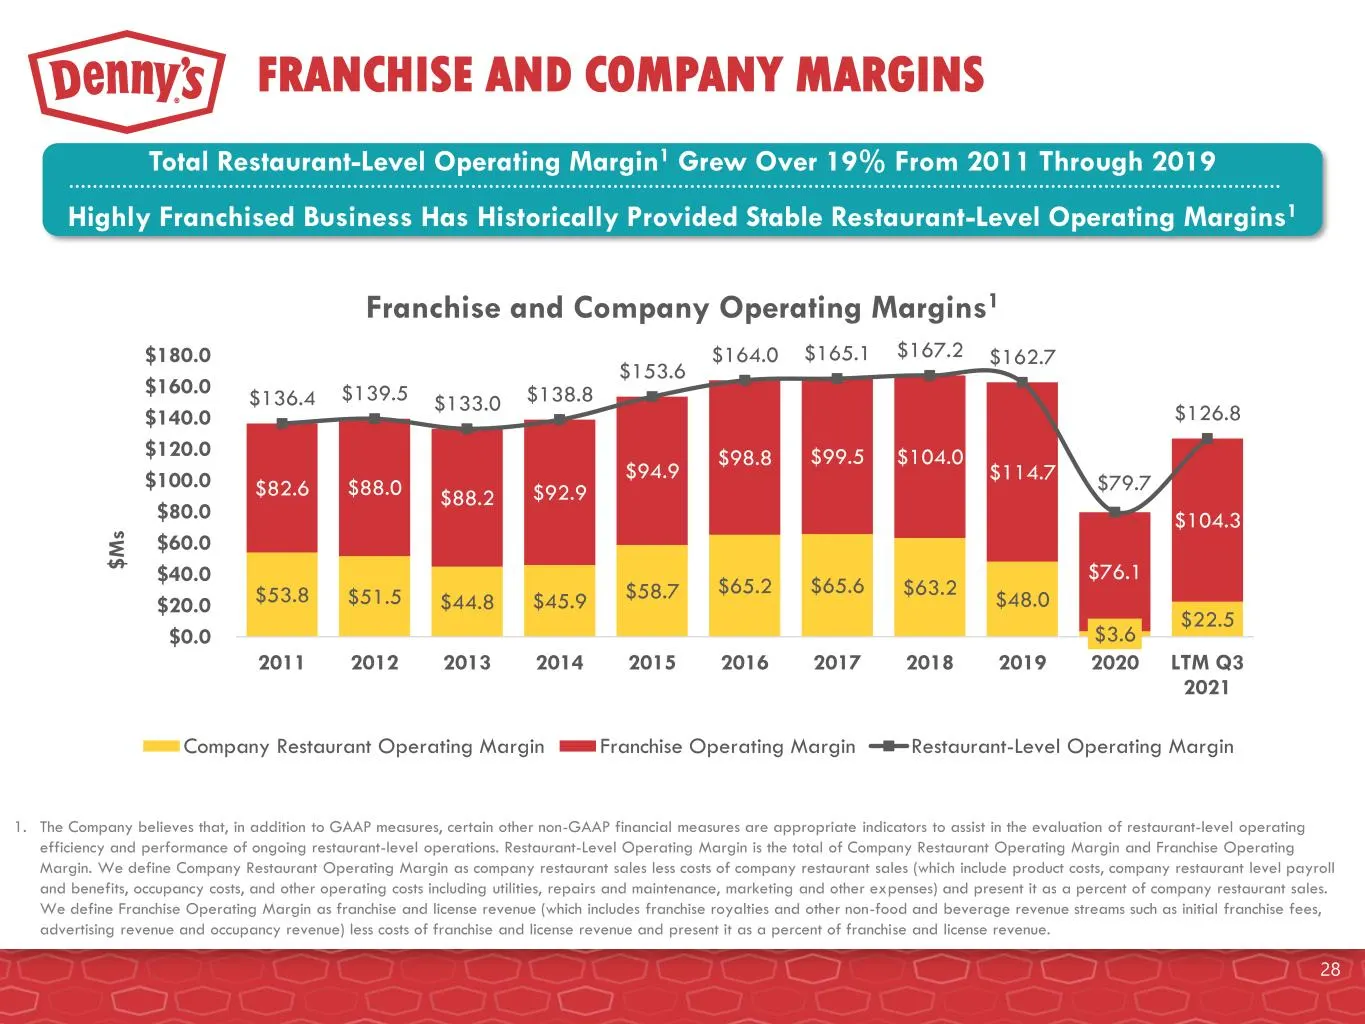
FRANCHISE AND COMPANY MARGINS $53.8 $51.5 $44.8 $45.9 $58.7 $65.2 $65.6 $63.2 $48.0 $3.6 $22.5 $82.6 $88.0 $88.2 $92.9 $94.9 $98.8 $99.5 $104.0 $114.7 $76.1 $104.3 $136.4 $139.5 $133.0 $138.8 $153.6 $164.0 $165.1 $167.2 $162.7 $79.7 $126.8 $0.0 $20.0 $40.0 $60.0 $80.0 $100.0 $120.0 $140.0 $160.0 $18
Slide 29: General and Administrative Expenses
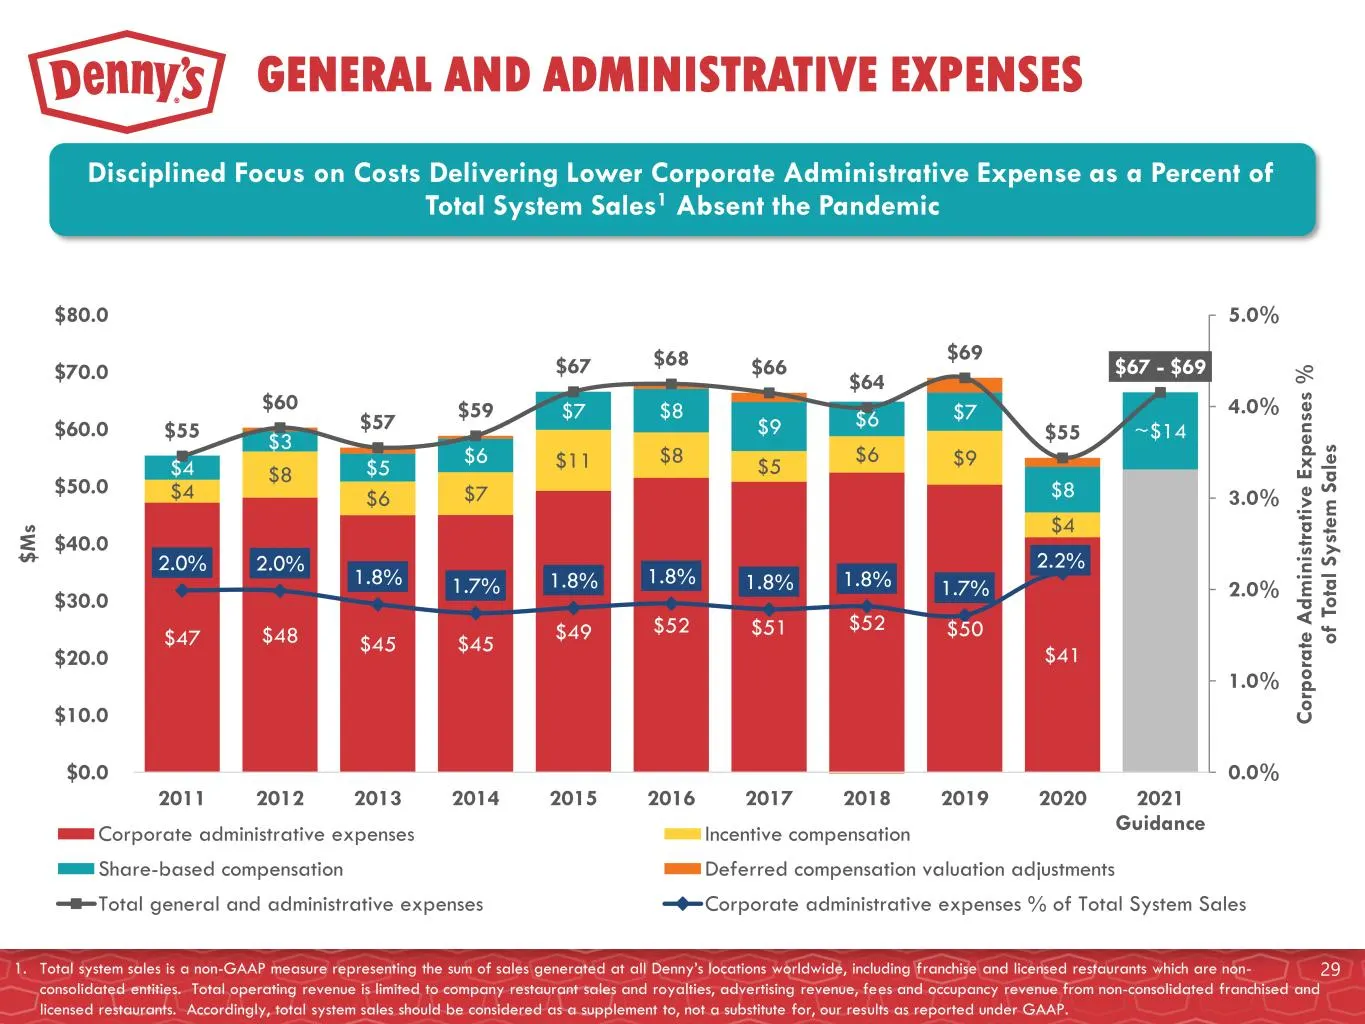
$47 $48 $45 $45 $49 $52 $51 $52 $50 $41 $4 $8 $6 $7 $11 $8 $5 $6 $9 $4 $4 $3 $5 $6 $7 $8 $9 $6 $7 $8 ~$14$55 $60 $57 $59 $67 $68 $66 $64 $69 $55 $67 - $69 2.0% 2.0% 1.8% 1.7% 1.8% 1.8% 1.8% 1.8% 1.7% 2.2% 0.0% 1.0% 2.0% 3.0% 4.0% 5.0% $0.0 $10.0 $20.0 $30.0 $40.0 $50.0 $60.0 $70.0 $80.0 2011 2012 20
Slide 30: Domestic System-Wide Same-Store Sales
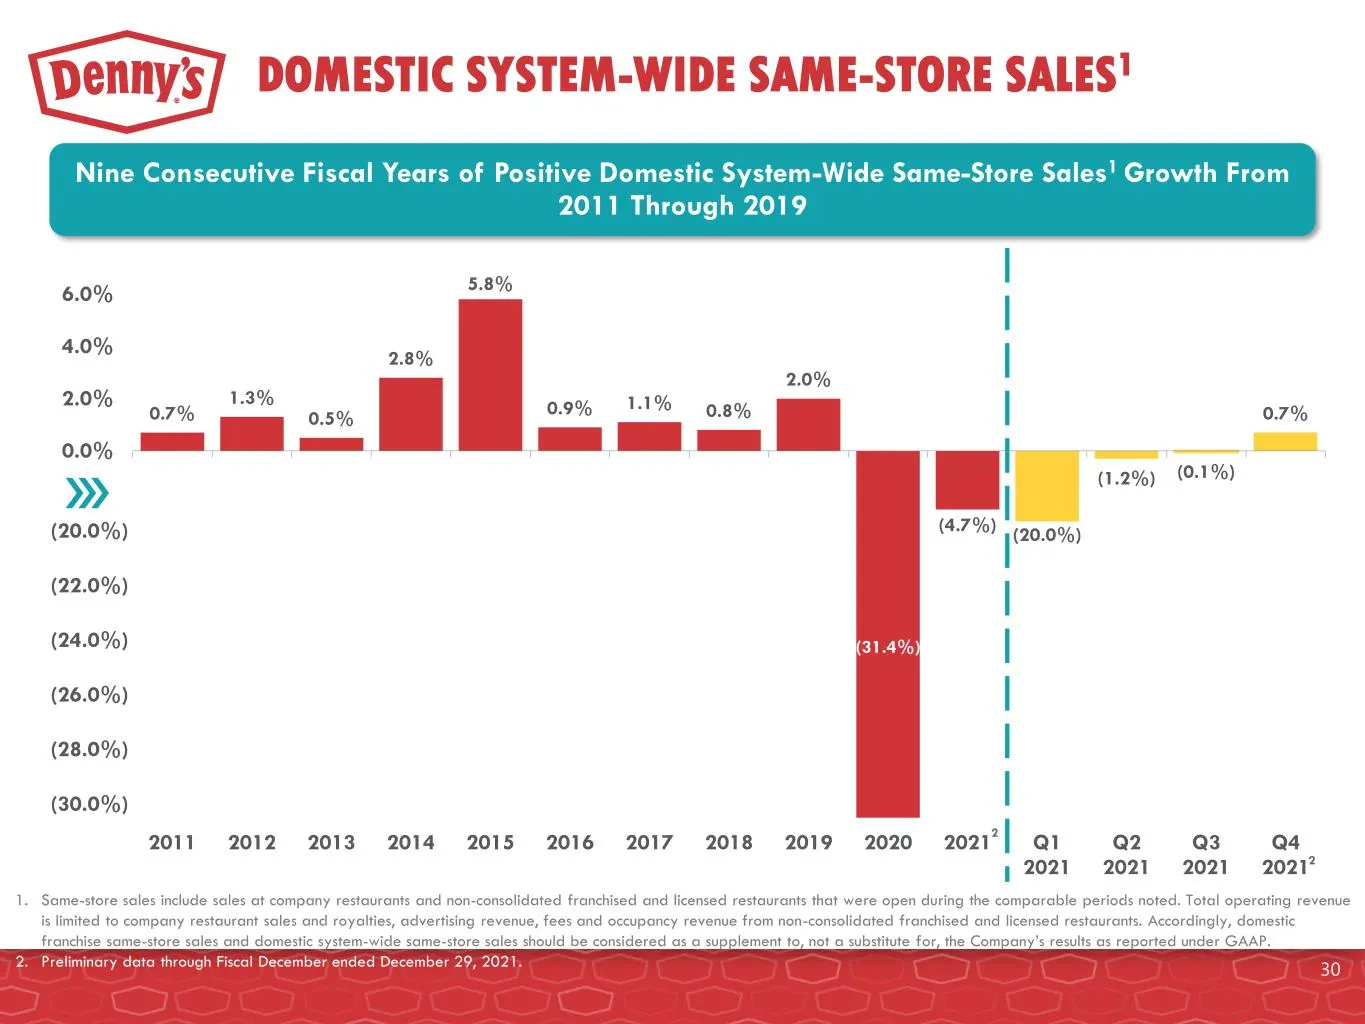
DOMESTIC SYSTEM-WIDE SAME-STORE SALES1 0.7% 1.3% 0.5% 2.8% 5.8% 0.9% 1.1% 0.8% 2.0% (31.4%) (4.7%) (20.0%) (1.2%) (0.1%) 0.7% (14.0%) (12.0%) (10.0%) (8.0%) (6.0%) (4.0%) (2.0%) 0.0% 2.0% 4.0% 6.0% 2011 2012 2013 2014 2015 2016 2017 2018 2019 2020 2021 Q1 2021 Q2 2021 Q3 2021 Q4 2021 (20.0%) (22.0%)
Slide 31: Global Development
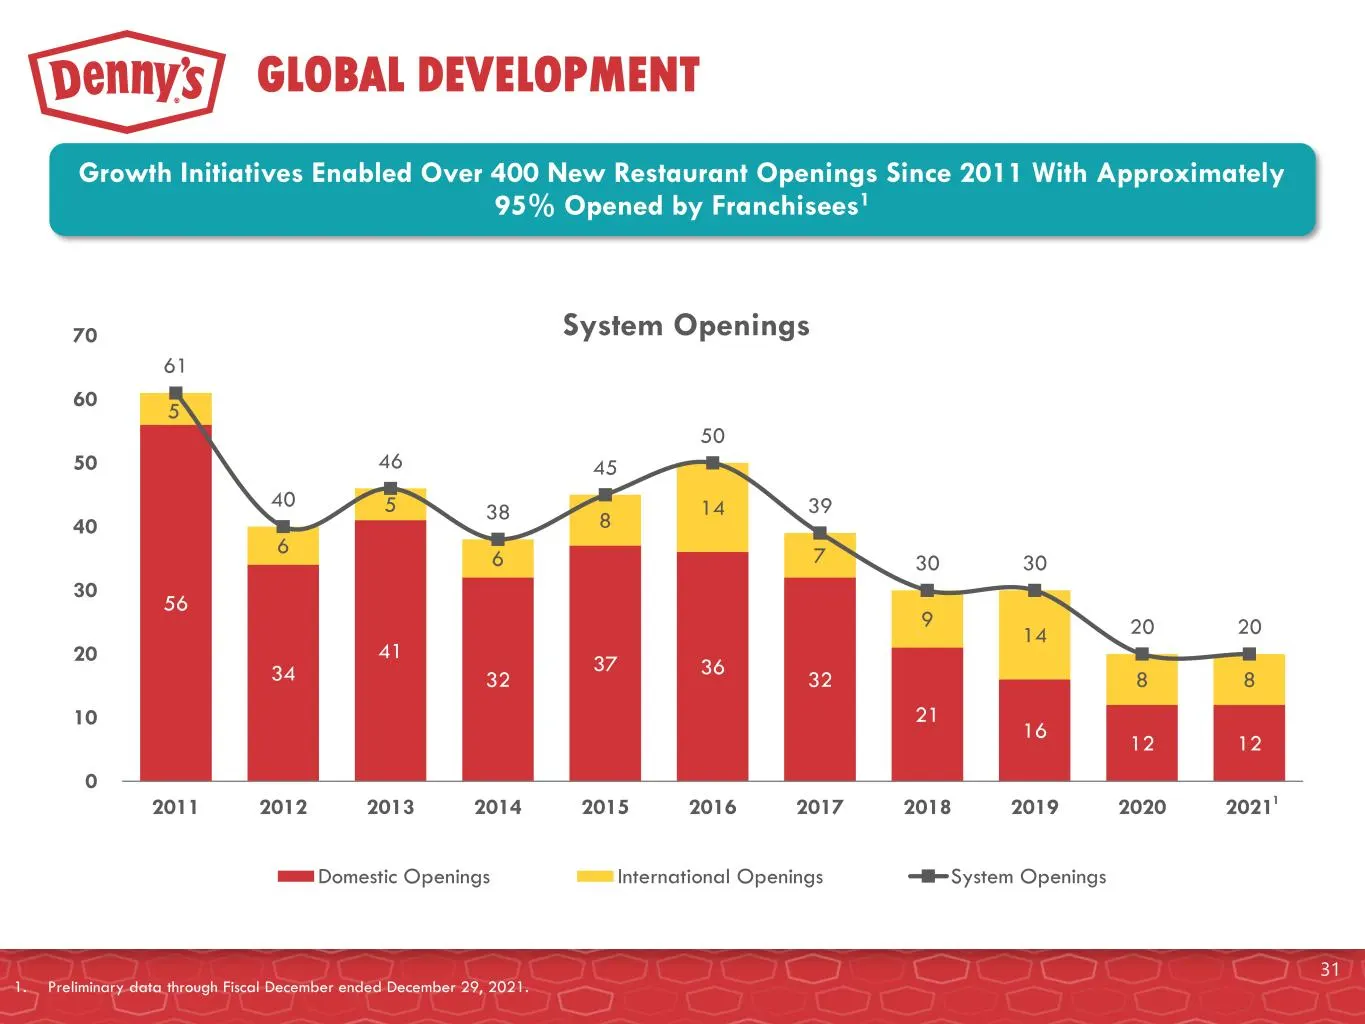
GLOBAL DEVELOPMENT 56 34 41 32 37 36 32 21 16 12 12 5 6 5 6 8 14 7 9 14 8 8 61 40 46 38 45 50 39 30 30 20 20 0 10 20 30 40 50 60 70 2011 2012 2013 2014 2015 2016 2017 2018 2019 2020 2021 System Openings Domestic Openings International Openings System Openings 31 Growth Initiatives Enabled Over 400 N
Slide 32: Adjusted Net Income (Loss) Per Share
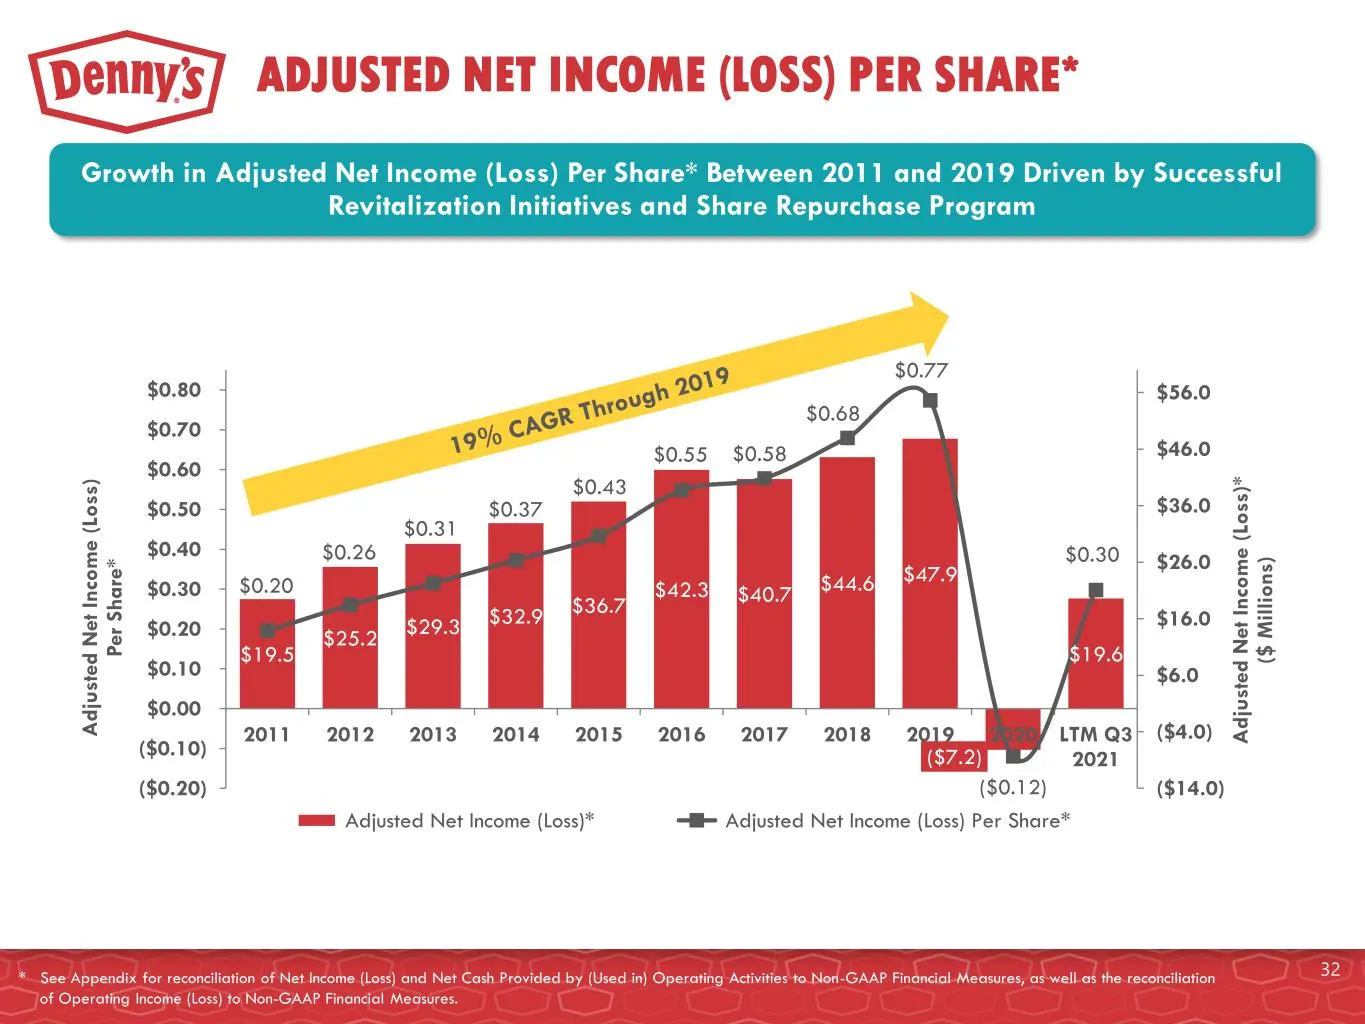
ADJUSTED NET INCOME (LOSS) PER SHARE* $19.5 $25.2 $29.3 $32.9 $36.7 $42.3 $40.7 $44.6 $47.9 ($7.2) $19.6 $0.20 $0.26 $0.31 $0.37 $0.43 $0.55 $0.58 $0.68 $0.77 ($0.12) $0.30 ($14.0) ($4.0) $6.0 $16.0 $26.0 $36.0 $46.0 $56.0 ($0.20) ($0.10) $0.00 $0.10 $0.20 $0.30 $0.40 $0.50 $0.60 $0.70 $0.80 2011 20
Slide 33: Adjusted Free Cash Flow
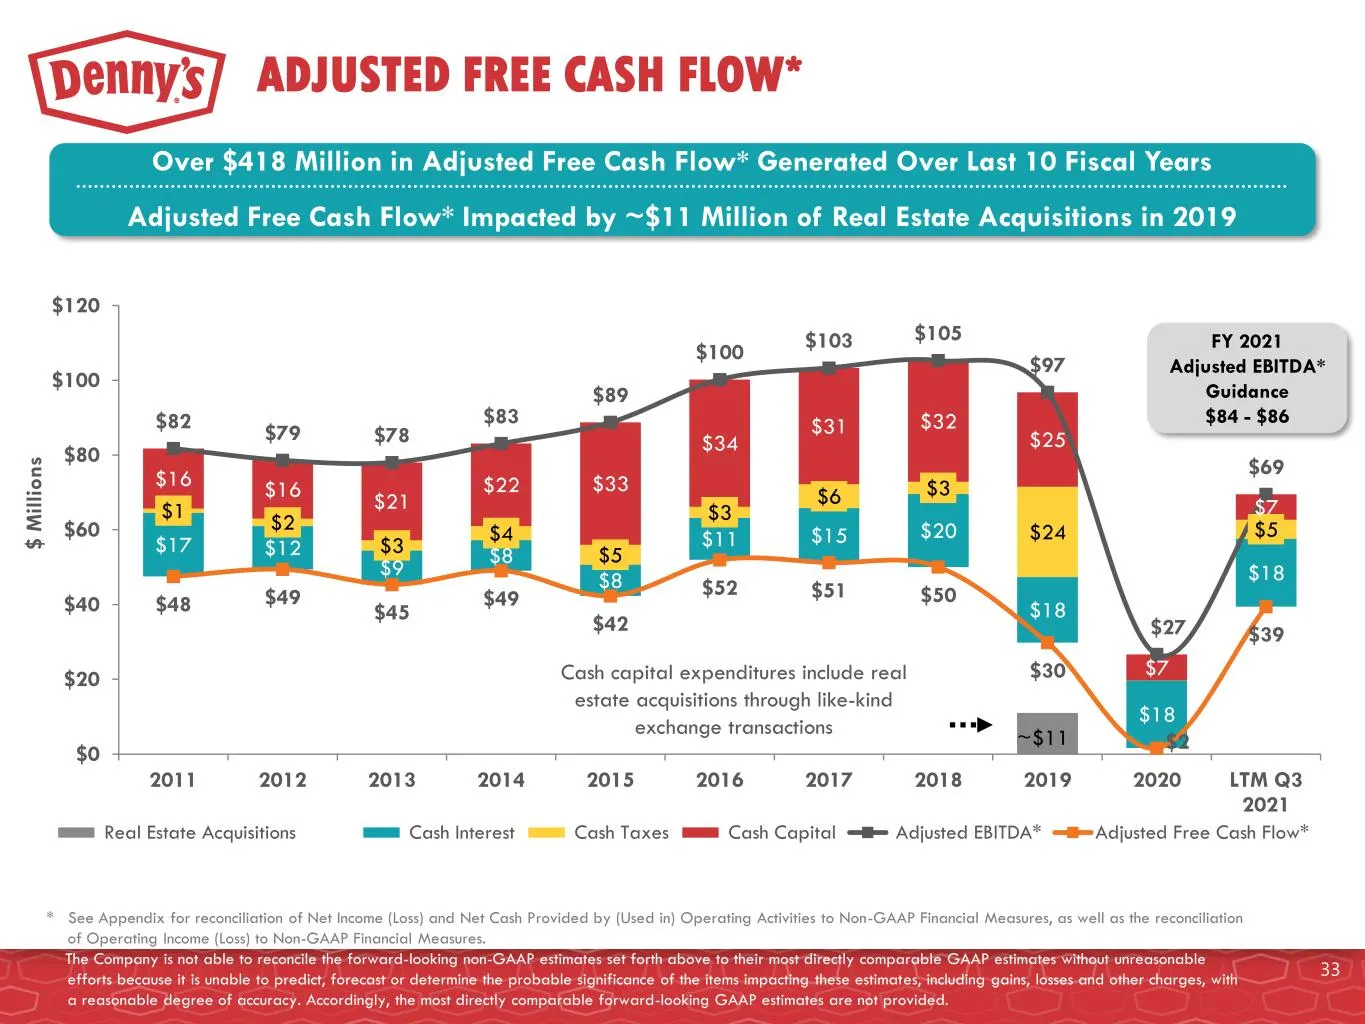
~$11 $17 $12 $9 $8 $8 $11 $15 $20 $18 $18 $18 $1 $2 $3 $4 $5 $3 $6 $3 $24 $5 $16 $16 $21 $22 $33 $34 $31 $32 $25 $7 $7 $82 $79 $78 $83 $89 $100 $103 $105 $97 $27 $69 $48 $49 $45 $49 $42 $52 $51 $50 $30 $2 $39 $0 $20 $40 $60 $80 $100 $120 2011 2012 2013 2014 2015 2016 2017 2018 2019 2020 LTM Q3 2021
Slide 34: Solid Balance Sheet with Flexibility
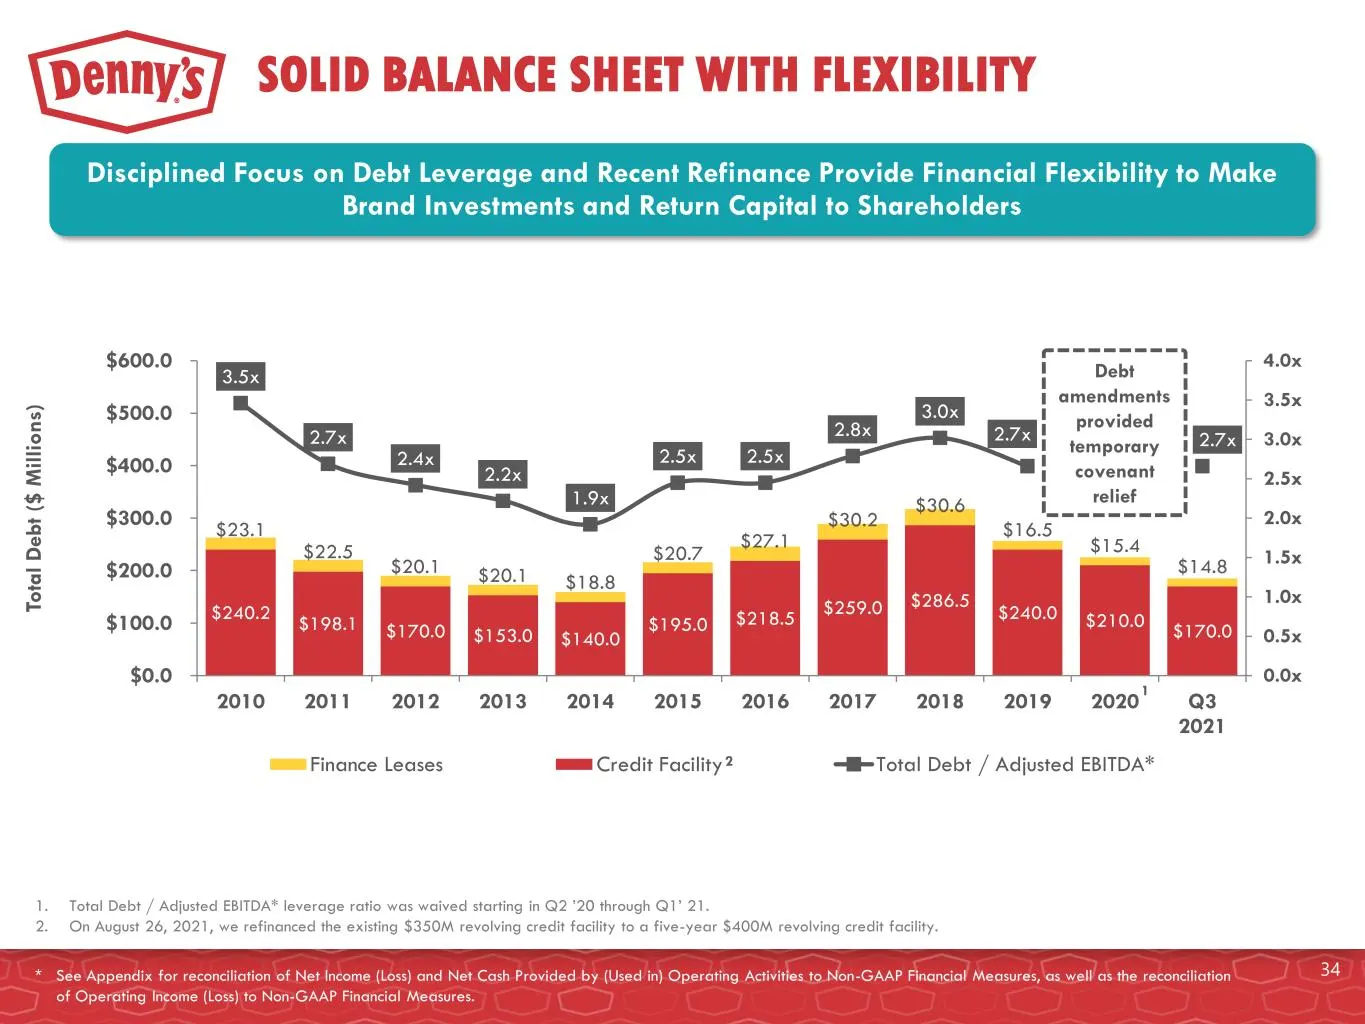
Debt amendments provided temporary covenant relief Disciplined Focus on Debt Leverage and Recent Refinance Provide Financial Flexibility to Make Brand Investments and Return Capital to Shareholders SOLID BALANCE SHEET WITH FLEXIBILITY 1. Total Debt / Adjusted EBITDA* leverage ratio was waived starti
Slide 35: History of Returning Excess Capital to Shareholders
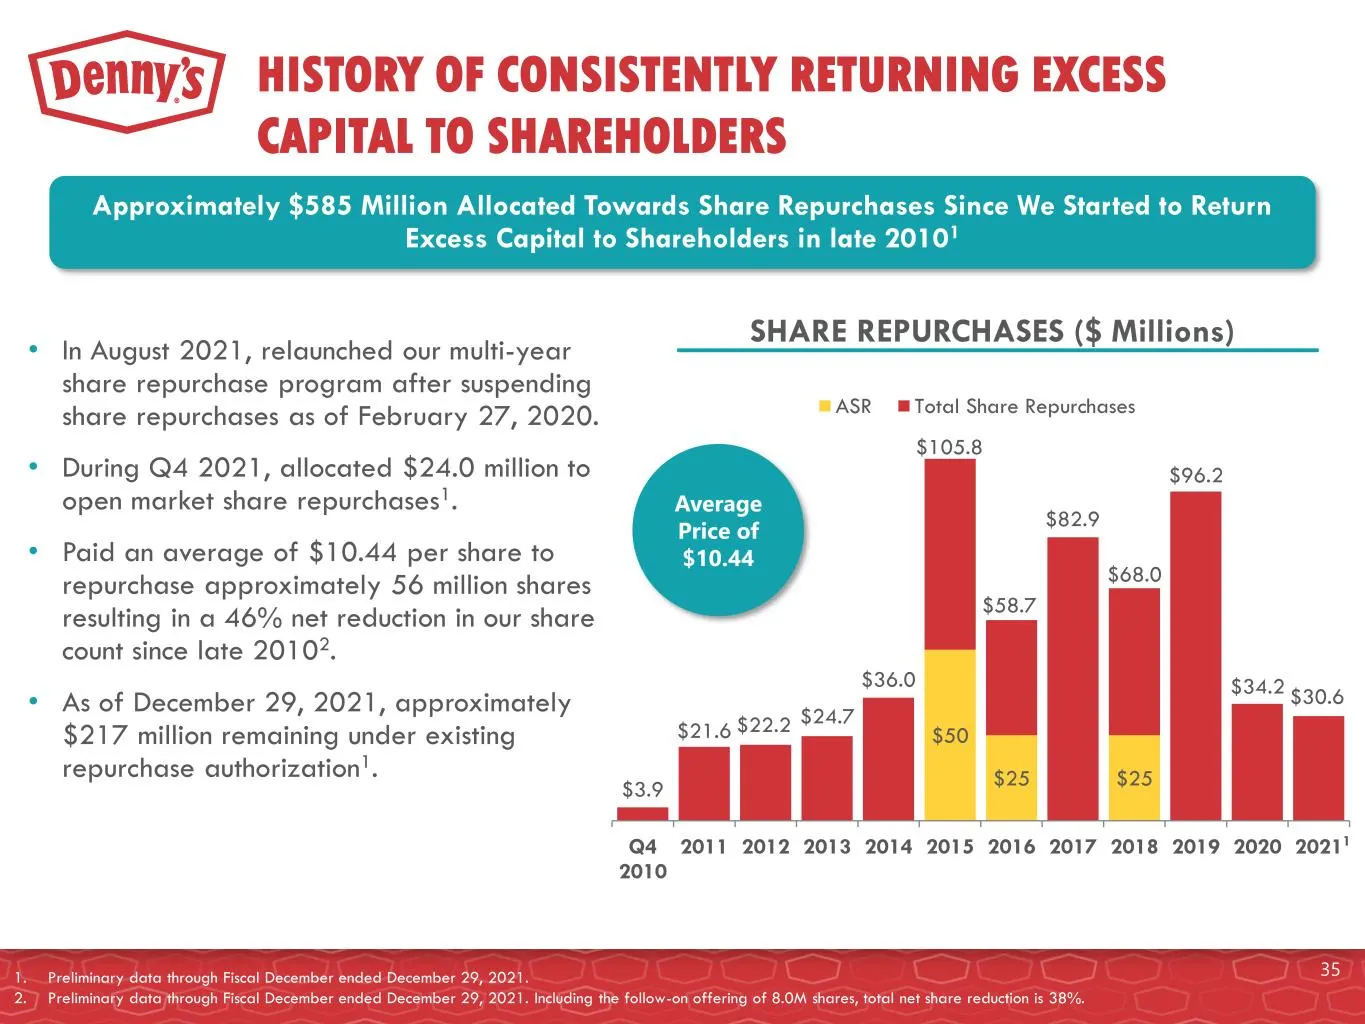
HISTORY OF CONSISTENTLY RETURNING EXCESS CAPITAL TO SHAREHOLDERS $50 $25 $25 $3.9 $21.6 $22.2 $24.7 $36.0 $82.9 $96.2 $34.2 $30.6 Q4 2010 2011 2012 2013 2014 2015 2016 2017 2018 2019 2020 2021 ASR Total Share Repurchases • In August 2021, relaunched our multi-year share repurchase program after susp
Slide 36: Stock Price Performance
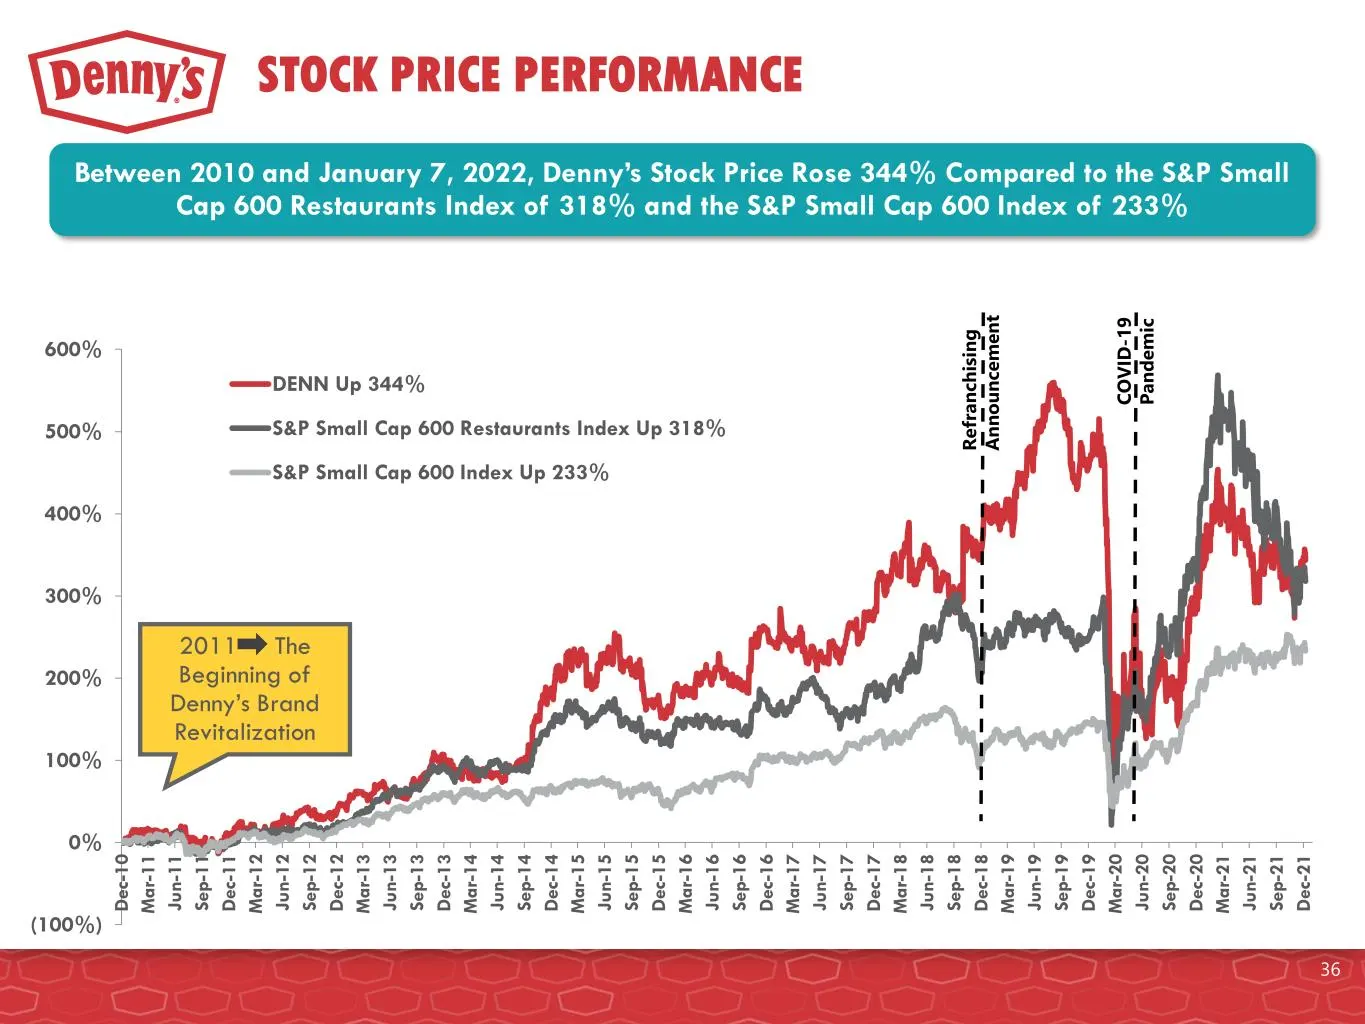
STOCK PRICE PERFORMANCE (100%) 0% 100% 200% 300% 400% 500% 600% D e c- 1 0 M a r- 1 1 Ju n -1 1 S e p -1 1 D e c- 1 1 M a r- 1 2 Ju n -1 2 S e p -1 2 D e c- 1 2 M a r- 1 3 Ju n -1 3 S e p -1 3 D e c- 1 3 M a r- 1 4 Ju n -1 4 S e p -1 4 D e c- 1 4 M a r- 1 5 Ju n -1 5 S e p -1 5 D e c- 1 5 M a r- 1 6
Slide 37: Denny's Investment Highlights
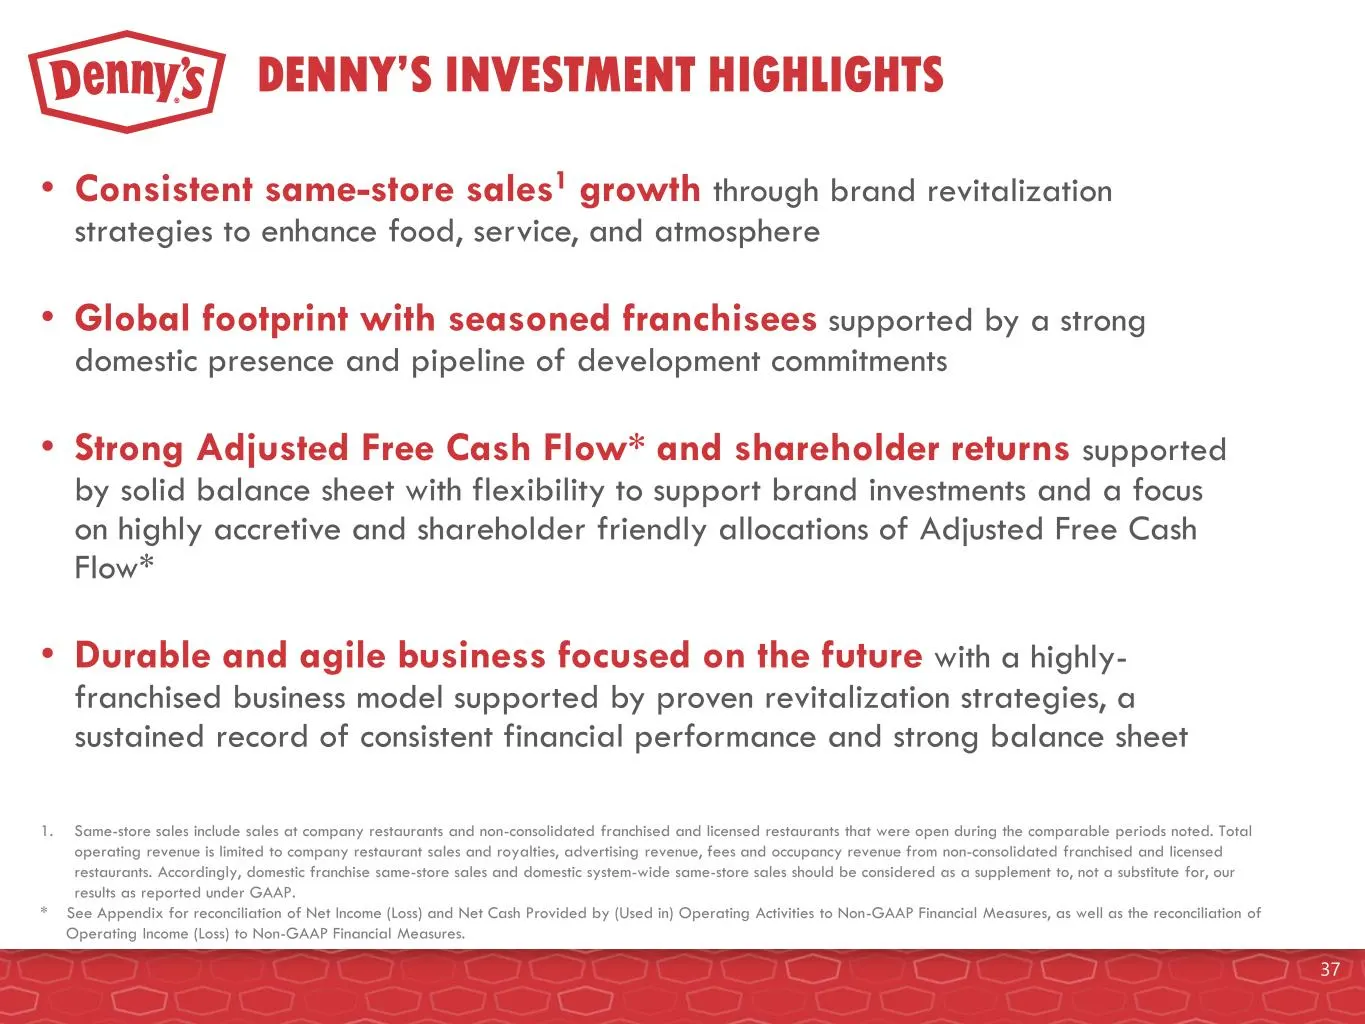
DENNY’S INVESTMENT HIGHLIGHTS 1. Same-store sales include sales at company restaurants and non-consolidated franchised and licensed restaurants that were open during the comparable periods noted. Total operating revenue is limited to company restaurant sales and royalties, advertising revenue, fees

Slide 38: Appendix
APPENDIX 38
Slide 39: Experienced and Committed Leadership Team
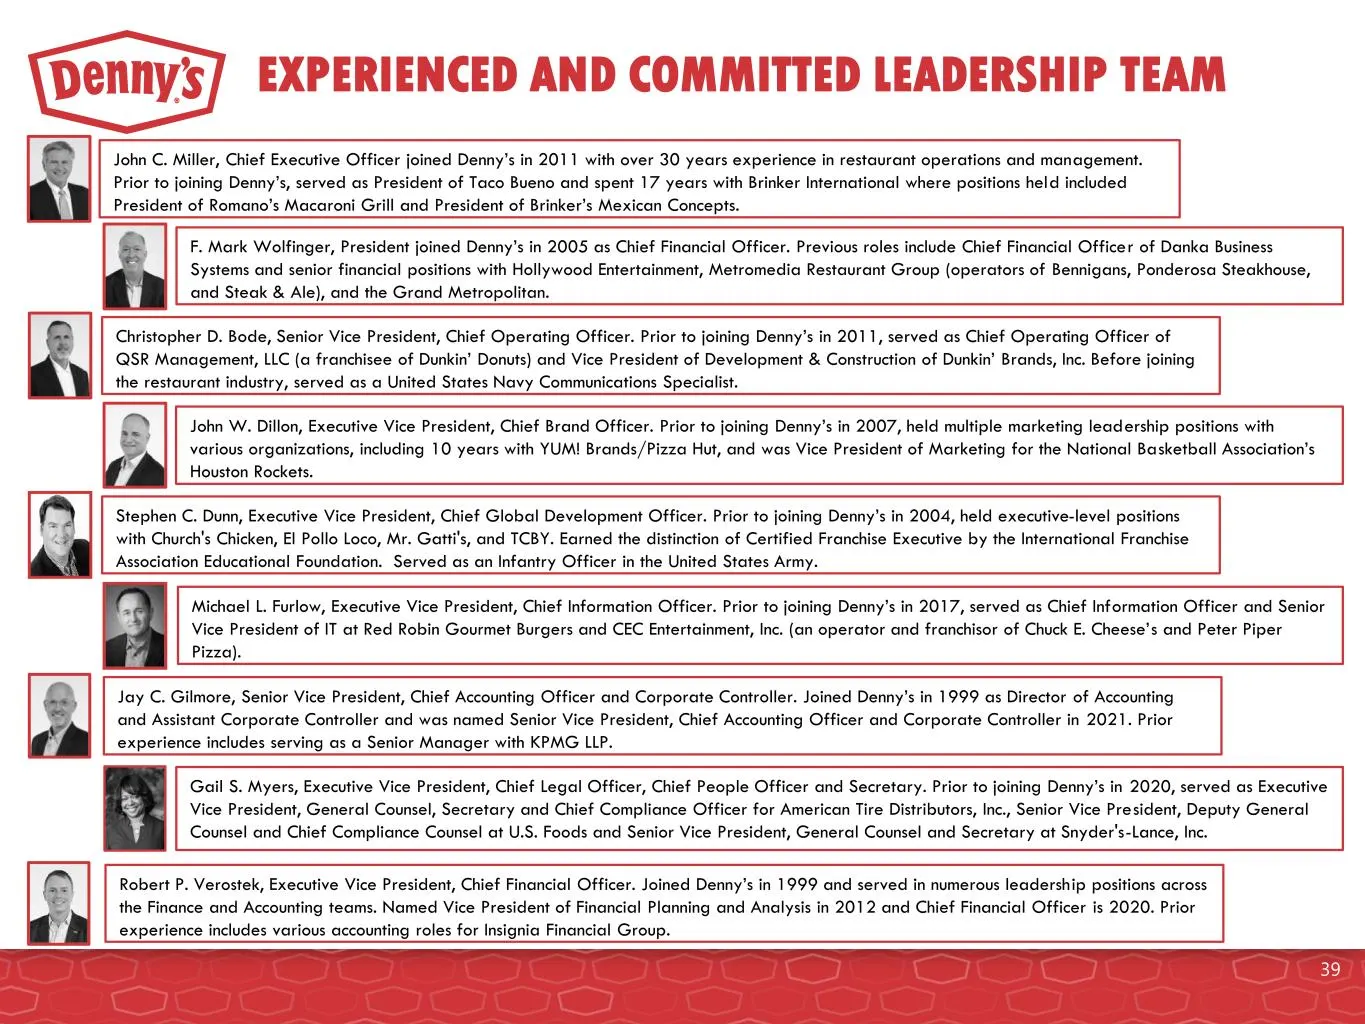
EXPERIENCED AND COMMITTED LEADERSHIP TEAM John C. Miller, Chief Executive Officer joined Denny’s in 2011 with over 30 years experience in restaurant operations and management. Prior to joining Denny’s, served as President of Taco Bueno and spent 17 years with Brinker International where positions he
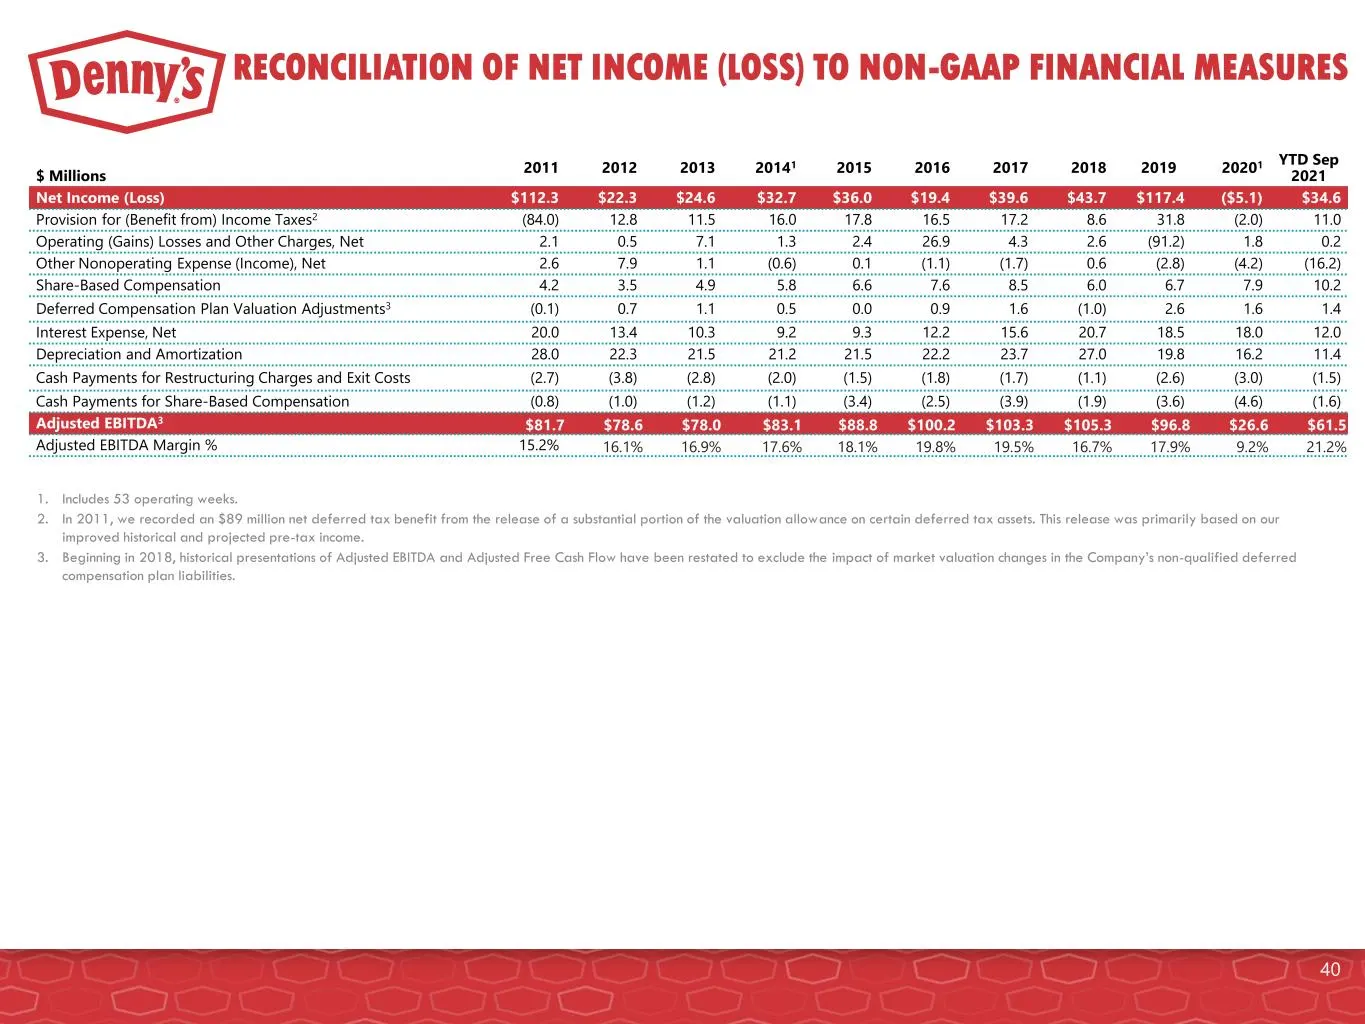
Slide 40: Reconciliation of Net Income (Loss) to Non-GAAP Measures
RECONCILIATION OF NET INCOME (LOSS) TO NON-GAAP FINANCIAL MEASURES $ Millions 2011 2012 2013 20141 2015 2016 2017 2018 2019 20201 YTD Sep 2021 Net Income (Loss) $112.3 $22.3 $24.6 $32.7 $36.0 $19.4 $39.6 $43.7 $117.4 ($5.1) $34.6 Provision for (Benefit from) Income Taxes2 (84.0) 12.8 11.5 16.0 17.8
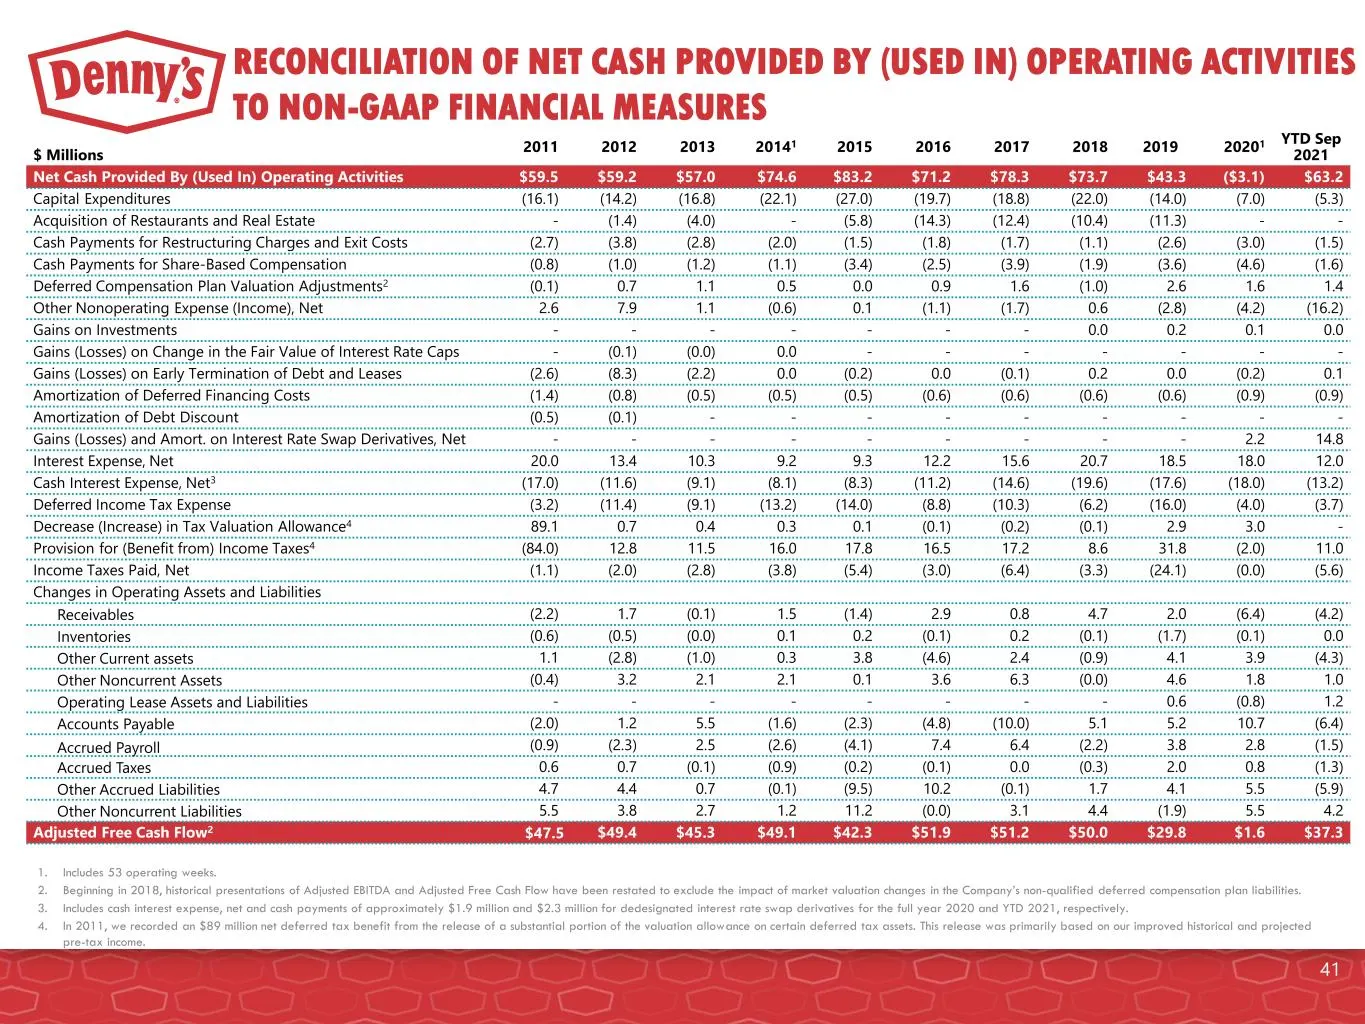
Slide 41: Reconciliation of Net Cash from Operating Activities to Non-GAAP Measures
RECONCILIATION OF NET CASH PROVIDED BY (USED IN) OPERATING ACTIVITIES TO NON-GAAP FINANCIAL MEASURES $ Millions 2011 2012 2013 20141 2015 2016 2017 2018 2019 20201 YTD Sep 2021 Net Cash Provided By (Used In) Operating Activities $59.5 $59.2 $57.0 $74.6 $83.2 $71.2 $78.3 $73.7 $43.3 ($3.1) $63.2 Capi
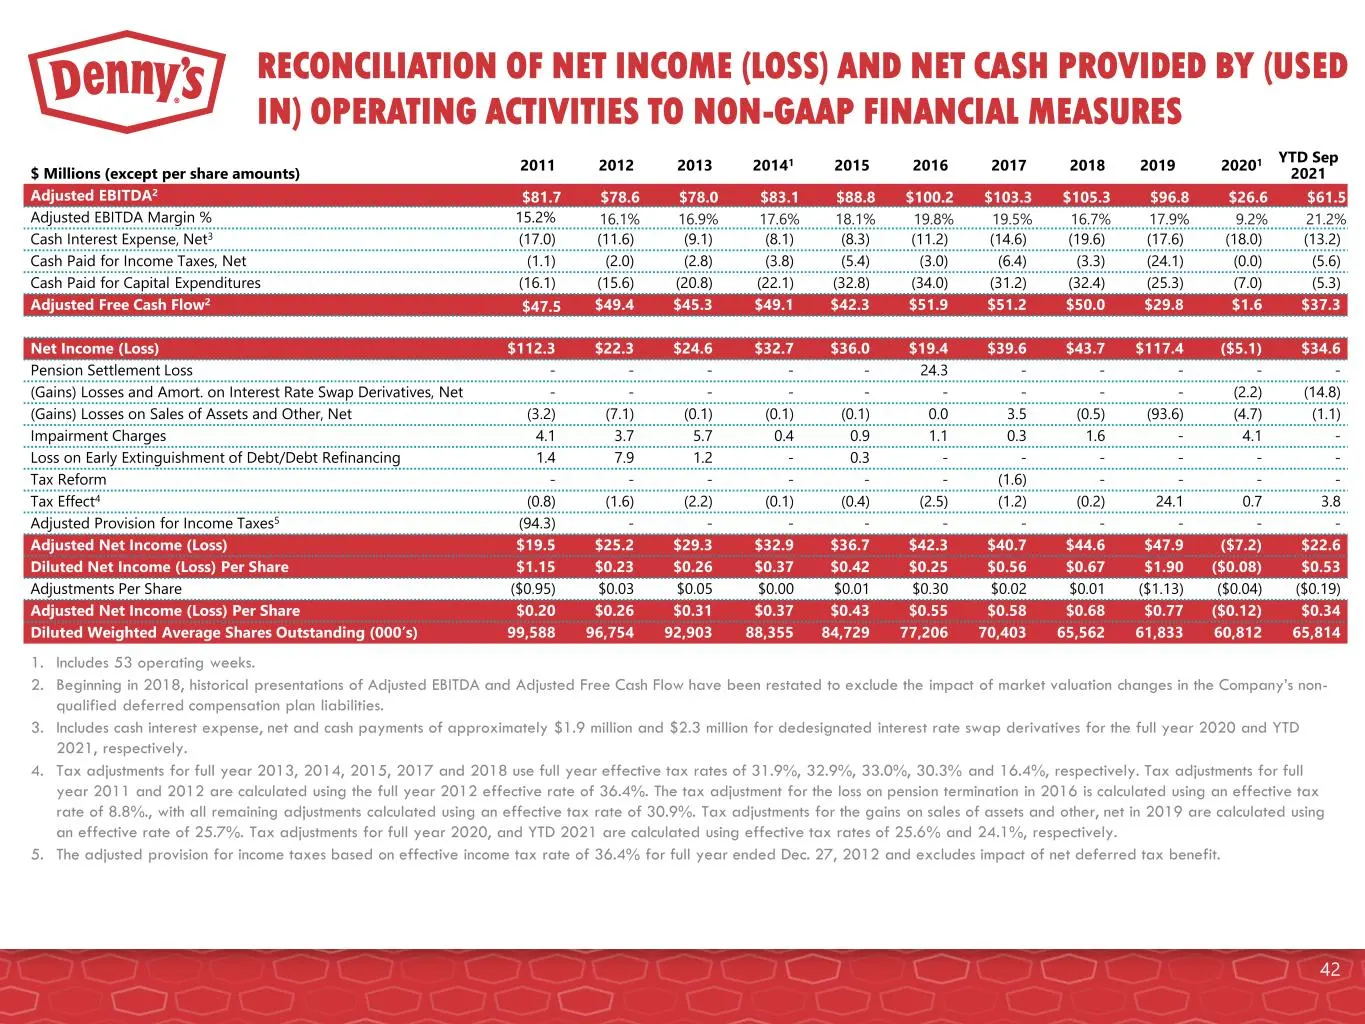
Slide 42: Reconciliation of Net Income and Operating Cash Flow to Non-GAAP Measures
RECONCILIATION OF NET INCOME (LOSS) AND NET CASH PROVIDED BY (USED IN) OPERATING ACTIVITIES TO NON-GAAP FINANCIAL MEASURES $ Millions (except per share amounts) 2011 2012 2013 20141 2015 2016 2017 2018 2019 20201 YTD Sep 2021 Adjusted EBITDA2 $81.7 $78.6 $78.0 $83.1 $88.8 $100.2 $103.3 $105.3 $96.8
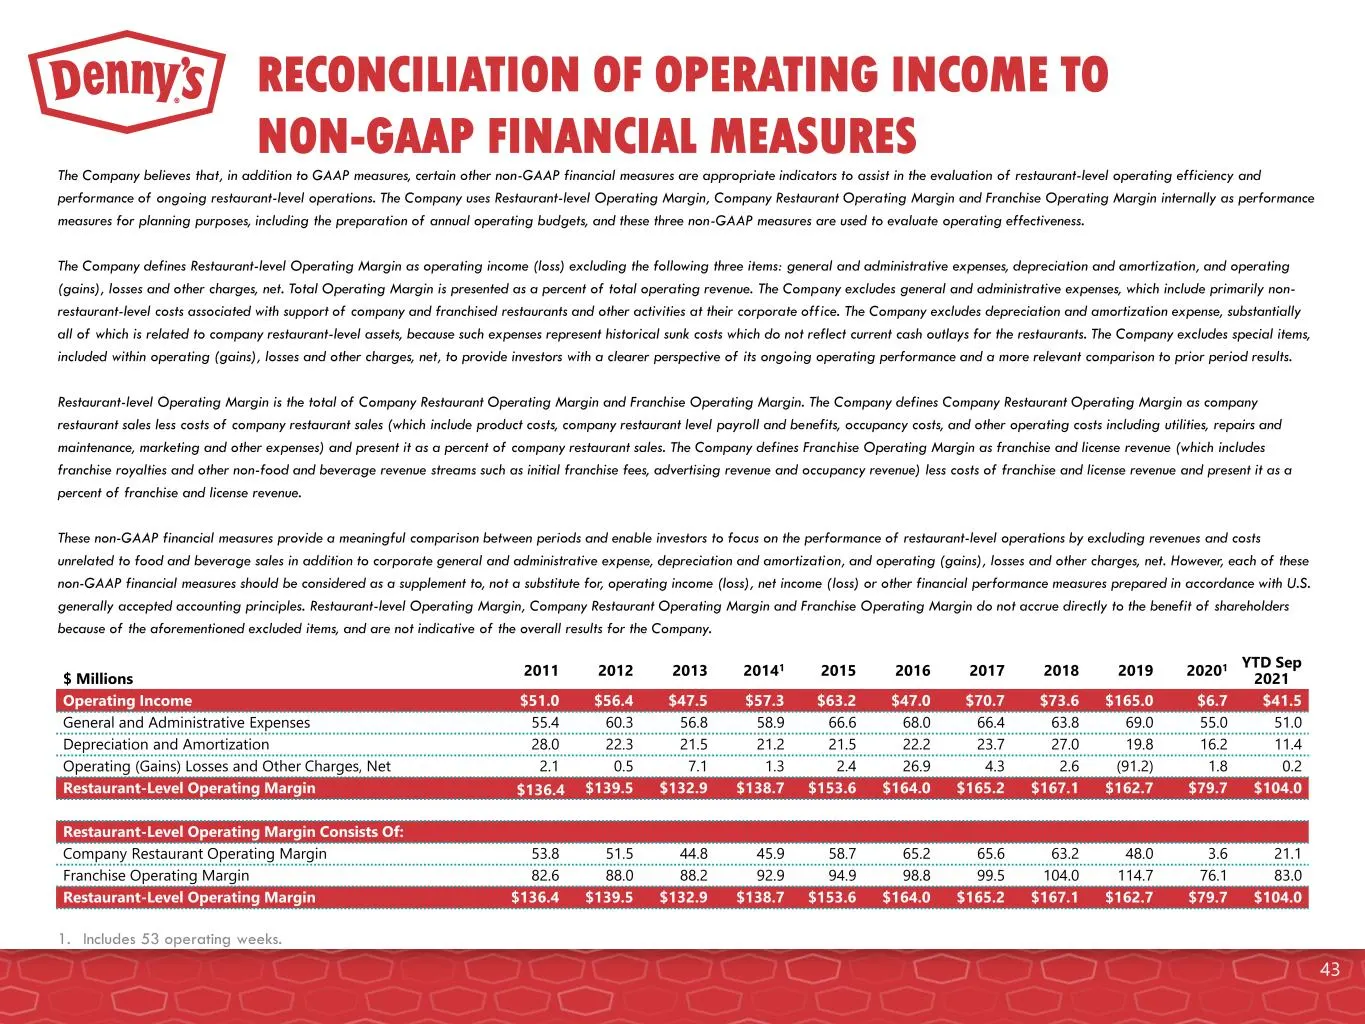
Slide 43: Reconciliation of Operating Income to Non-GAAP Measures
RECONCILIATION OF OPERATING INCOME TO NON-GAAP FINANCIAL MEASURES $ Millions 2011 2012 2013 20141 2015 2016 2017 2018 2019 20201 YTD Sep 2021 Operating Income $51.0 $56.4 $47.5 $57.3 $63.2 $47.0 $70.7 $73.6 $165.0 $6.7 $41.5 General and Administrative Expenses 55.4 60.3 56.8 58.9 66.6 68.0 66.4 63.8
Source: SEC EDGAR · 8-K filed Jan 10, 2022
More decks from Dennys Corp
 Investor Presentation (August 2025)30 slides · Aug 4, 2025
 Investor Presentation (May 2025)32 slides · May 2025
 Investor Presentation (February 2025)32 slides · February 2025
 Investor Presentation (January 2025)32 slides · Jan 13, 2025
 Investor Day (October 2024)137 slides · Oct 22, 2024
 Q2 2024 Earnings Presentation22 slides · Jul 30, 2024