Wachovia Corp New
Wachovia Corp New — Golden West Financial — Merger or Acquisition (May 2006)
32 slides from Wachovia Corp New's merger presentation, May 8, 2006
Slide 1: Accelerates retail momentum in high growth markets
Accelerates retail momentum in high growth markets Presentation to Investors May 8, 2006
Slide 2: Accelerates retail momentum in high growth markets
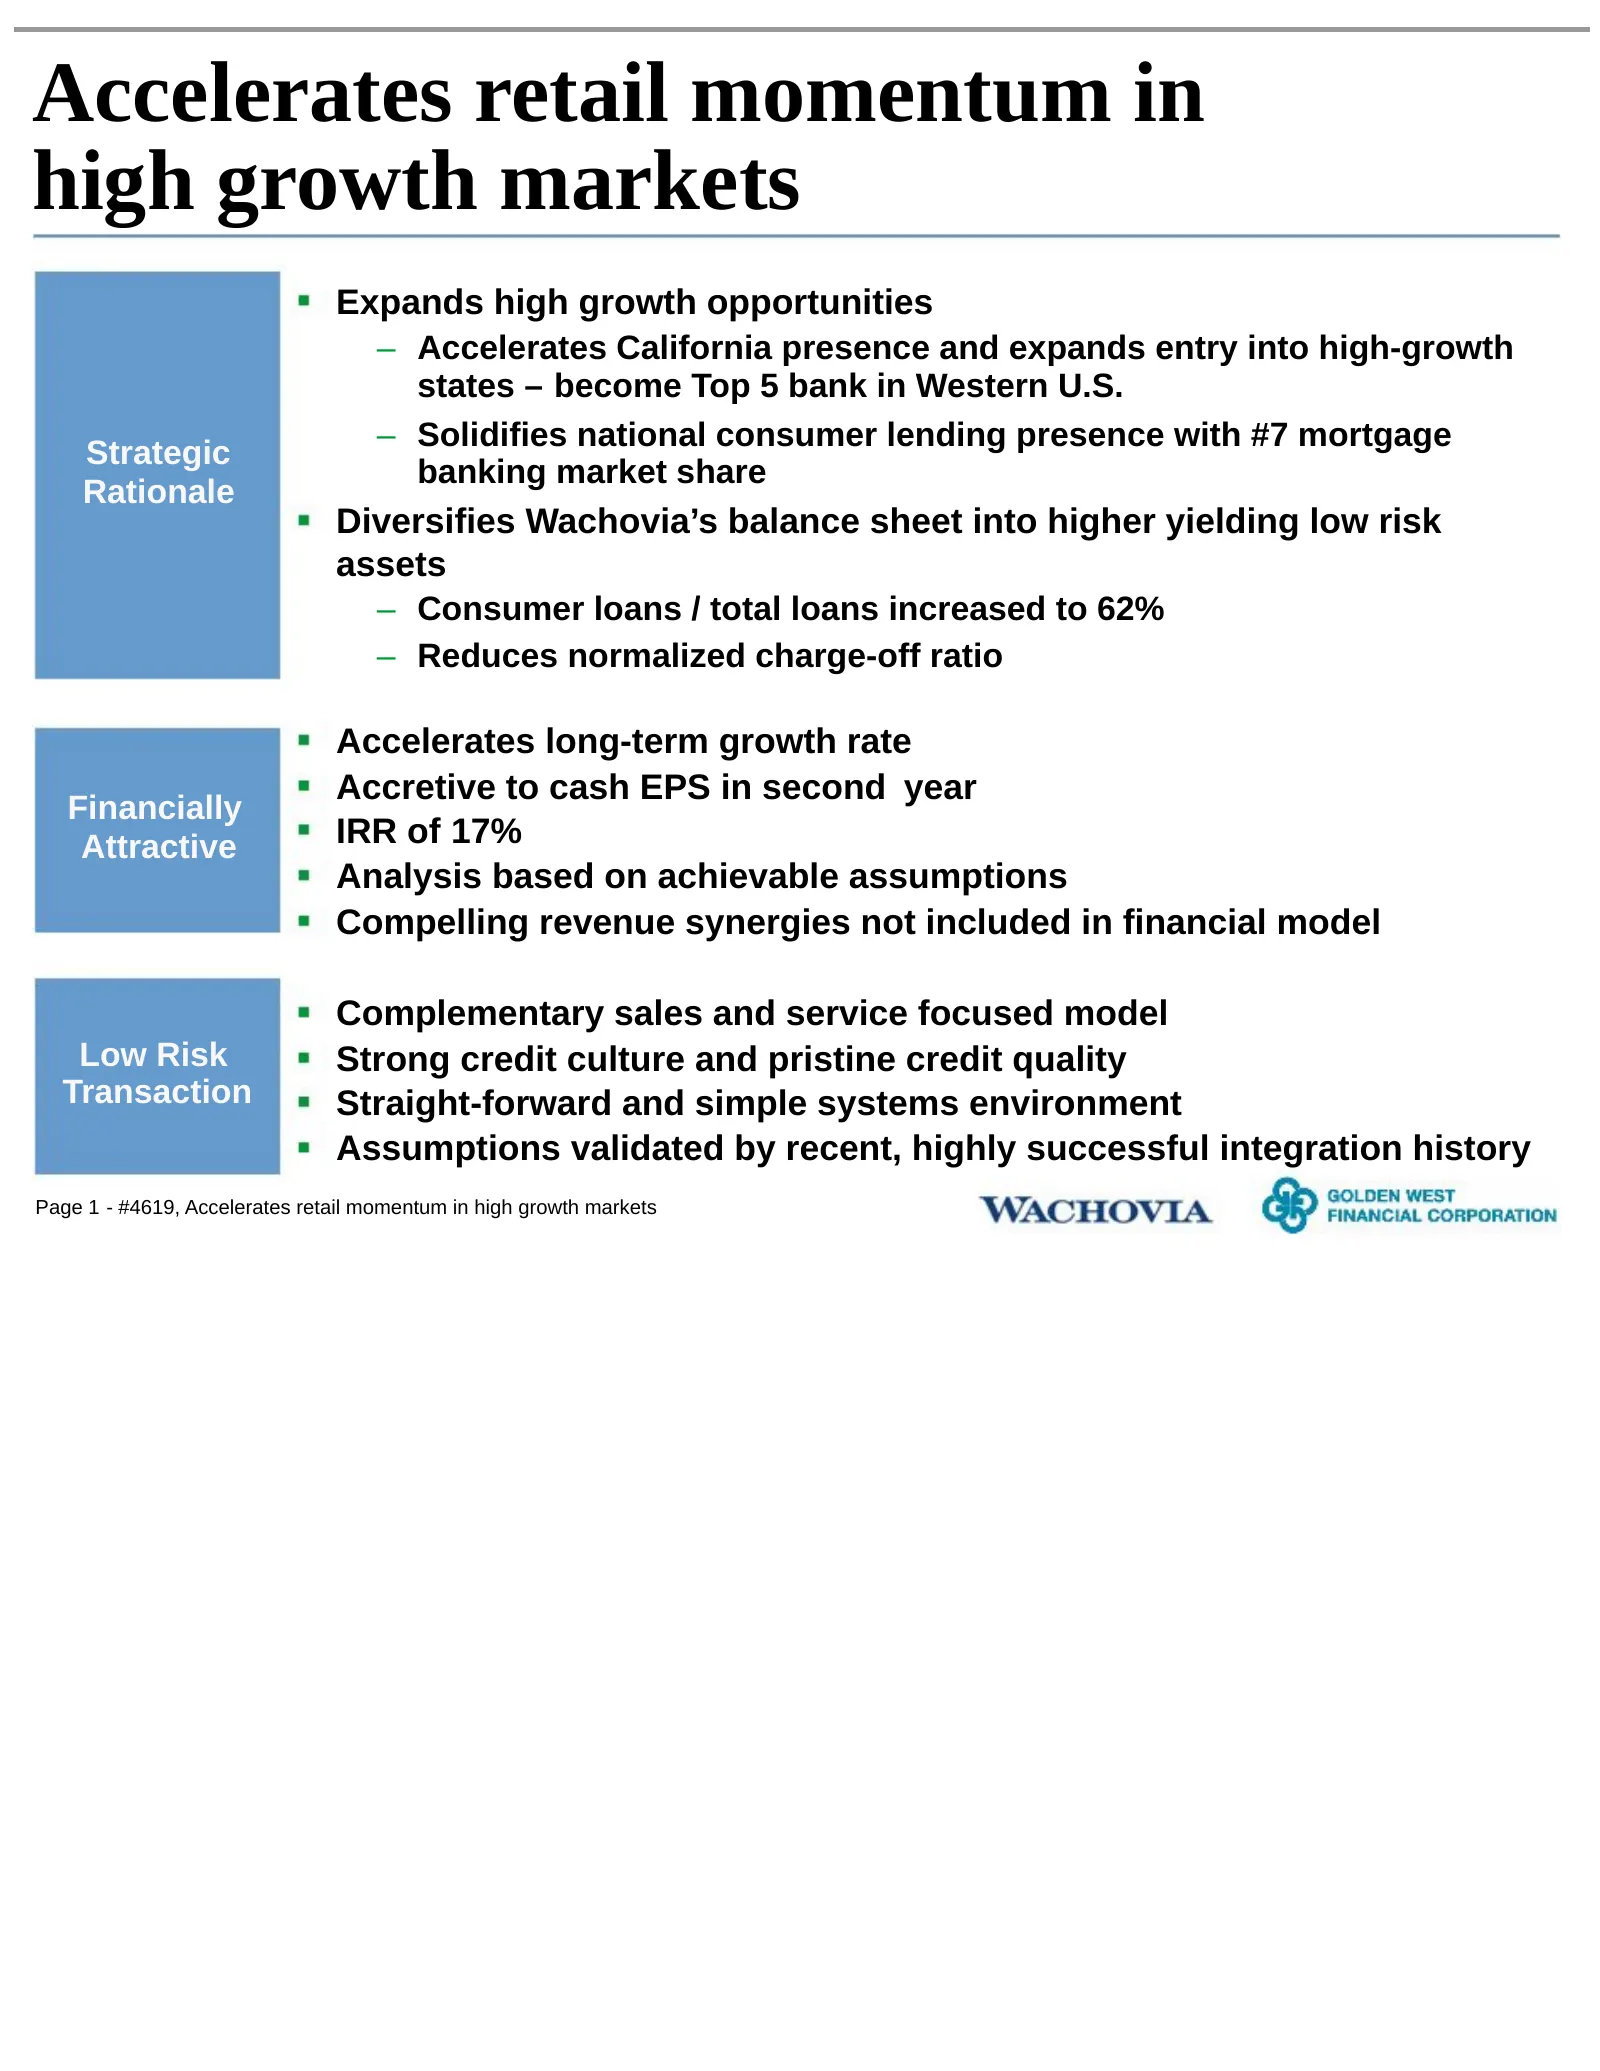
Accelerates retail momentum in high growth markets Expands high growth opportunities – Accelerates California presence and expands entry into high-growth states – become Top 5 bank in Western U.S. – Solidifies national consumer lending presence with #7 mortgage Strategic banking market share Rationa
Slide 3: Transaction summary
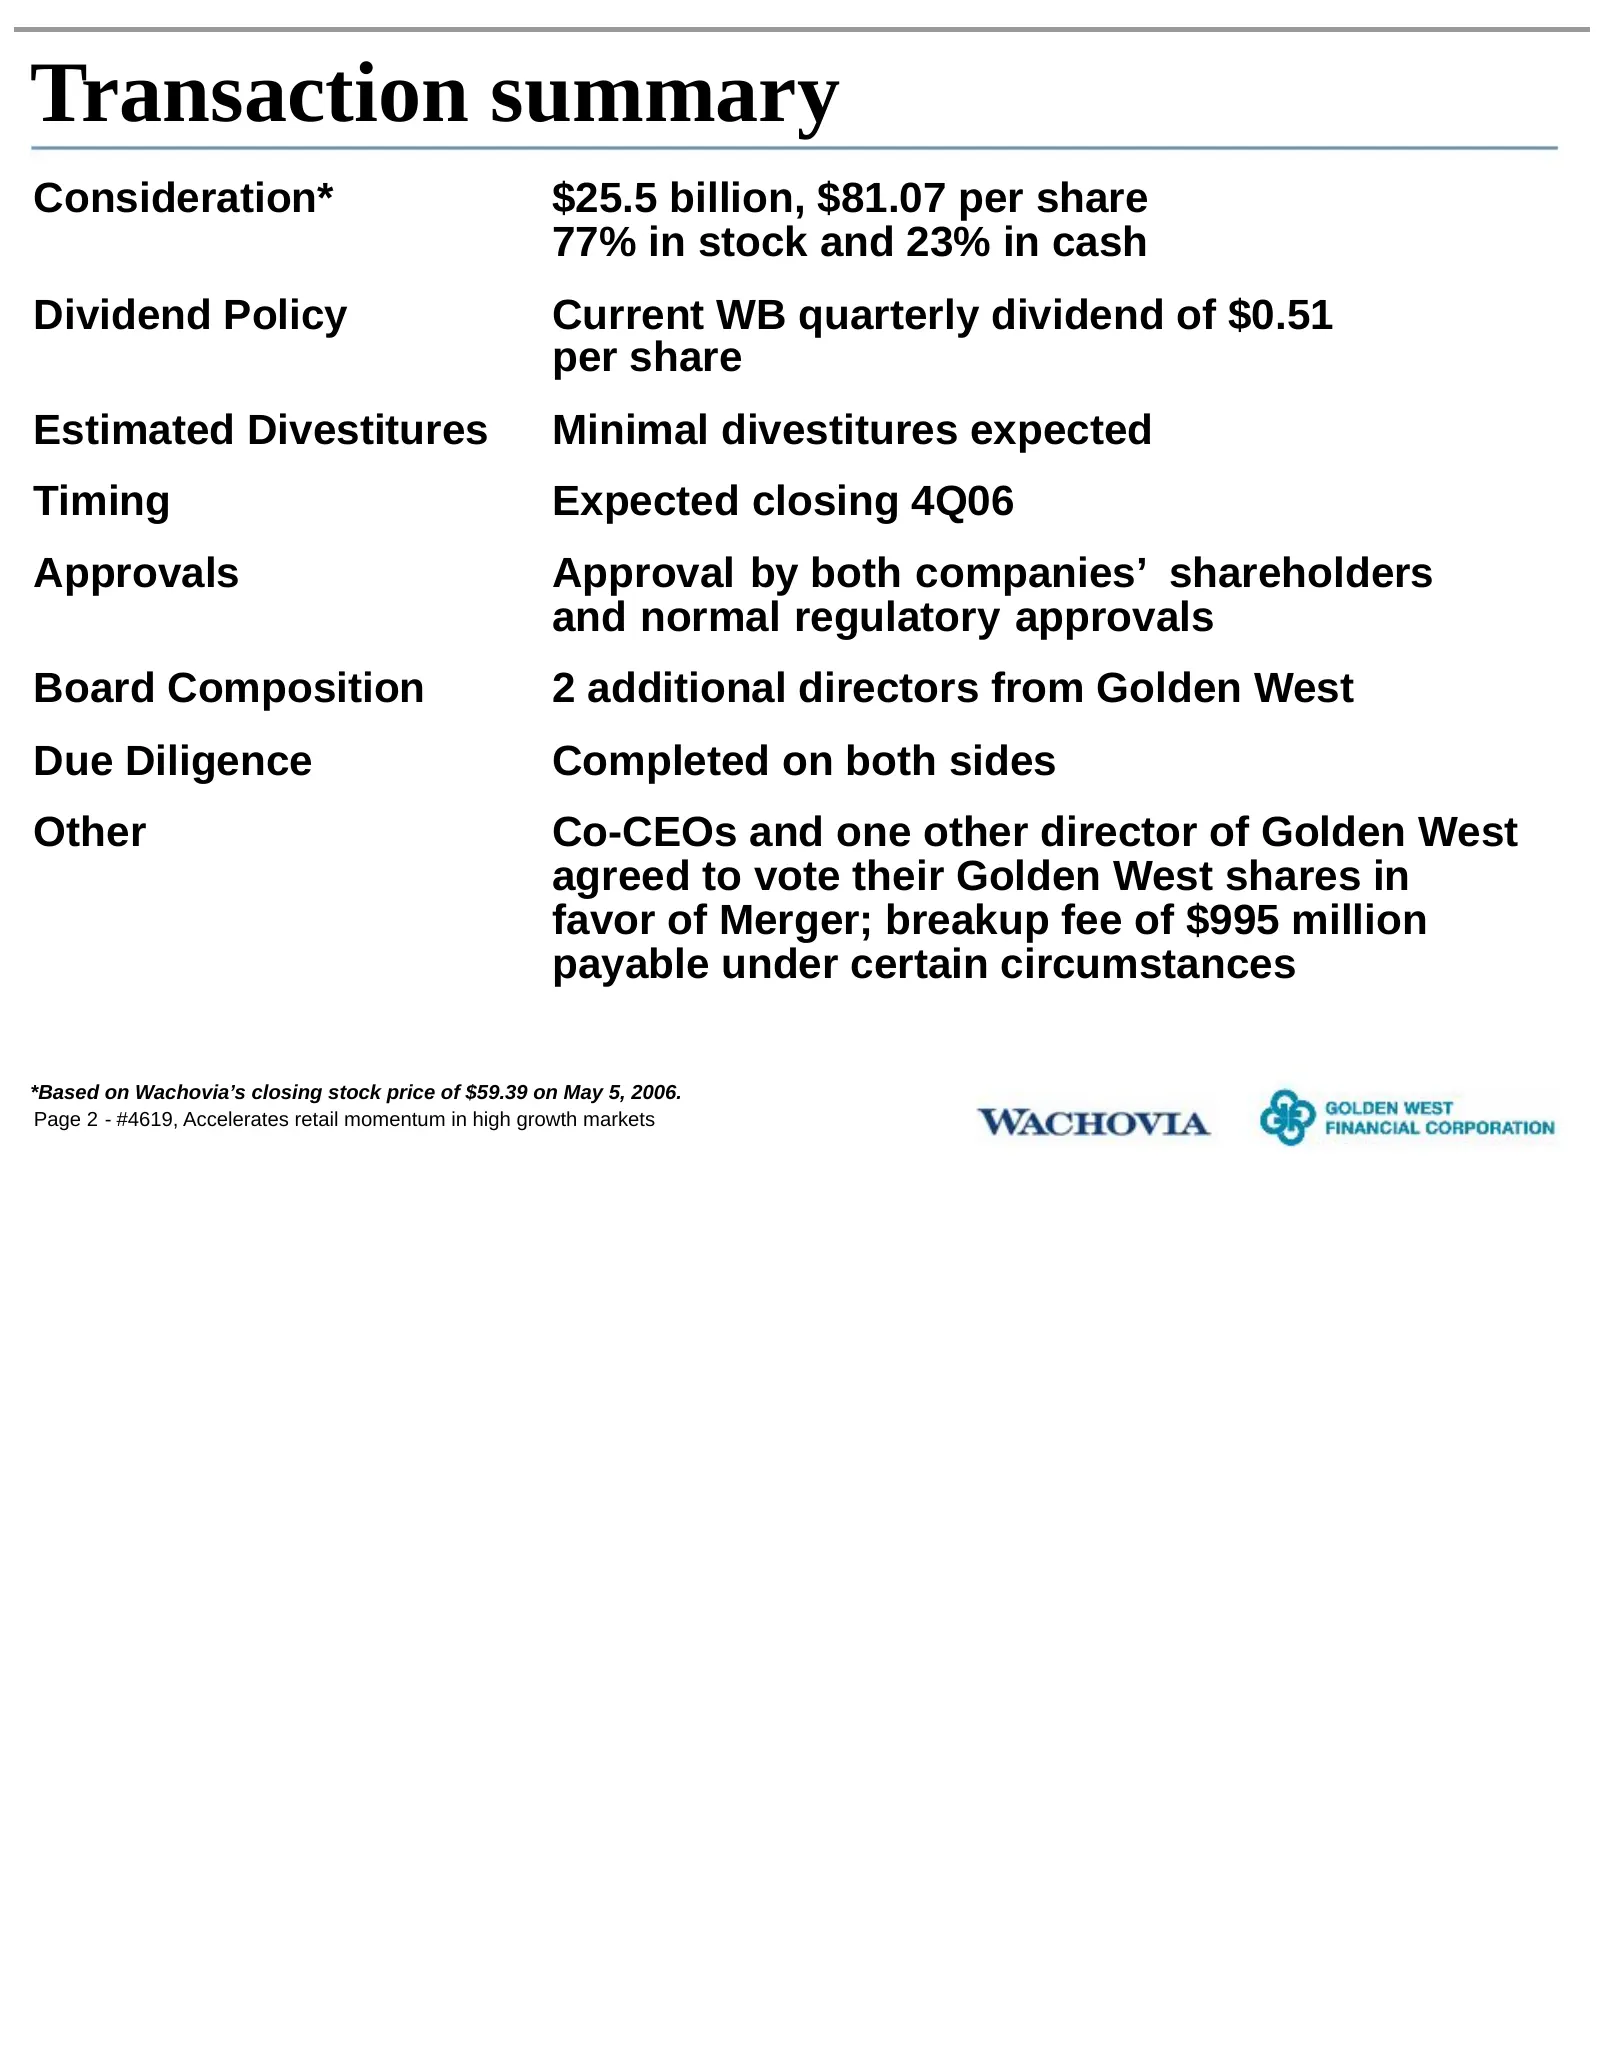
Transaction summary Consideration* $25.5 billion, $81.07 per share 77% in stock and 23% in cash Dividend Policy Current WB quarterly dividend of $0.51 per share Estimated Divestitures Minimal divestitures expected Timing Expected closing 4Q06 Approvals Approval by both companies’ shareholders and no
Slide 4: Golden West: Proven business model
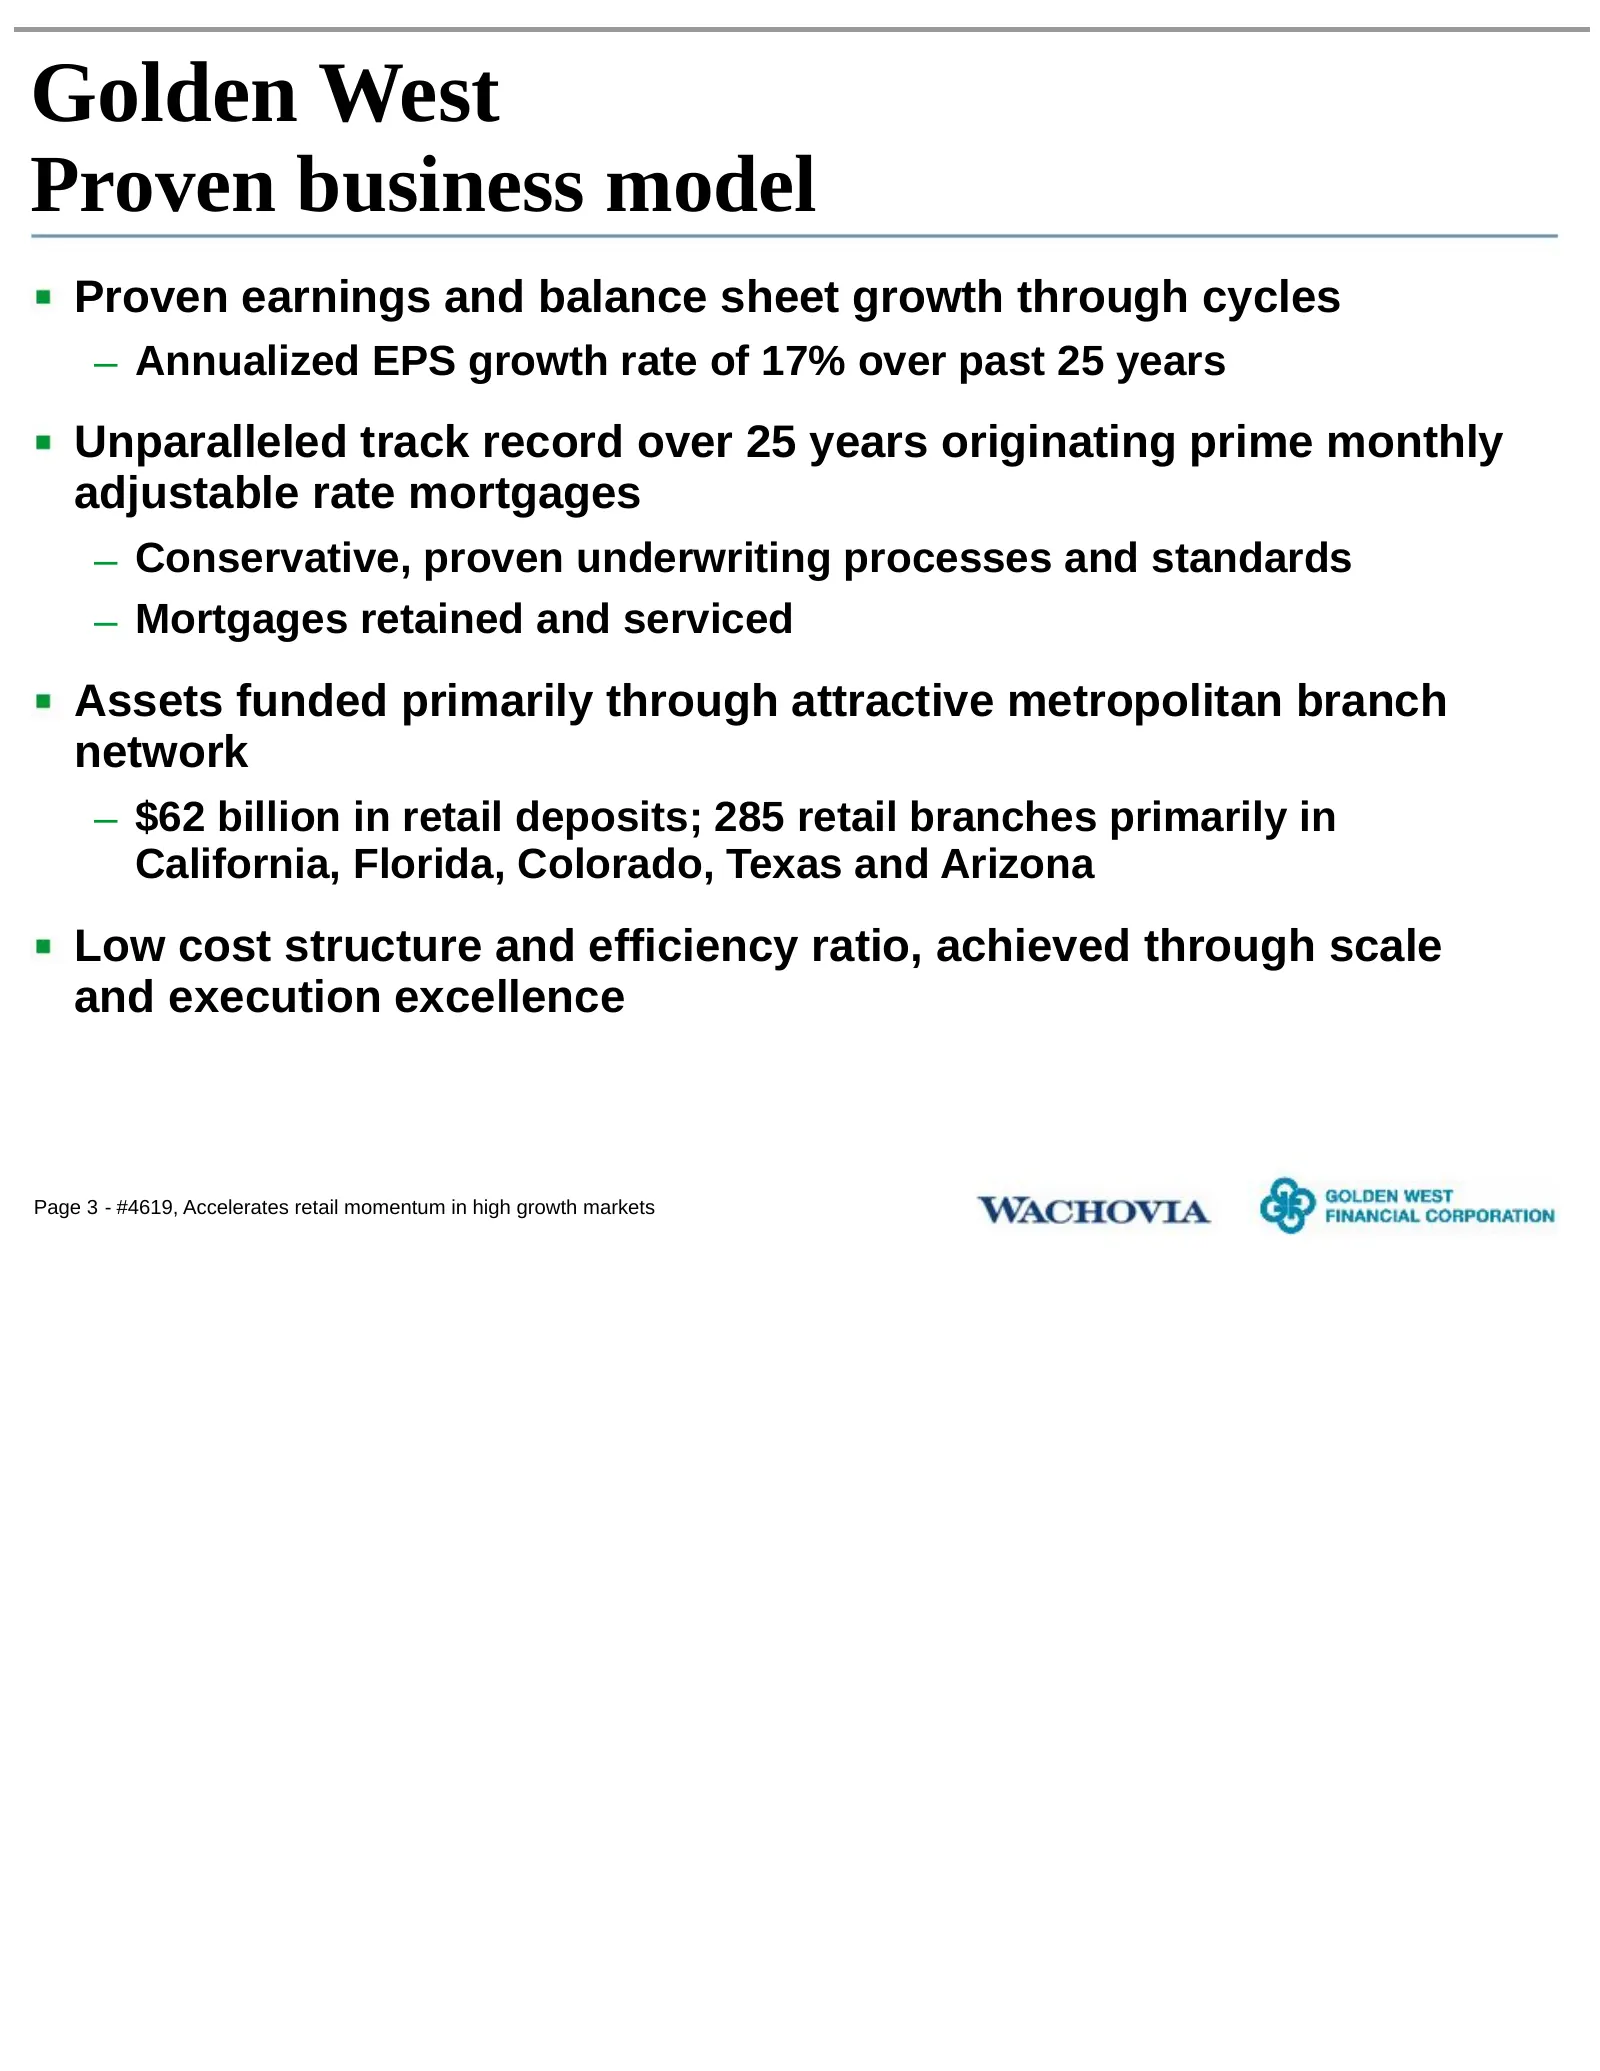
Golden West Proven business model Proven earnings and balance sheet growth through cycles – Annualized EPS growth rate of 17% over past 25 years Unparalleled track record over 25 years originating prime monthly adjustable rate mortgages – Conservative, proven underwriting processes and standards – M
Slide 5: Golden West: Snapshot of a premier retail franchise
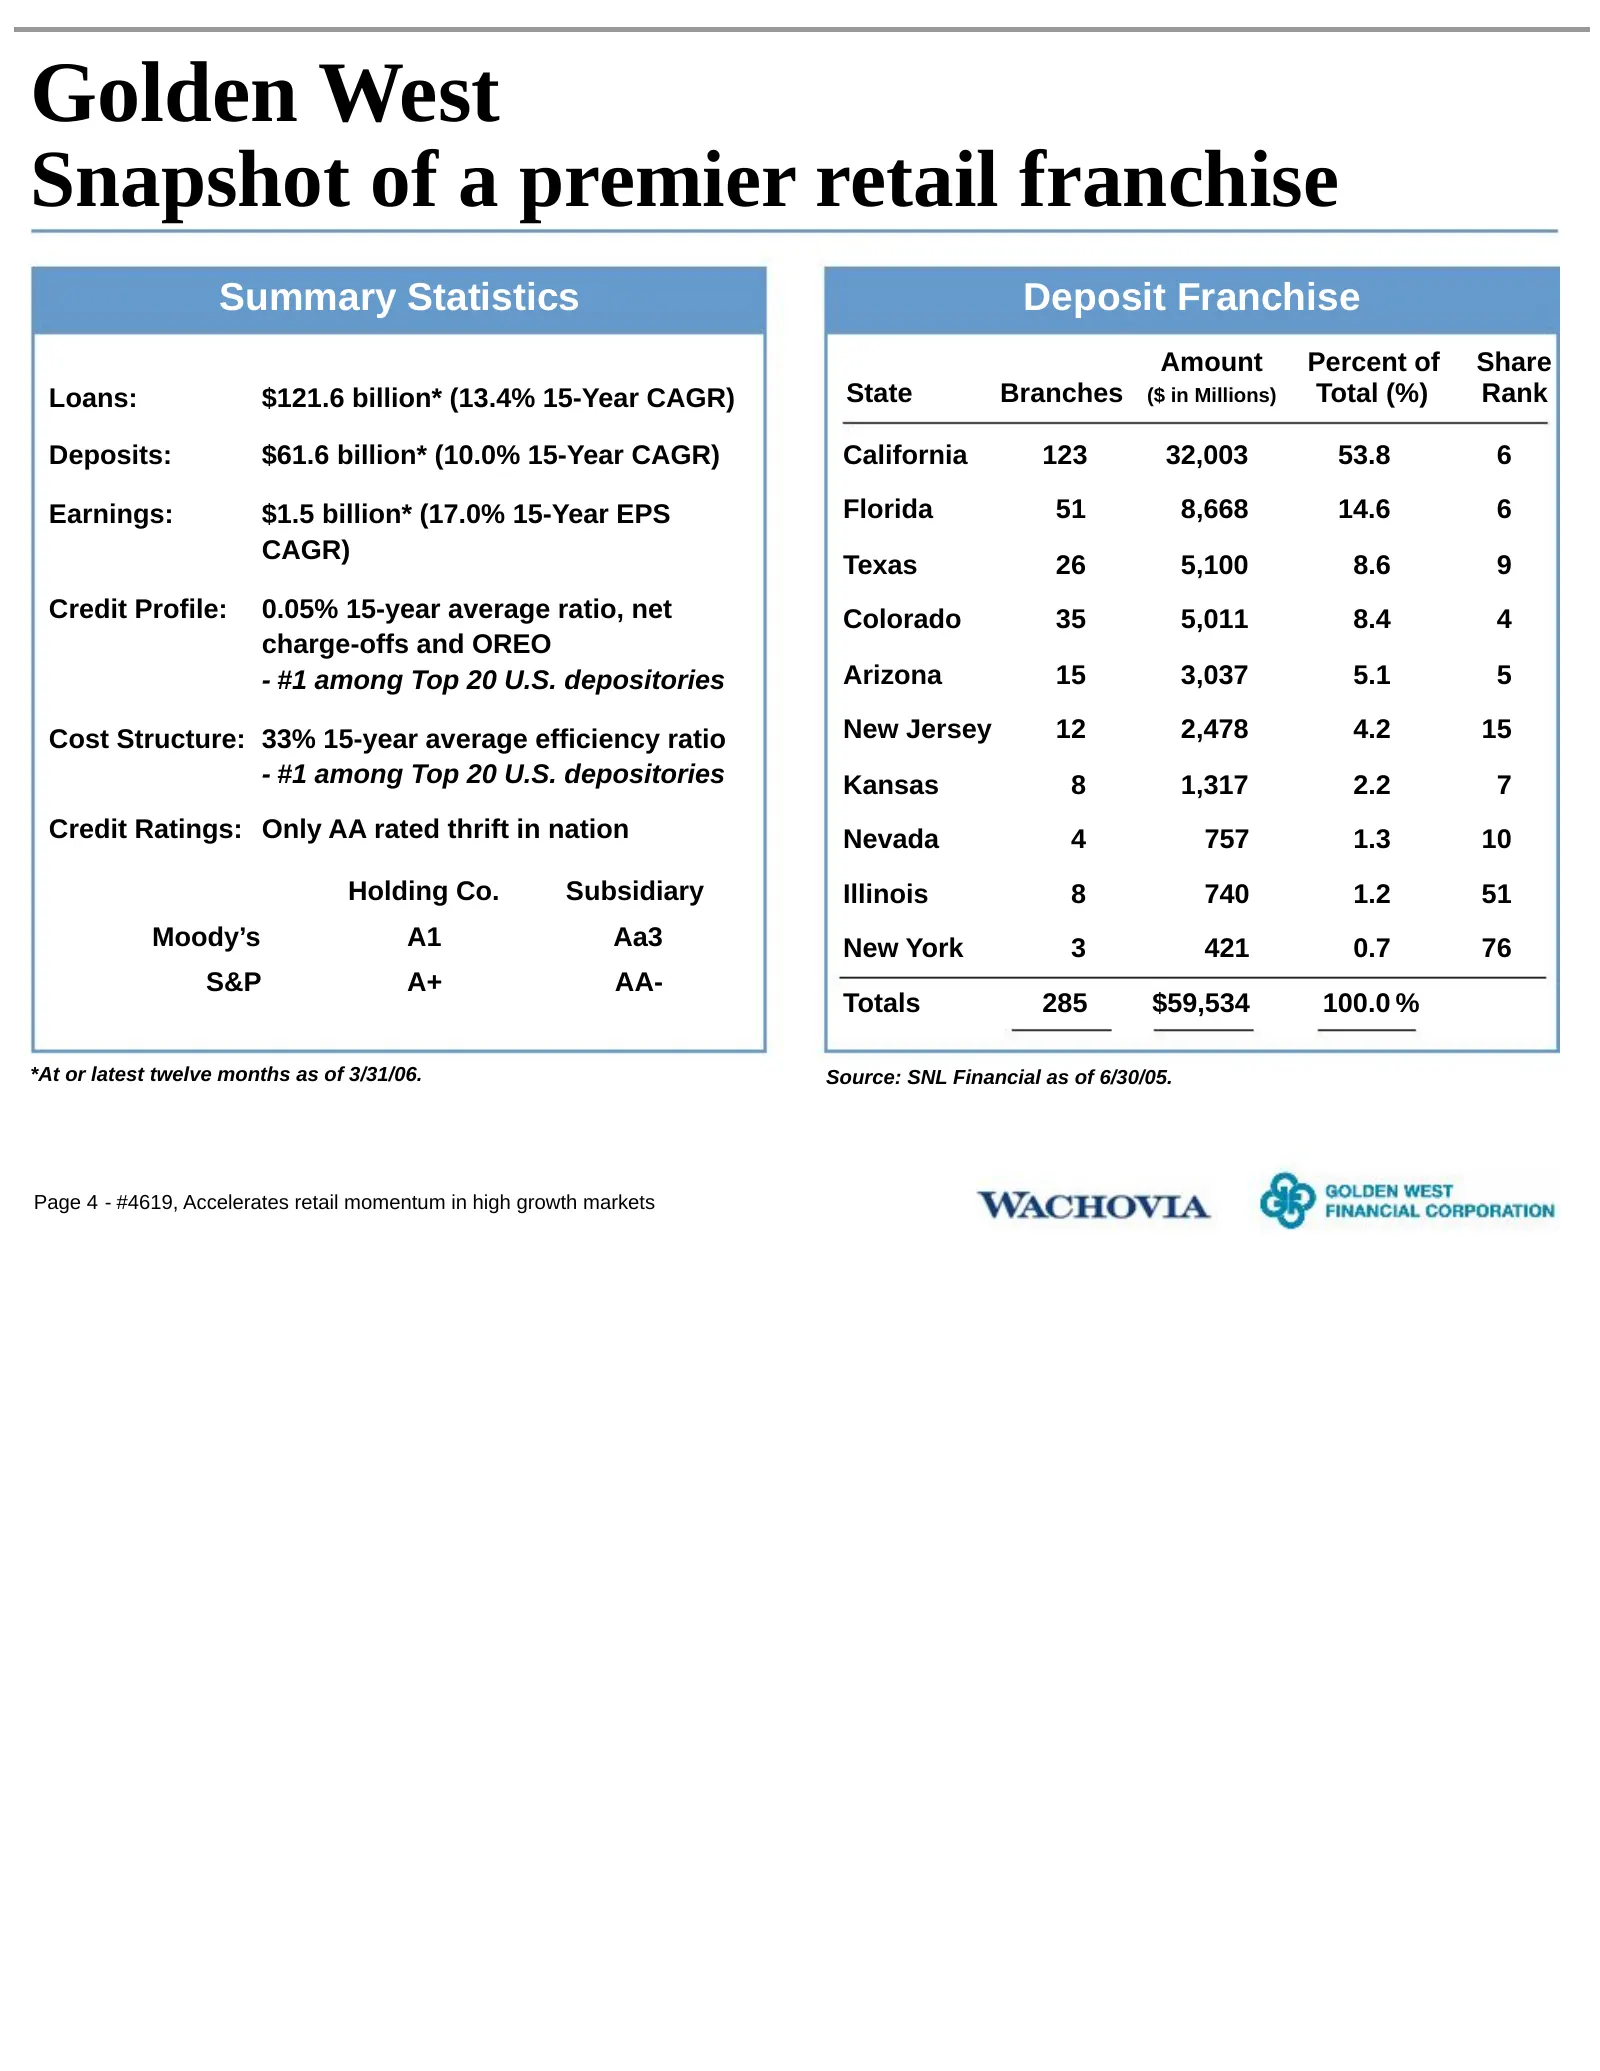
Golden West Snapshot of a premier retail franchise Summary Statistics Deposit Franchise Amount Percent of Share Loans: $121.6 billion* (13.4% 15-Year CAGR) State Branches ($ in Millions) Total (%) Rank Deposits: $61.6 billion* (10.0% 15-Year CAGR) California 123 32,003 53.8 6 Earnings: $1.5 billion*
Slide 6: Golden West: Strong national retail mortgage presence
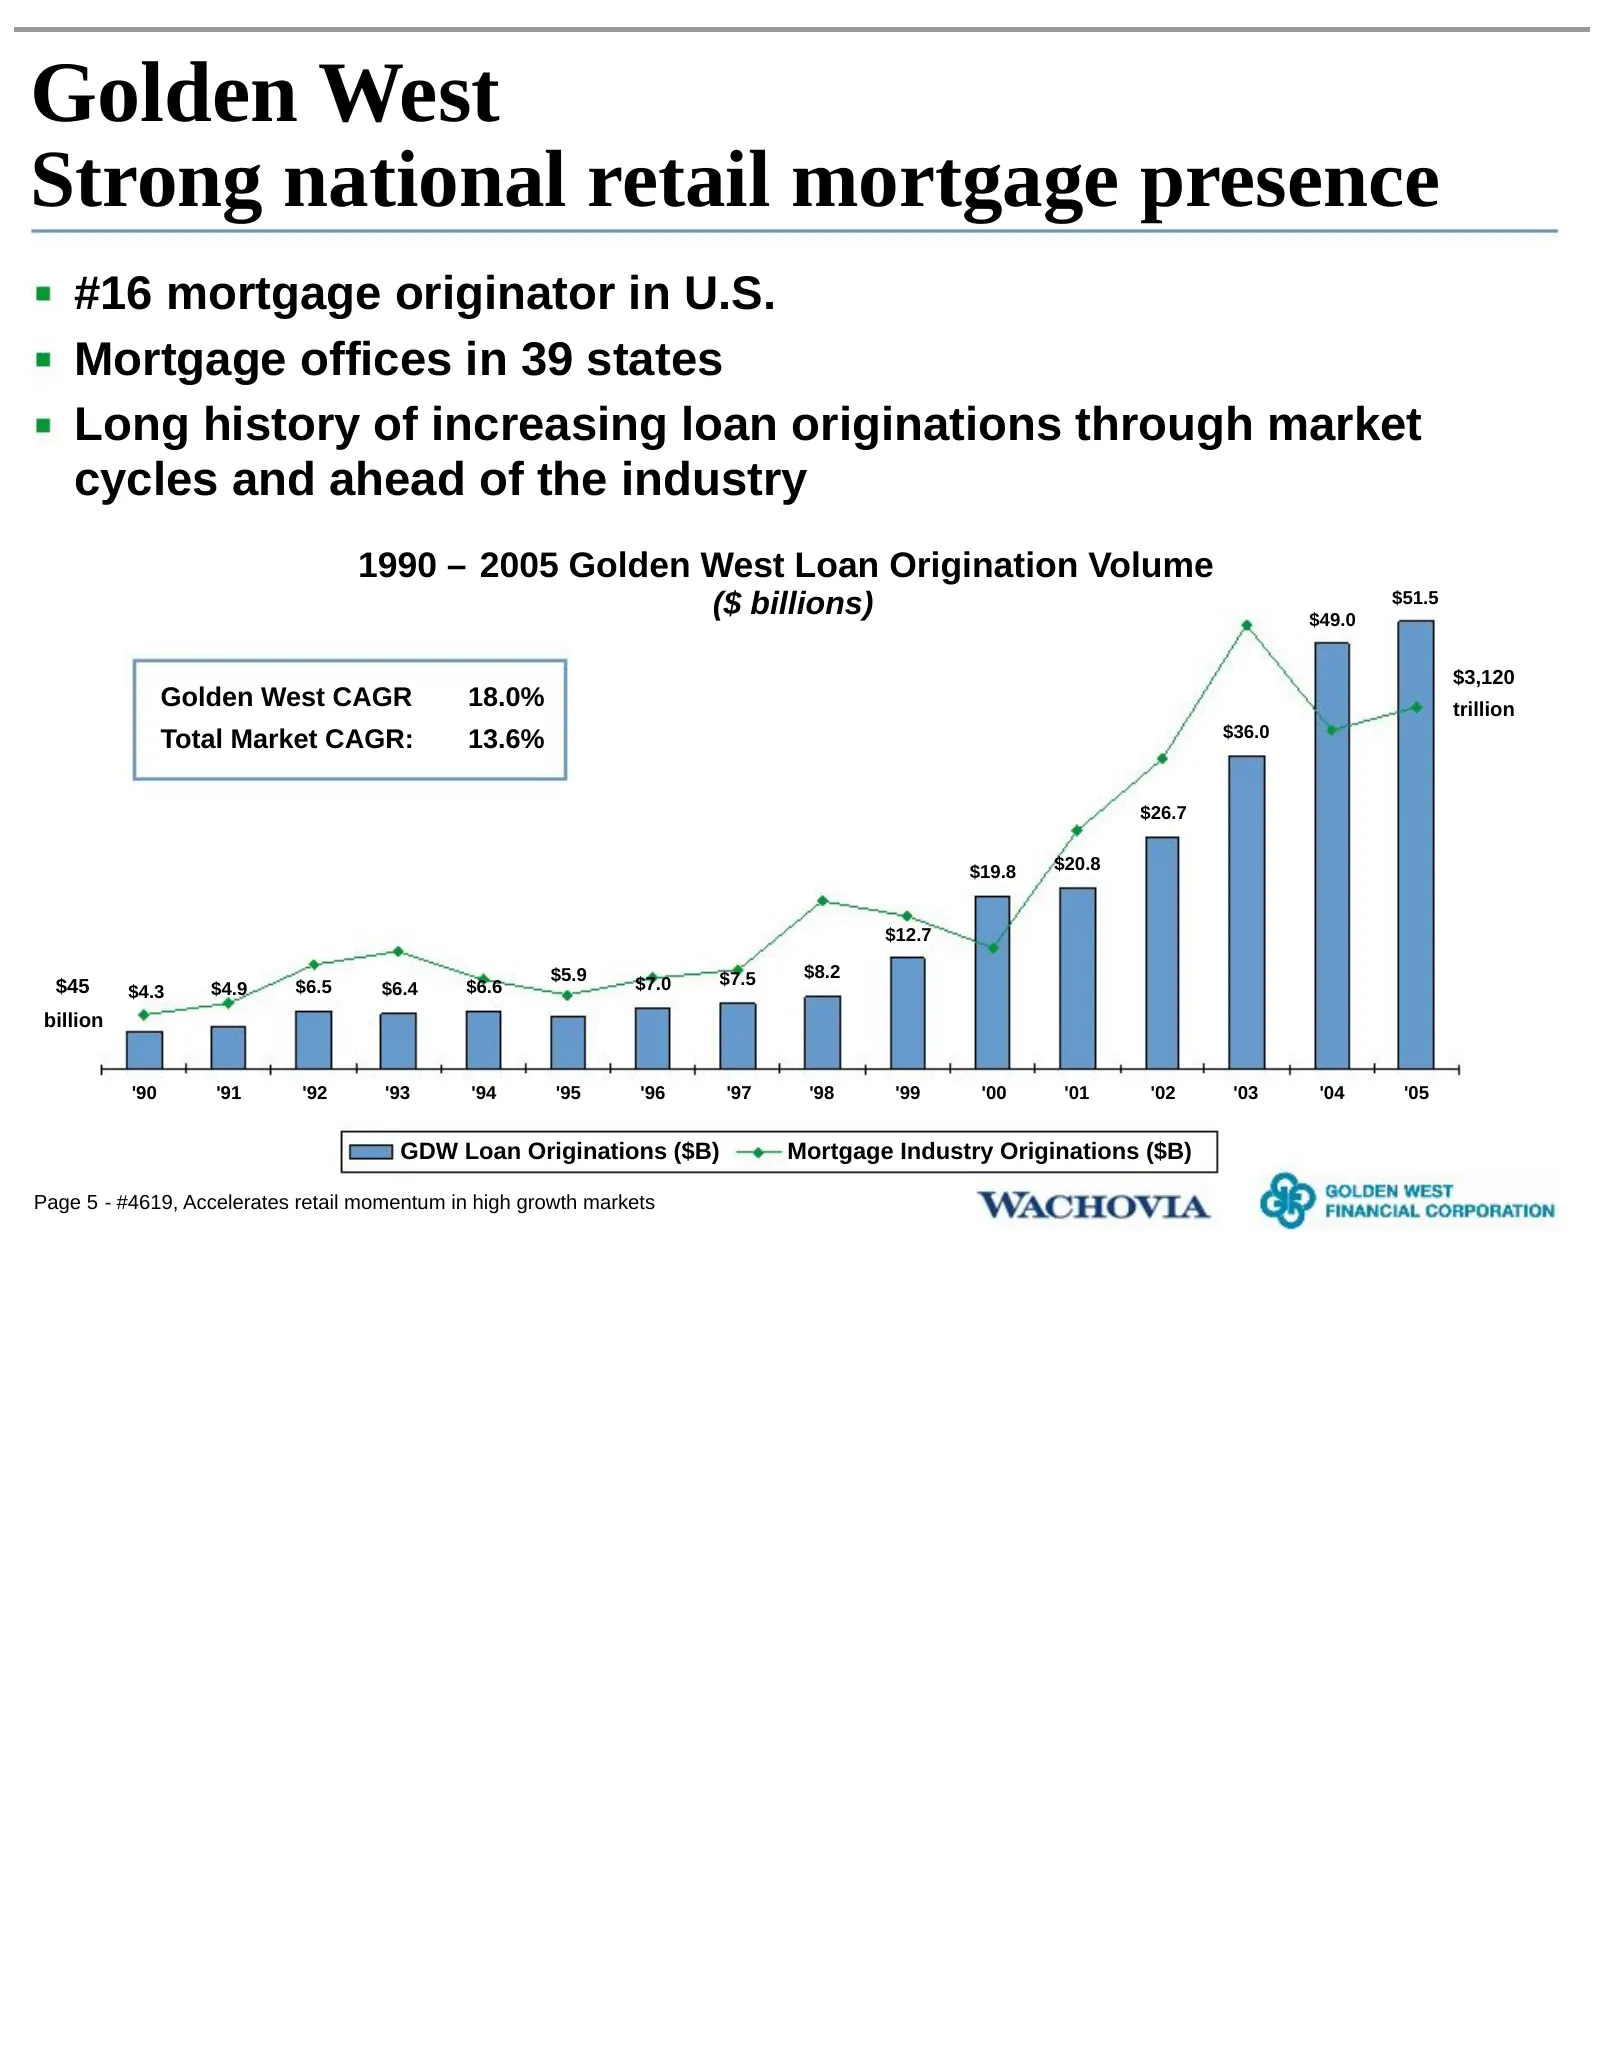
Golden West Strong national retail mortgage presence #16 mortgage originator in U.S. Mortgage offices in 39 states Long history of increasing loan originations through market cycles and ahead of the industry 1990 – 2005 Golden West Loan Origination Volume ($ billions) $49.0 $51.5 $3,120 Golden West
Slide 7: Golden West: Proven, low risk origination model
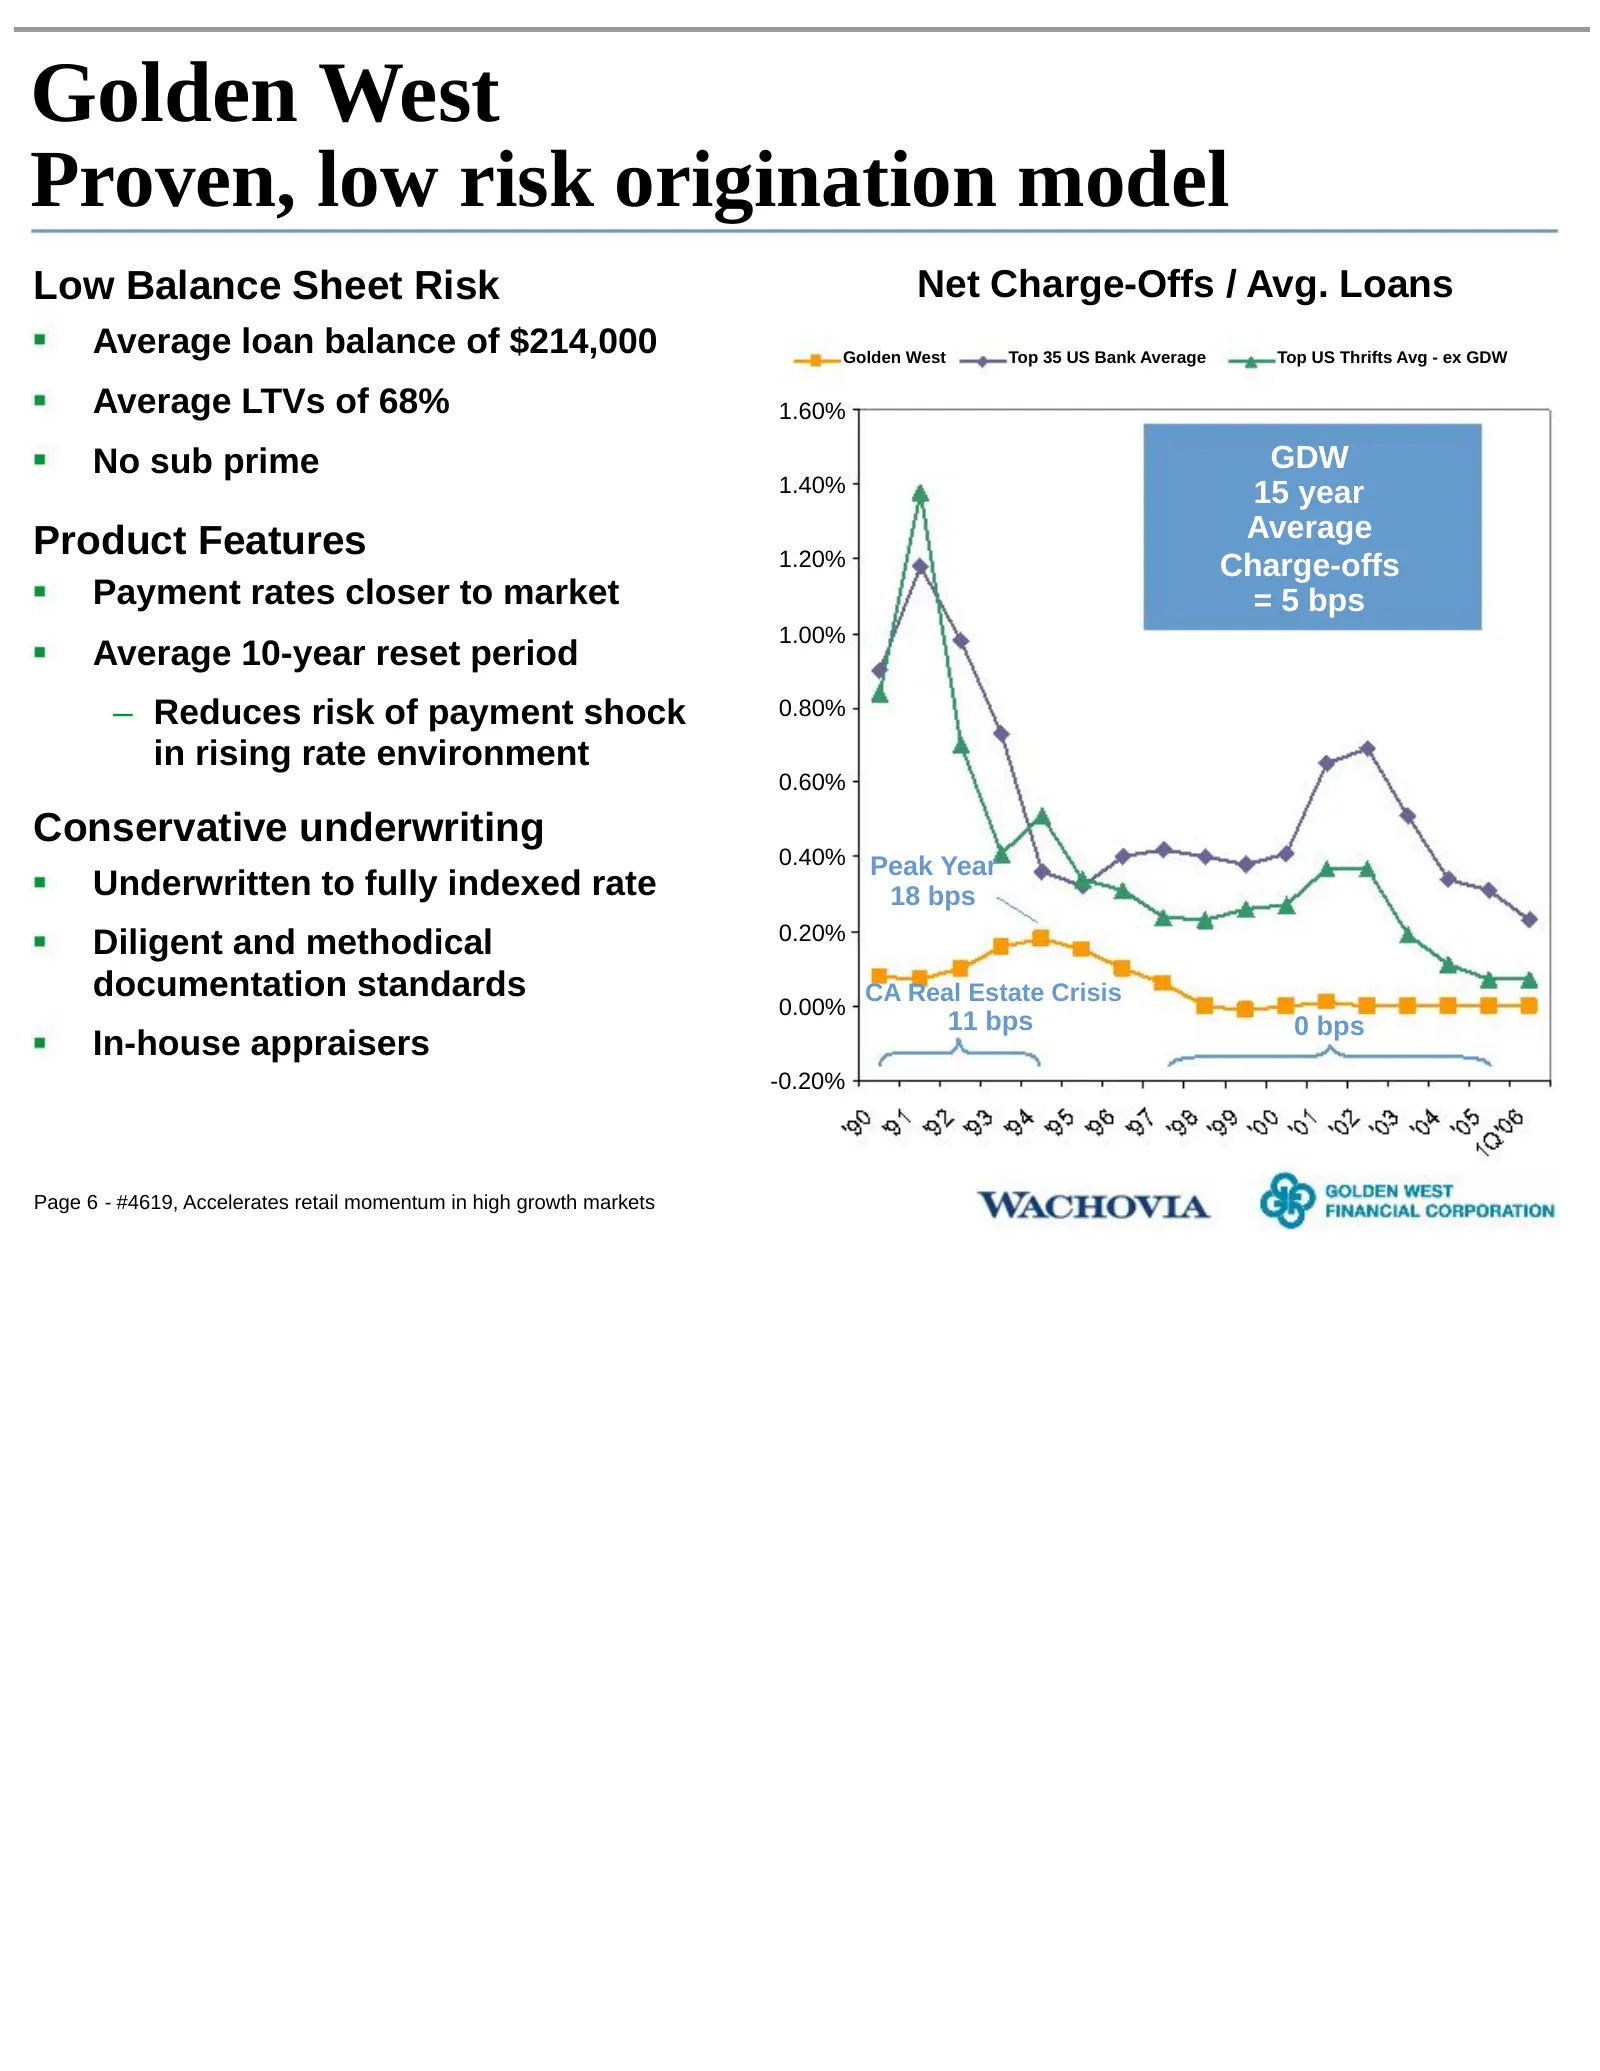
Golden West Proven, low risk origination model Low Balance Sheet Risk Net Charge-Offs / Avg. Loans Average loan balance of $214,000 Golden West Top 35 US Bank Average Top US Thrifts Avg - ex GDW Average LTVs of 68% 1.60% No sub prime GDW 1.40% 15 year Product Features Average 1.20% Charge-offs Payme
Slide 8: Combination strengthens Wachovia's retail franchise, business mix and growth profile
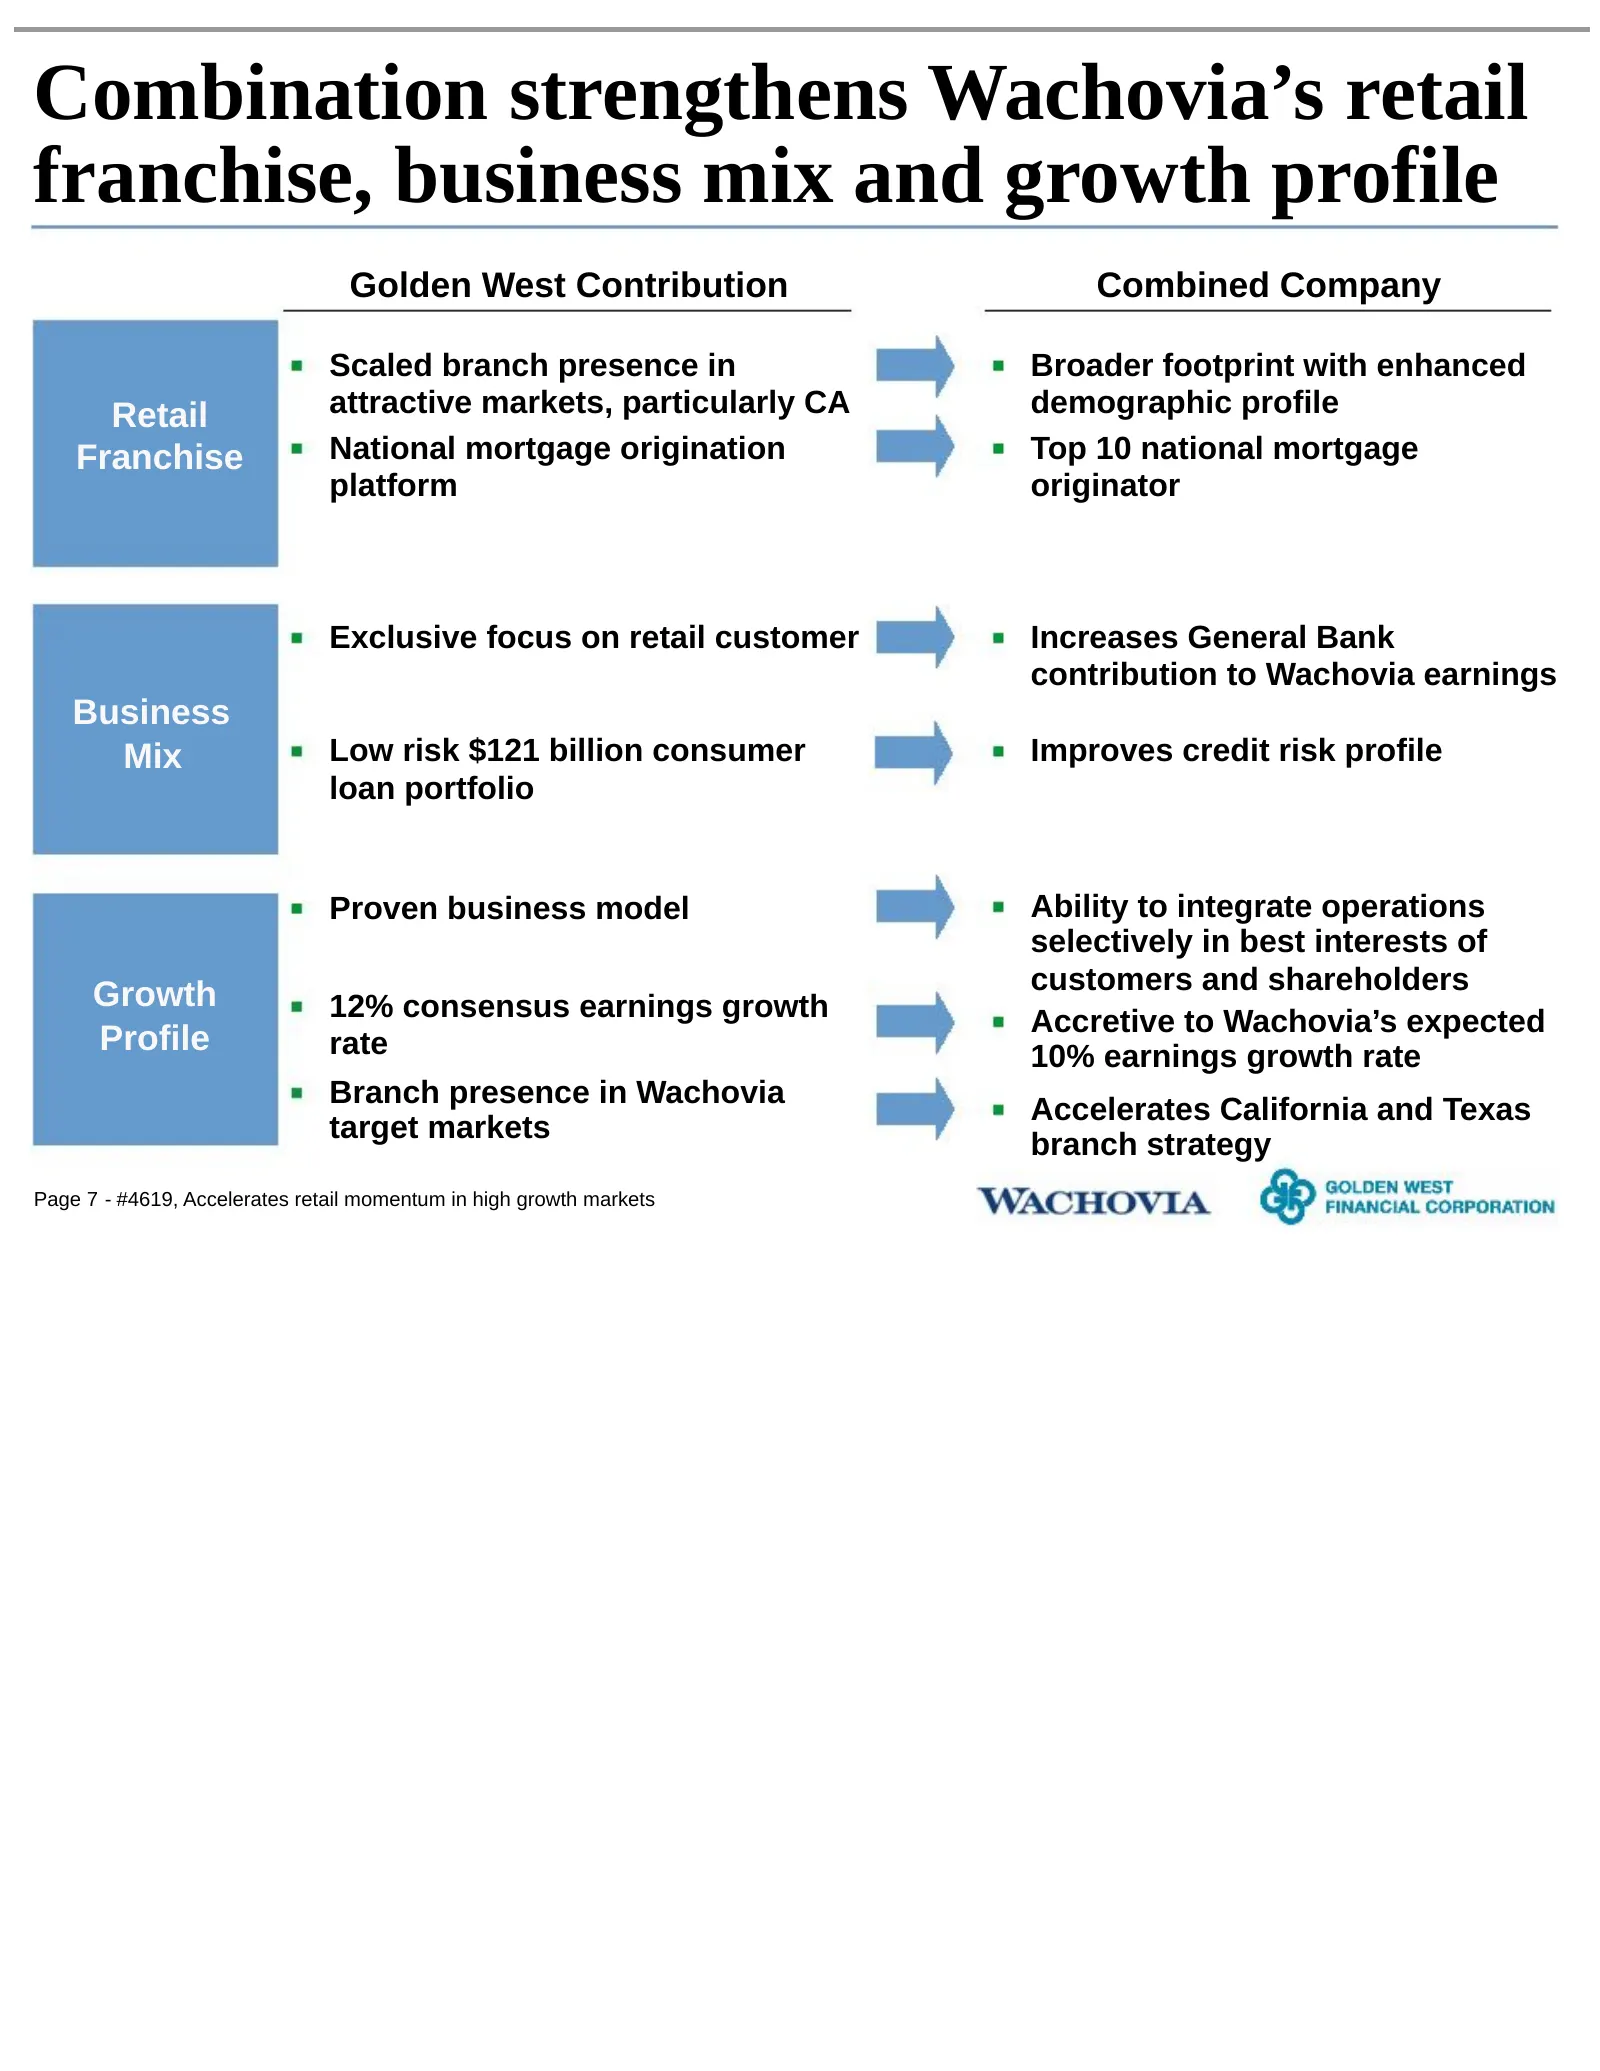
Combination strengthens Wachovia’s retail franchise, business mix and growth profile Golden West Contribution Combined Company Scaled branch presence in Broader footprint with enhanced Retail attractive markets, particularly CA demographic profile Franchise National mortgage origination Top 10 natio
Slide 9: Combination further strengthens retail franchise and enhances demographics
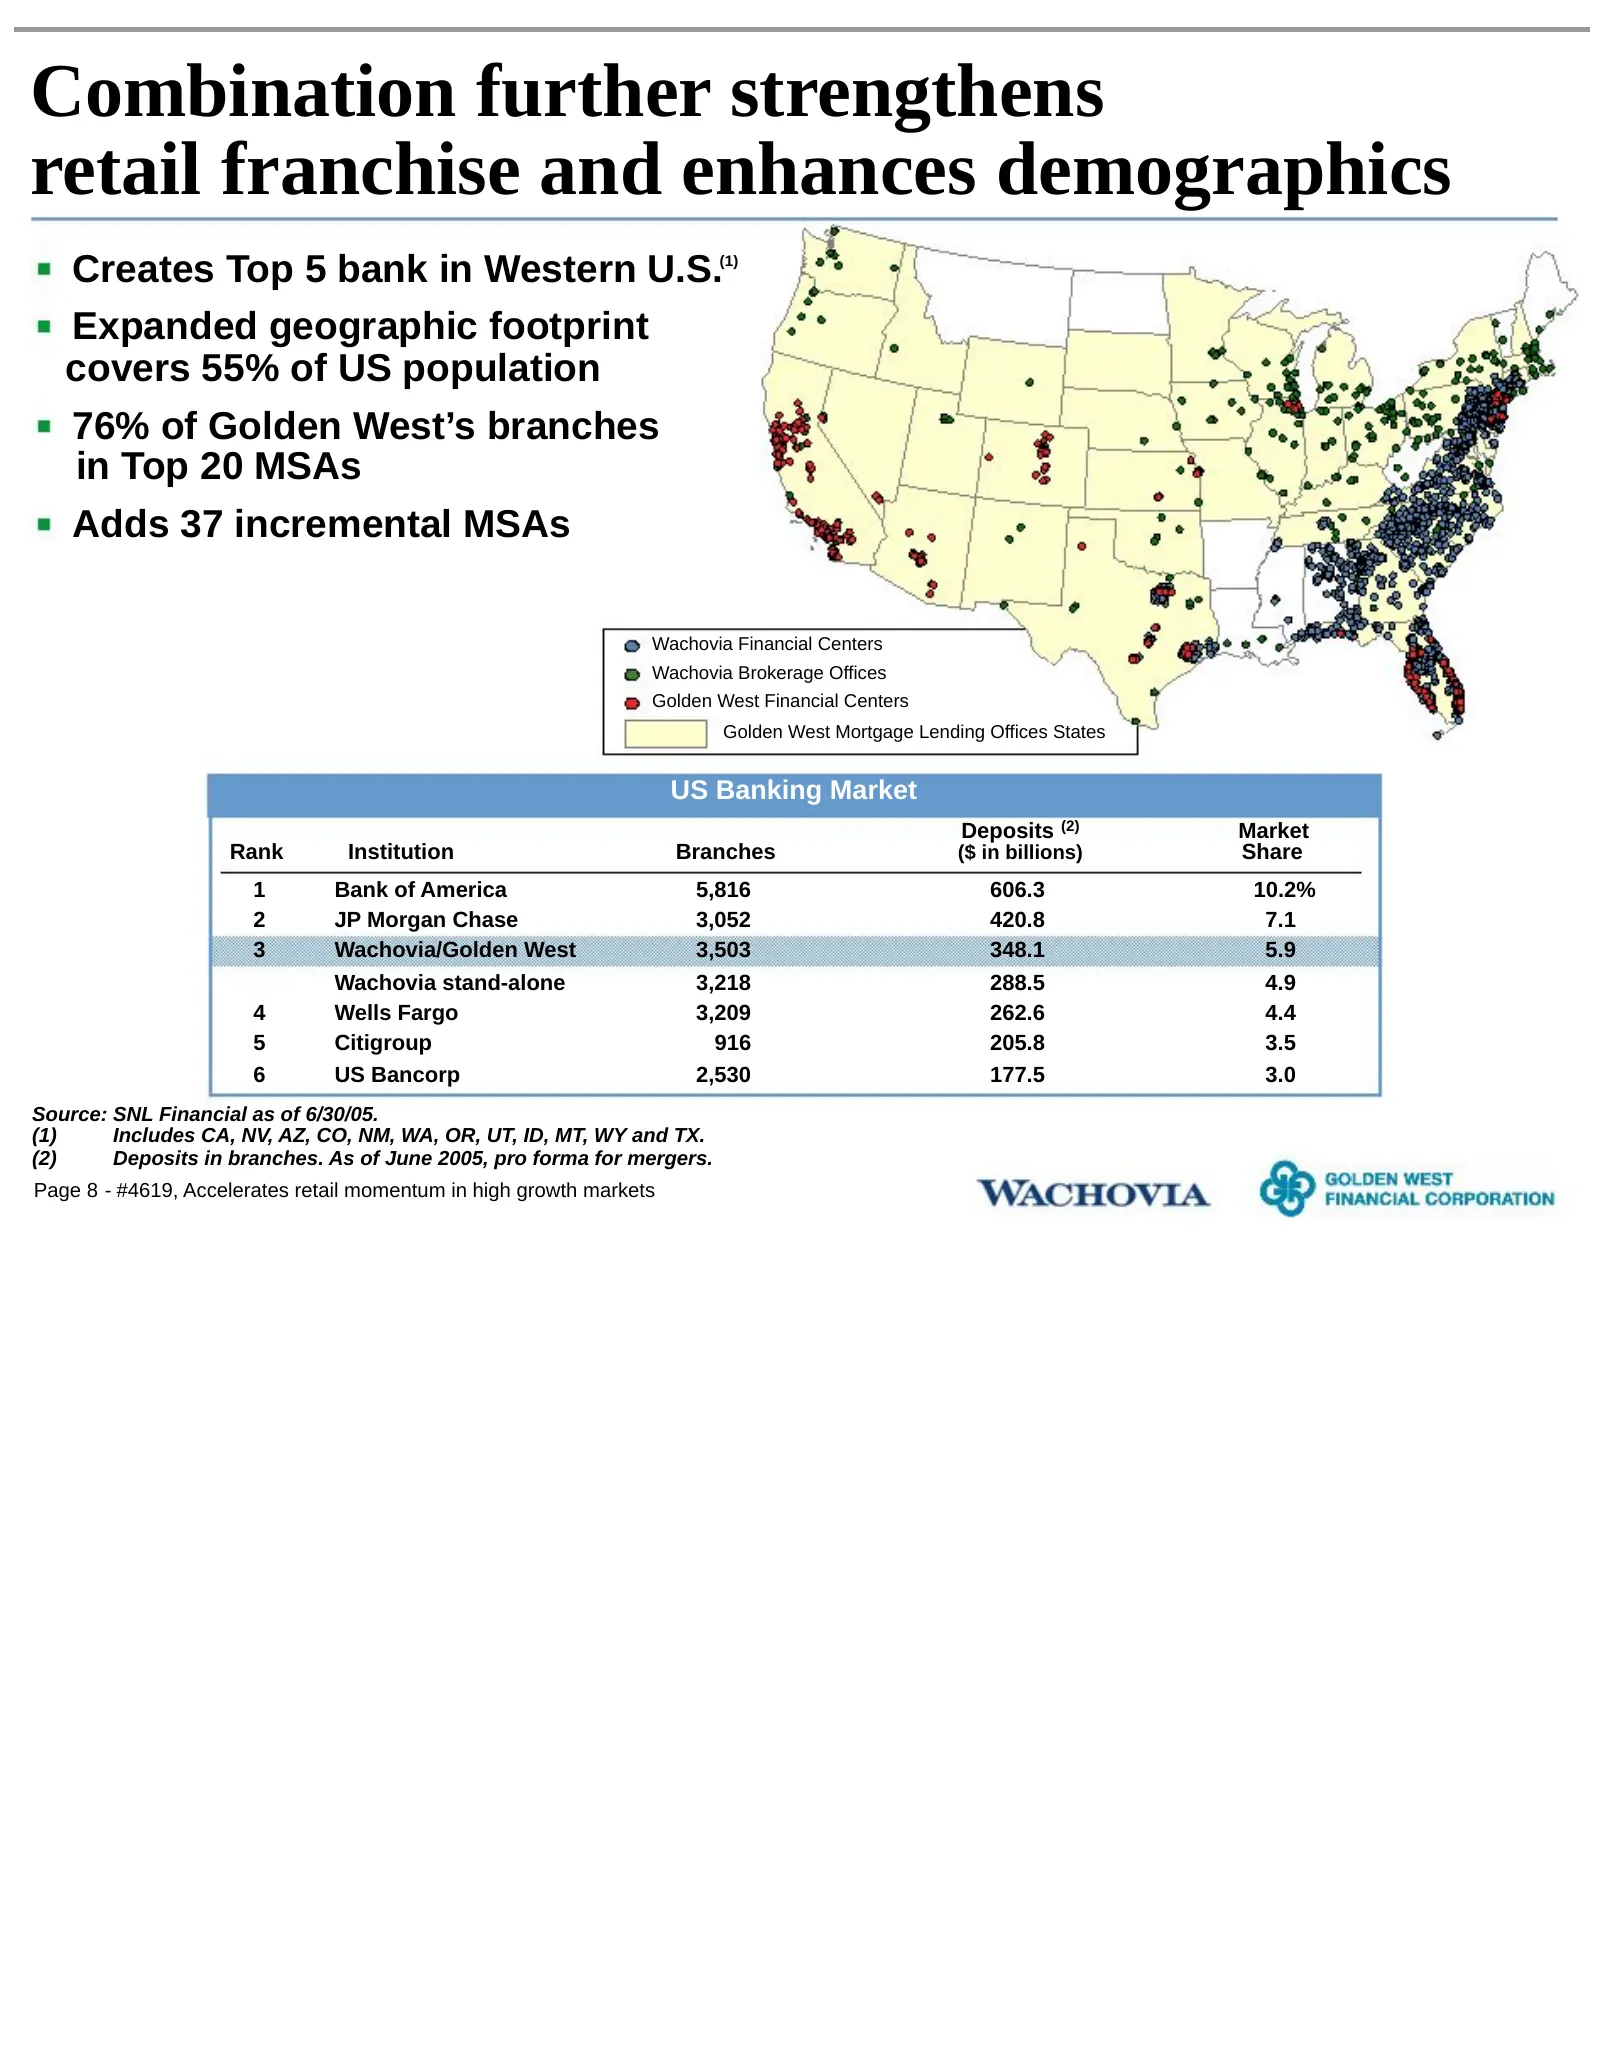
Combination further strengthens retail franchise and enhances demographics Creates Top 5 bank in Western U.S. (1) Expanded geographic footprint covers 55% of US population 76% of Golden West’s branches in Top 20 MSAs Adds 37 incremental MSAs Wachovia Financial Centers Wachovia Brokerage Offices Gold
Slide 10: Combination further strengthens retail franchise and enhances demographics
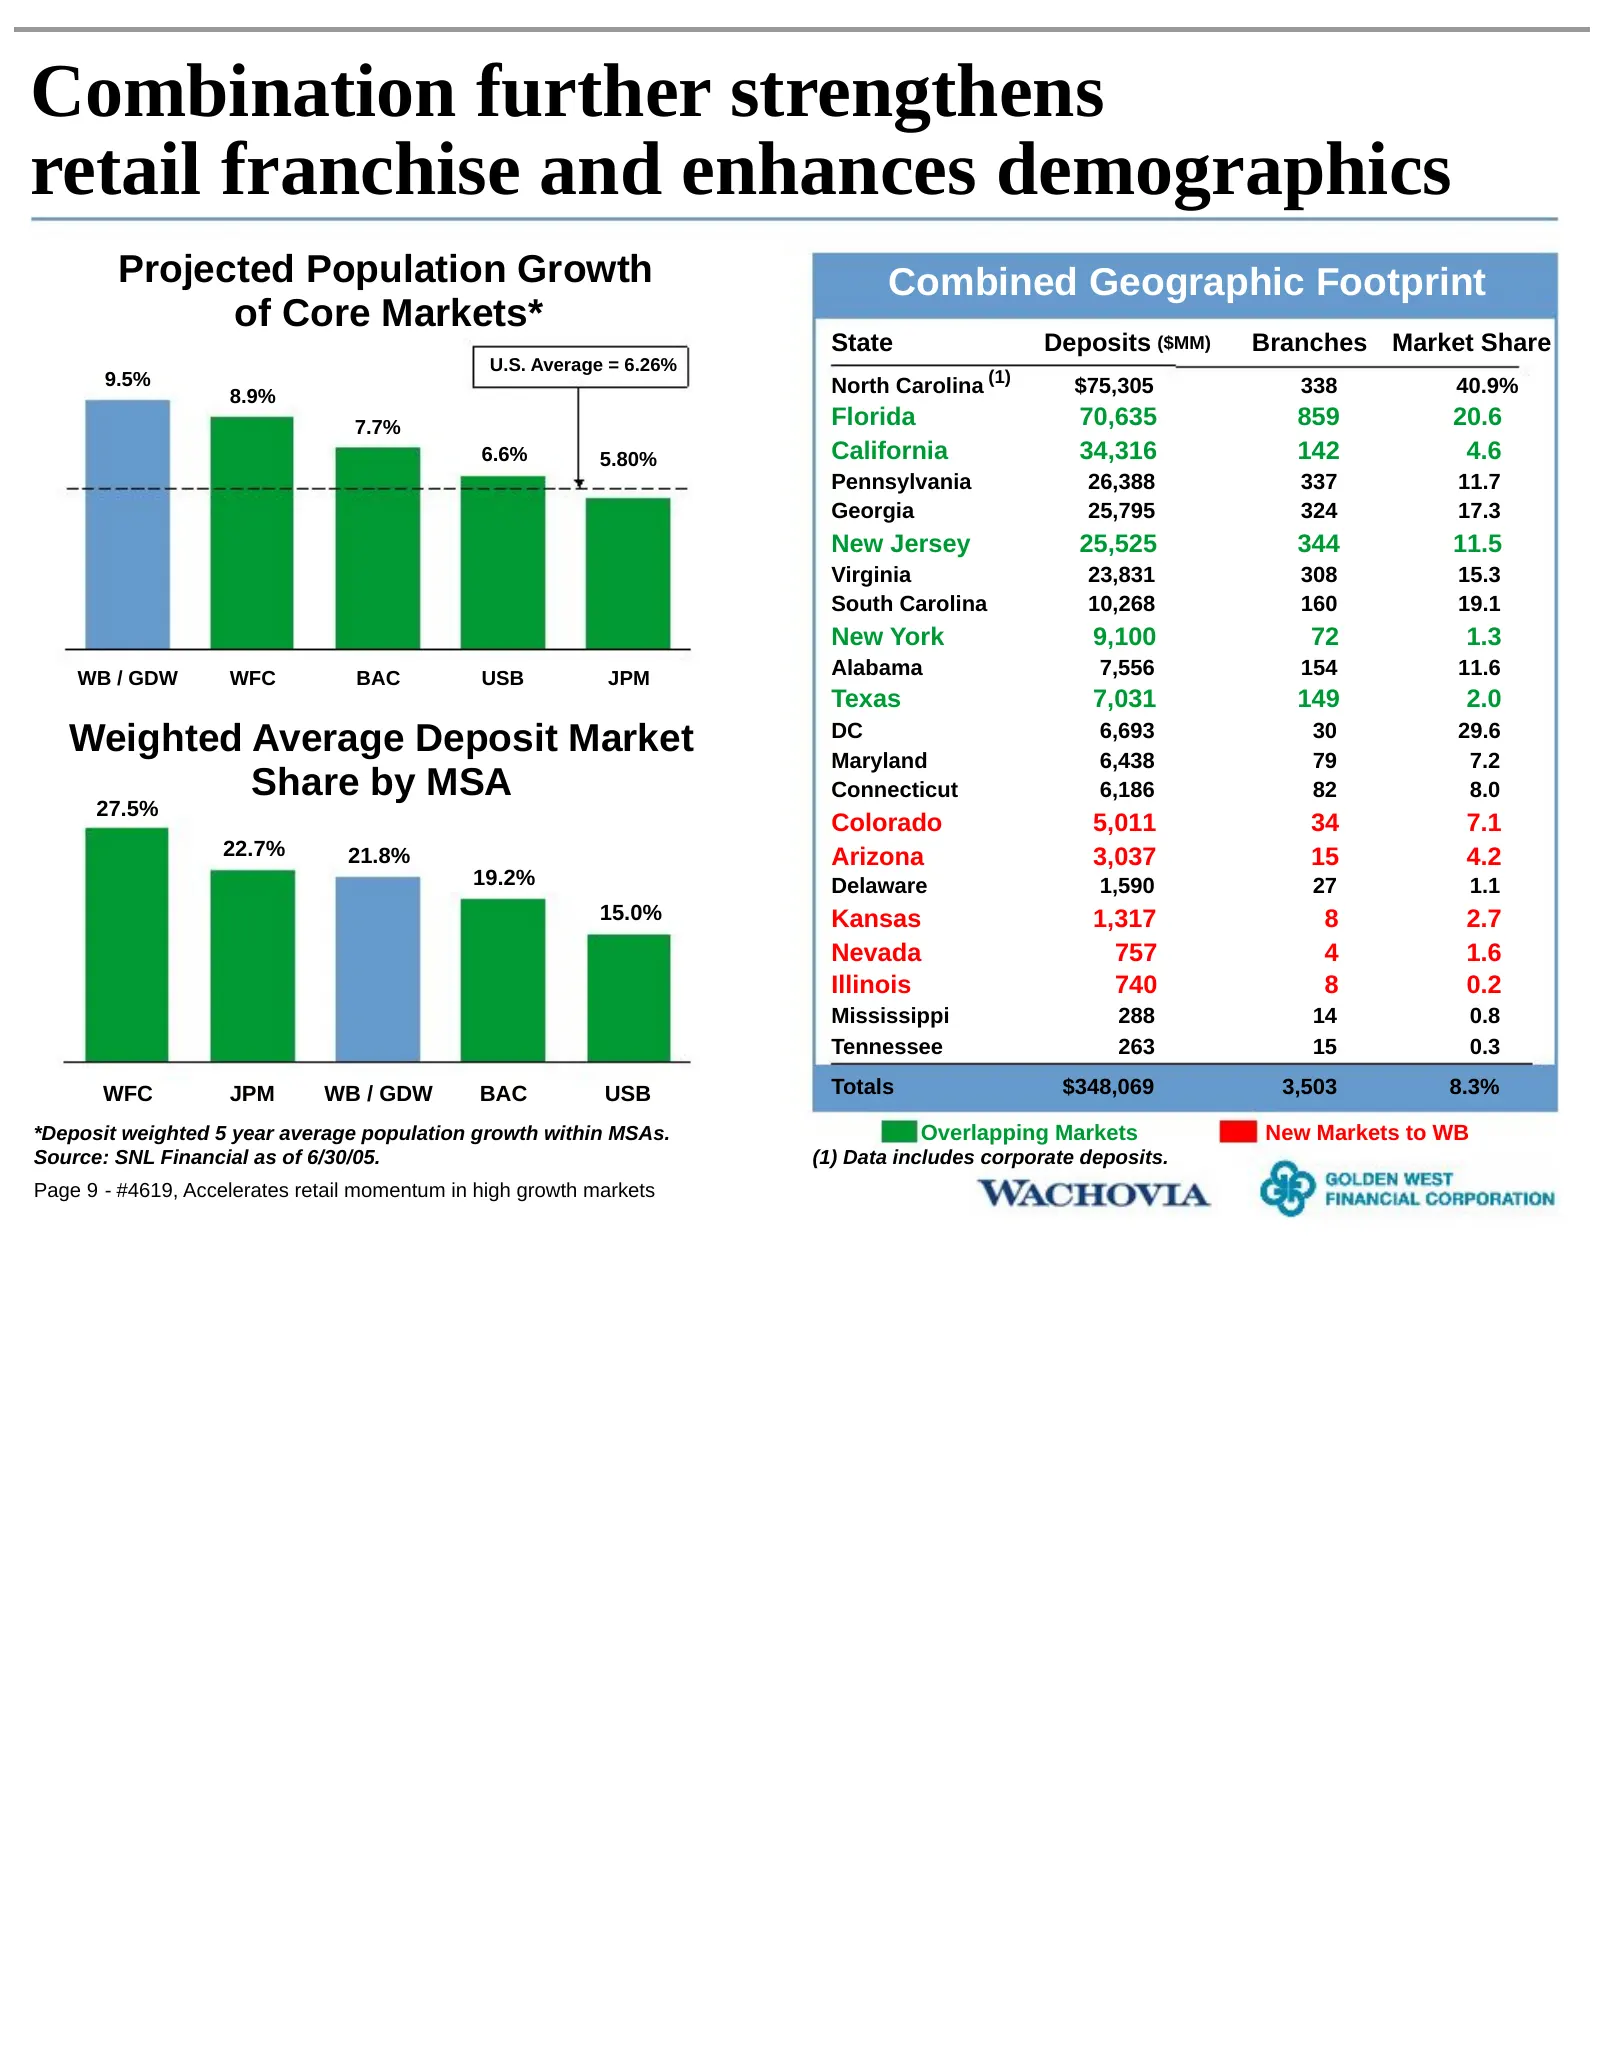
Combination further strengthens retail franchise and enhances demographics Projected Population Growth Combined Geographic Footprint of Core Markets* State Deposits ($MM) Branches Market Share U.S. Average = 6.26% 9.5% (1) 8.9% North Carolina $75,305 338 40.9% 7.7% Florida 70,635 859 20.6 6.6% 5.80%
Slide 11: California presence accelerates branch expansion strategy
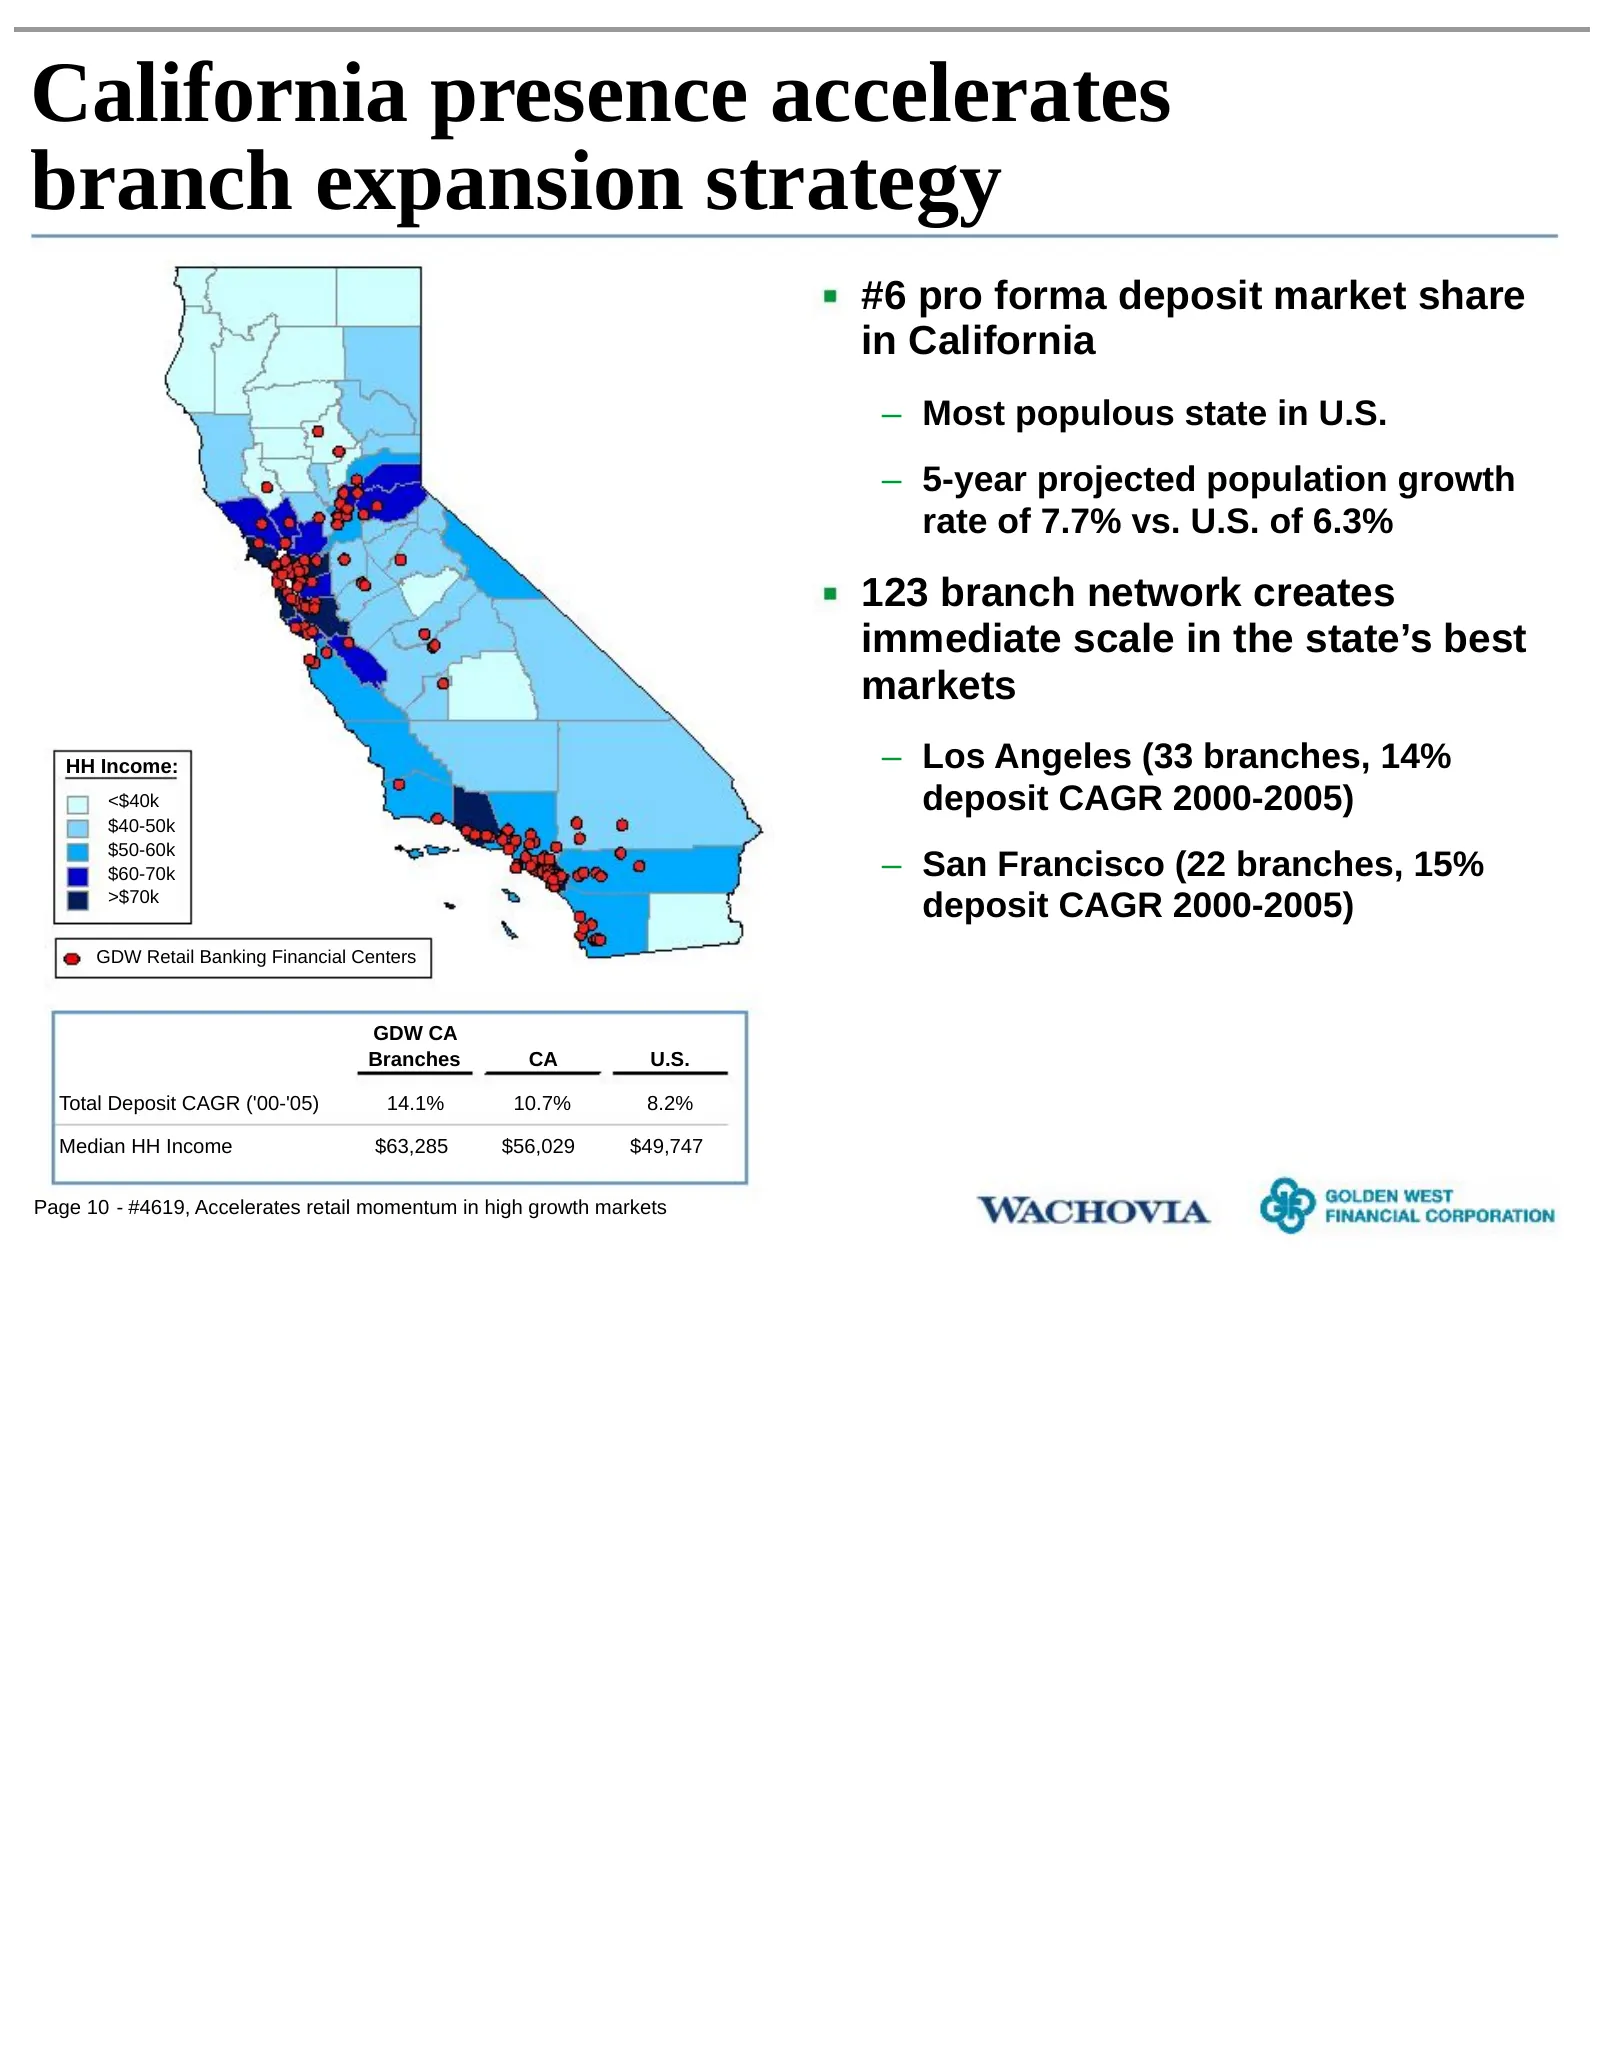
California presence accelerates branch expansion strategy #6 pro forma deposit market share in California – Most populous state in U.S. – 5-year projected population growth rate of 7.7% vs. U.S. of 6.3% 123 branch network creates immediate scale in the state’s best markets HH Income: – Los Angeles (
Slide 12: Increases contribution of traditional banking businesses
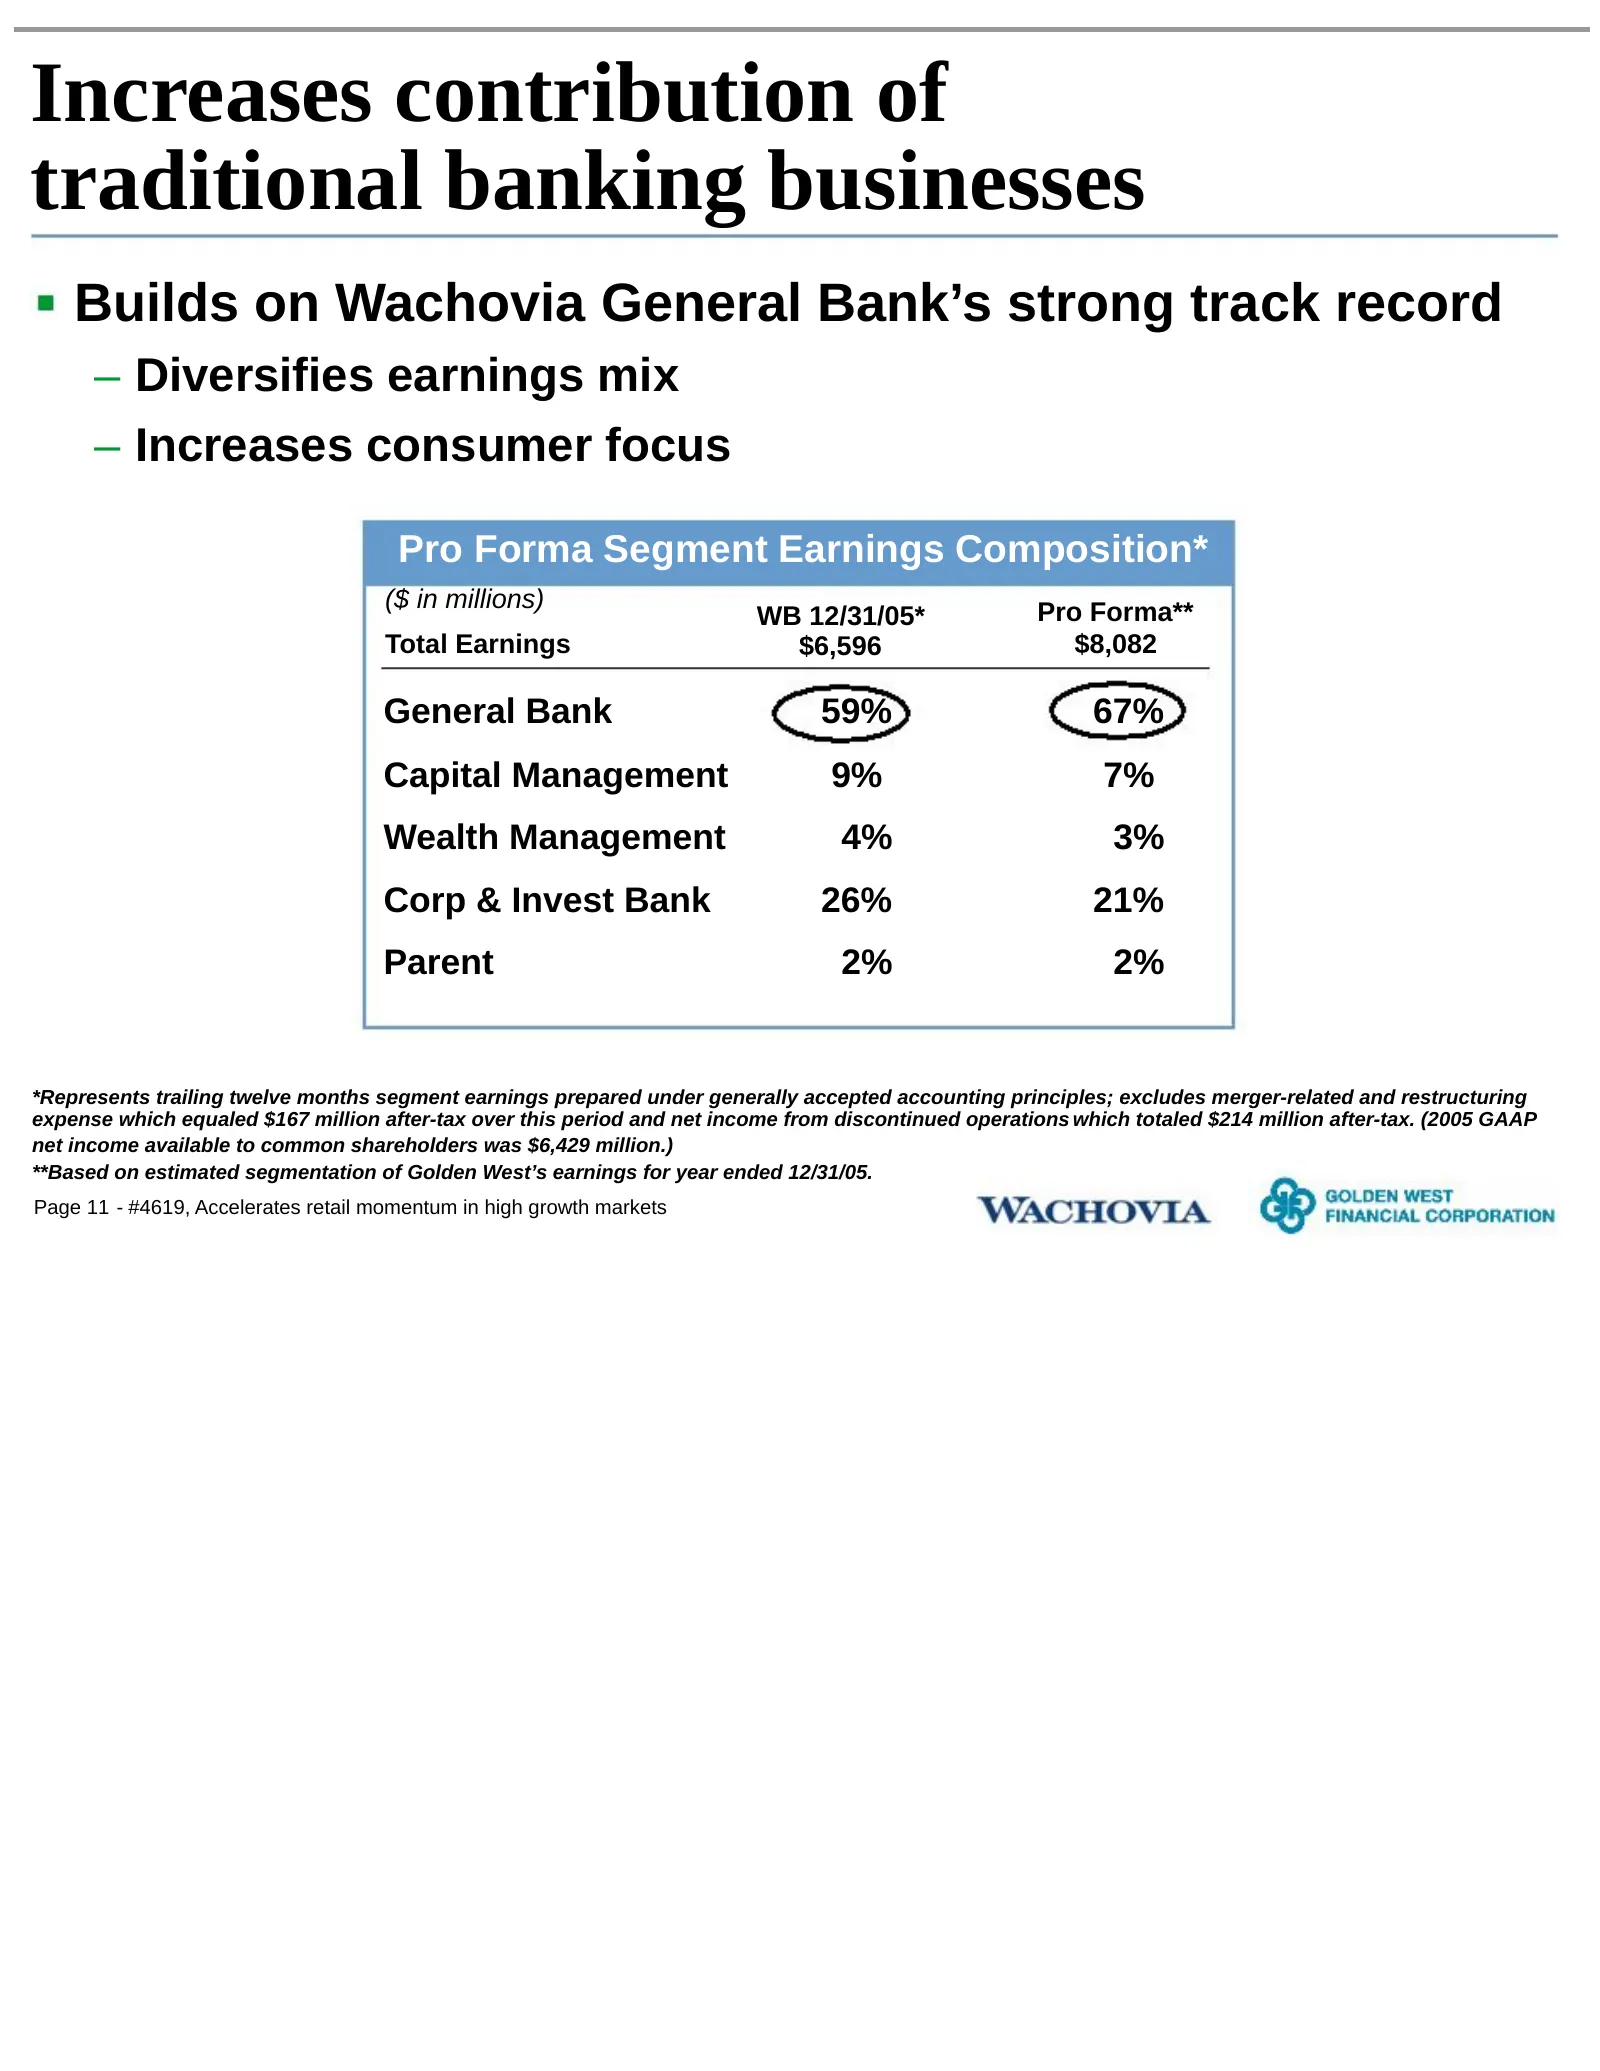
Increases contribution of traditional banking businesses Builds on Wachovia General Bank’s strong track record – Diversifies earnings mix – Increases consumer focus Pro Forma Segment Earnings Composition* ($ in millions) Pro Forma** WB 12/31/05* Total Earnings $6,596 $8,082 General Bank 59% 67% Capi
Slide 13: Building on the General Bank's momentum
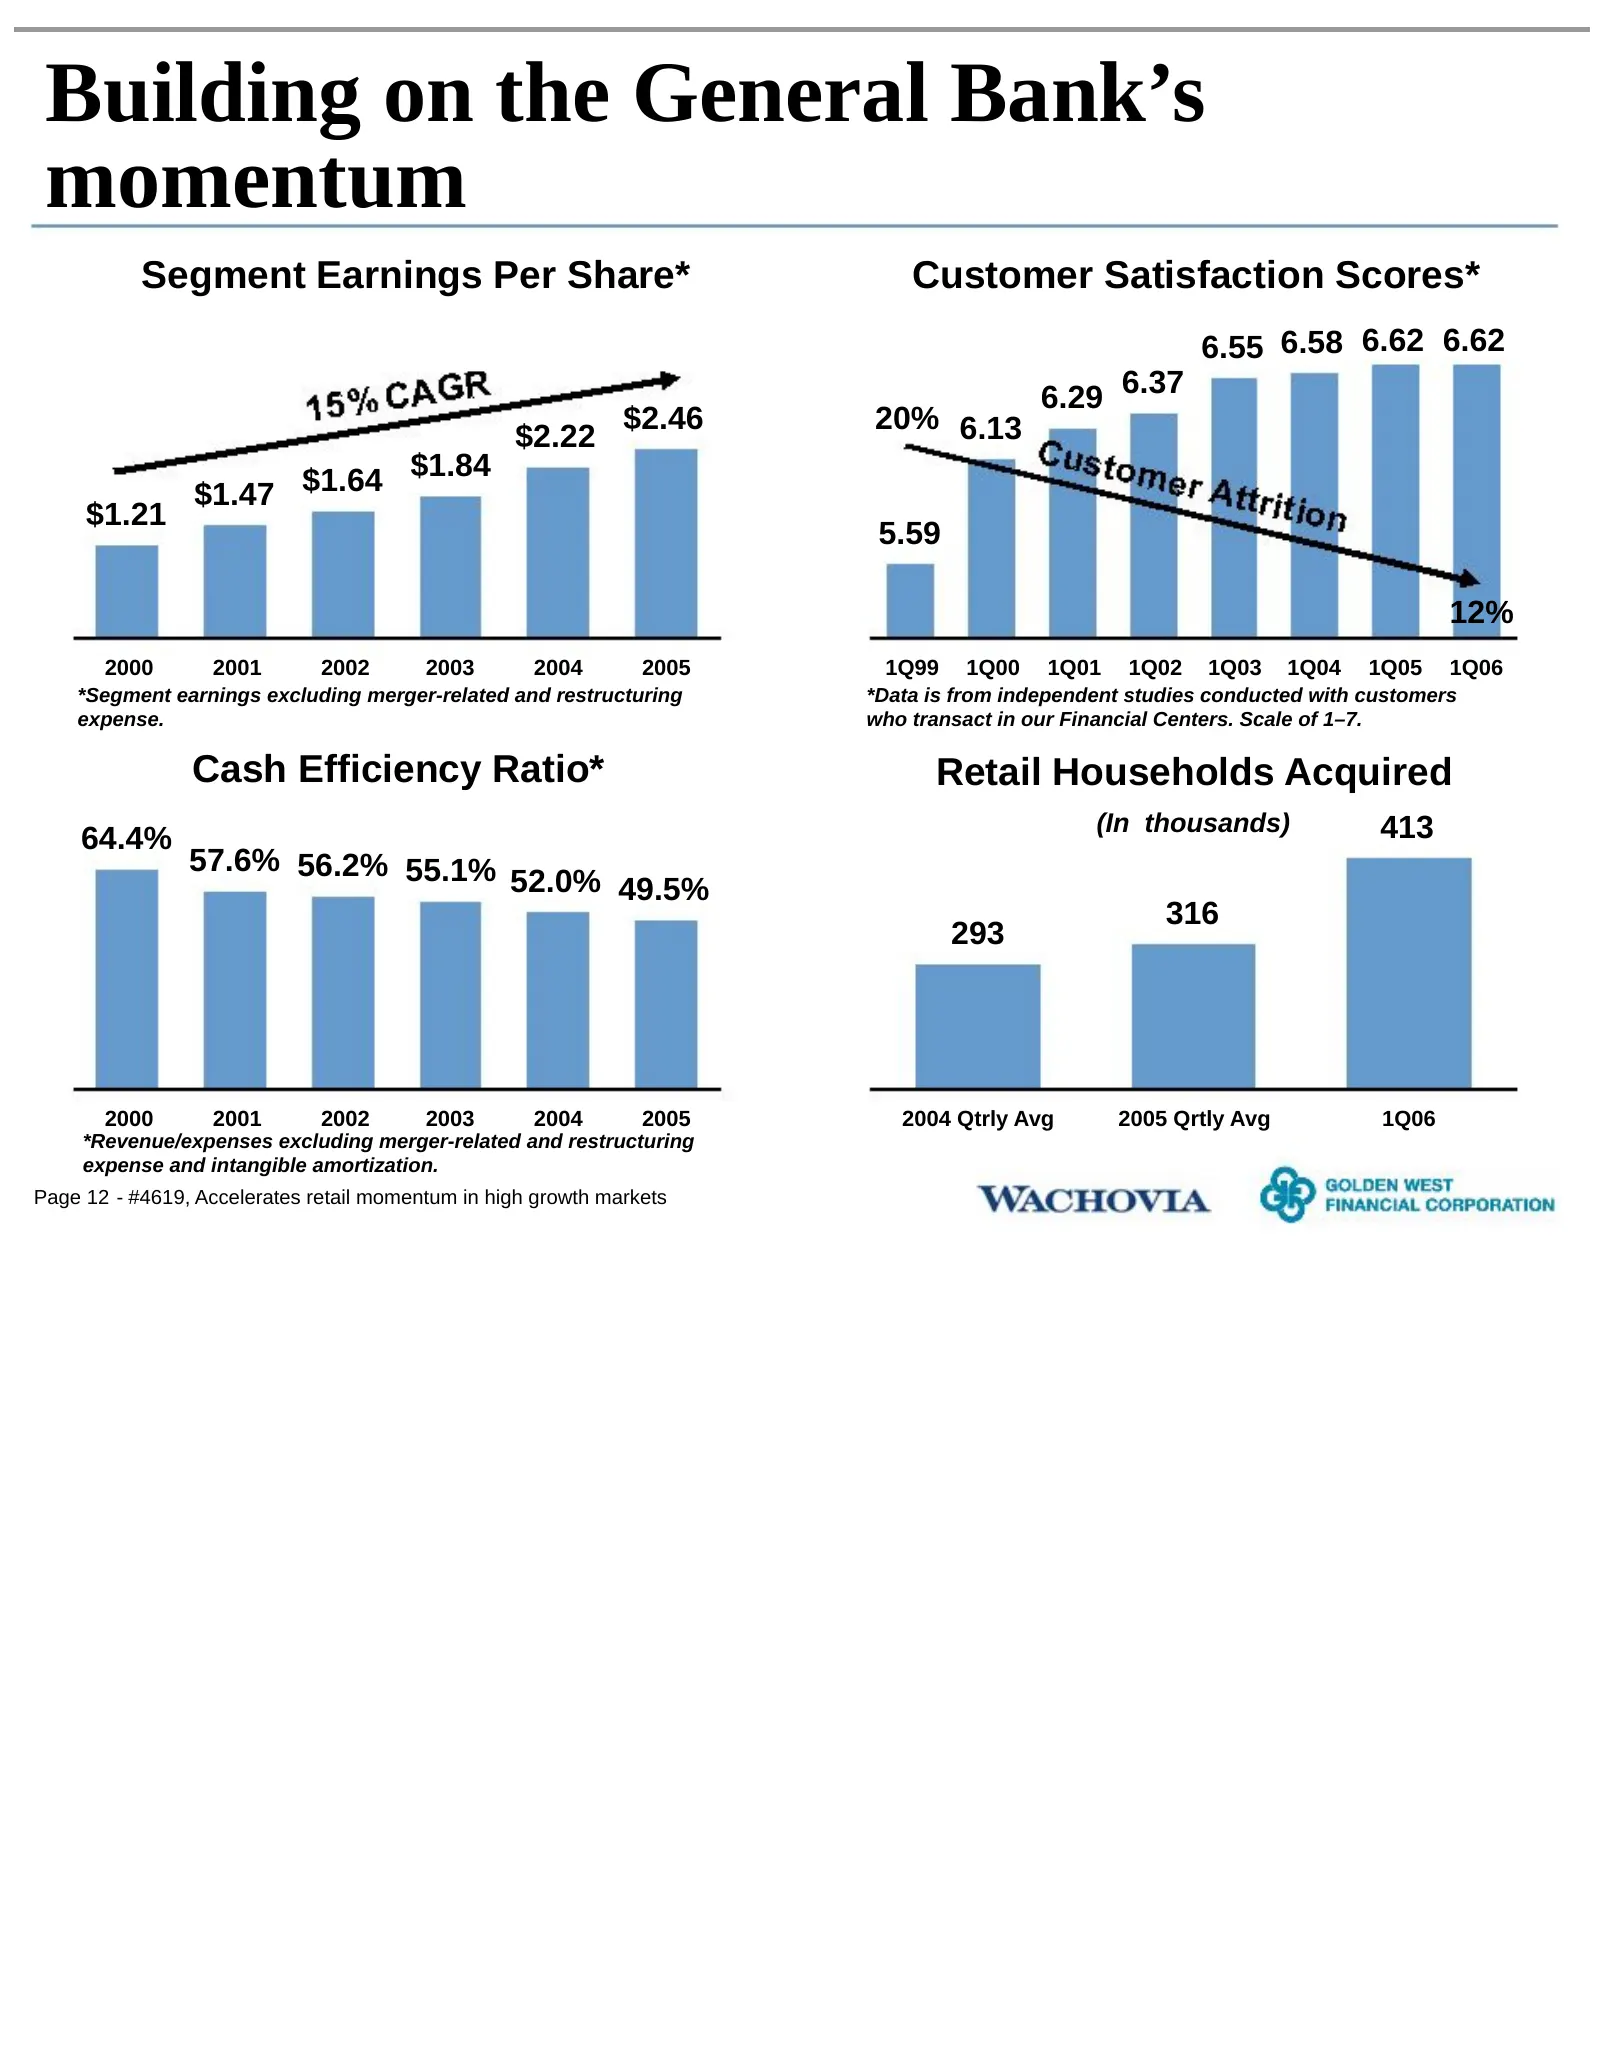
Building on the General Bank’s momentum Segment Earnings Per Share* Customer Satisfaction Scores* 6.55 6.58 6.62 6.62 6.29 6.37 $2.46 20% 6.13 $2.22 $1.84 $1.47 $1.64 $1.21 5.59 12% 2000 2001 2002 2003 2004 2005 1Q99 1Q00 1Q01 1Q02 1Q03 1Q04 1Q05 1Q06 *Segment earnings excluding merger-related and r
Slide 14: Leveraging GBG's broad product suite and powerful sales culture
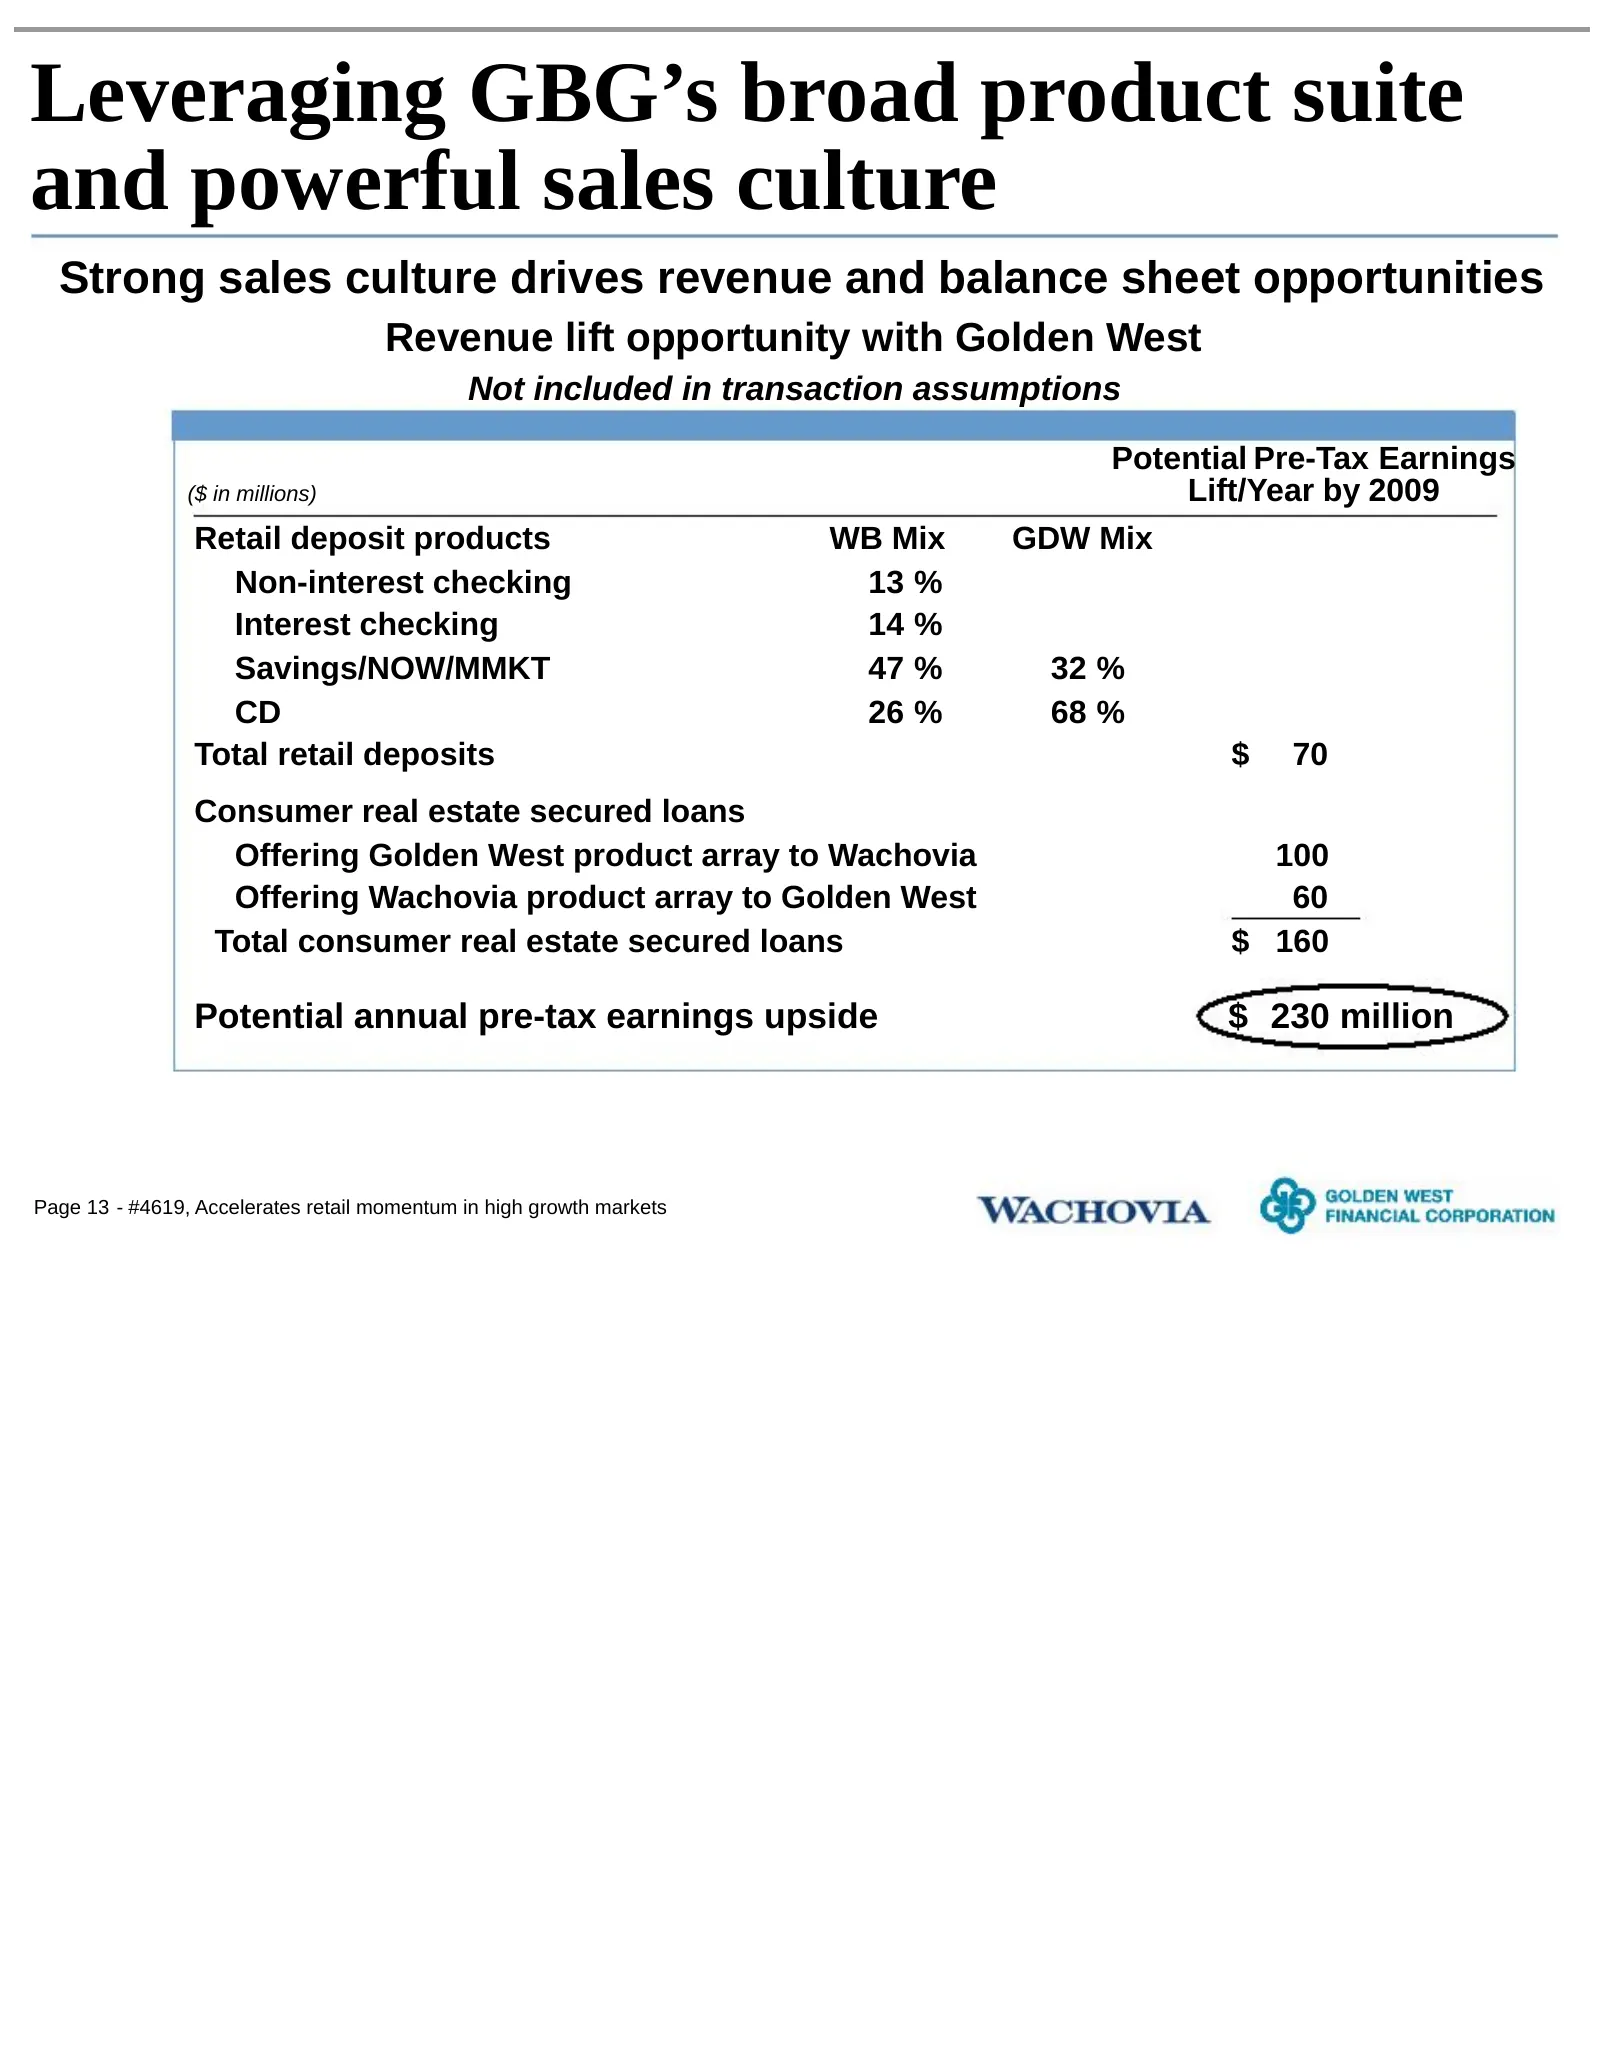
Leveraging GBG’s broad product suite and powerful sales culture Strong sales culture drives revenue and balance sheet opportunities Revenue lift opportunity with Golden West Not included in transaction assumptions Potential Pre-Tax Earnings ($ in millions) Lift/Year by 2009 Retail deposit products W
Slide 15: Financial assumptions
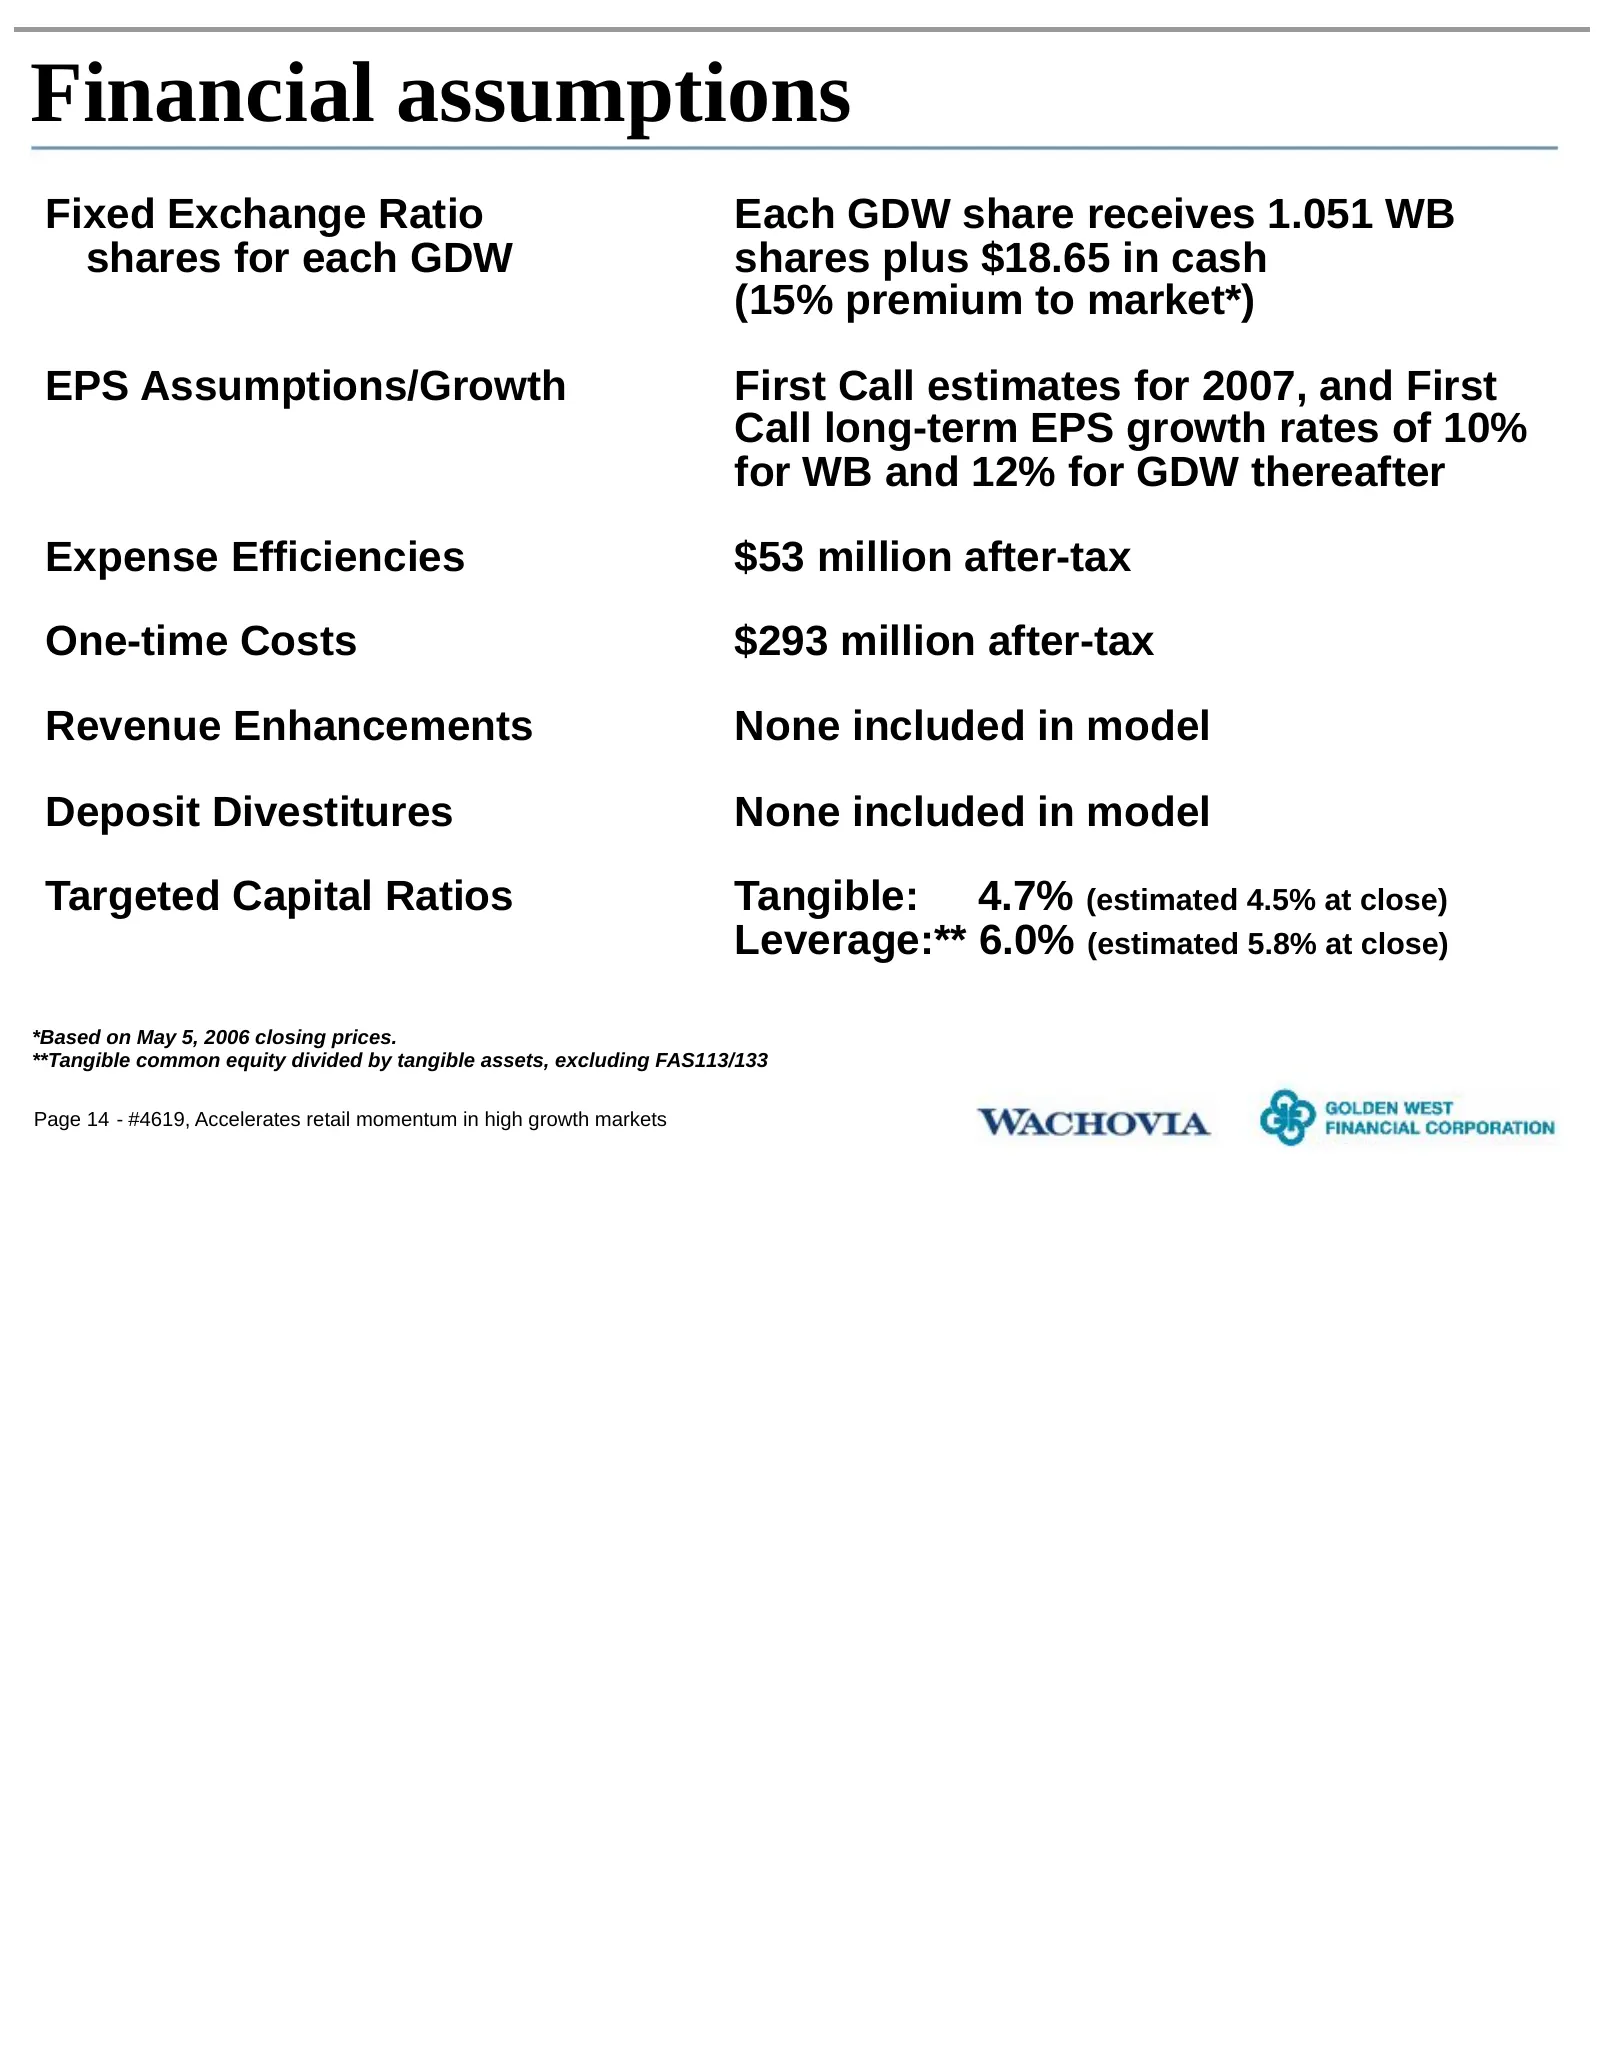
Financial assumptions Fixed Exchange Ratio Each GDW share receives 1.051 WB shares for each GDW shares plus $18.65 in cash (15% premium to market*) EPS Assumptions/Growth First Call estimates for 2007, and First Call long-term EPS growth rates of 10% for WB and 12% for GDW thereafter Expense Efficie
Slide 16: Pro forma earnings
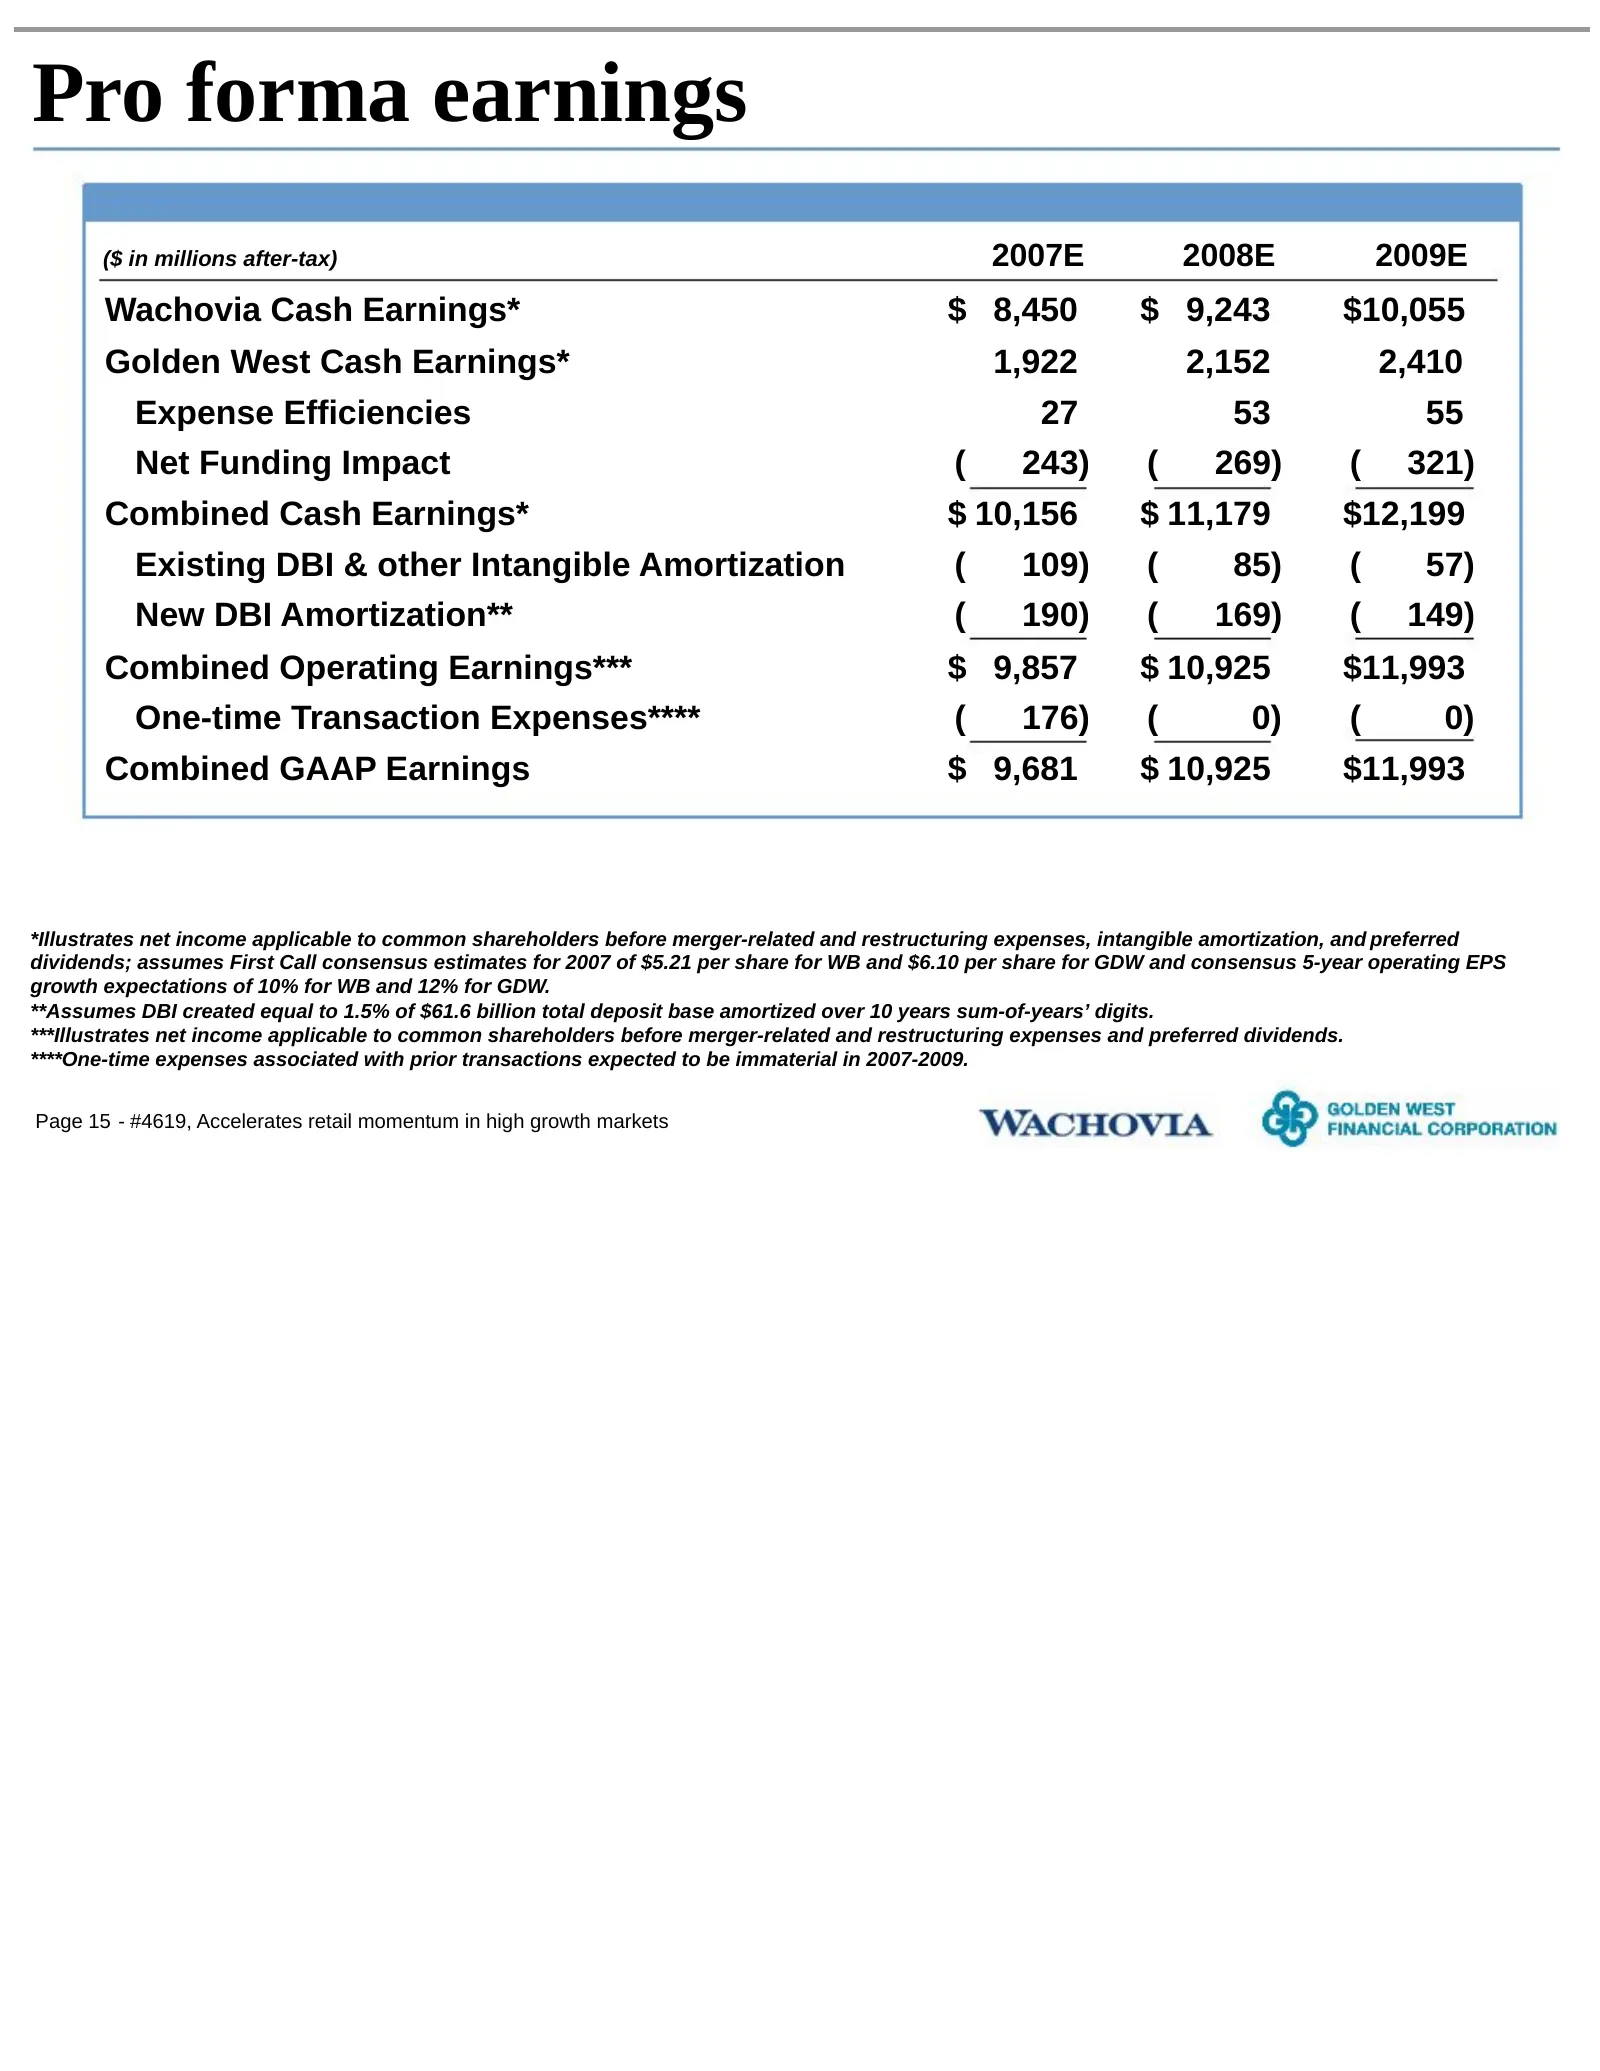
Pro forma earnings ($ in millions after-tax) 2007E 2008E 2009E Wachovia Cash Earnings* $ 8,450 $ 9,243 $10,055 Golden West Cash Earnings* 1,922 2,152 2,410 Expense Efficiencies 27 53 55 Net Funding Impact ( 243) ( 269) ( 321) Combined Cash Earnings* $ 10,156 $ 11,179 $12,199 Existing DBI & other Int
Slide 17: Pro forma EPS and IRR
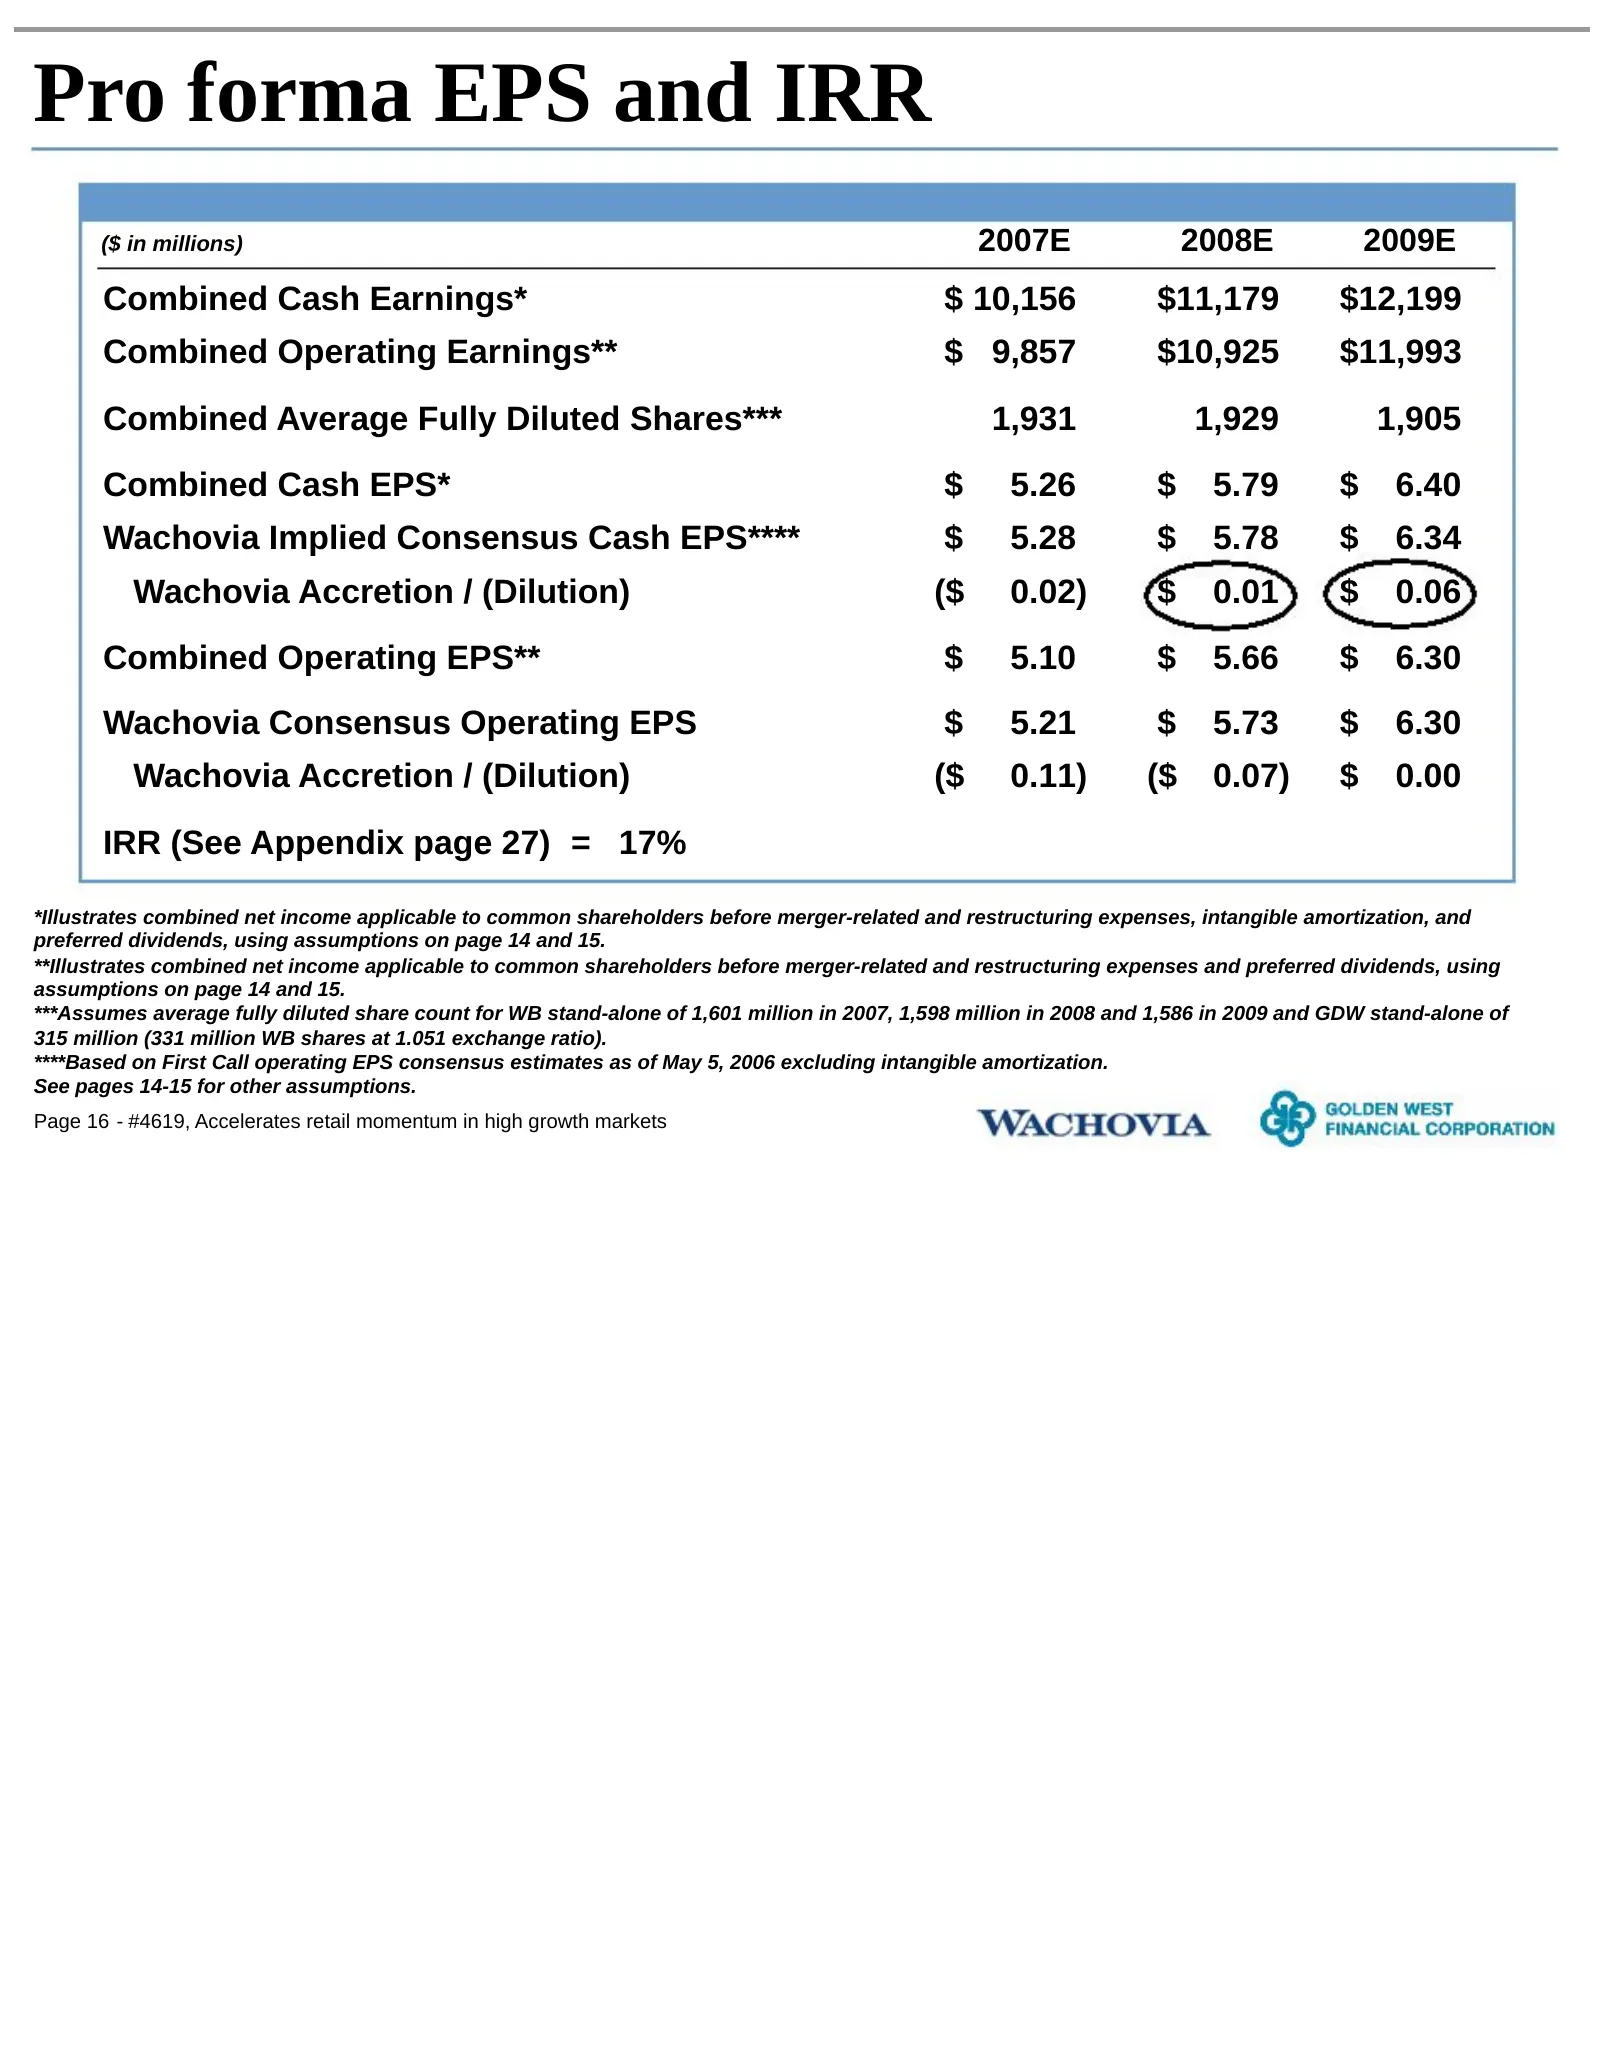
Pro forma EPS and IRR ($ in millions) 2007E 2008E 2009E Combined Cash Earnings* $ 10,156 $11,179 $12,199 Combined Operating Earnings** $ 9,857 $10,925 $11,993 Combined Average Fully Diluted Shares*** 1,931 1,929 1,905 Combined Cash EPS* $ 5.26 $ 5.79 $ 6.40 Wachovia Implied Consensus Cash EPS**** $
Slide 18: Modest expense efficiencies assumed
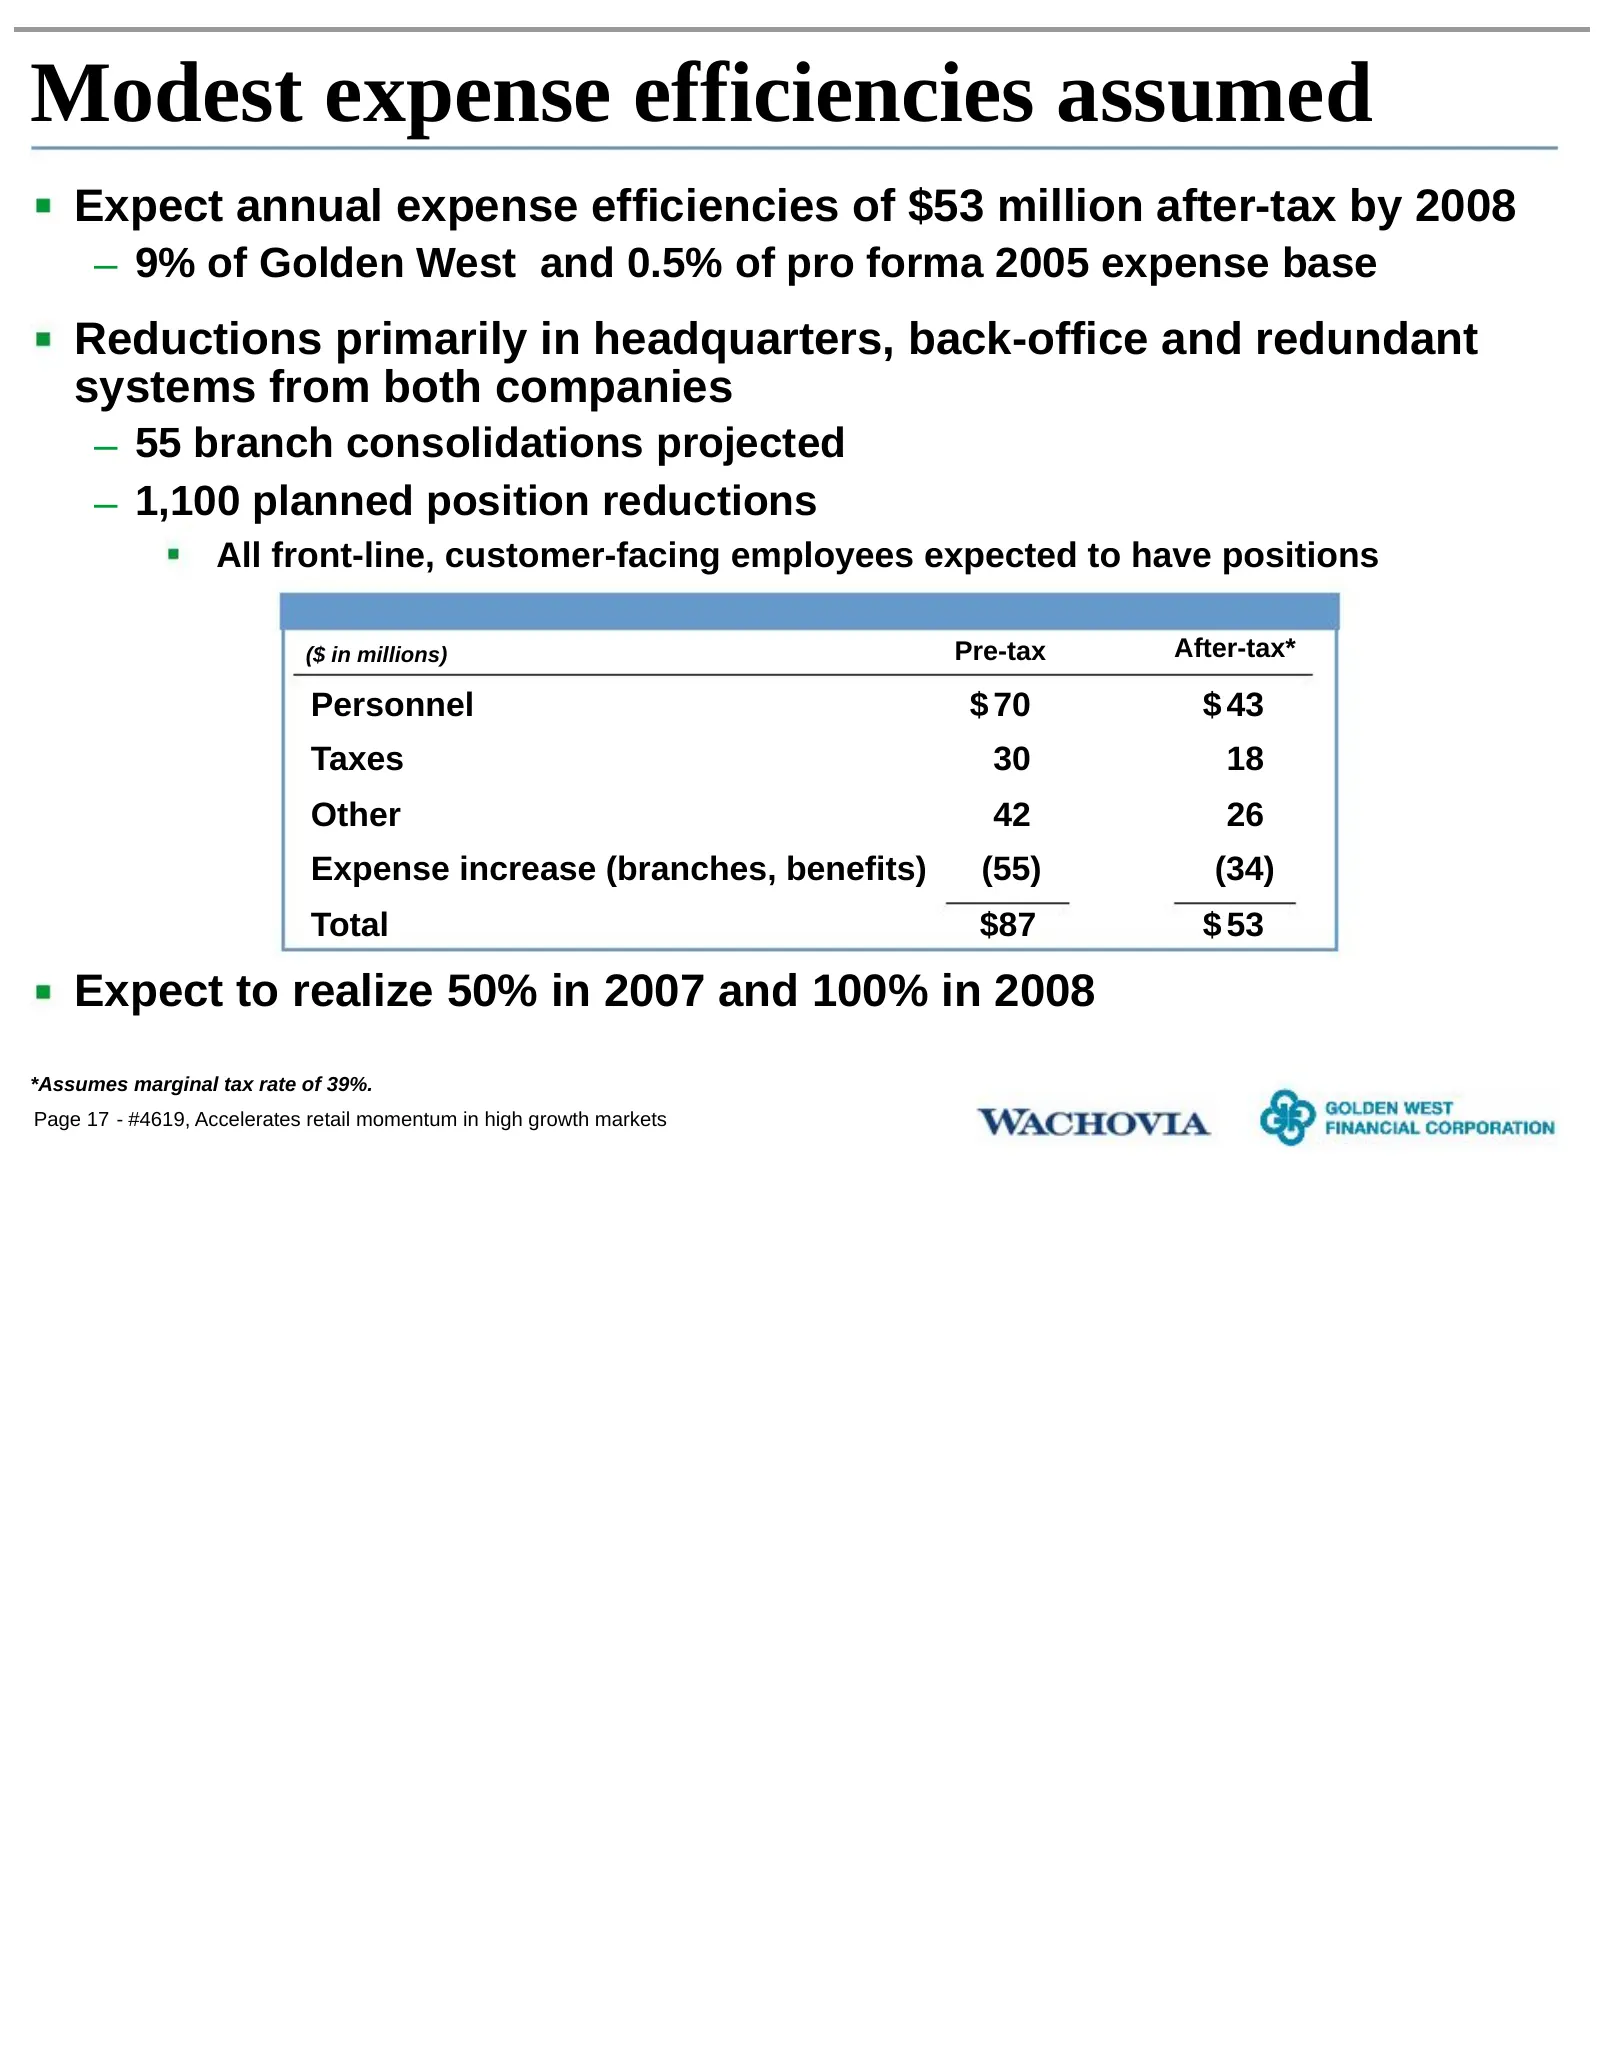
Modest expense efficiencies assumed Expect annual expense efficiencies of $53 million after-tax by 2008 – 9% of Golden West and 0.5% of pro forma 2005 expense base Reductions primarily in headquarters, back-office and redundant systems from both companies – 55 branch consolidations projected – 1,100
Slide 19: One-time merger-related costs
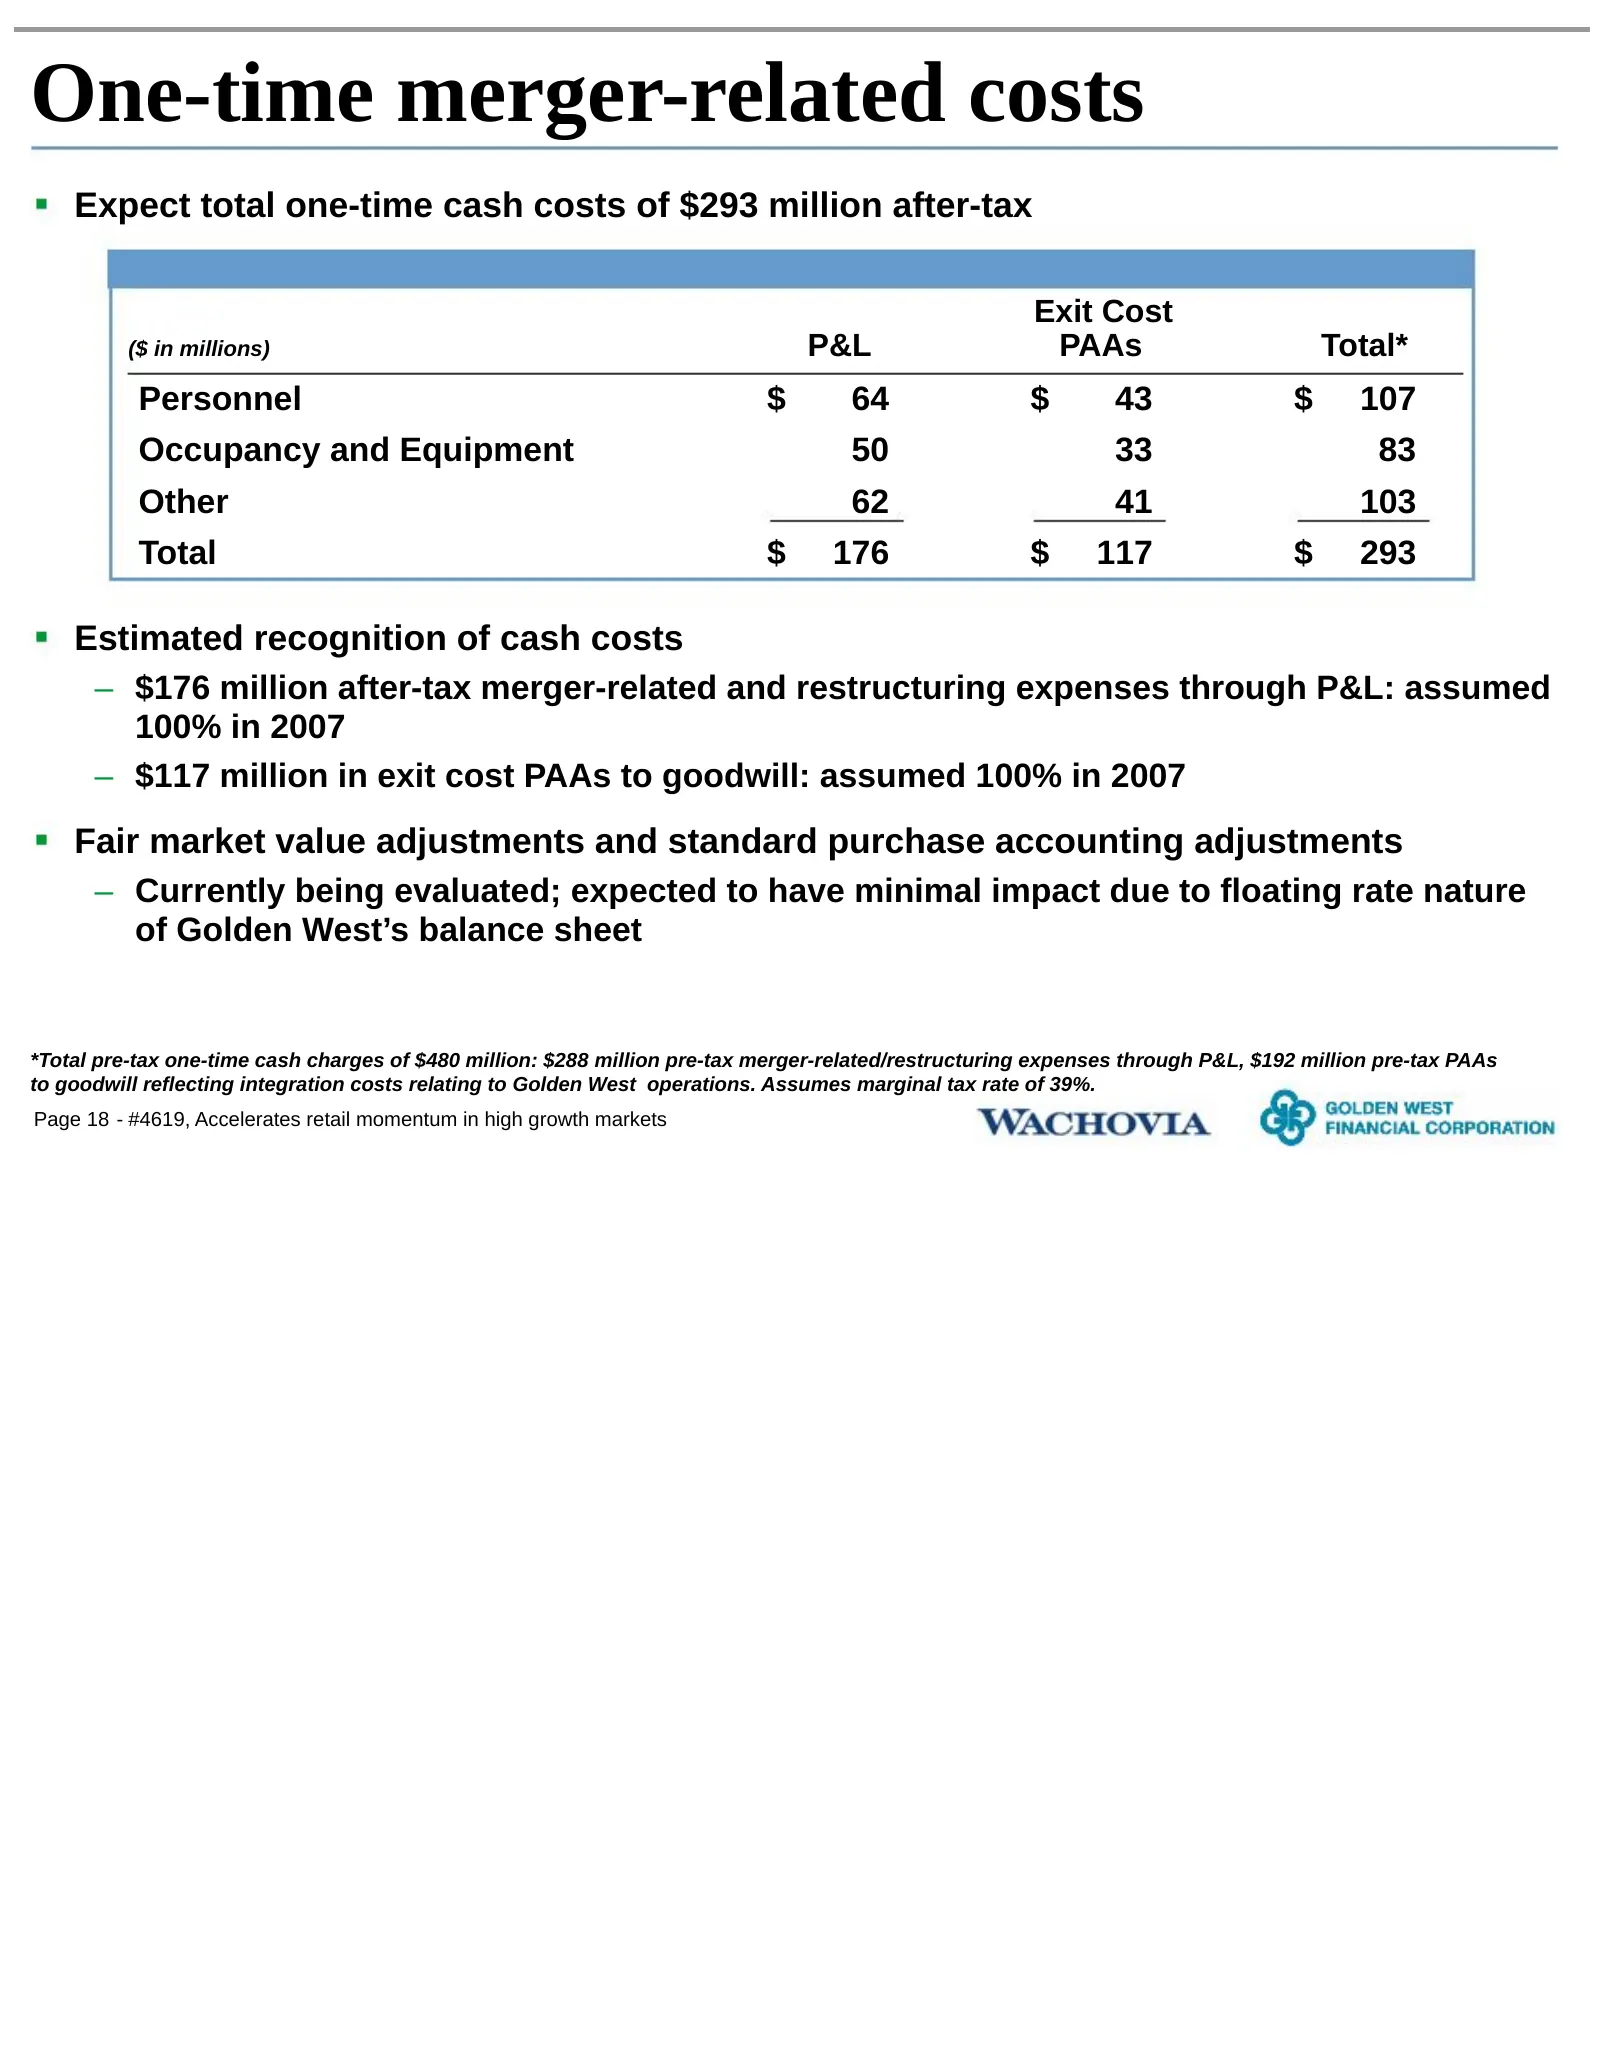
One-time merger-related costs Expect total one-time cash costs of $293 million after-tax Exit Cost ($ in millions) P&L PAAs Total* Personnel $ 64 $ 43 $ 107 Occupancy and Equipment 50 33 83 Other 62 41 103 Total $ 176 $ 117 $ 293 Estimated recognition of cash costs – $176 million after-tax merger-re
Slide 20: Drawing on experience: Delivering on integration promises
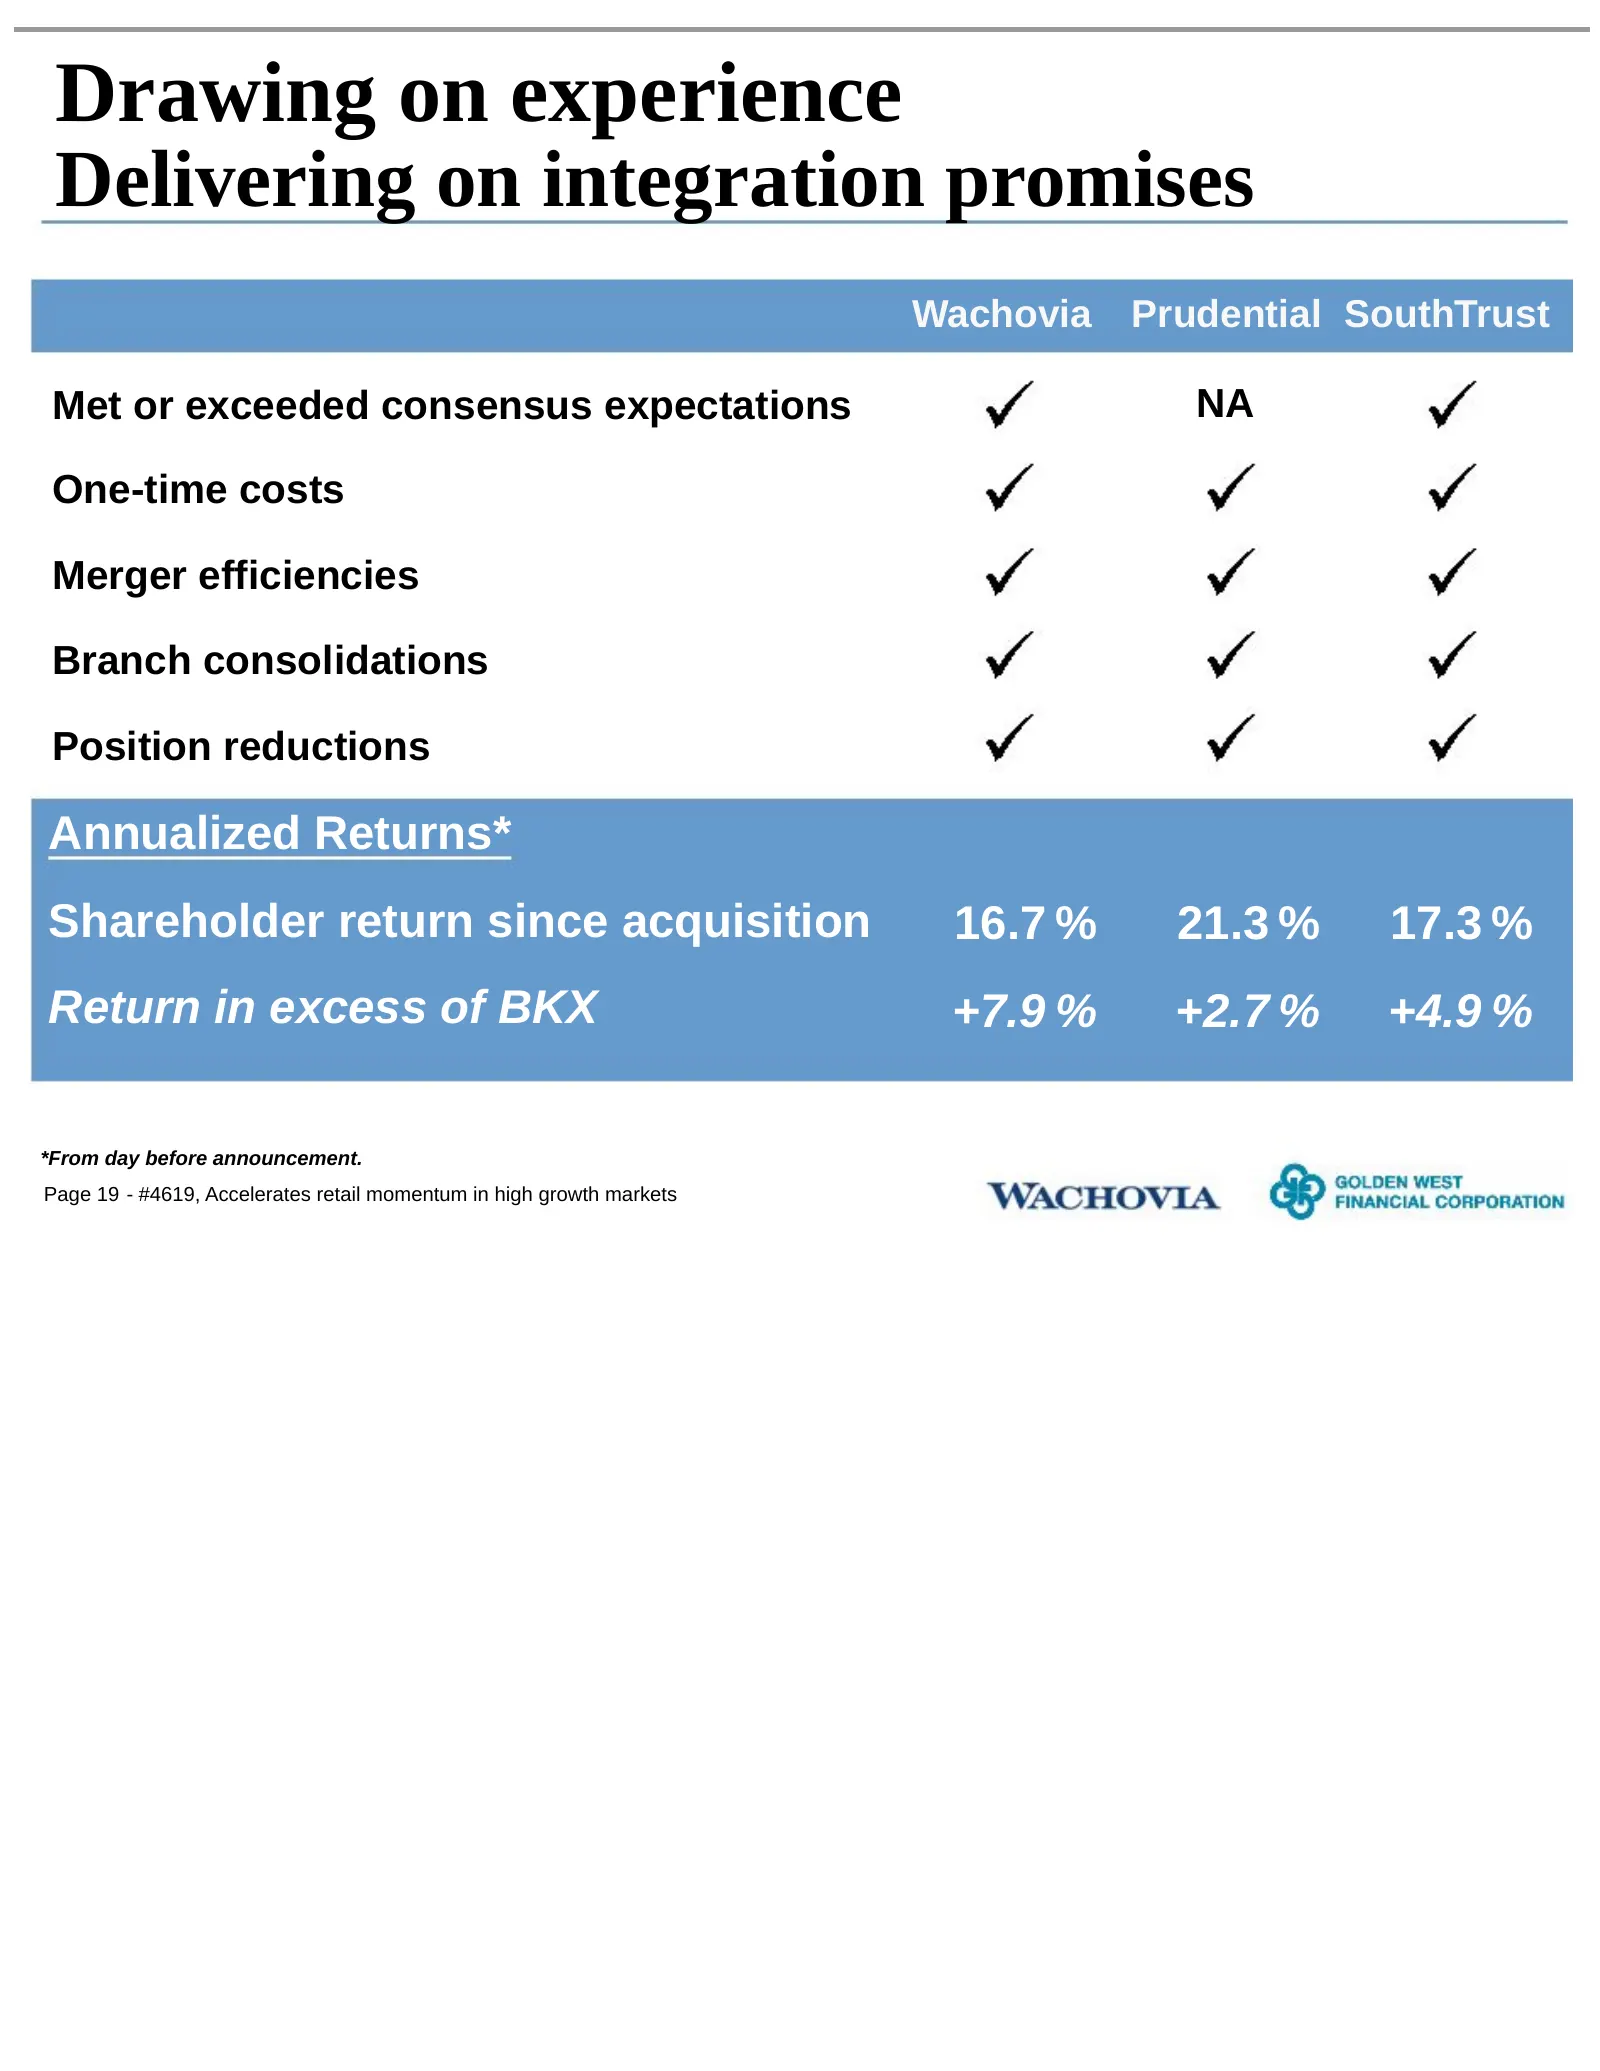
Drawing on experience Delivering on integration promises Wachovia Prudential SouthTrust Met or exceeded consensus expectations NA One-time costs Merger efficiencies Branch consolidations Position reductions Annualized Returns* Shareholder return since acquisition 16.7 % 21.3 % 17.3 % Return in exces
Slide 21: In summary
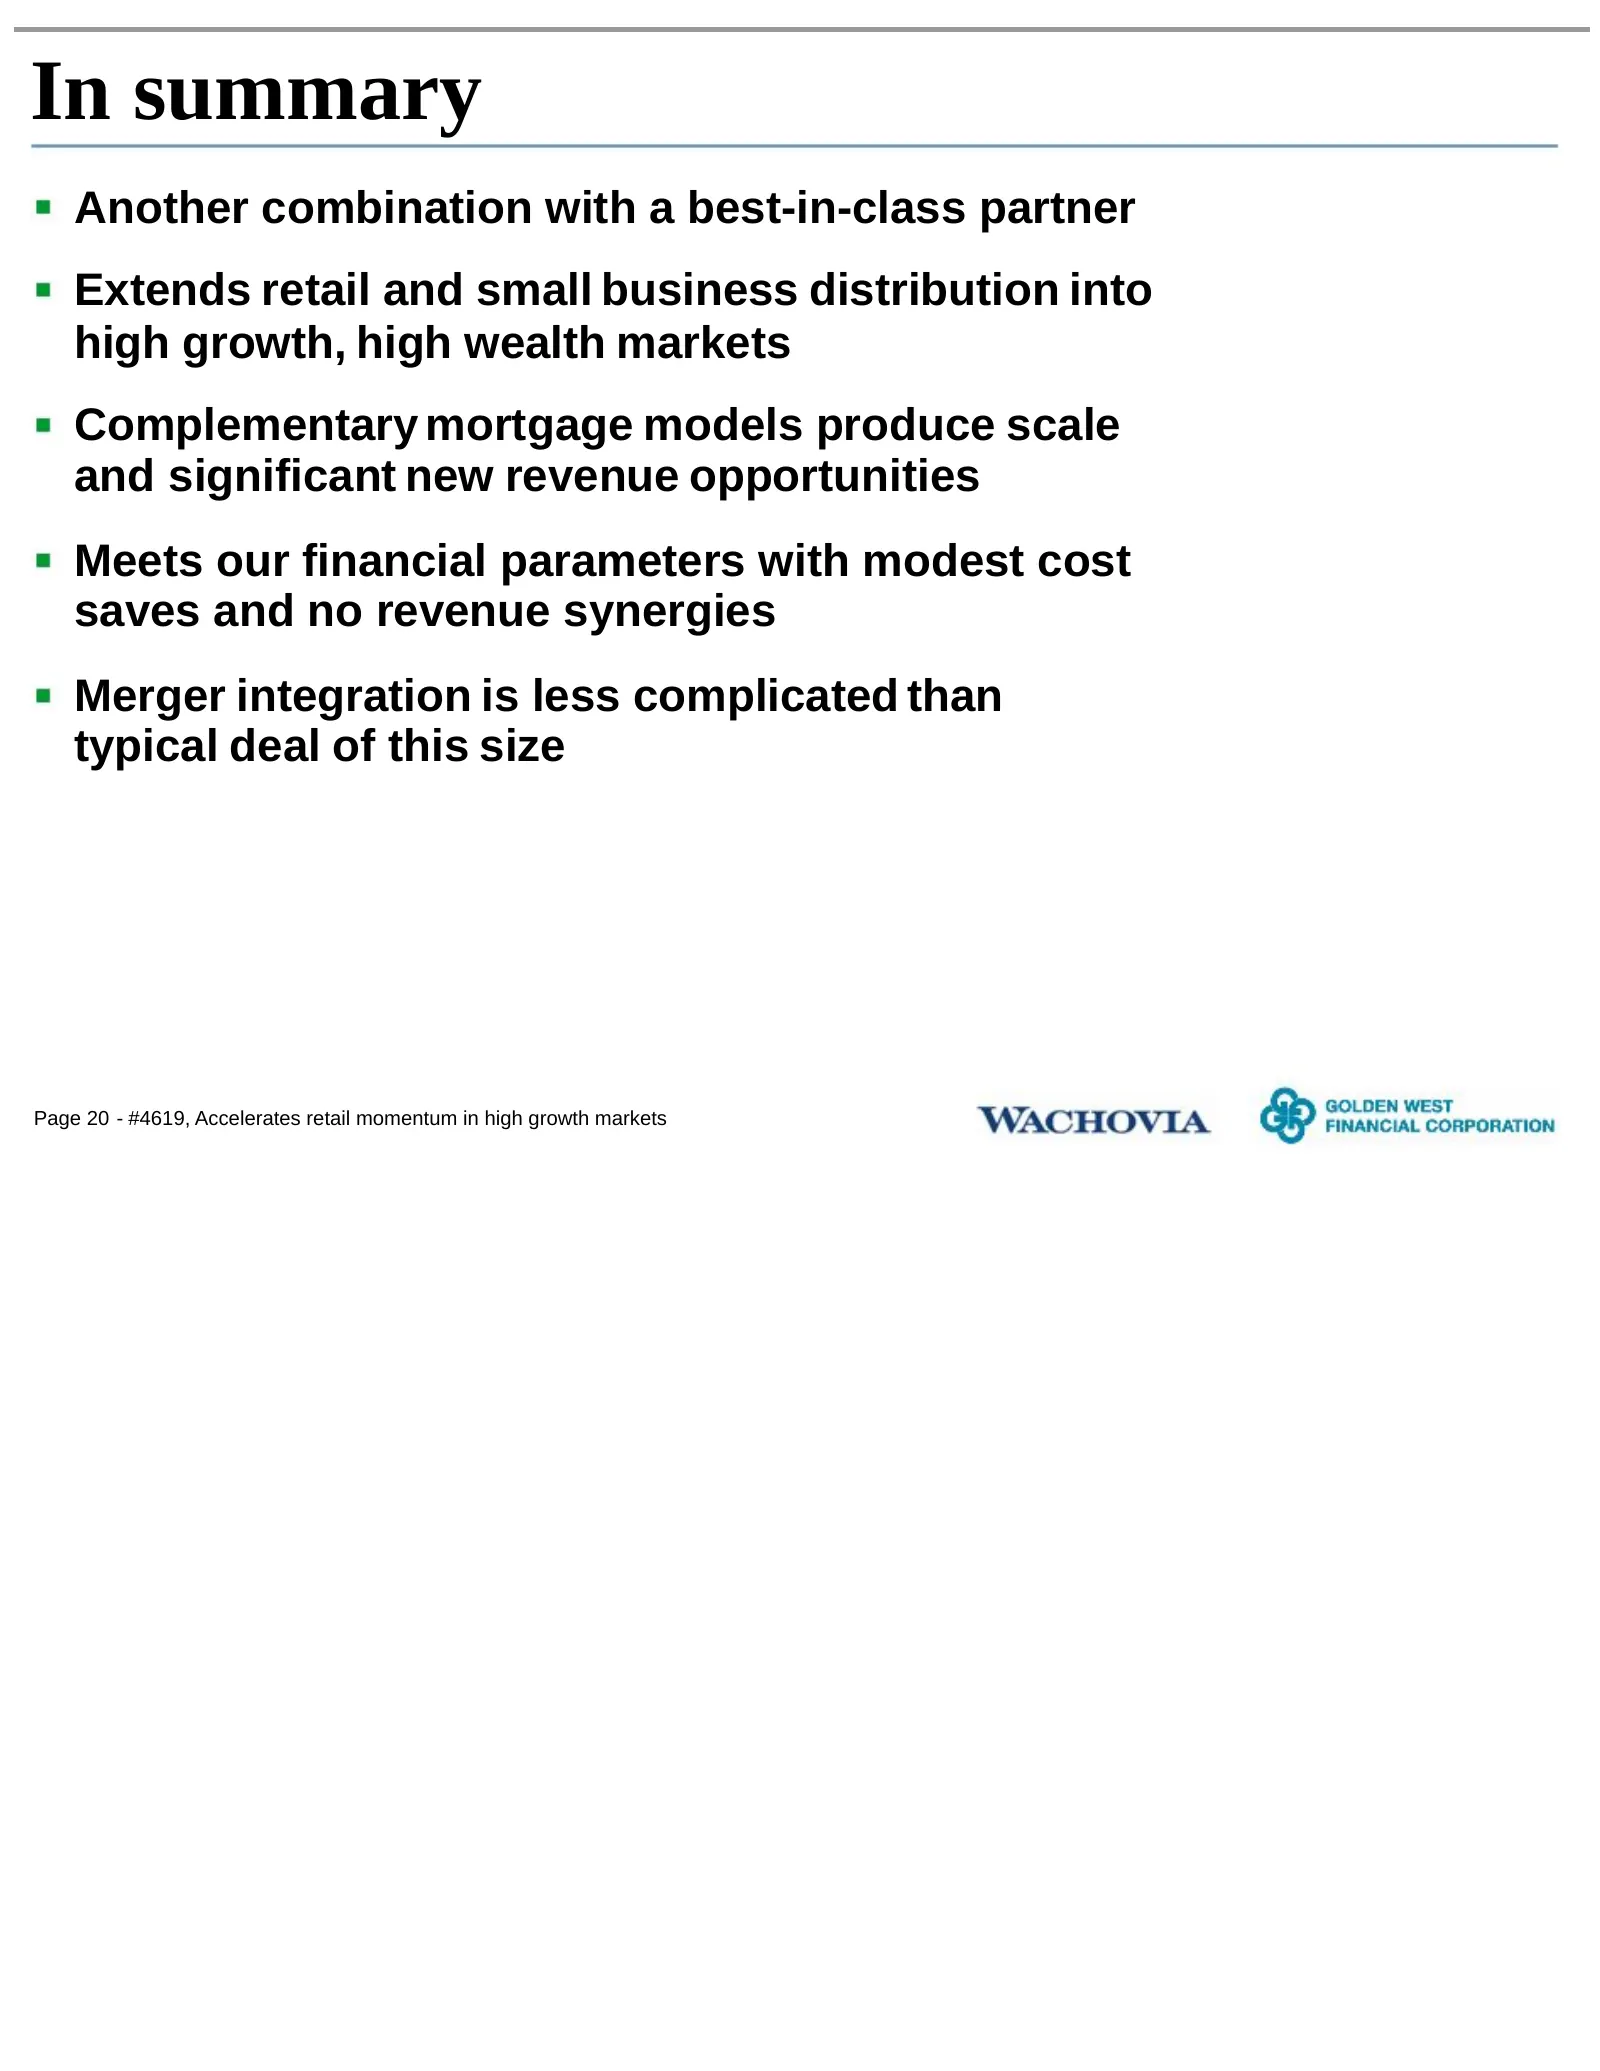
In summary Another combination with a best-in-class partner Extends retail and small business distribution into high growth, high wealth markets Complementary mortgage models produce scale and significant new revenue opportunities Meets our financial parameters with modest cost saves and no revenue
Slide 22: Appendix
Appendix Golden West: Primary product overview Resilience through market cycles Golden West top 20 MSA market shares Pro forma balance sheet IRR detail Integration timeline Pro forma credit position Page 21 - #4619, Accelerates retail momentum in high growth markets
Slide 23: Golden West: Primary product overview
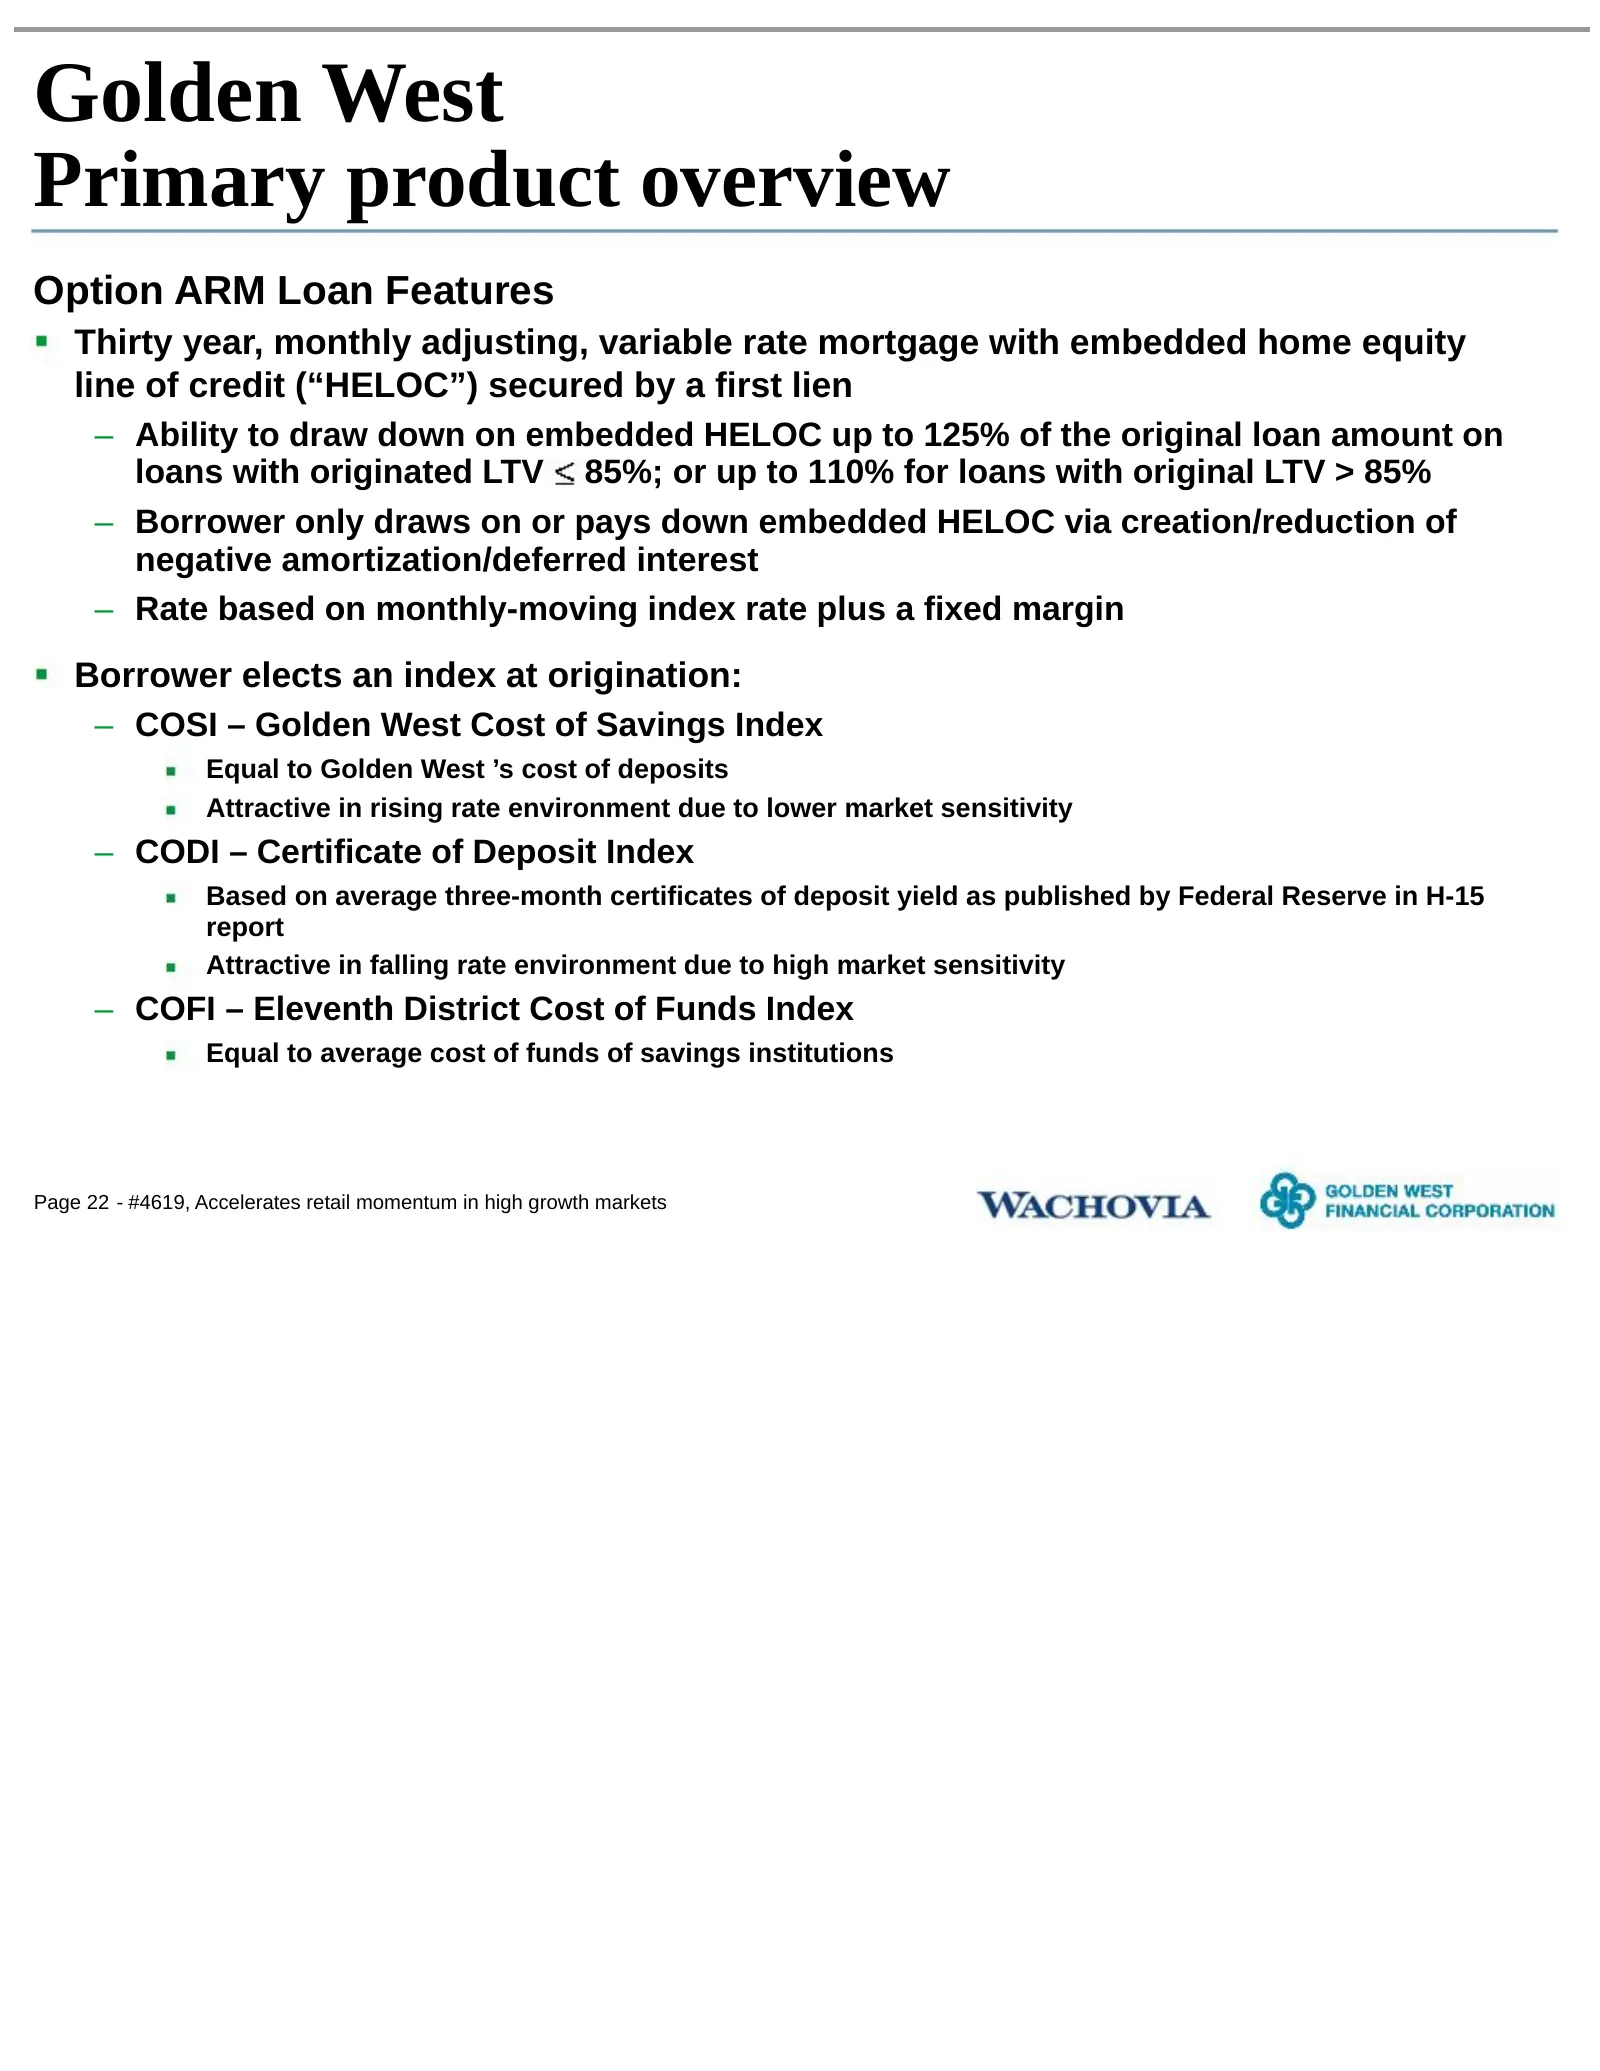
Golden West Primary product overview Option ARM Loan Features Thirty year, monthly adjusting, variable rate mortgage with embedded home equity line of credit (“HELOC”) secured by a first lien – Ability to draw down on embedded HELOC up to 125% of the original loan amount on loans with originated LTV
Slide 24: Golden West: Primary product overview
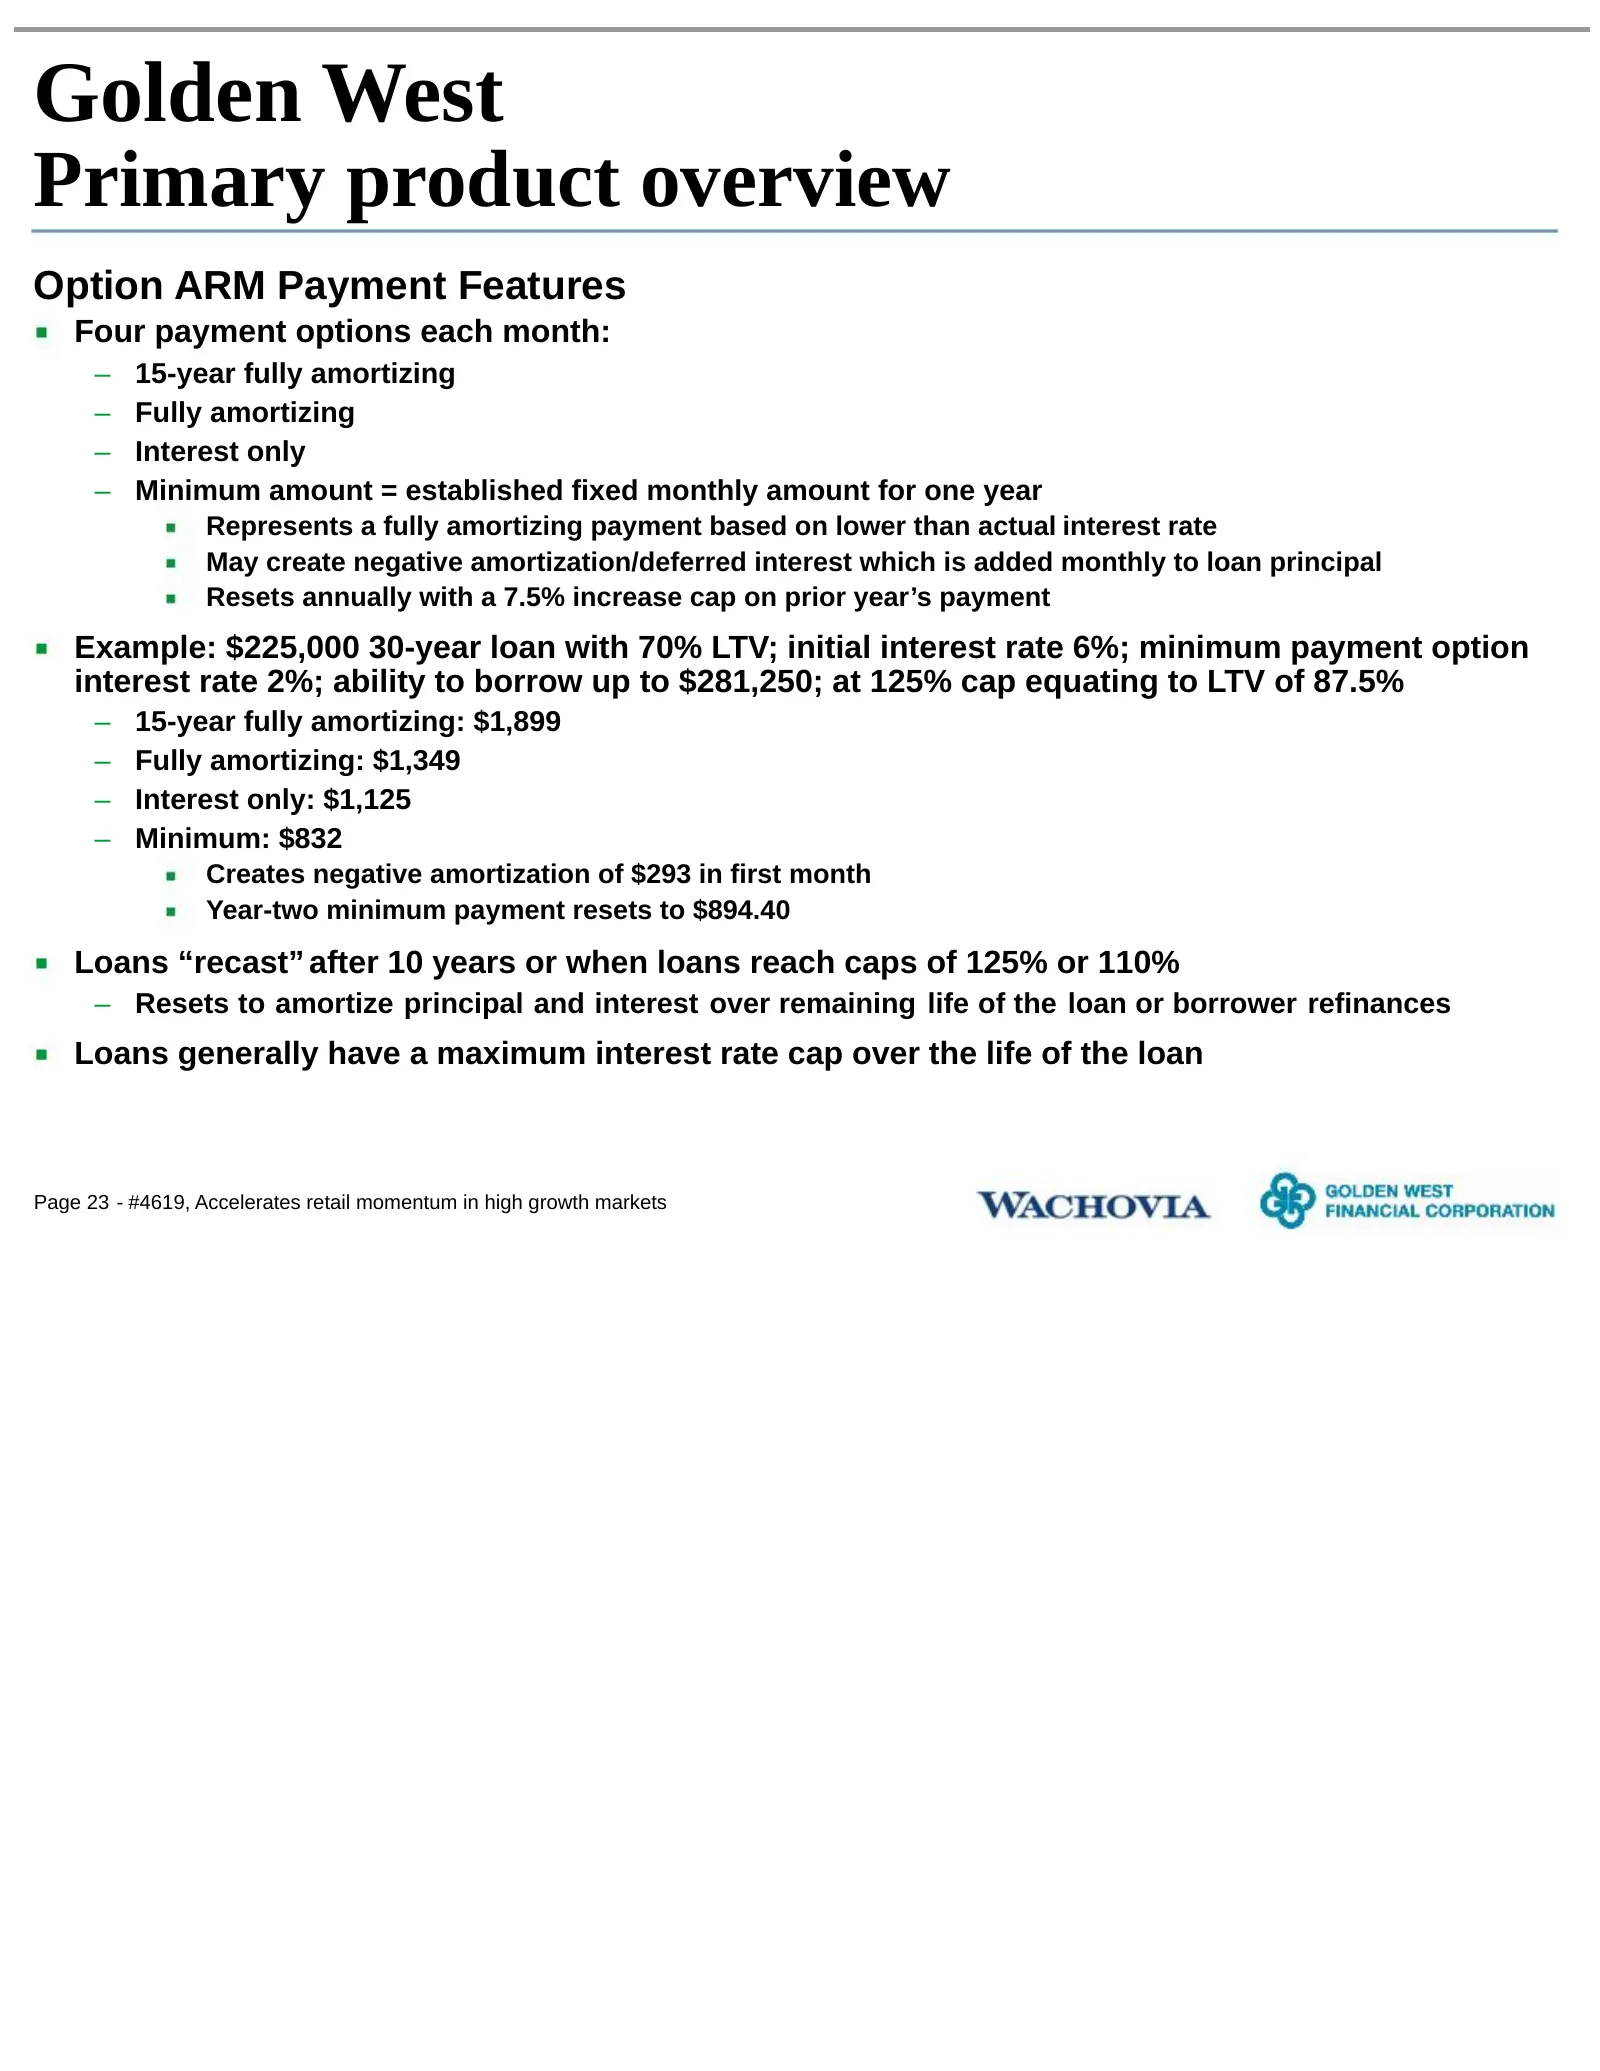
Golden West Primary product overview Option ARM Payment Features Four payment options each month: – 15-year fully amortizing – Fully amortizing – Interest only – Minimum amount = established fixed monthly amount for one year Represents a fully amortizing payment based on lower than actual interest r
Slide 25: Resilience through market cycles
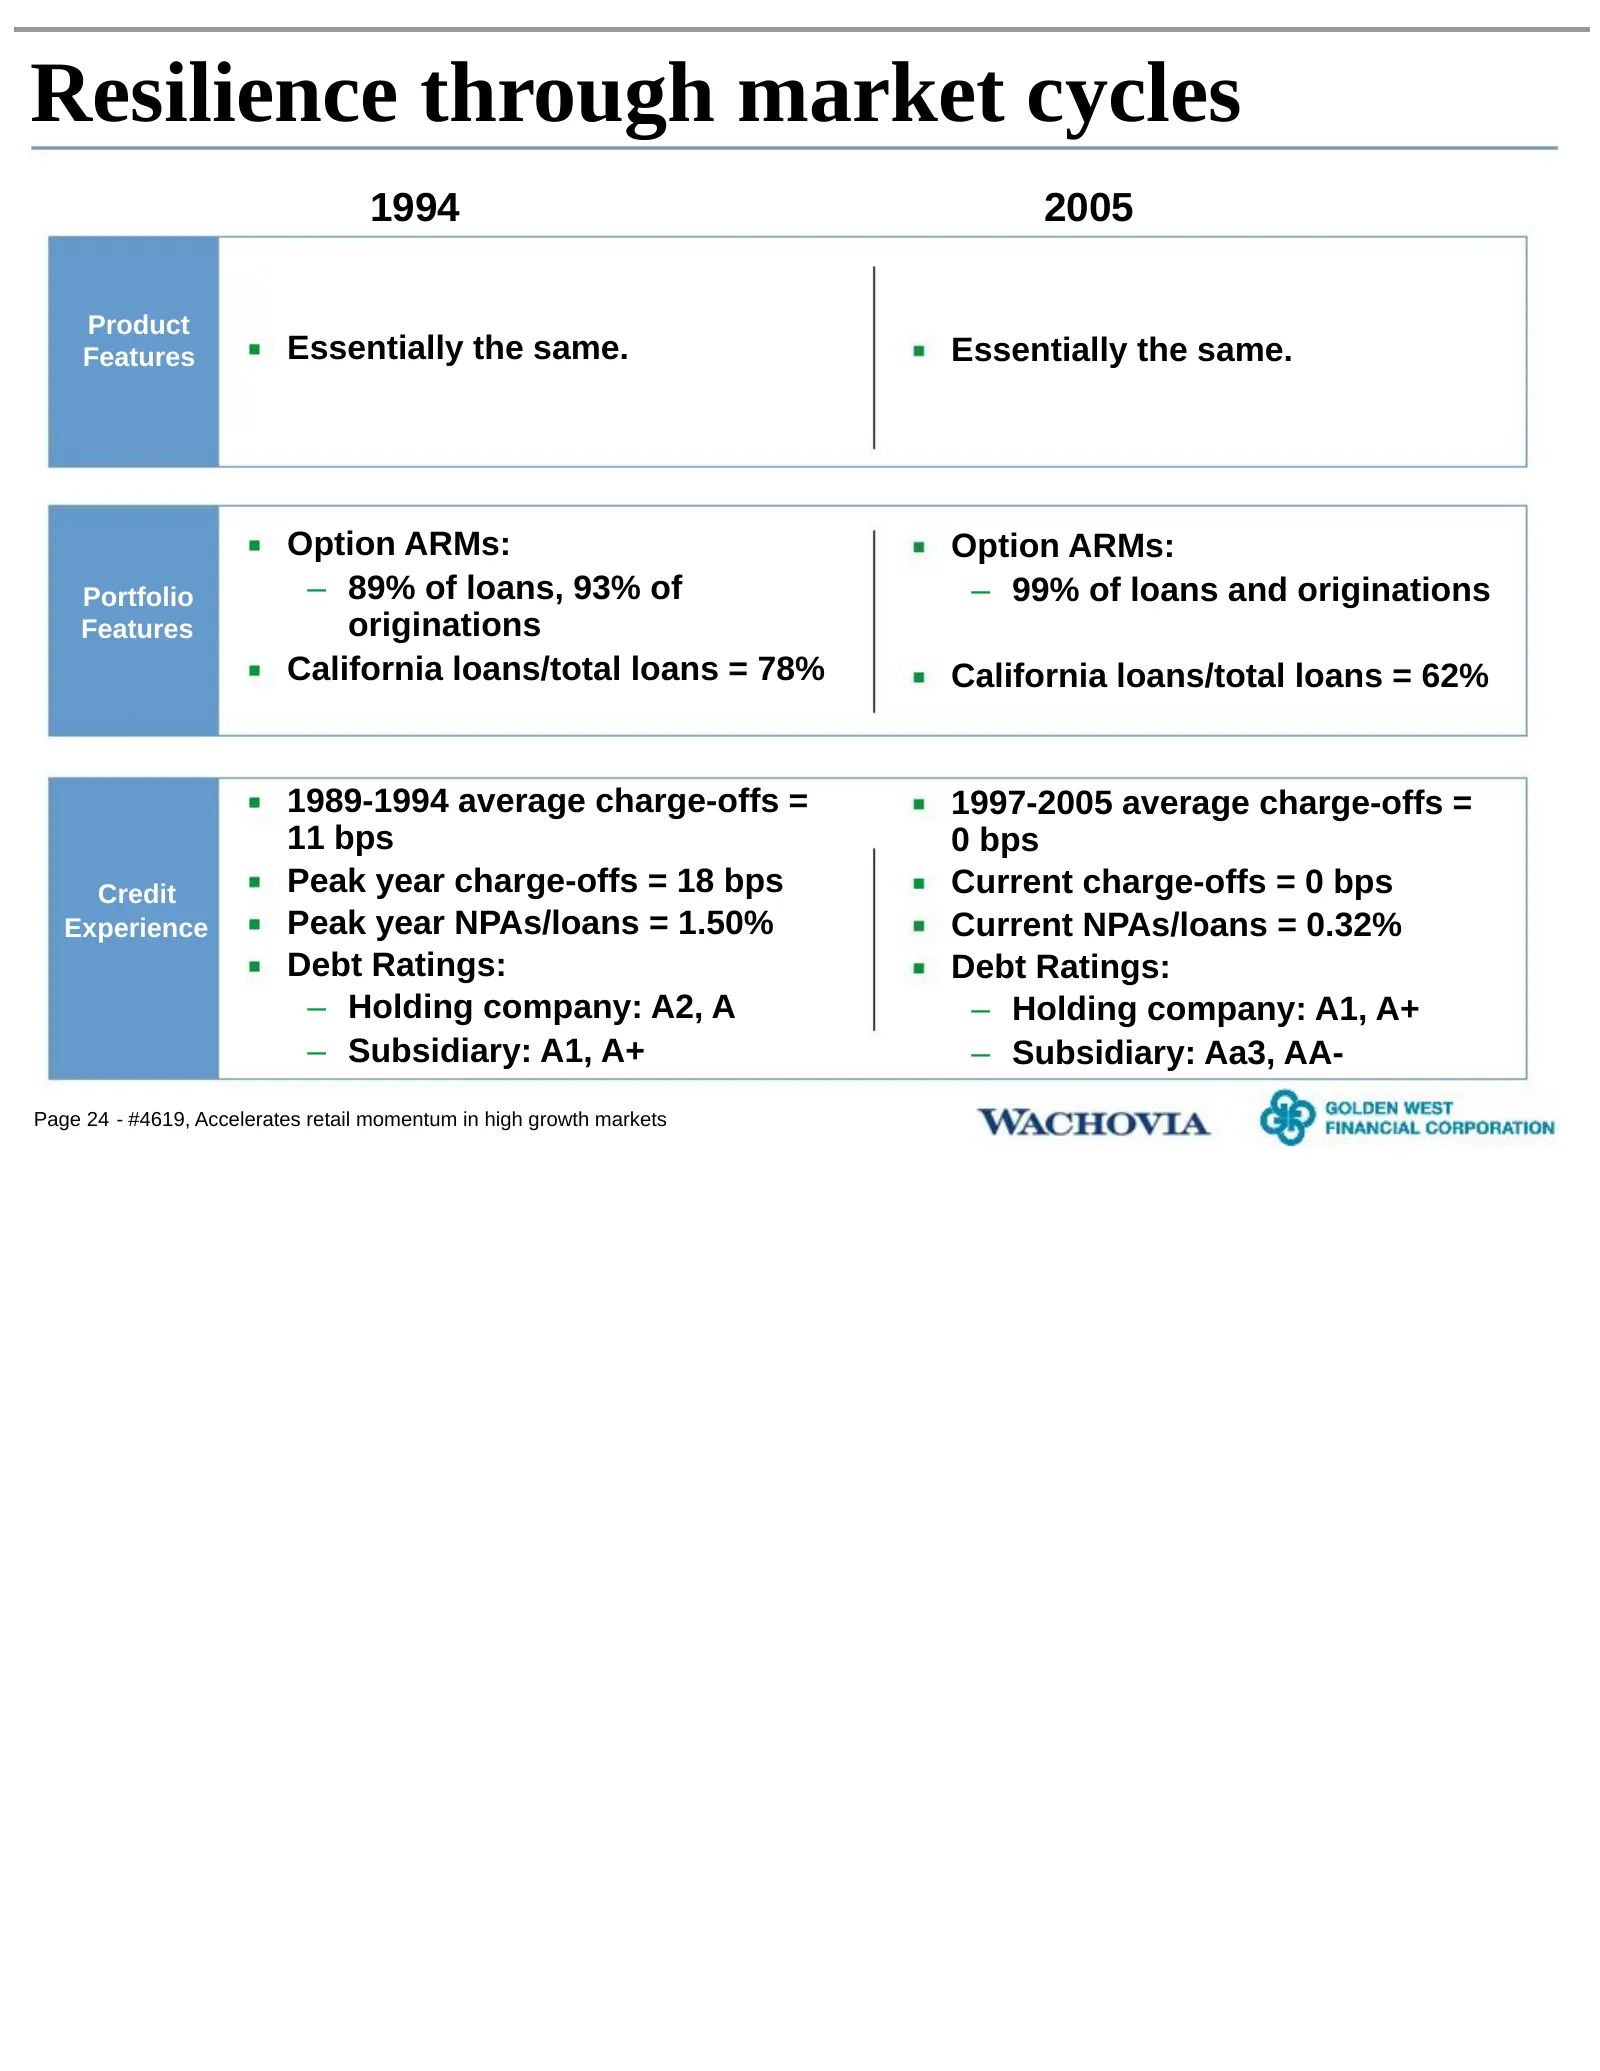
Resilience through market cycles 1994 2005 Product Features Essentially the same. Essentially the same. Option ARMs: Option ARMs: Portfolio – 89% of loans, 93% of – 99% of loans and originations Features originations California loans/total loans = 78% California loans/total loans = 62% 1989-1994 ave
Slide 26: Golden West top 20 MSA market shares
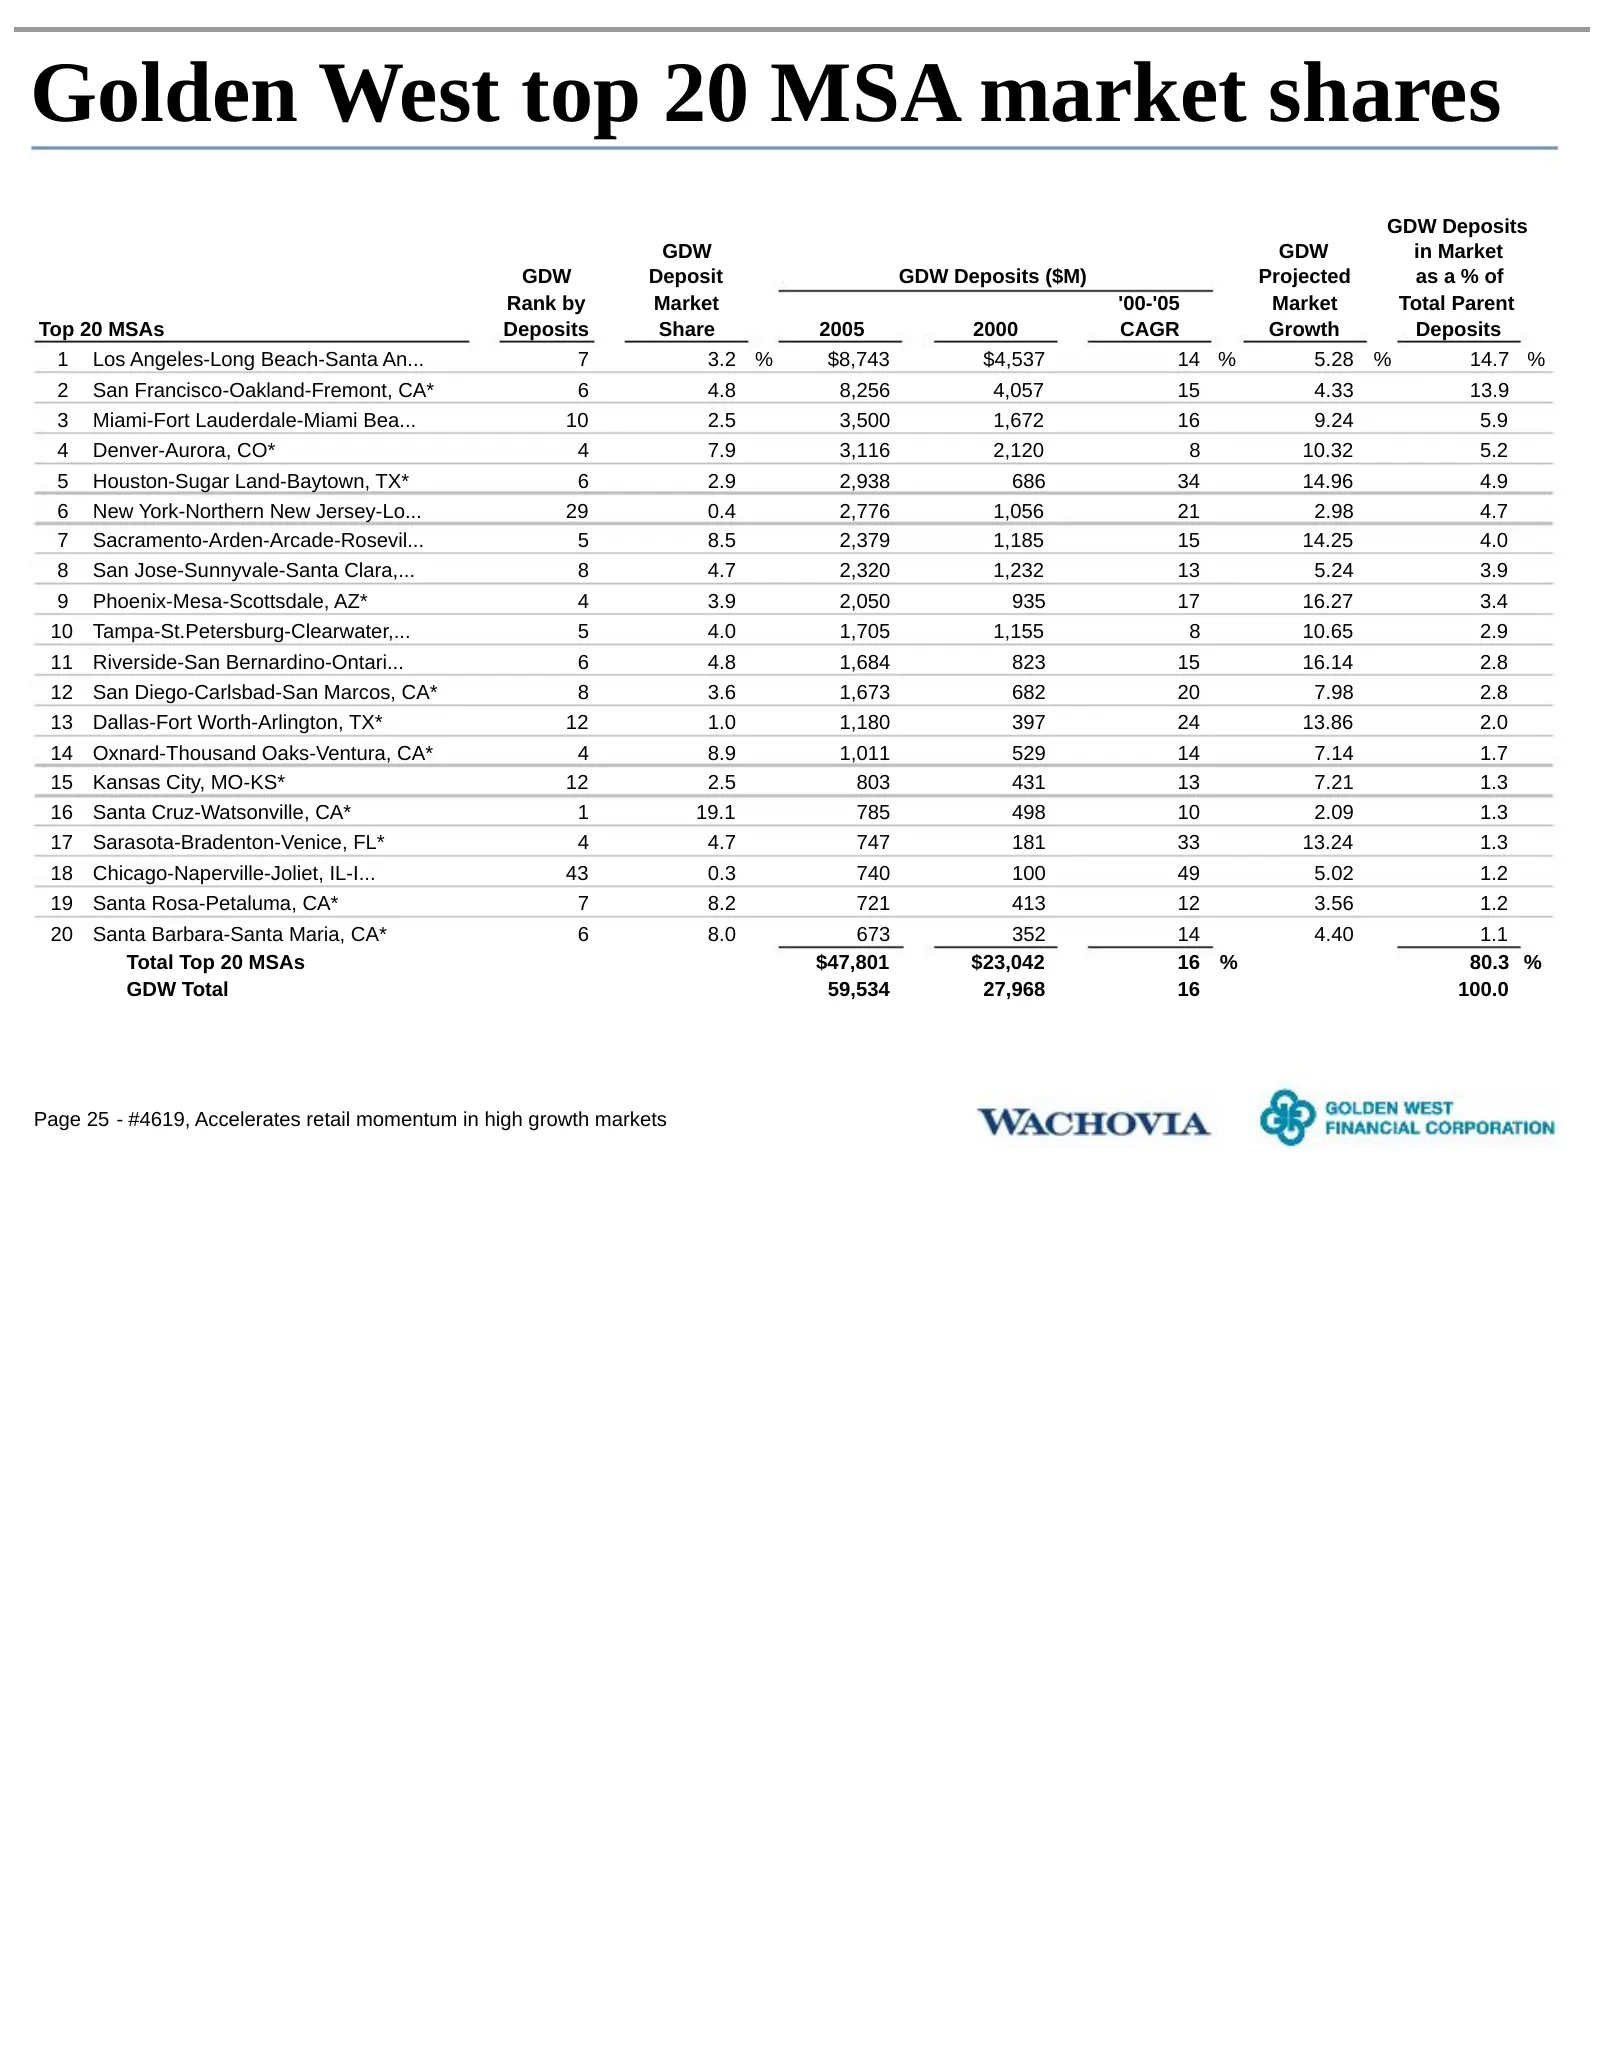
Golden West top 20 MSA market shares GDW Deposits GDW GDW in Market GDW Deposit GDW Deposits ($M) Projected as a % of Rank by Market '00-'05 Market Total Parent Top 20 MSAs Deposits Share 2005 2000 CAGR Growth Deposits 1 Los Angeles-Long Beach-Santa An... 7 3.2 % $8,743 $4,537 14 % 5.28 % 14.7 % 2 S
Slide 27: Pro forma balance sheet
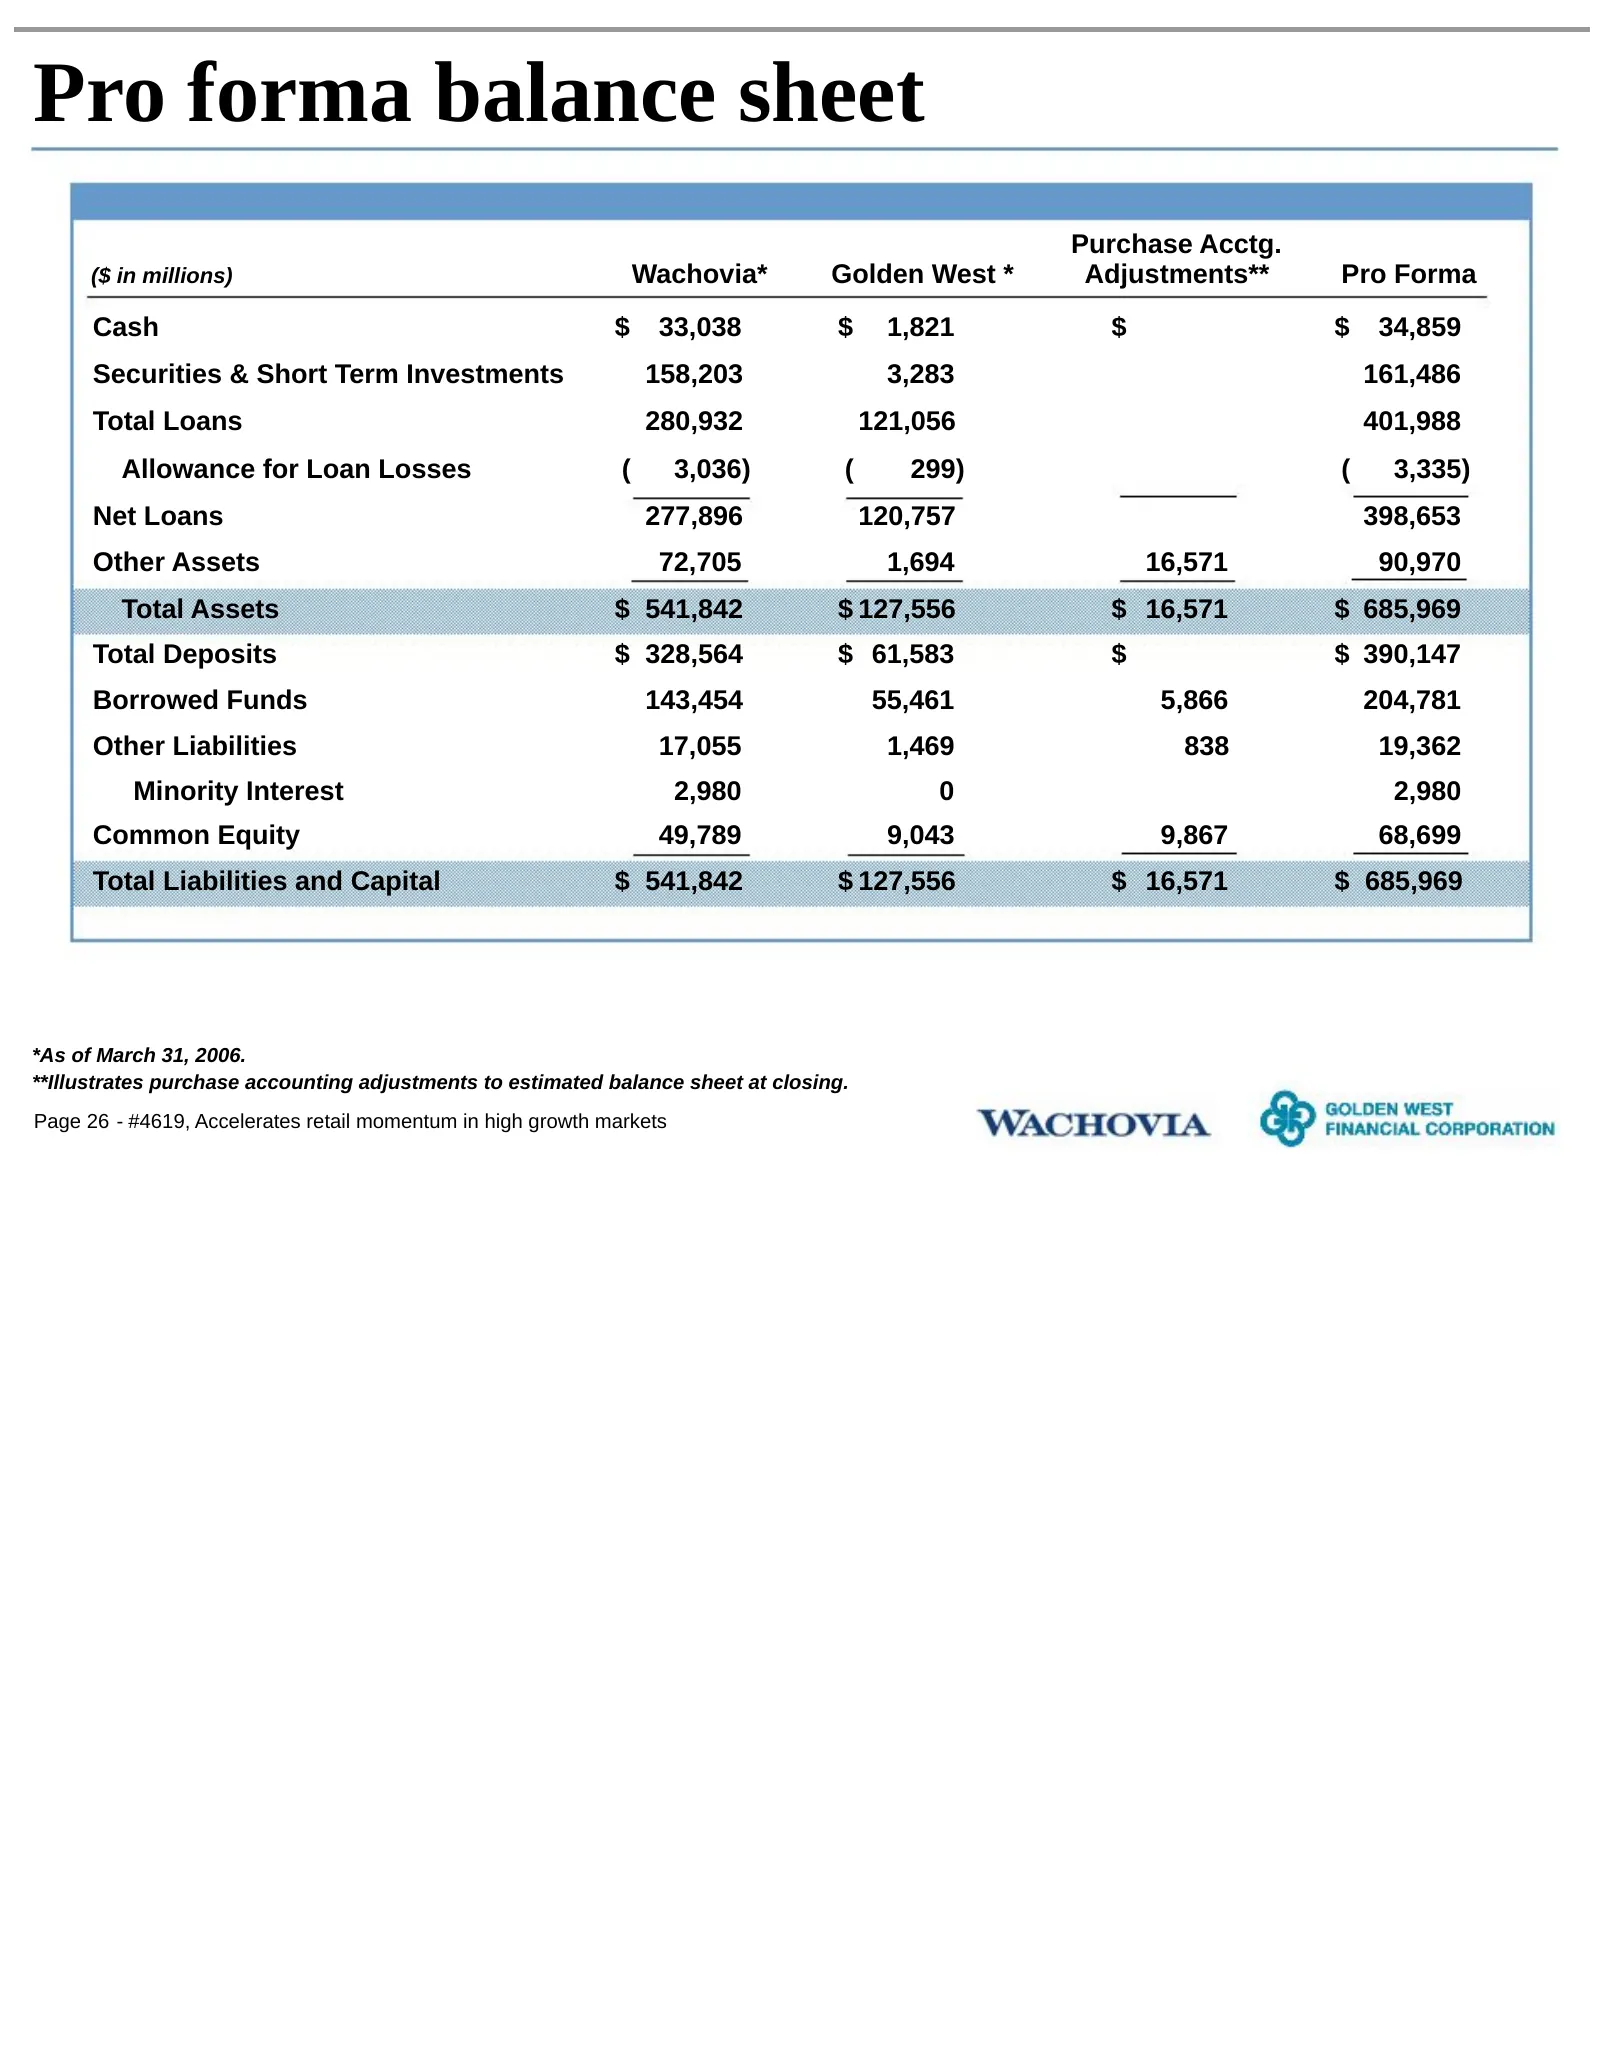
Pro forma balance sheet Purchase Acctg. ($ in millions) Wachovia* Golden West * Adjustments** Pro Forma Cash $ 33,038 $ 1,821 $ $ 34,859 Securities & Short Term Investments 158,203 3,283 161,486 Total Loans 280,932 121,056 401,988 Allowance for Loan Losses ( 3,036) ( 299) ( 3,335) Net Loans 277,896
Slide 28: IRR detail
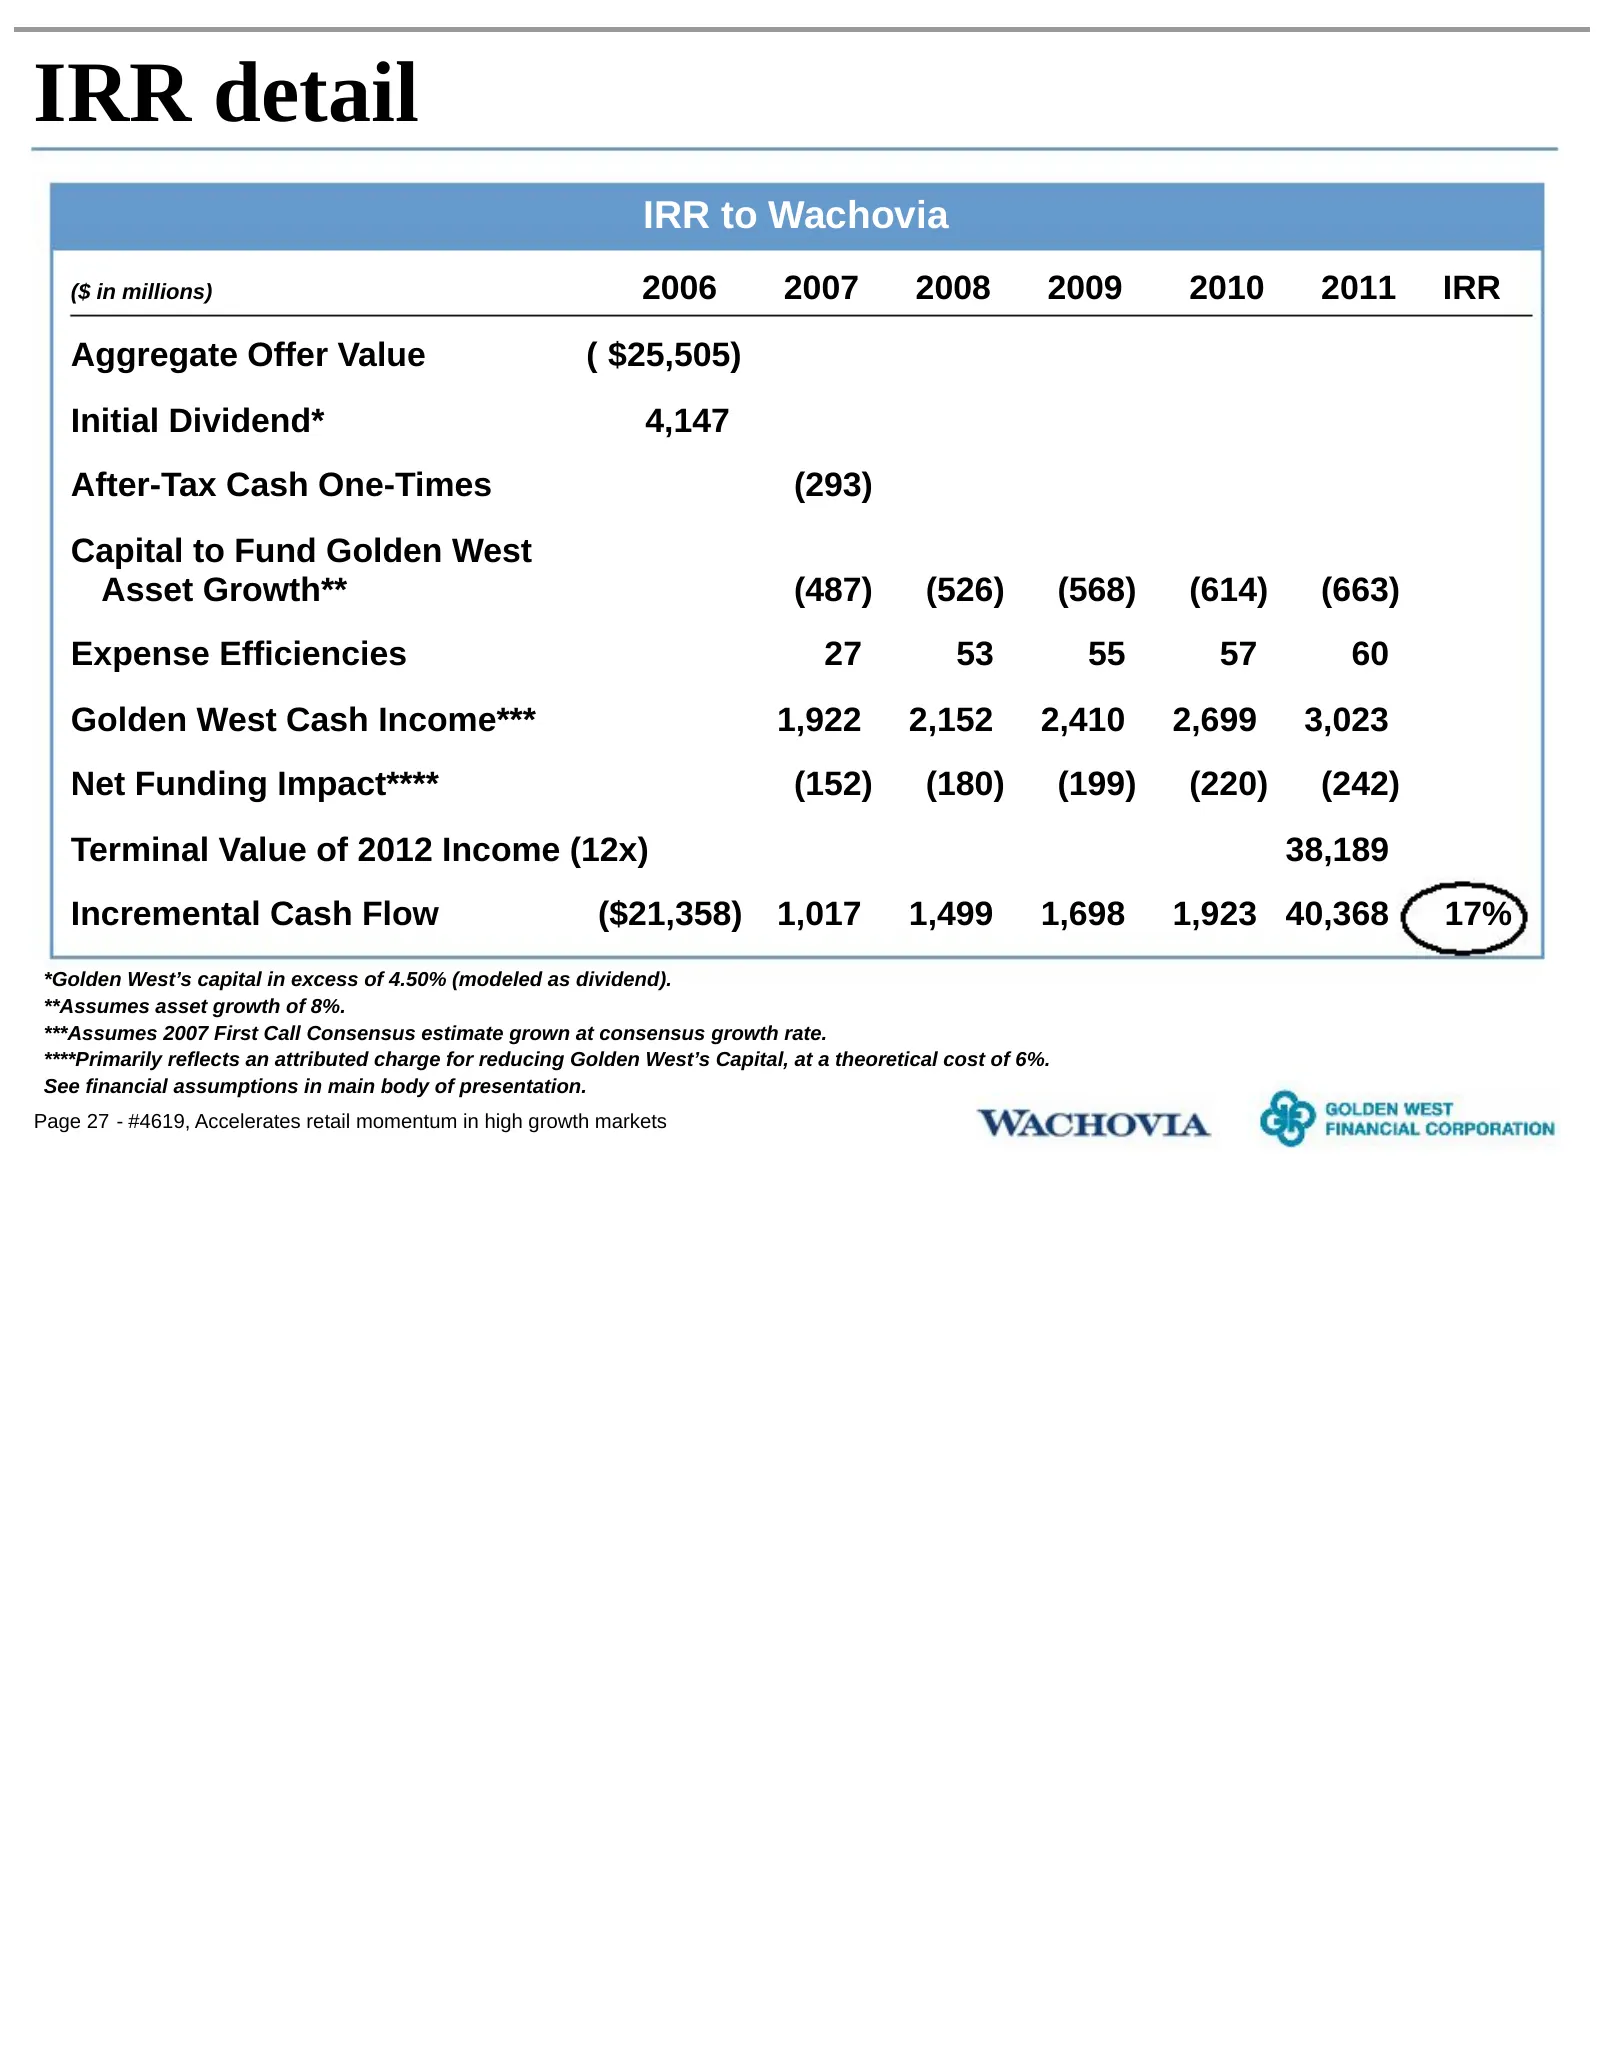
IRR detail IRR to Wachovia ($ in millions) 2006 2007 2008 2009 2010 2011 IRR Aggregate Offer Value ( $25,505) Initial Dividend* 4,147 After-Tax Cash One-Times (293) Capital to Fund Golden West Asset Growth** (487) (526) (568) (614) (663) Expense Efficiencies 27 53 55 57 60 Golden West Cash Income***
Slide 29: Integration timeline
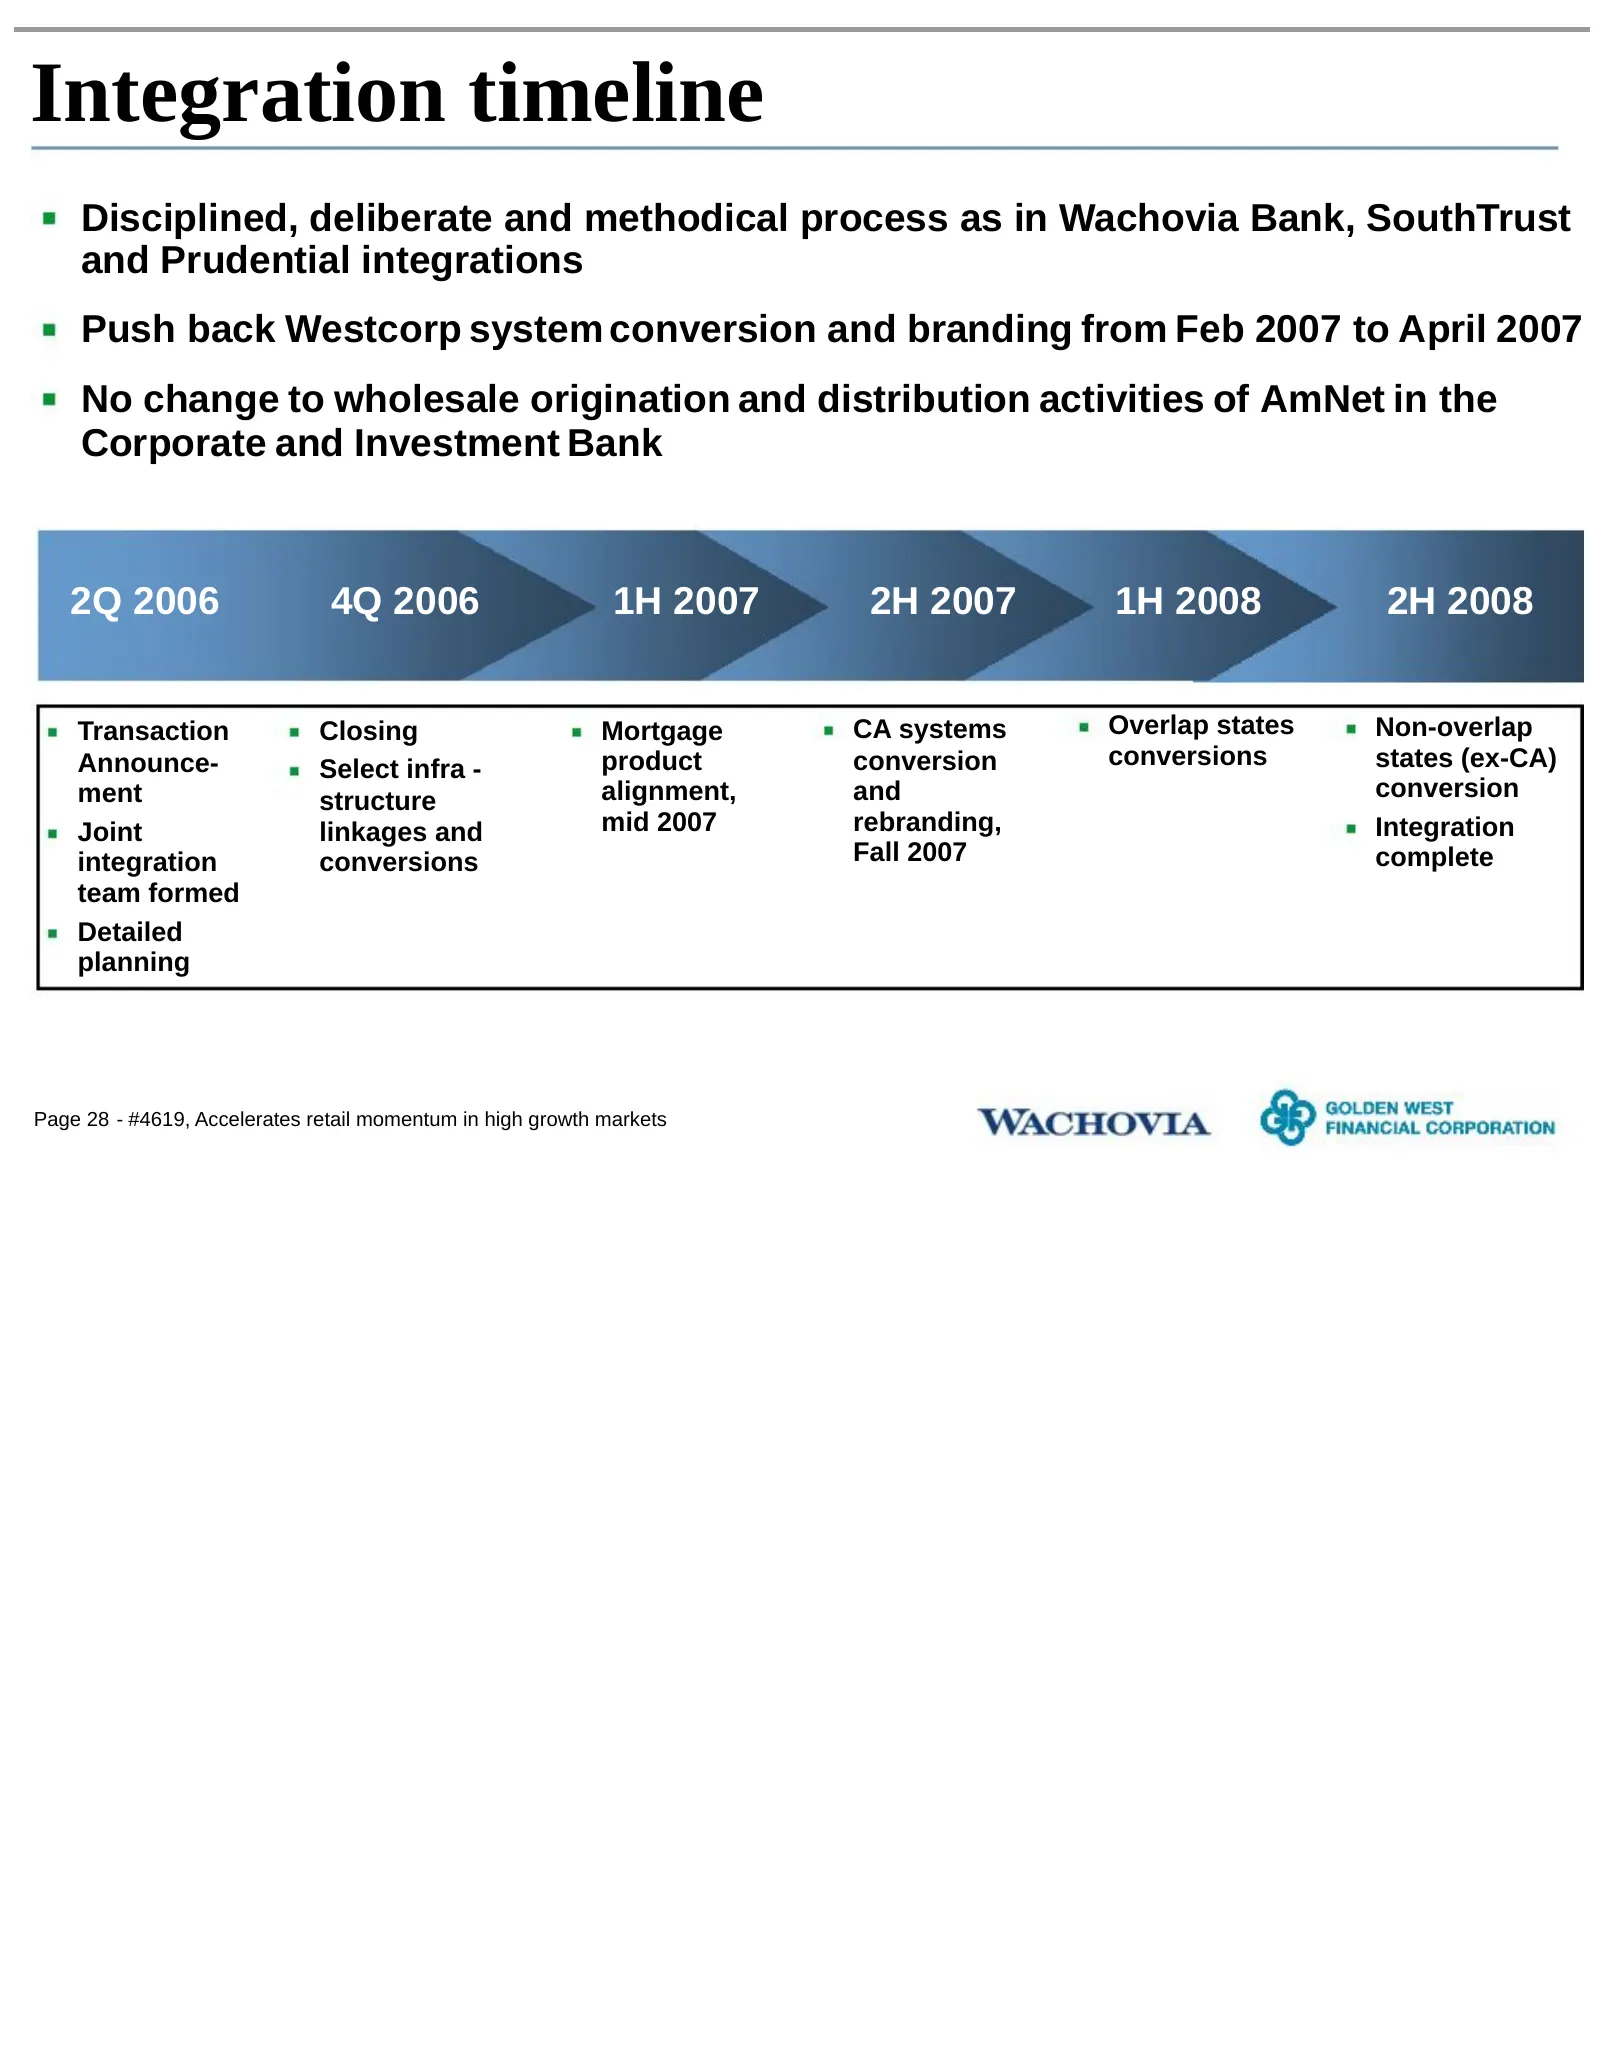
Integration timeline Disciplined, deliberate and methodical process as in Wachovia Bank, SouthTrust and Prudential integrations Push back Westcorp system conversion and branding from Feb 2007 to April 2007 No change to wholesale origination and distribution activities of AmNet in the Corporate and I
Slide 30: Pro forma credit position
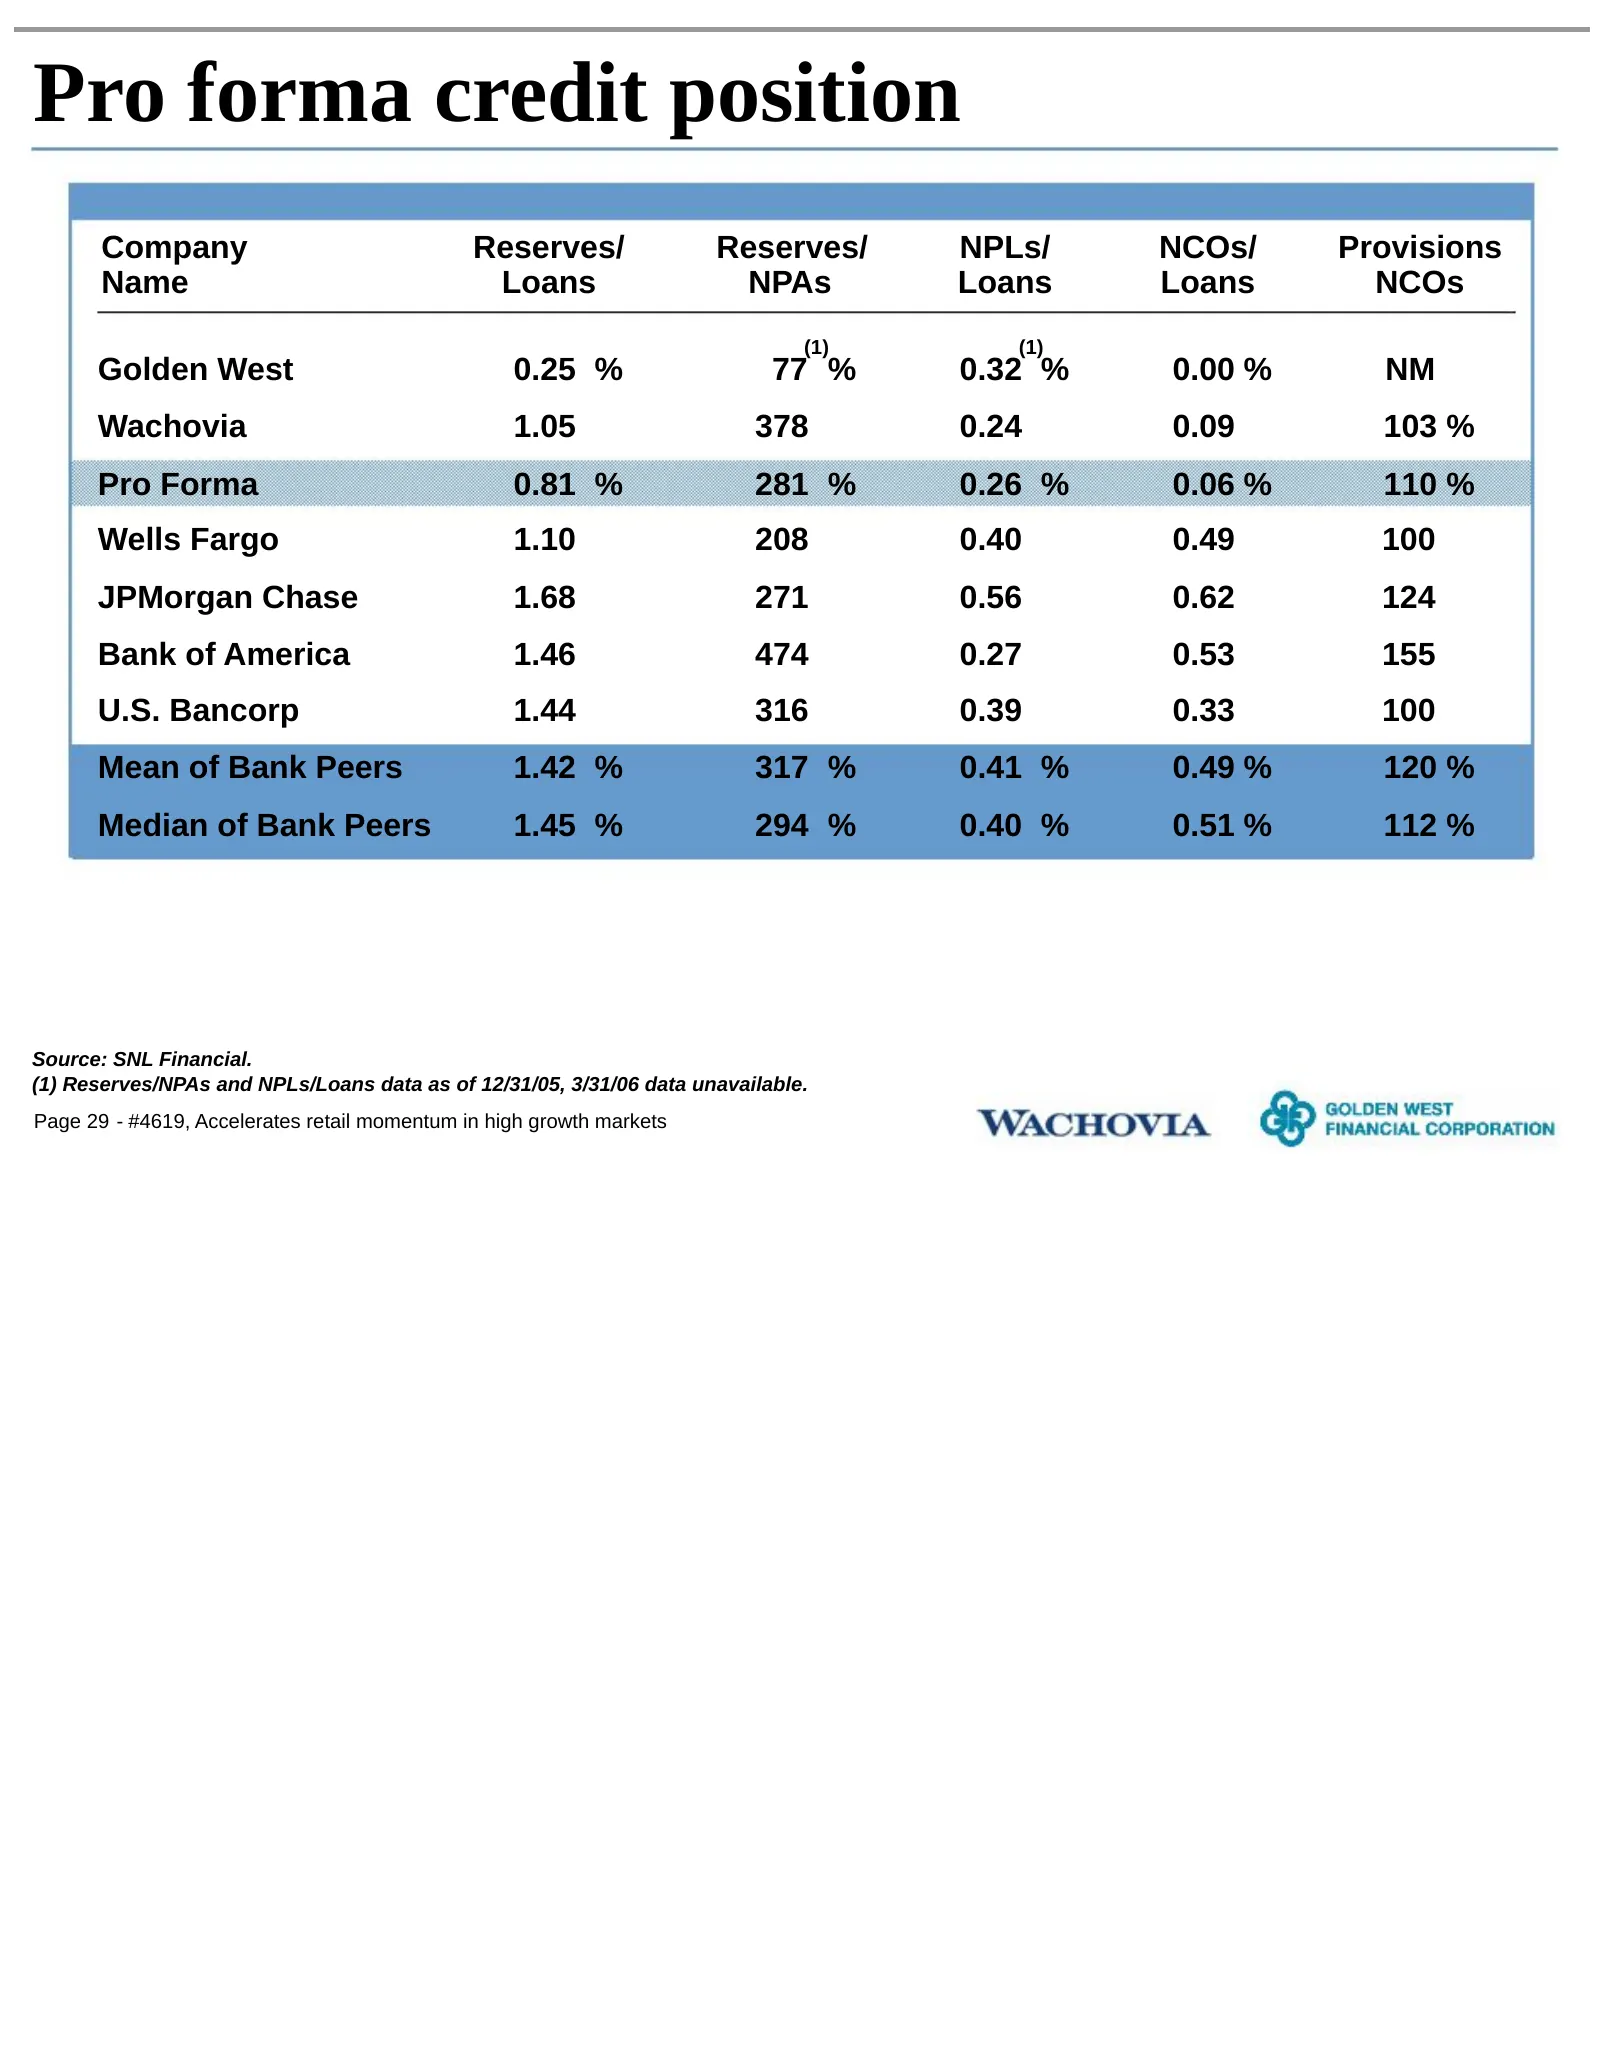
Pro forma credit position Company Reserves/ Reserves/ NPLs/ NCOs/ Provisions Name Loans NPAs Loans Loans NCOs (1) (1) Golden West 0.25 % 77 % 0.32 % 0.00 % NM Wachovia 1.05 378 0.24 0.09 103 % Pro Forma 0.81 % 281 % 0.26 % 0.06 % 110 % Wells Fargo 1.10 208 0.40 0.49 100 JPMorgan Chase 1.68 271 0.56
Slide 31: Cautionary statement
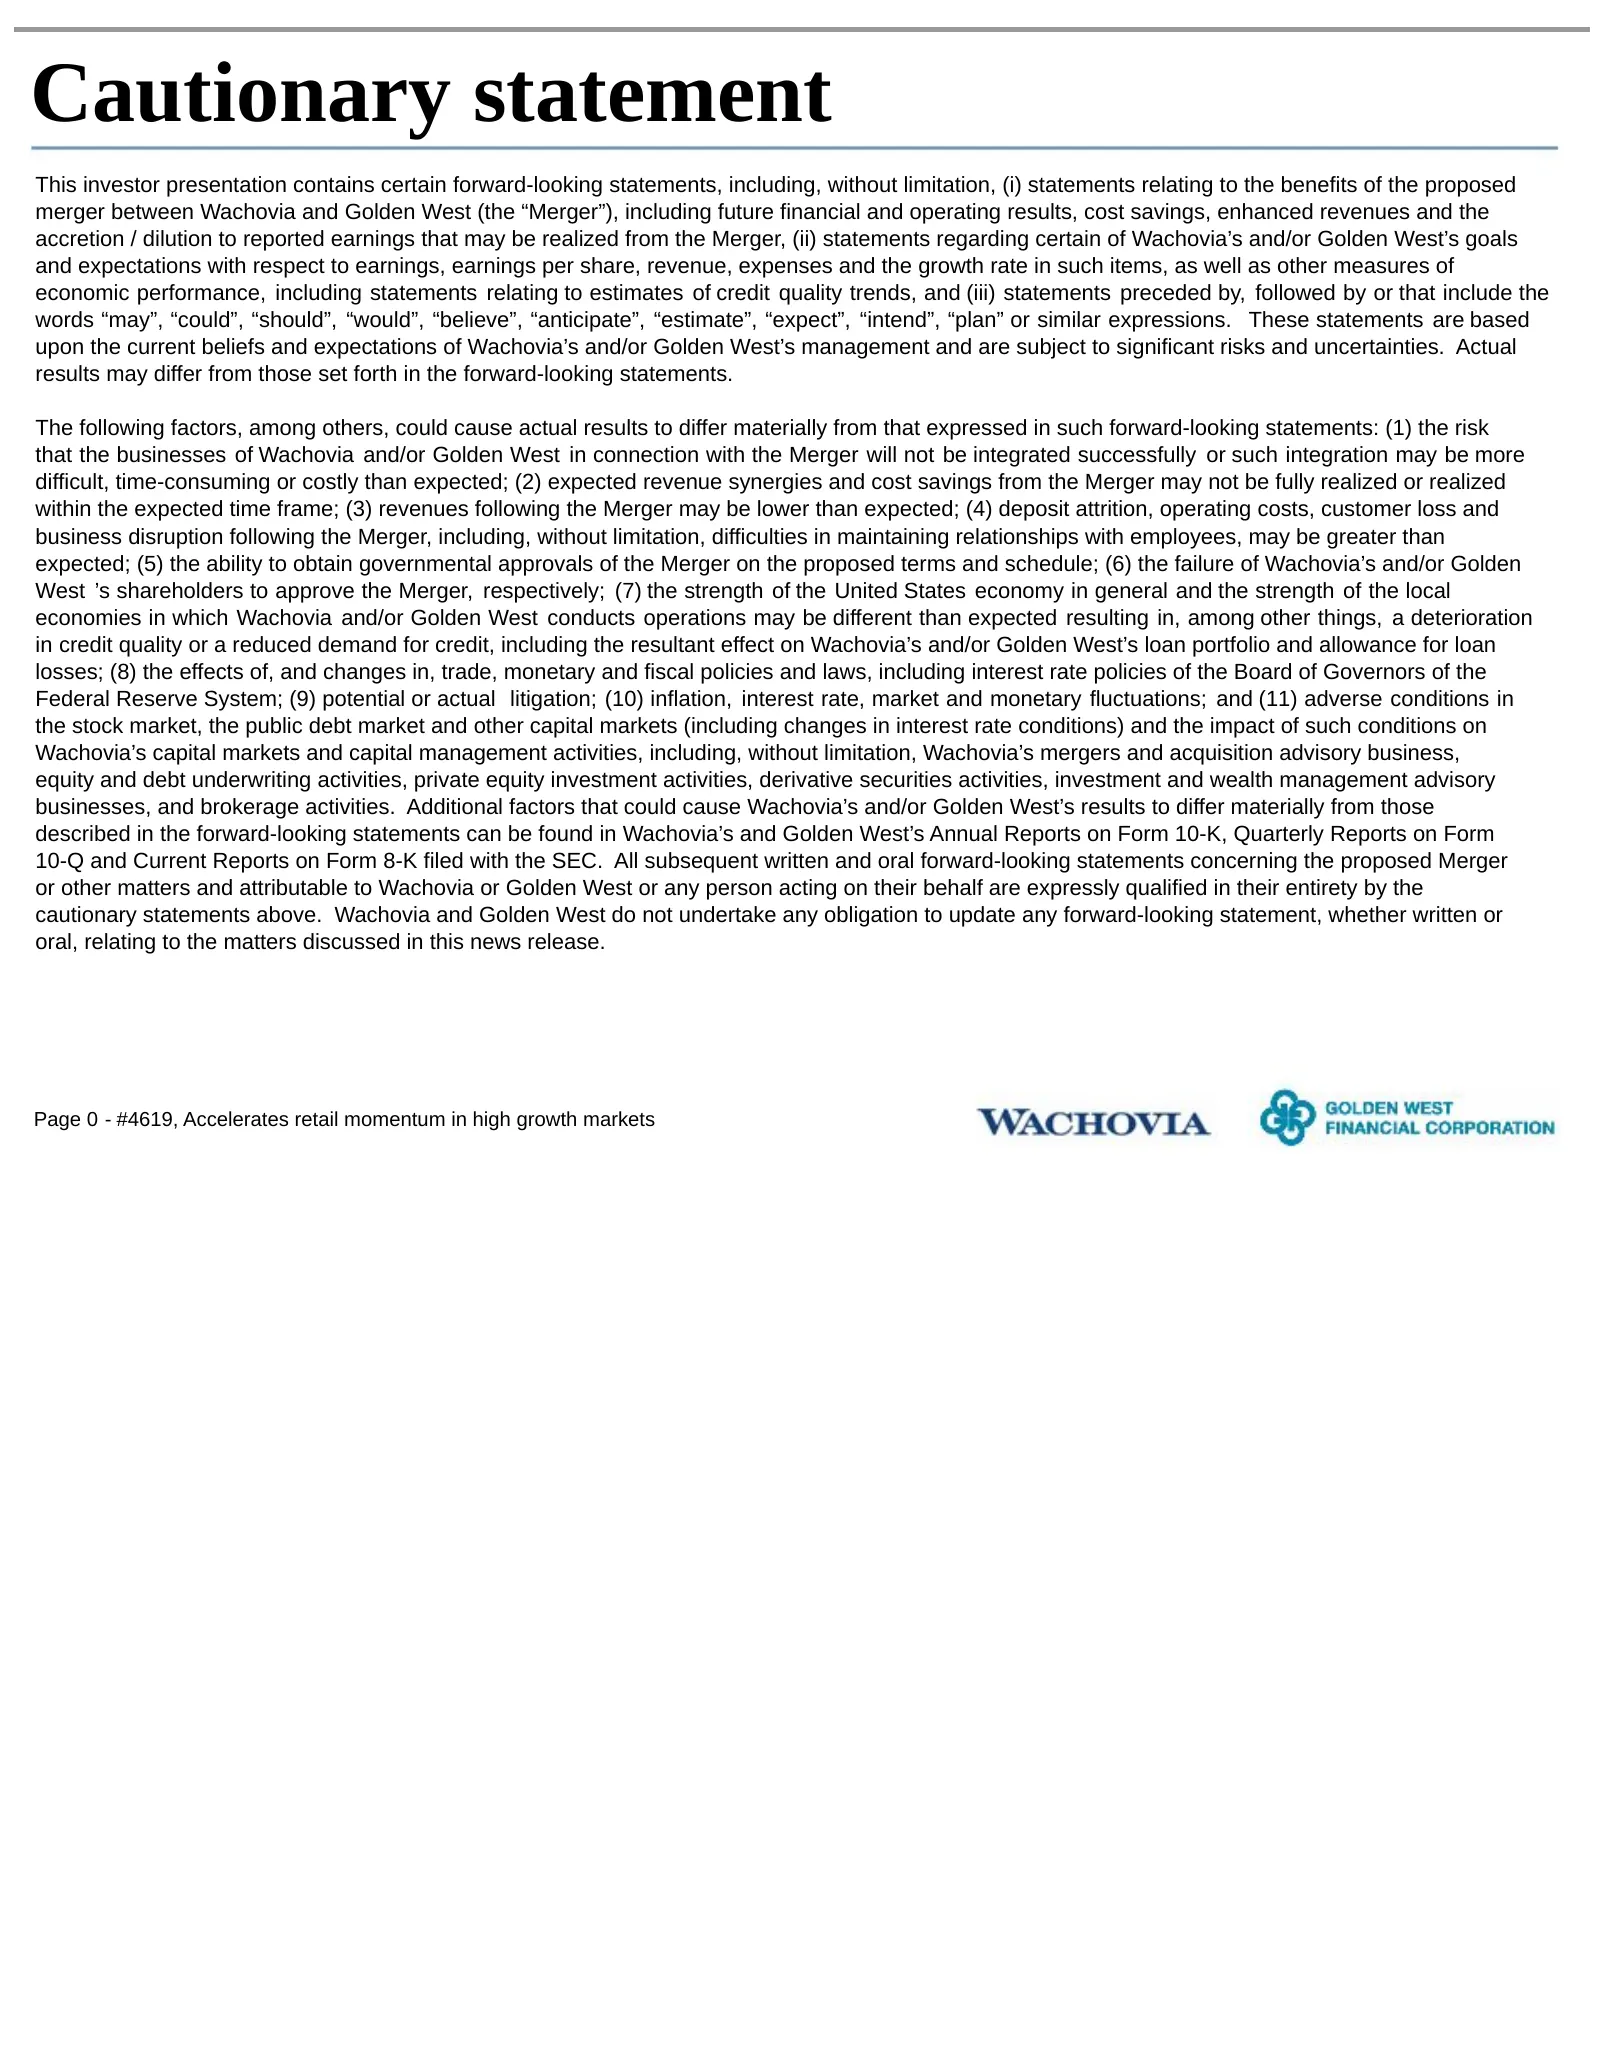
Cautionary statement This investor presentation contains certain forward-looking statements, including, without limitation, (i) statements relating to the benefits of the proposed merger between Wachovia and Golden West (the “Merger”), including future financial and operating results, cost savings,
Slide 32: Additional information
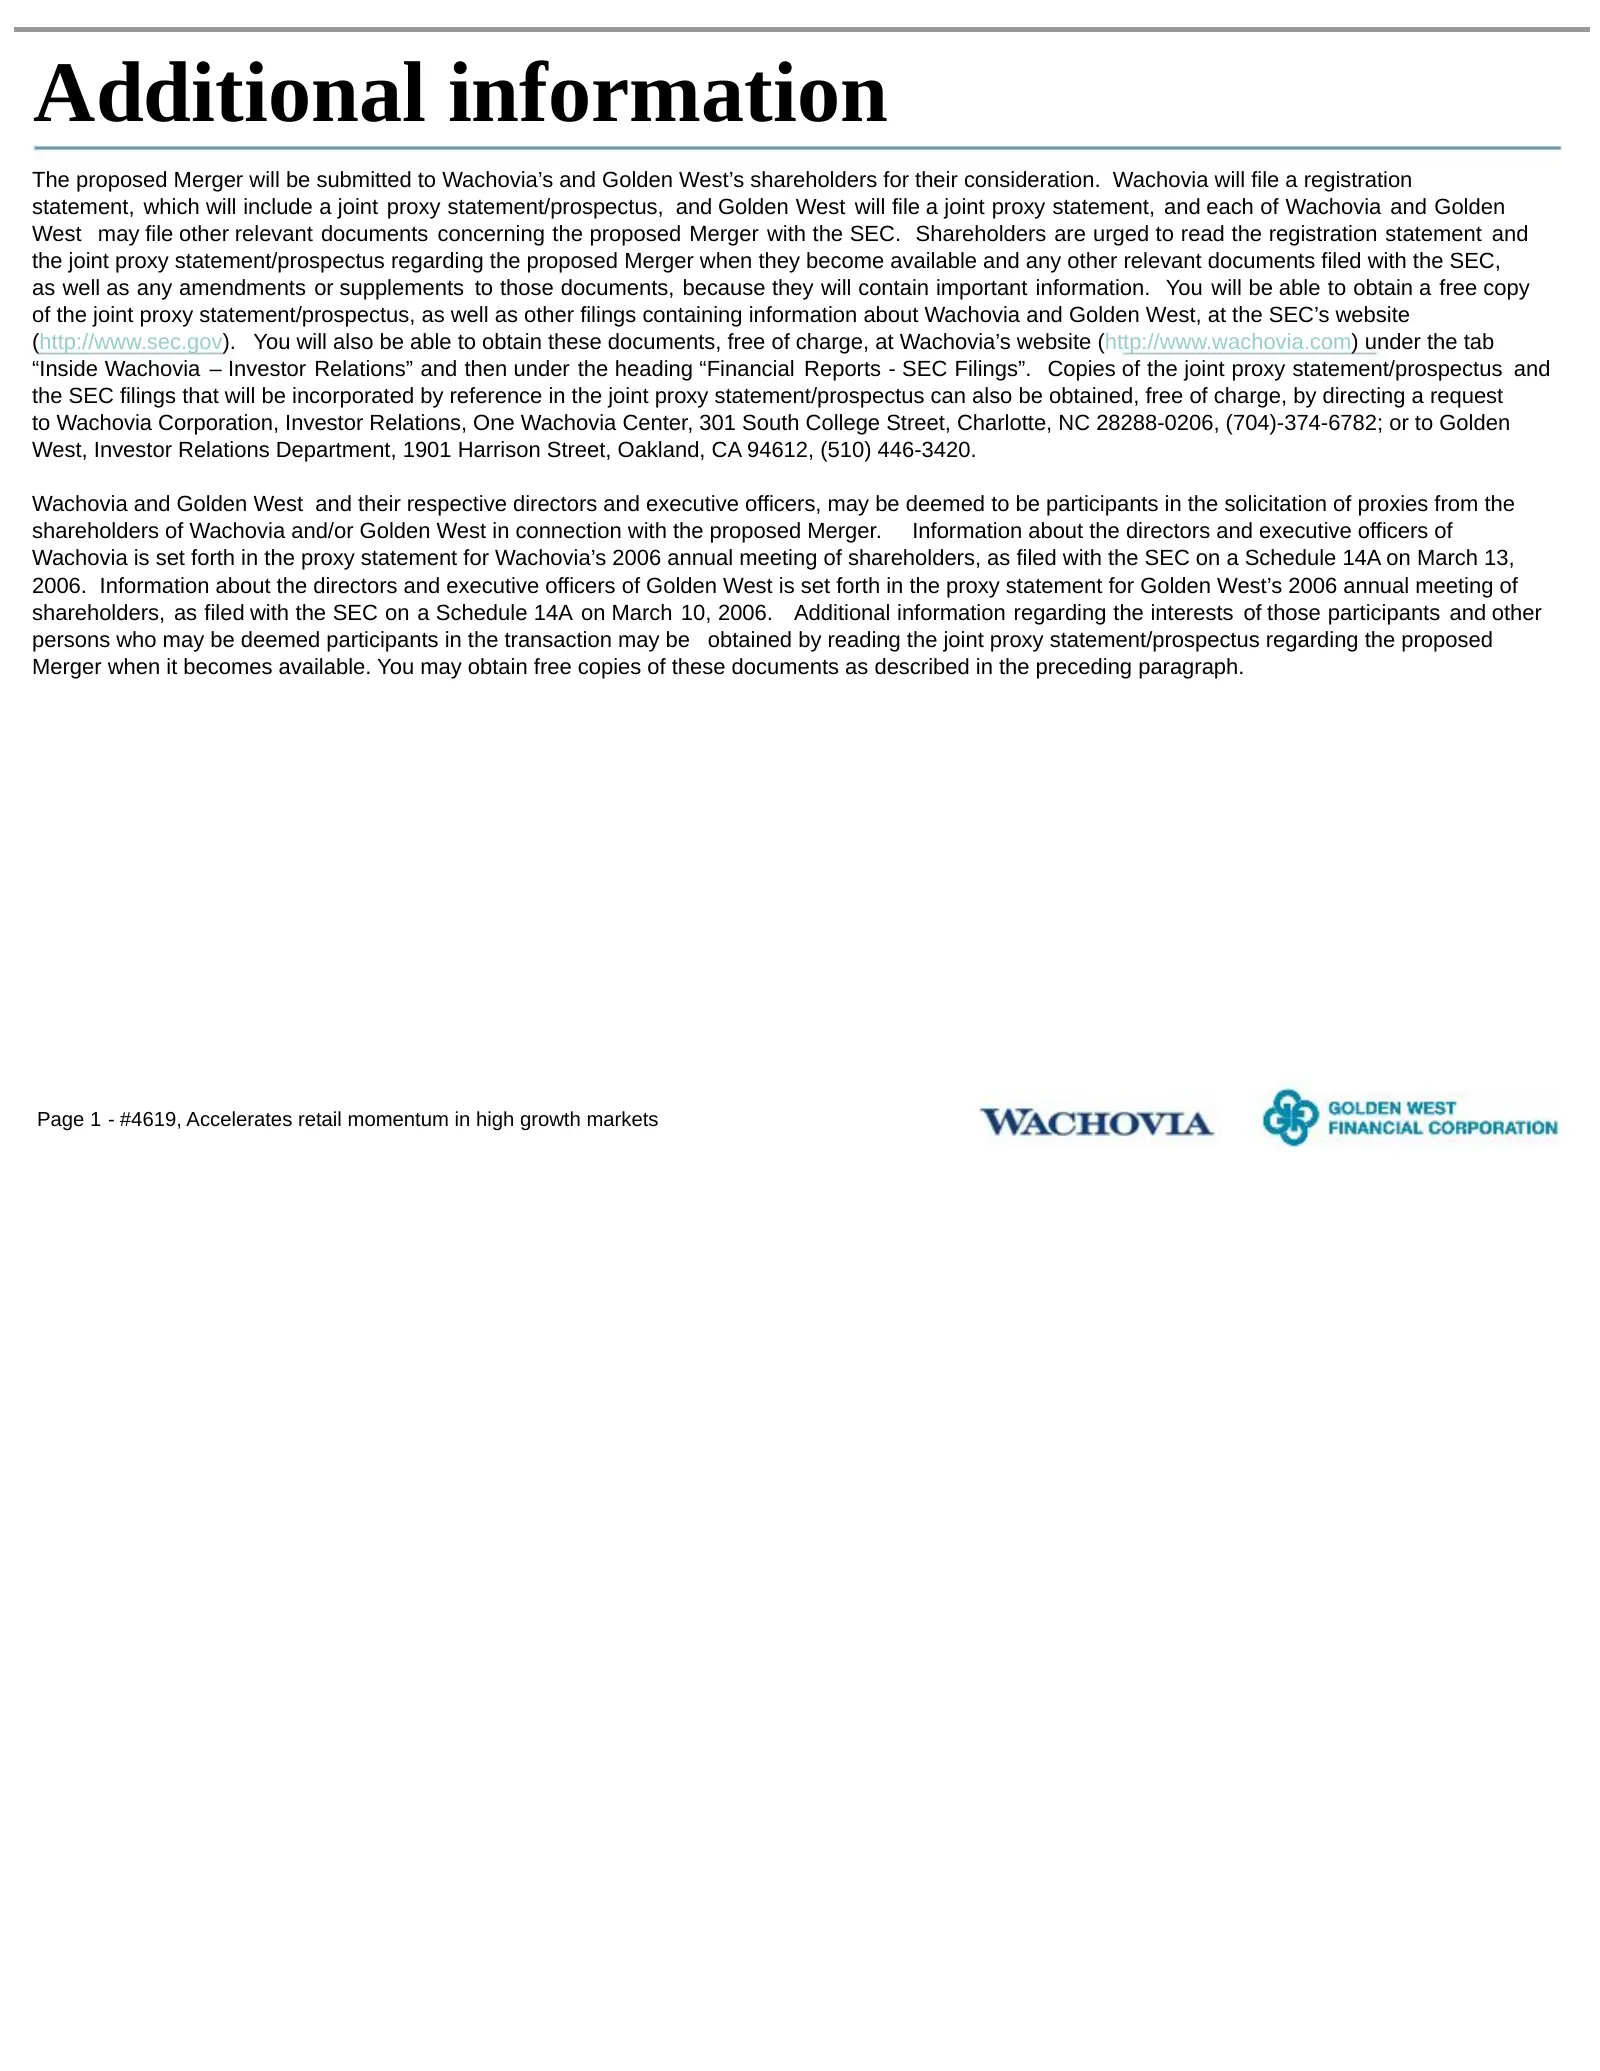
Additional information The proposed Merger will be submitted to Wachovia’s and Golden West’s shareholders for their consideration. Wachovia will file a registration statement, which will include a joint proxy statement/prospectus, and Golden West will file a joint proxy statement, and each of Wachov
Source: SEC EDGAR · 425 filed May 8, 2006
More decks from Wachovia Corp New
 Q3 2008 Earnings Presentation41 slides · Oct 22, 2008
 Merger or Acquisition (October 2008)15 slides · Oct 3, 2008
 Lehman Brothers Global Financial Services Conference 200828 slides · Sep 9, 2008
 Q2 2008 Earnings Presentation56 slides · Jul 22, 2008
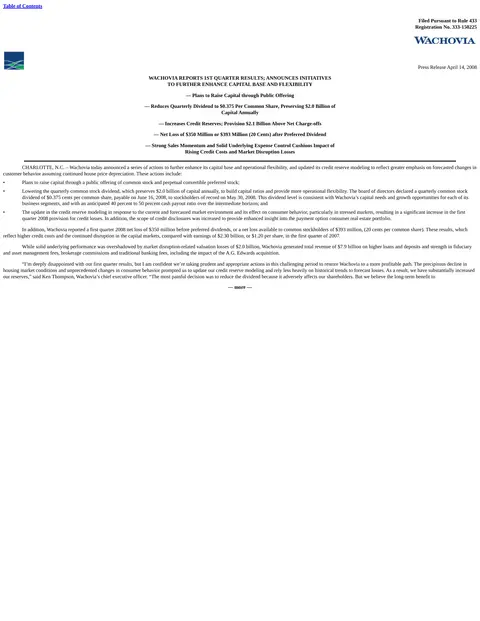 IPO Roadshow (April 2008)104 slides · Apr 14, 2008
 Q1 2008 Earnings Presentation45 slides · Apr 14, 2008