Wachovia Corp New
Wachovia Corp New — Q3 2008 Earnings Presentation
41 slides from Wachovia Corp New's earnings presentation, Oct 22, 2008
Slide 1: Wachovia Corporation 3Q08 Financial Highlights
Exhibit (99)(b) Wachovia Corporation 3Q08 Financial Highlights October 22, 2008
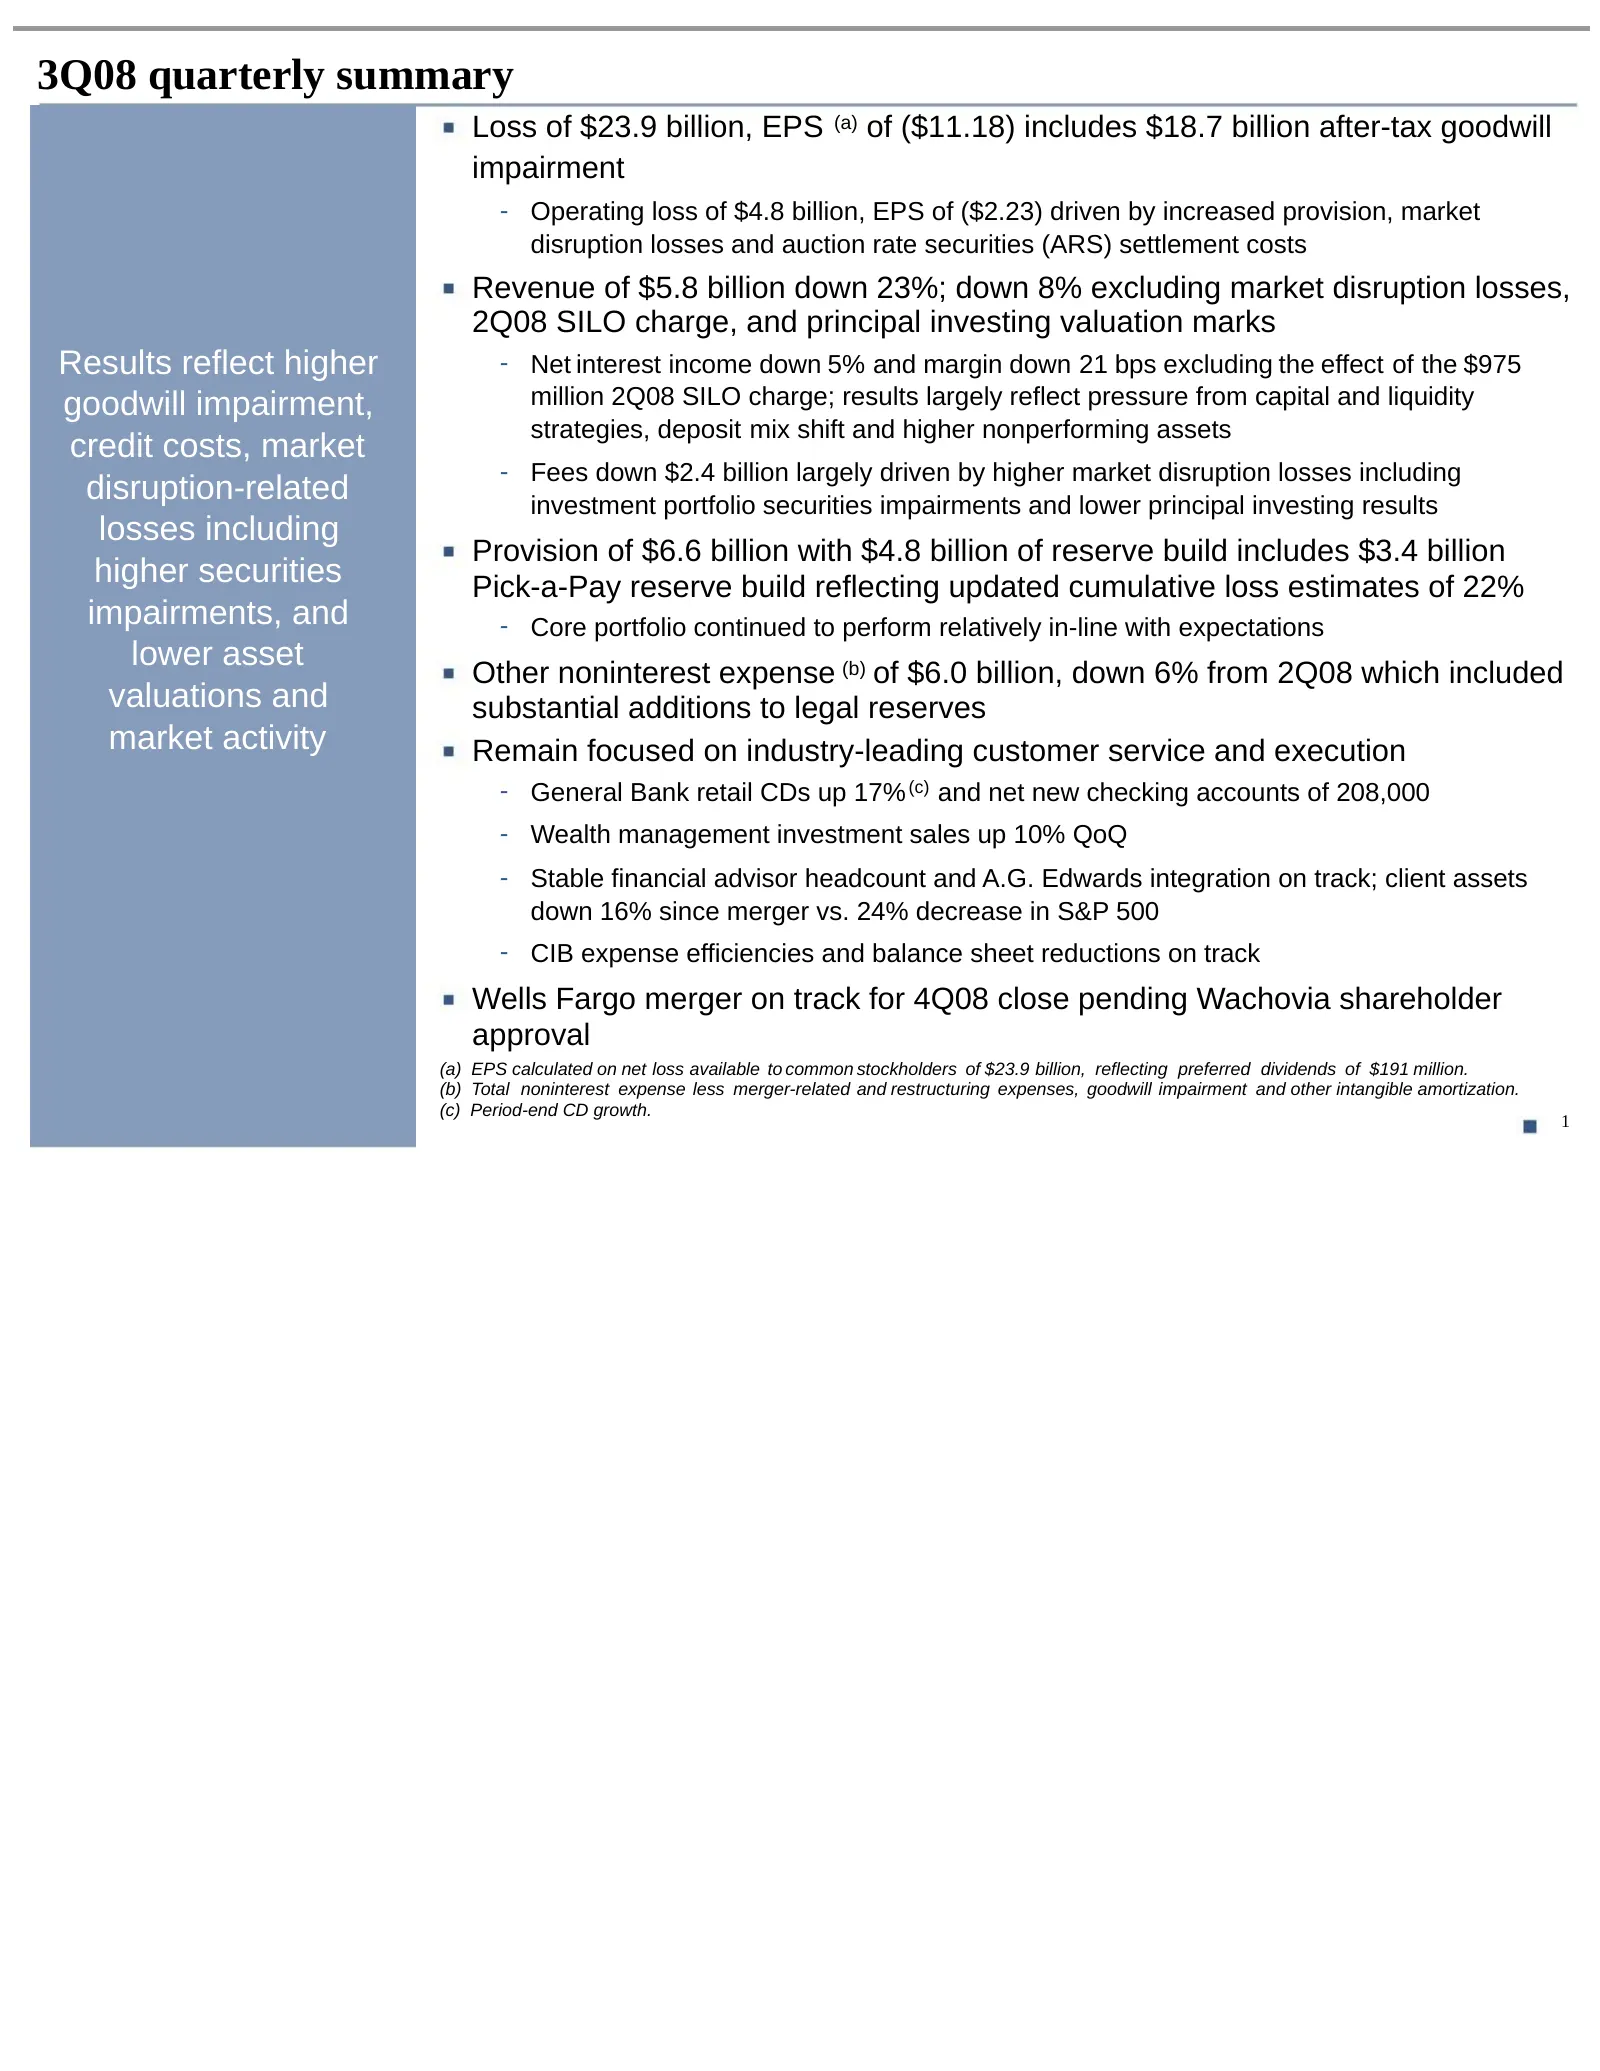
Slide 2: 3Q08 quarterly summary
3Q08 quarterly summary Loss of $23.9 billion, EPS (a) of ($11.18) includes $18.7 billion after-tax goodwill impairment - Operating loss of $4.8 billion, EPS of ($2.23) driven by increased provision, market disruption losses and auction rate securities (ARS) settlement costs Revenue of $5.8 billion d
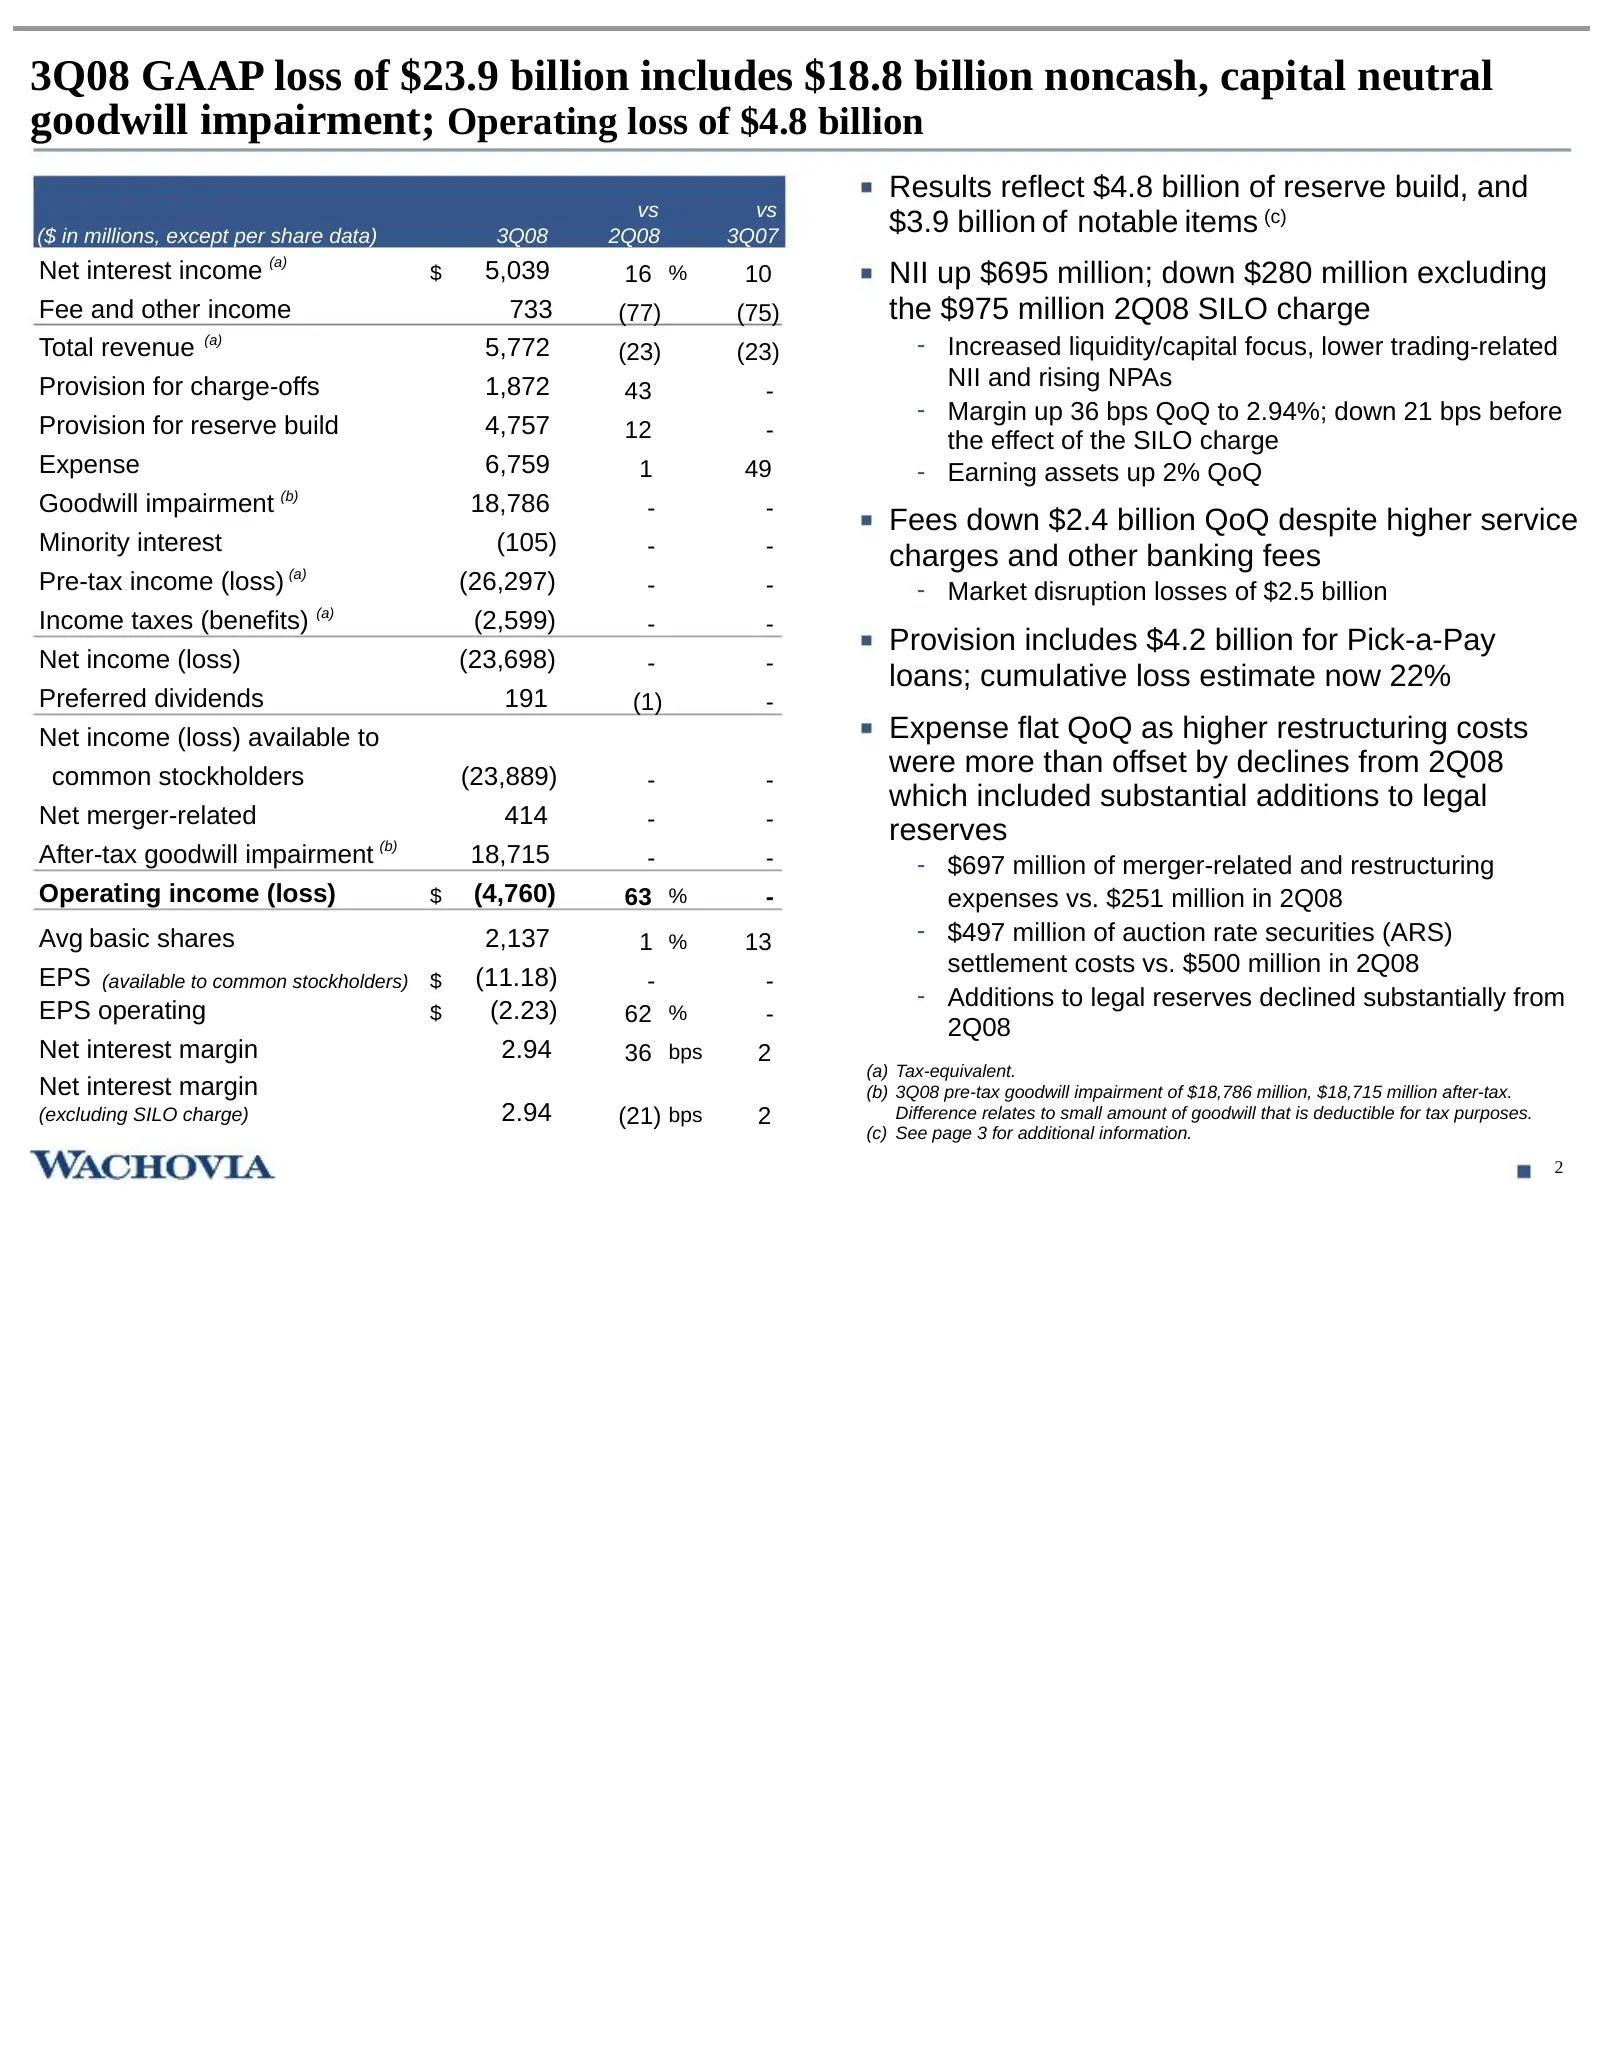
Slide 3: 3Q08 GAAP loss includes goodwill impairment; operating loss of $4.8 billion
3Q08 GAAP loss of $23.9 billion includes $18.8 billion noncash, capital neutral goodwill impairment; Operating loss of $4.8 billion Results reflect $4.8 billion of reserve build, and vs vs ($ in millions, except per share data) 3Q08 2Q08 3Q07 $3.9 billion of notable items (c) Net interest income (a)
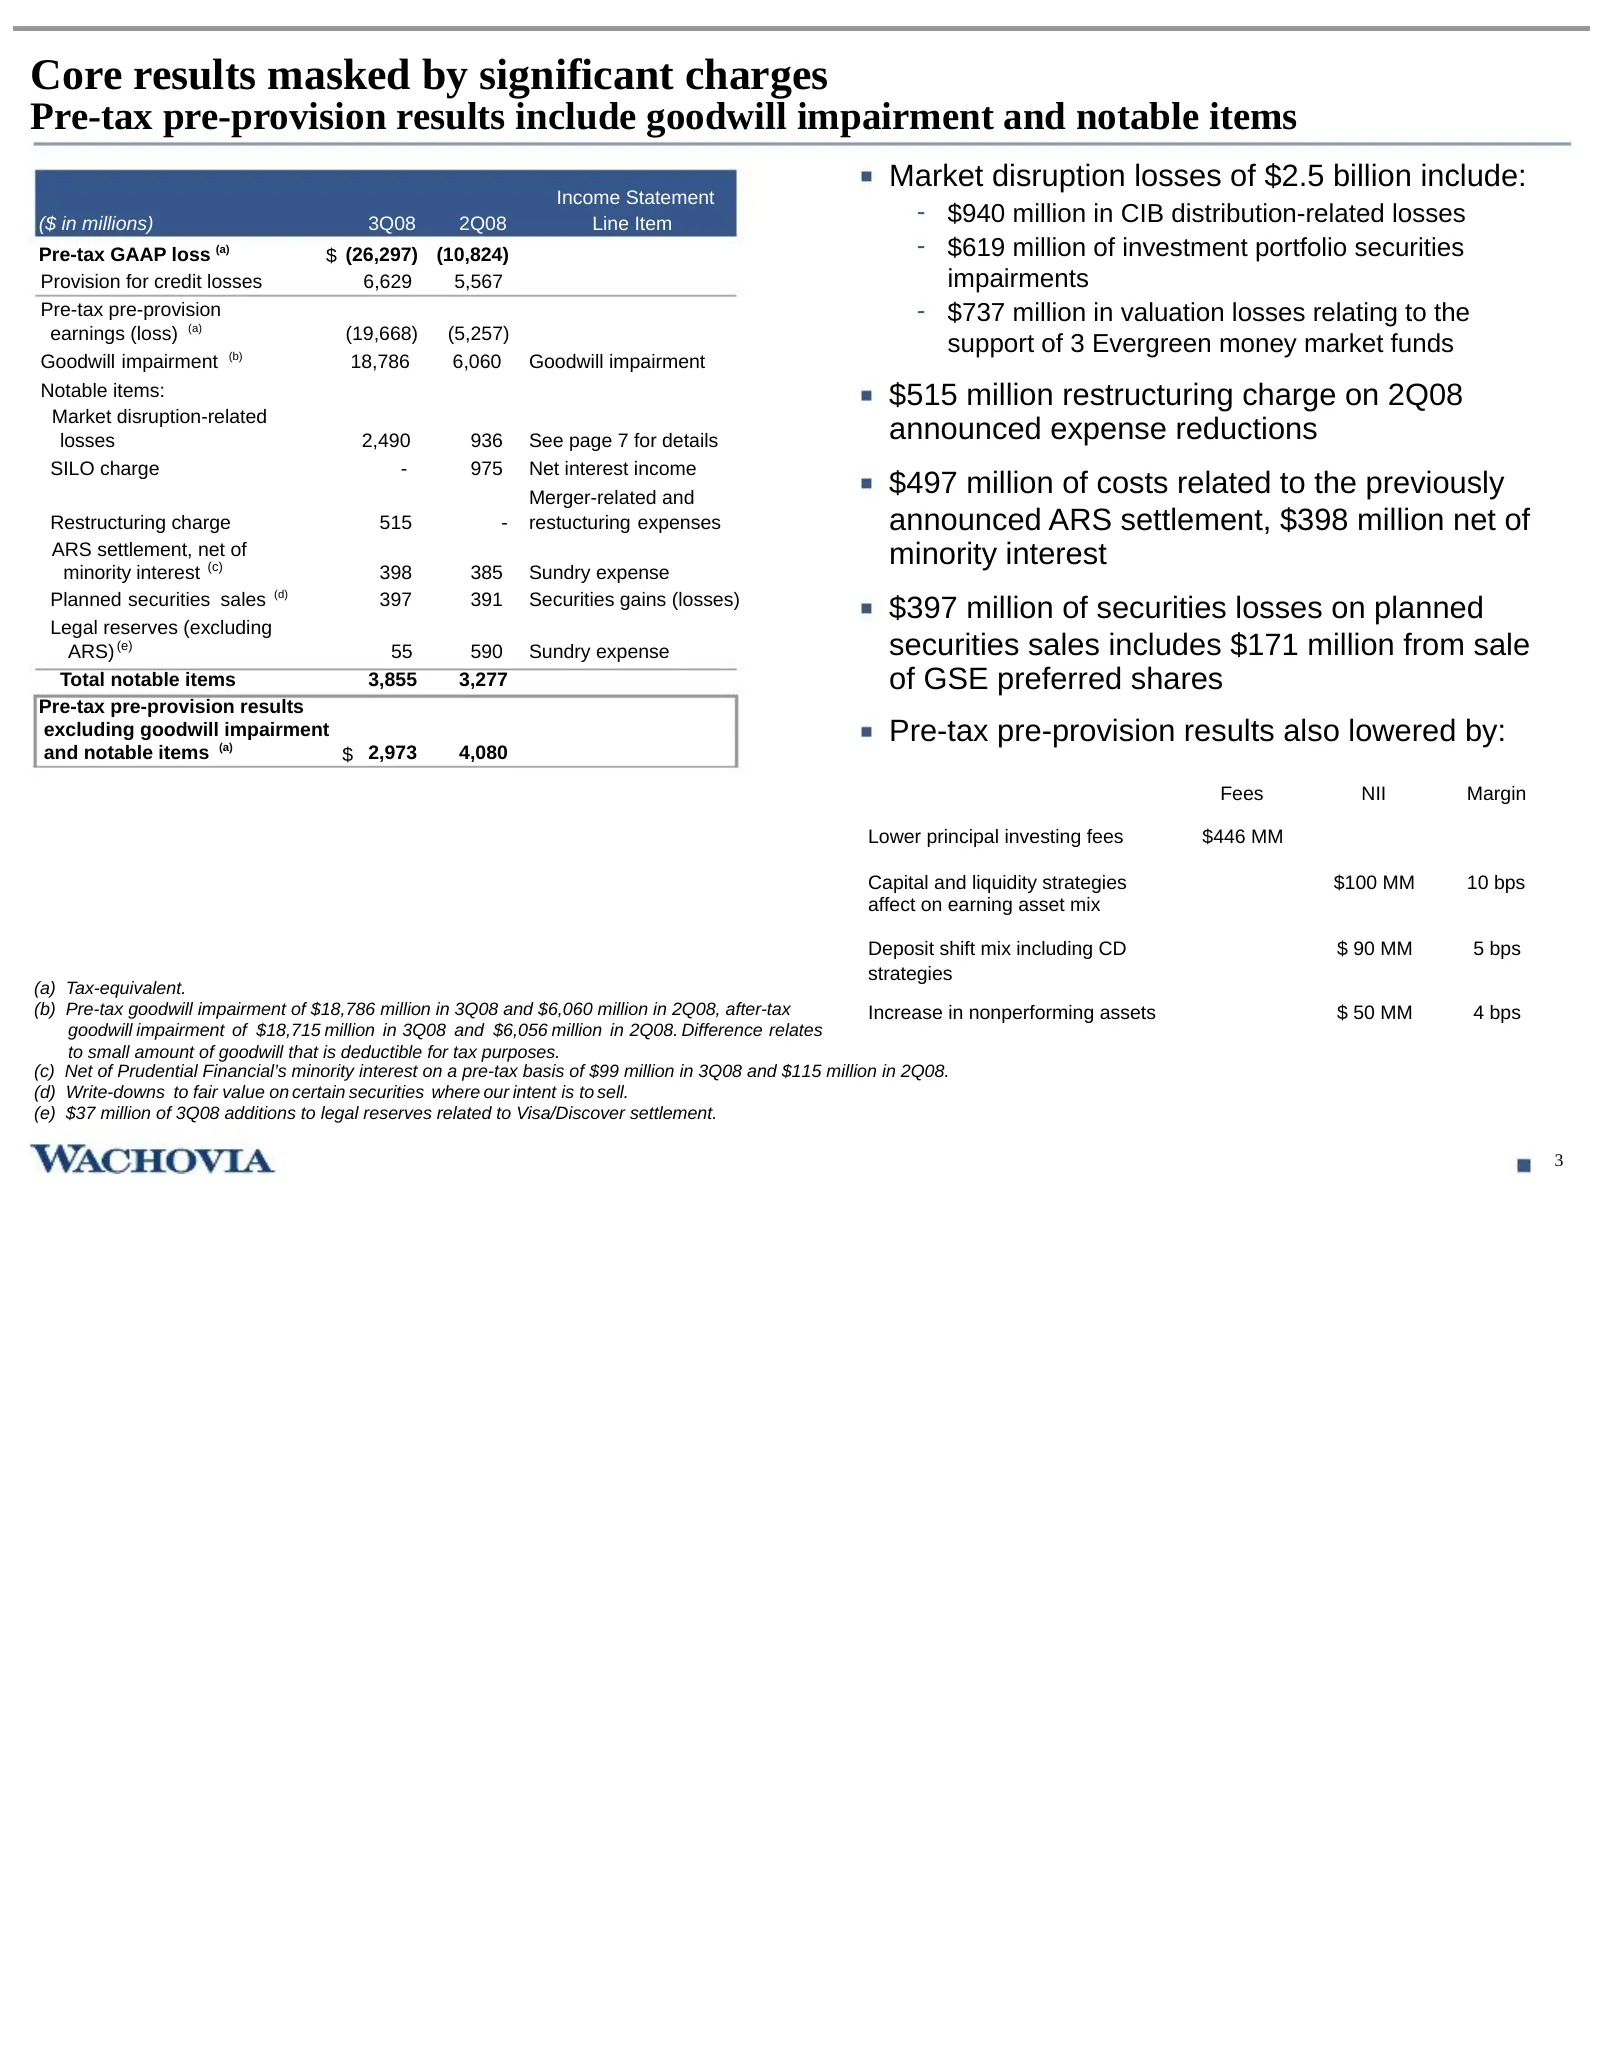
Slide 4: Core results masked by significant charges
Core results masked by significant charges Pre-tax pre-provision results include goodwill impairment and notable items Market disruption losses of $2.5 billion include: Income Statement ($ in millions) 3Q08 2Q08 Line Item - $940 million in CIB distribution-related losses Pre-tax GAAP loss (a) $ (26,
Slide 5: NII results reflect stable loan balances and capital preservation strategies
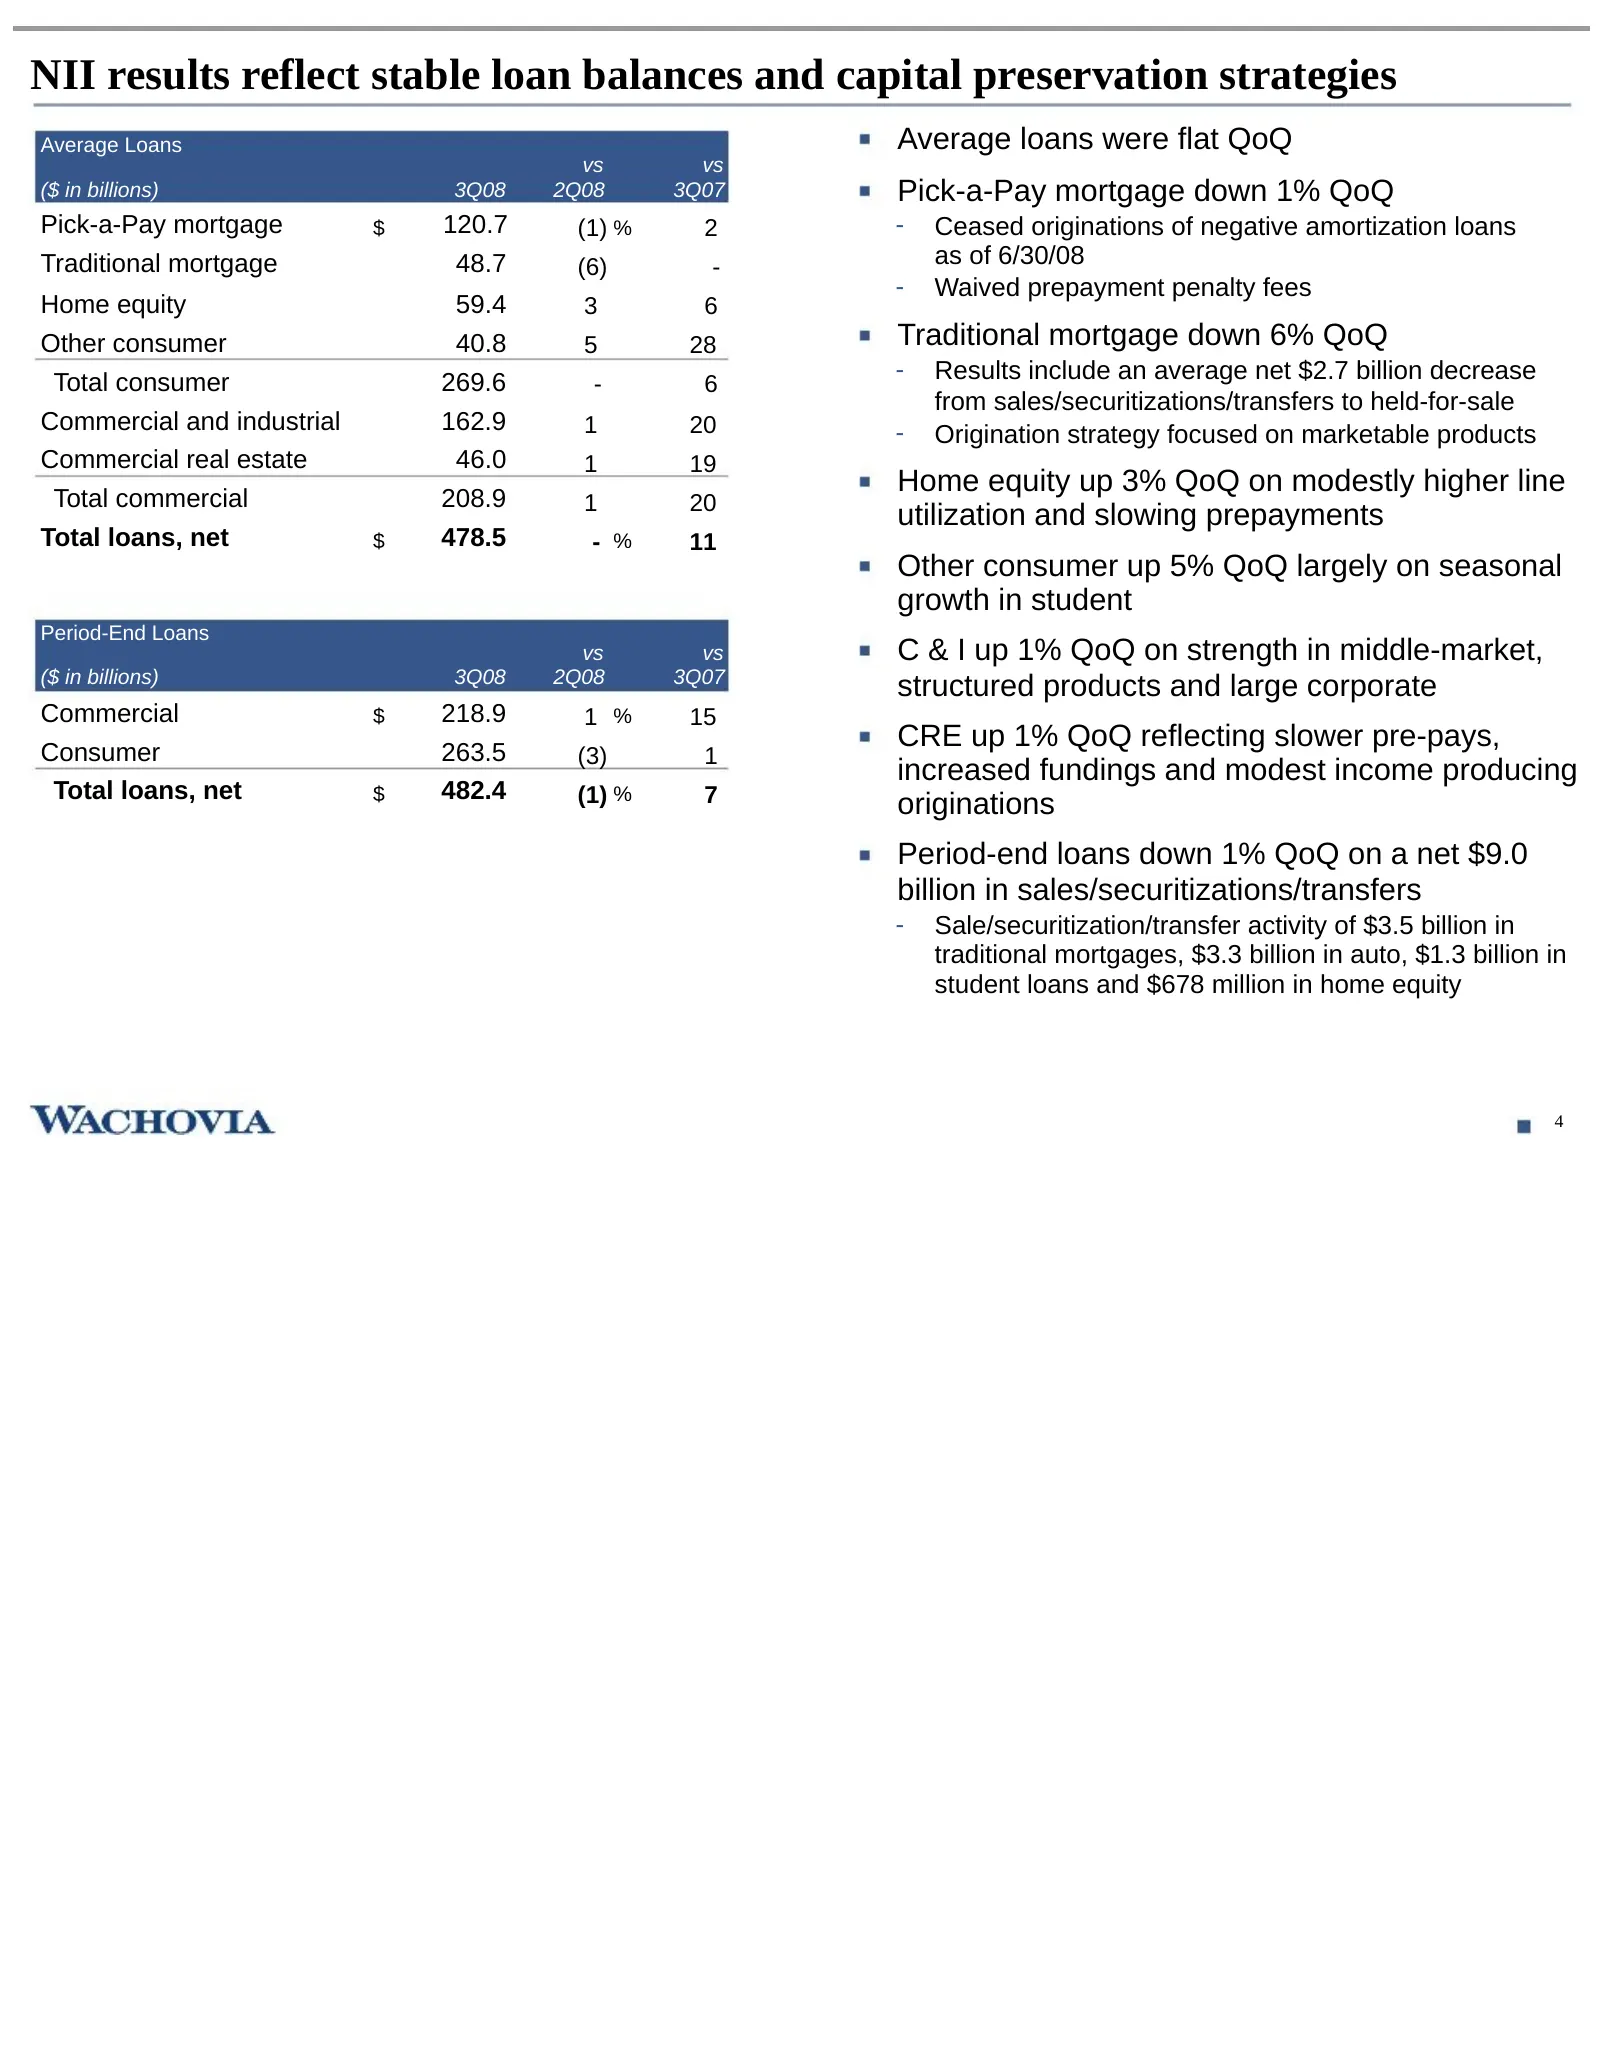
NII results reflect stable loan balances and capital preservation strategies Average Loans Average loans were flat QoQ vs vs ($ in billions) 3Q08 2Q08 3Q07 Pick-a-Pay mortgage down 1% QoQ Pick-a-Pay mortgage $ 120.7 (1) % 2 - Ceased originations of negative amortization loans Traditional mortgage 48
Slide 6: NII results reflect weaker deposit trends on market turbulence
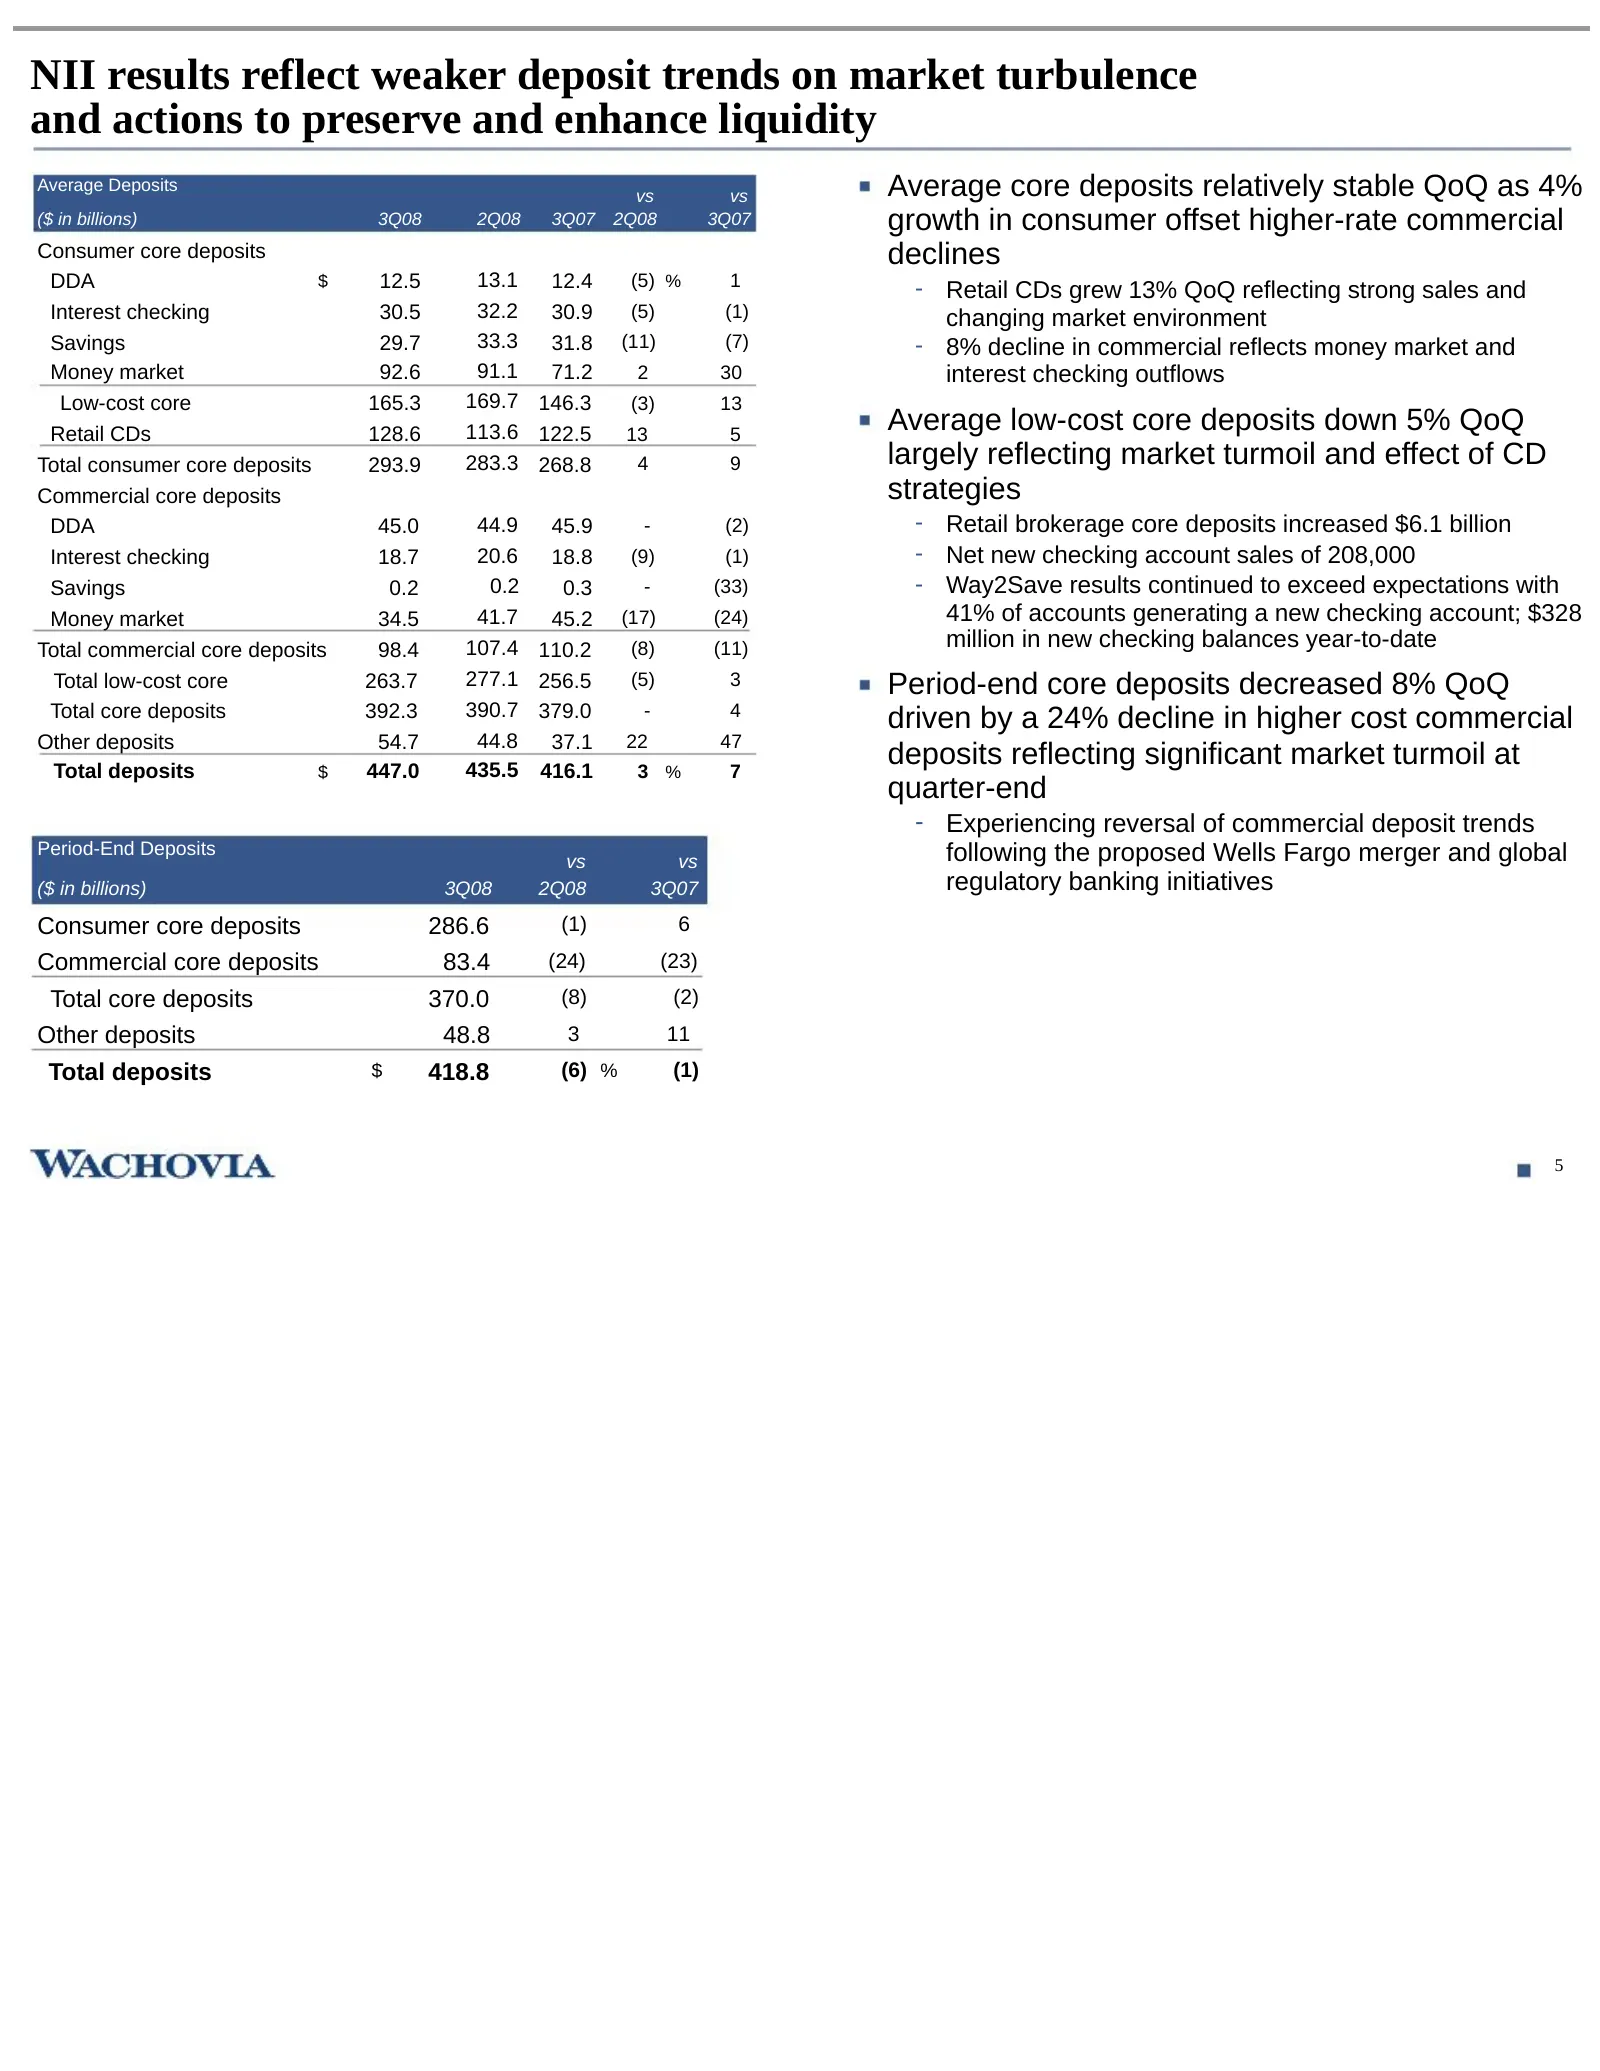
NII results reflect weaker deposit trends on market turbulence and actions to preserve and enhance liquidity Average Deposits vs vs Average core deposits relatively stable QoQ as 4% ($ in billions) 3Q08 2Q08 3Q07 2Q08 3Q07 growth in consumer offset higher-rate commercial Consumer core deposits decli
Slide 7: Fee and other income
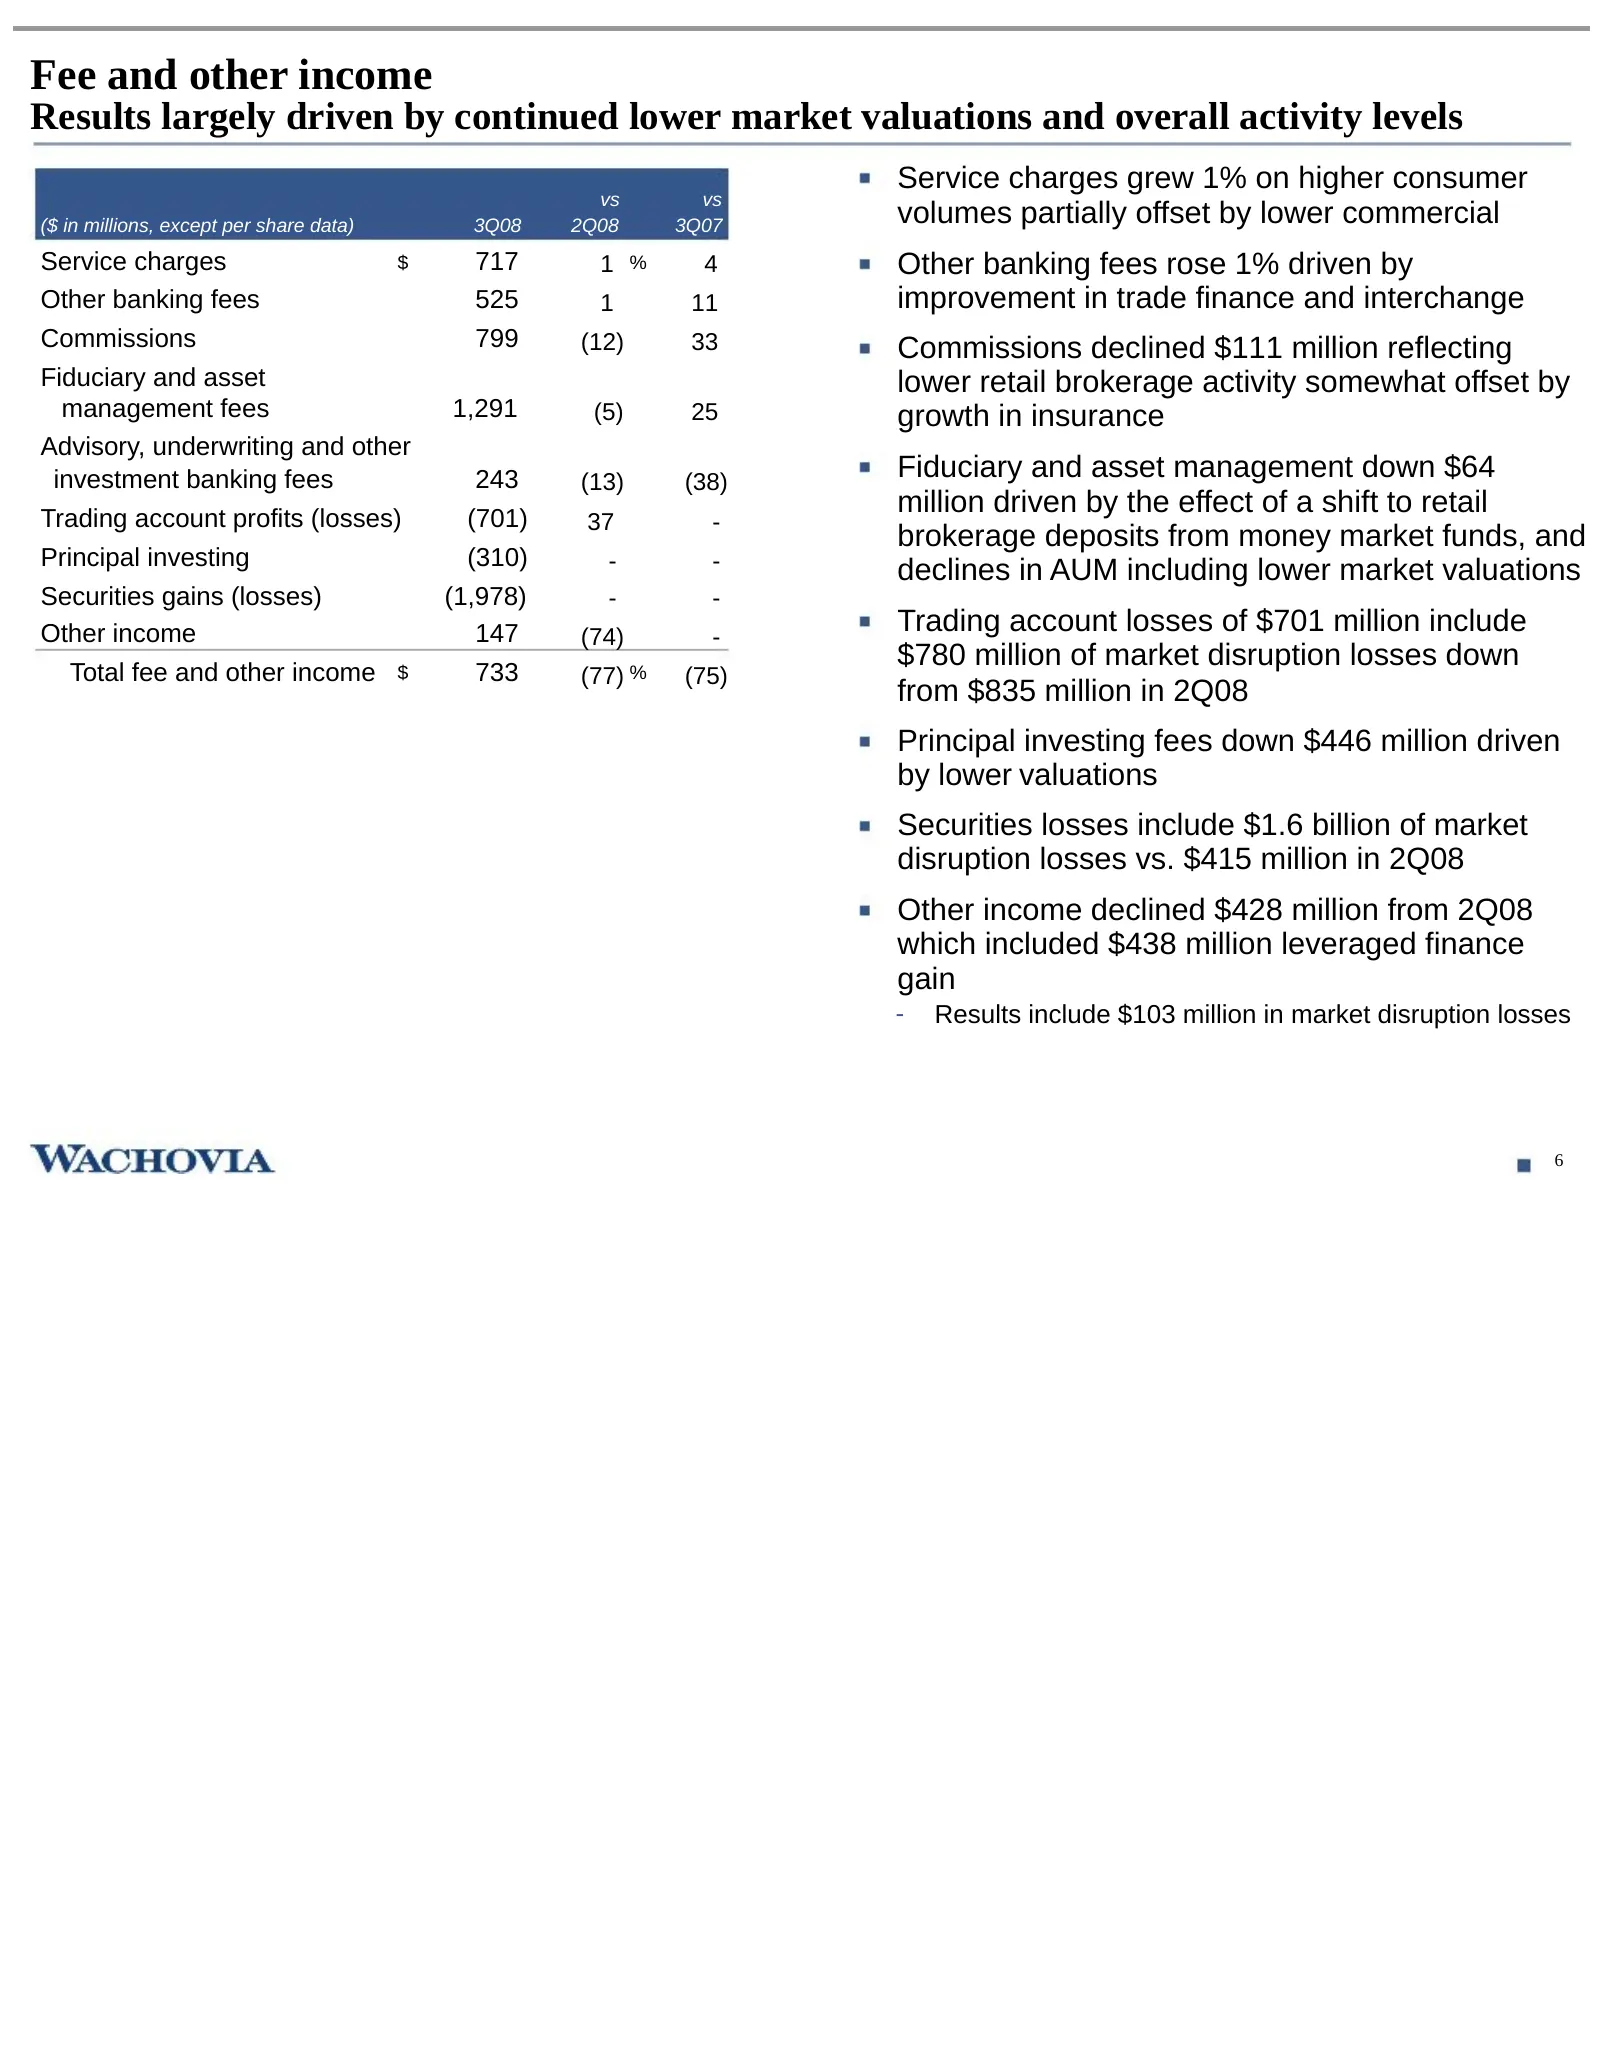
Fee and other income Results largely driven by continued lower market valuations and overall activity levels Service charges grew 1% on higher consumer vs vs ($ in millions, except per share data) 3Q08 2Q08 3Q07 volumes partially offset by lower commercial Service charges $ 717 1 % 4 Other banking f
Slide 8: Market disruption-related losses driven by impairment losses
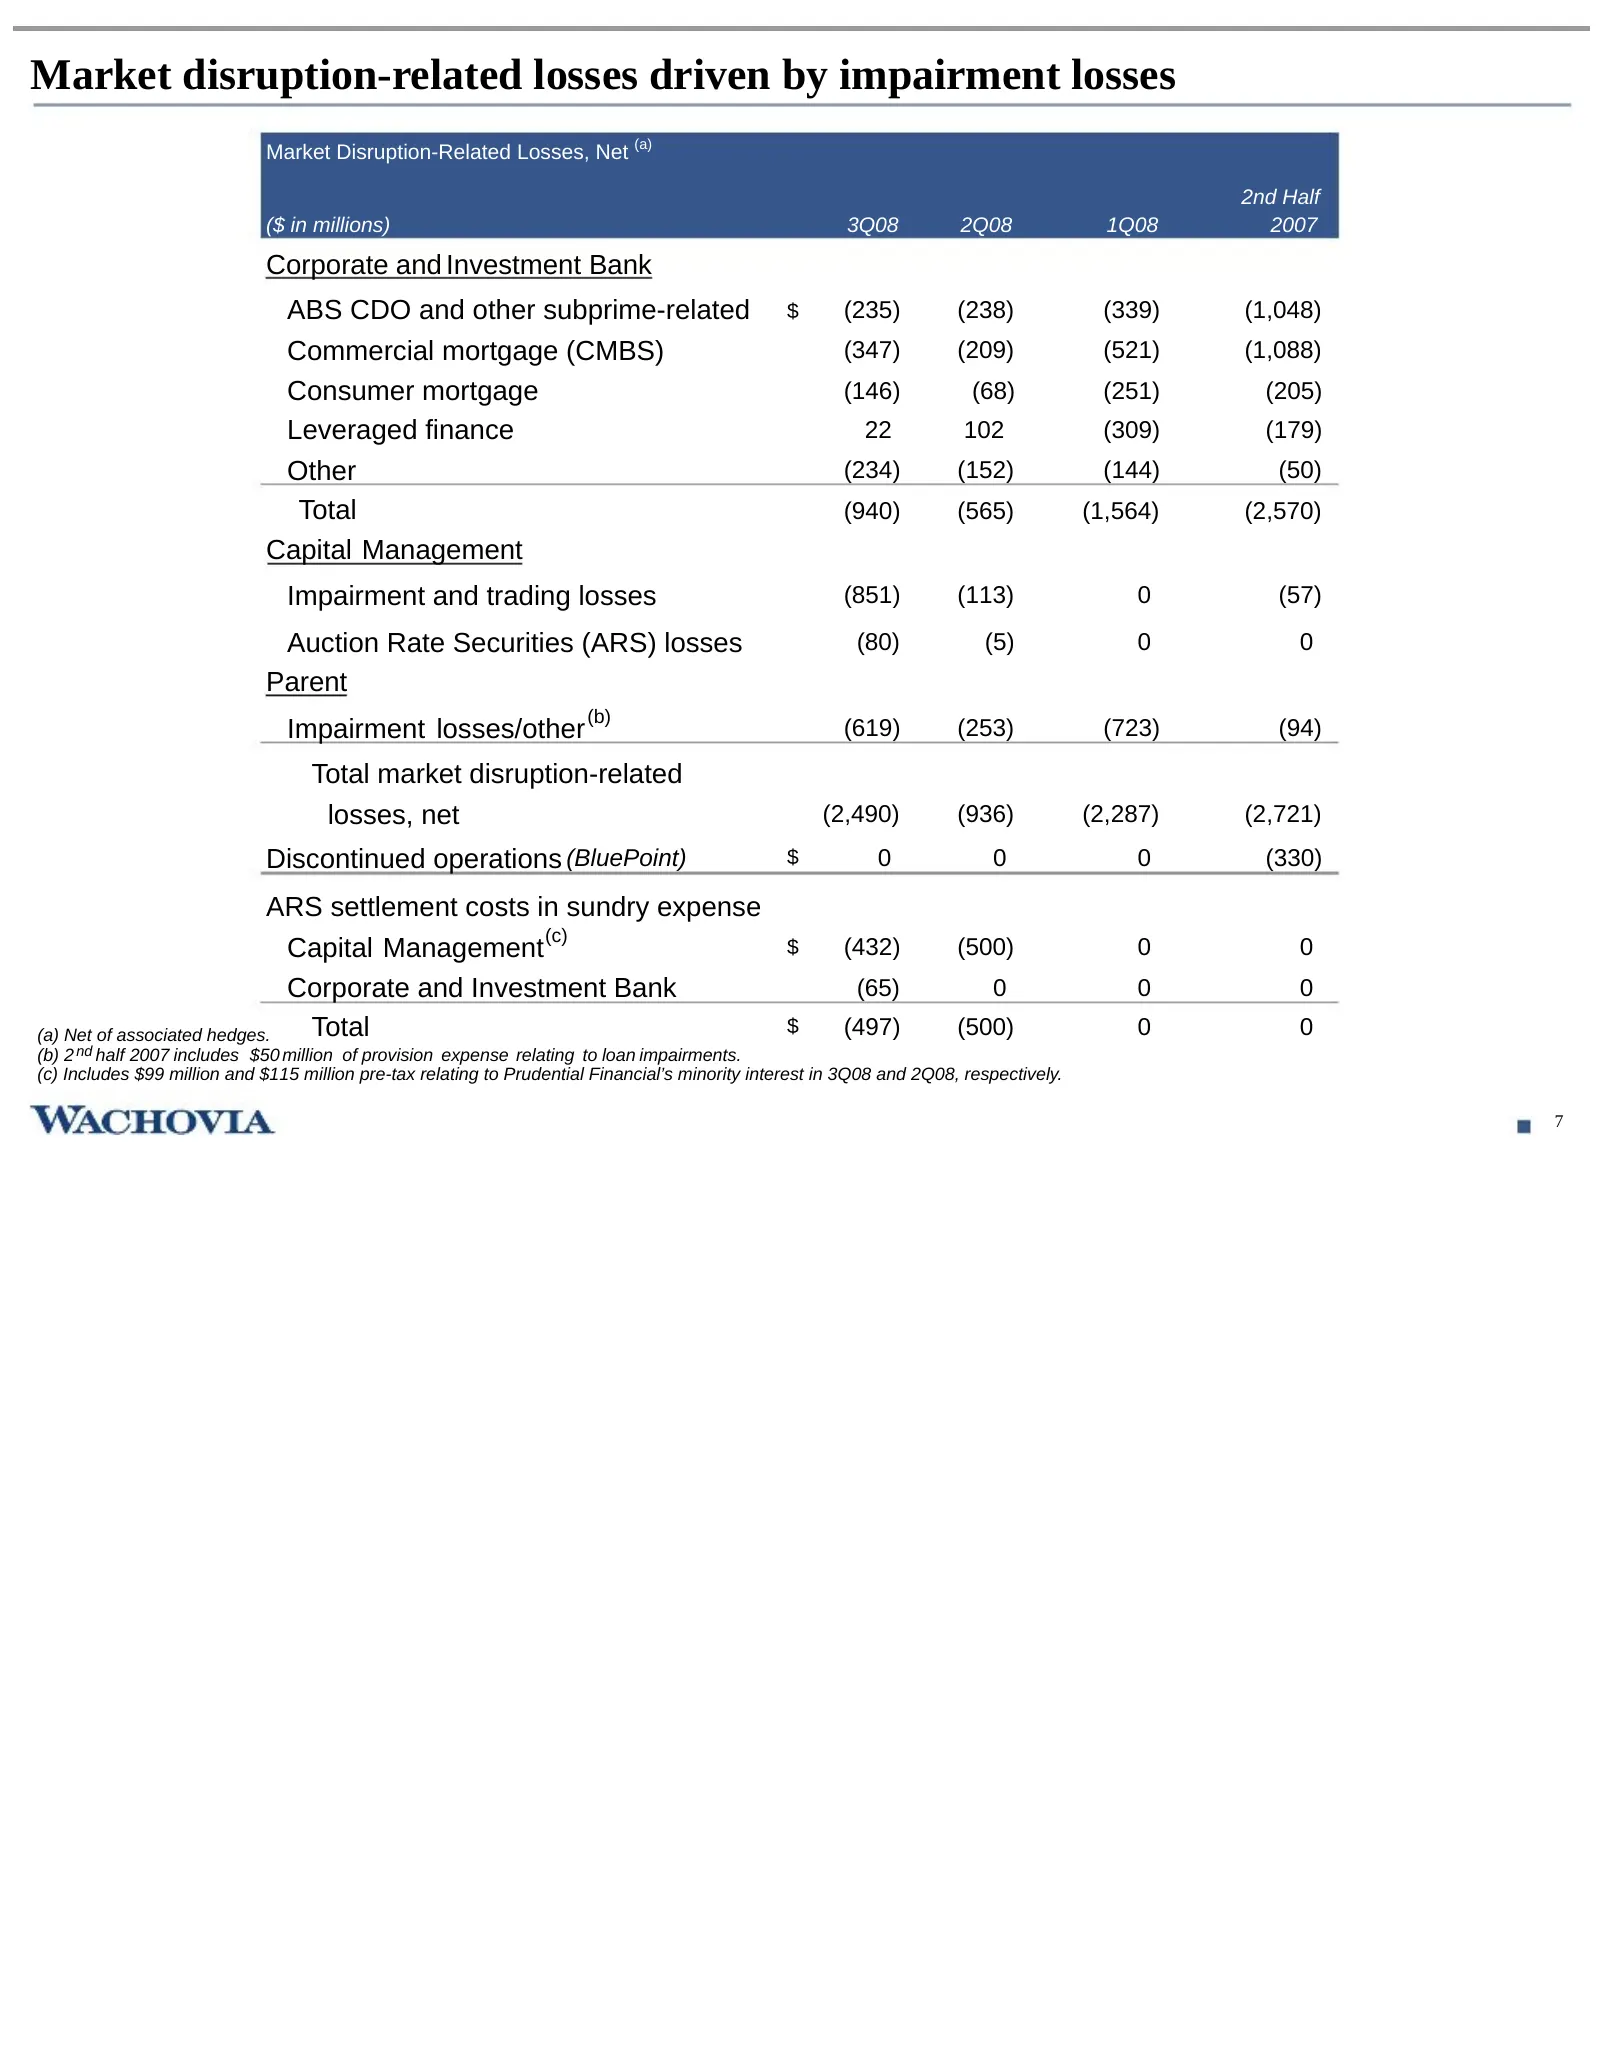
Market disruption-related losses driven by impairment losses Market Disruption-Related Losses, Net (a) 2nd Half ($ in millions) 3Q08 2Q08 1Q08 2007 Corporate and Investment Bank ABS CDO and other subprime-related $ (235) (238) (339) (1,048) Commercial mortgage (CMBS) (347) (209) (521) (1,088) Consum
Slide 9: General Bank results affected by housing market decline and liquidity strategies
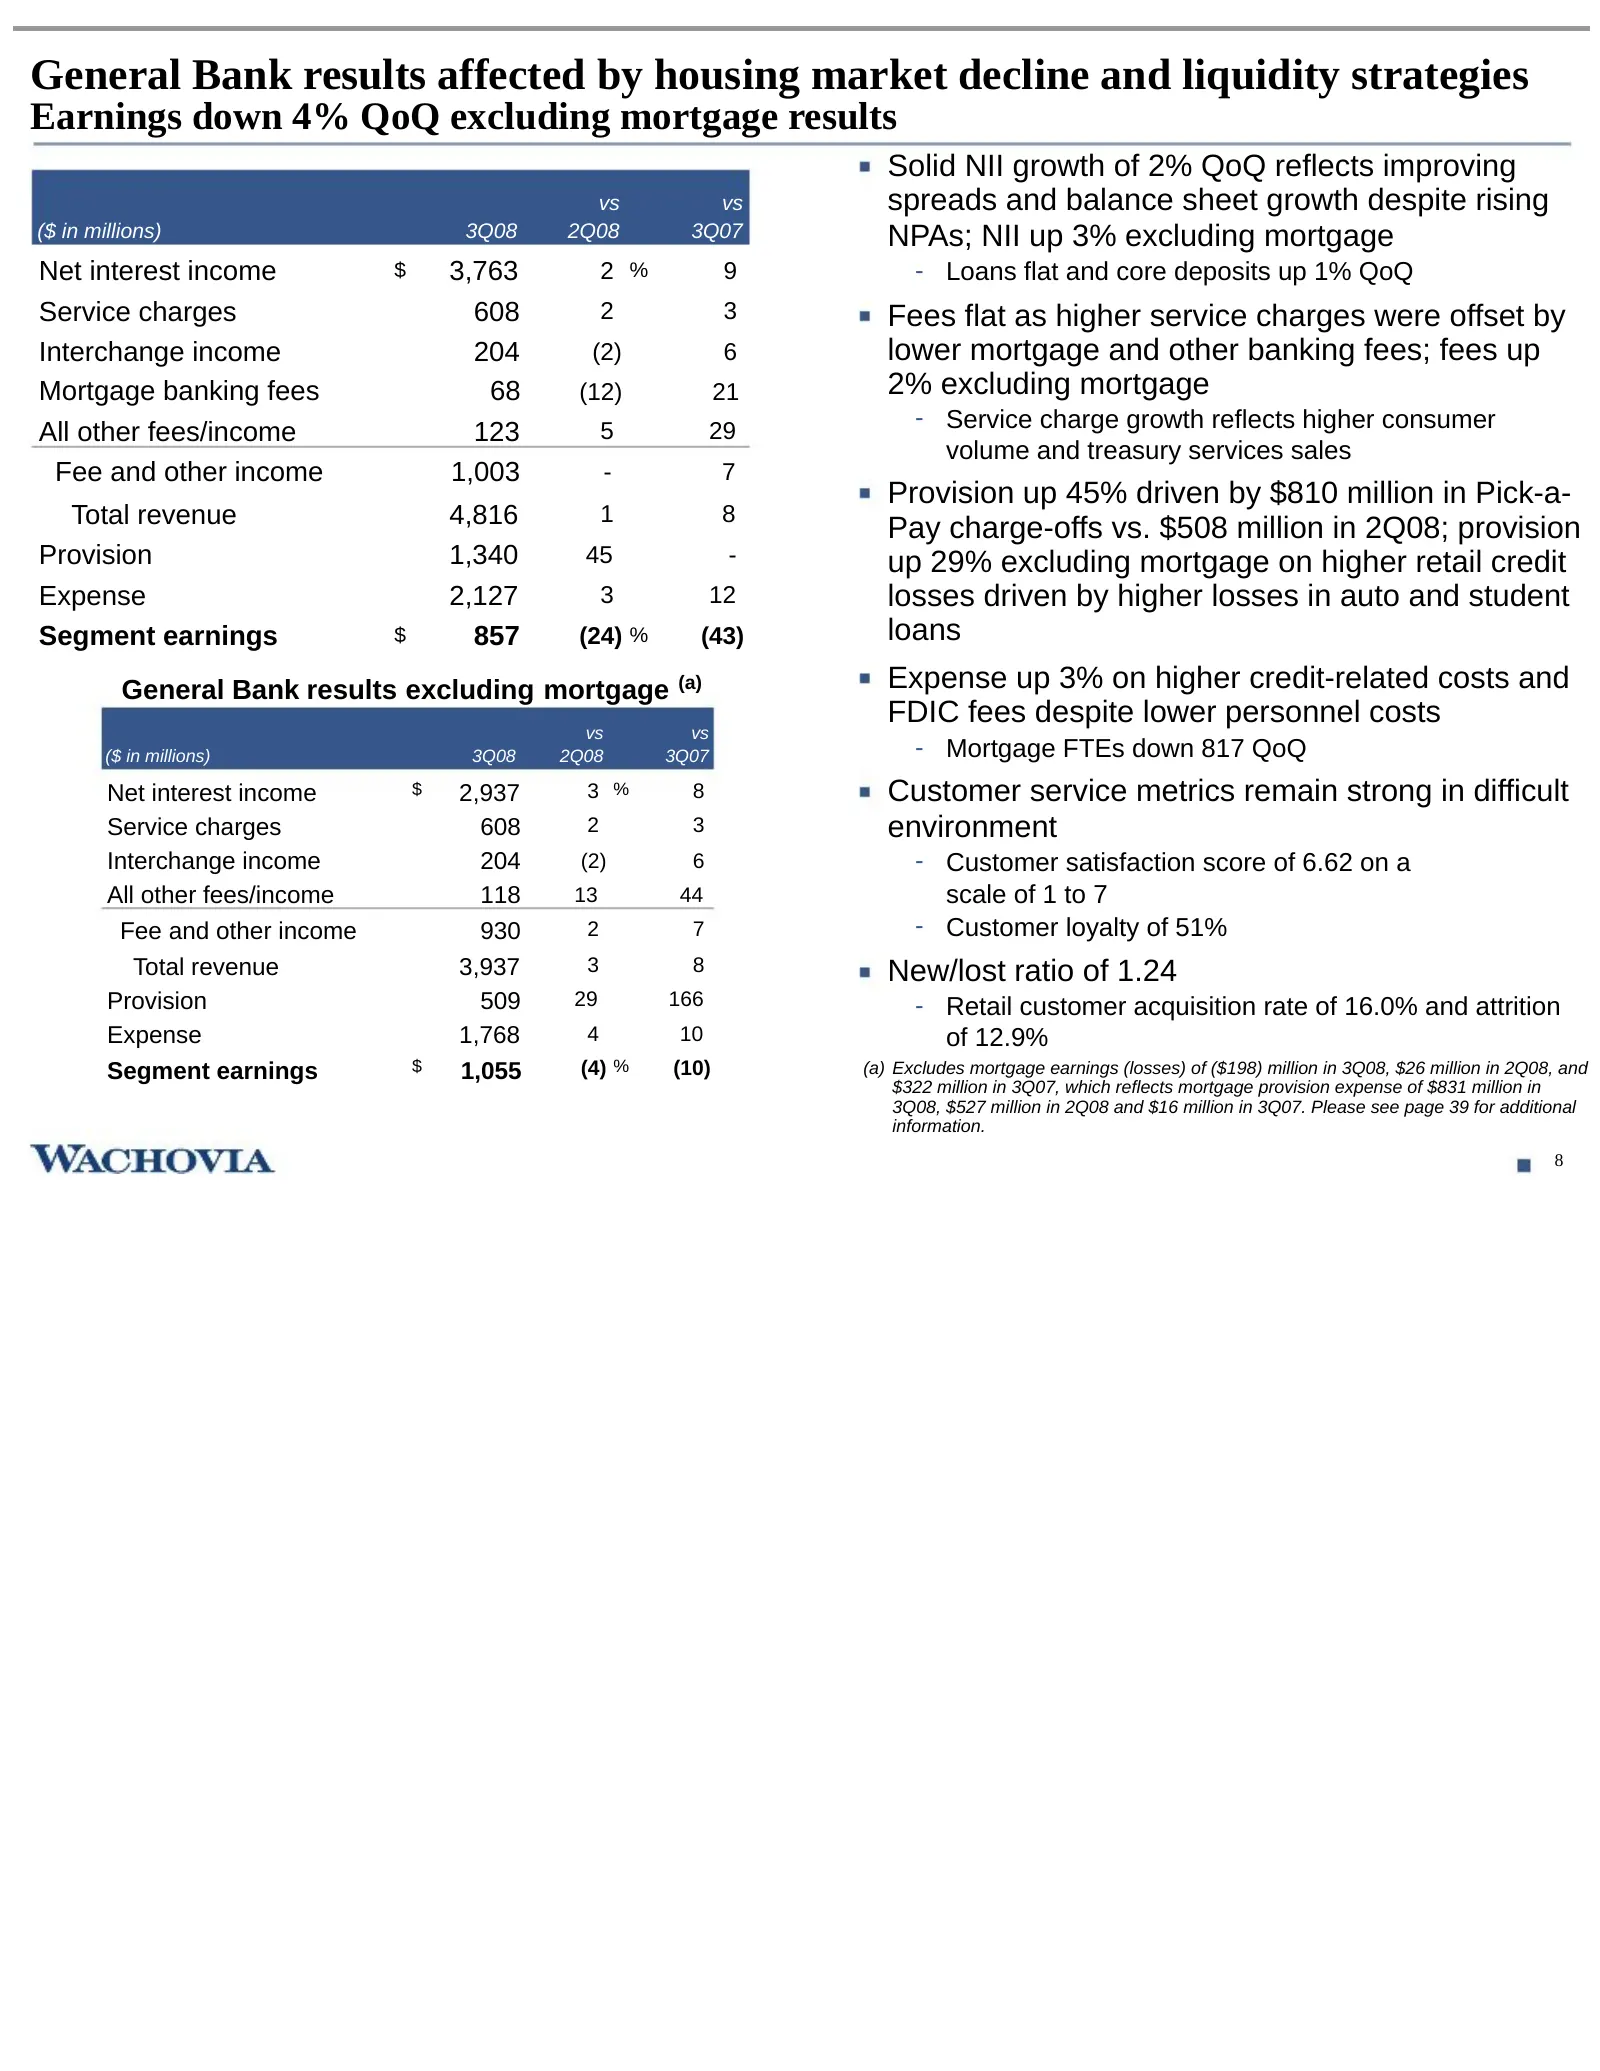
General Bank results affected by housing market decline and liquidity strategies Earnings down 4% QoQ excluding mortgage results Solid NII growth of 2% QoQ reflects improving vs vs spreads and balance sheet growth despite rising ($ in millions) 3Q08 2Q08 3Q07 NPAs; NII up 3% excluding mortgage Net i
Slide 10: Wealth Management
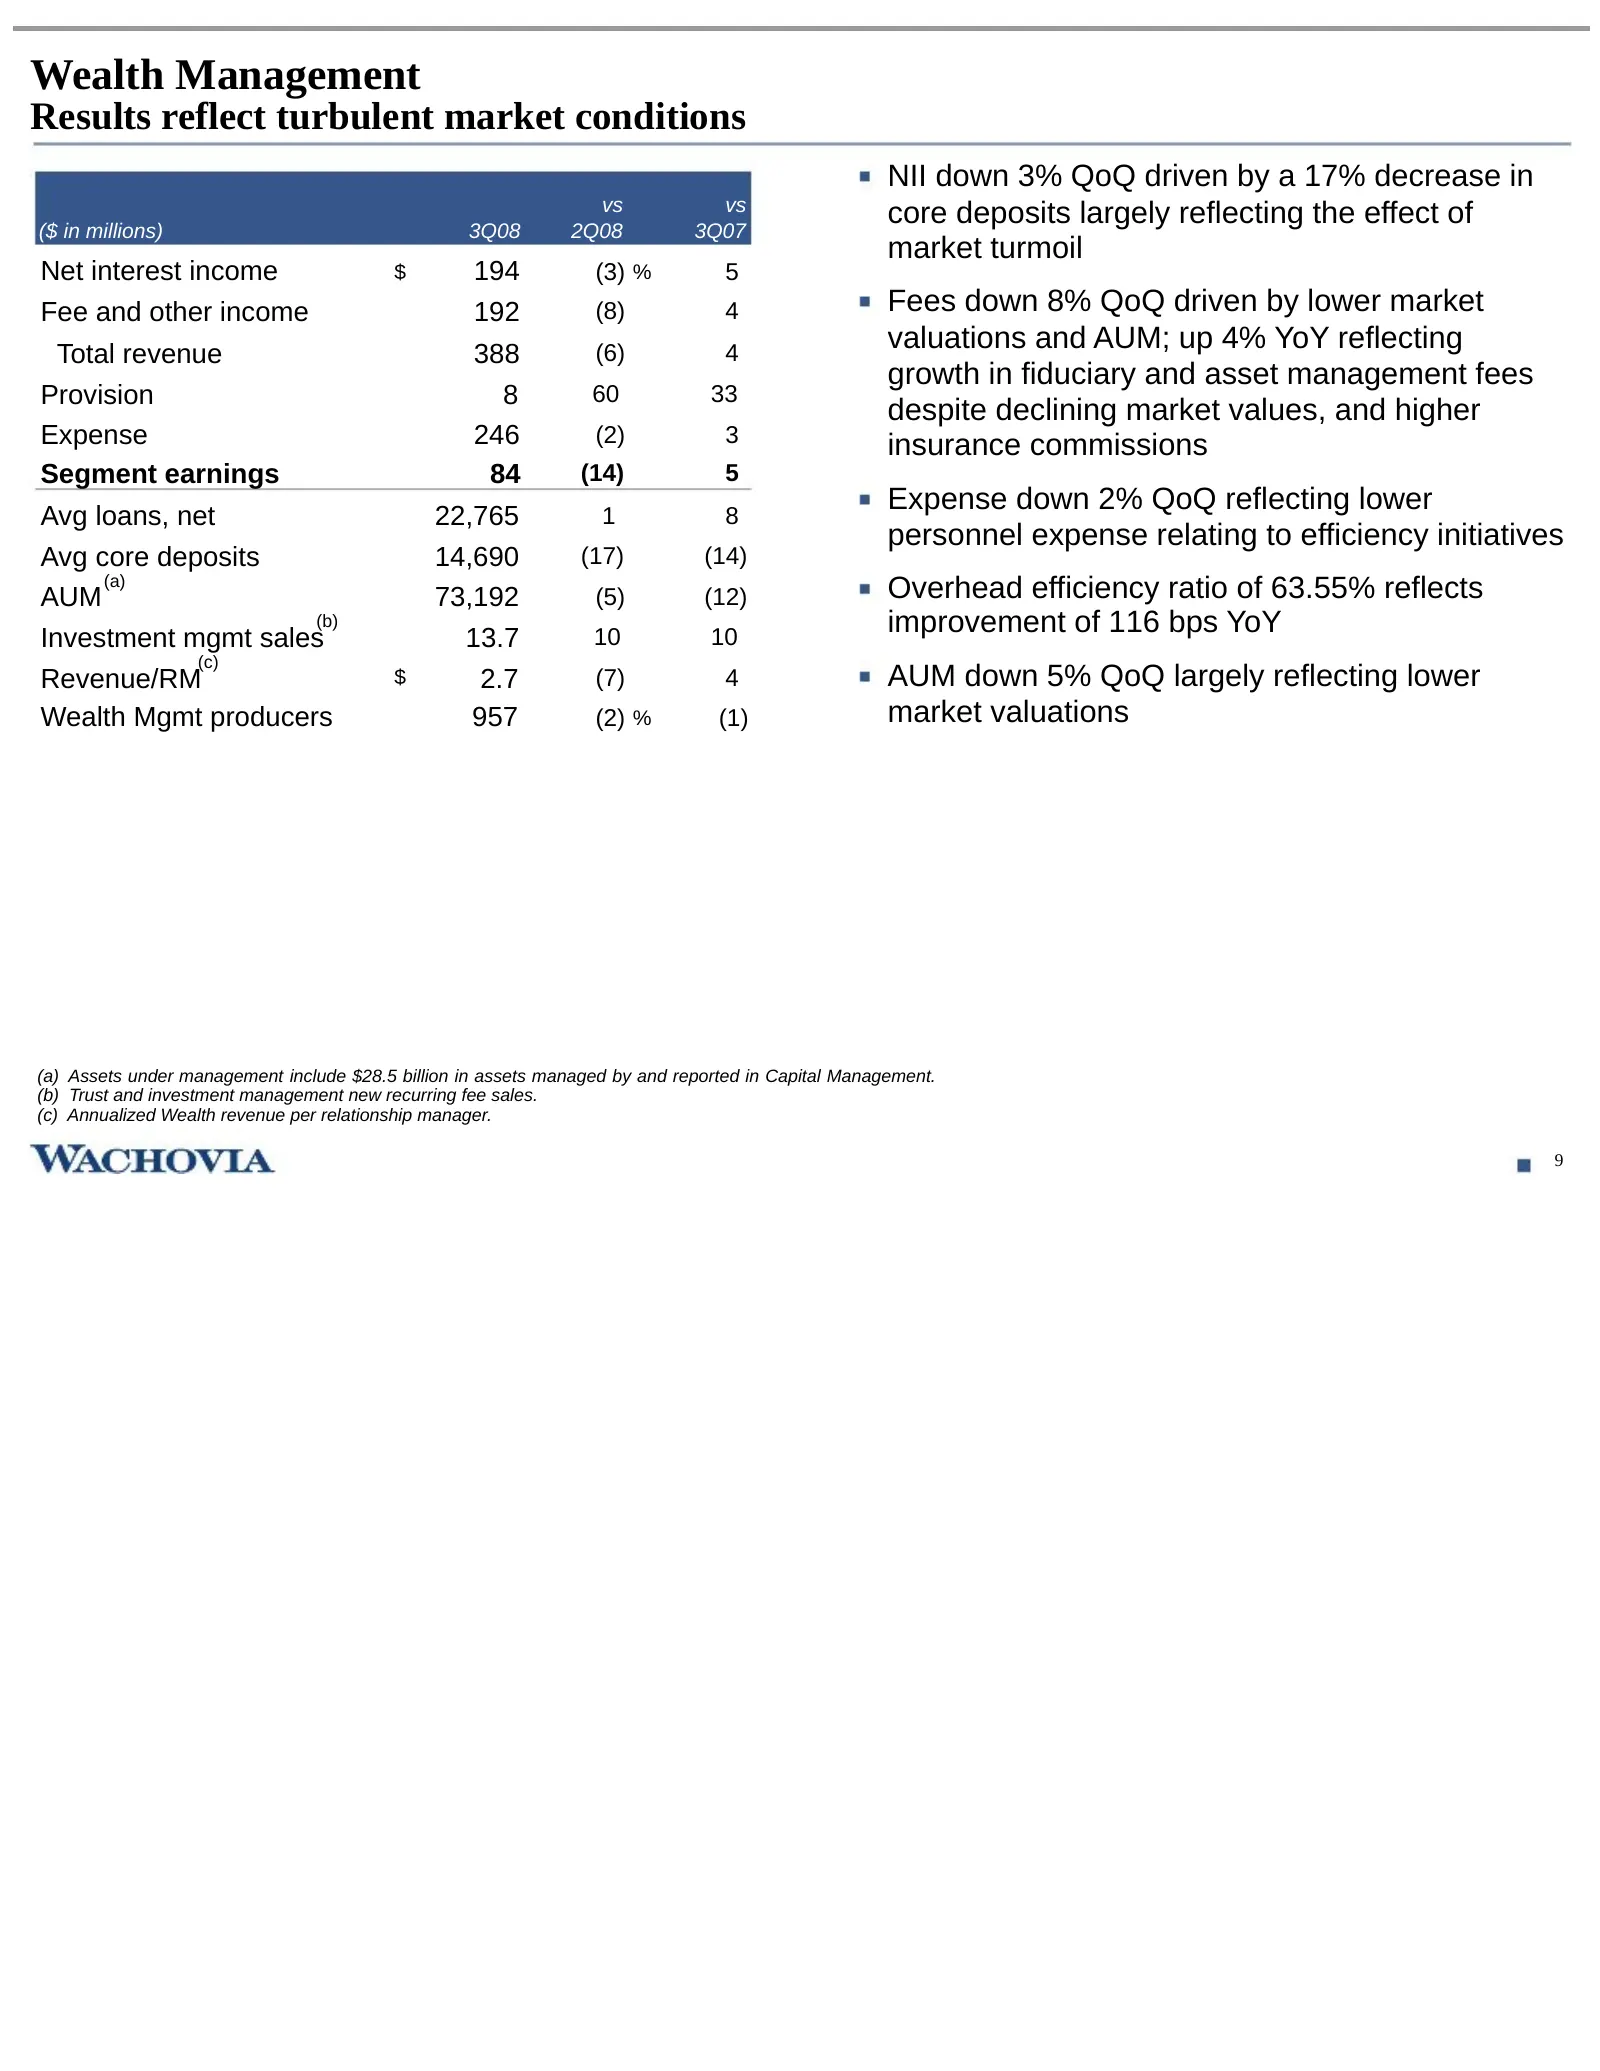
Wealth Management Results reflect turbulent market conditions NII down 3% QoQ driven by a 17% decrease in vs vs ($ in millions) 3Q08 2Q08 3Q07 core deposits largely reflecting the effect of market turmoil Net interest income $ 194 (3) % 5 Fee and other income 192 (8) 4 Fees down 8% QoQ driven by low
Slide 11: Corporate and Investment Bank
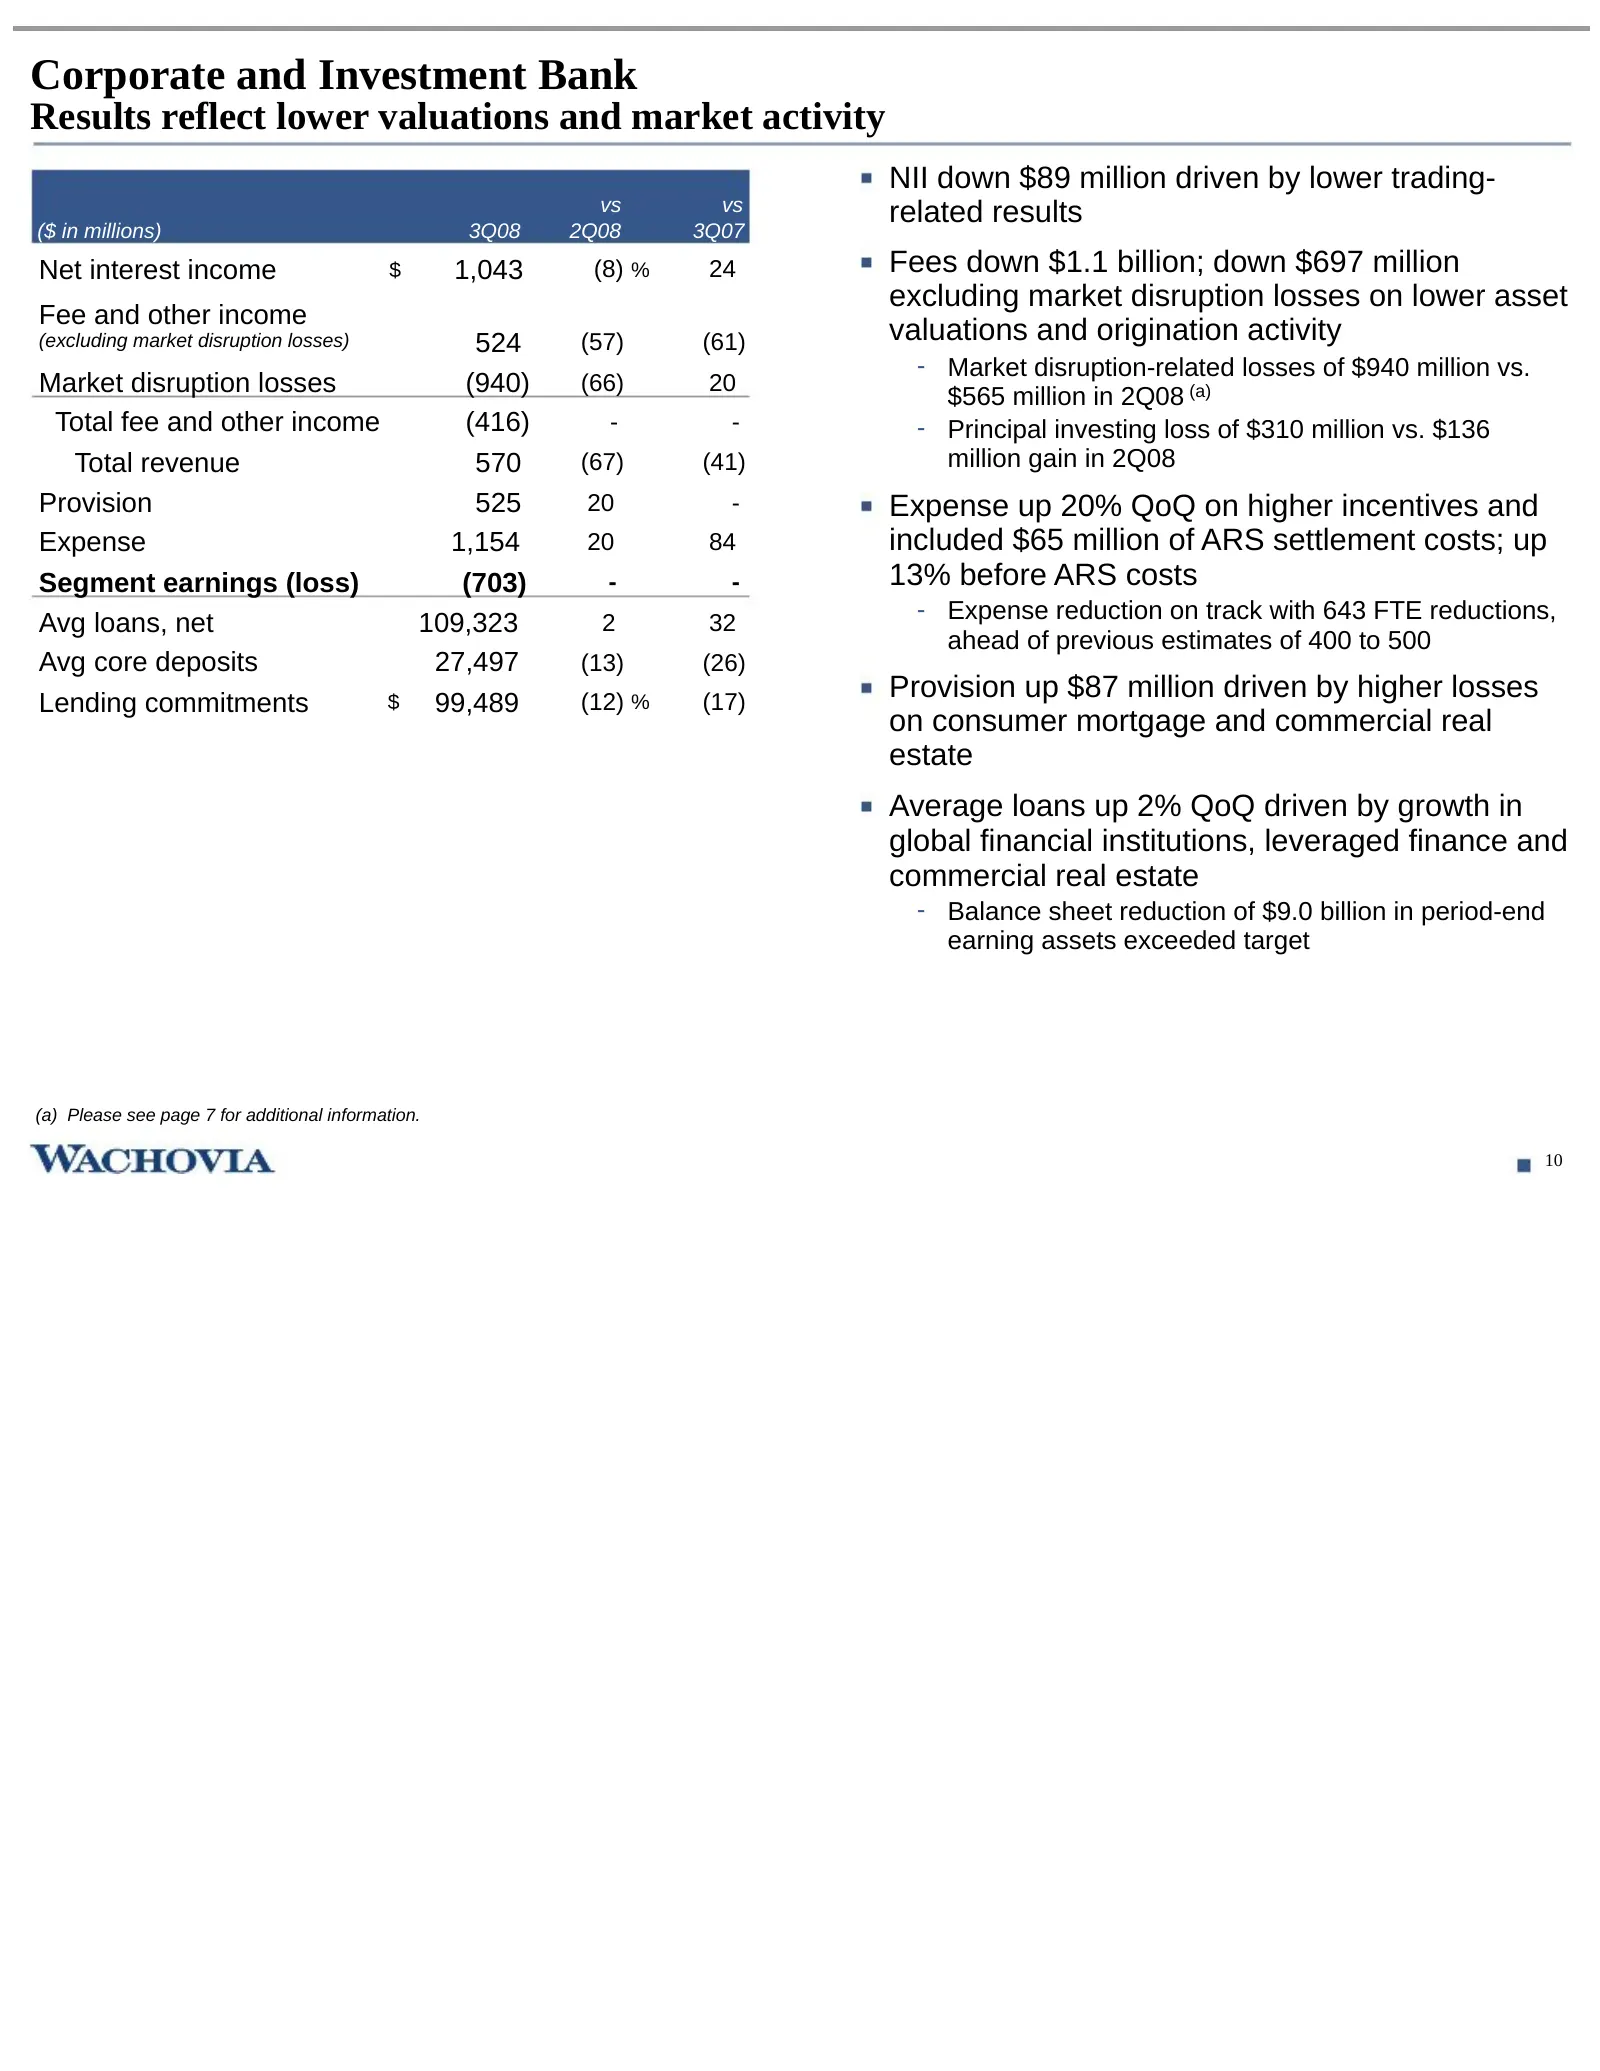
Corporate and Investment Bank Results reflect lower valuations and market activity NII down $89 million driven by lower trading- vs vs related results ($ in millions) 3Q08 2Q08 3Q07 Net interest income $ 1,043 (8) % 24 Fees down $1.1 billion; down $697 million excluding market disruption losses on l
Slide 12: Capital Management
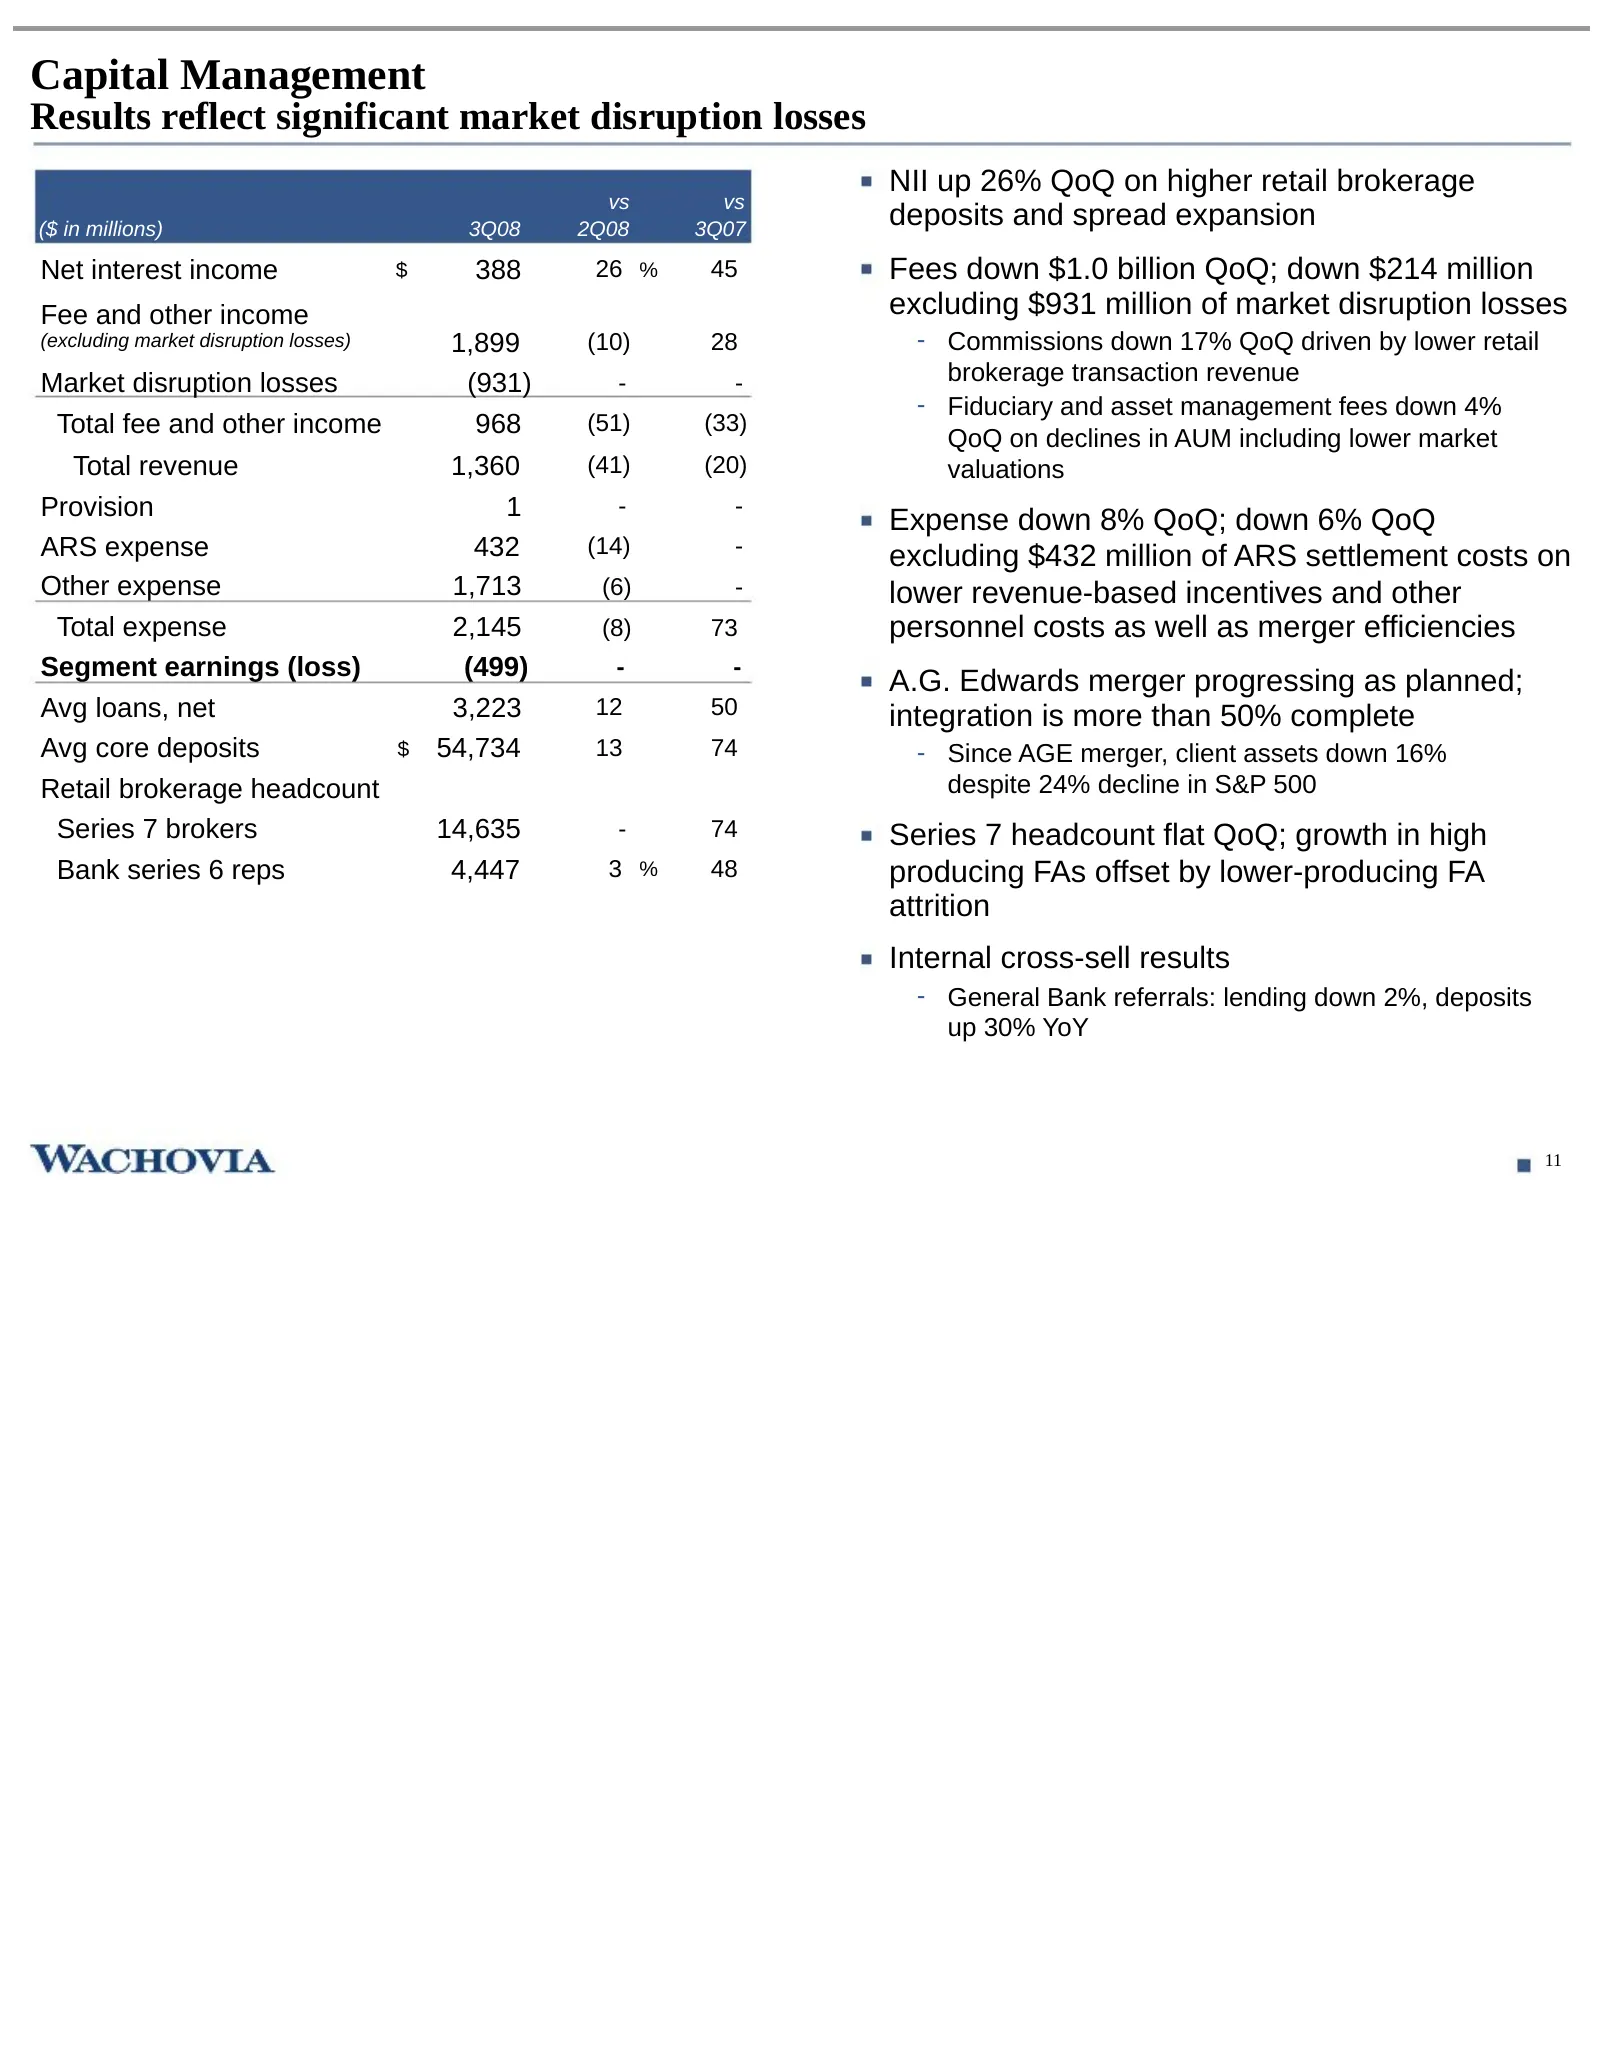
Capital Management Results reflect significant market disruption losses NII up 26% QoQ on higher retail brokerage vs vs ($ in millions) 3Q08 2Q08 3Q07 deposits and spread expansion Net interest income $ 388 26 % 45 Fees down $1.0 billion QoQ; down $214 million Fee and other income excluding $931 mil
Slide 13: Update on core loan portfolio (excluding Golden West)
Update on core loan portfolio (excluding Golden West) 12
Slide 14: Asset quality
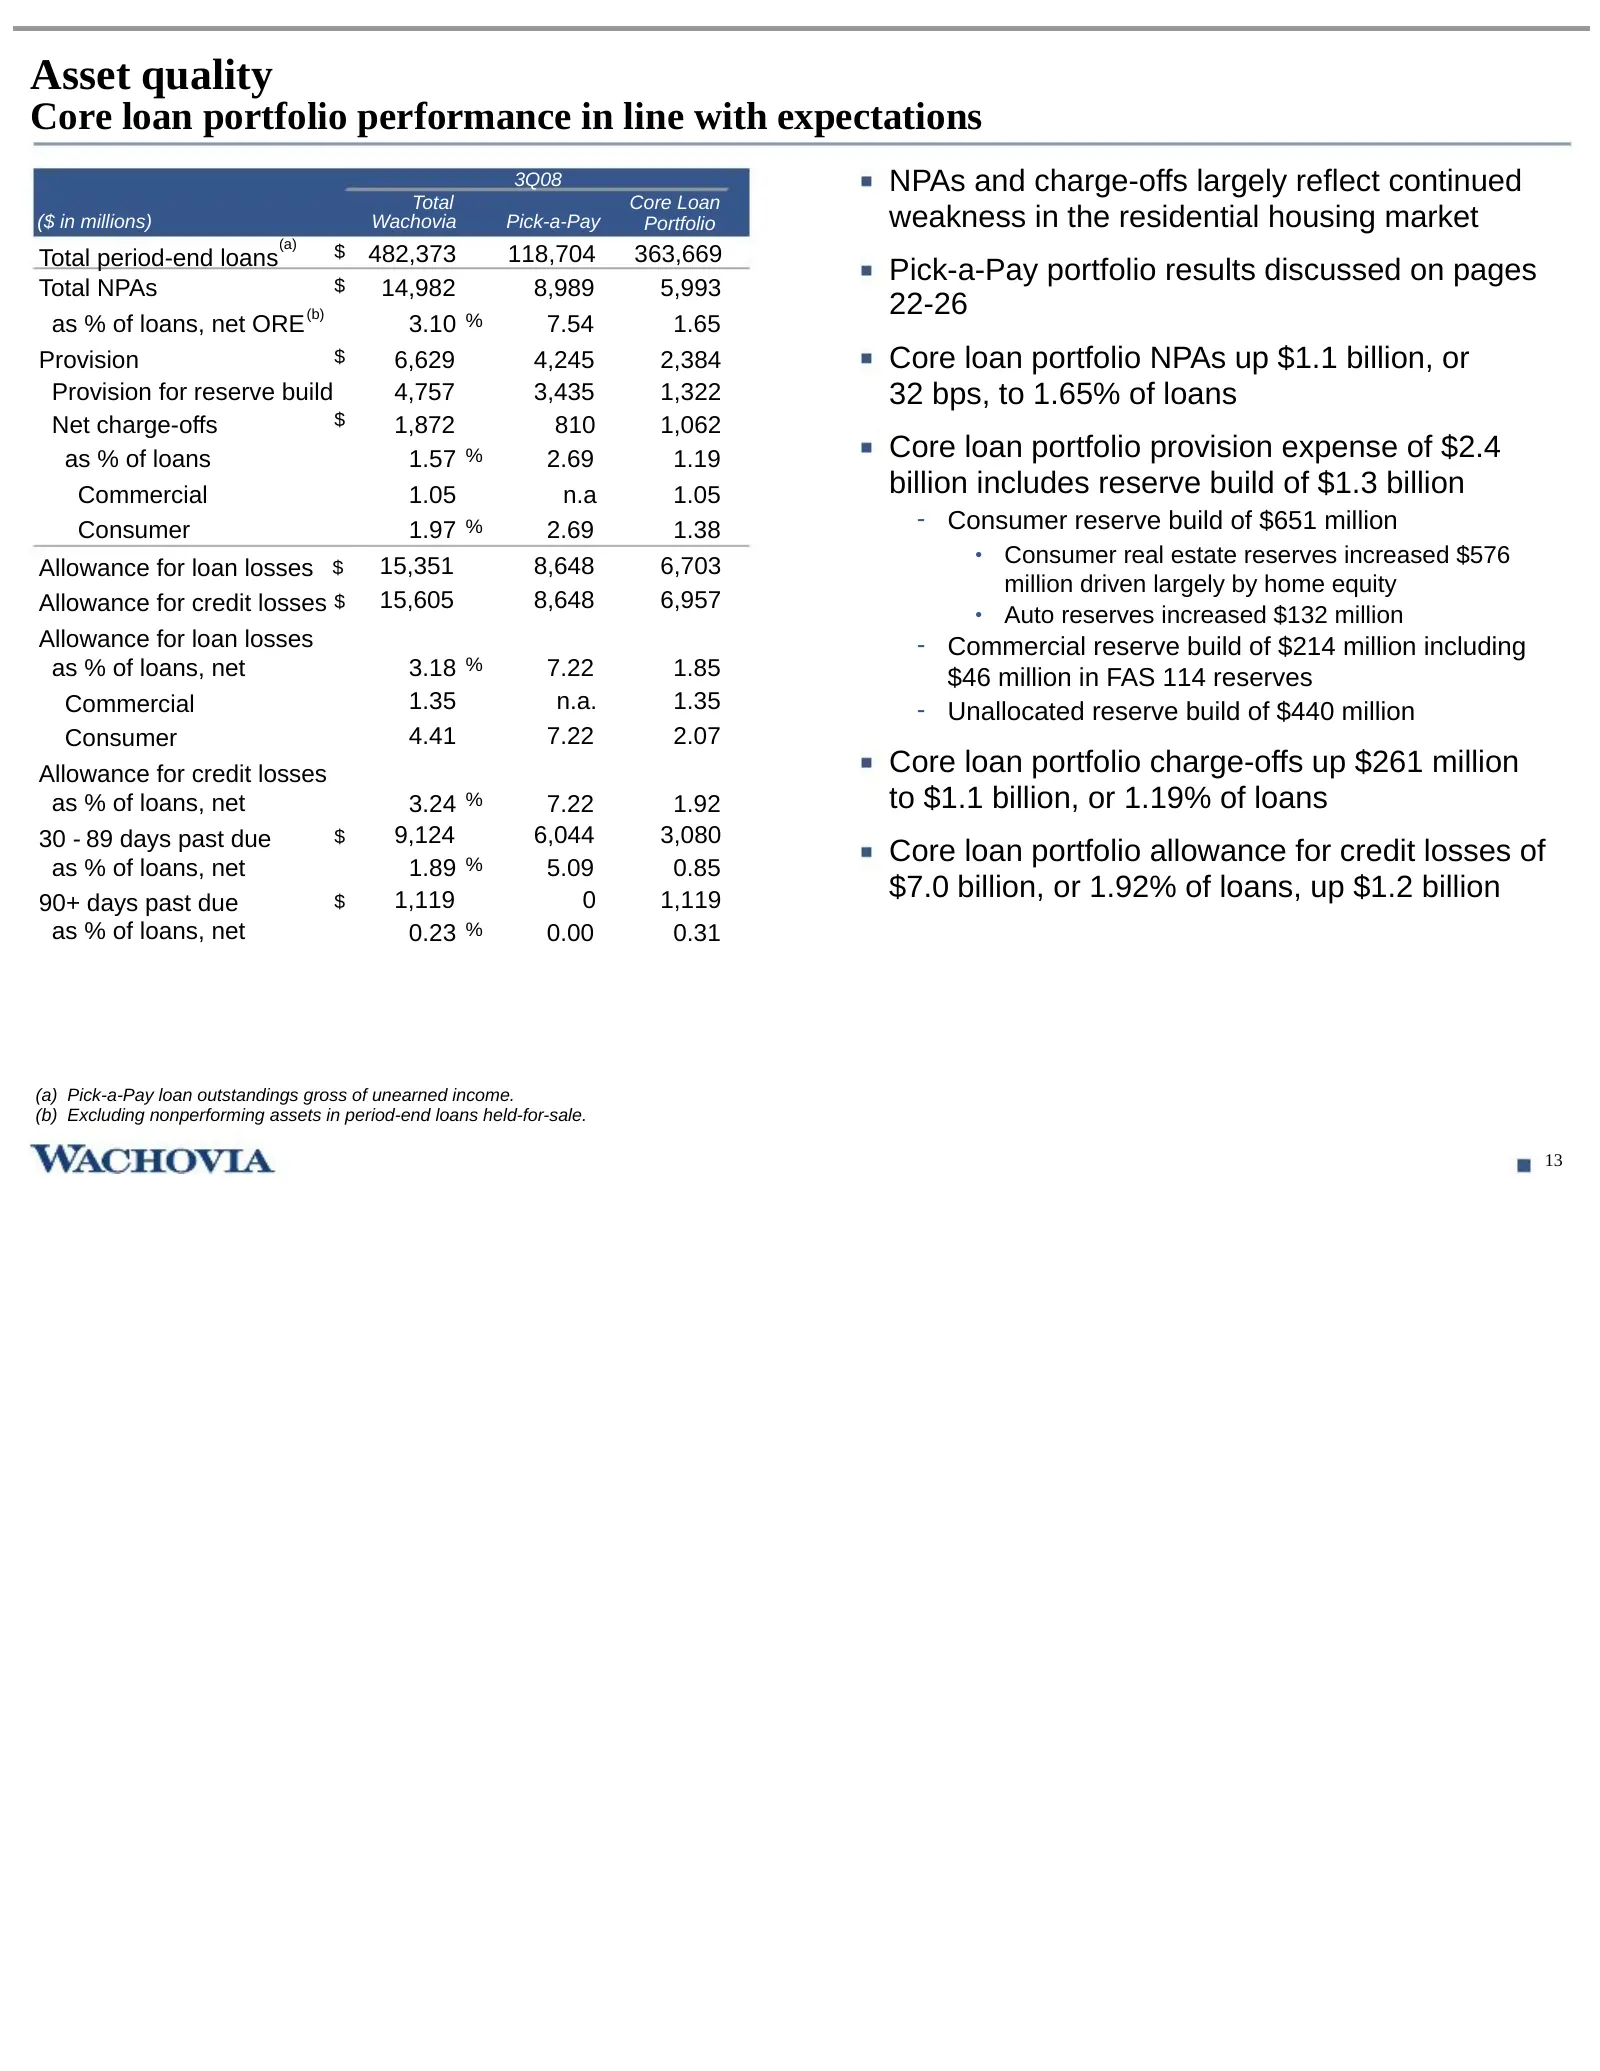
Asset quality Core loan portfolio performance in line with expectations 3Q08 NPAs and charge-offs largely reflect continued Total Core Loan ($ in millions) Wachovia Pick-a-Pay Portfolio weakness in the residential housing market (a) Total period-end loans $ 482,373 118,704 363,669 $ Pick-a-Pay portf
Slide 15: Core consumer loan portfolio continues solid performance
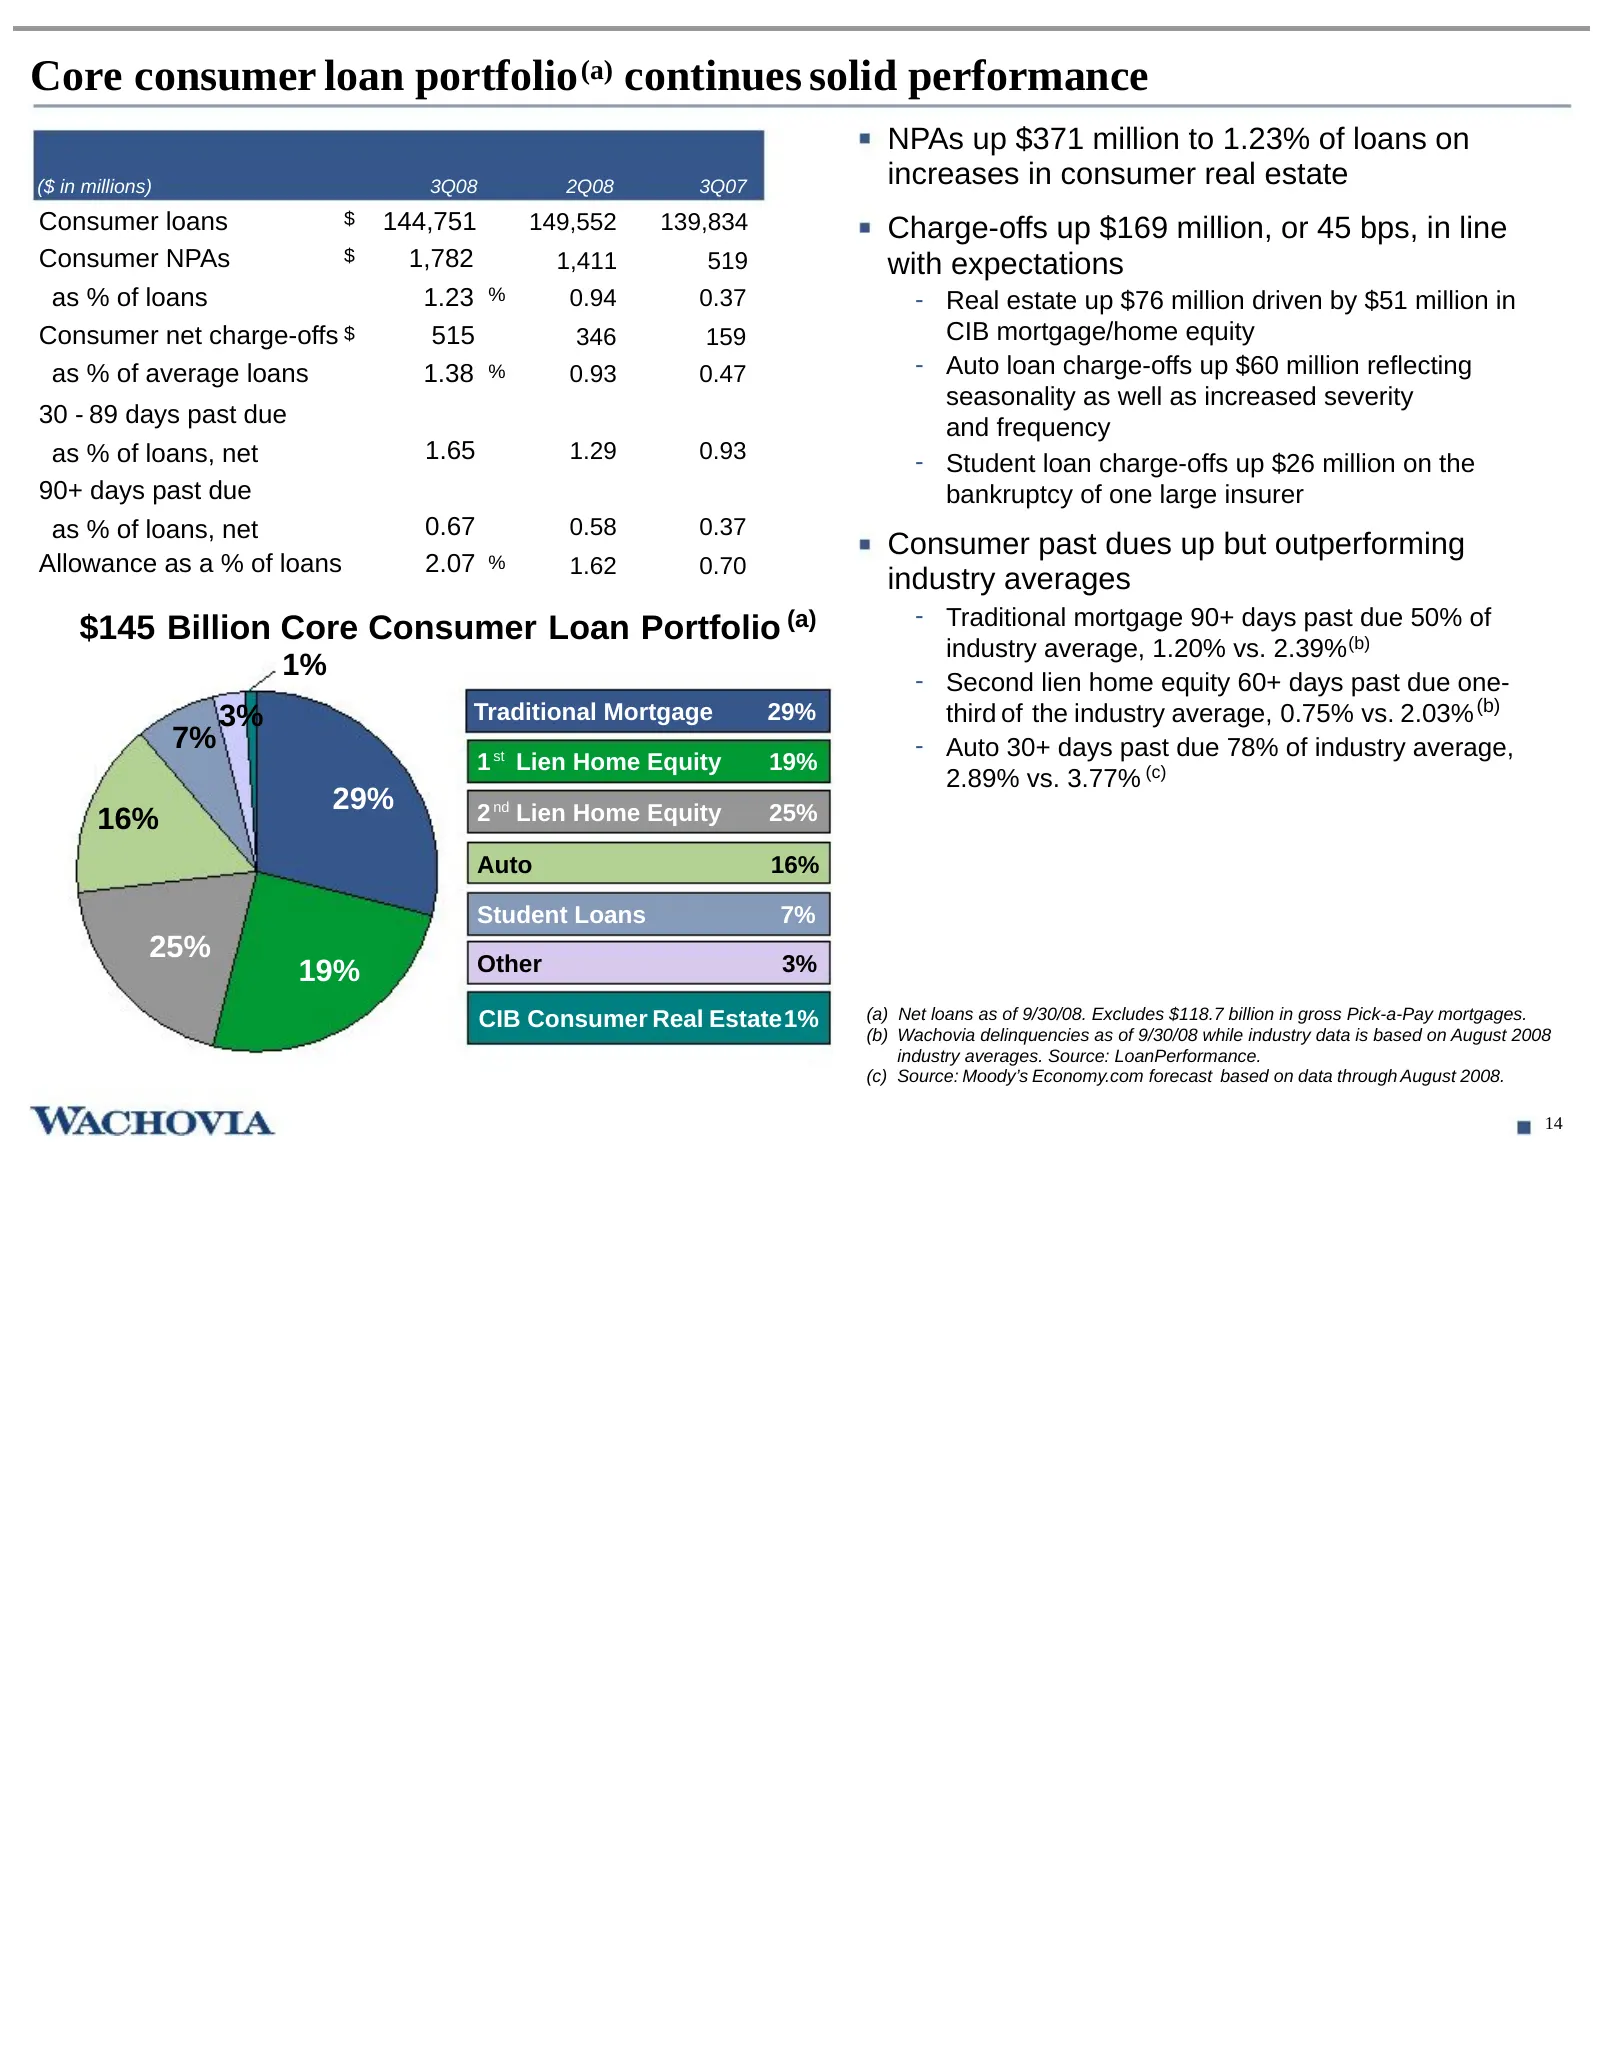
Core consumer loan portfolio (a) continues solid performance NPAs up $371 million to 1.23% of loans on ($ in millions) 3Q08- 2Q08 3Q07 increases in consumer real estate Consumer loans $ 144,751 149,552 139,834 Charge-offs up $169 million, or 45 bps, in line Consumer NPAs $ 1,782 1,411 519 with expec
Slide 16: Traditional mortgage and home equity continues to outperform the industry
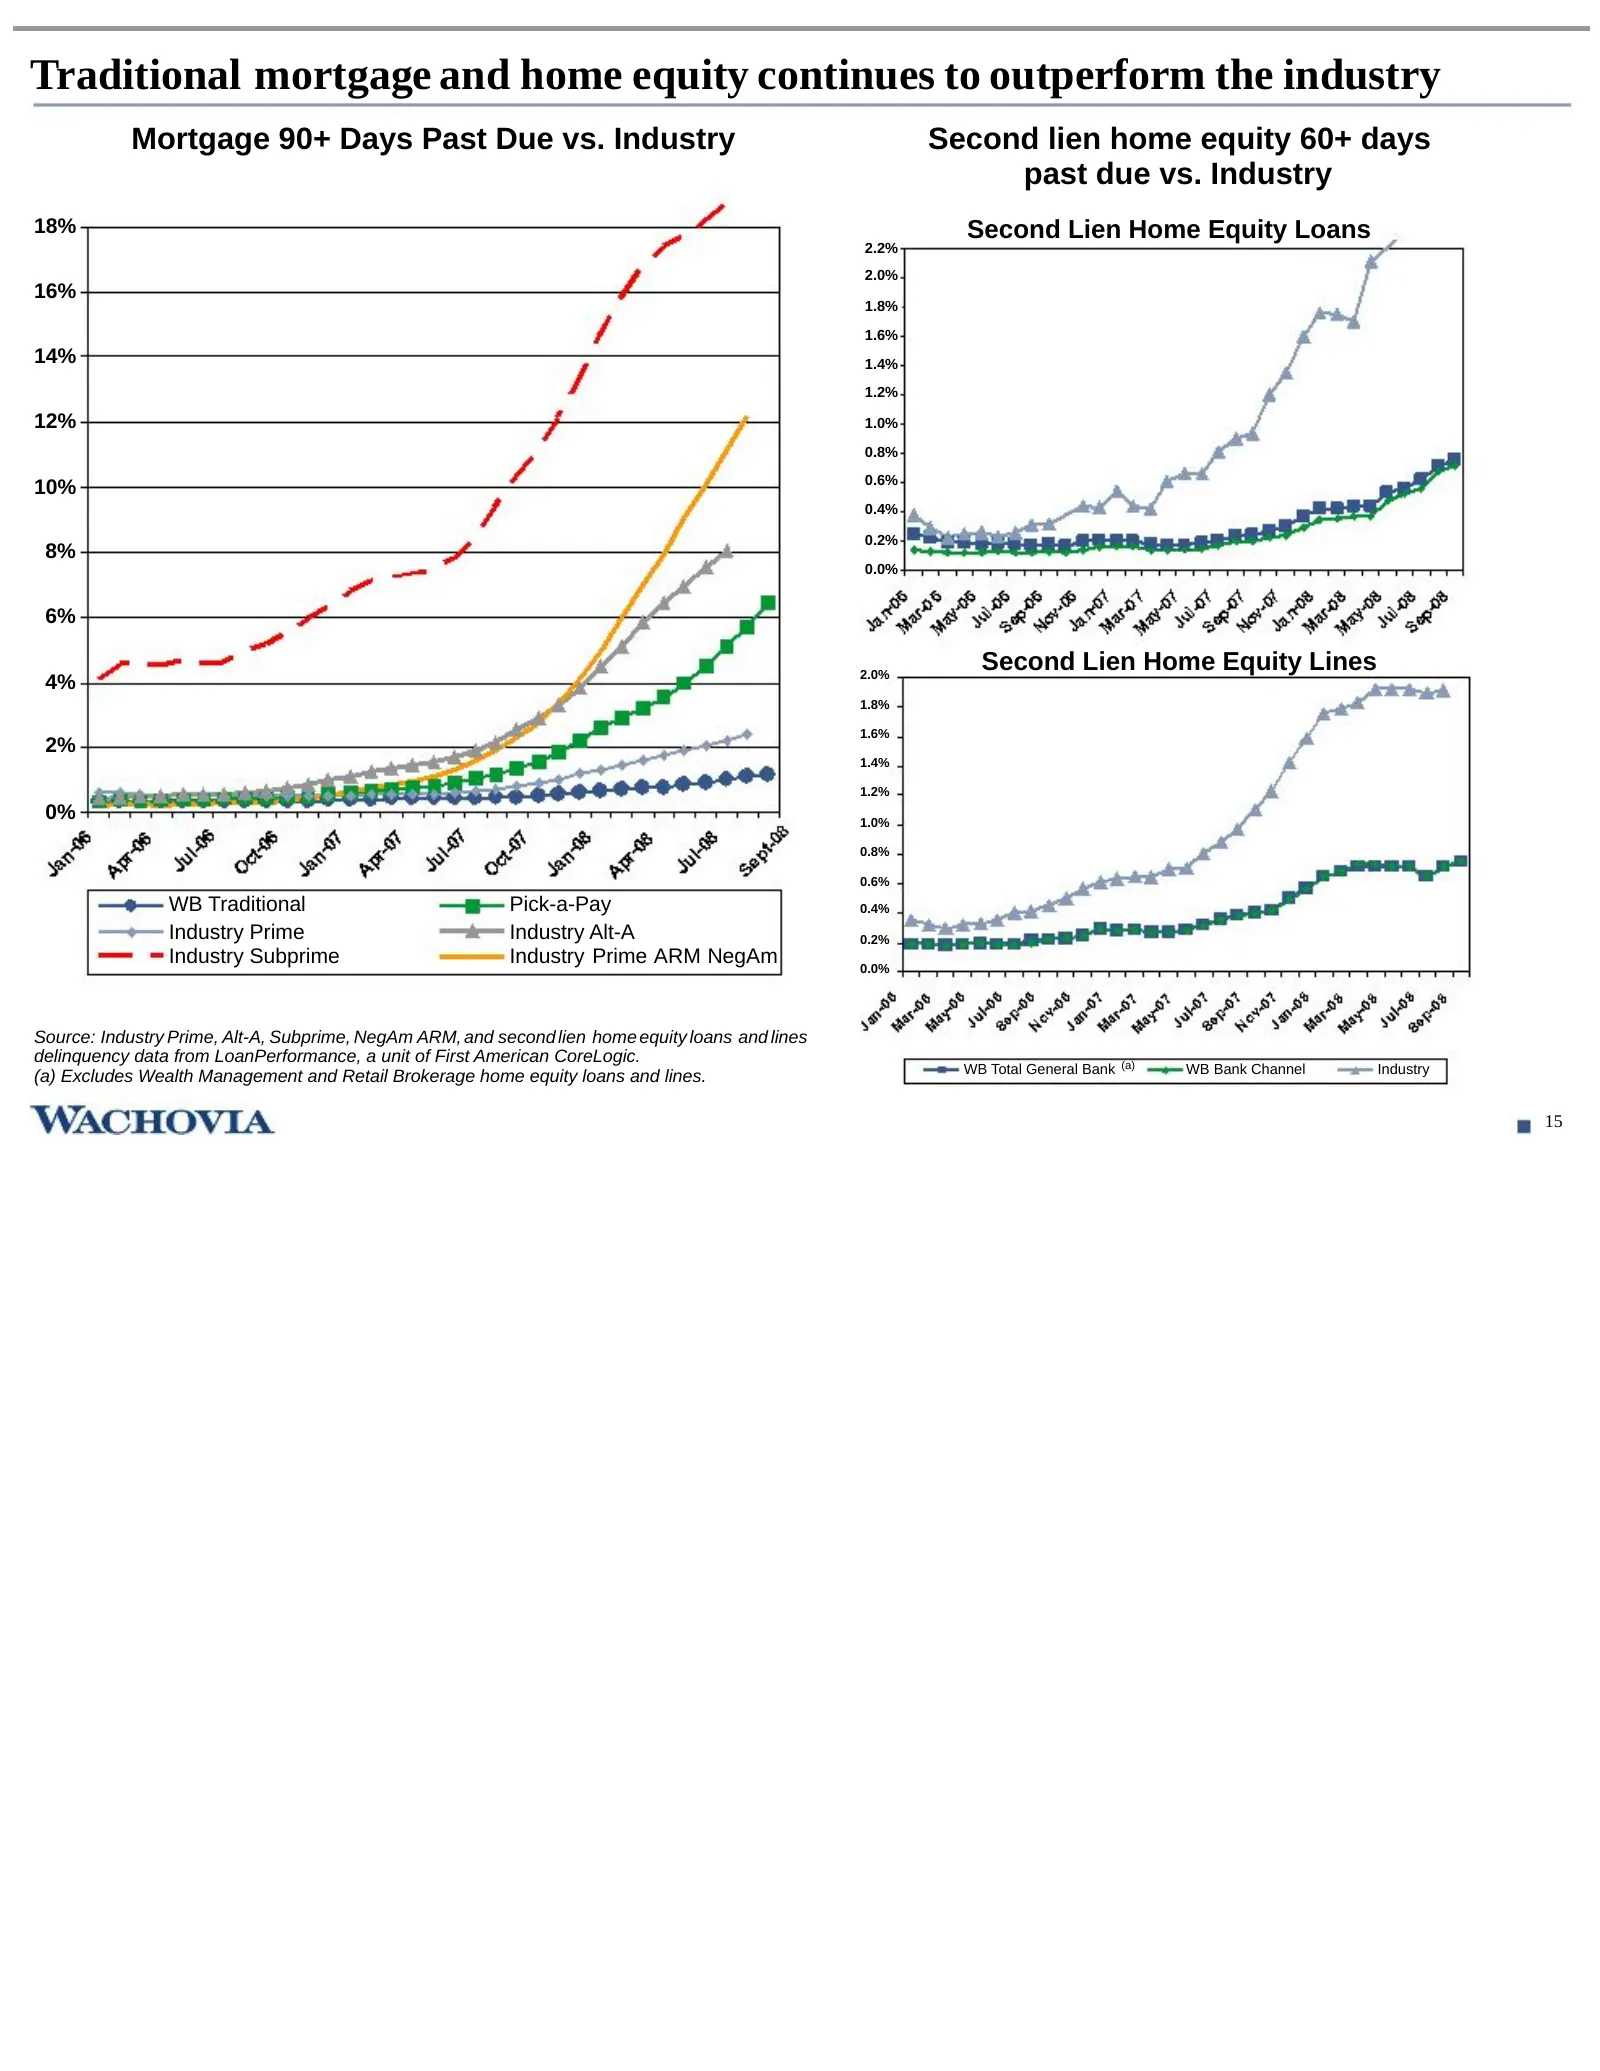
Traditional mortgage and home equity continues to outperform the industry Mortgage 90+ Days Past Due vs. Industry Second lien home equity 60+ days past due vs. Industry 18% Second Lien Home Equity Loans 2.2% 2.0% 16% 1.8% 1.6% 14% 1.4% 1.2% 12% 1.0% 0.8% 0.6% 10% 0.4% 0.2% 8% 0.0% 6% 2.0% Second Lie
Slide 17: Consumer mortgage excluding Pick-a-Pay
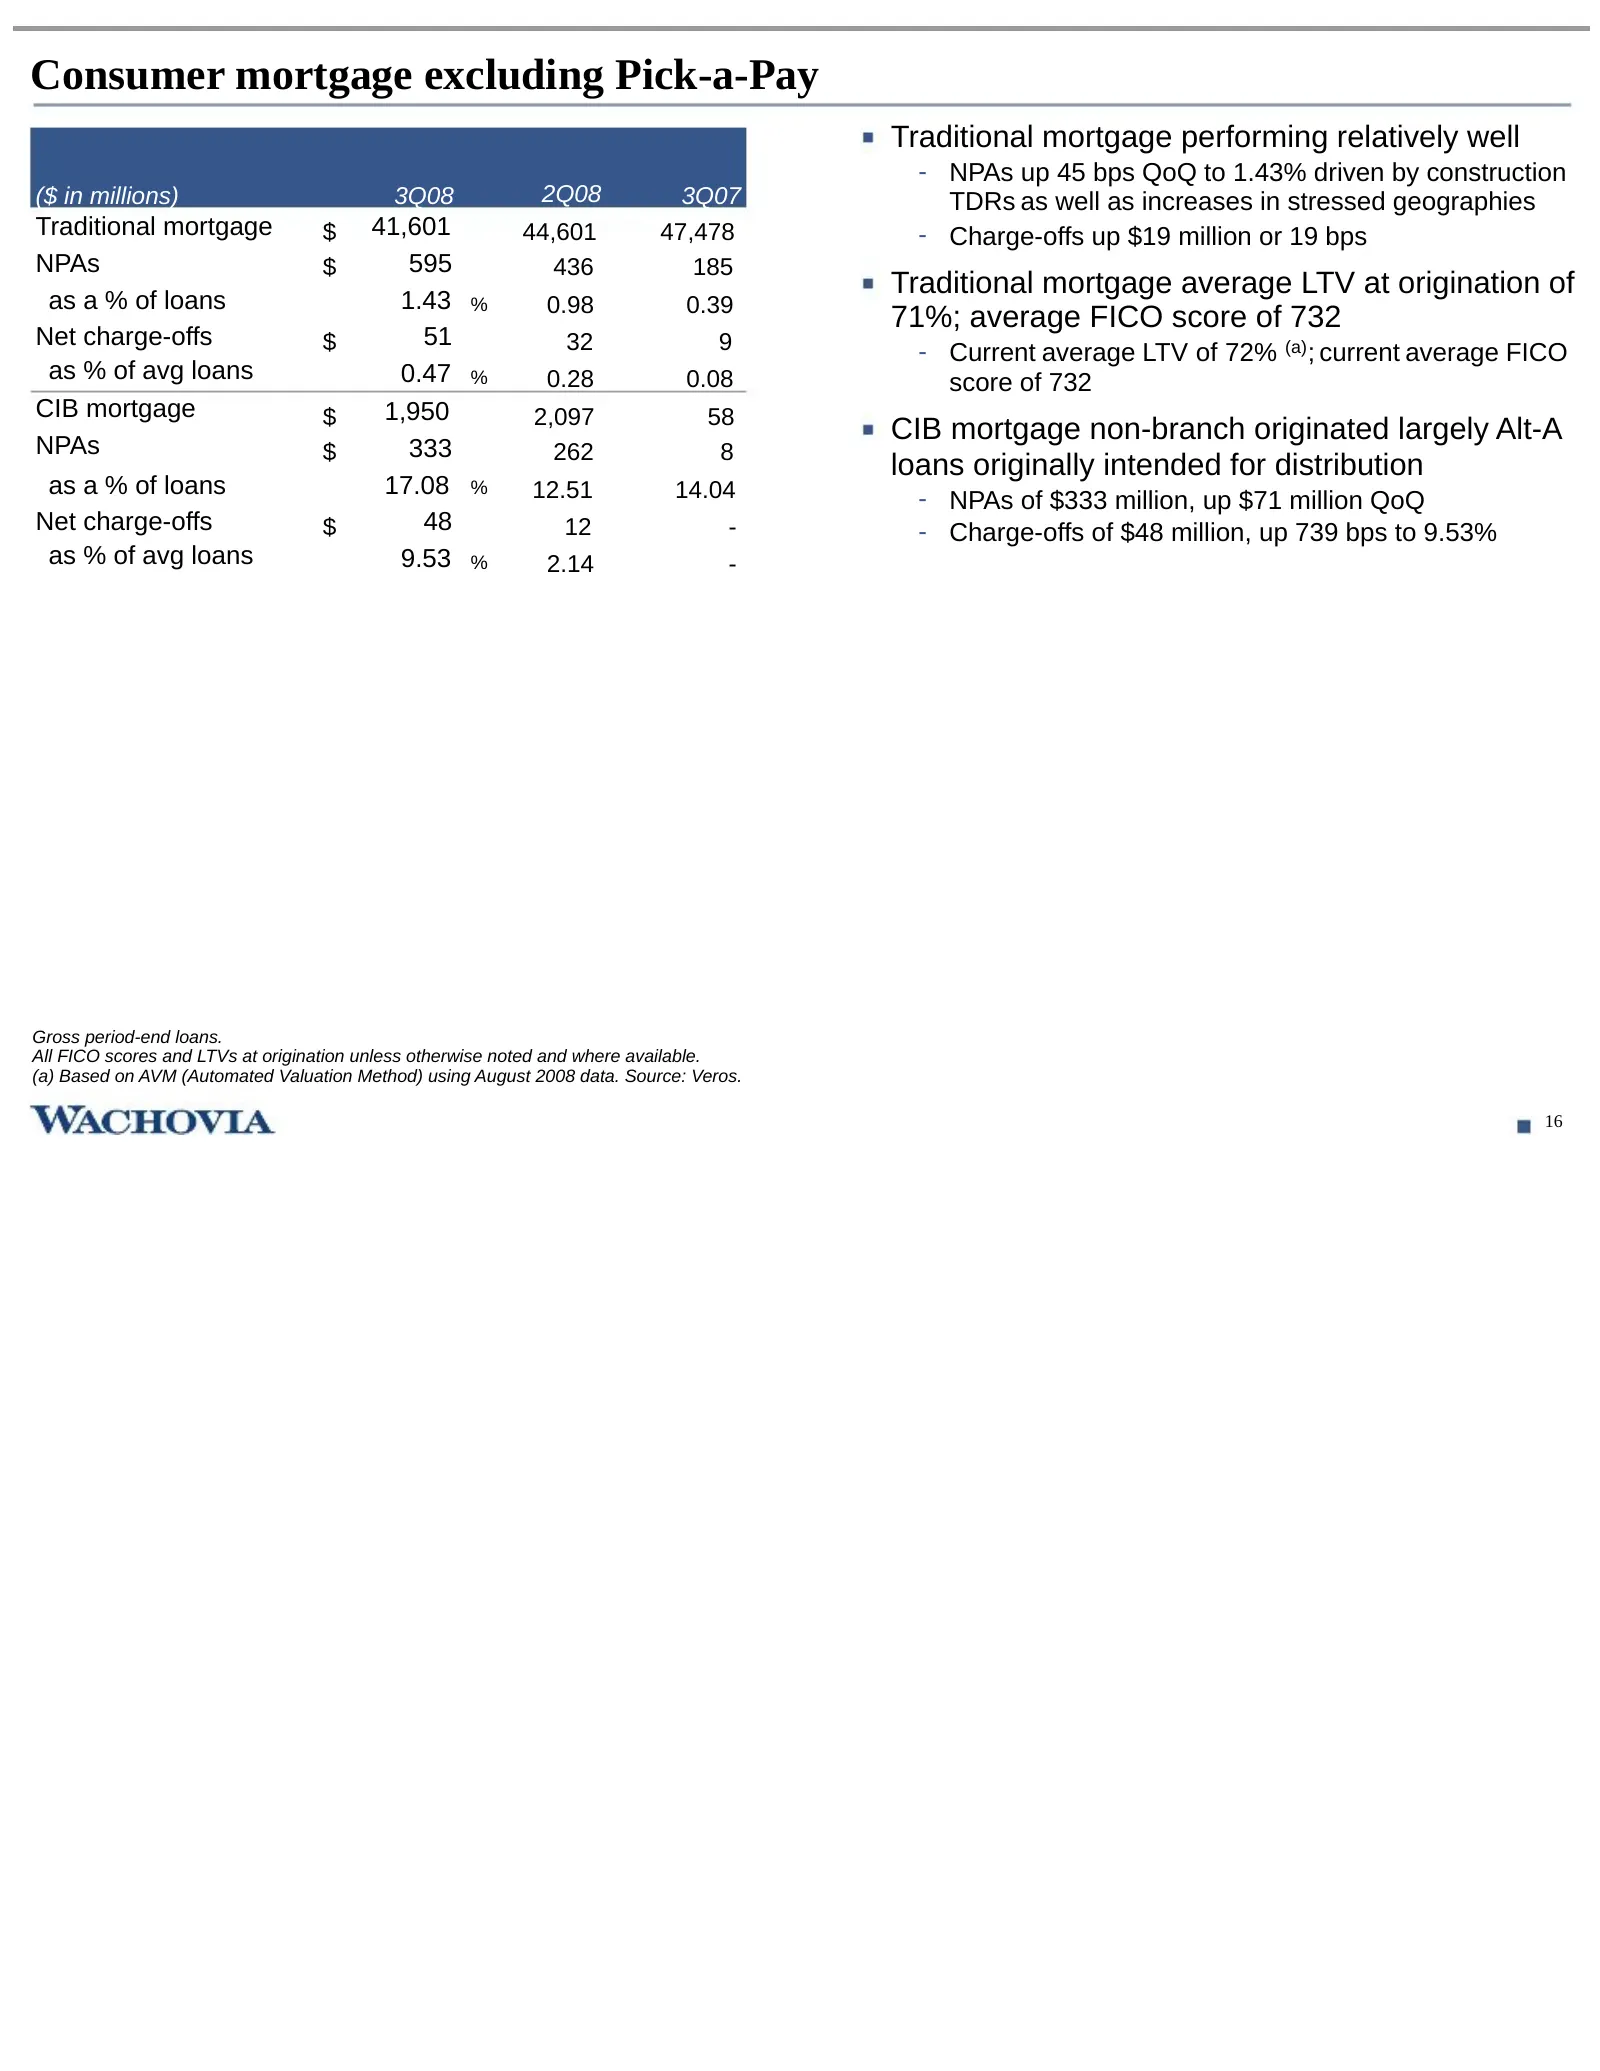
Consumer mortgage excluding Pick-a-Pay Traditional mortgage performing relatively well - NPAs up 45 bps QoQ to 1.43% driven by construction ($ in millions) 3Q08 2Q08 3Q07 TDRs as well as increases in stressed geographies Traditional mortgage $ 41,601 44,601 47,478 - Charge-offs up $19 million or 19
Slide 18: Home equity loans and lines
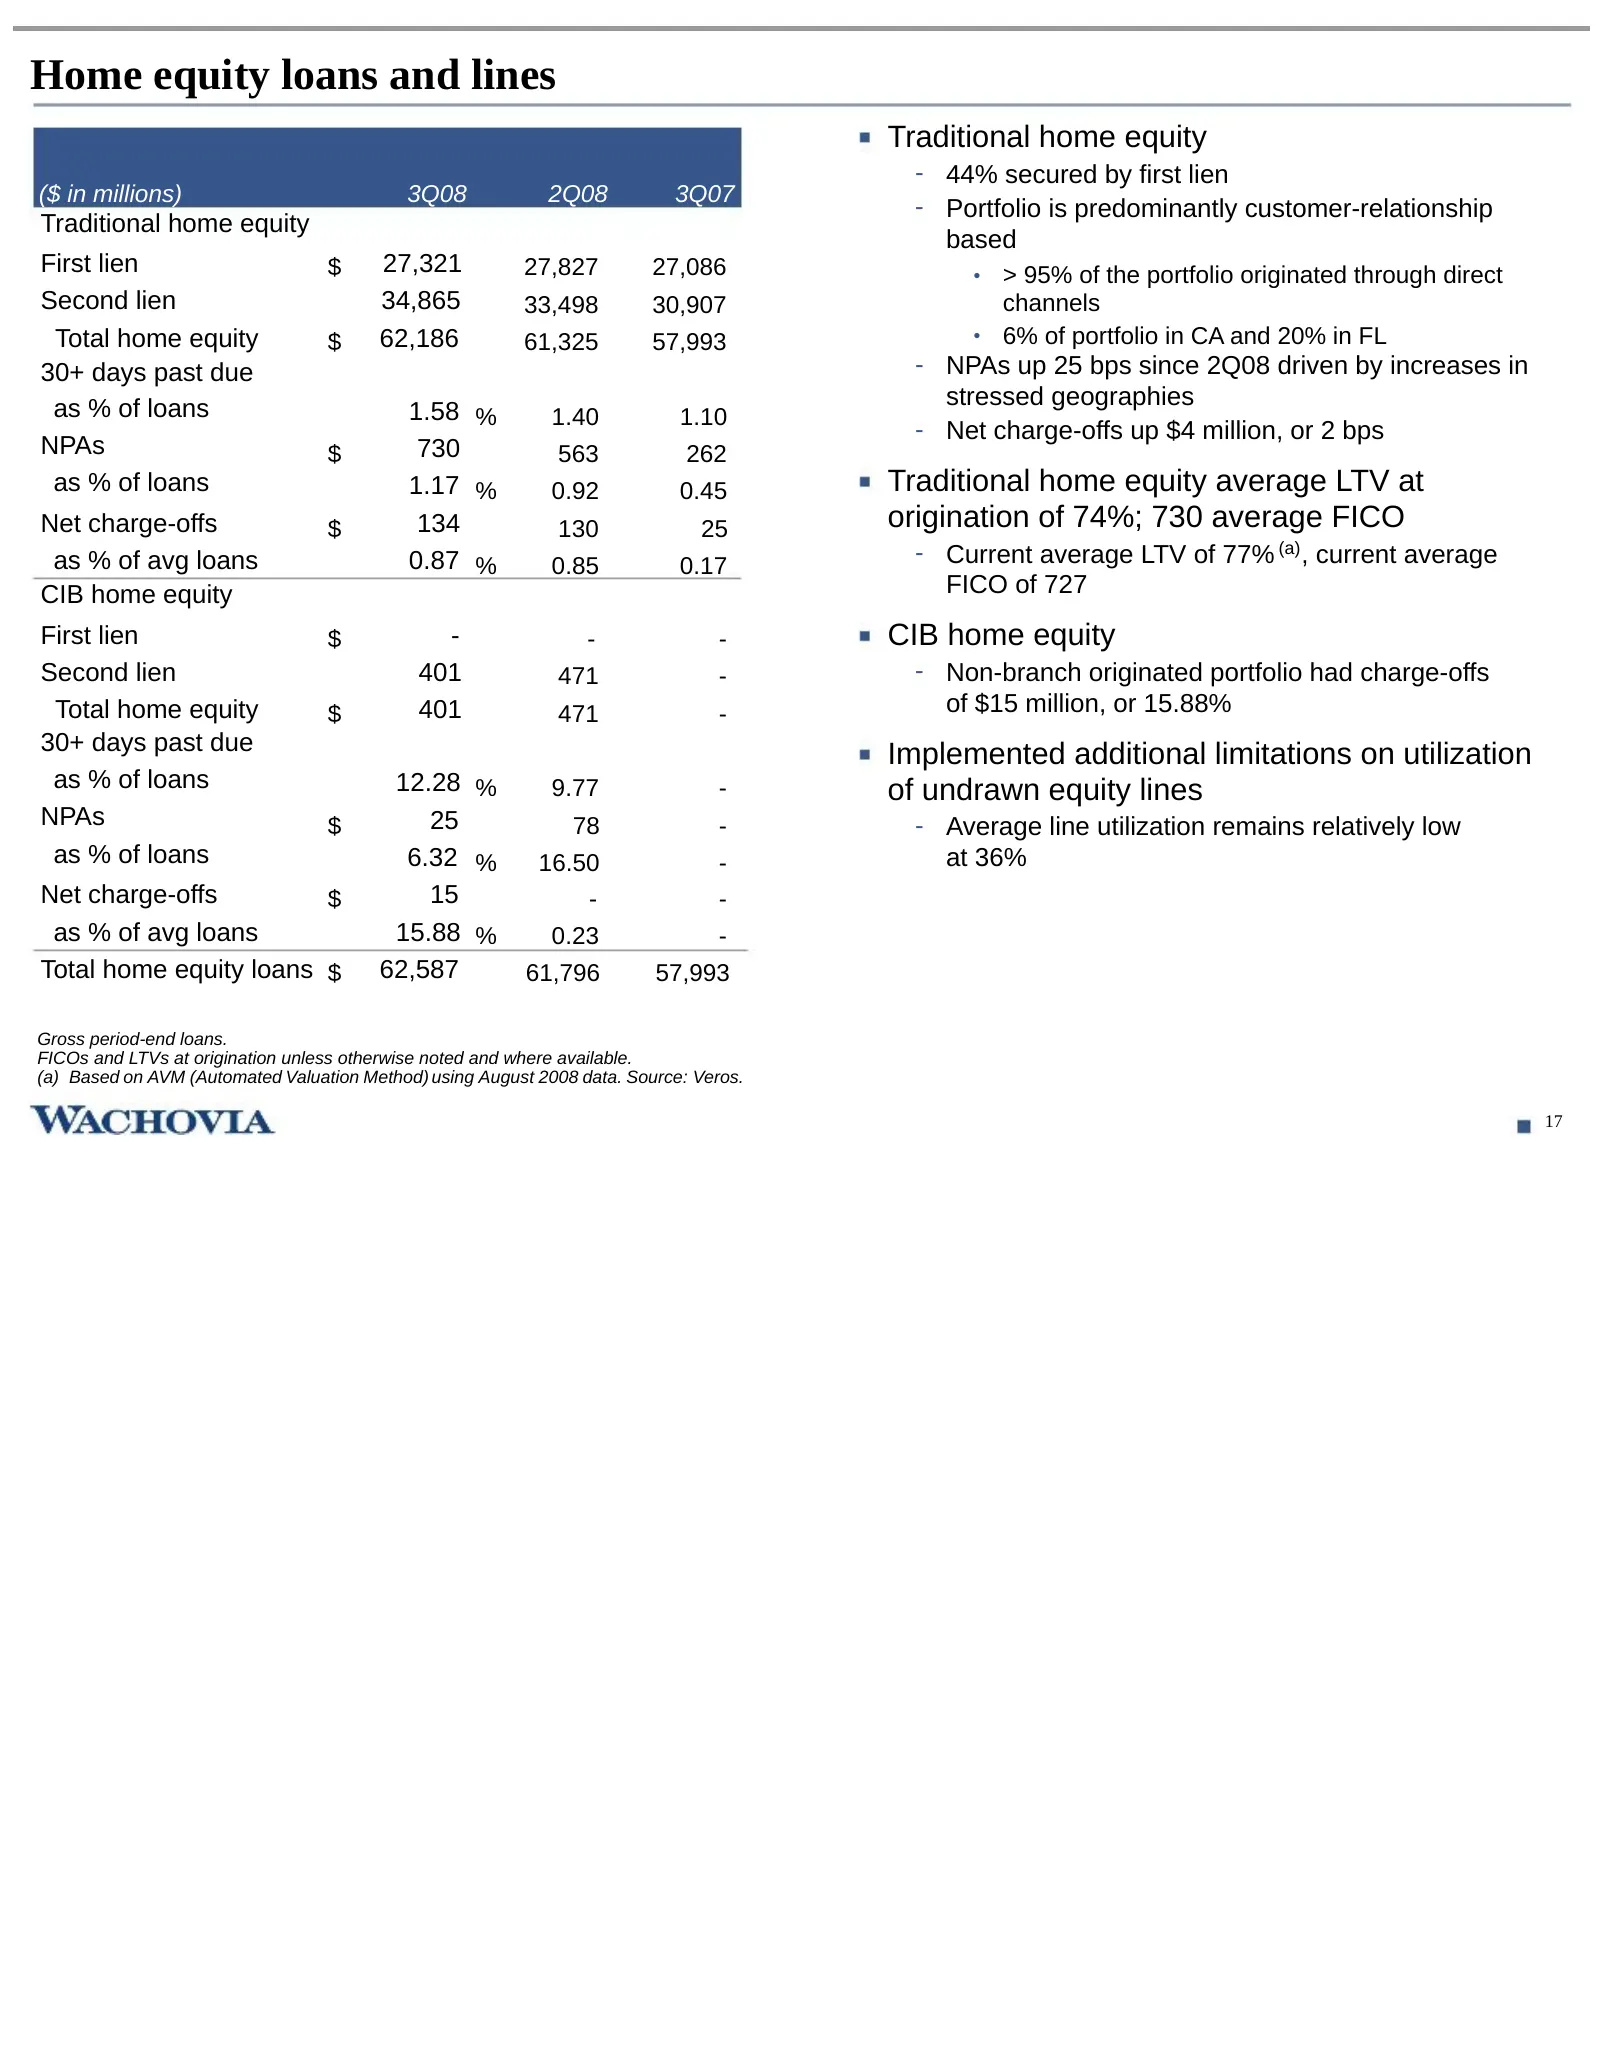
Home equity loans and lines Traditional home equity - 44% secured by first lien ($ in millions) 3Q08 2Q08 3Q07 - Portfolio is predominantly customer-relationship Traditional home equity based First lien $ 27,321 27,827 27,086 • > 95% of the portfolio originated through direct Second lien 34,865 33,4
Slide 19: Managed auto portfolio
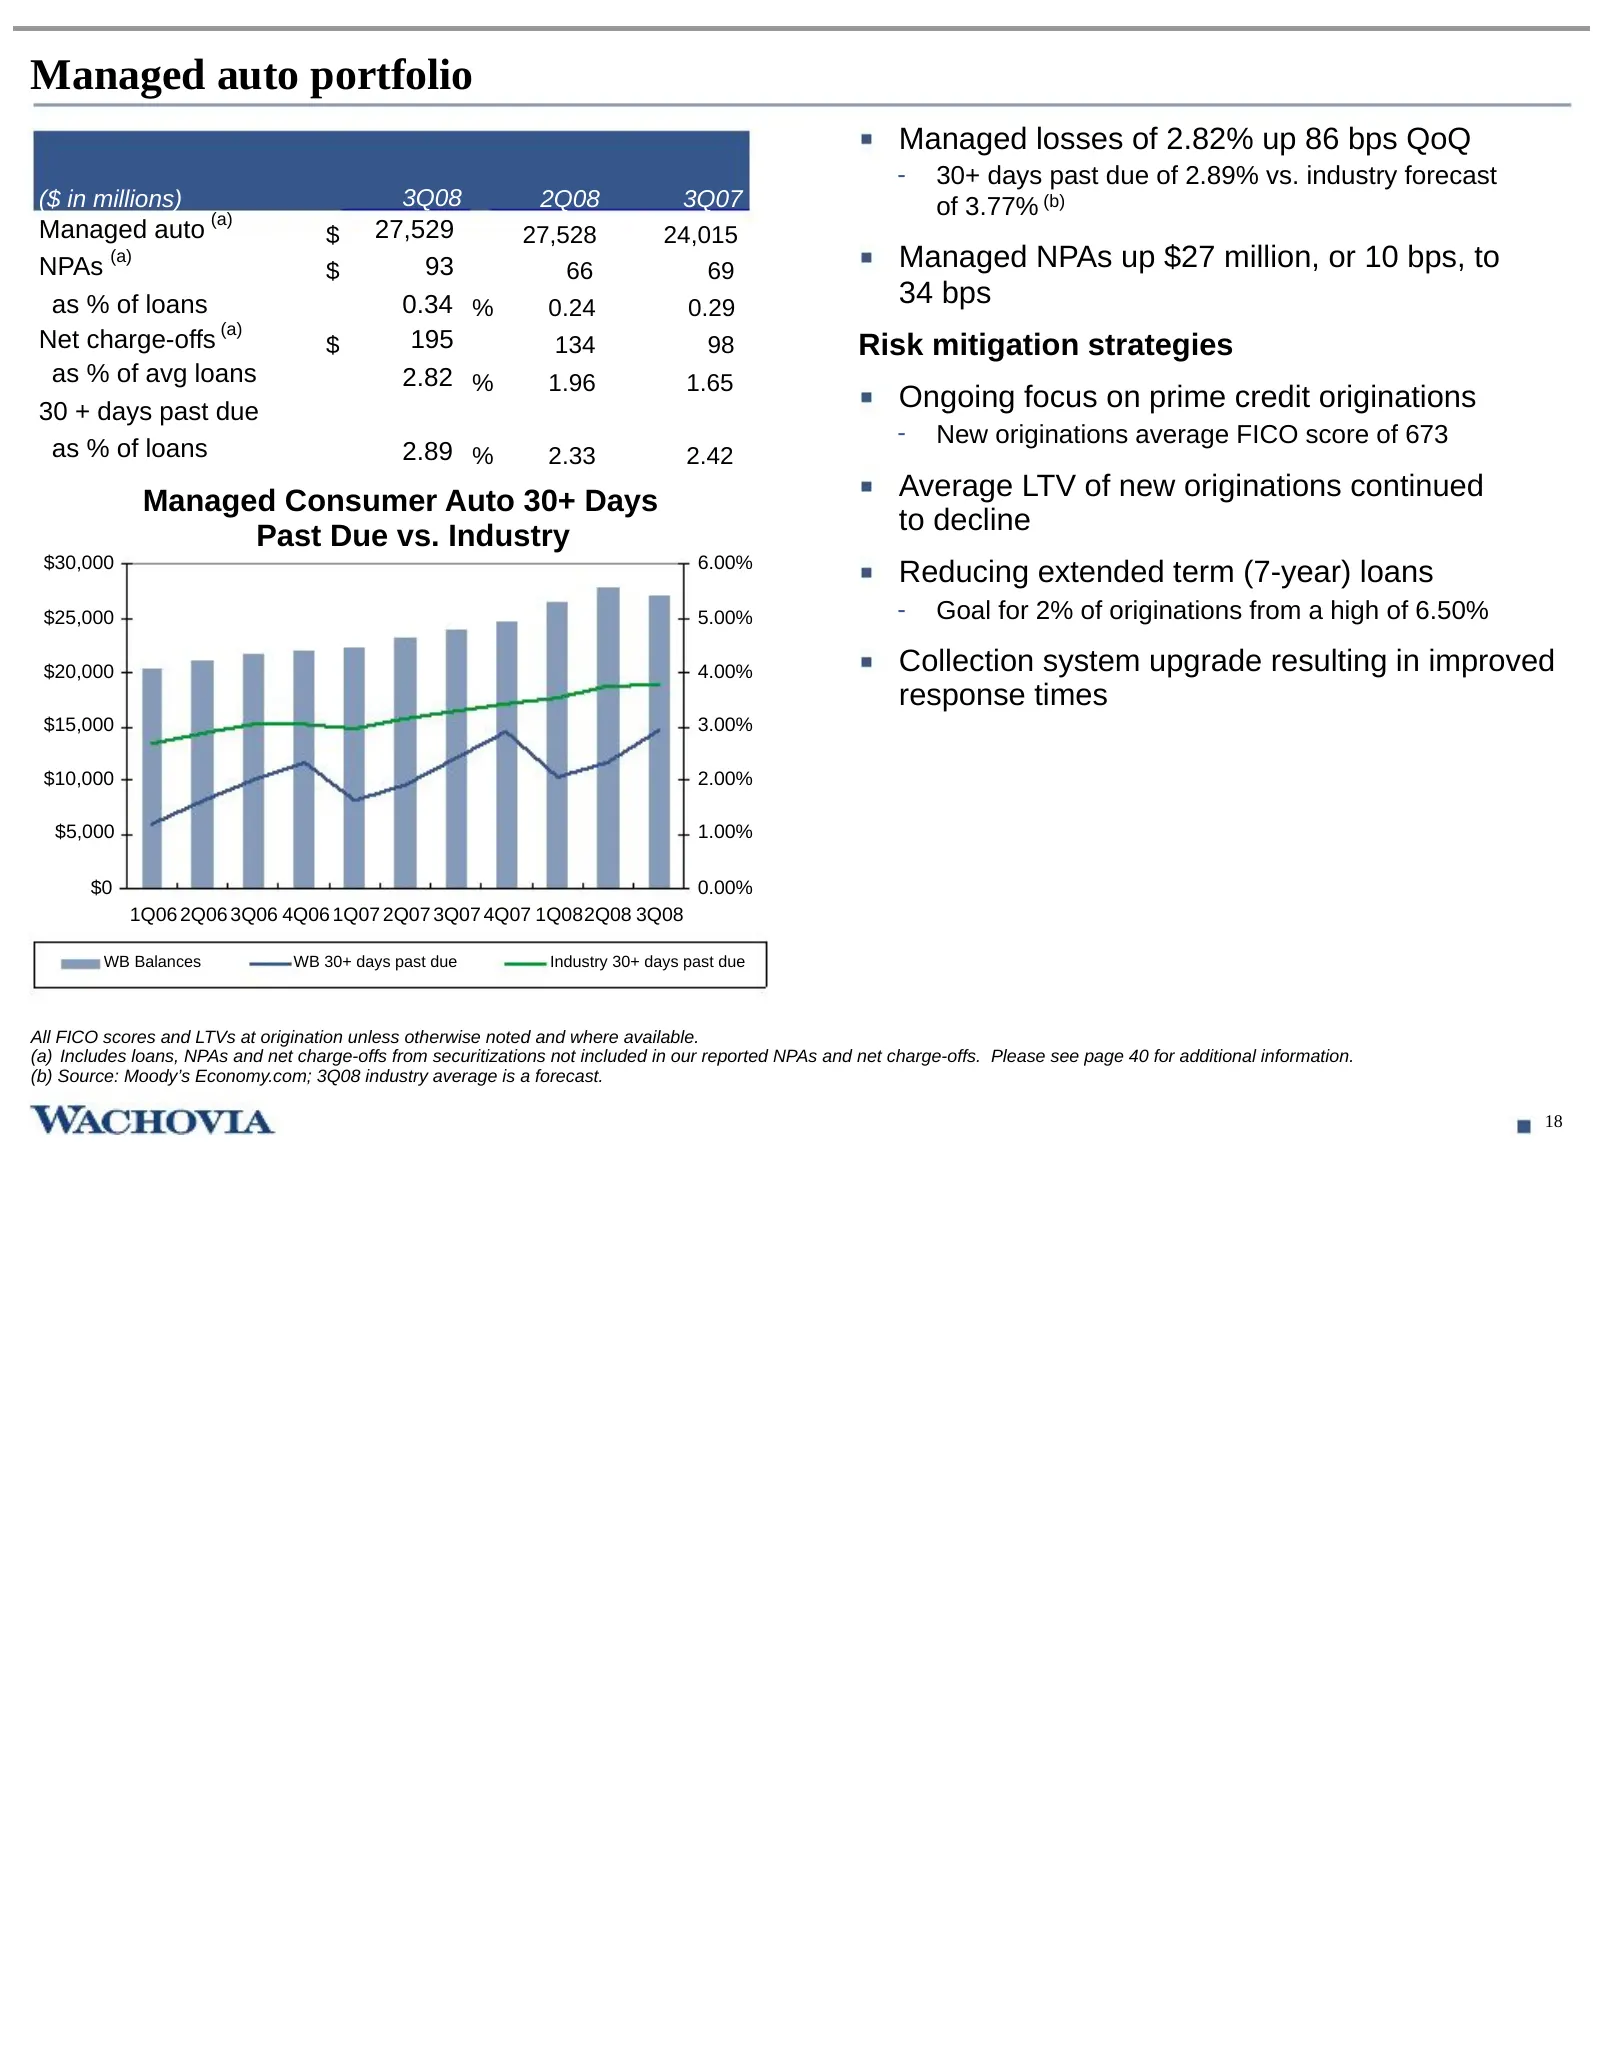
Managed auto portfolio Managed losses of 2.82% up 86 bps QoQ - 30+ days past due of 2.89% vs. industry forecast ($ in millions) 3Q08 2Q08 3Q07 of 3.77% (b) (a) Managed auto $ 27,529 27,528 24,015 NPAs (a) $ 93 66 69 Managed NPAs up $27 million, or 10 bps, to as % of loans 0.34 % 0.24 0.29 34 bps (a)
Slide 20: Commercial loan portfolio, excluding REFS commercial real estate, continues to perform well
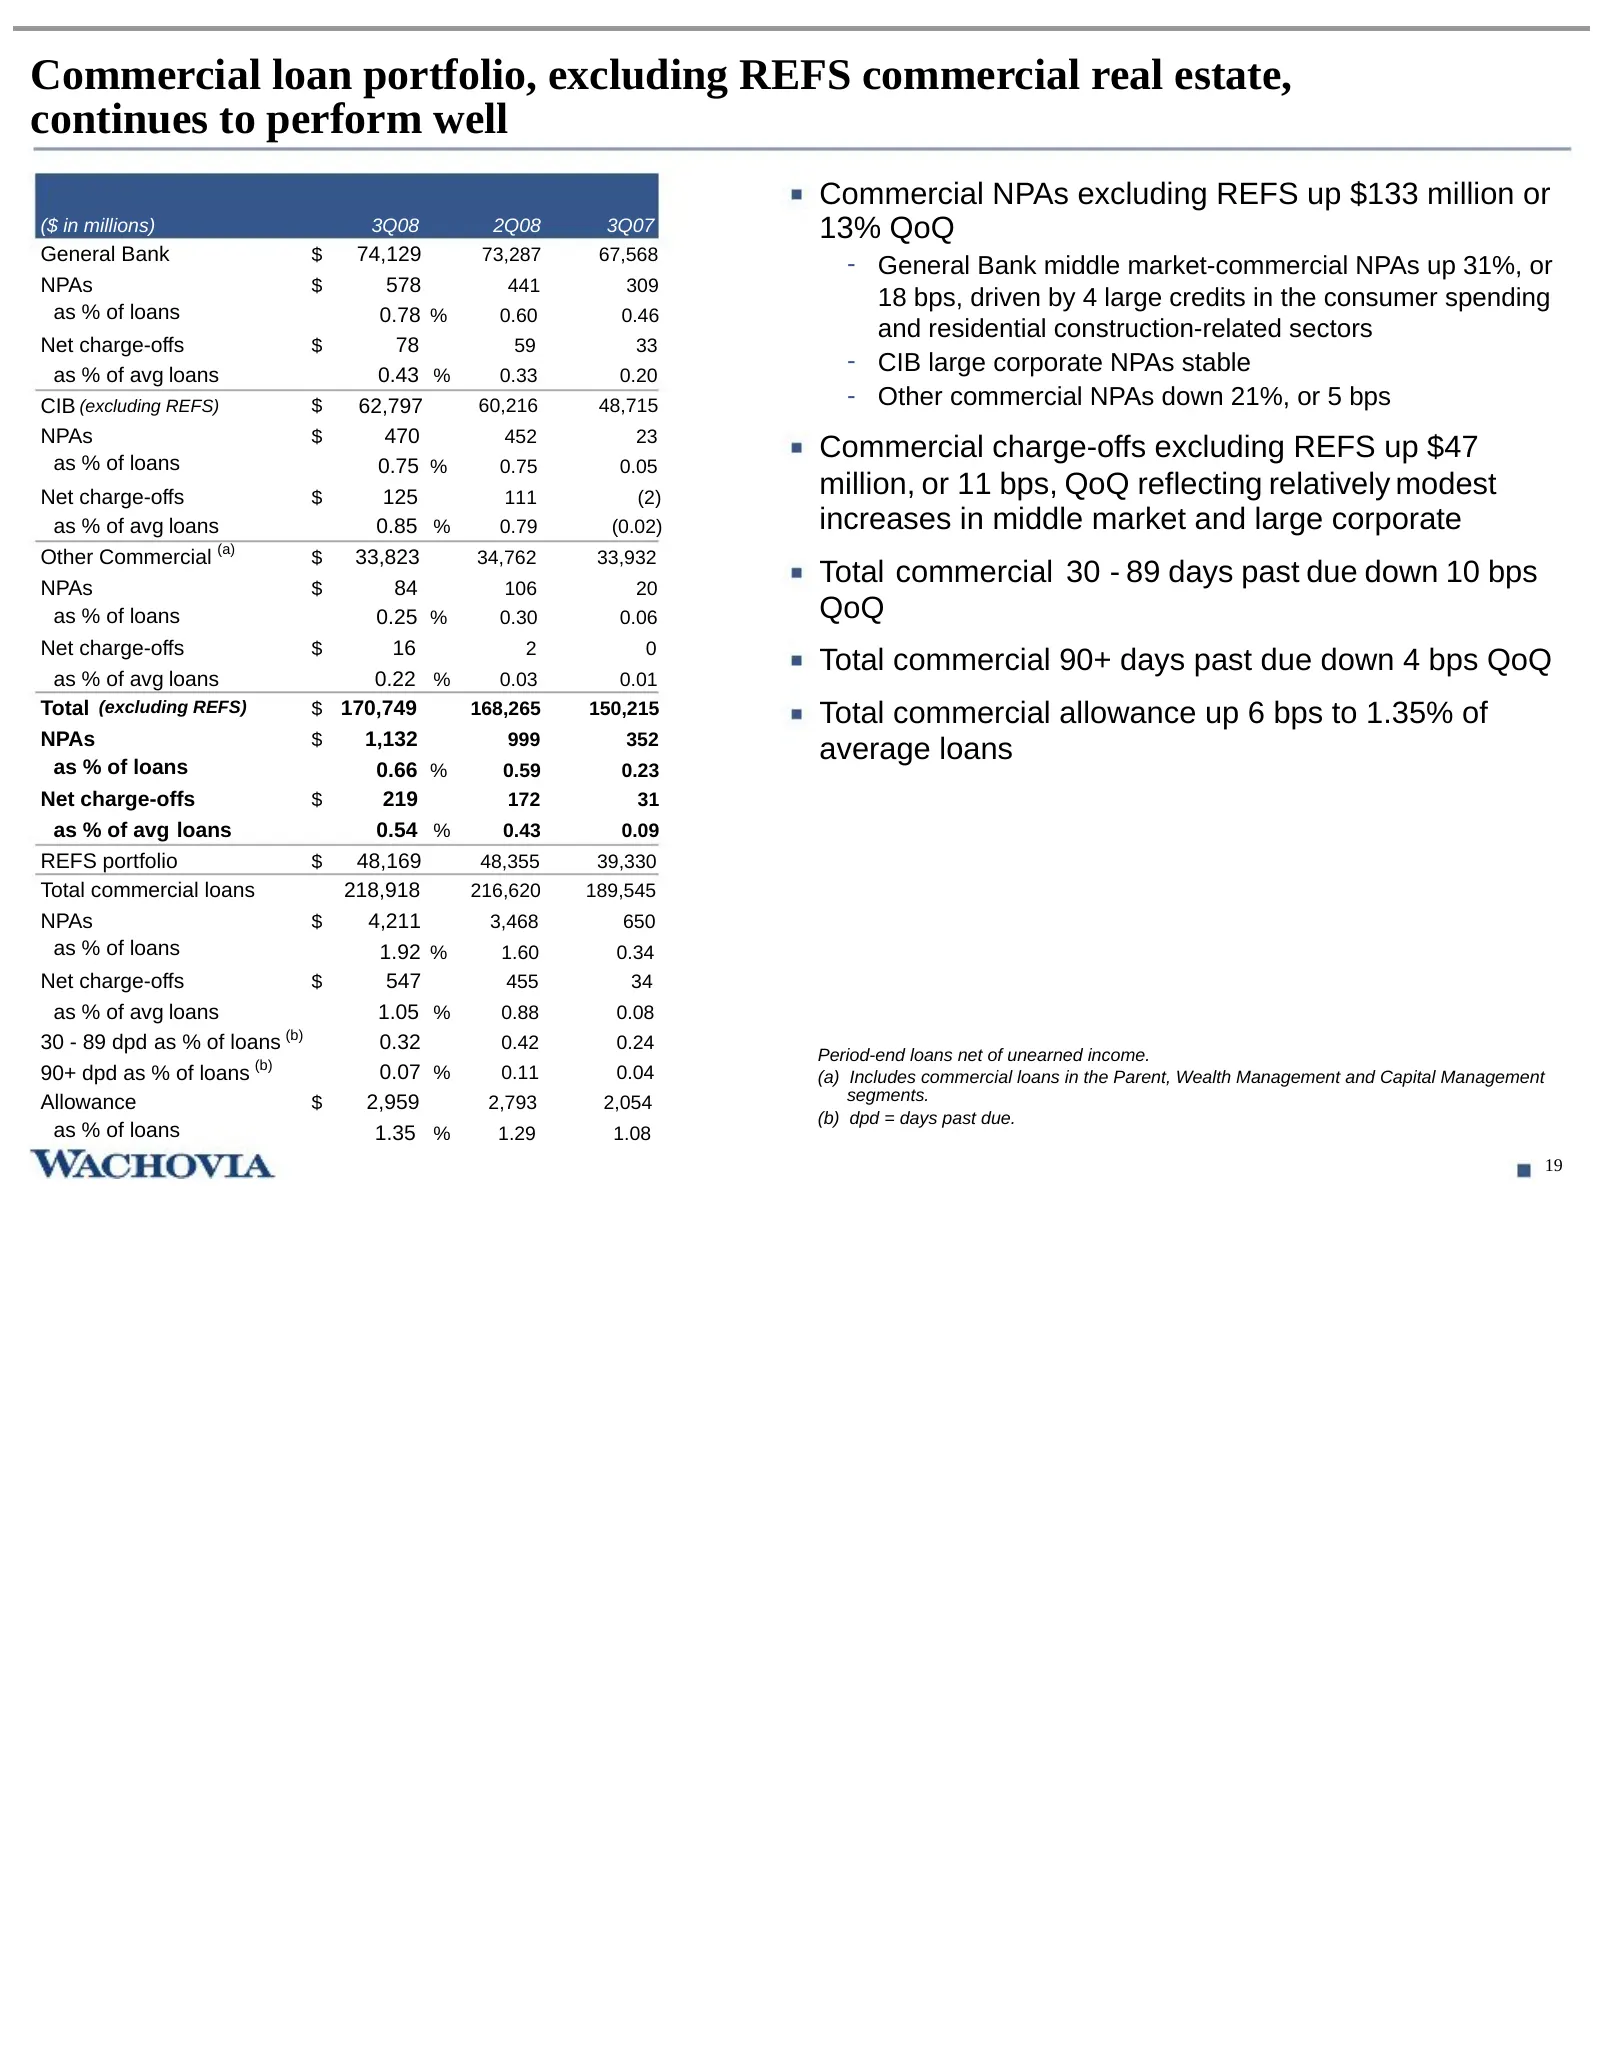
Commercial loan portfolio, excluding REFS commercial real estate, continues to perform well Commercial NPAs excluding REFS up $133 million or ($ in millions) 3Q08- 2Q08 3Q07 13% QoQ General Bank $ 74,129 73,287 67,568 - General Bank middle market-commercial NPAs up 31%, or NPAs $ 578 441 309 as % of
Slide 21: Commercial real estate
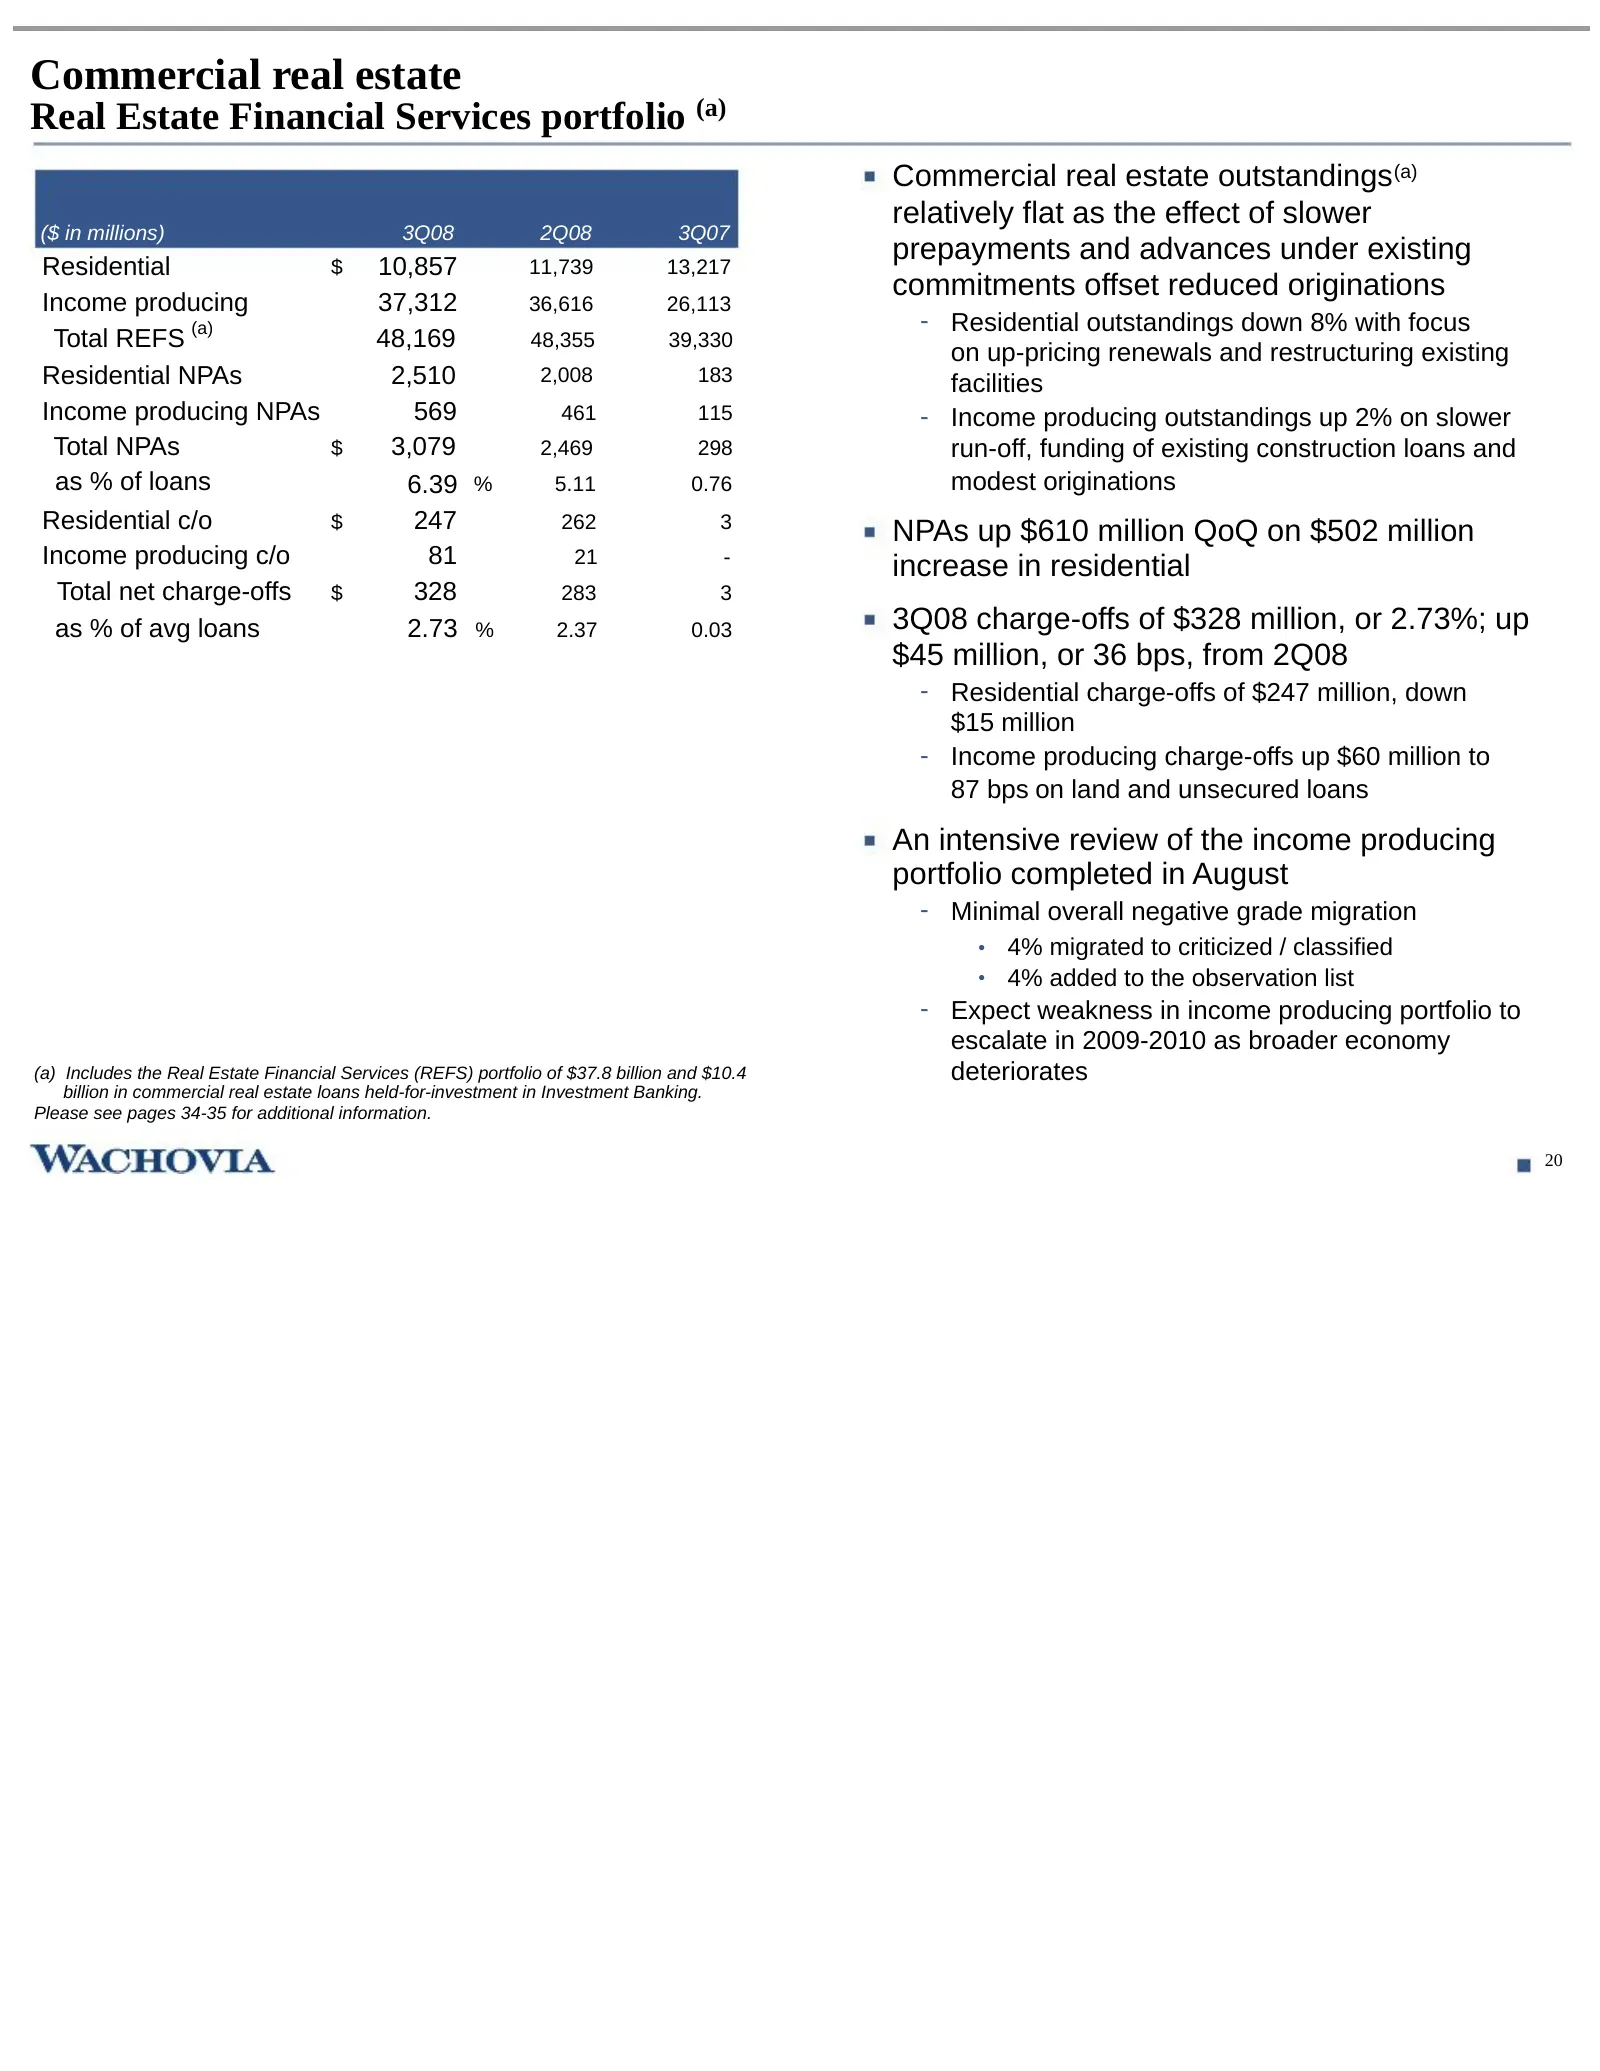
Commercial real estate Real Estate Financial Services portfolio (a) Commercial real estate outstandings (a) relatively flat as the effect of slower ($ in millions) 3Q08 2Q08 3Q07 prepayments and advances under existing Residential $ 10,857 11,739 13,217 commitments offset reduced originations Income
Slide 22: Update on Golden West portfolio
Update on Golden West portfolio 21
Slide 23: Pick-a-Pay mortgage portfolio snapshot
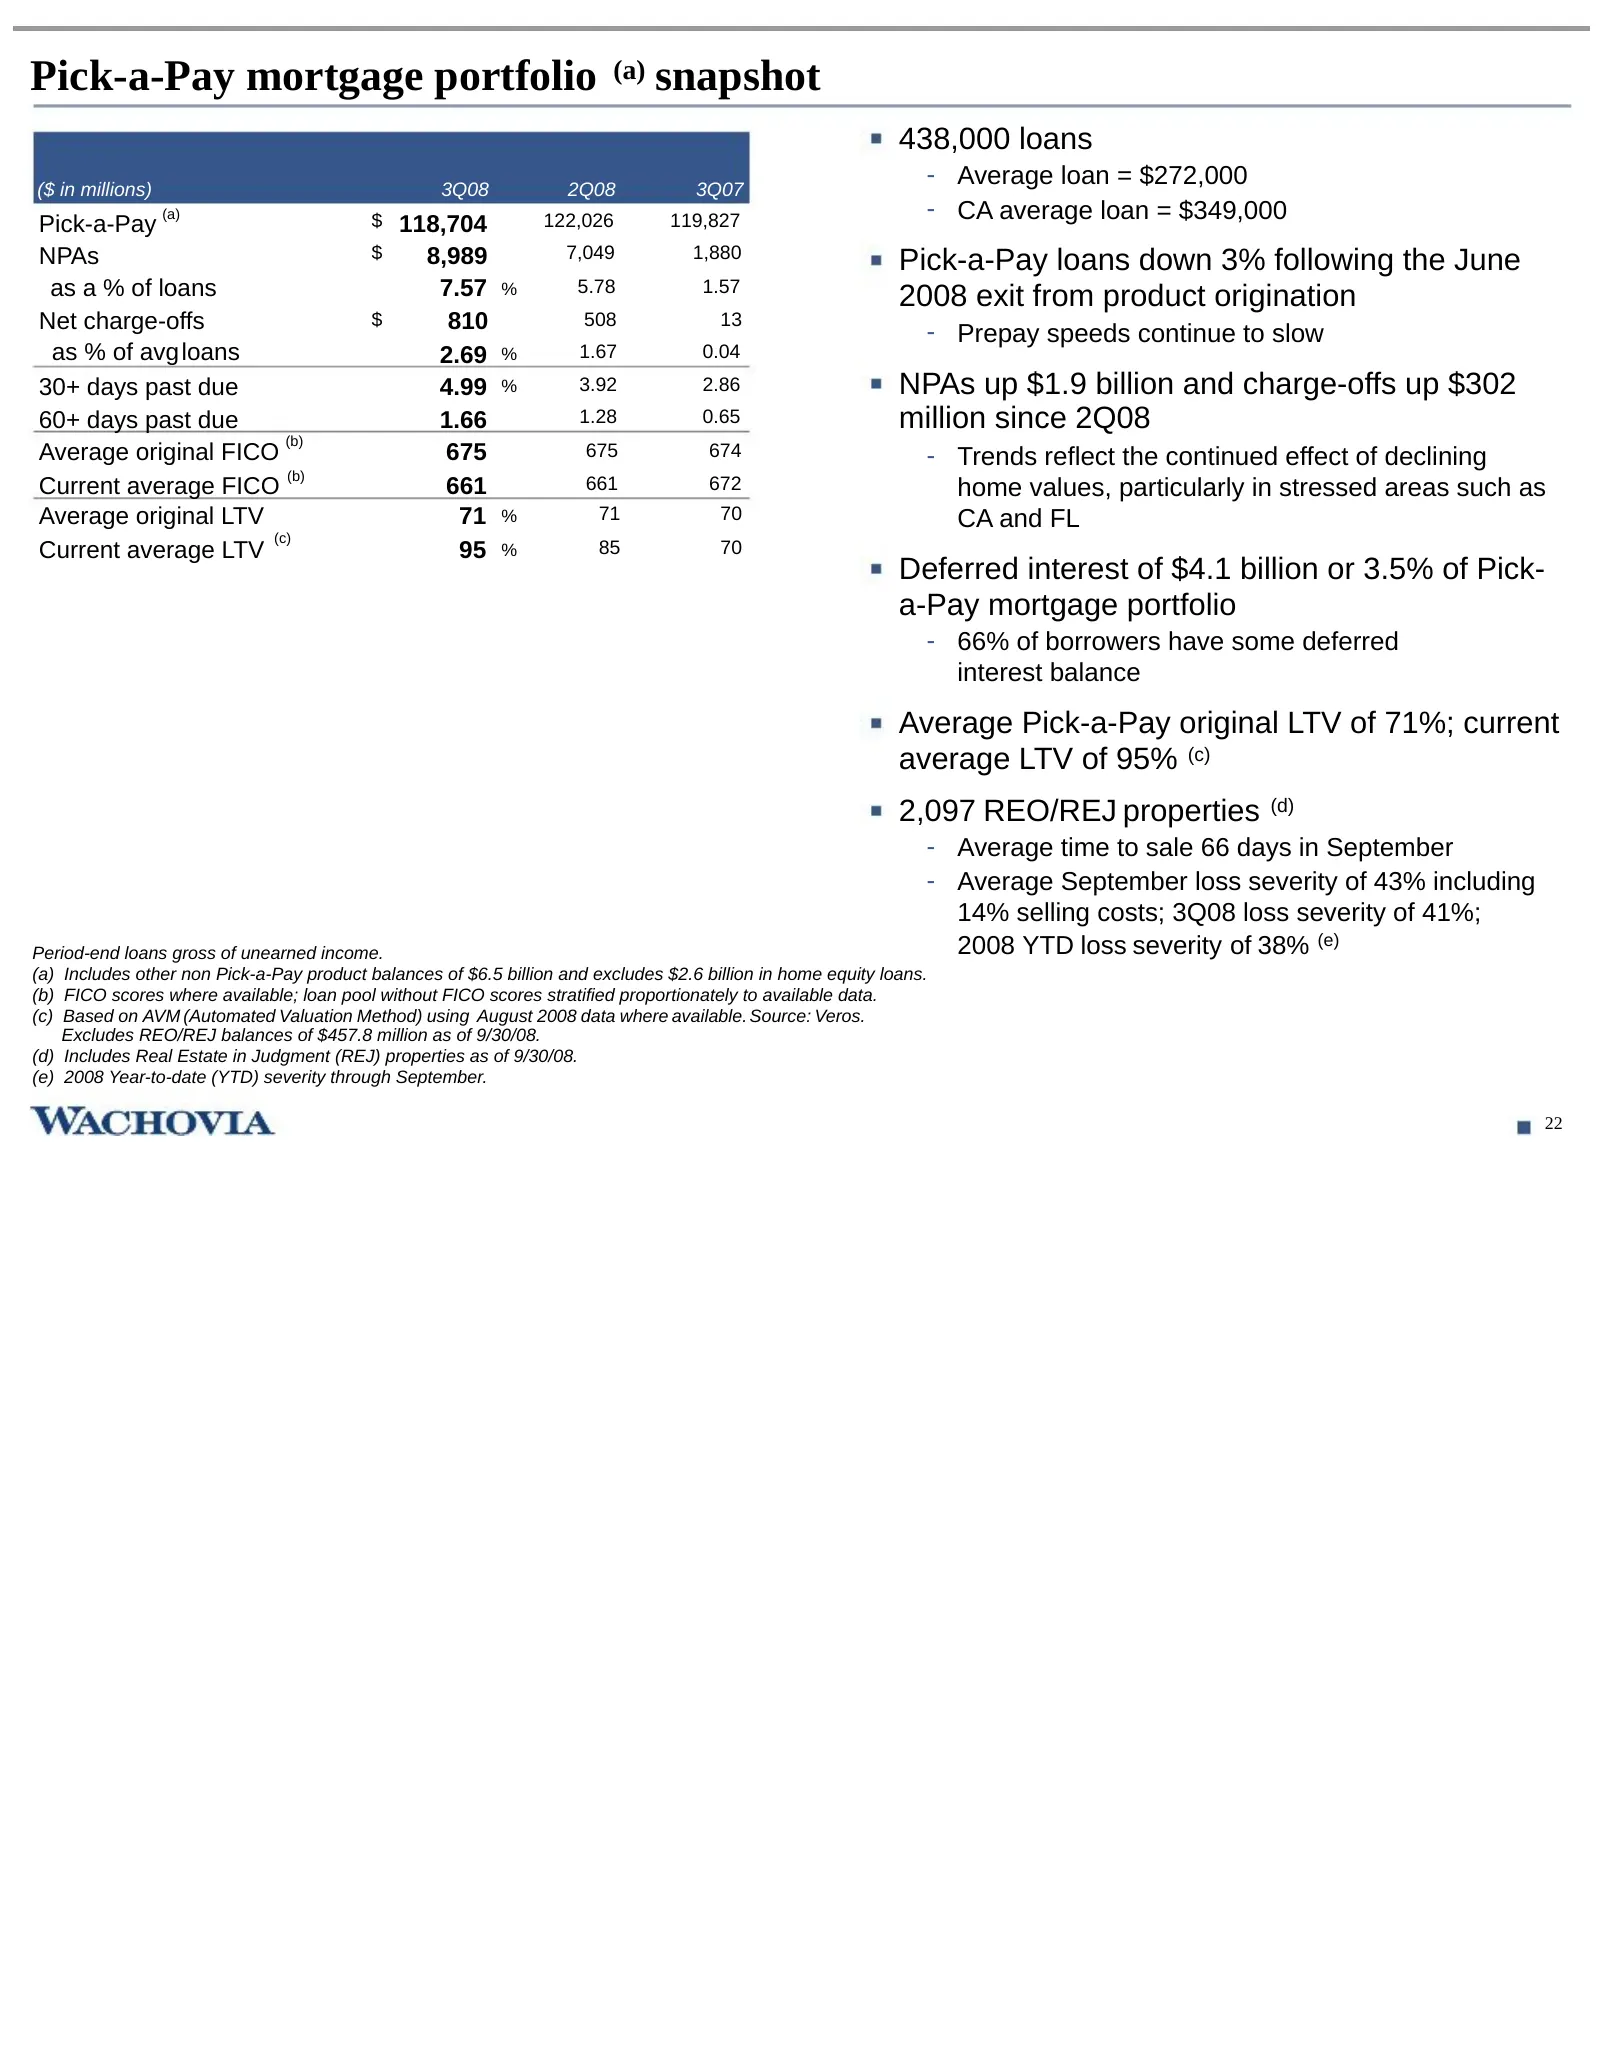
Pick-a-Pay mortgage portfolio (a) snapshot 438,000 loans ($ in millions) 3Q08 2Q08 3Q07 - Average loan = $272,000 (a) $ 122,026 119,827 - CA average loan = $349,000 Pick-a-Pay 118,704 NPAs $ 8,989 7,049 1,880 Pick-a-Pay loans down 3% following the June as a % of loans 7.57 % 5.78 1.57 2008 exit from
Slide 24: Pick-a-Pay mortgage
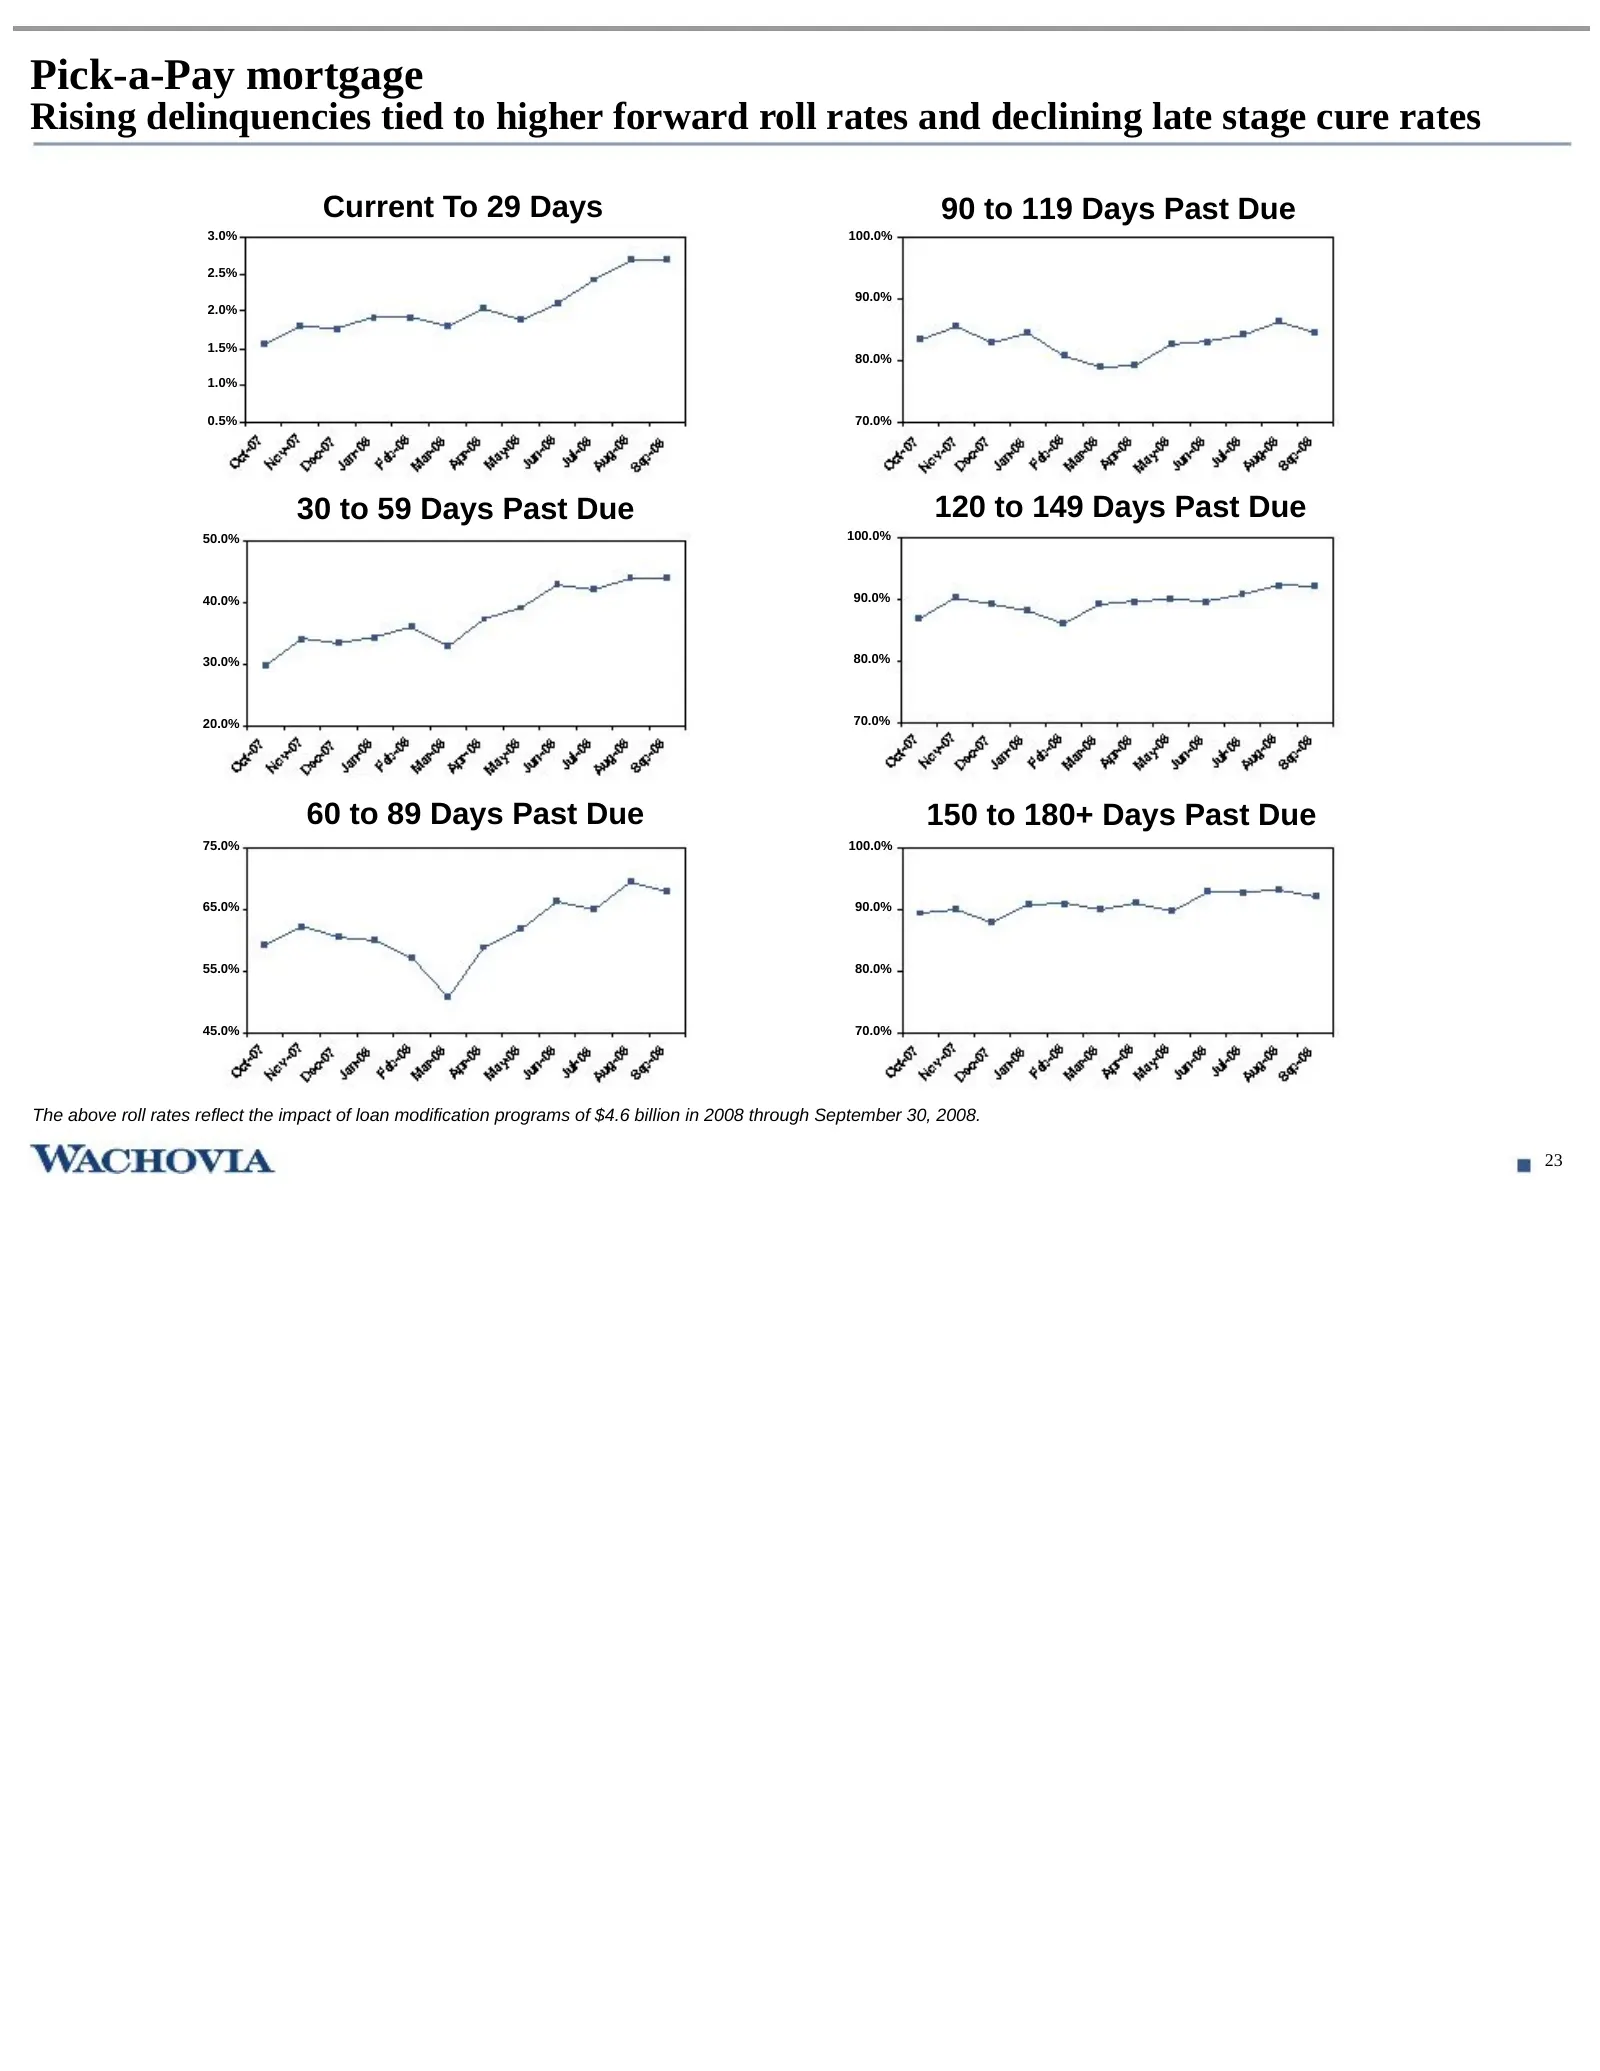
Pick-a-Pay mortgage Rising delinquencies tied to higher forward roll rates and declining late stage cure rates Current To 29 Days 90 to 119 Days Past Due 3.0% 100.0% 2.5% 90.0% 2.0% 1.5% 80.0% 1.0% 0.5% 70.0% 30 to 59 Days Past Due 120 to 149 Days Past Due 50.0% 100.0% 40.0% 90.0% 30.0% 80.0% 20.0%
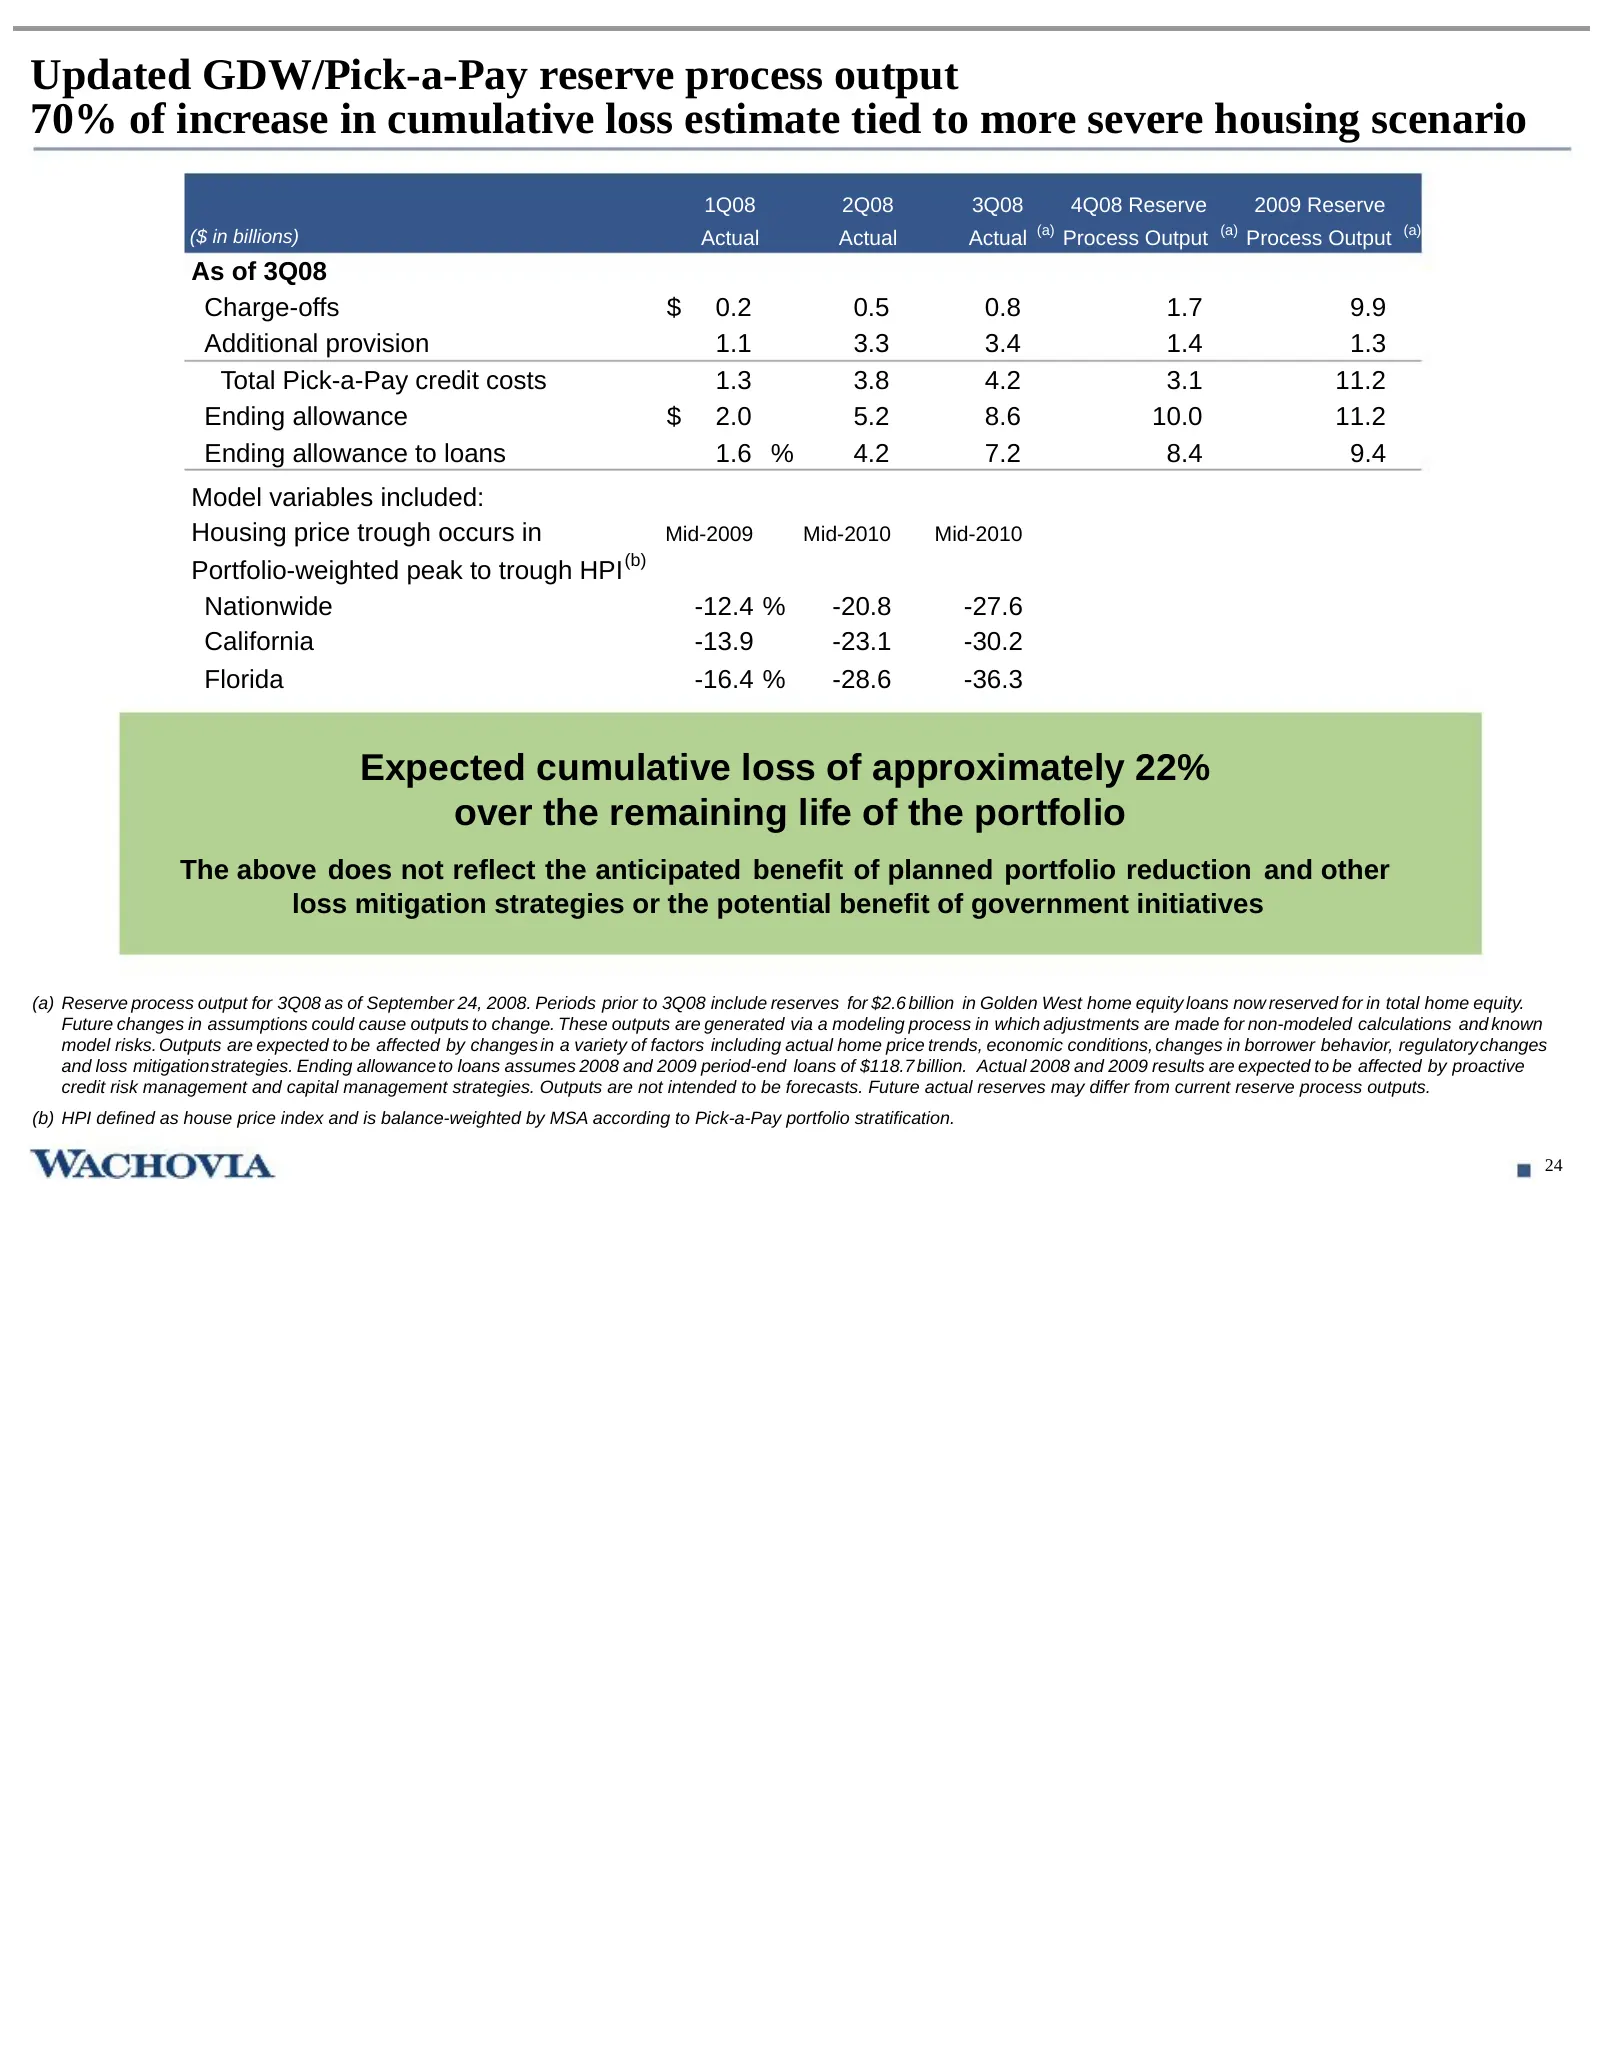
Slide 25: Updated GDW/Pick-a-Pay reserve process output
Updated GDW/Pick-a-Pay reserve process output 70% of increase in cumulative loss estimate tied to more severe housing scenario 1Q08 2Q08 3Q08 4Q08 Reserve 2009 Reserve ($ in billions) Actual Actual Actual (a) Process Output (a) Process Output (a) As of 3Q08 Charge-offs $ 0.2 0.5 0.8 1.7 9.9 Addition
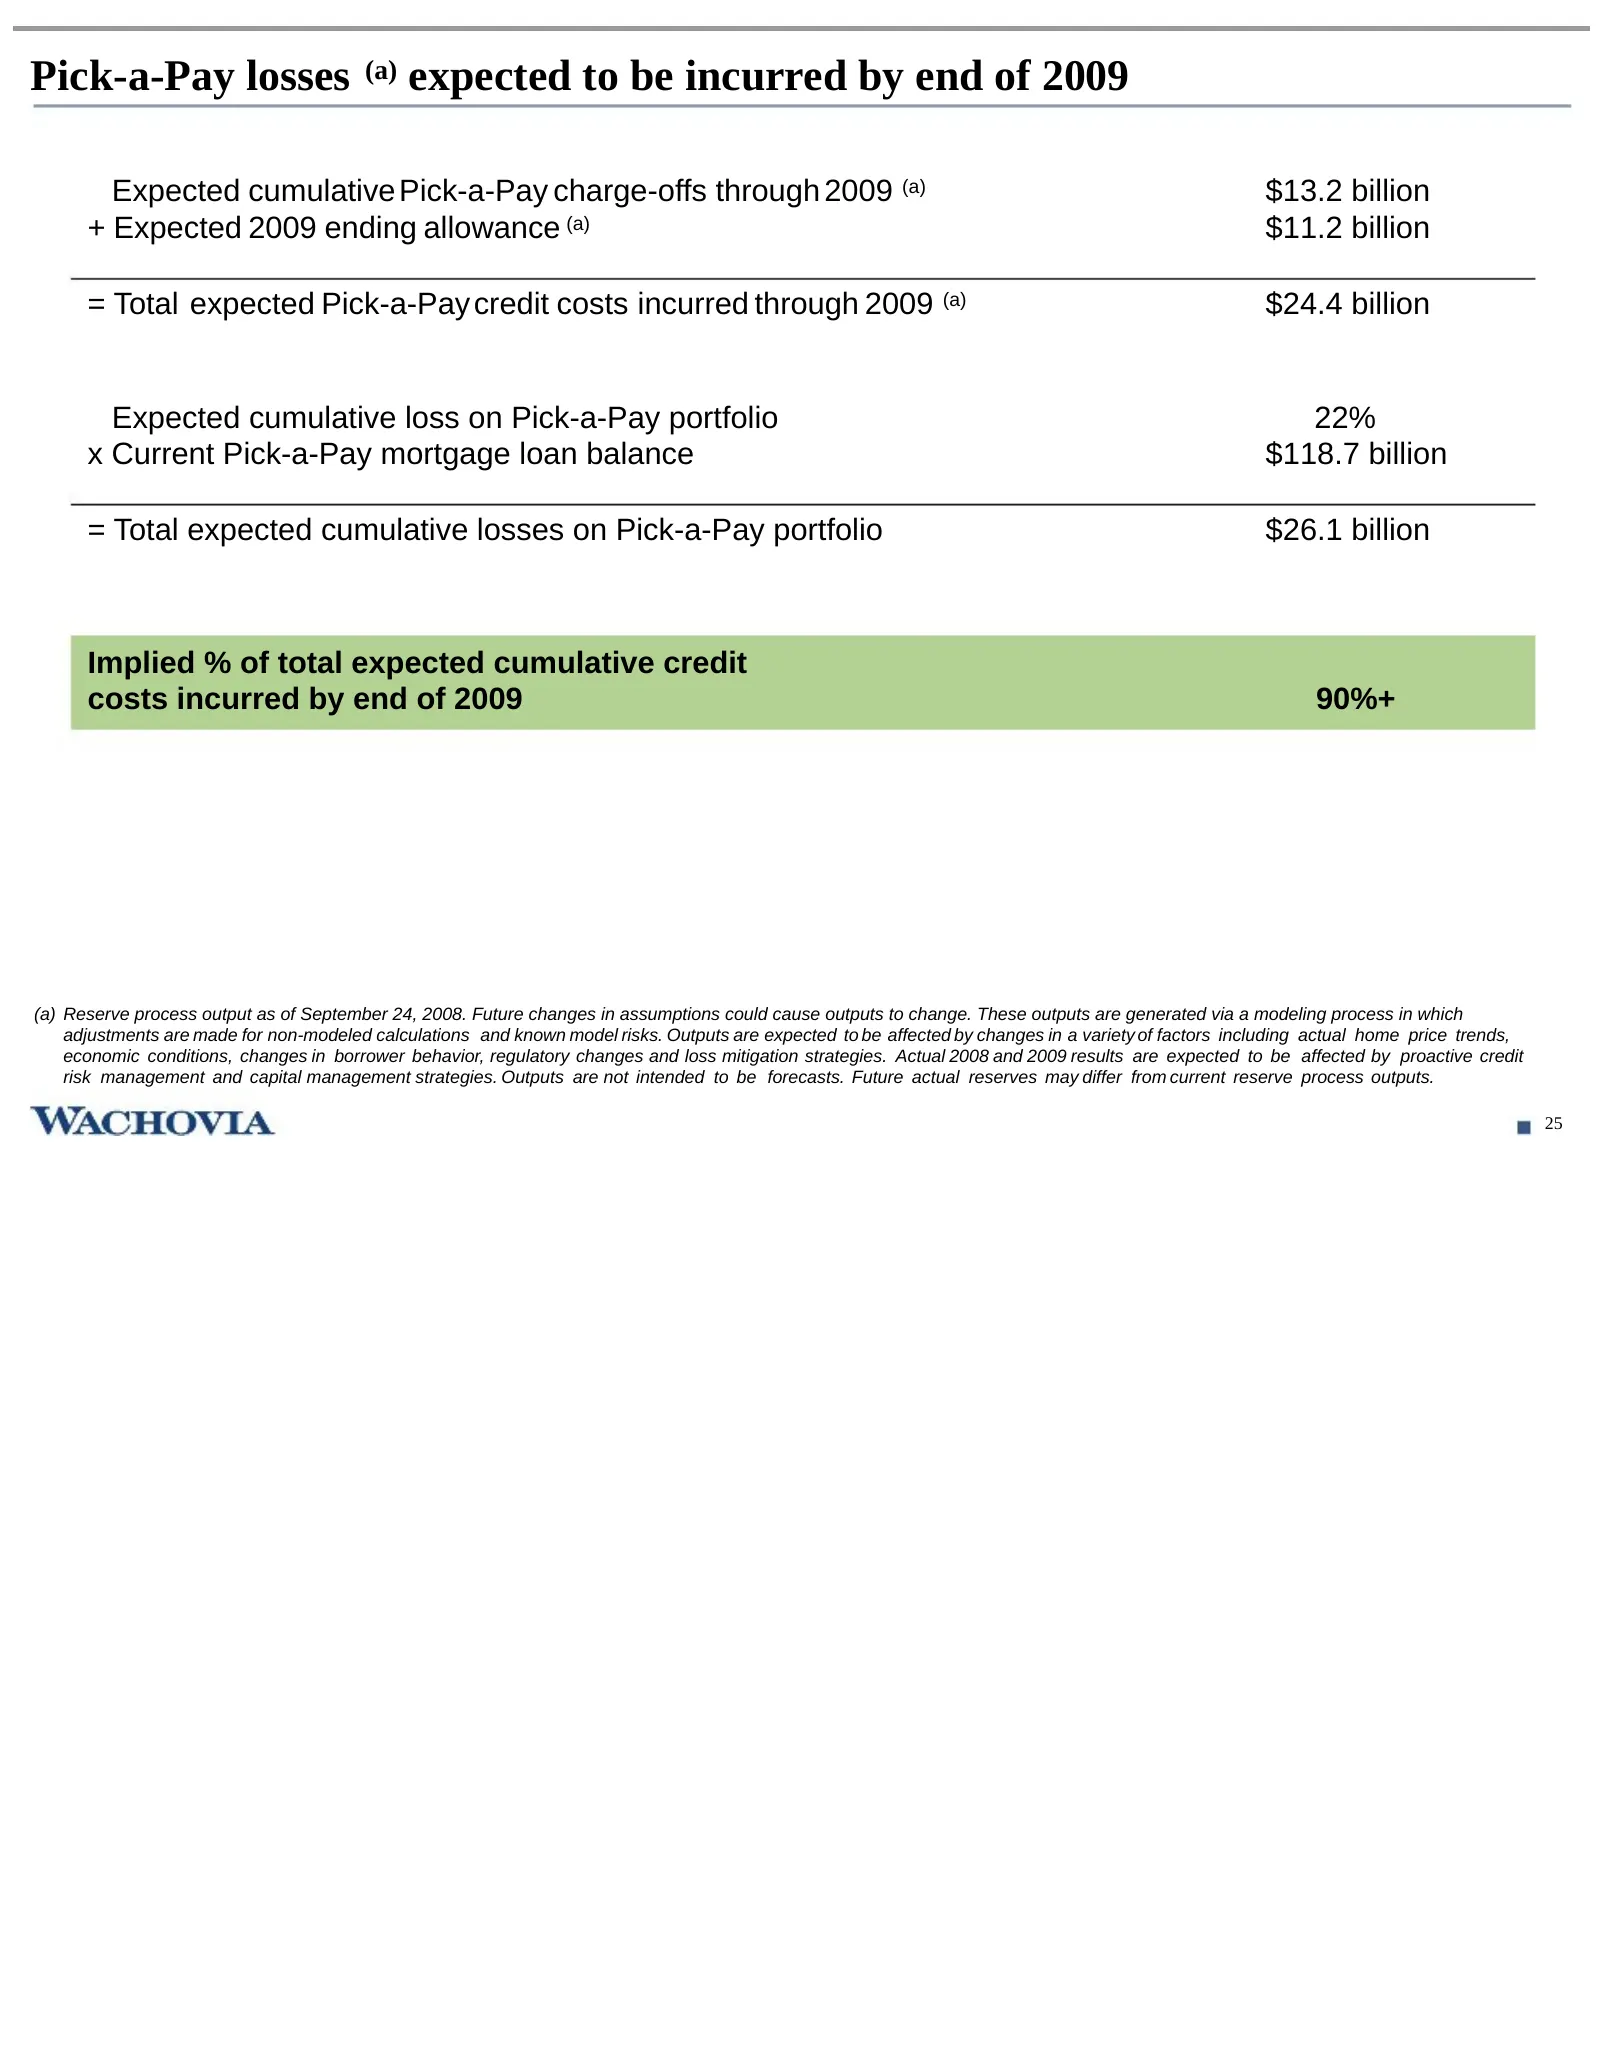
Slide 26: Pick-a-Pay losses expected to be incurred by end of 2009
Pick-a-Pay losses (a) expected to be incurred by end of 2009 Expected cumulative Pick-a-Pay charge-offs through 2009-(a) $13.2 billion + Expected 2009 ending allowance (a) $11.2 billion = Total expected Pick-a-Pay credit costs incurred through 2009-(a) $24.4 billion Expected cumulative loss on Pick-
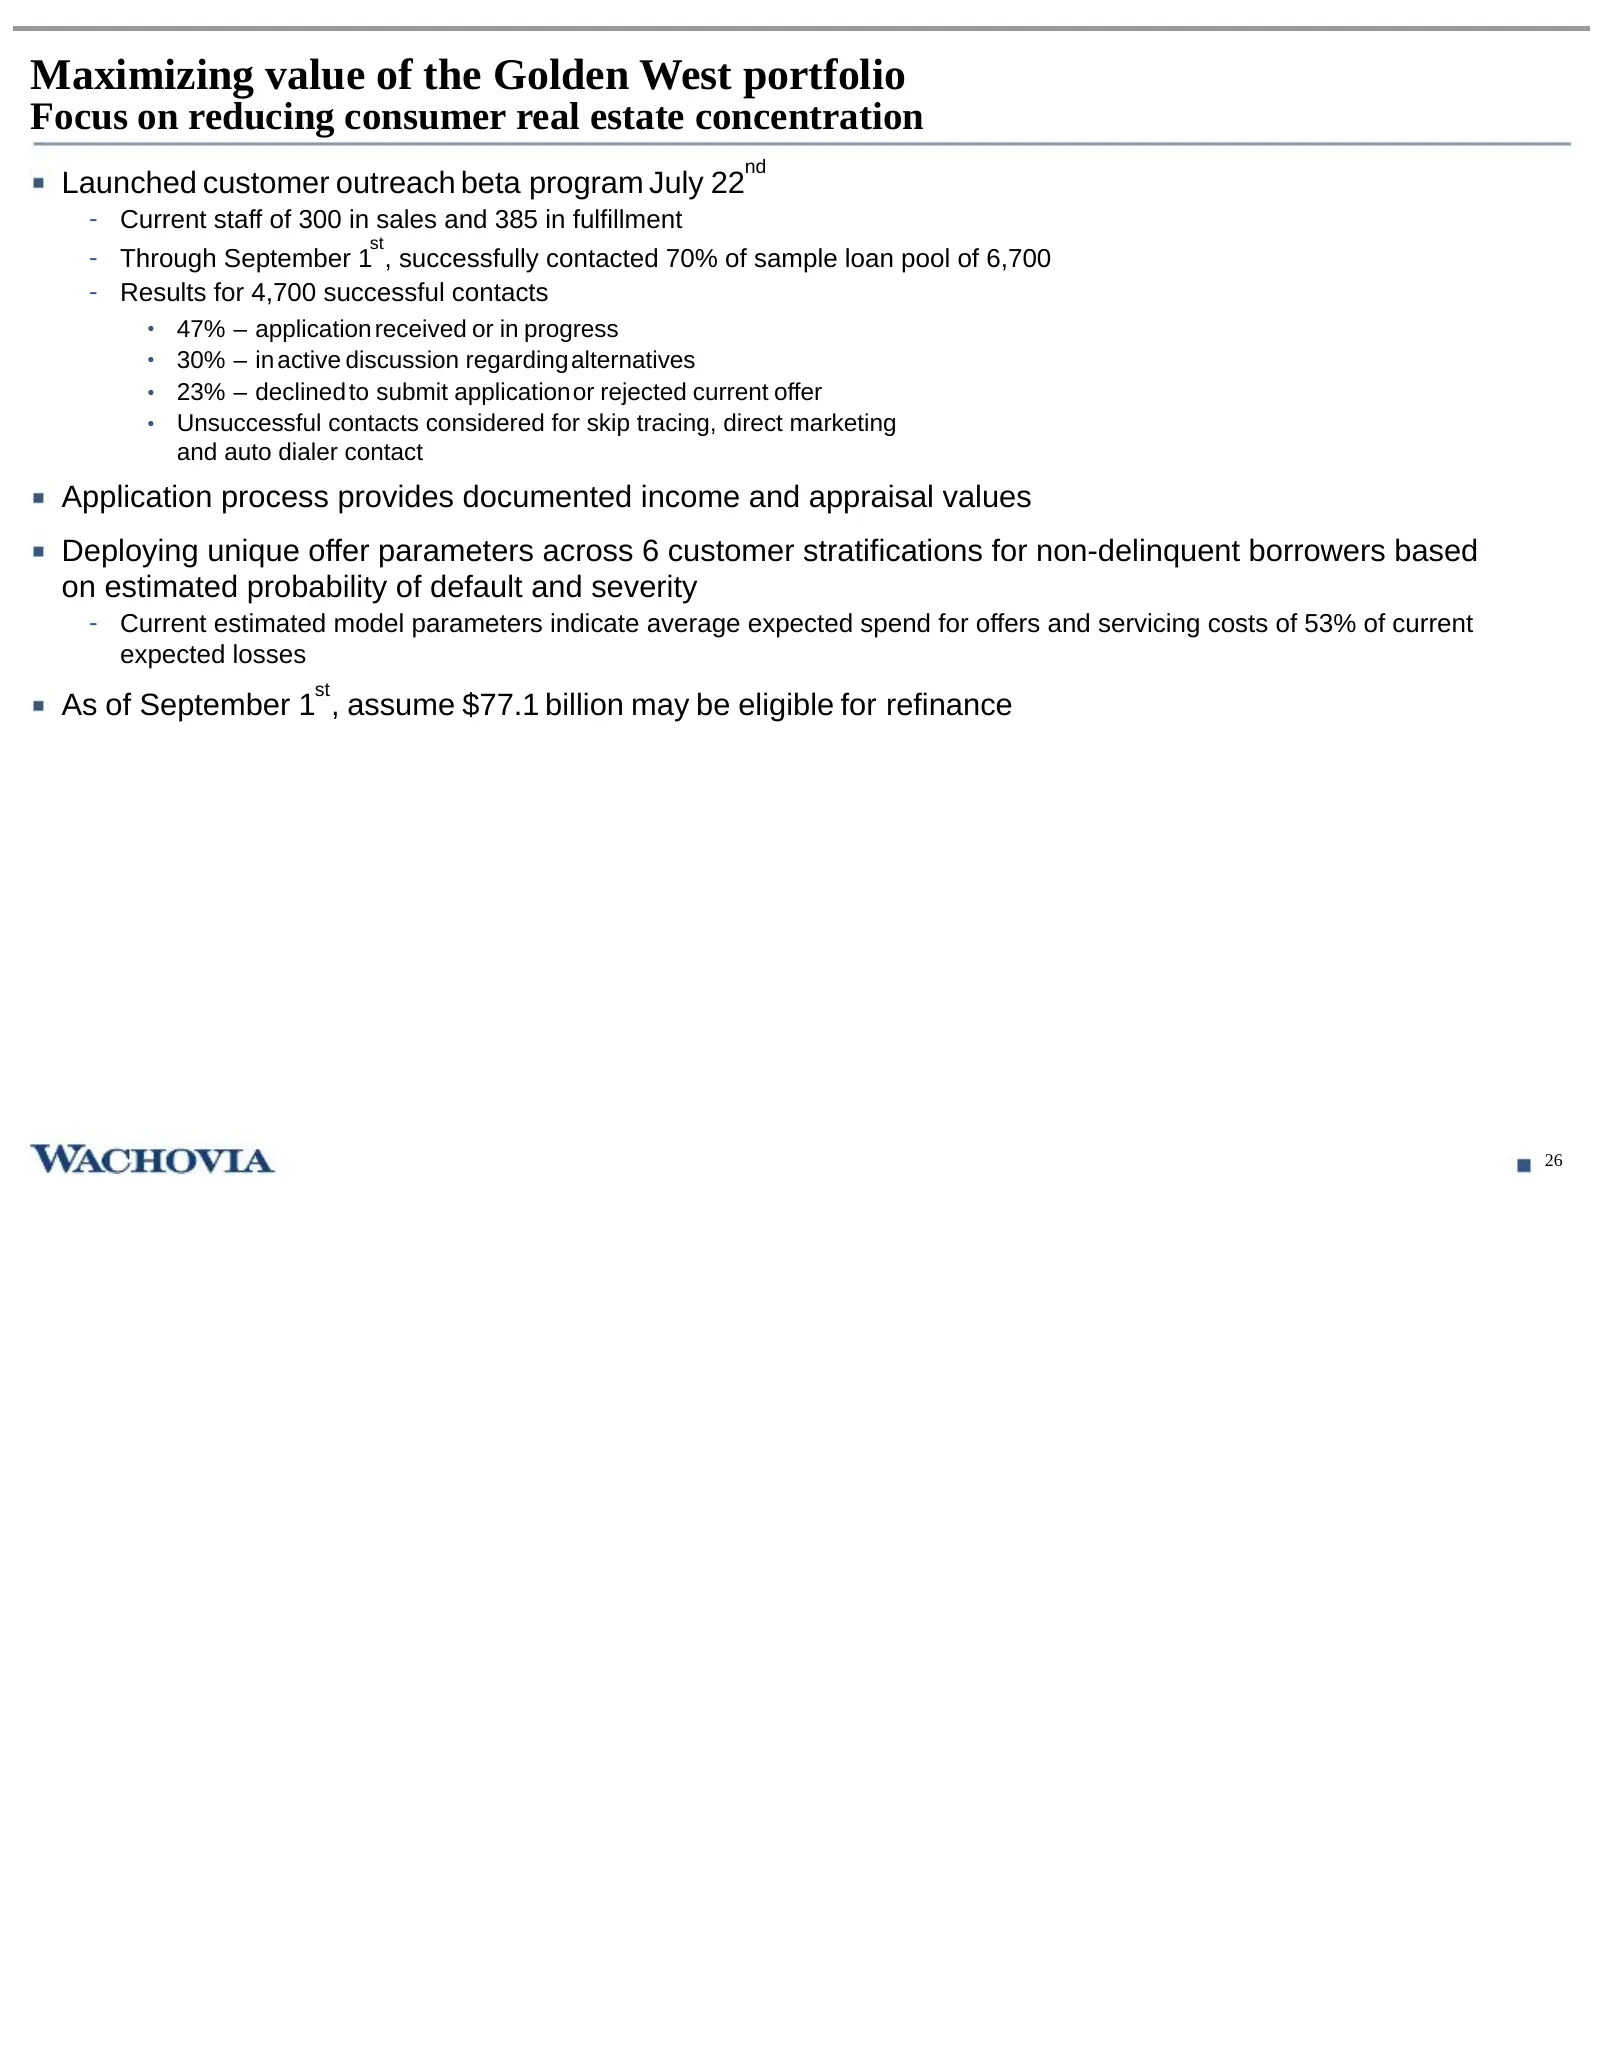
Slide 27: Maximizing value of the Golden West portfolio
Maximizing value of the Golden West portfolio Focus on reducing consumer real estate concentration nd Launched customer outreach beta program July 22 - Current staff of 300 in sales and 385 in fulfillment st - Through September 1 , successfully contacted 70% of sample loan pool of 6,700 - Results fo
Slide 28: Appendix
Appendix WACHOVIA 27
Slide 29: General Bank key metrics
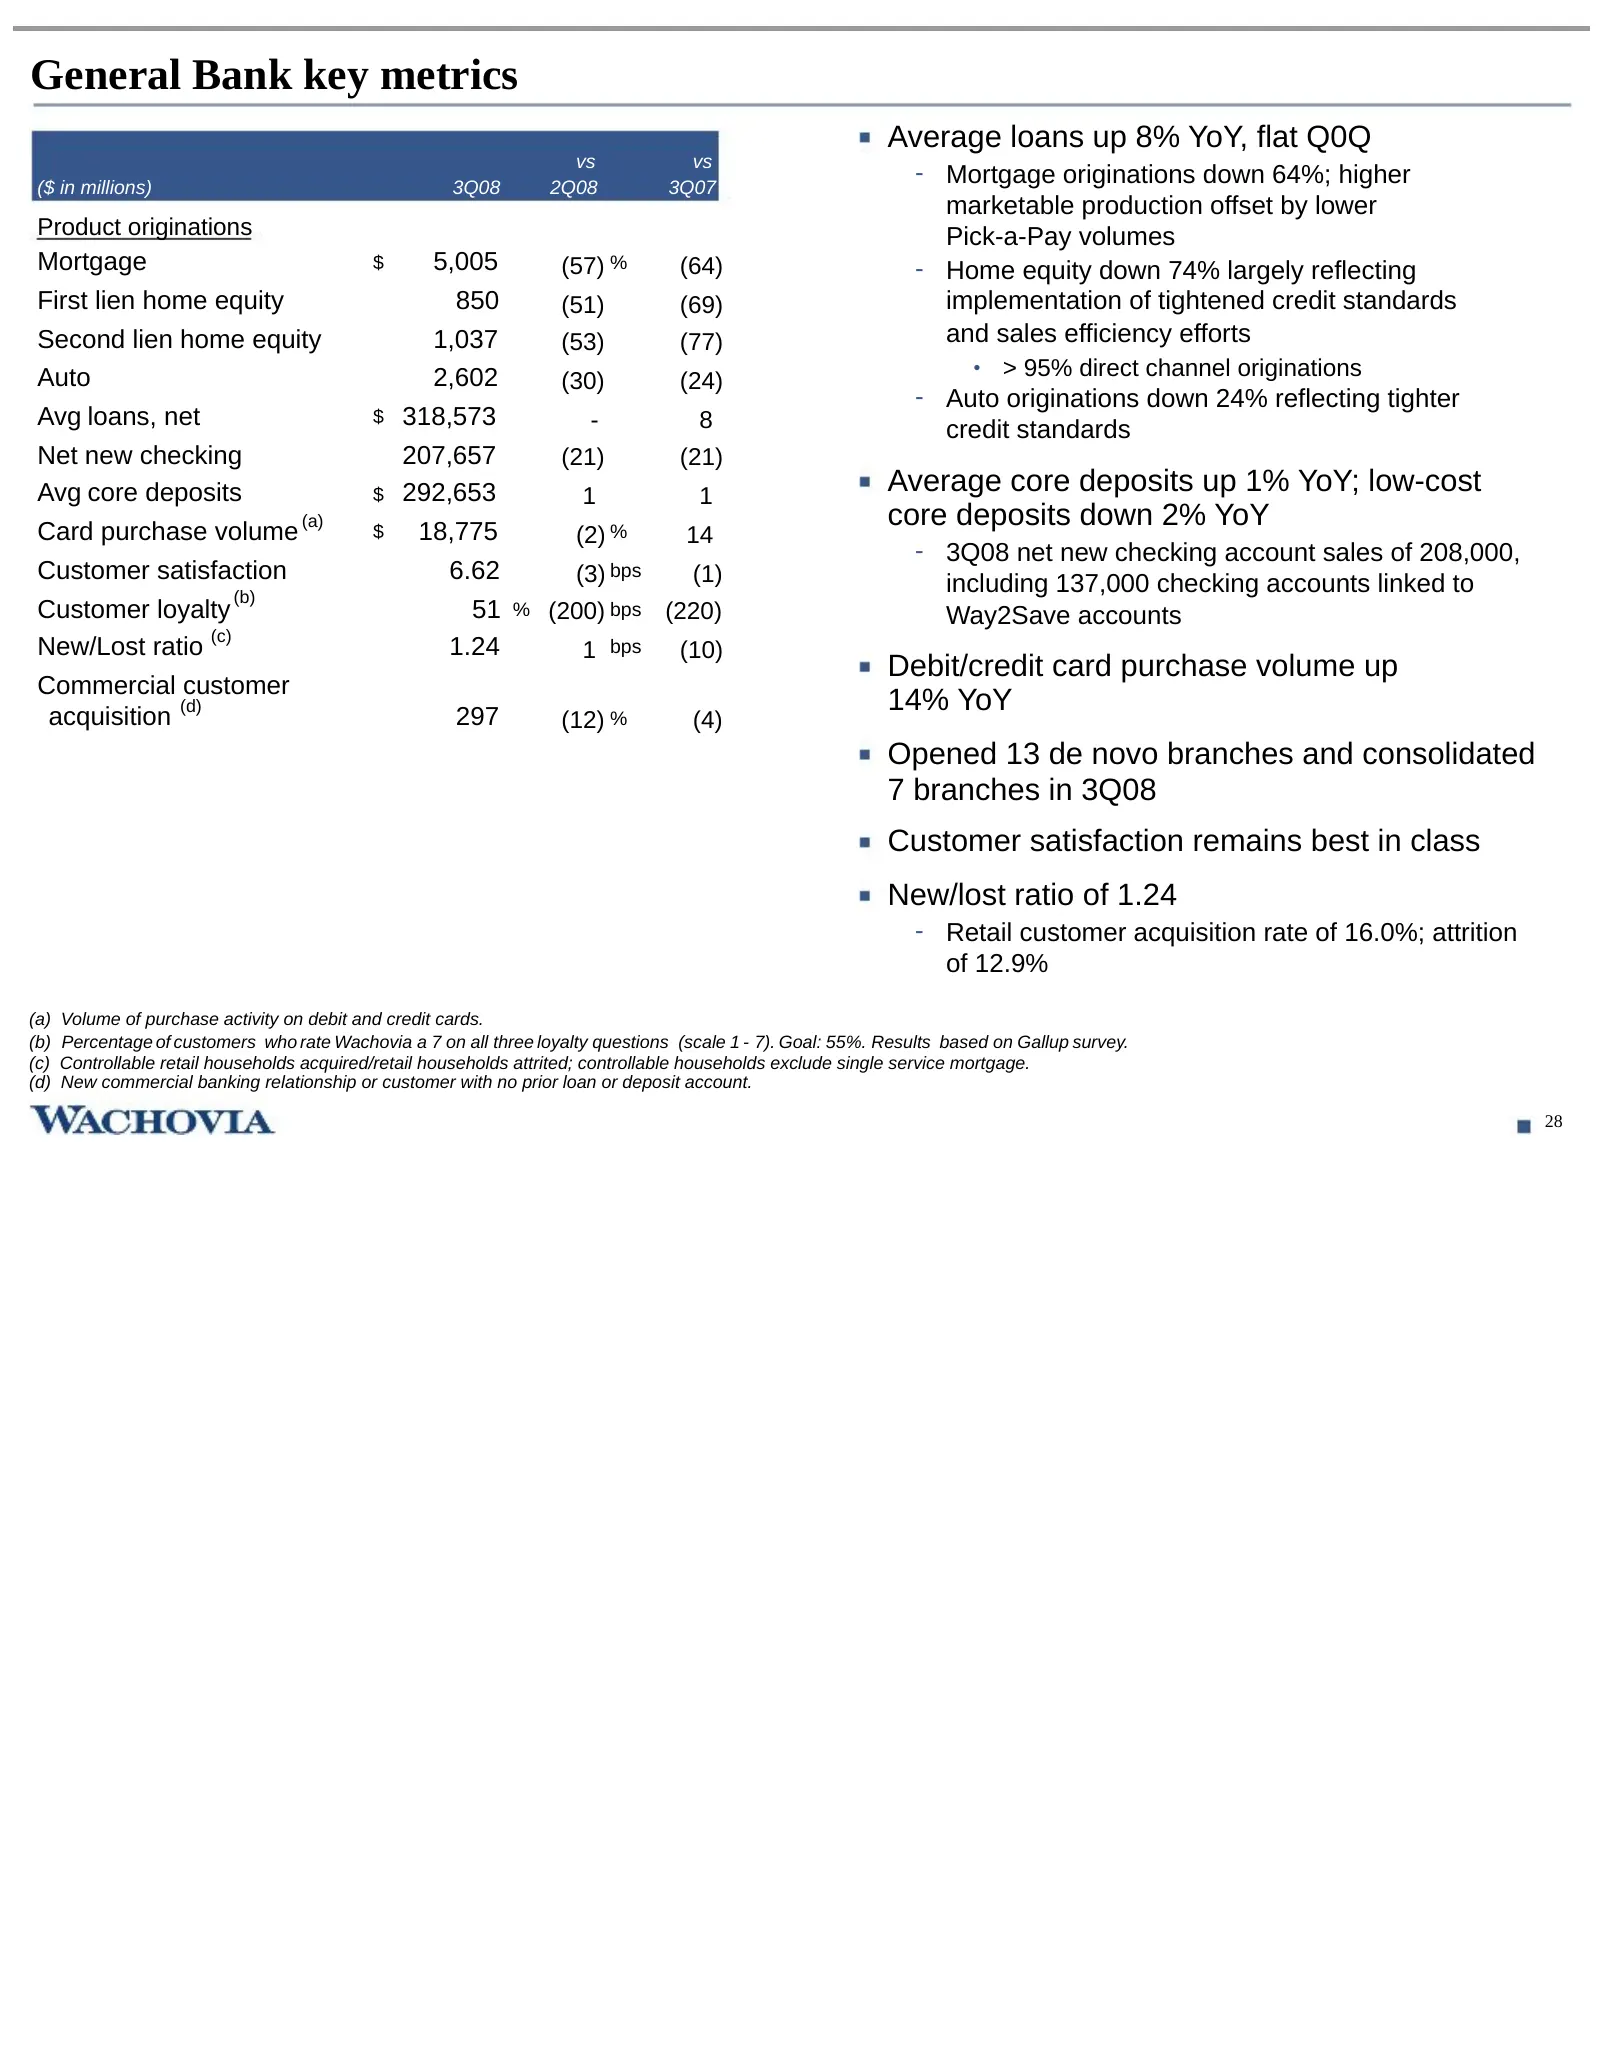
General Bank key metrics Average loans up 8% YoY, flat Q0Q vs vs ($ in millions) 3Q08 2Q08 3Q07 - Mortgage originations down 64%; higher marketable production offset by lower Product originations Pick-a-Pay volumes Mortgage $ 5,005 (57) % (64) - Home equity down 74% largely reflecting First lien hom
Slide 30: Capital Management key metrics
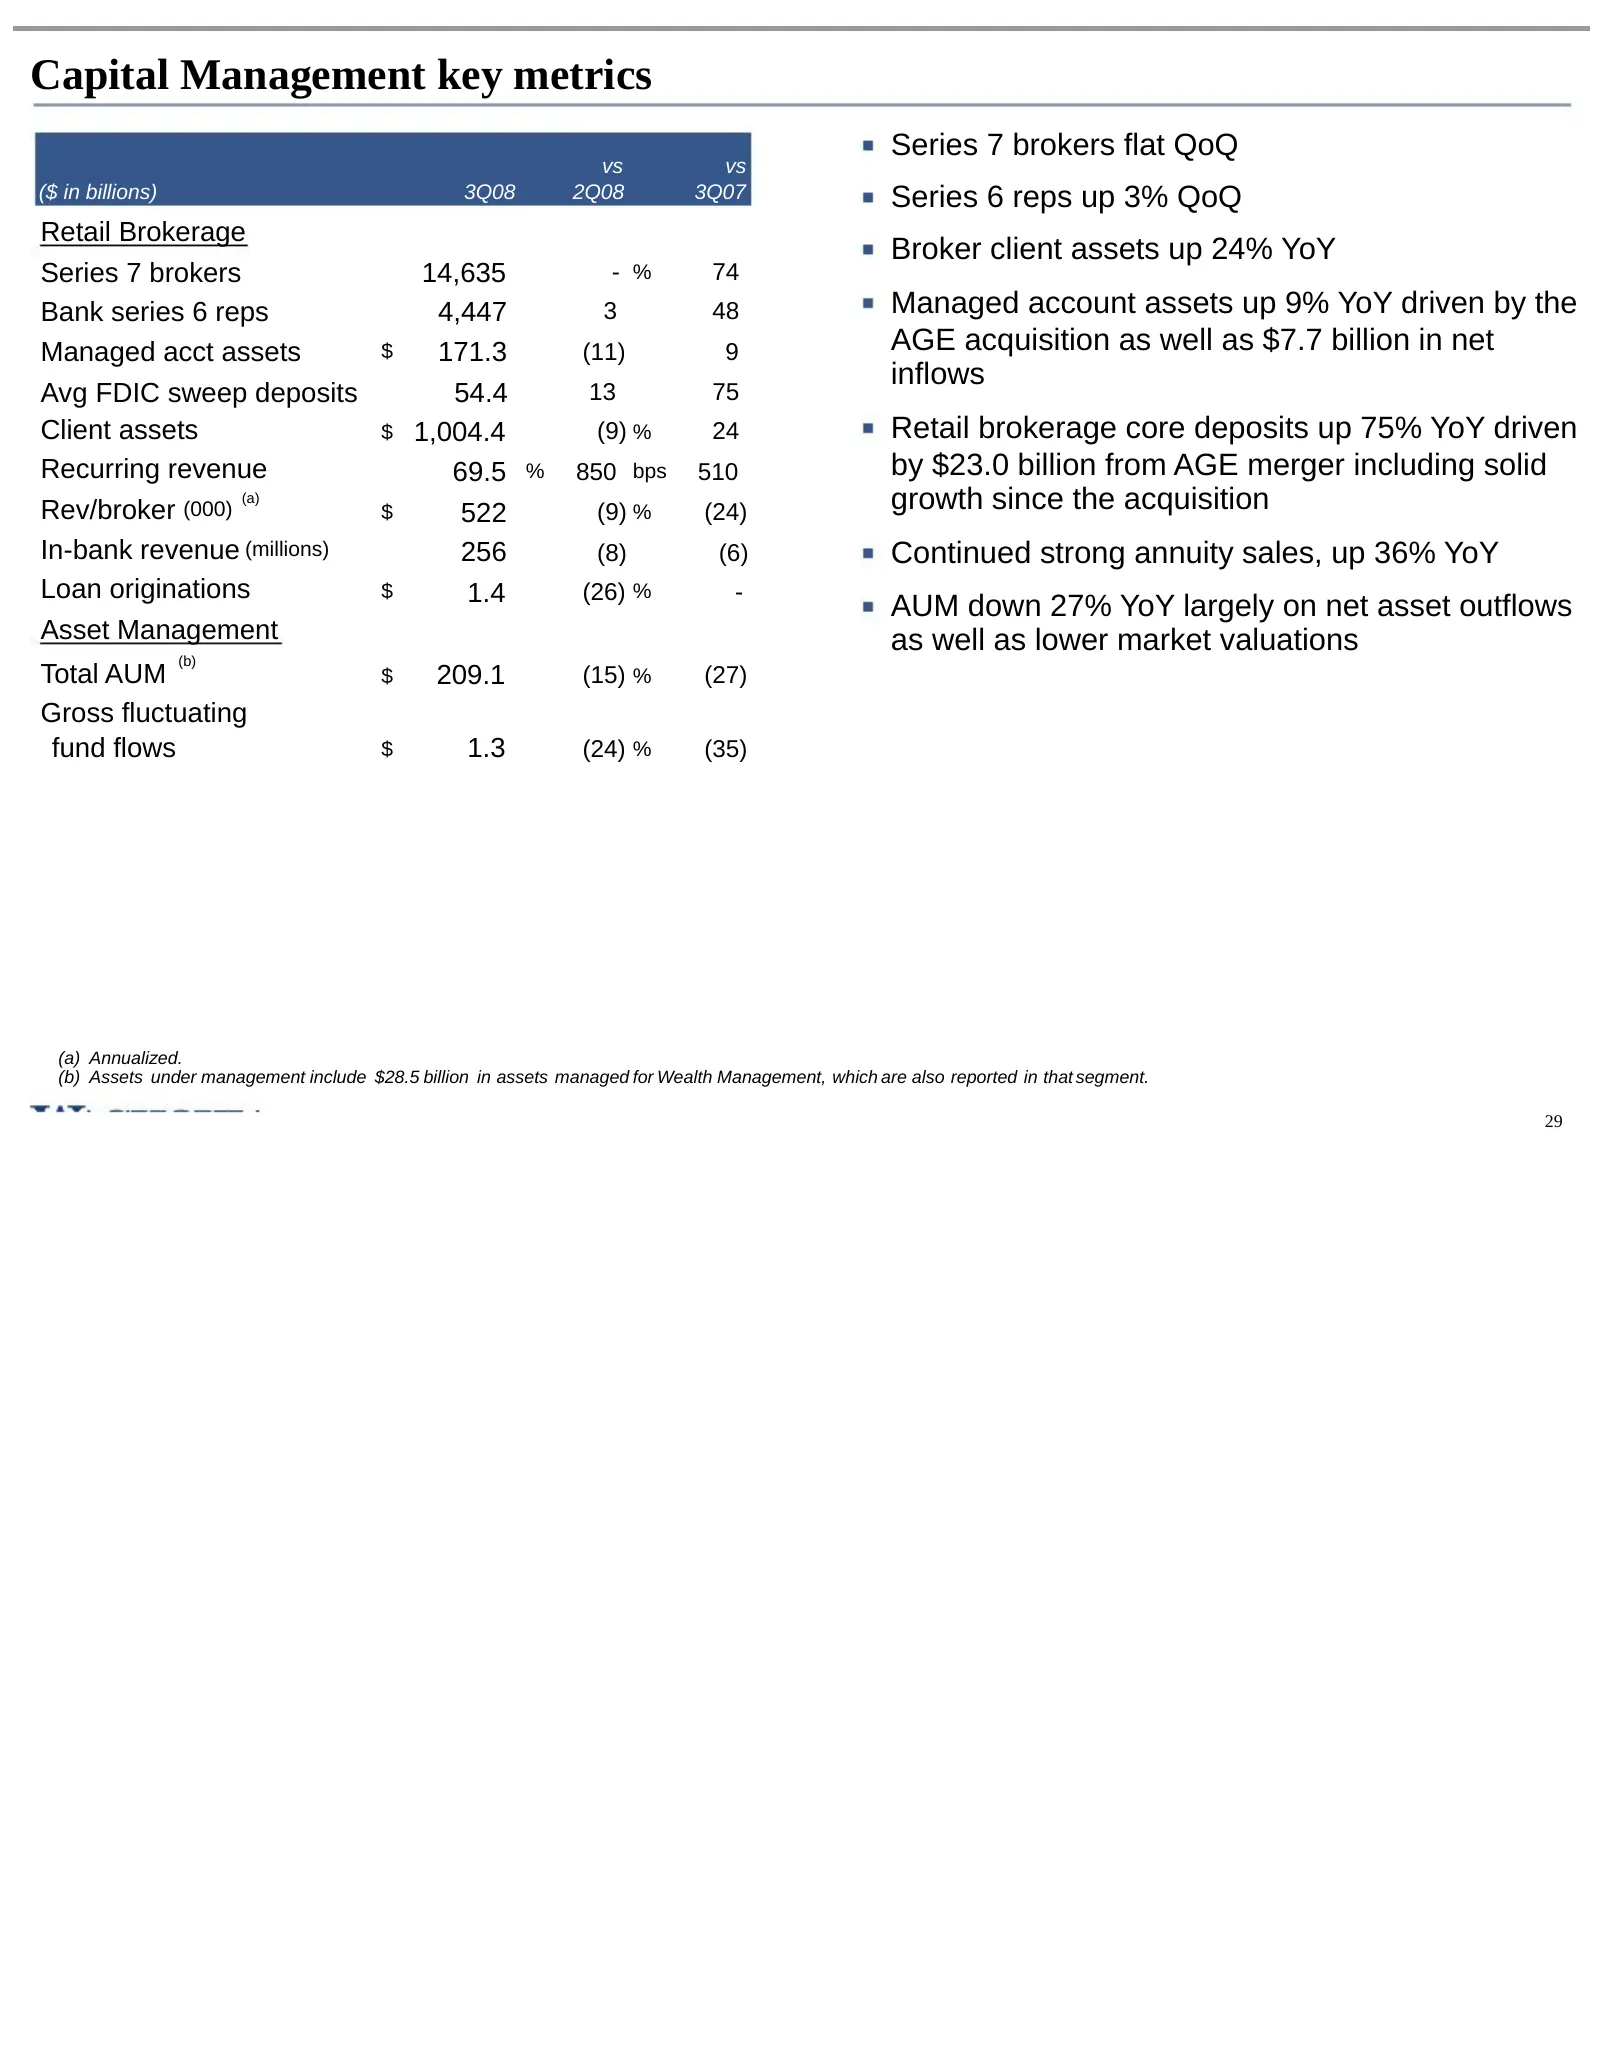
Capital Management key metrics Series 7 brokers flat QoQ vs vs ($ in billions) 3Q08 2Q08 3Q07 Series 6 reps up 3% QoQ Retail Brokerage Broker client assets up 24% YoY Series 7 brokers 14,635 - % 74 Bank series 6 reps 4,447 3 48 Managed account assets up 9% YoY driven by the Managed acct assets $ 171
Slide 31: Consumer real estate portfolio
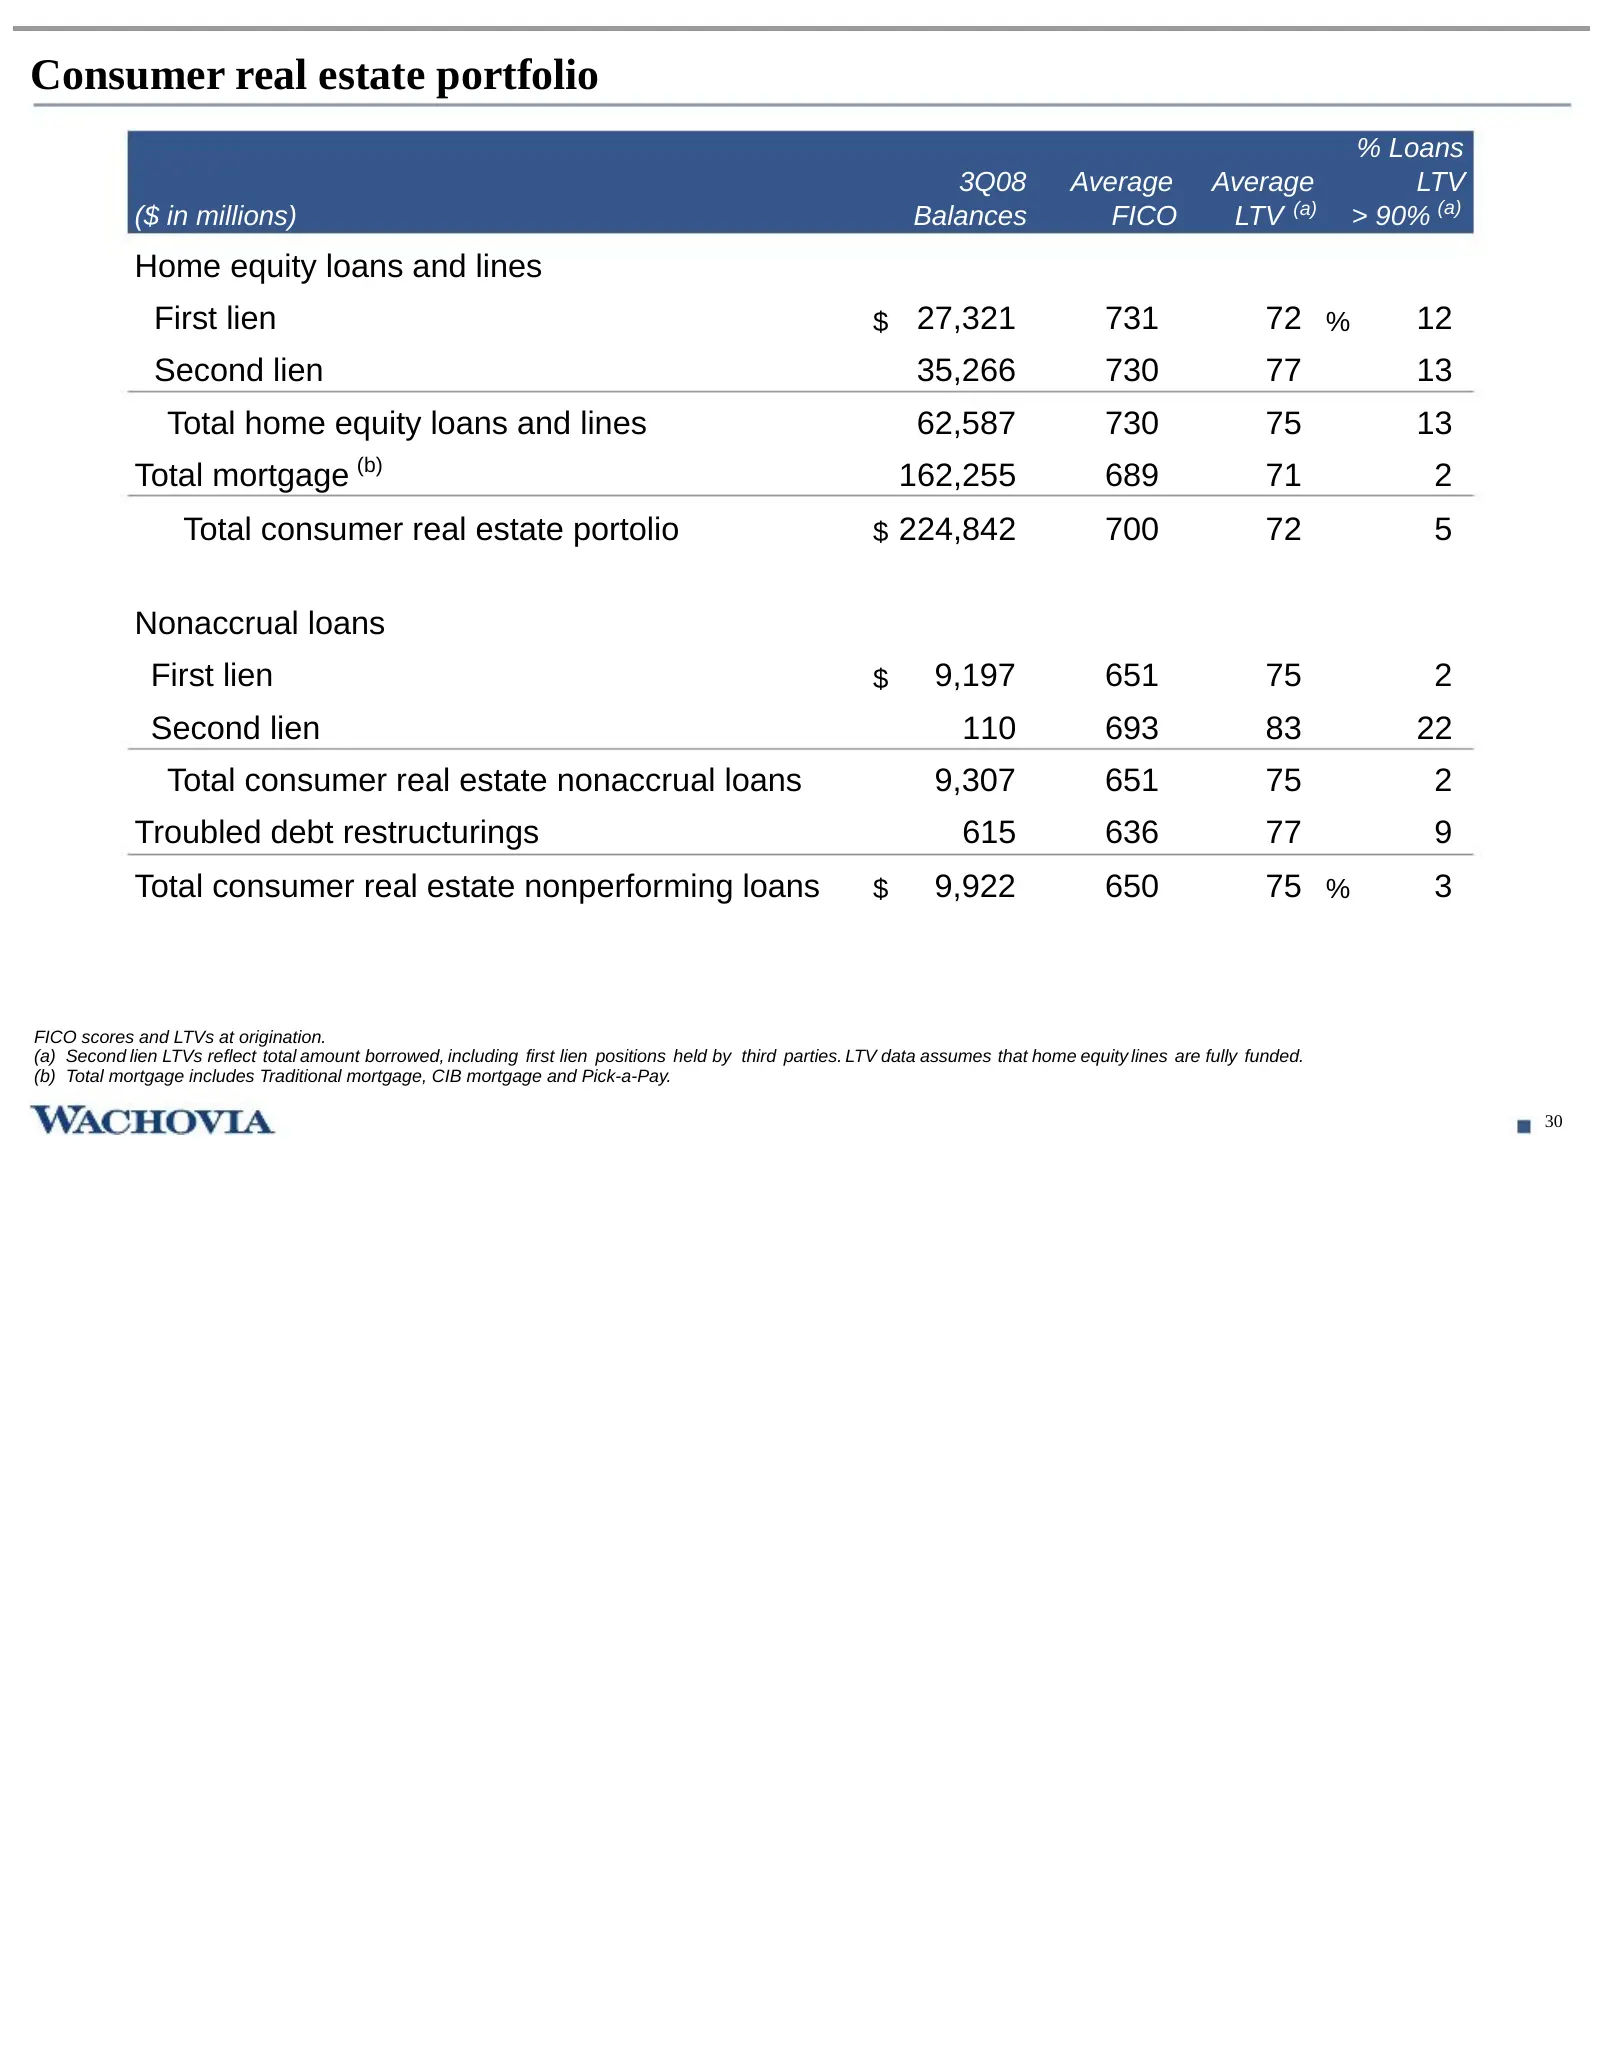
Consumer real estate portfolio % Loans 3Q08 - Average Average LTV ($ in millions) Balances FICO LTV (a) > 90% (a) Home equity loans and lines First lien $ 27,321 731 72 % 12 Second lien 35,266 730 77 13 Total home equity loans and lines 62,587 730 75 13 Total mortgage (b) 162,255 689 71 2 Total cons
Slide 32: Consumer real estate
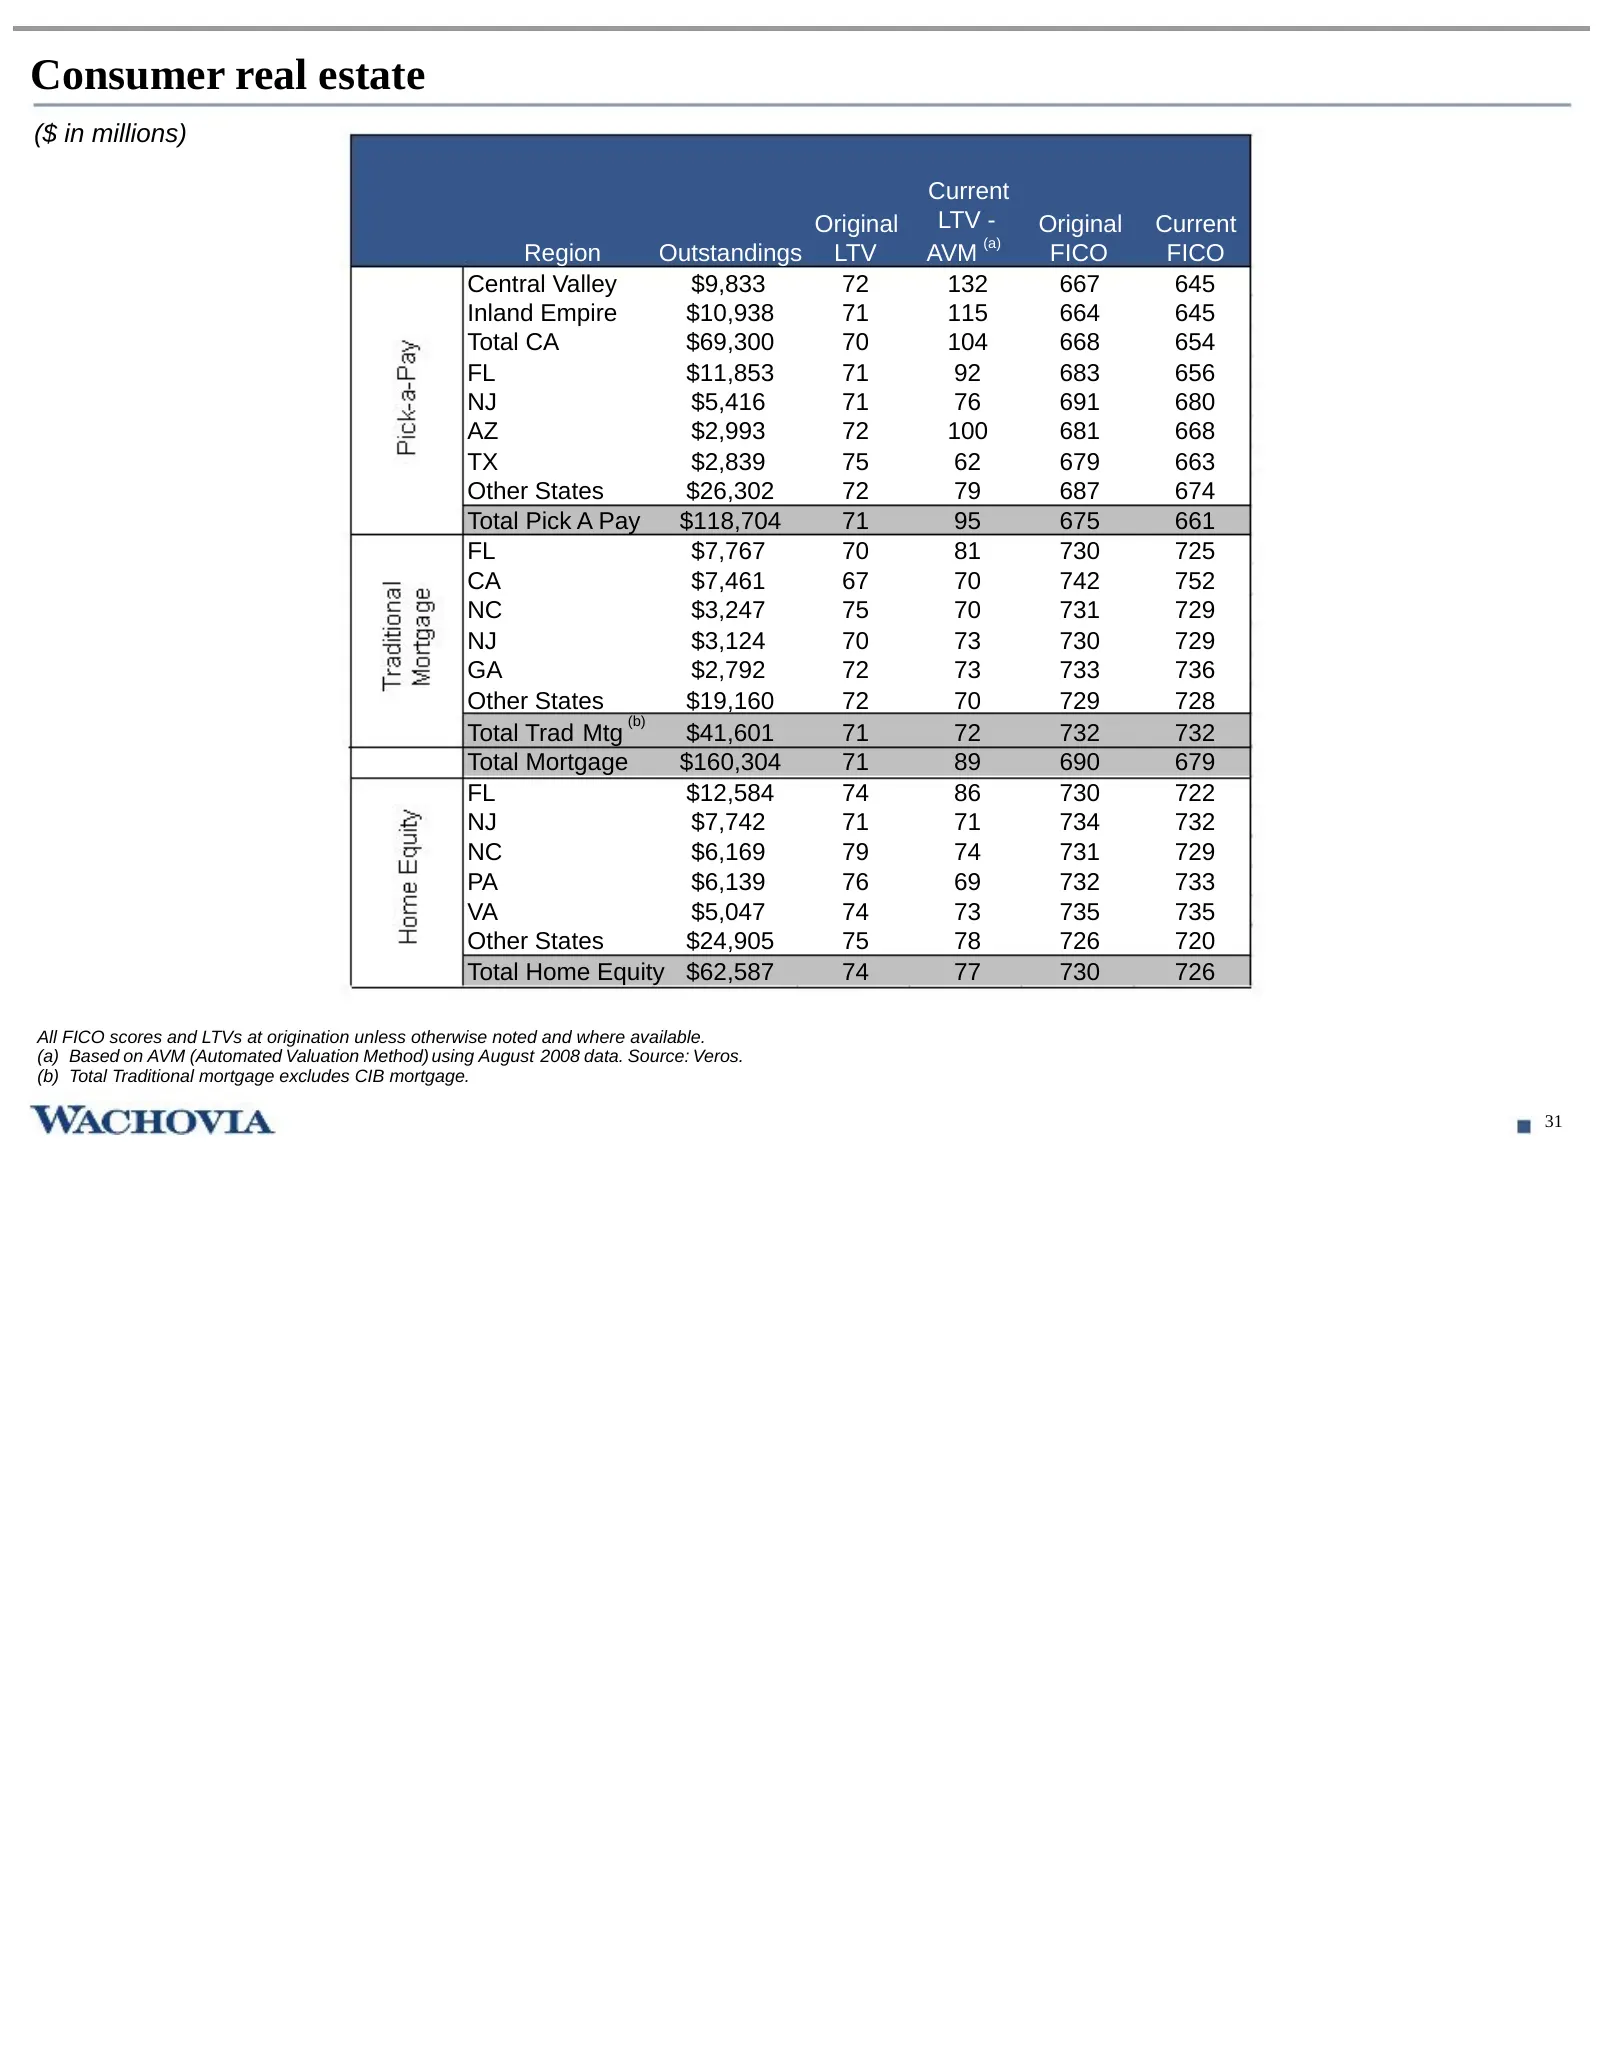
Consumer real estate ($ in millions) Current Original LTV - Original Current (a) Region Outstandings LTV AVM FICO FICO Central Valley $9,833 72 132 667 645 Inland Empire $10,938 71 115 664 645 Total CA $69,300 70 104 668 654 FL $11,853 71 92 683 656 NJ $5,416 71 76 691 680 AZ $2,993 72 100 681 668 T
Slide 33: Pick-a-Pay mortgage portfolio performance
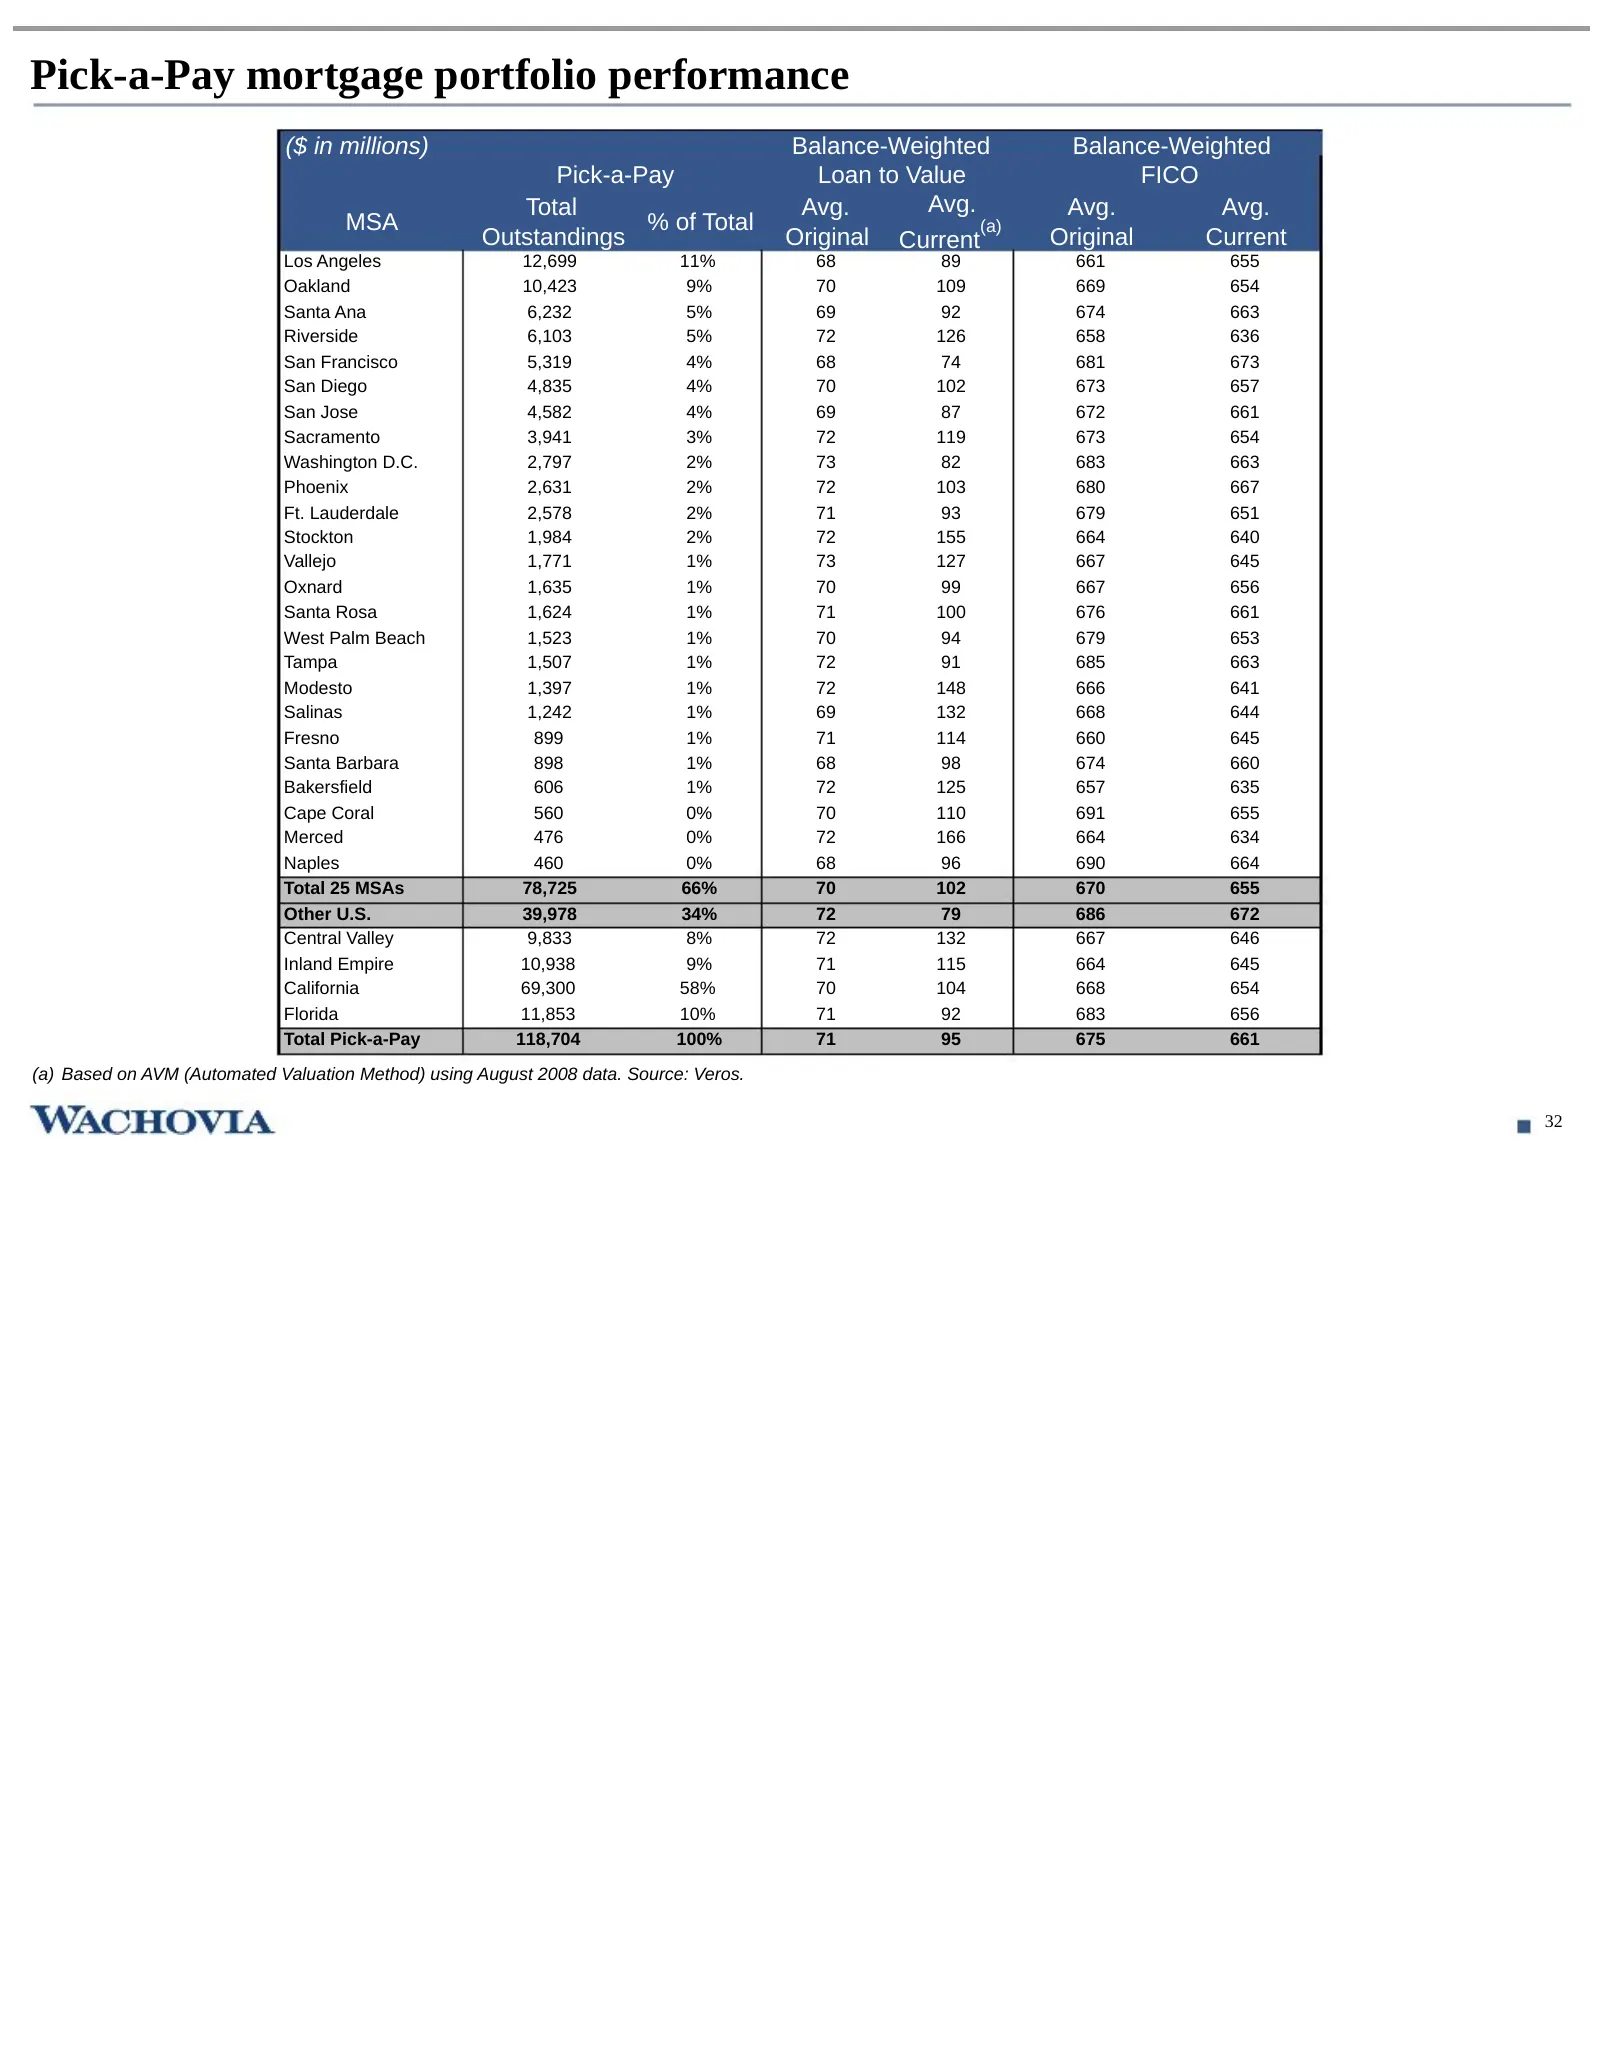
Pick-a-Pay mortgage portfolio performance ($ in millions) Balance-Weighted Balance-Weighted Pick-a-Pay Loan to Value FICO Total Avg. Avg. Avg. Avg. MSA % of Total (a) Outstandings Original Current Original Current Los Angeles 12,699 11% 68 89 661 655 Oakland 10,423 9% 70 109 669 654 Santa Ana 6,232
Slide 34: Wachovia Mortgage
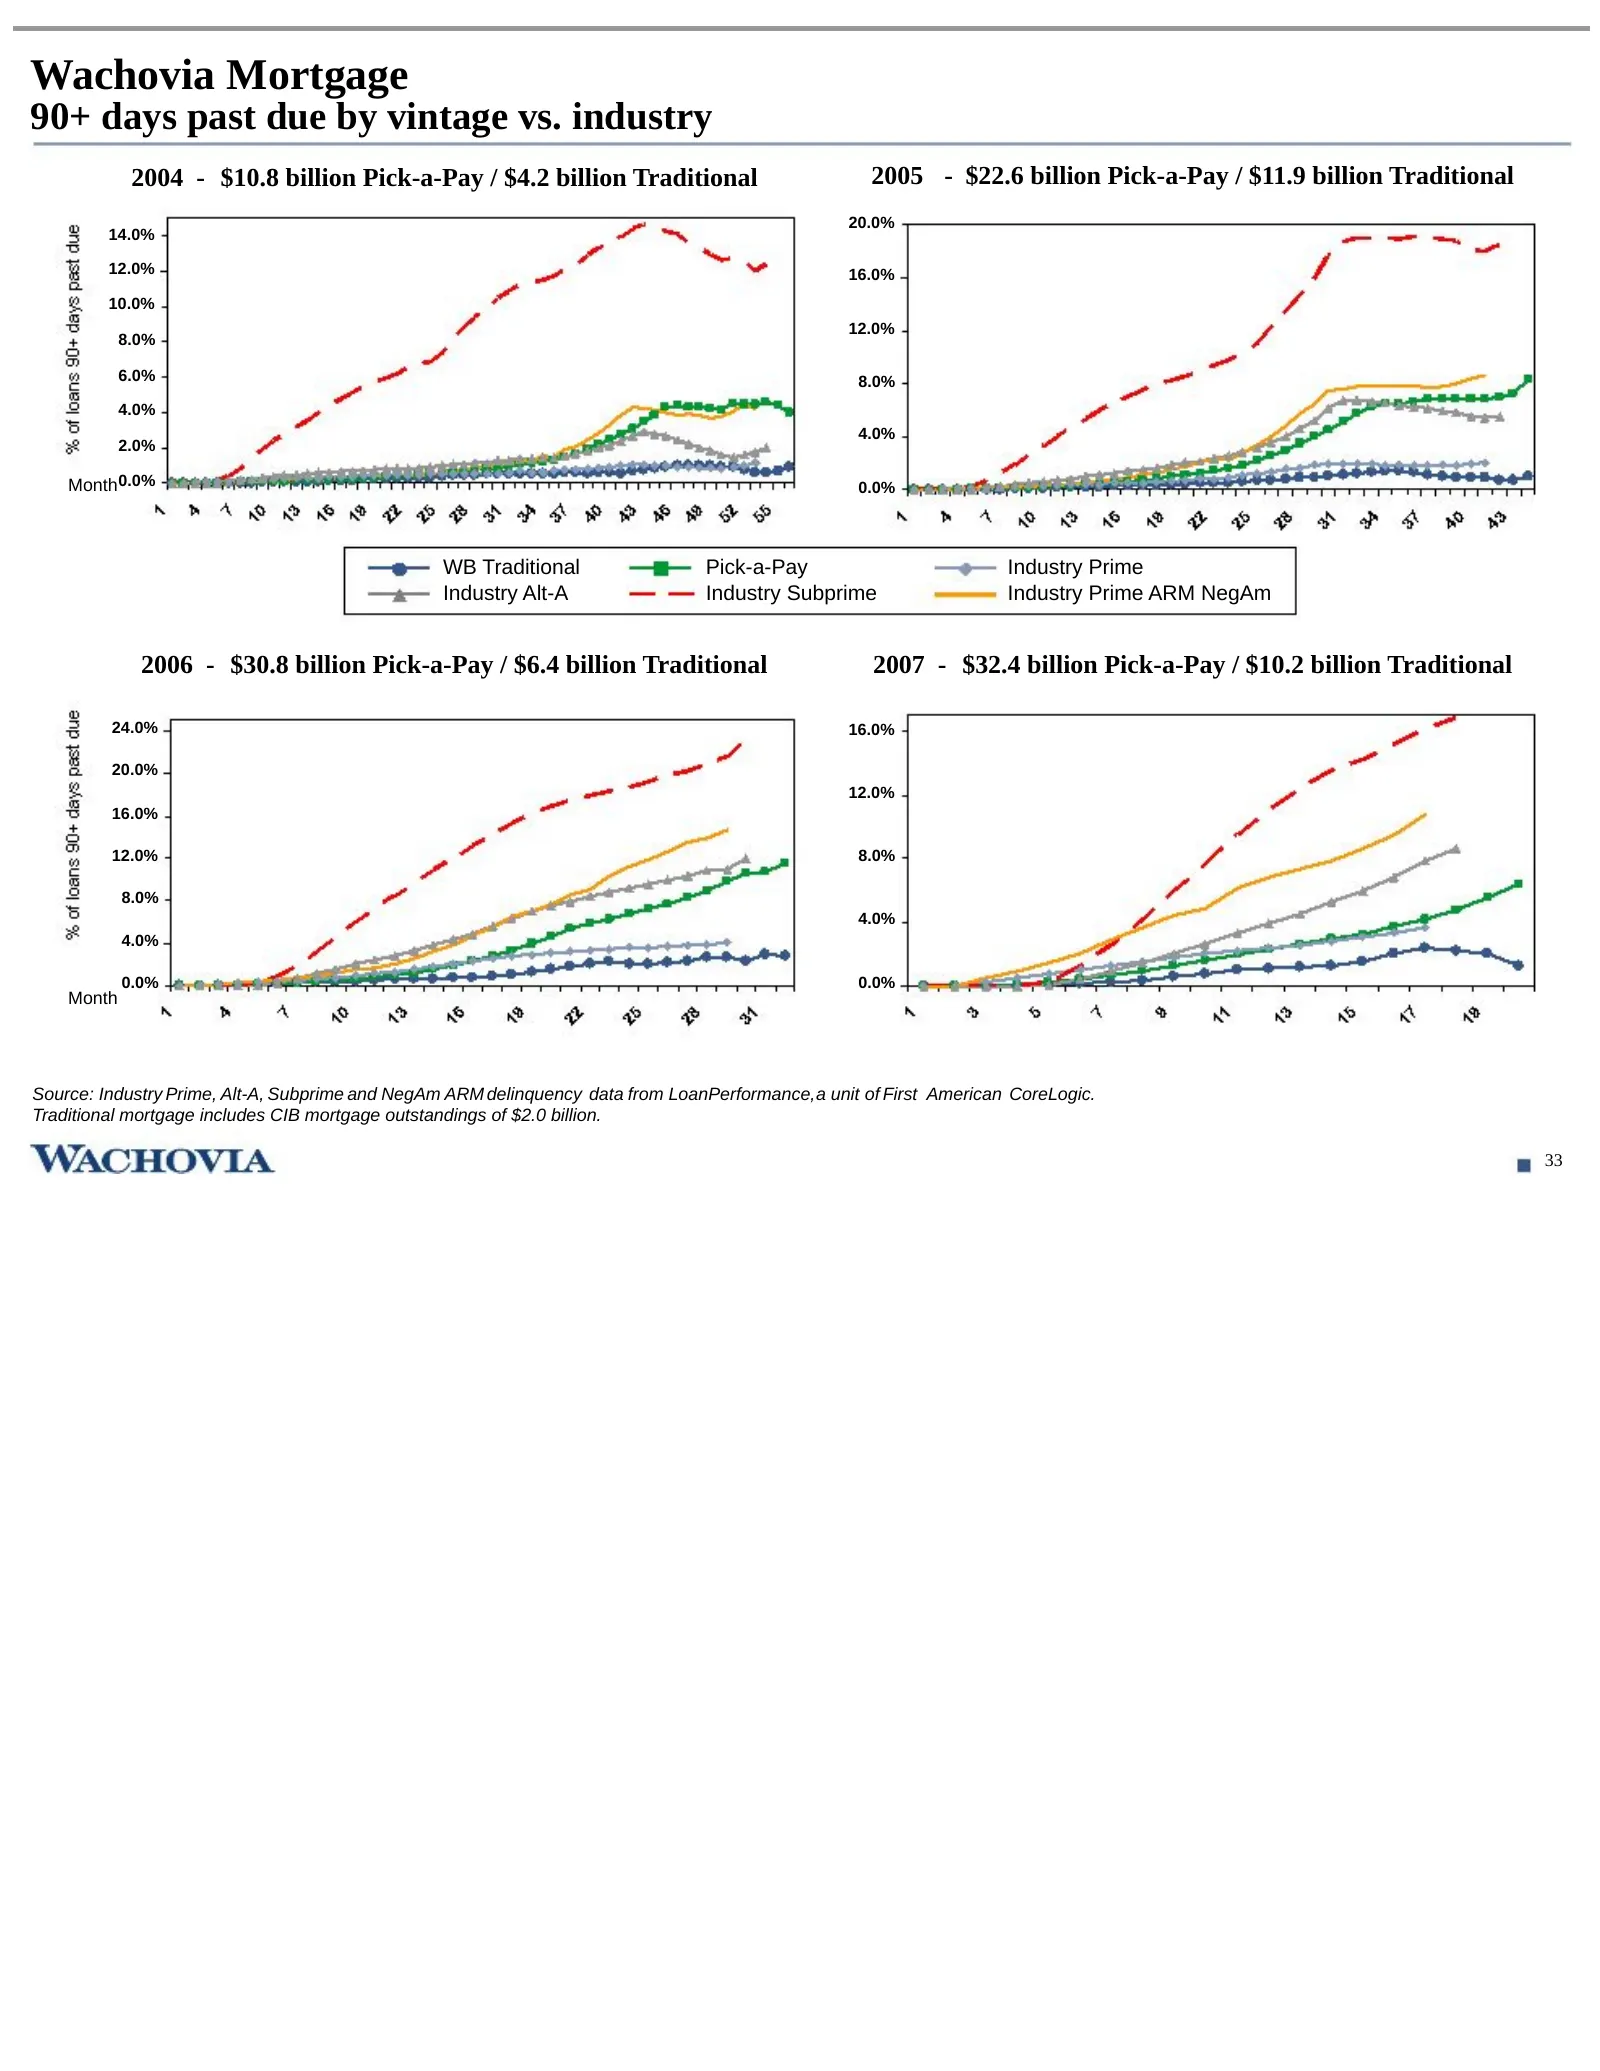
Wachovia Mortgage 90+ days past due by vintage vs. industry 2004 - $10.8 billion Pick-a-Pay / $4.2 billion Traditional 2005 - $22.6 billion Pick-a-Pay / $11.9 billion Traditional 20.0% 14.0% 12.0% 16.0% 10.0% 12.0% 8.0% 6.0% 8.0% 4.0% 4.0% 2.0% Month 0.0% 0.0% WB Traditional Pick-a-Pay Industry Prim
Slide 35: Real Estate Financial Services
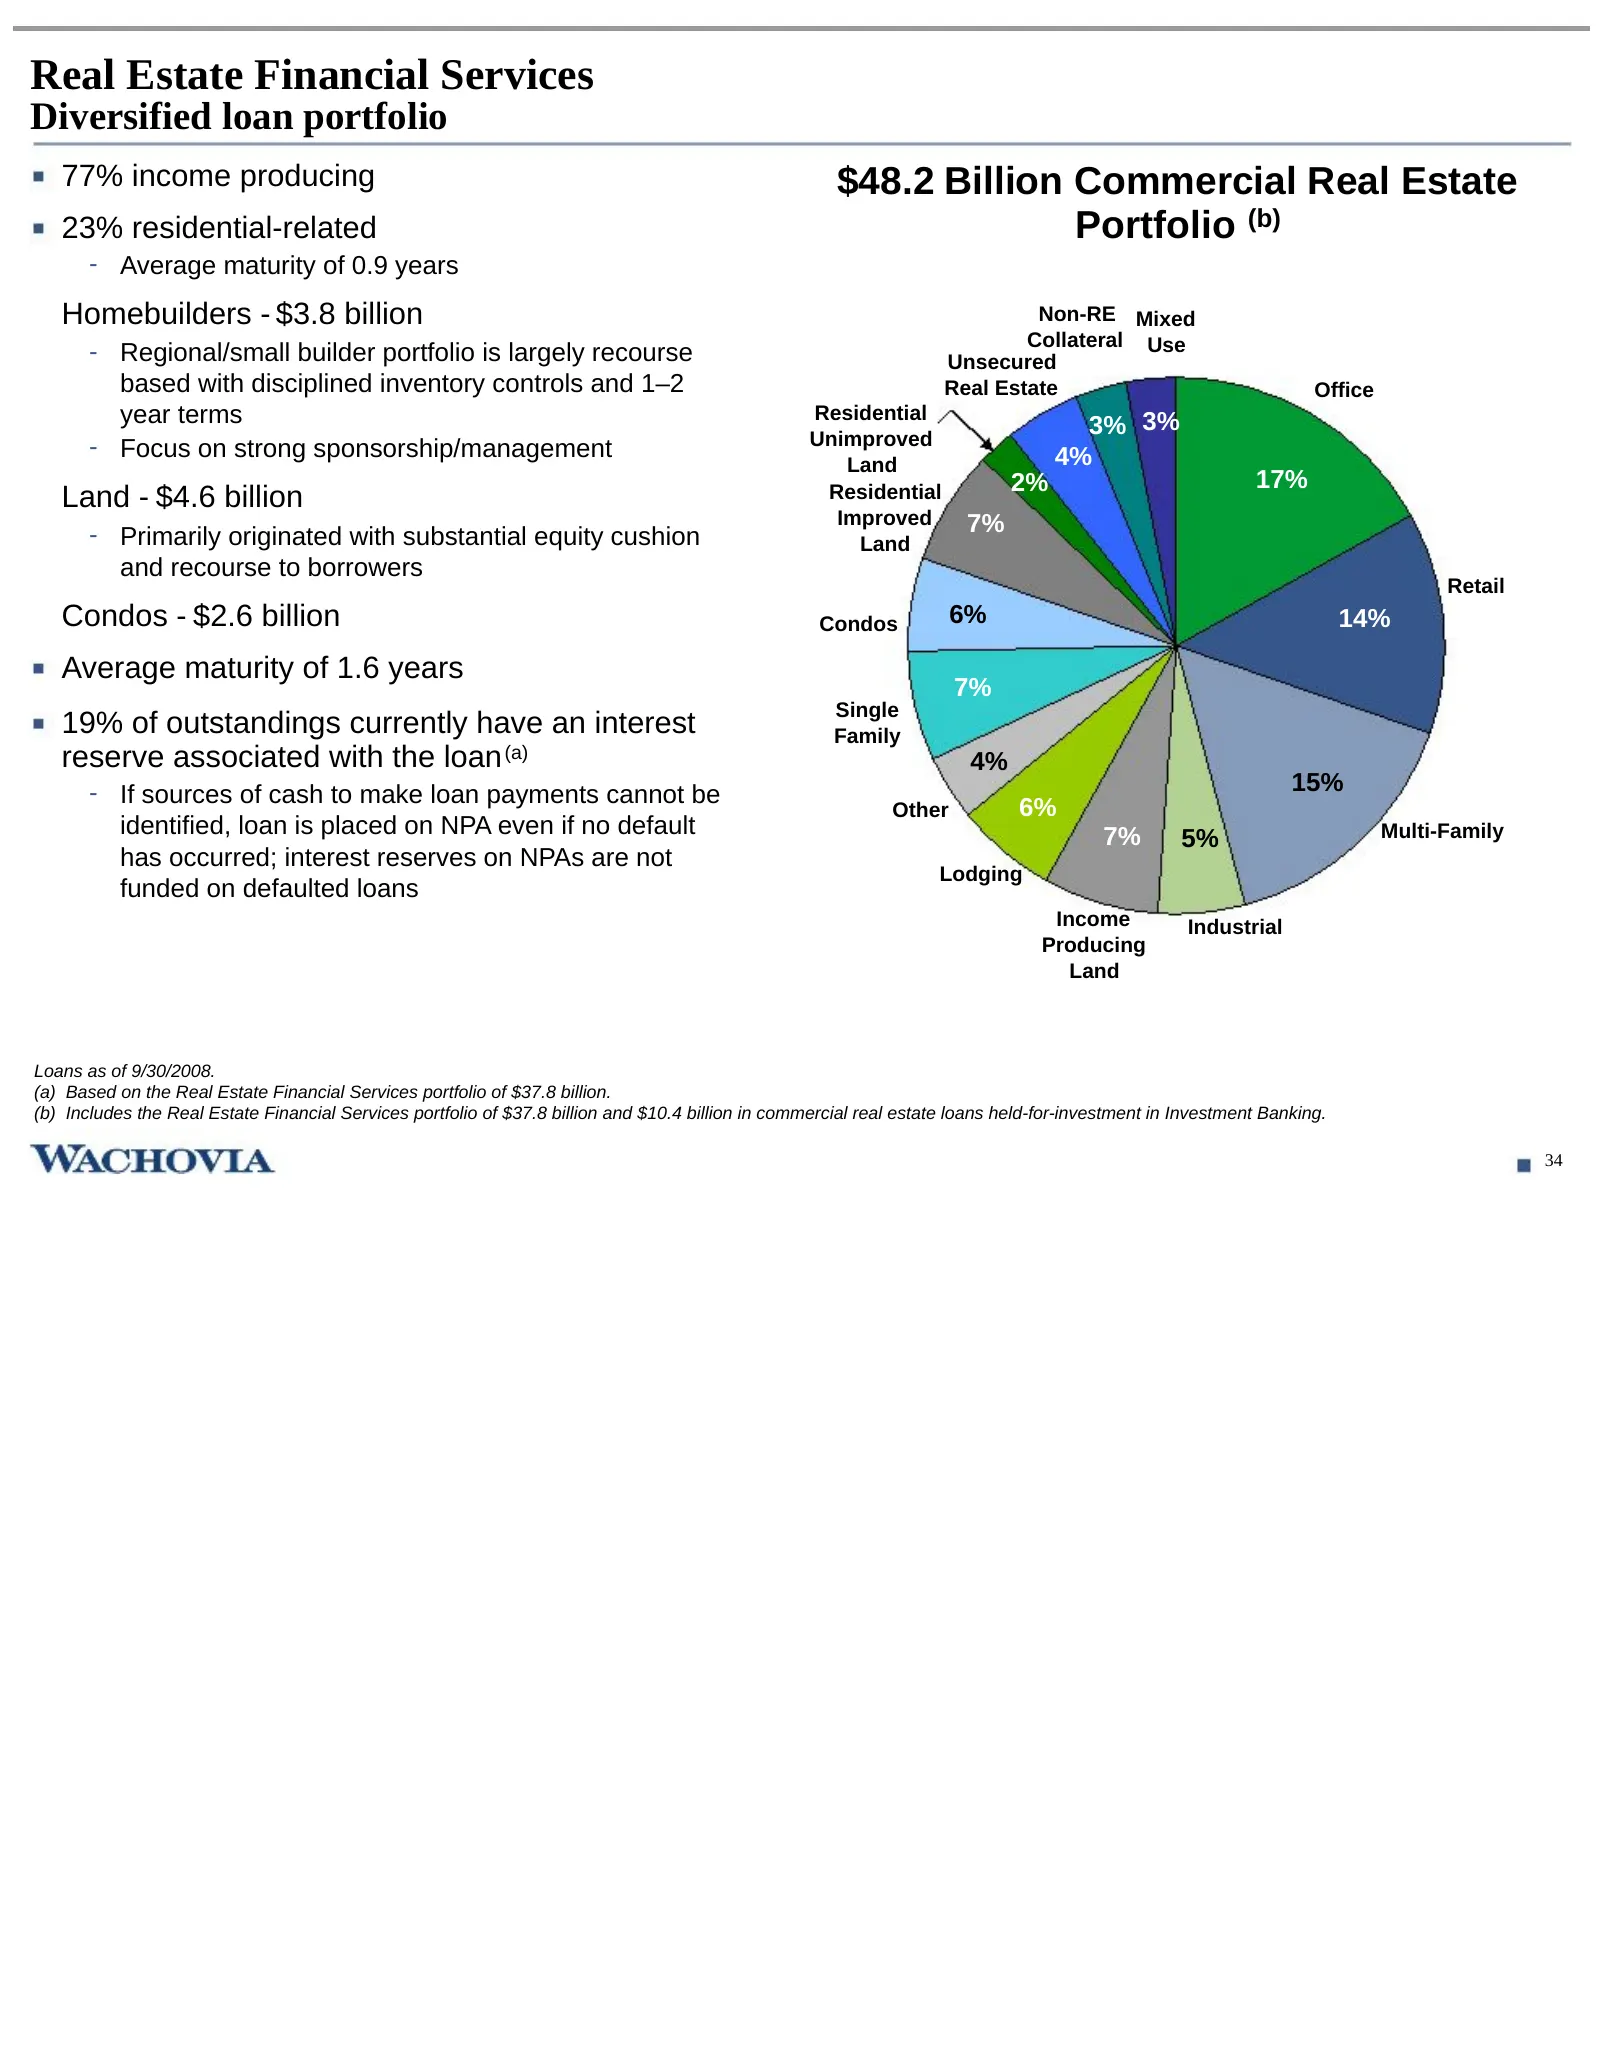
Real Estate Financial Services Diversified loan portfolio 77% income producing $48.2 Billion Commercial Real Estate 23% residential-related Portfolio (b) - Average maturity of 0.9 years Homebuilders - $3.8 billion Non-RE Mixed Collateral Use - Regional/small builder portfolio is largely recourse Uns
Slide 36: Real Estate Financial Services
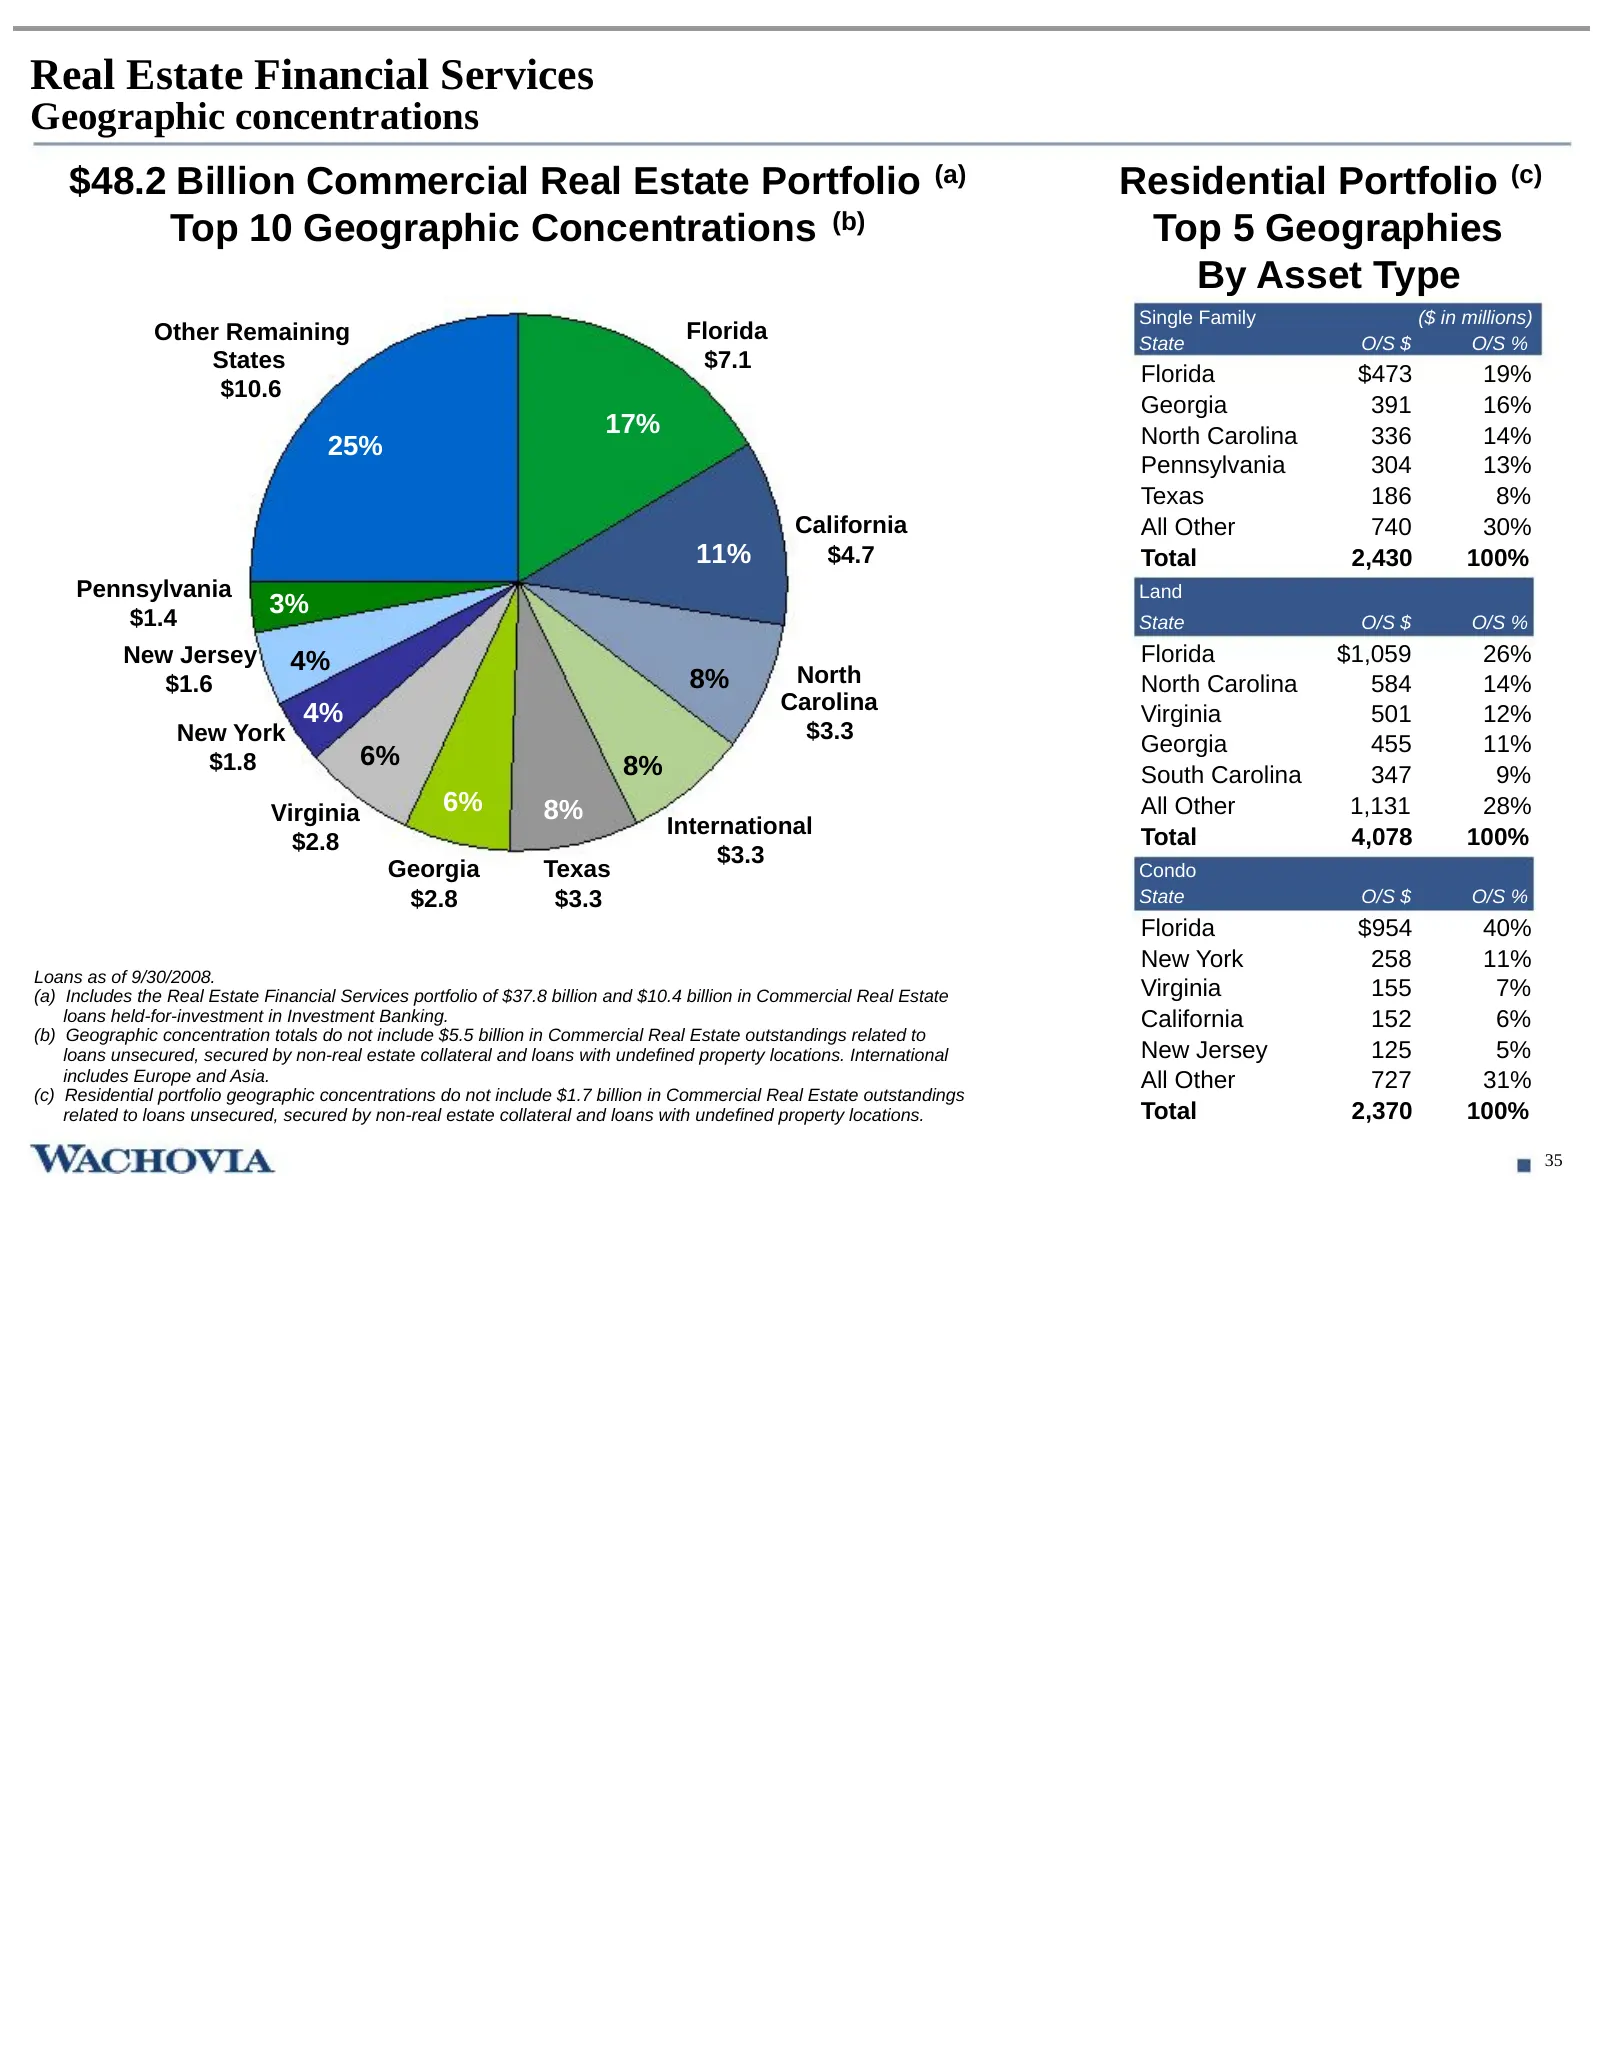
Real Estate Financial Services Geographic concentrations $48.2 Billion Commercial Real Estate Portfolio (a) Residential Portfolio (c) Top 10 Geographic Concentrations (b) Top 5 Geographies By Asset Type Single Family ($ in millions) Other Remaining Florida State O/S $ O/S % States $7.1 Florida $473
Slide 37: Goodwill impairment
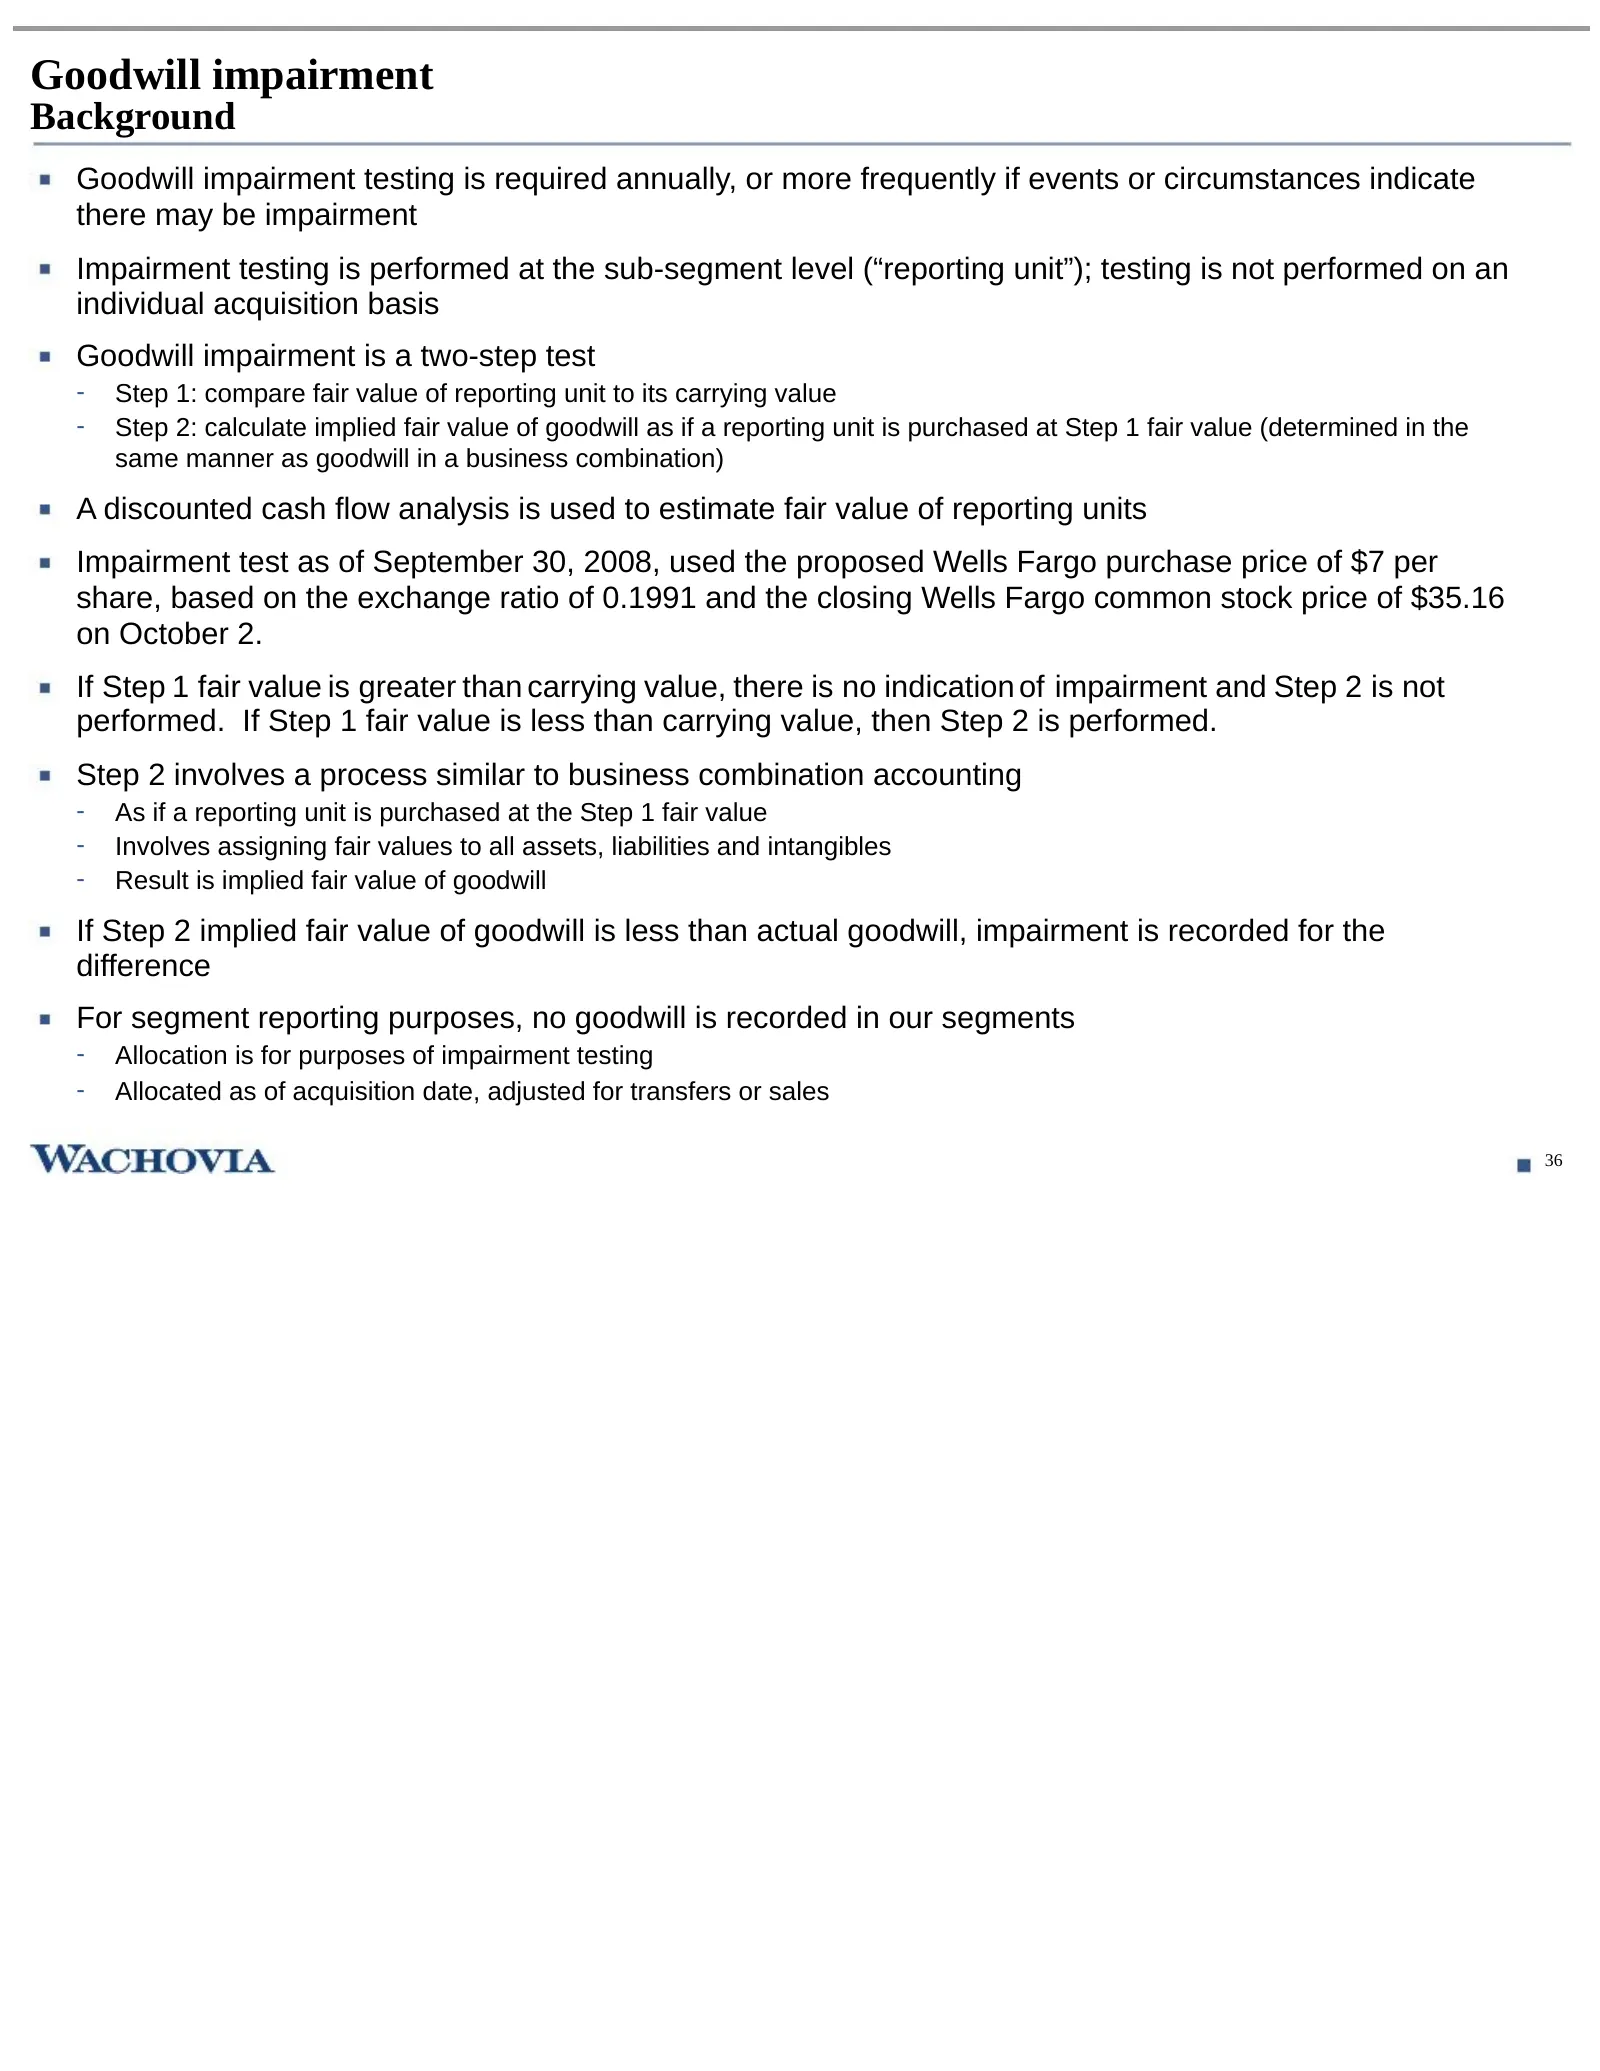
Goodwill impairment Background Goodwill impairment testing is required annually, or more frequently if events or circumstances indicate there may be impairment Impairment testing is performed at the sub-segment level (“reporting unit”); testing is not performed on an individual acquisition basis Goo
Slide 38: Goodwill impairment
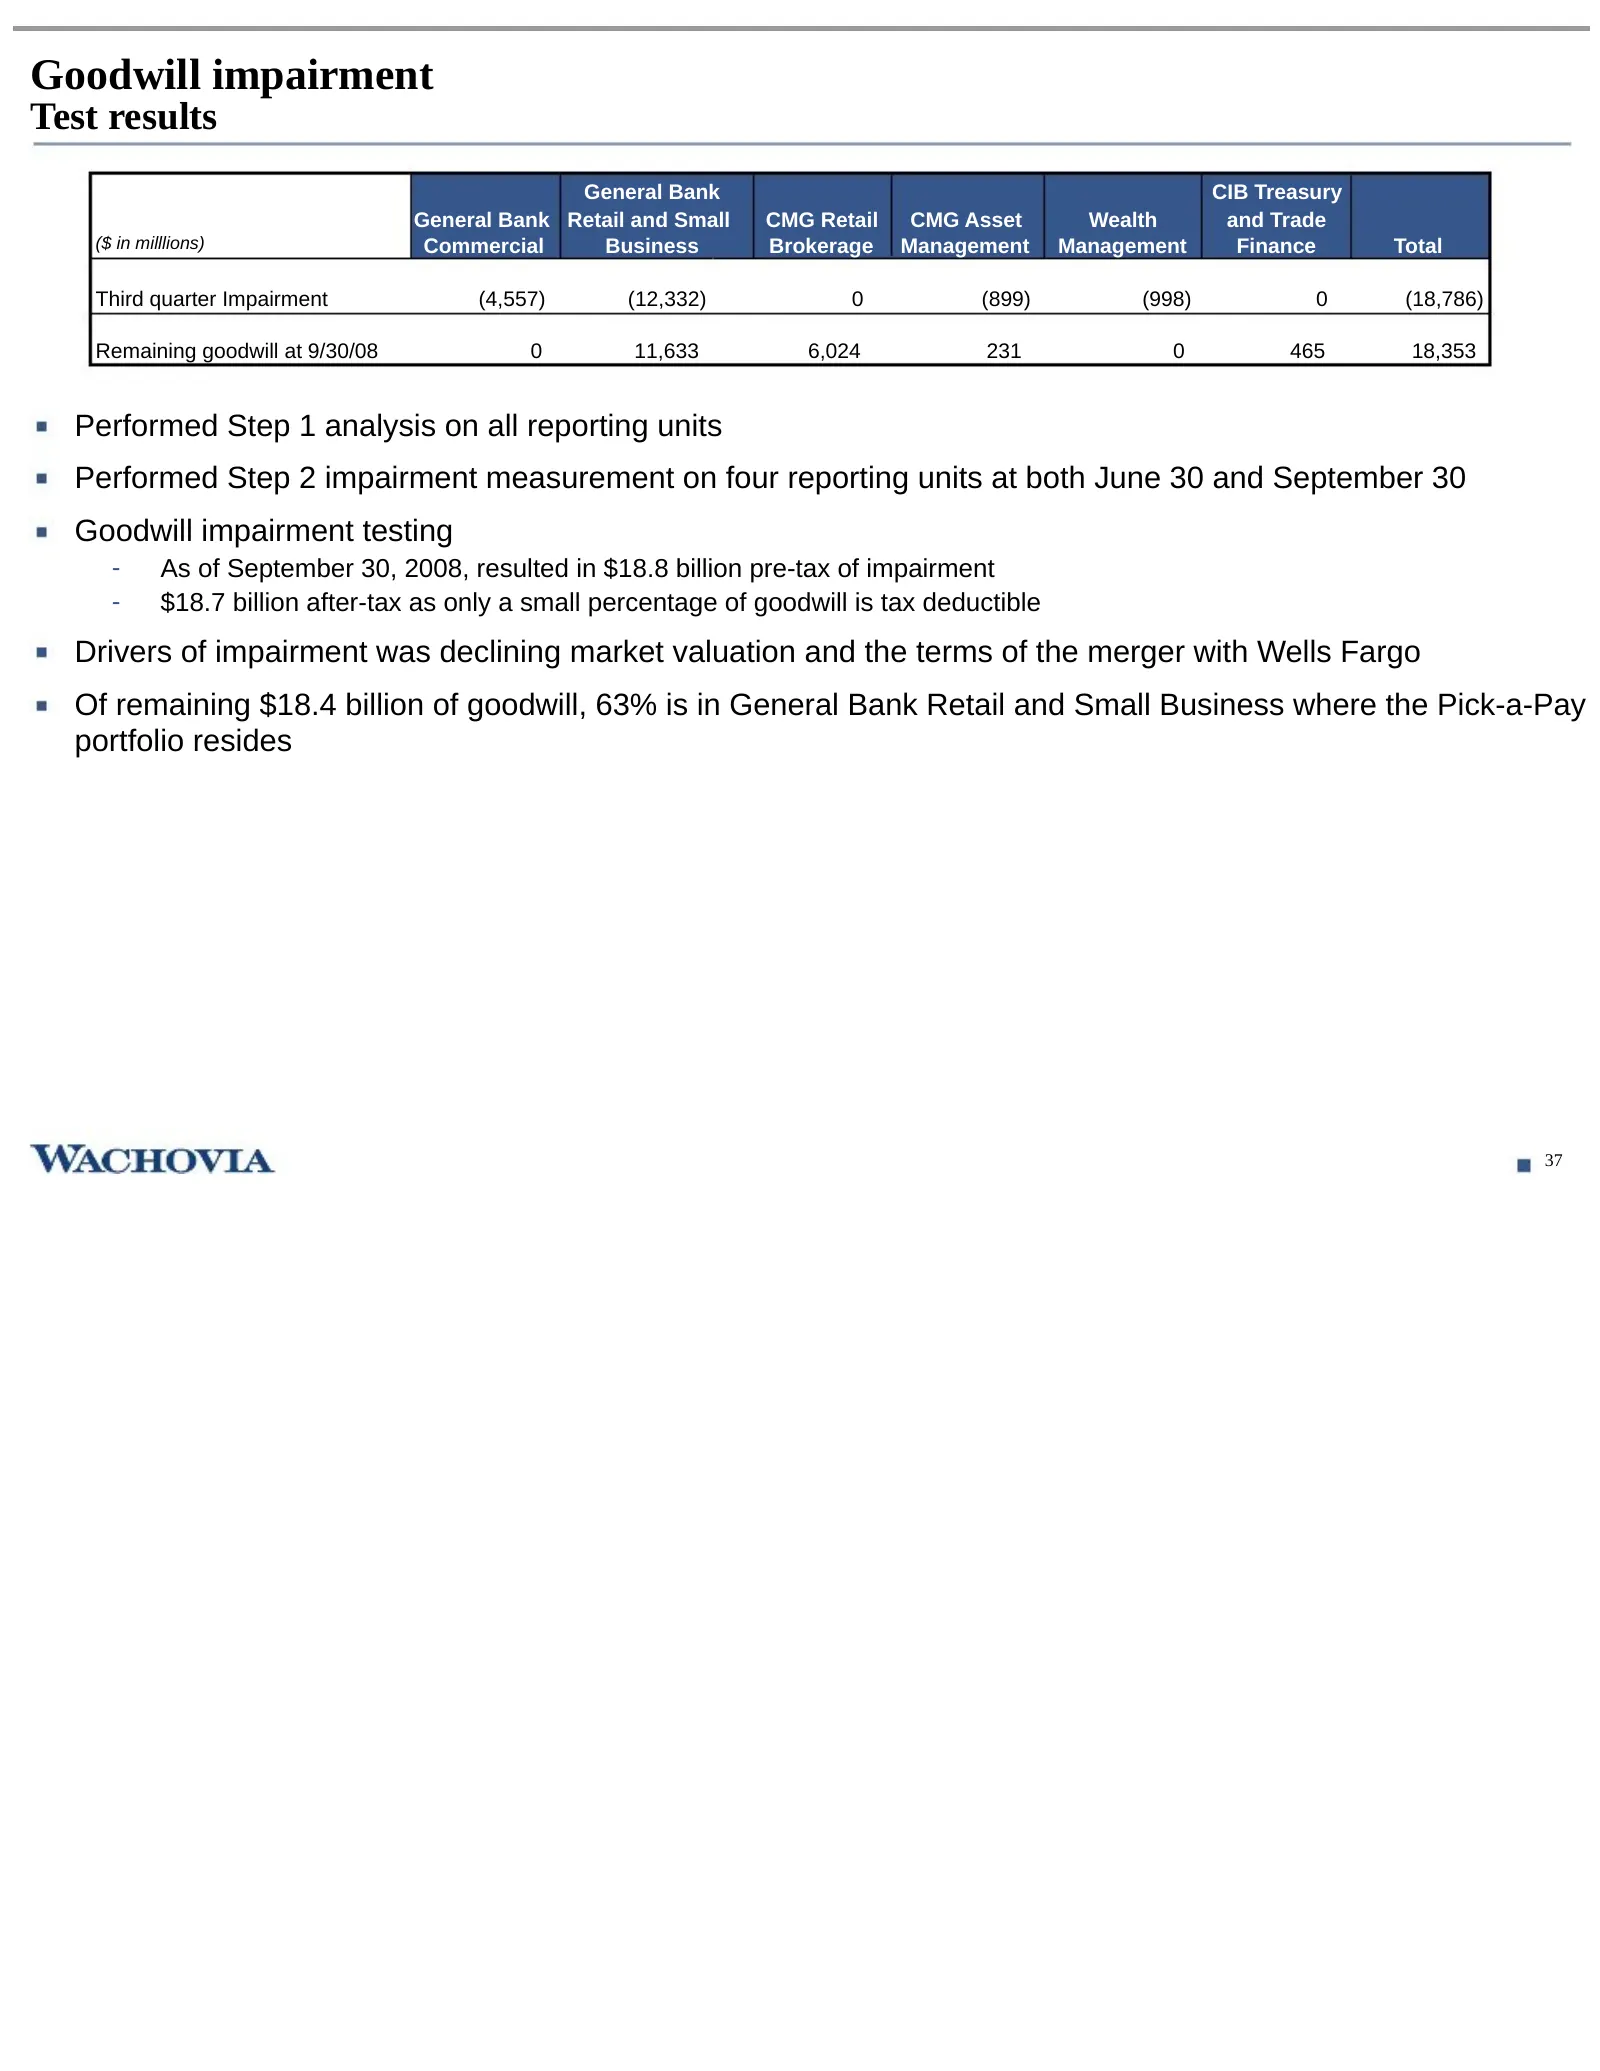
Goodwill impairment Test results General Bank CIB Treasury General Bank Retail and Small CMG Retail CMG Asset Wealth and Trade ($ in milllions) Commercial Business Brokerage Management Management Finance Total Third quarter Impairment (4,557) (12,332) 0 (899) (998) 0 (18,786) Remaining goodwill at 9
Slide 39: Cautionary statement
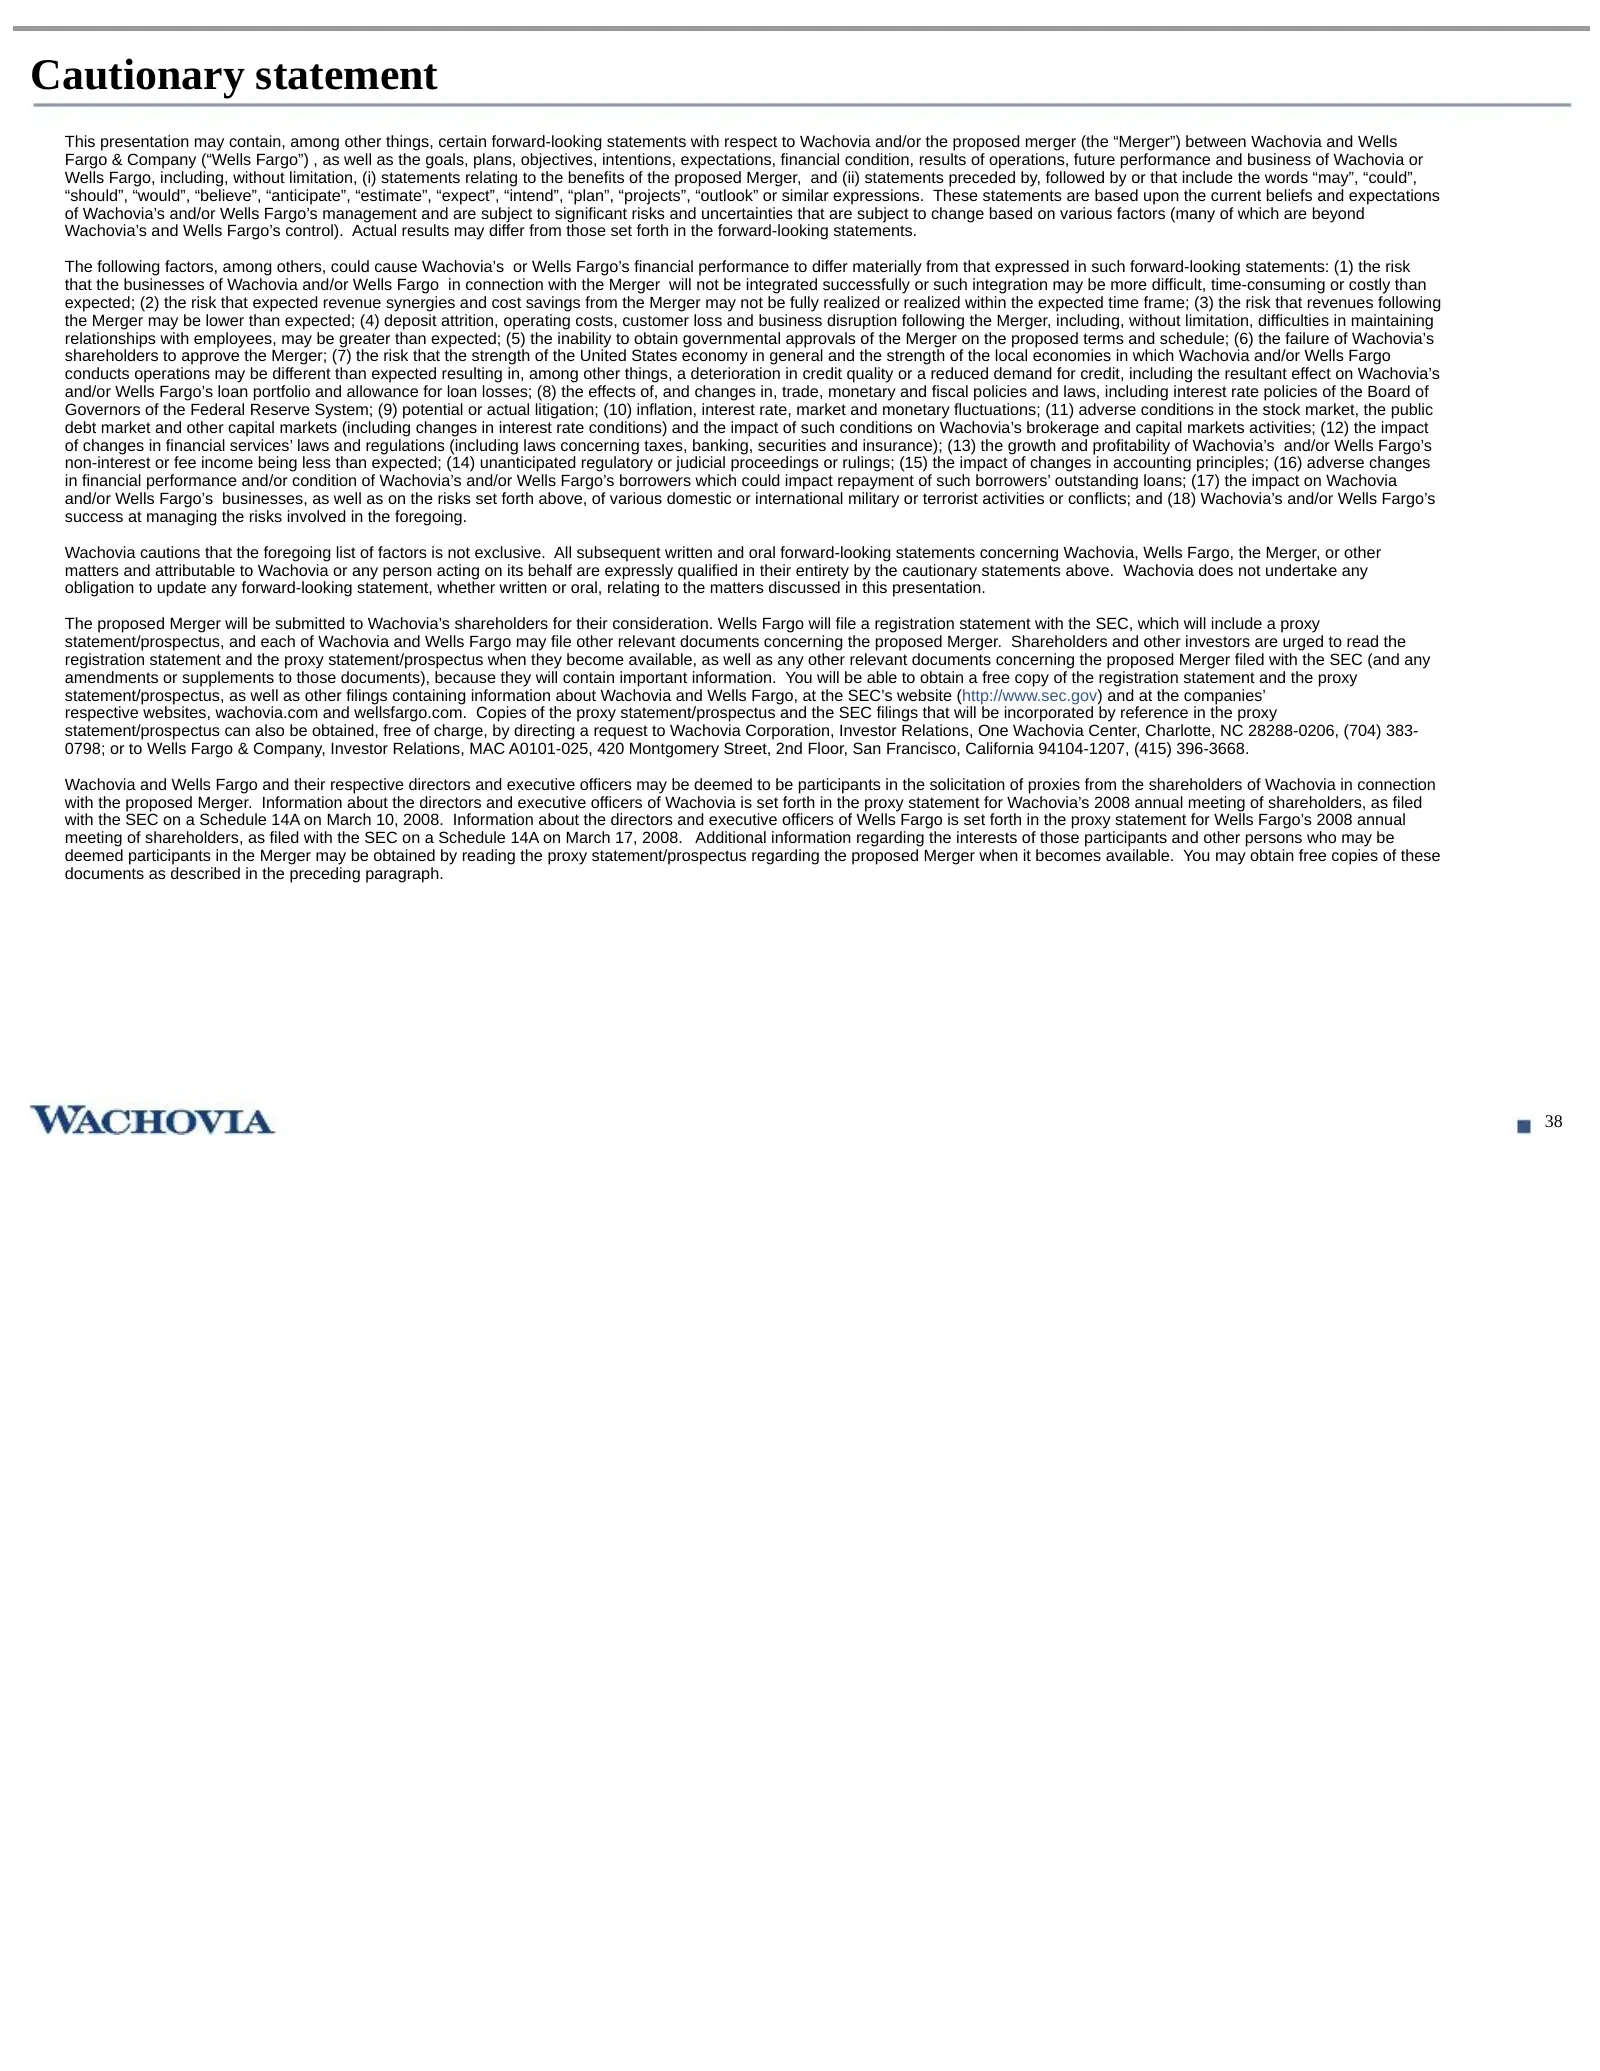
Cautionary statement This presentation may contain, among other things, certain forward-looking statements with respect to Wachovia and/or the proposed merger (the “Merger”) between Wachovia and Wells Fargo & Company (“Wells Fargo”) , as well as the goals, plans, objectives, intentions, expectations
Slide 40: Notes on non-GAAP financial measures
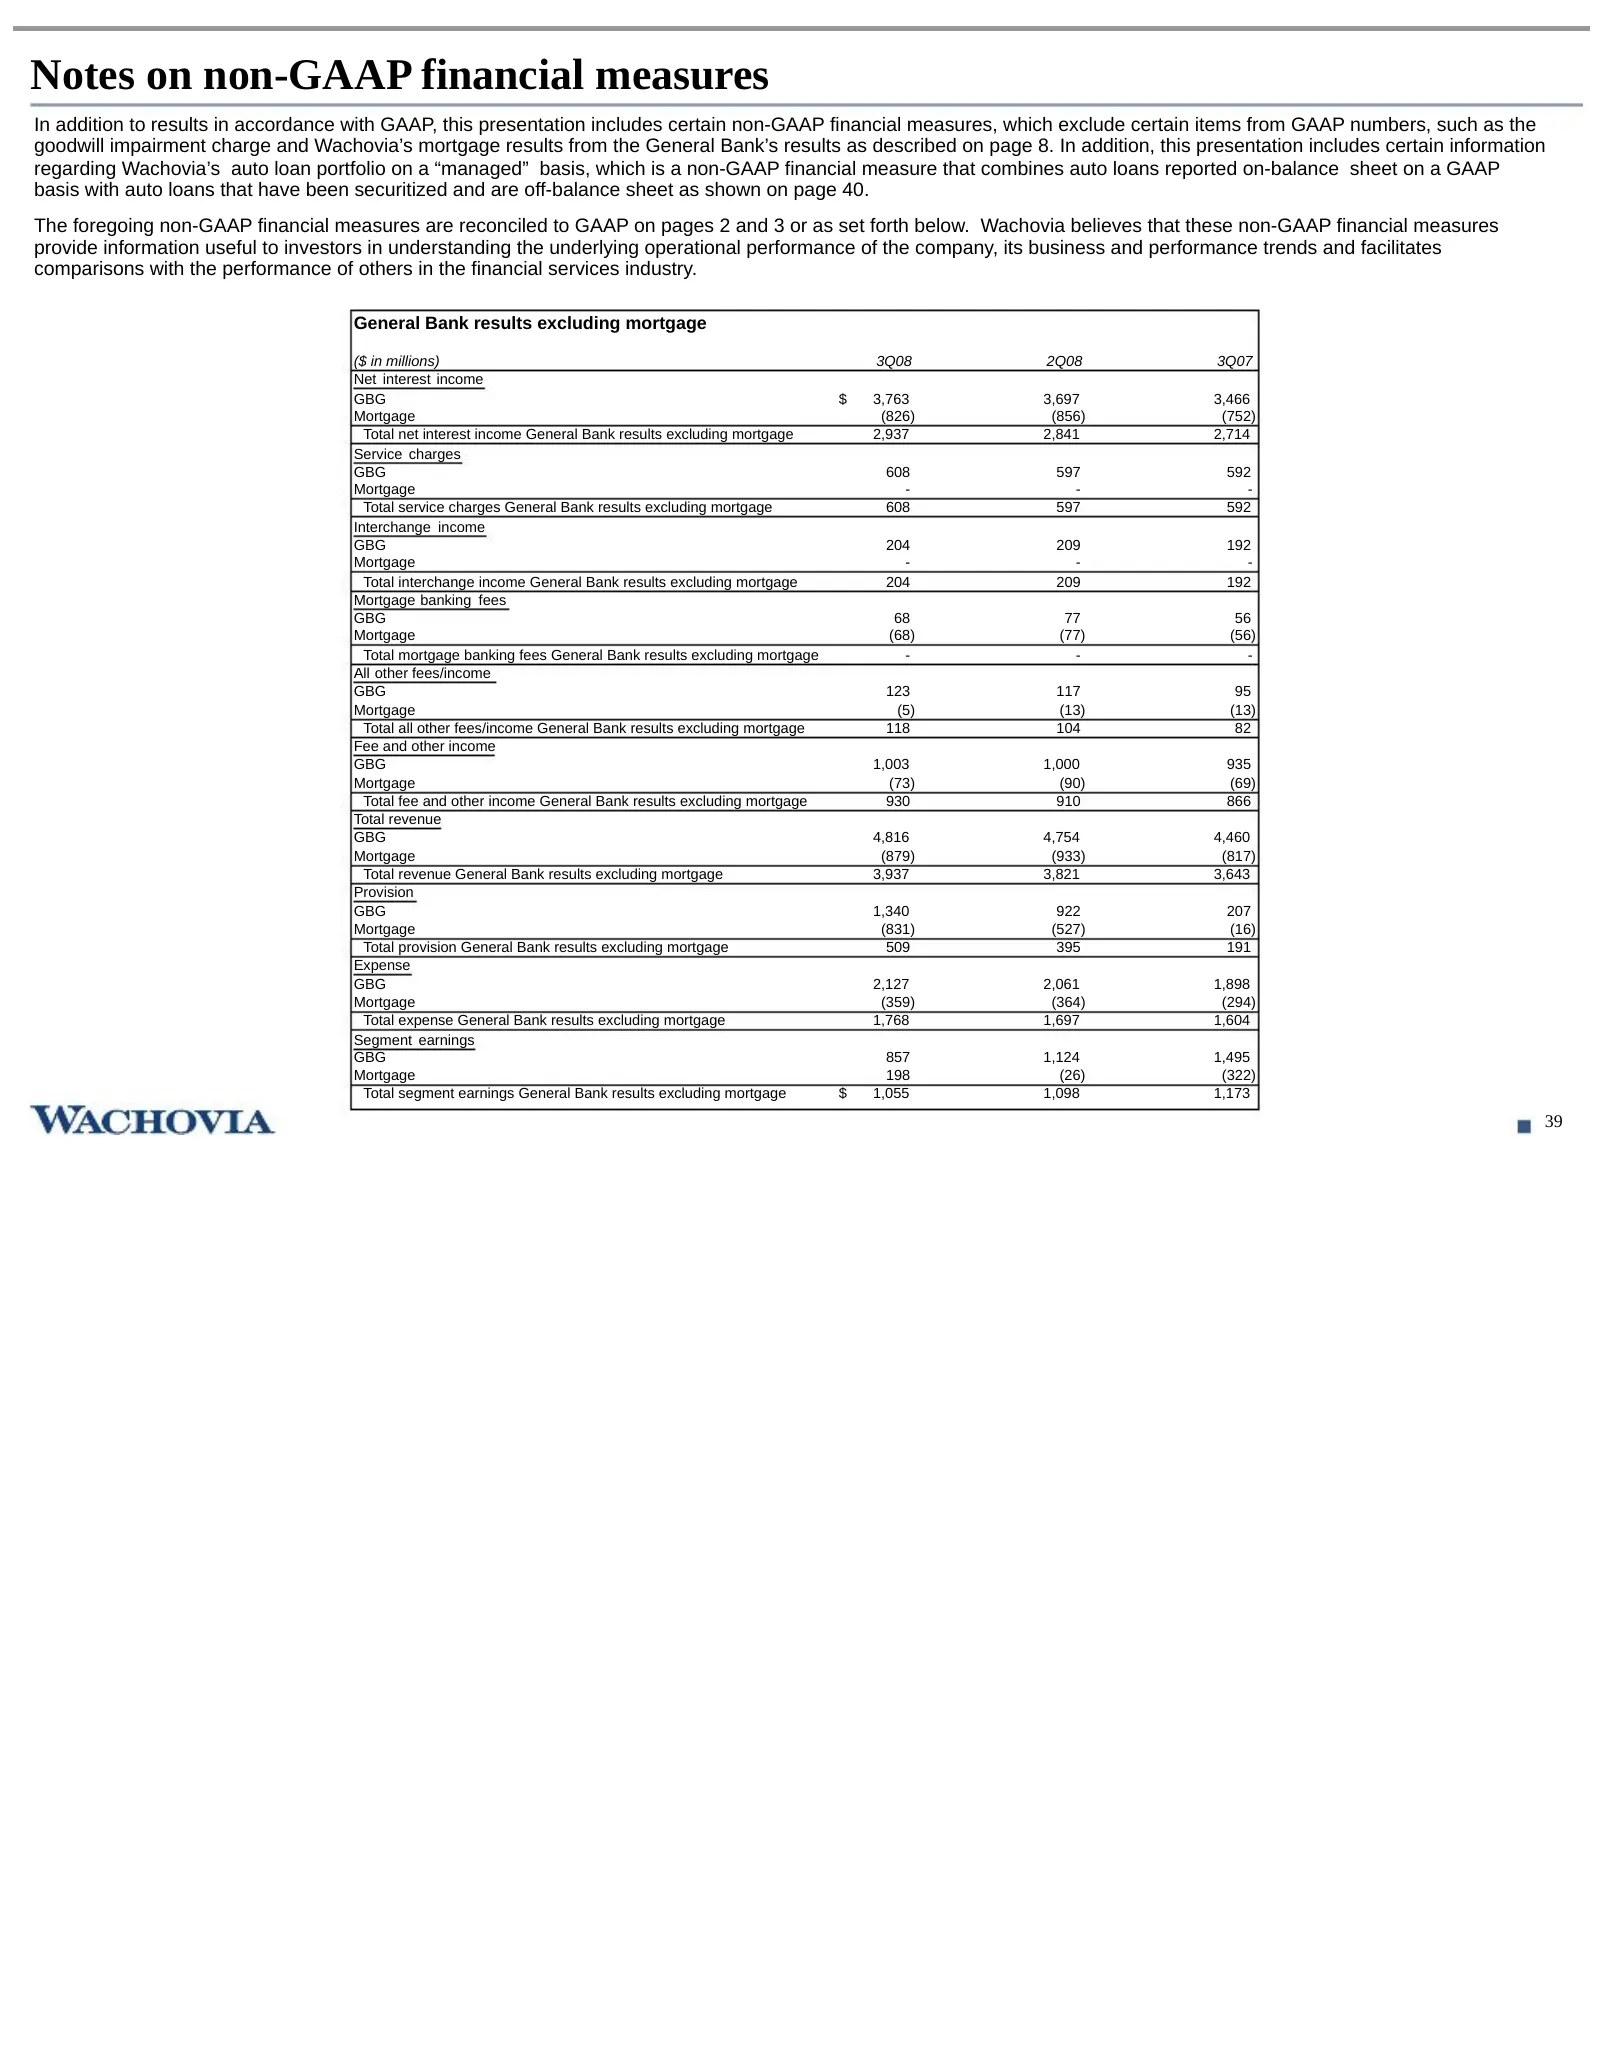
Notes on non-GAAP financial measures In addition to results in accordance with GAAP, this presentation includes certain non-GAAP financial measures, which exclude certain items from GAAP numbers, such as the goodwill impairment charge and Wachovia’s mortgage results from the General Bank’s results a
Slide 41: Notes on non-GAAP financial measures
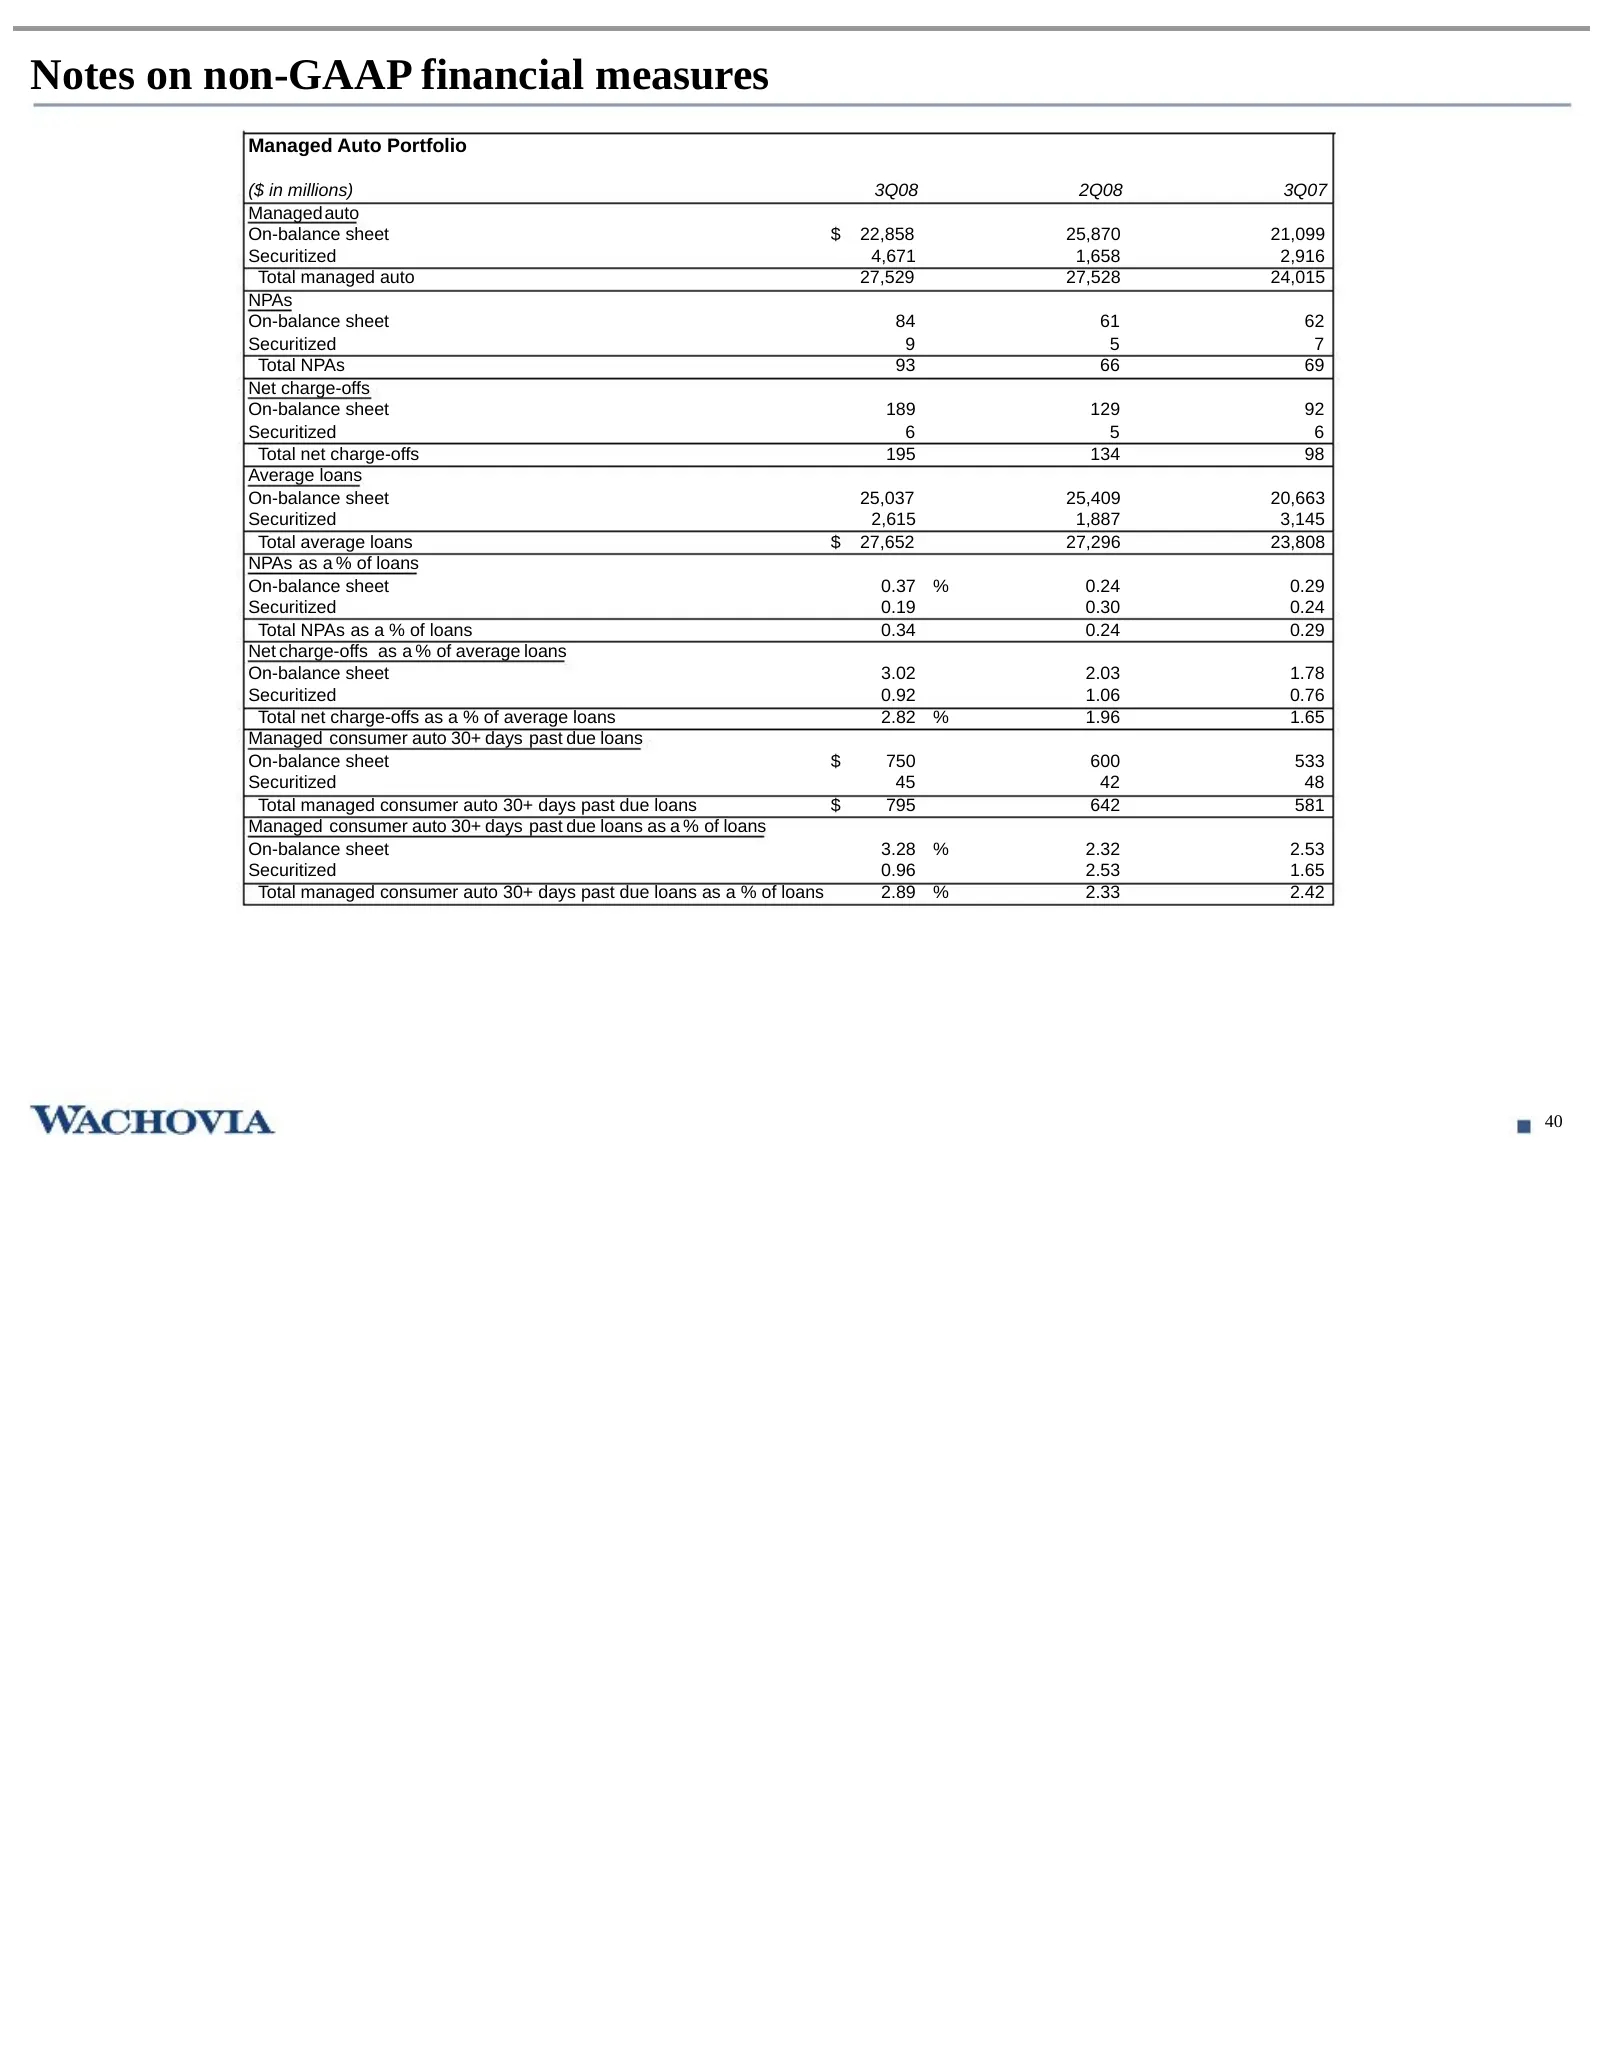
Notes on non-GAAP financial measures Managed Auto Portfolio ($ in millions) 3Q08 2Q08 3Q07 Managed auto On-balance sheet $ 22,858 25,870 21,099 Securitized 4,671 1,658 2,916 Total managed auto 27,529 27,528 24,015 NPAs On-balance sheet 84 61 62 Securitized 9 5 7 Total NPAs 93 66 69 Net charge-offs O
Source: SEC EDGAR · DEFA14A filed Oct 22, 2008
More decks from Wachovia Corp New
 Merger or Acquisition (October 2008)15 slides · Oct 3, 2008
 Lehman Brothers Global Financial Services Conference 200828 slides · Sep 9, 2008
 Q2 2008 Earnings Presentation56 slides · Jul 22, 2008
 IPO Roadshow (April 2008)104 slides · Apr 14, 2008
 Q1 2008 Earnings Presentation45 slides · Apr 14, 2008
 Q4 2007 Earnings Presentation30 slides · Jan 22, 2008