Wachovia Corp New
Wachovia Corp New — IPO Roadshow (April 2008)
104 slides from Wachovia Corp New's IPO roadshow presentation, Apr 14, 2008

Slide 1: Wachovia Reports 1st Quarter Results; Announces Initiatives
Table of Contents Filed Pursuant to Rule 433 Registration No. 333-150225 Press Release April 14, 2008 WACHOVIA REPORTS 1ST QUARTER RESULTS; ANNOUNCES INITIATIVES TO FURTHER ENHANCE CAPITAL BASE AND FLEXIBILITY — Plans to Raise Capital through Public Offering — Reduces Quarterly Dividend to $0.375 Pe
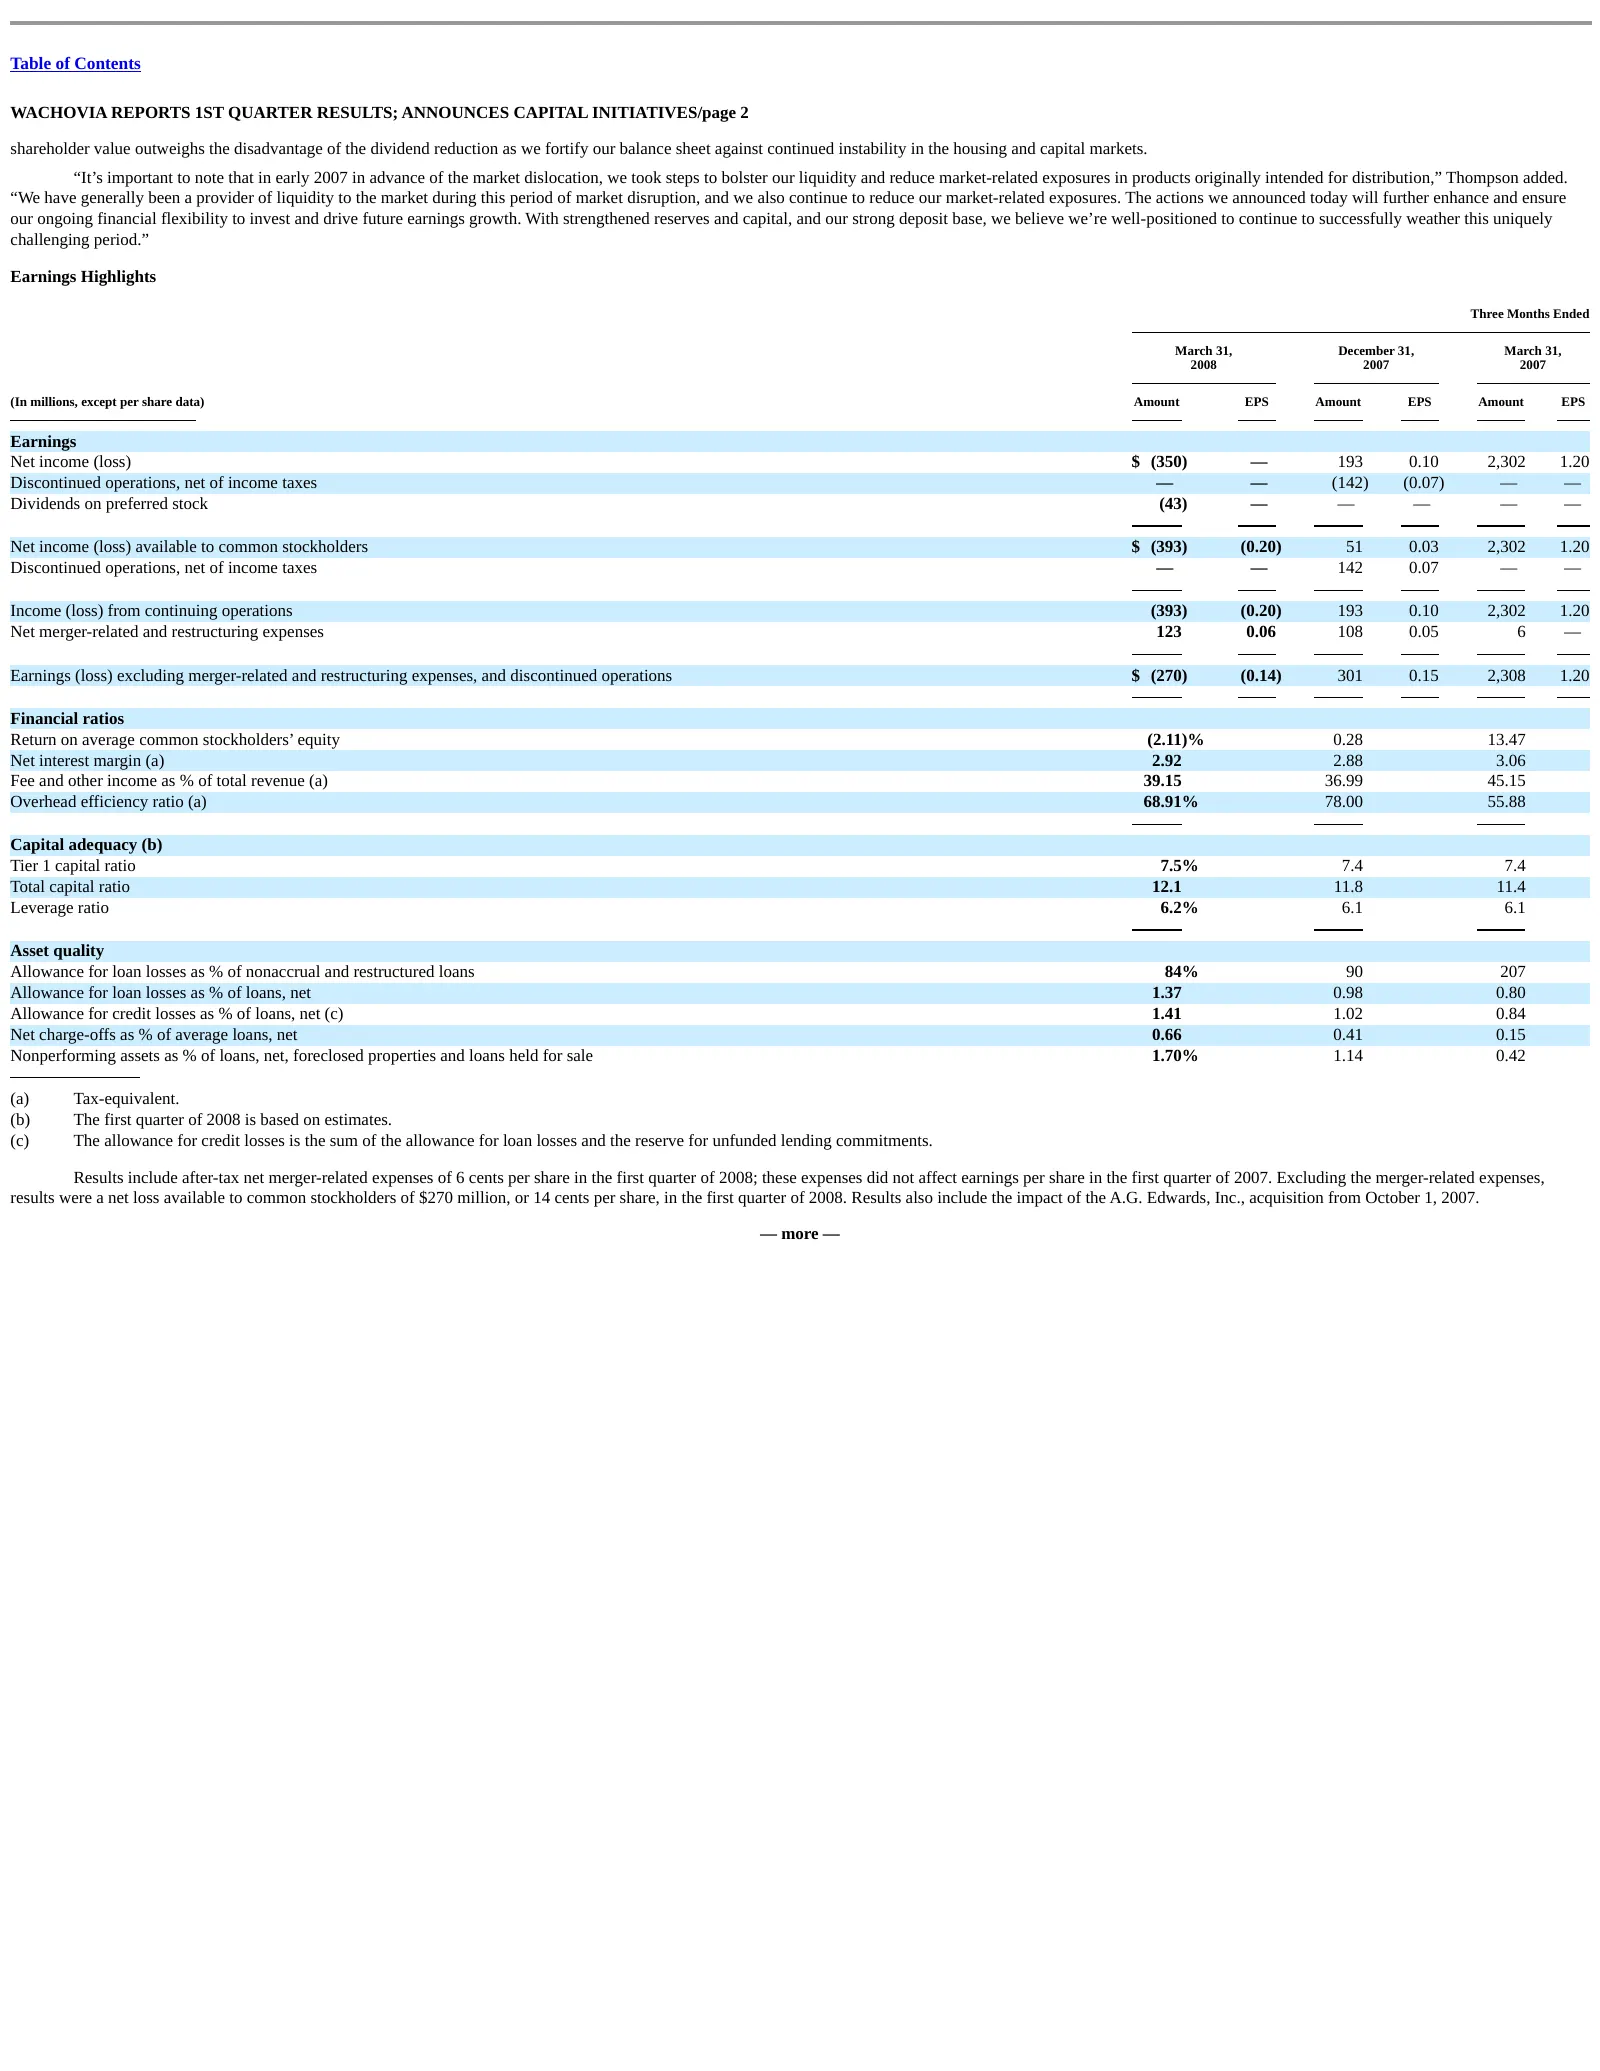
Slide 2: Press Release Page 2: Earnings Highlights
Table of Contents WACHOVIA REPORTS 1ST QUARTER RESULTS; ANNOUNCES CAPITAL INITIATIVES/page 2 shareholder value outweighs the disadvantage of the dividend reduction as we fortify our balance sheet against continued instability in the housing and capital markets. “It’s important to note that in early
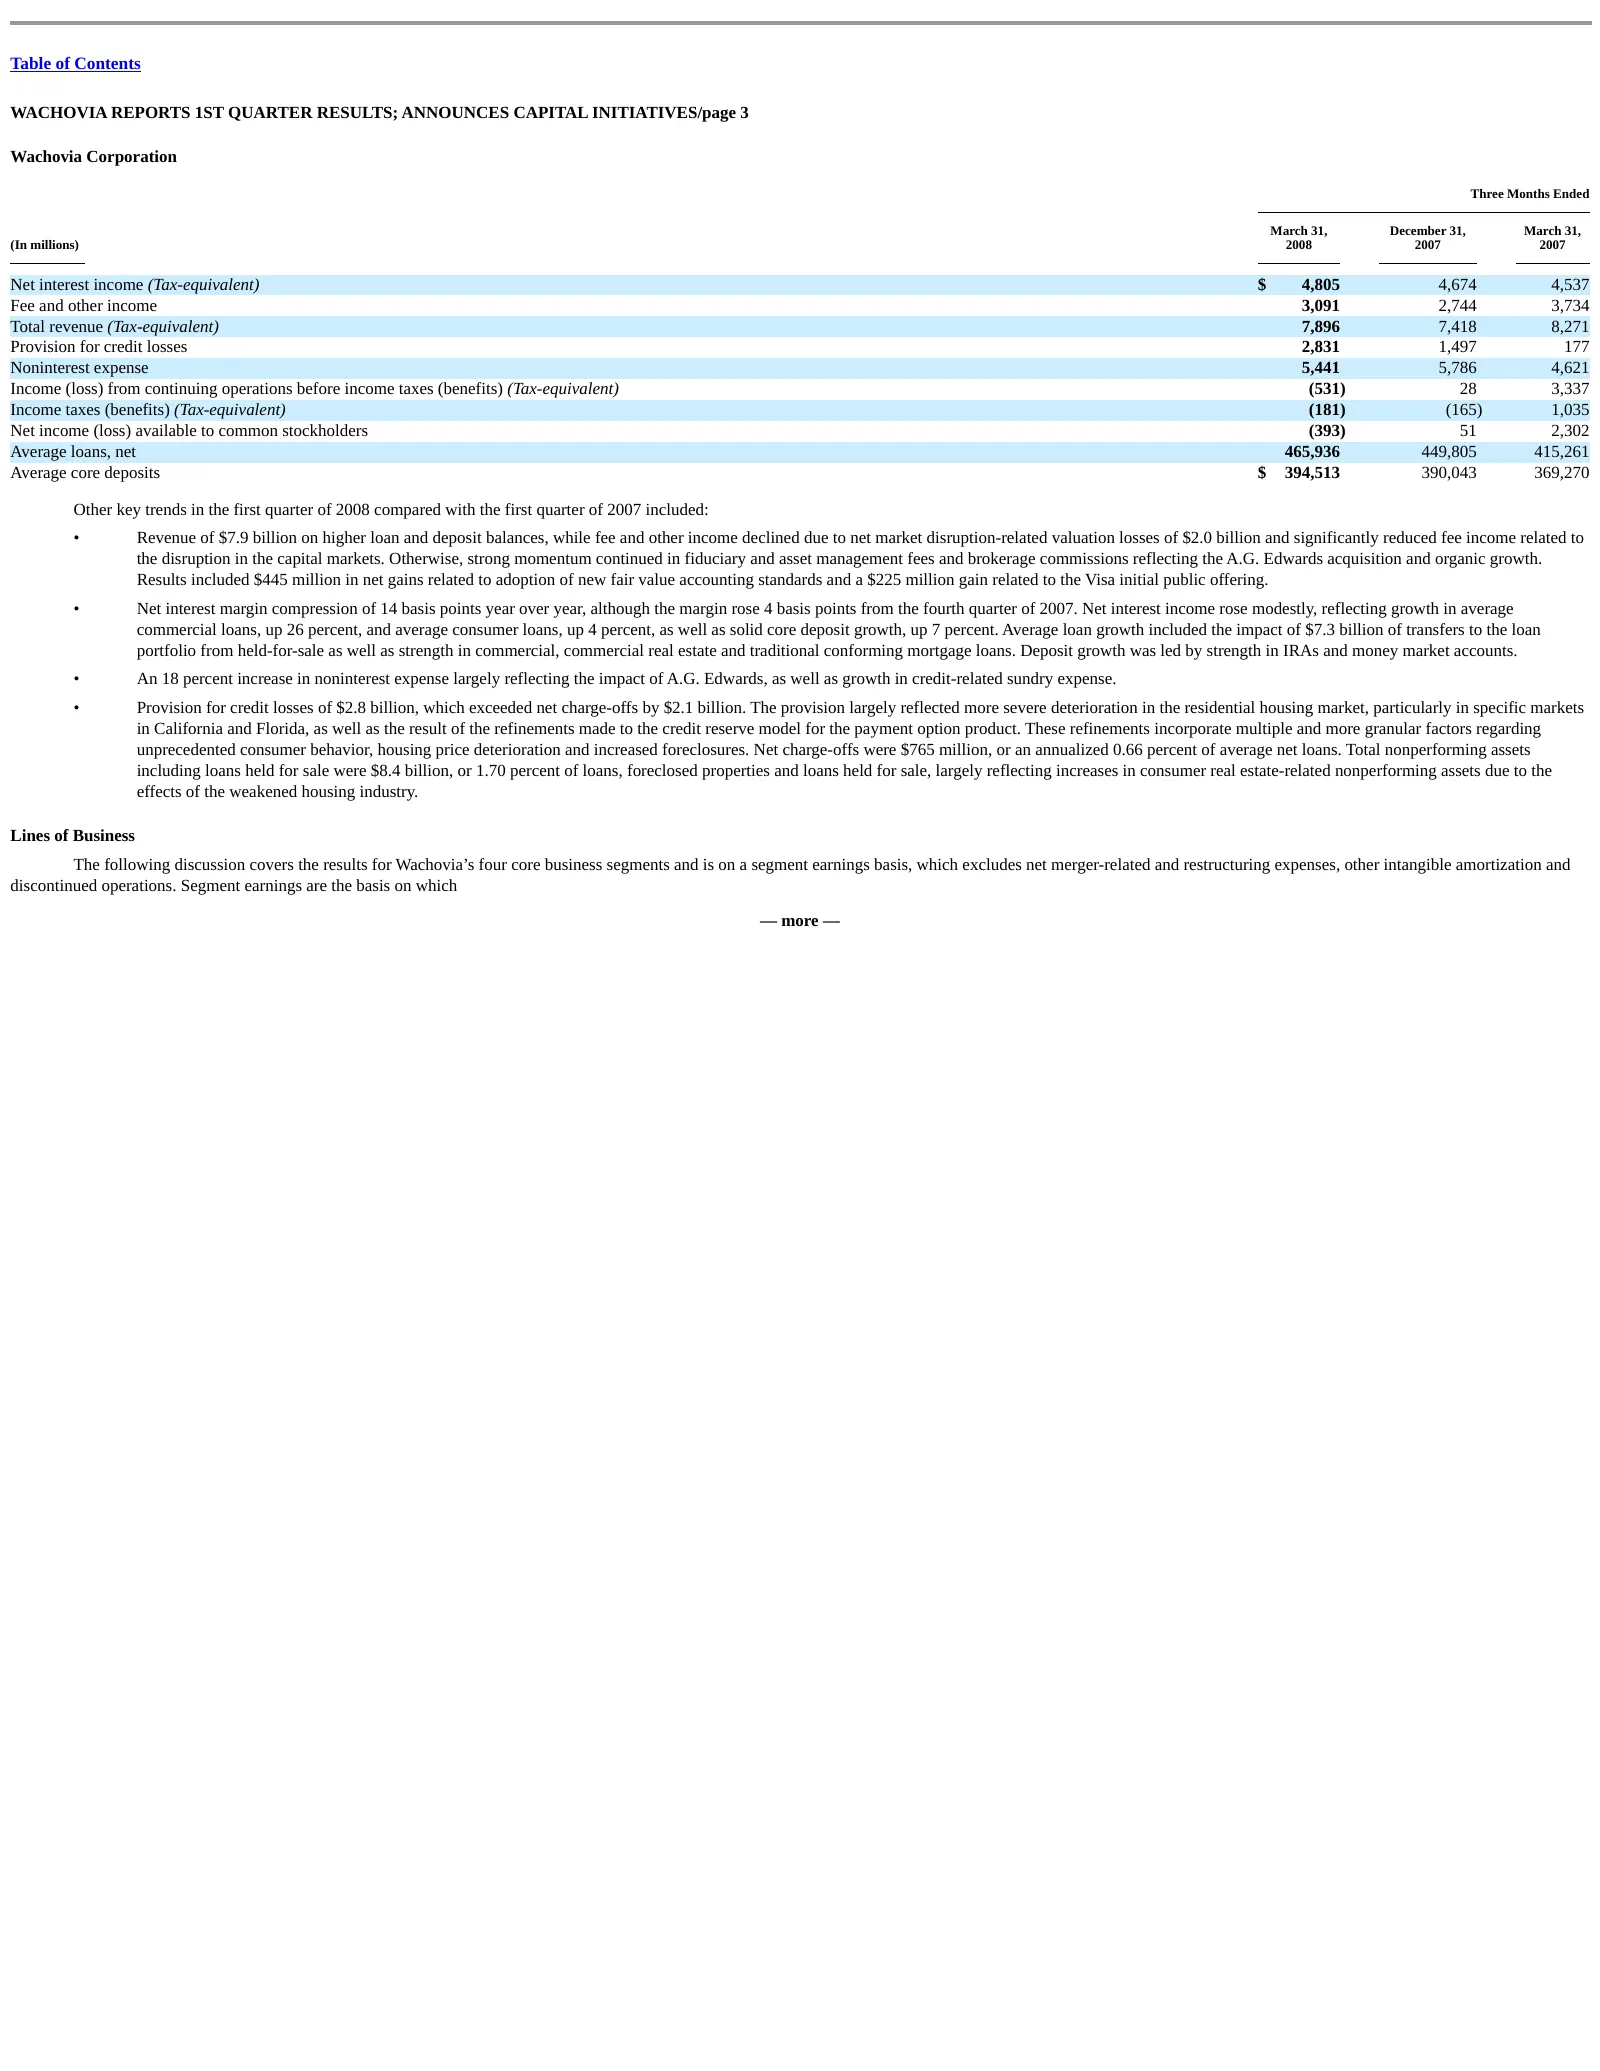
Slide 3: Wachovia Corporation Results Page 3
Table of Contents WACHOVIA REPORTS 1ST QUARTER RESULTS; ANNOUNCES CAPITAL INITIATIVES/page 3 Wachovia Corporation Three Months Ended March 31, December 31, March 31, (In millions) 2008 2007 2007 Net interest income (Tax-equivalent) $ 4,805 4,674 4,537 Fee and other income 3,091 2,744 3,734 Total rev
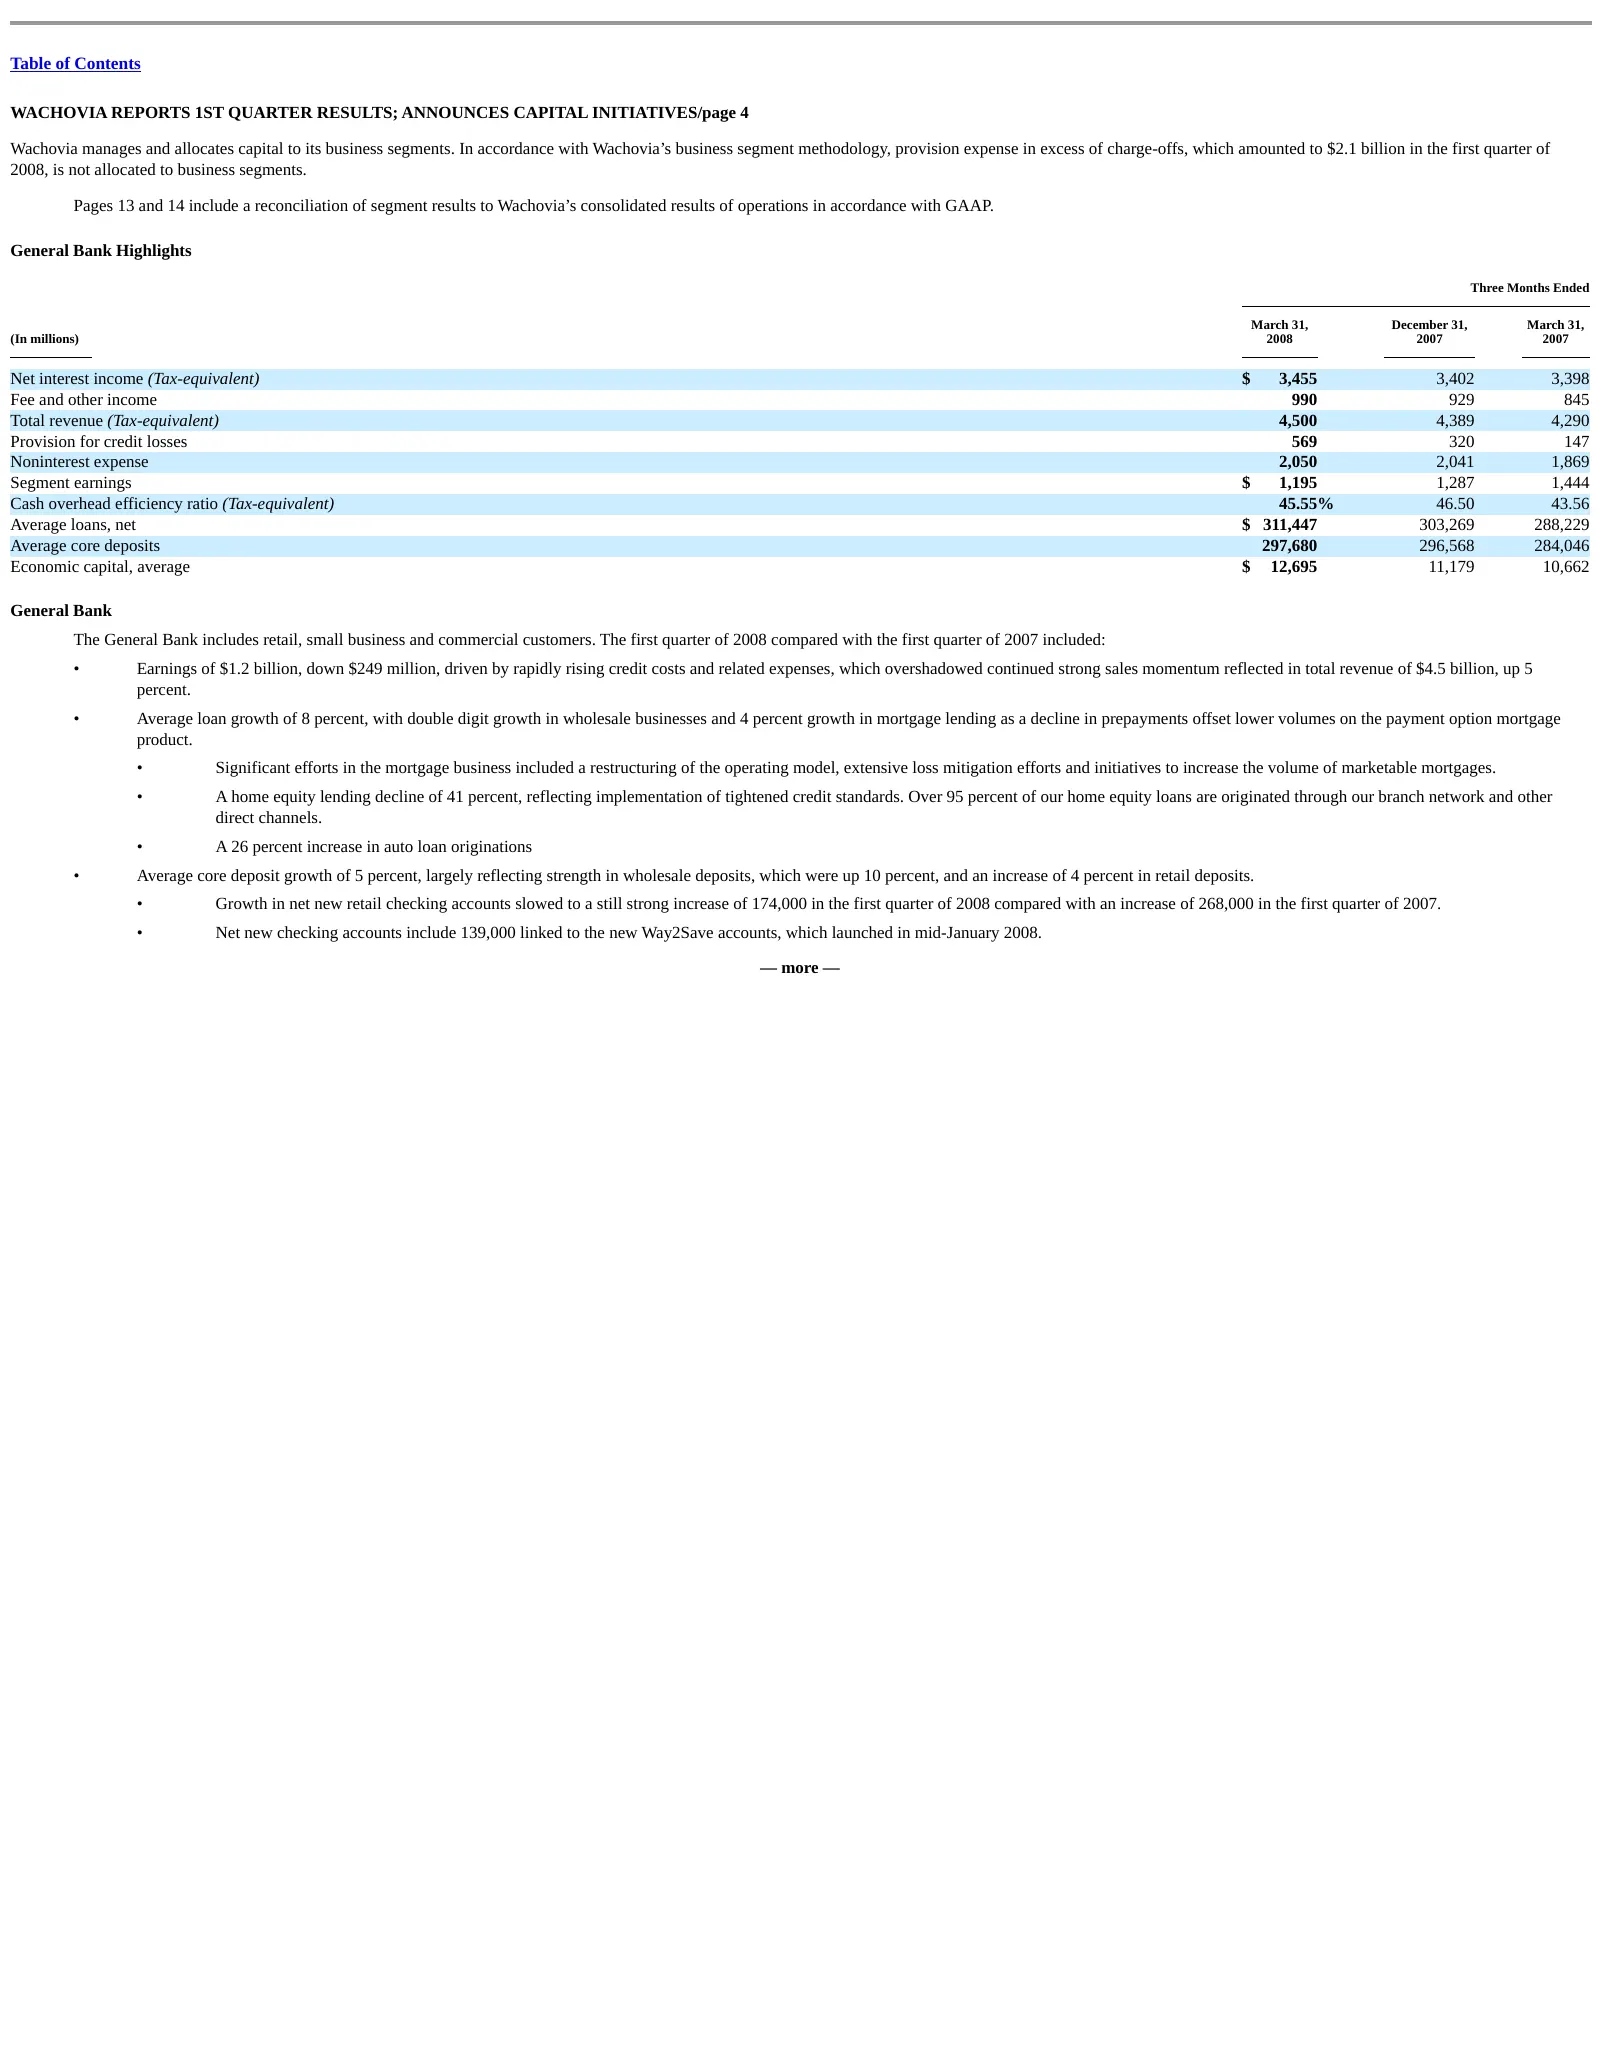
Slide 4: General Bank Highlights
Table of Contents WACHOVIA REPORTS 1ST QUARTER RESULTS; ANNOUNCES CAPITAL INITIATIVES/page 4 Wachovia manages and allocates capital to its business segments. In accordance with Wachovia’s business segment methodology, provision expense in excess of charge-offs, which amounted to $2.1 billion in the
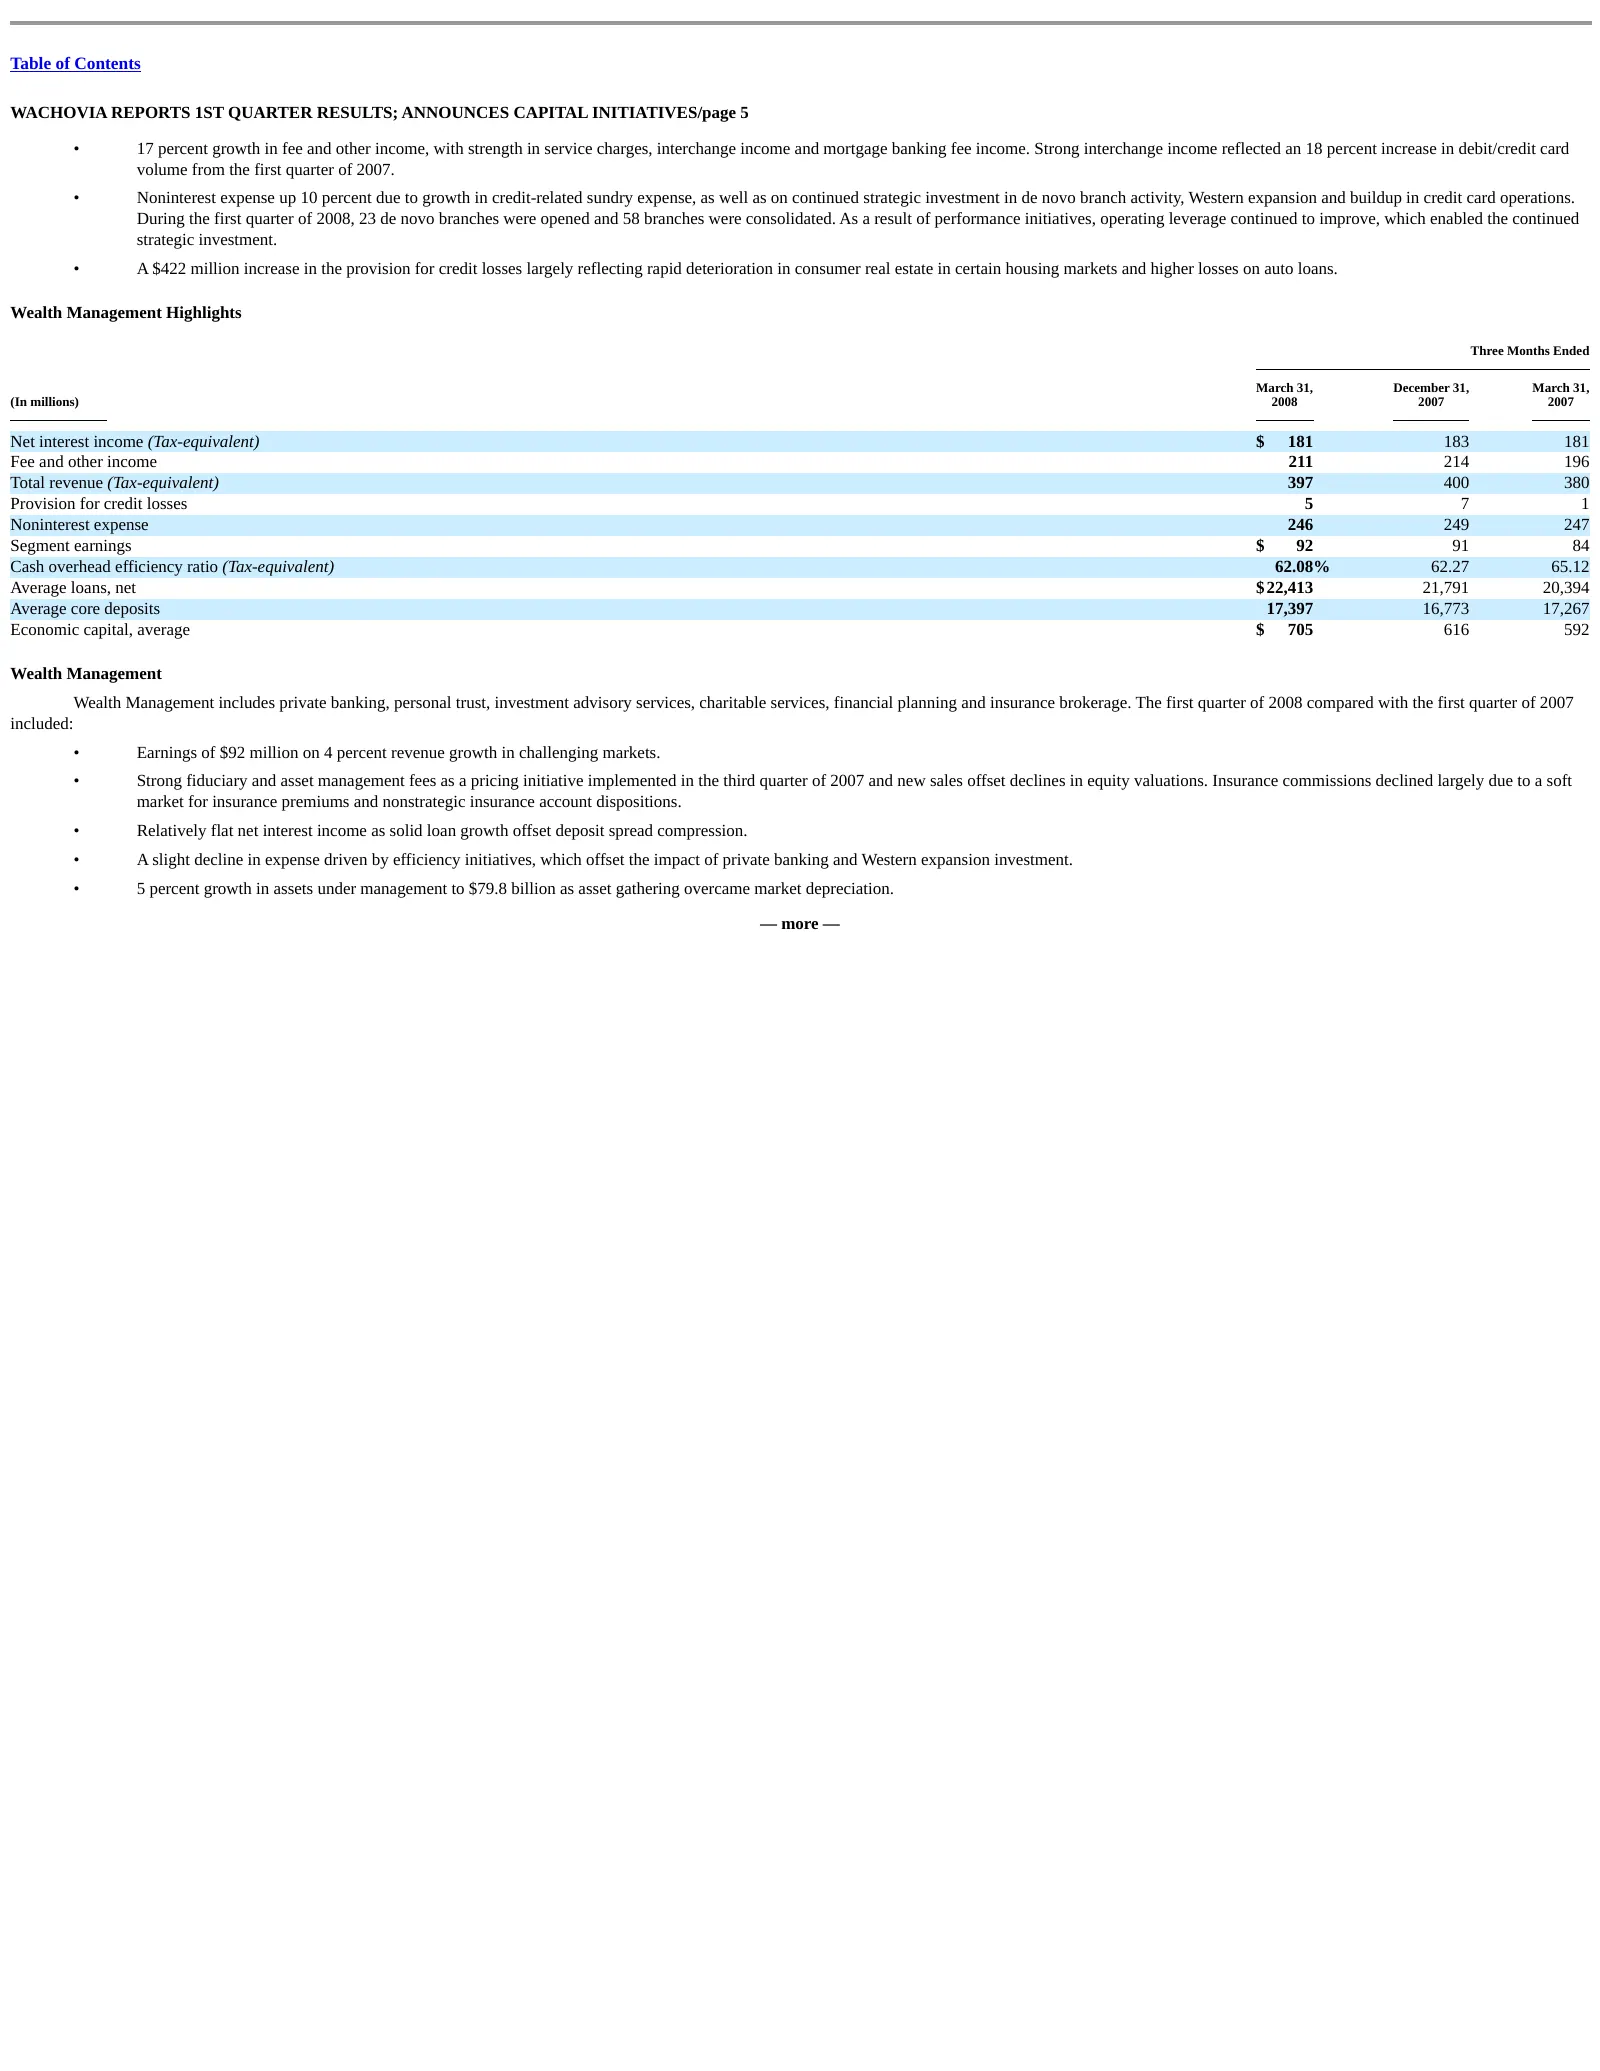
Slide 5: General Bank (continued)
Table of Contents WACHOVIA REPORTS 1ST QUARTER RESULTS; ANNOUNCES CAPITAL INITIATIVES/page 5 • 17 percent growth in fee and other income, with strength in service charges, interchange income and mortgage banking fee income. Strong interchange income reflected an 18 percent increase in debit/credit c
Slide 6: Corporate and Investment Bank Highlights
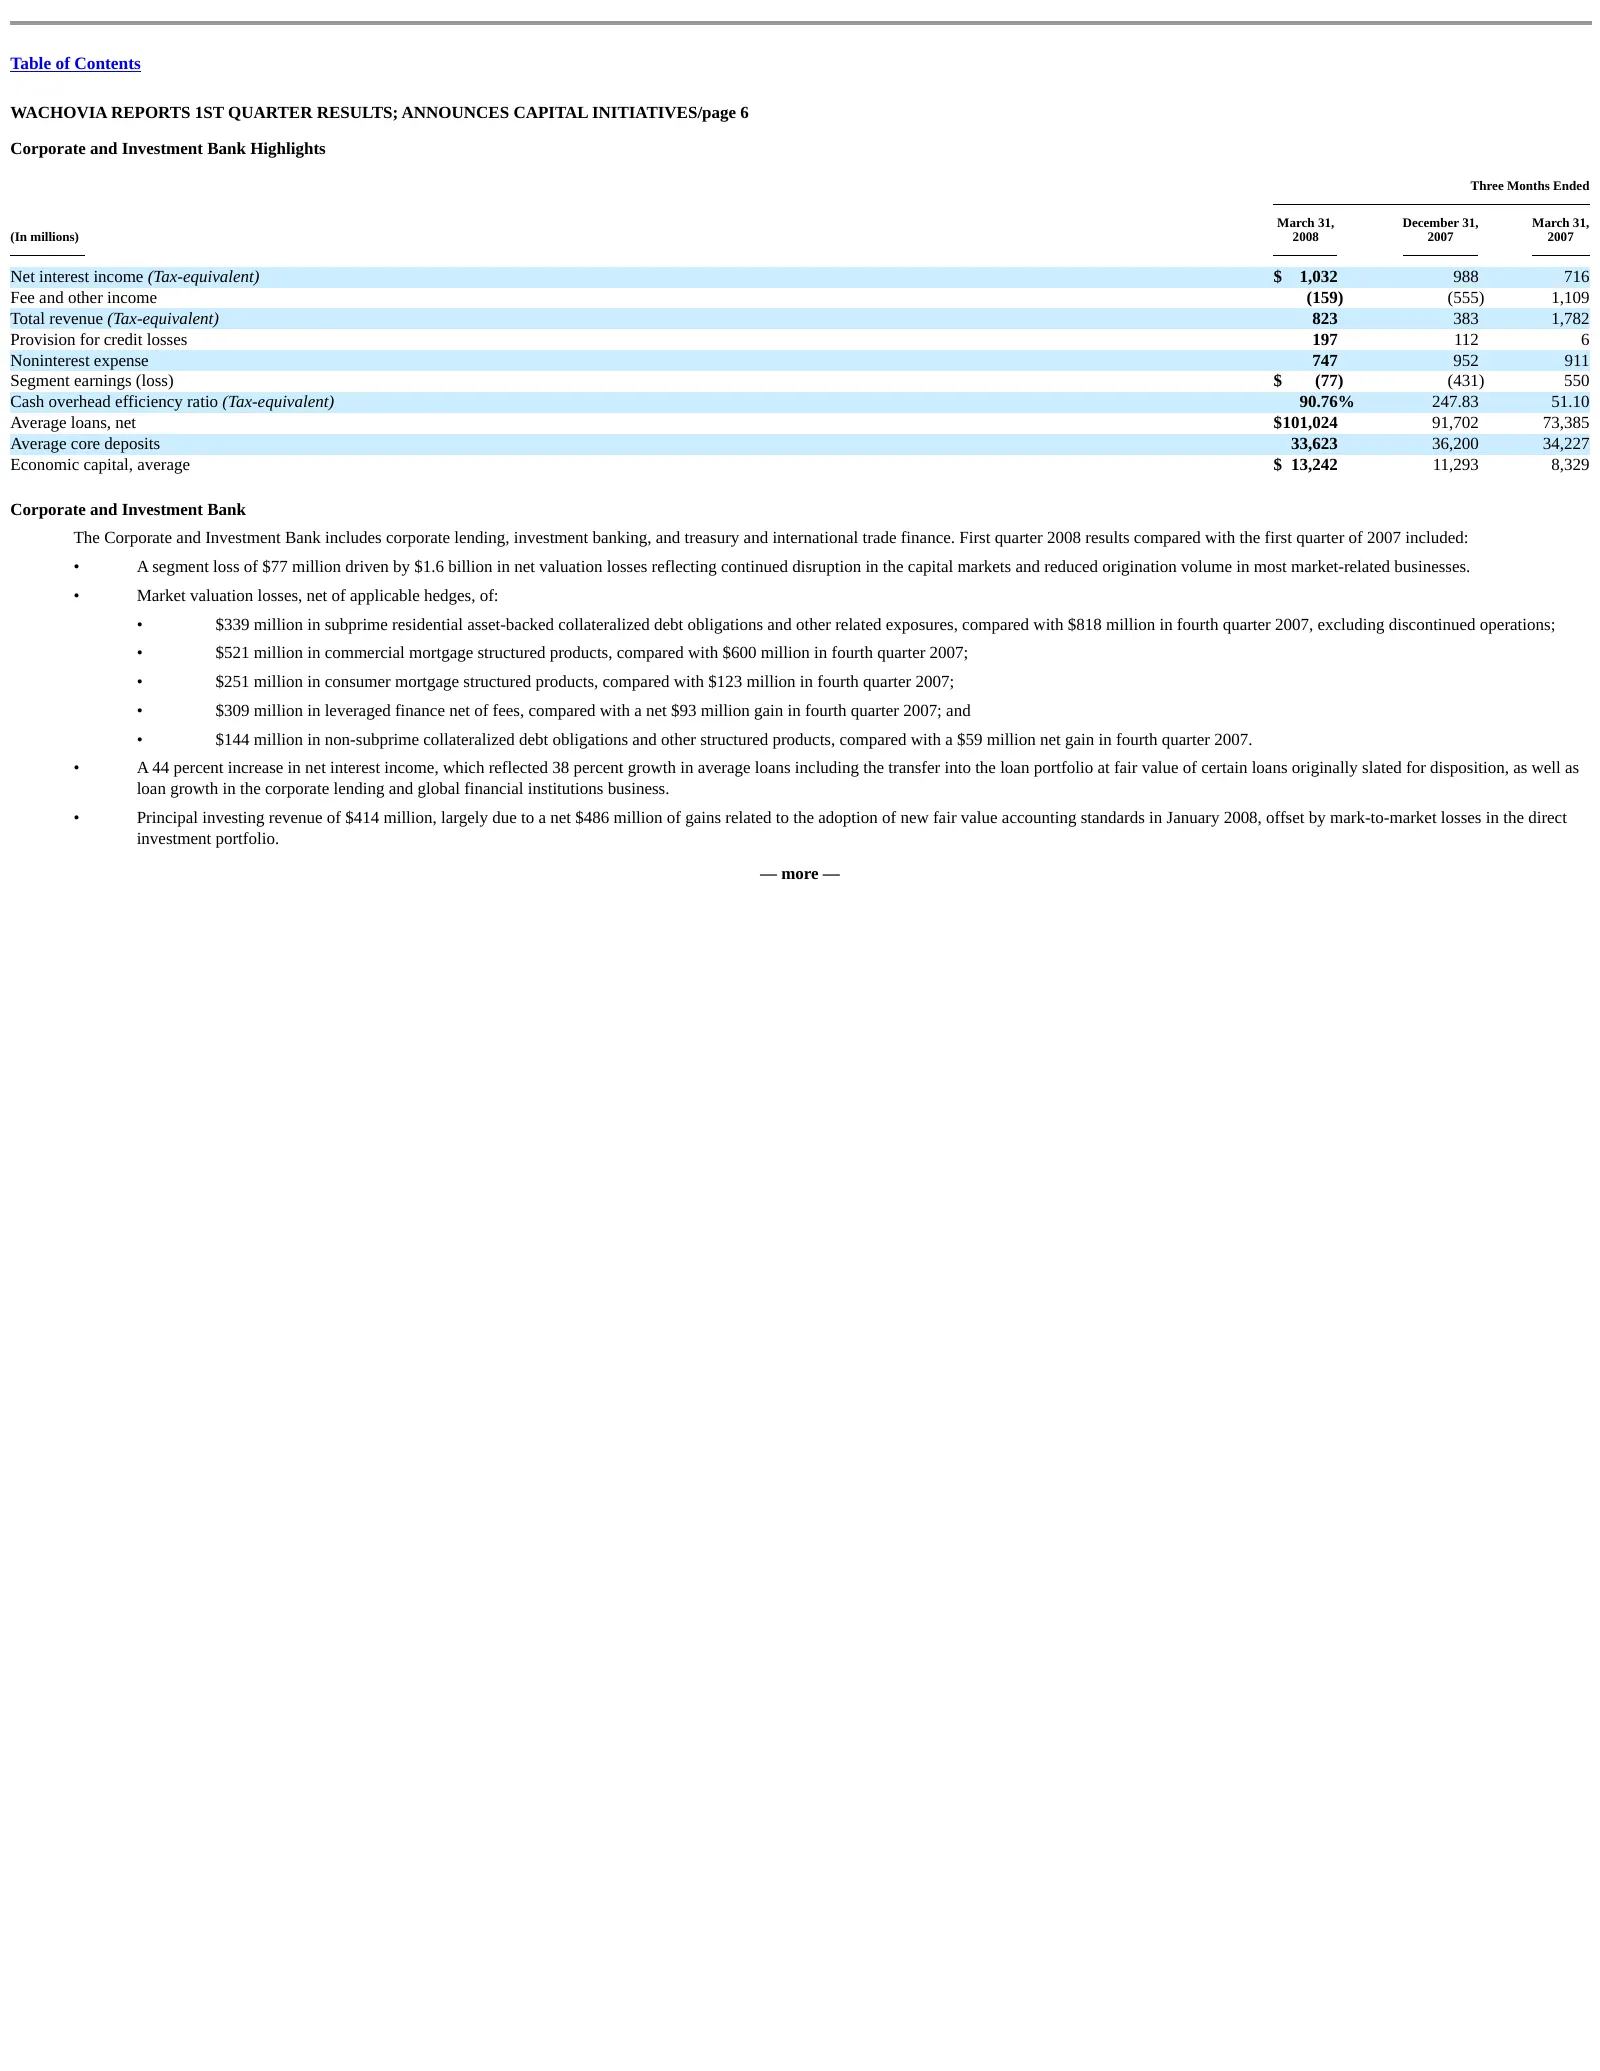
Table of Contents WACHOVIA REPORTS 1ST QUARTER RESULTS; ANNOUNCES CAPITAL INITIATIVES/page 6 Corporate and Investment Bank Highlights Three Months Ended March 31, December 31, March 31, (In millions) 2008 2007 2007 Net interest income (Tax-equivalent) $ 1,032 988 716 Fee and other income (159) (555)
Slide 7: Capital Management Highlights
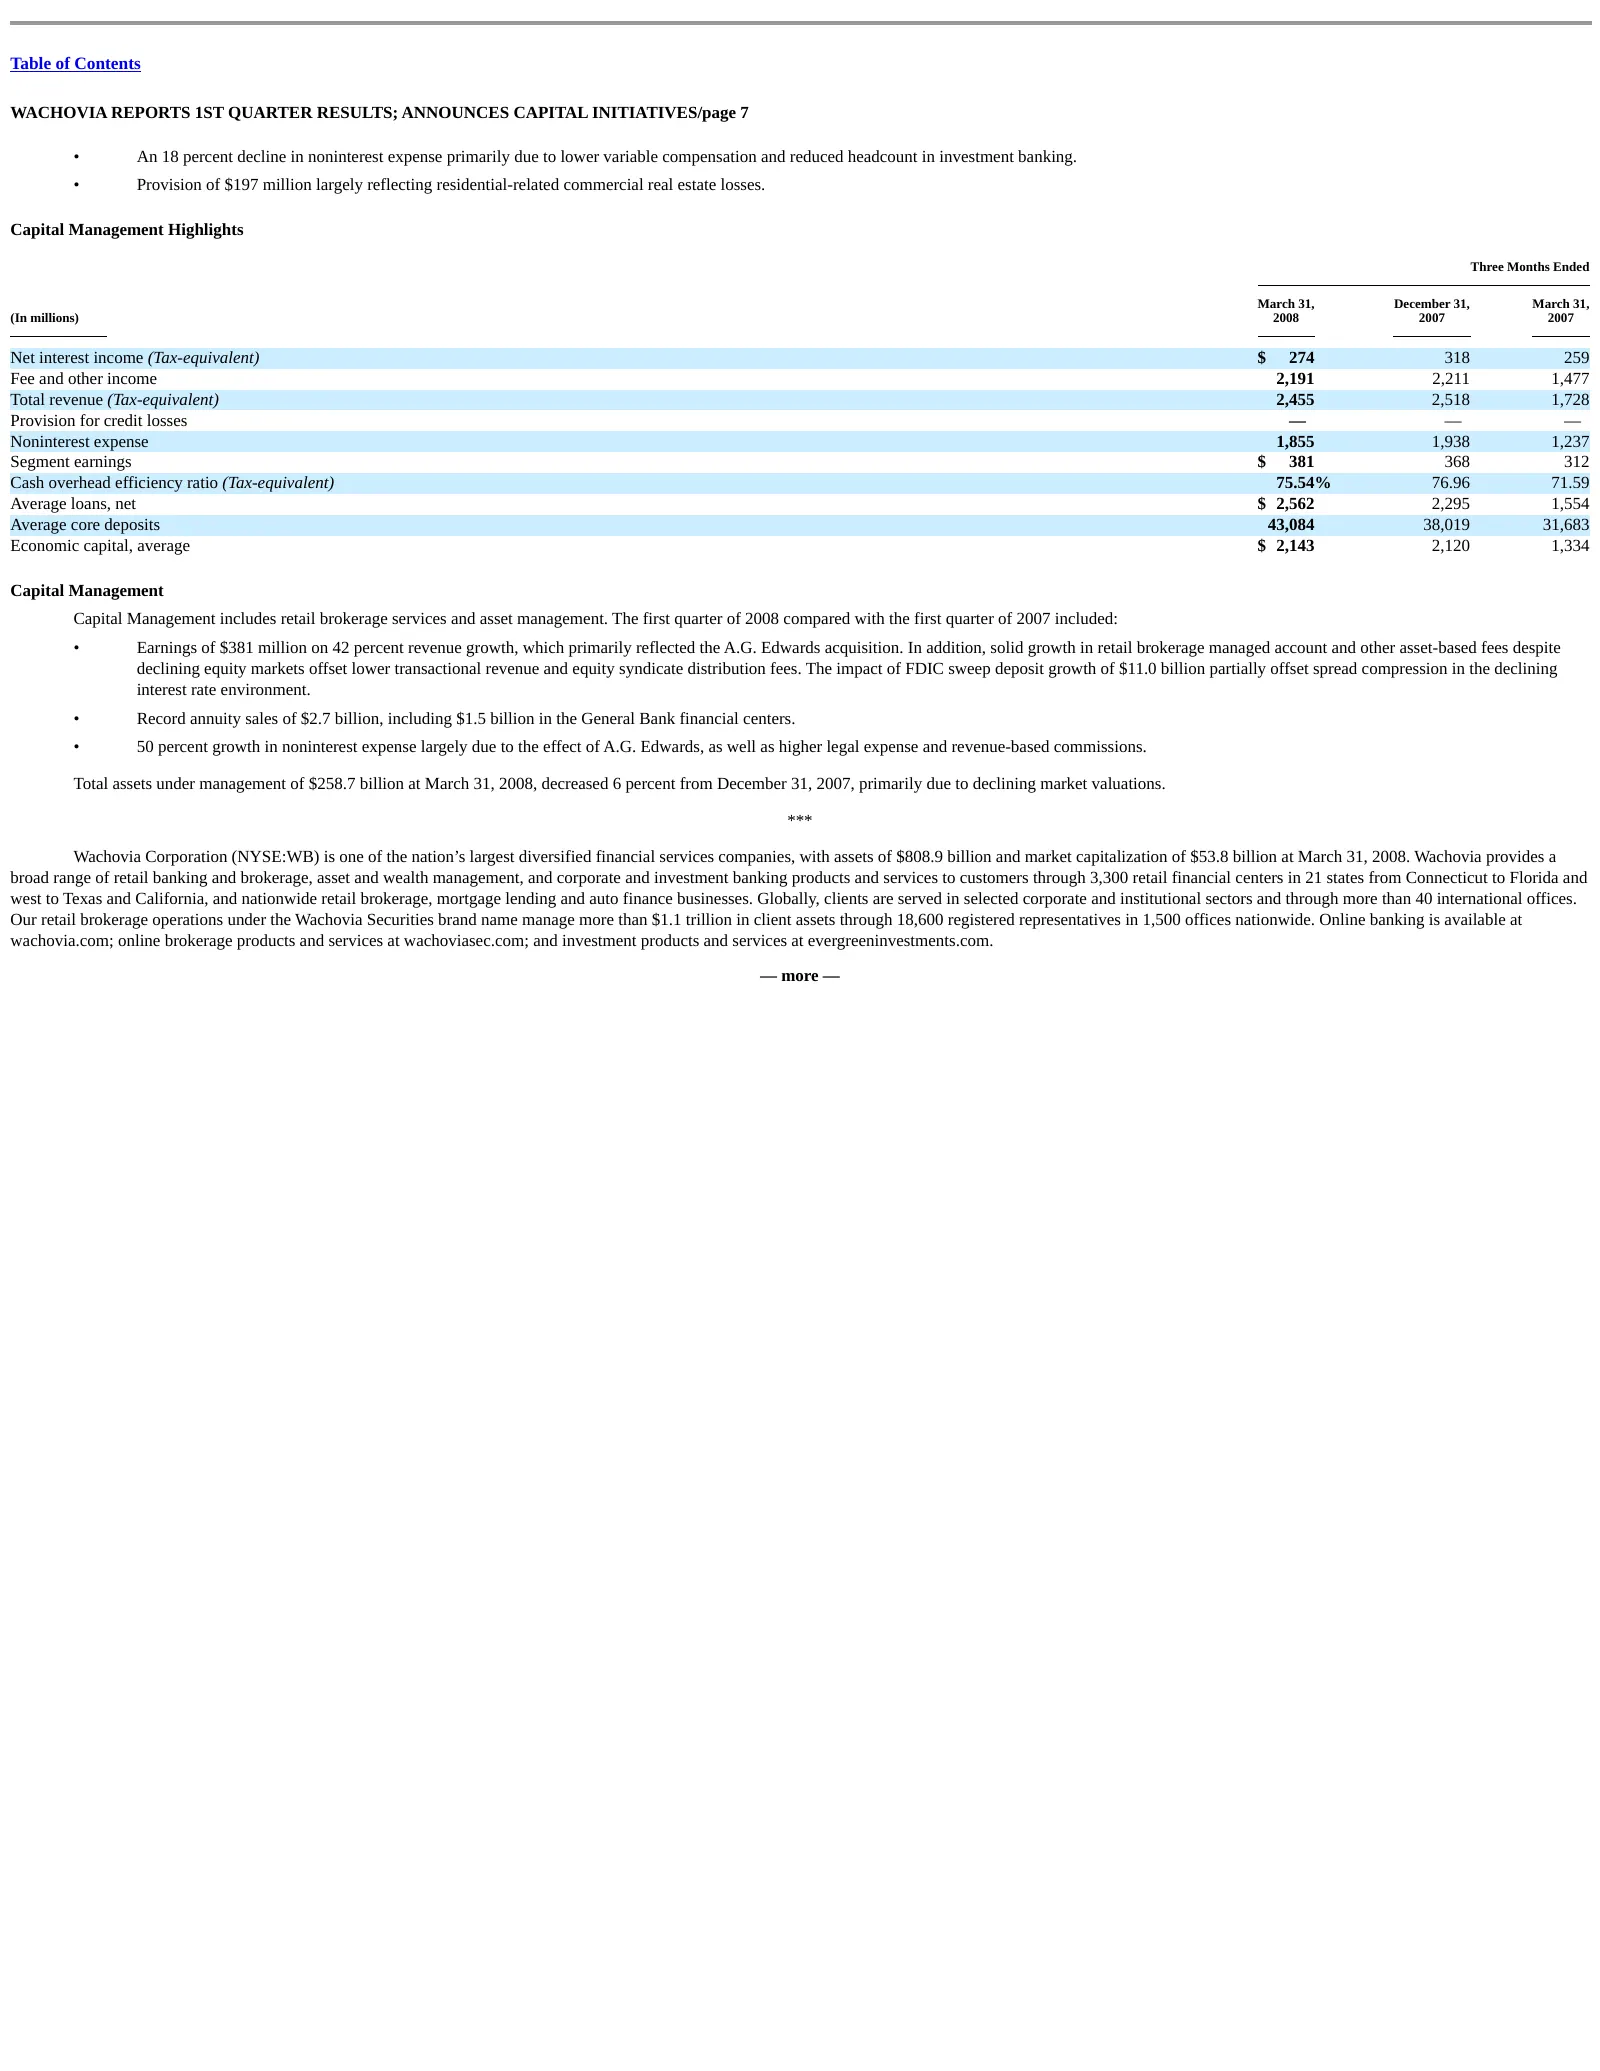
Table of Contents WACHOVIA REPORTS 1ST QUARTER RESULTS; ANNOUNCES CAPITAL INITIATIVES/page 7 • An 18 percent decline in noninterest expense primarily due to lower variable compensation and reduced headcount in investment banking. • Provision of $197 million largely reflecting residential-related com

Slide 8: Forward-Looking Statements
Table of Contents WACHOVIA REPORTS 1ST QUARTER RESULTS; ANNOUNCES CAPITAL INITIATIVES/page 8 Forward-Looking Statements This news release contains various forward-looking statements. A discussion of various factors that could cause Wachovia Corporation’s actual results to differ materially from thos

Slide 9: Financial Tables Table of Contents
Table of Contents PAGE 9 WACHOVIA CORPORATION AND SUBSIDIARIES FINANCIAL TABLES TABLE OF CONTENTS PAGE Financial Highlights—Five Quarters Ended March 31, 2008 10 Other Financial Data—Five Quarters Ended March 31, 2008 11 Consolidated Statements of Income—Five Quarters Ended March 31, 2008 12 Busines
Slide 10: Financial Highlights
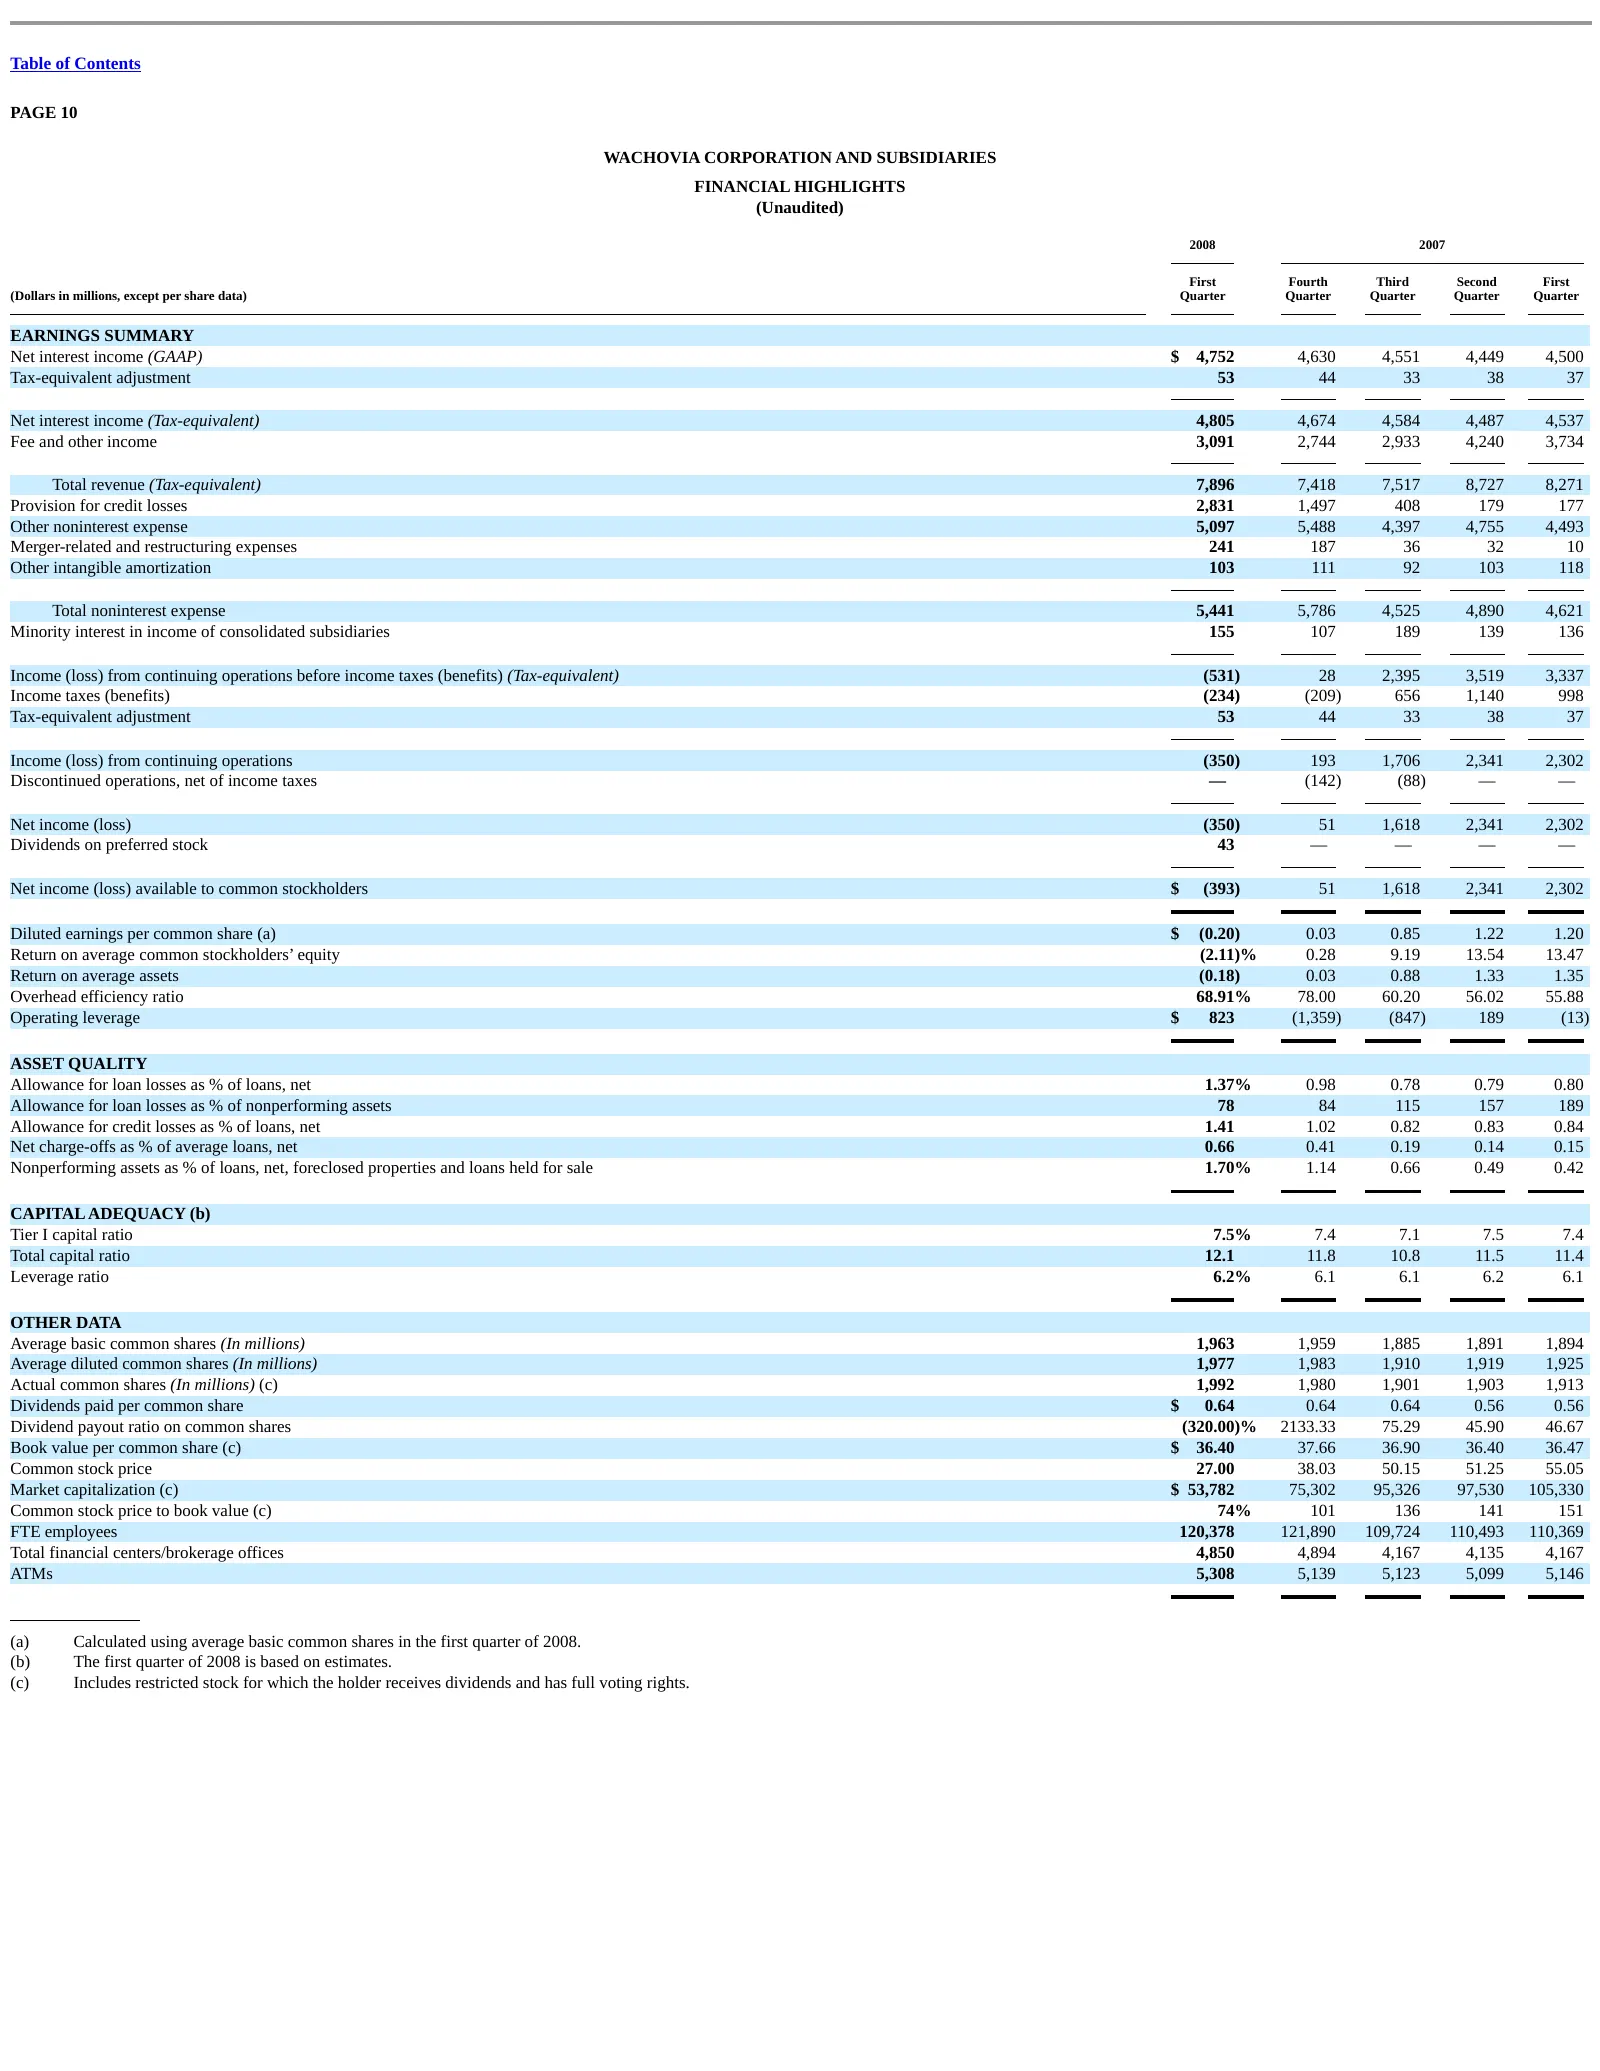
Table of Contents PAGE 10 WACHOVIA CORPORATION AND SUBSIDIARIES FINANCIAL HIGHLIGHTS (Unaudited) 2008 2007 First Fourth Third Second First (Dollars in millions, except per share data) Quarter Quarter Quarter Quarter Quarter EARNINGS SUMMARY Net interest income (GAAP) $ 4,752 4,630 4,551 4,449 4,500
Slide 11: Other Financial Data
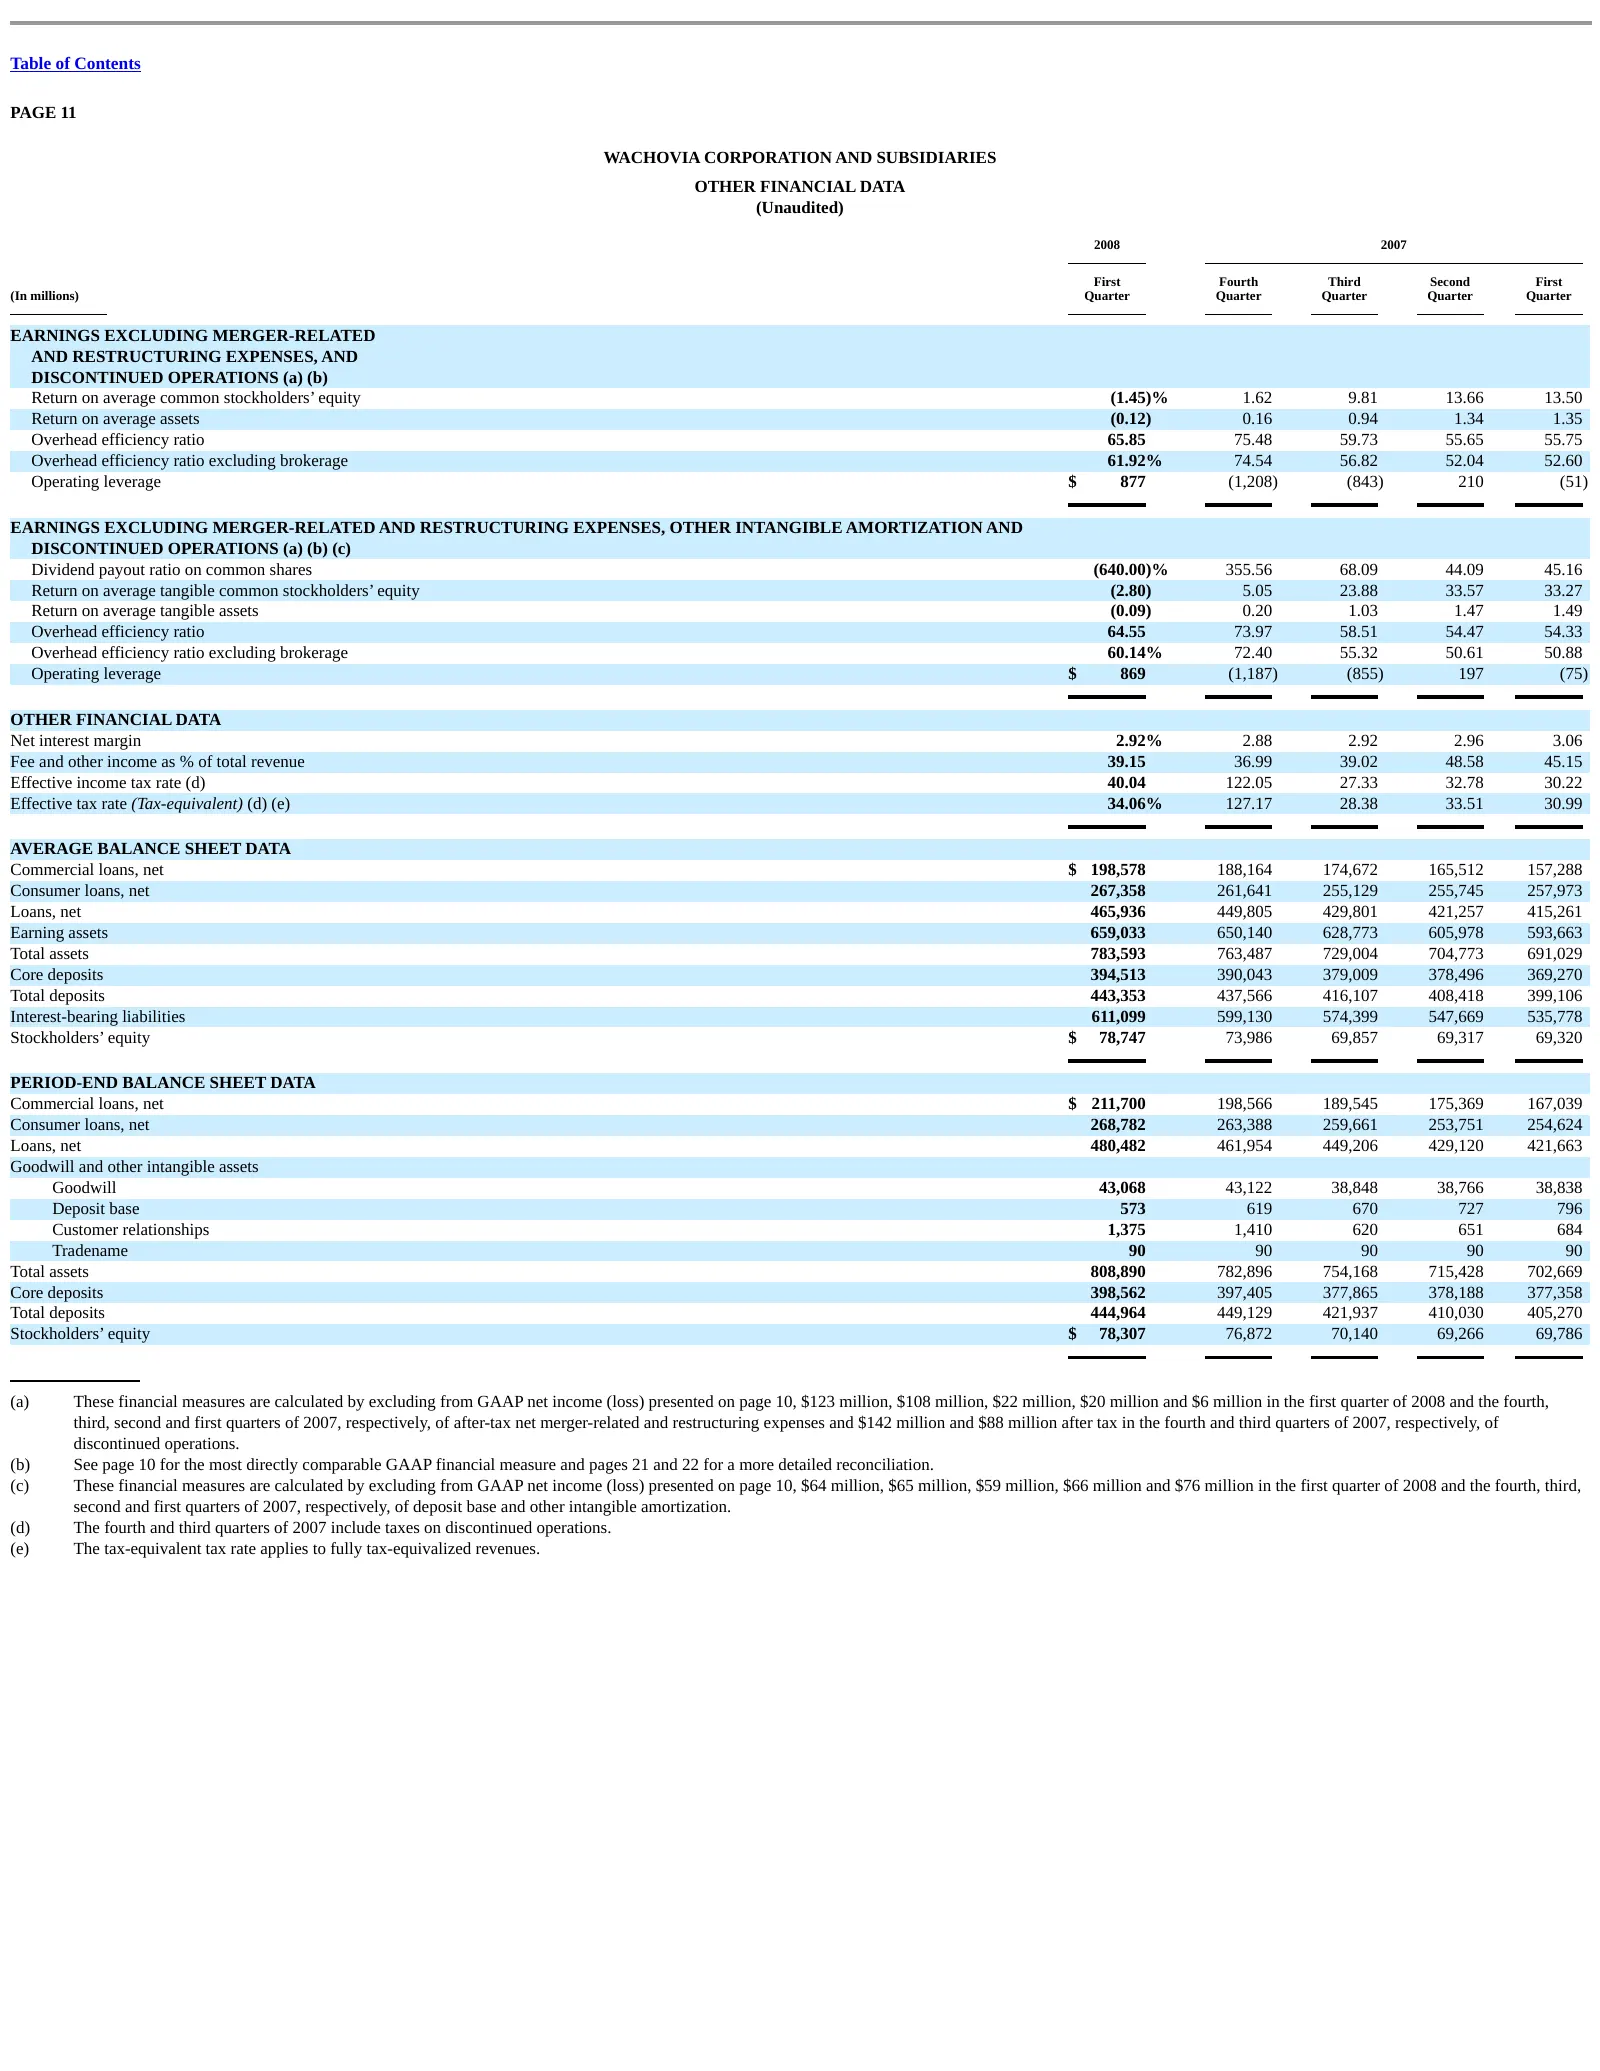
Table of Contents PAGE 11 WACHOVIA CORPORATION AND SUBSIDIARIES OTHER FINANCIAL DATA (Unaudited) 2008 2007 First Fourth Third Second First (In millions) Quarter Quarter Quarter Quarter Quarter EARNINGS EXCLUDING MERGER-RELATED AND RESTRUCTURING EXPENSES, AND DISCONTINUED OPERATIONS (a) (b) Return on
Slide 12: Consolidated Statements of Income
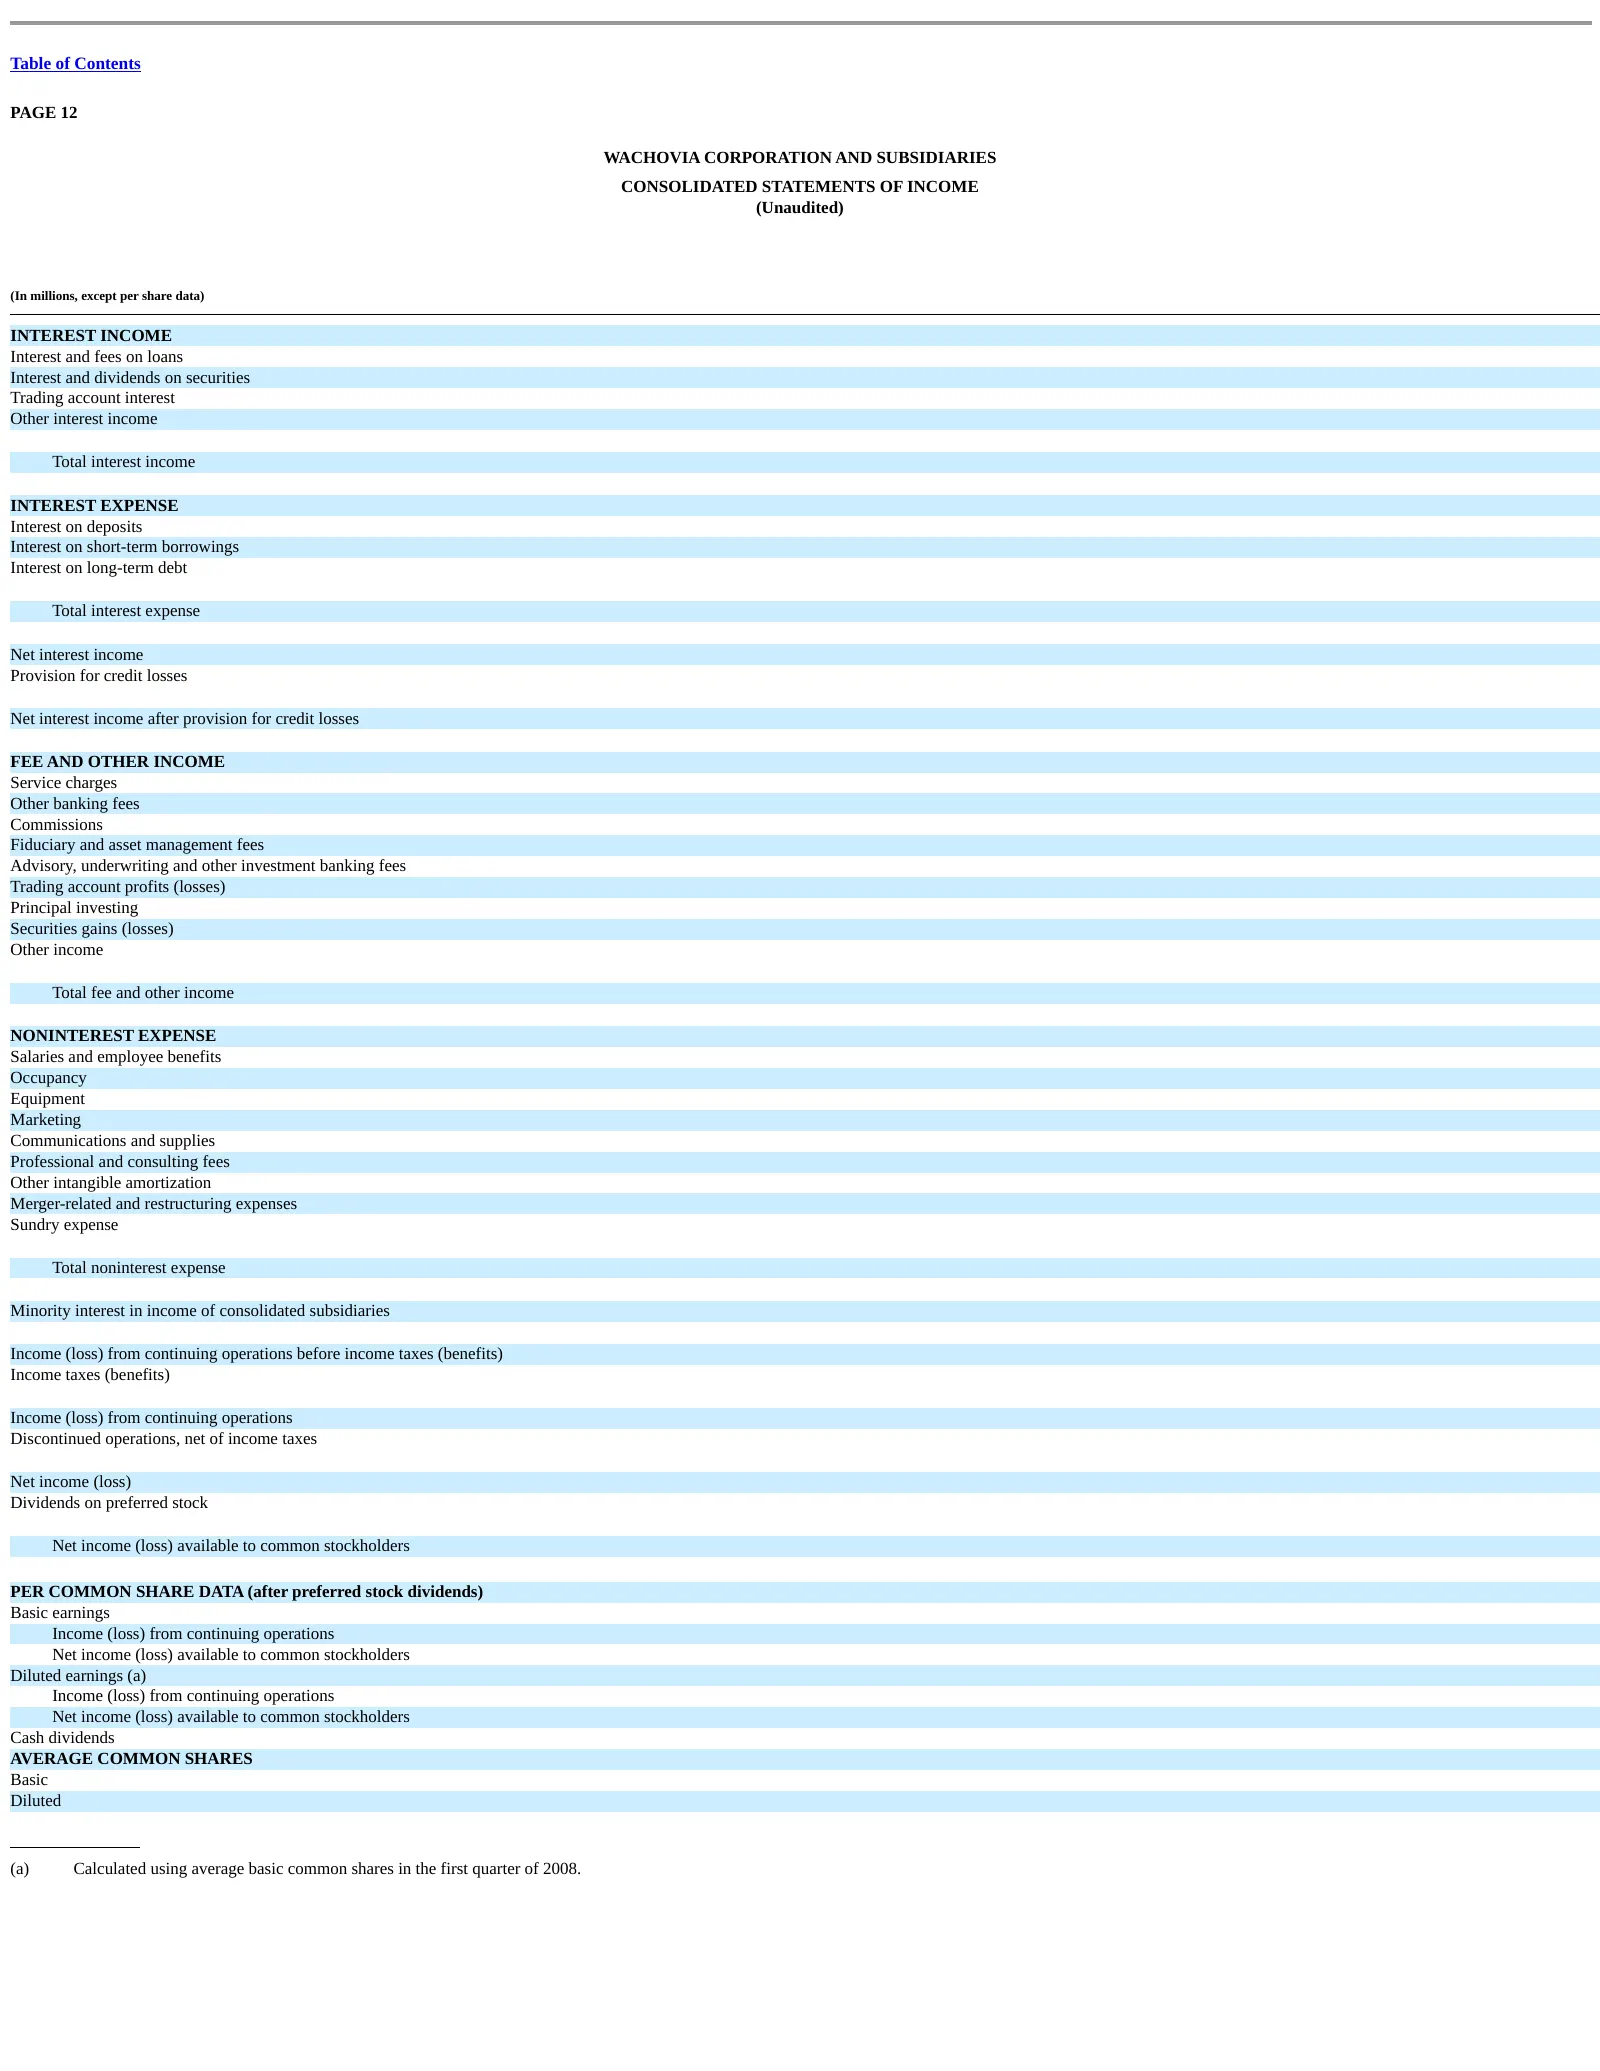
Table of Contents PAGE 12 WACHOVIA CORPORATION AND SUBSIDIARIES CONSOLIDATED STATEMENTS OF INCOME (Unaudited) (In millions, except per share data) INTEREST INCOME Interest and fees on loans Interest and dividends on securities Trading account interest Other interest income Total interest income INTE
Slide 13: Business Segments - Q1 2008
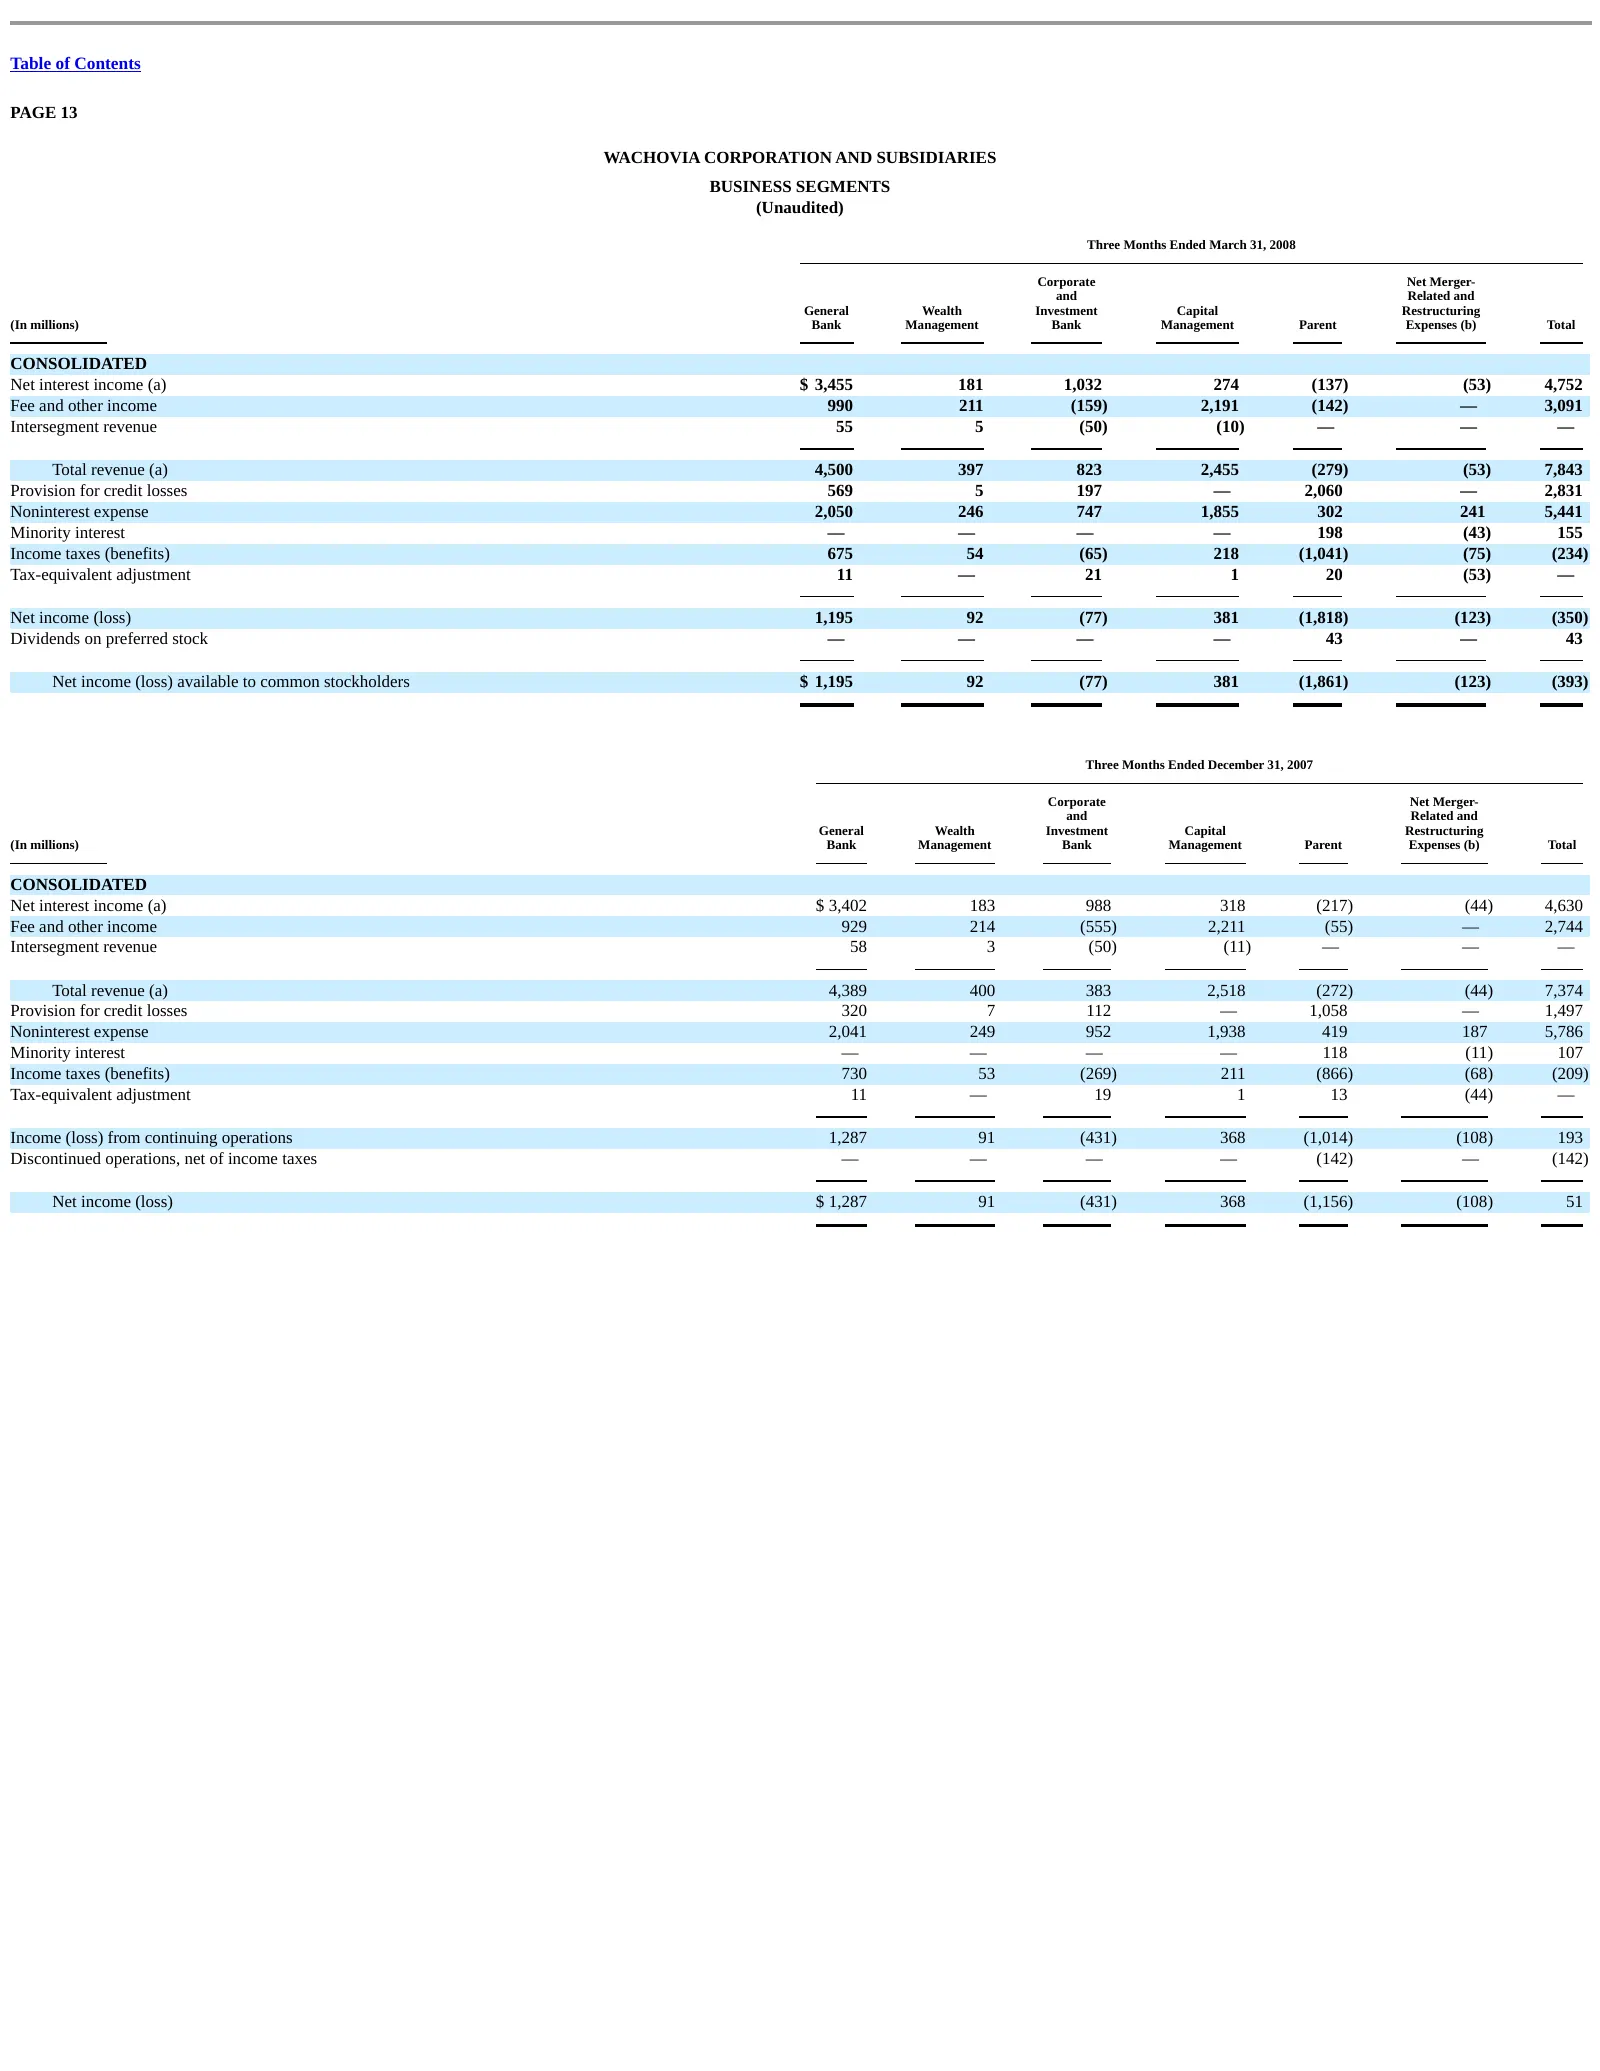
Table of Contents PAGE 13 WACHOVIA CORPORATION AND SUBSIDIARIES BUSINESS SEGMENTS (Unaudited) Three Months Ended March 31, 2008 Corporate Net Merger- and Related and General Wealth Investment Capital Restructuring (In millions) Bank Management Bank Management Parent Expenses (b) Total CONSOLIDATED N
Slide 14: Business Segments - Q1 2007
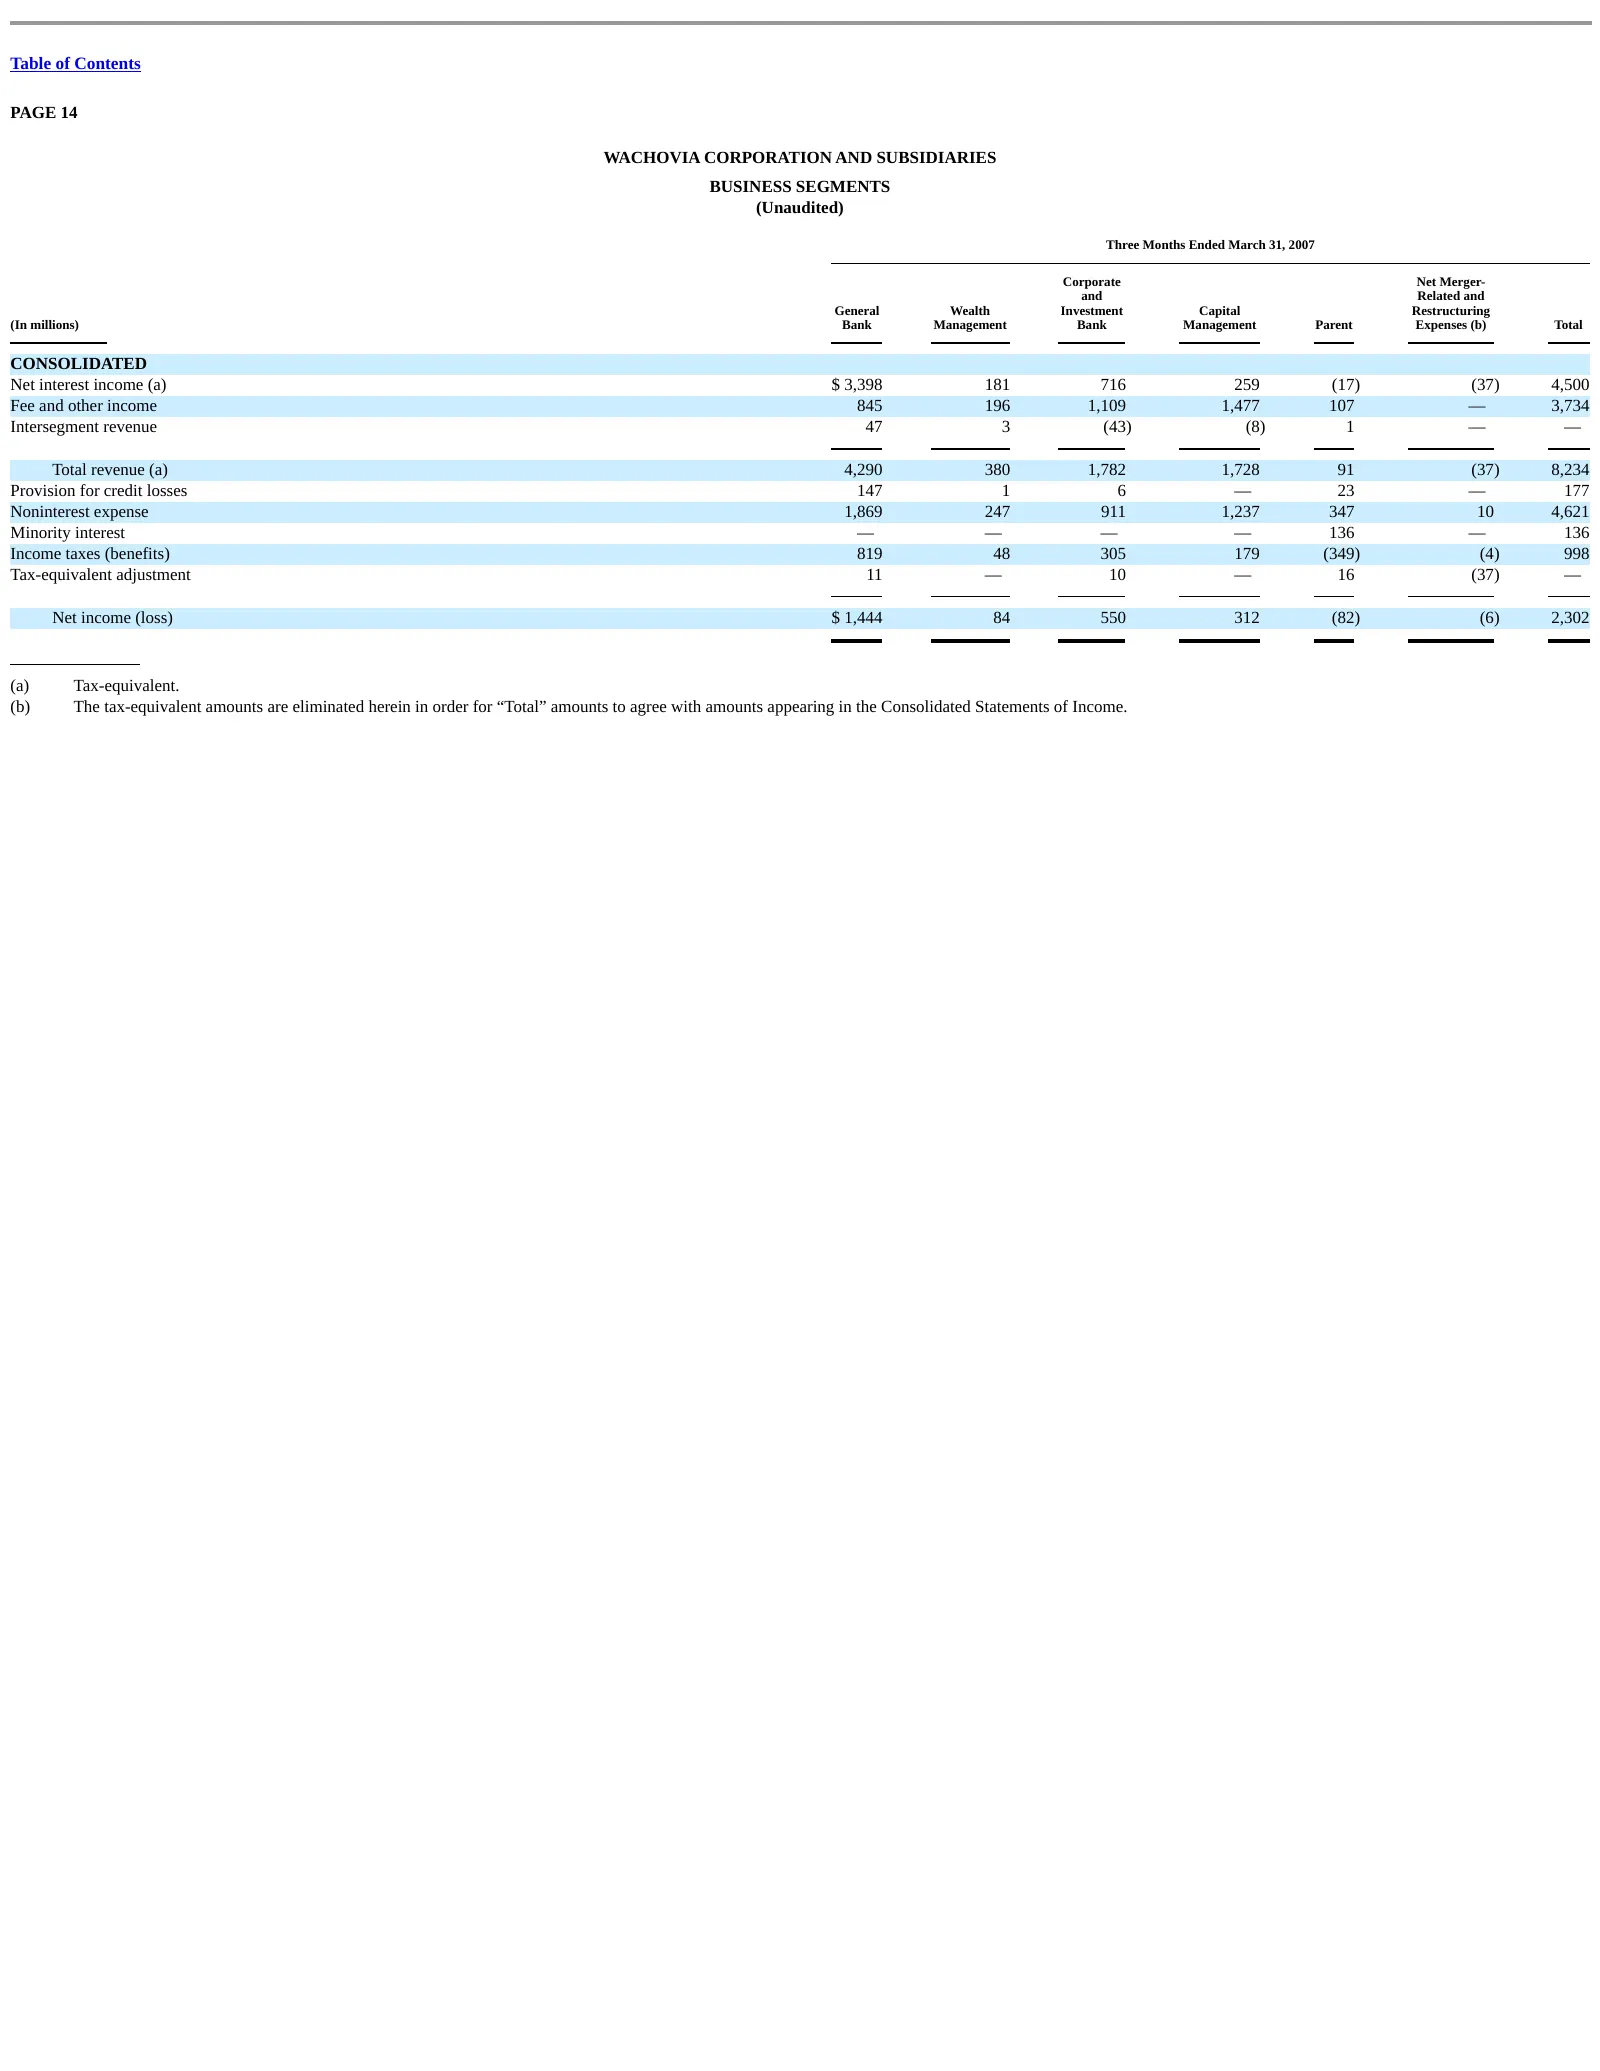
Table of Contents PAGE 14 WACHOVIA CORPORATION AND SUBSIDIARIES BUSINESS SEGMENTS (Unaudited) Three Months Ended March 31, 2007 Corporate Net Merger- and Related and General Wealth Investment Capital Restructuring (In millions) Bank Management Bank Management Parent Expenses (b) Total CONSOLIDATED N
Slide 15: Loans - On-Balance Sheet, Managed and Servicing Portfolios
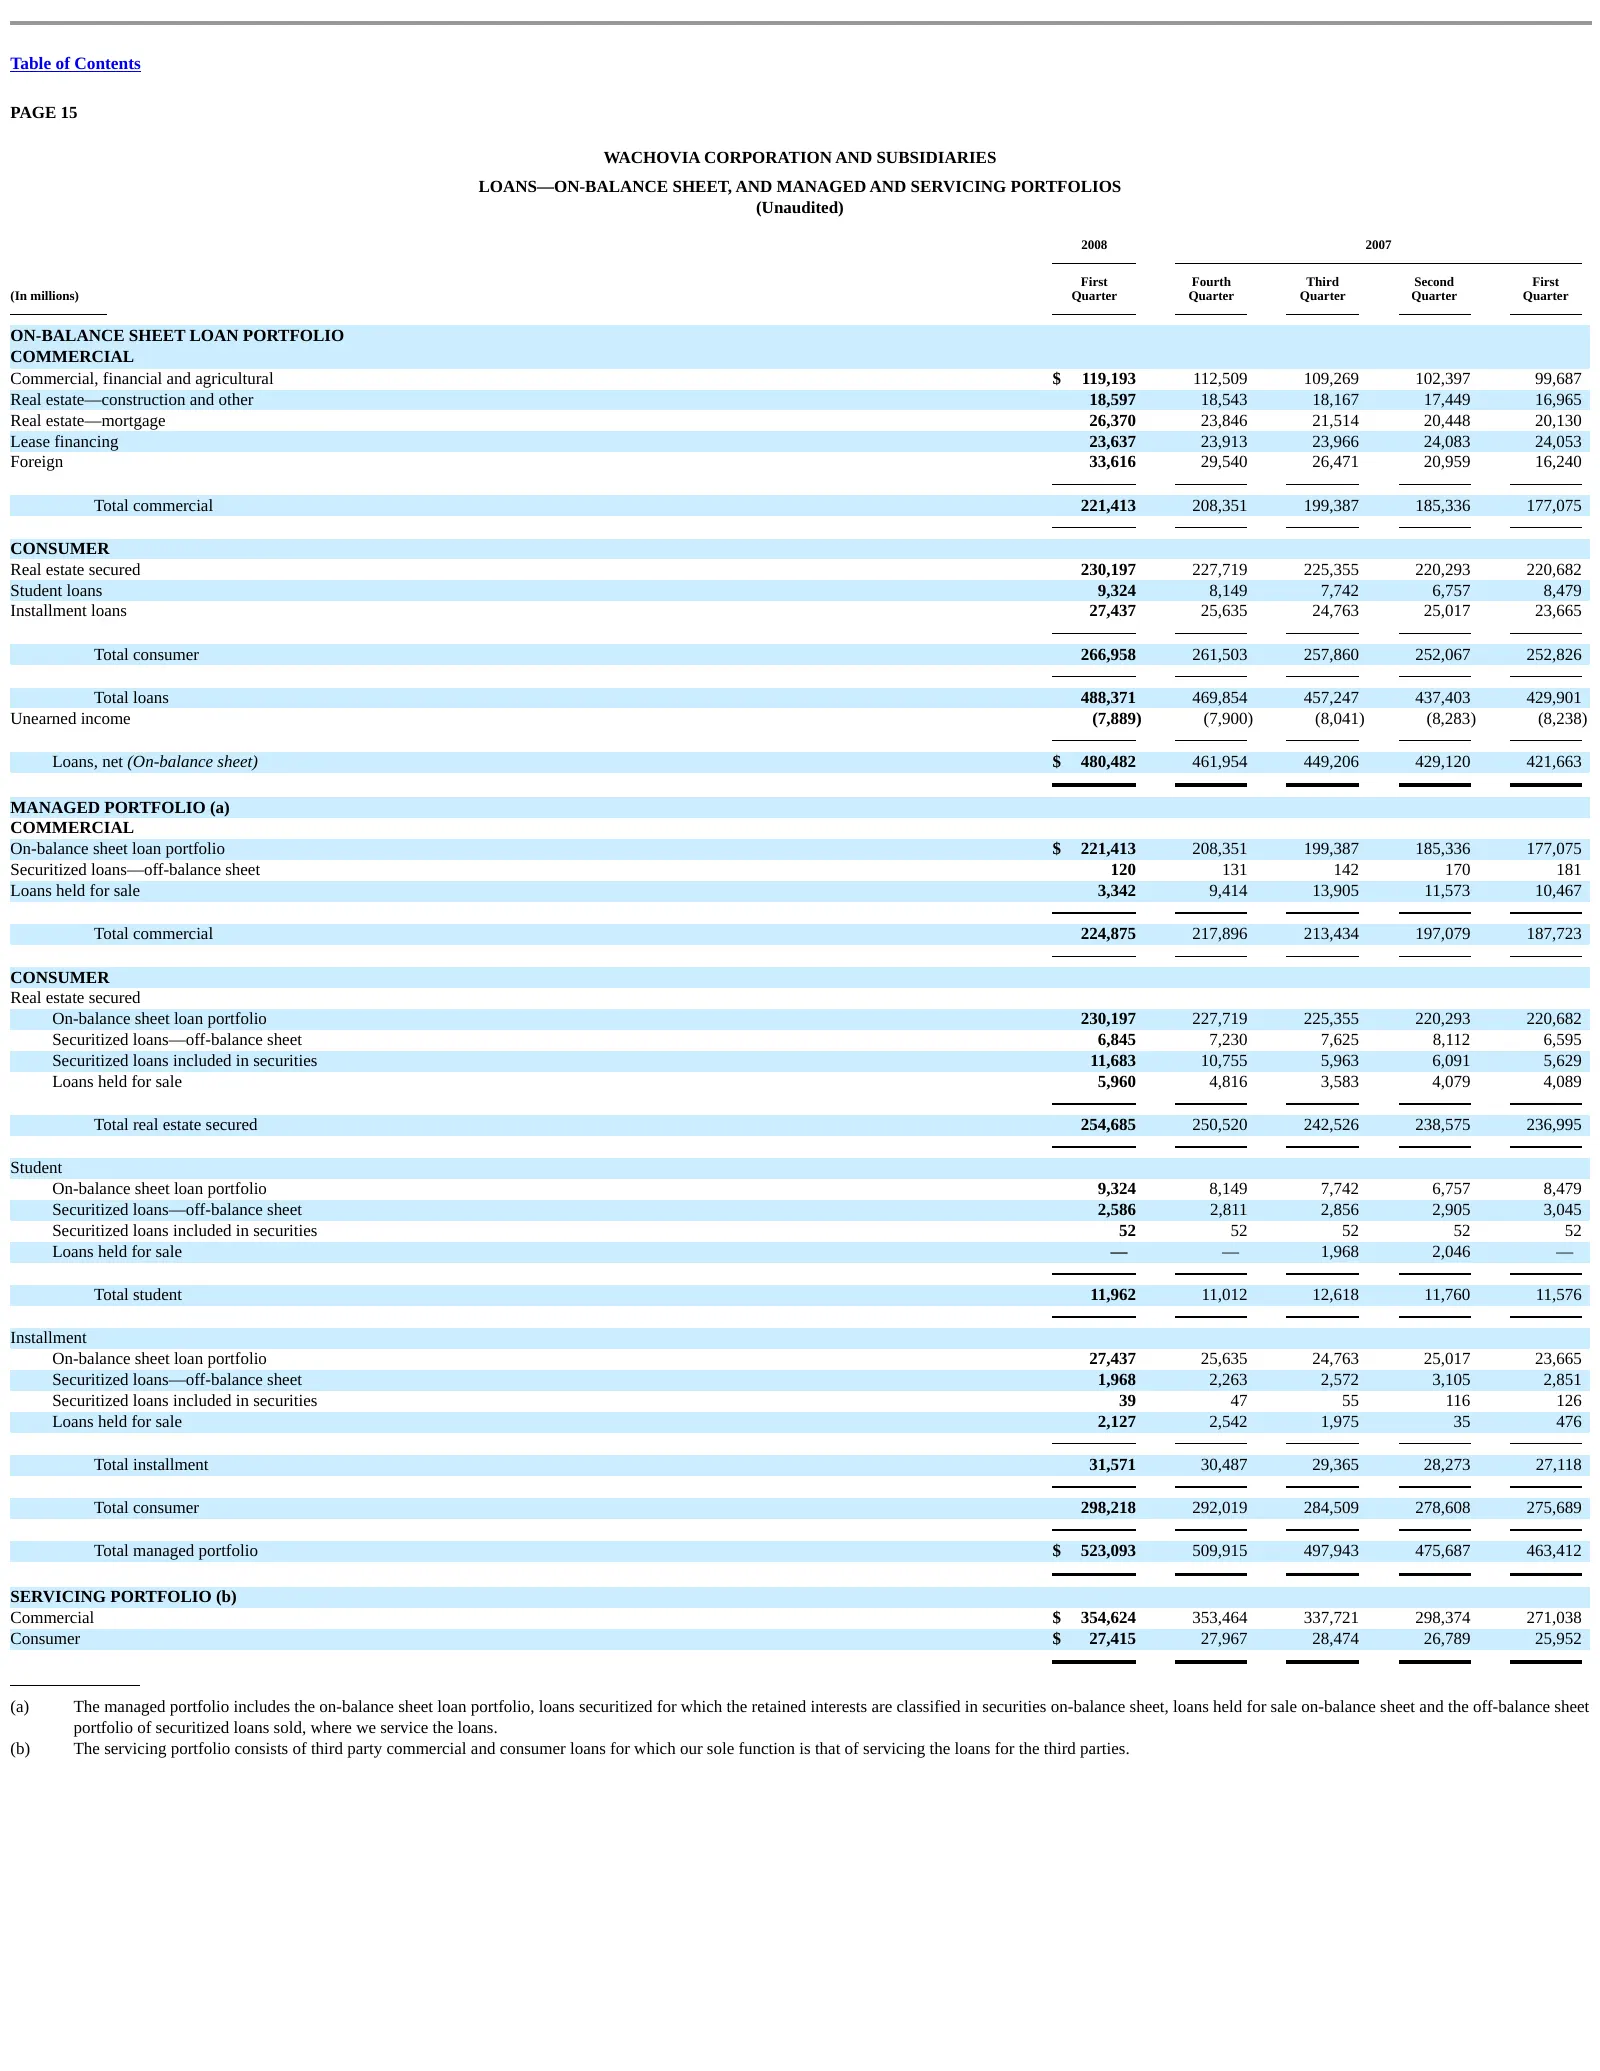
Table of Contents PAGE 15 WACHOVIA CORPORATION AND SUBSIDIARIES LOANS—ON-BALANCE SHEET, AND MANAGED AND SERVICING PORTFOLIOS (Unaudited) 2008 2007 First Fourth Third Second First (In millions) Quarter Quarter Quarter Quarter Quarter ON-BALANCE SHEET LOAN PORTFOLIO COMMERCIAL Commercial, financial an
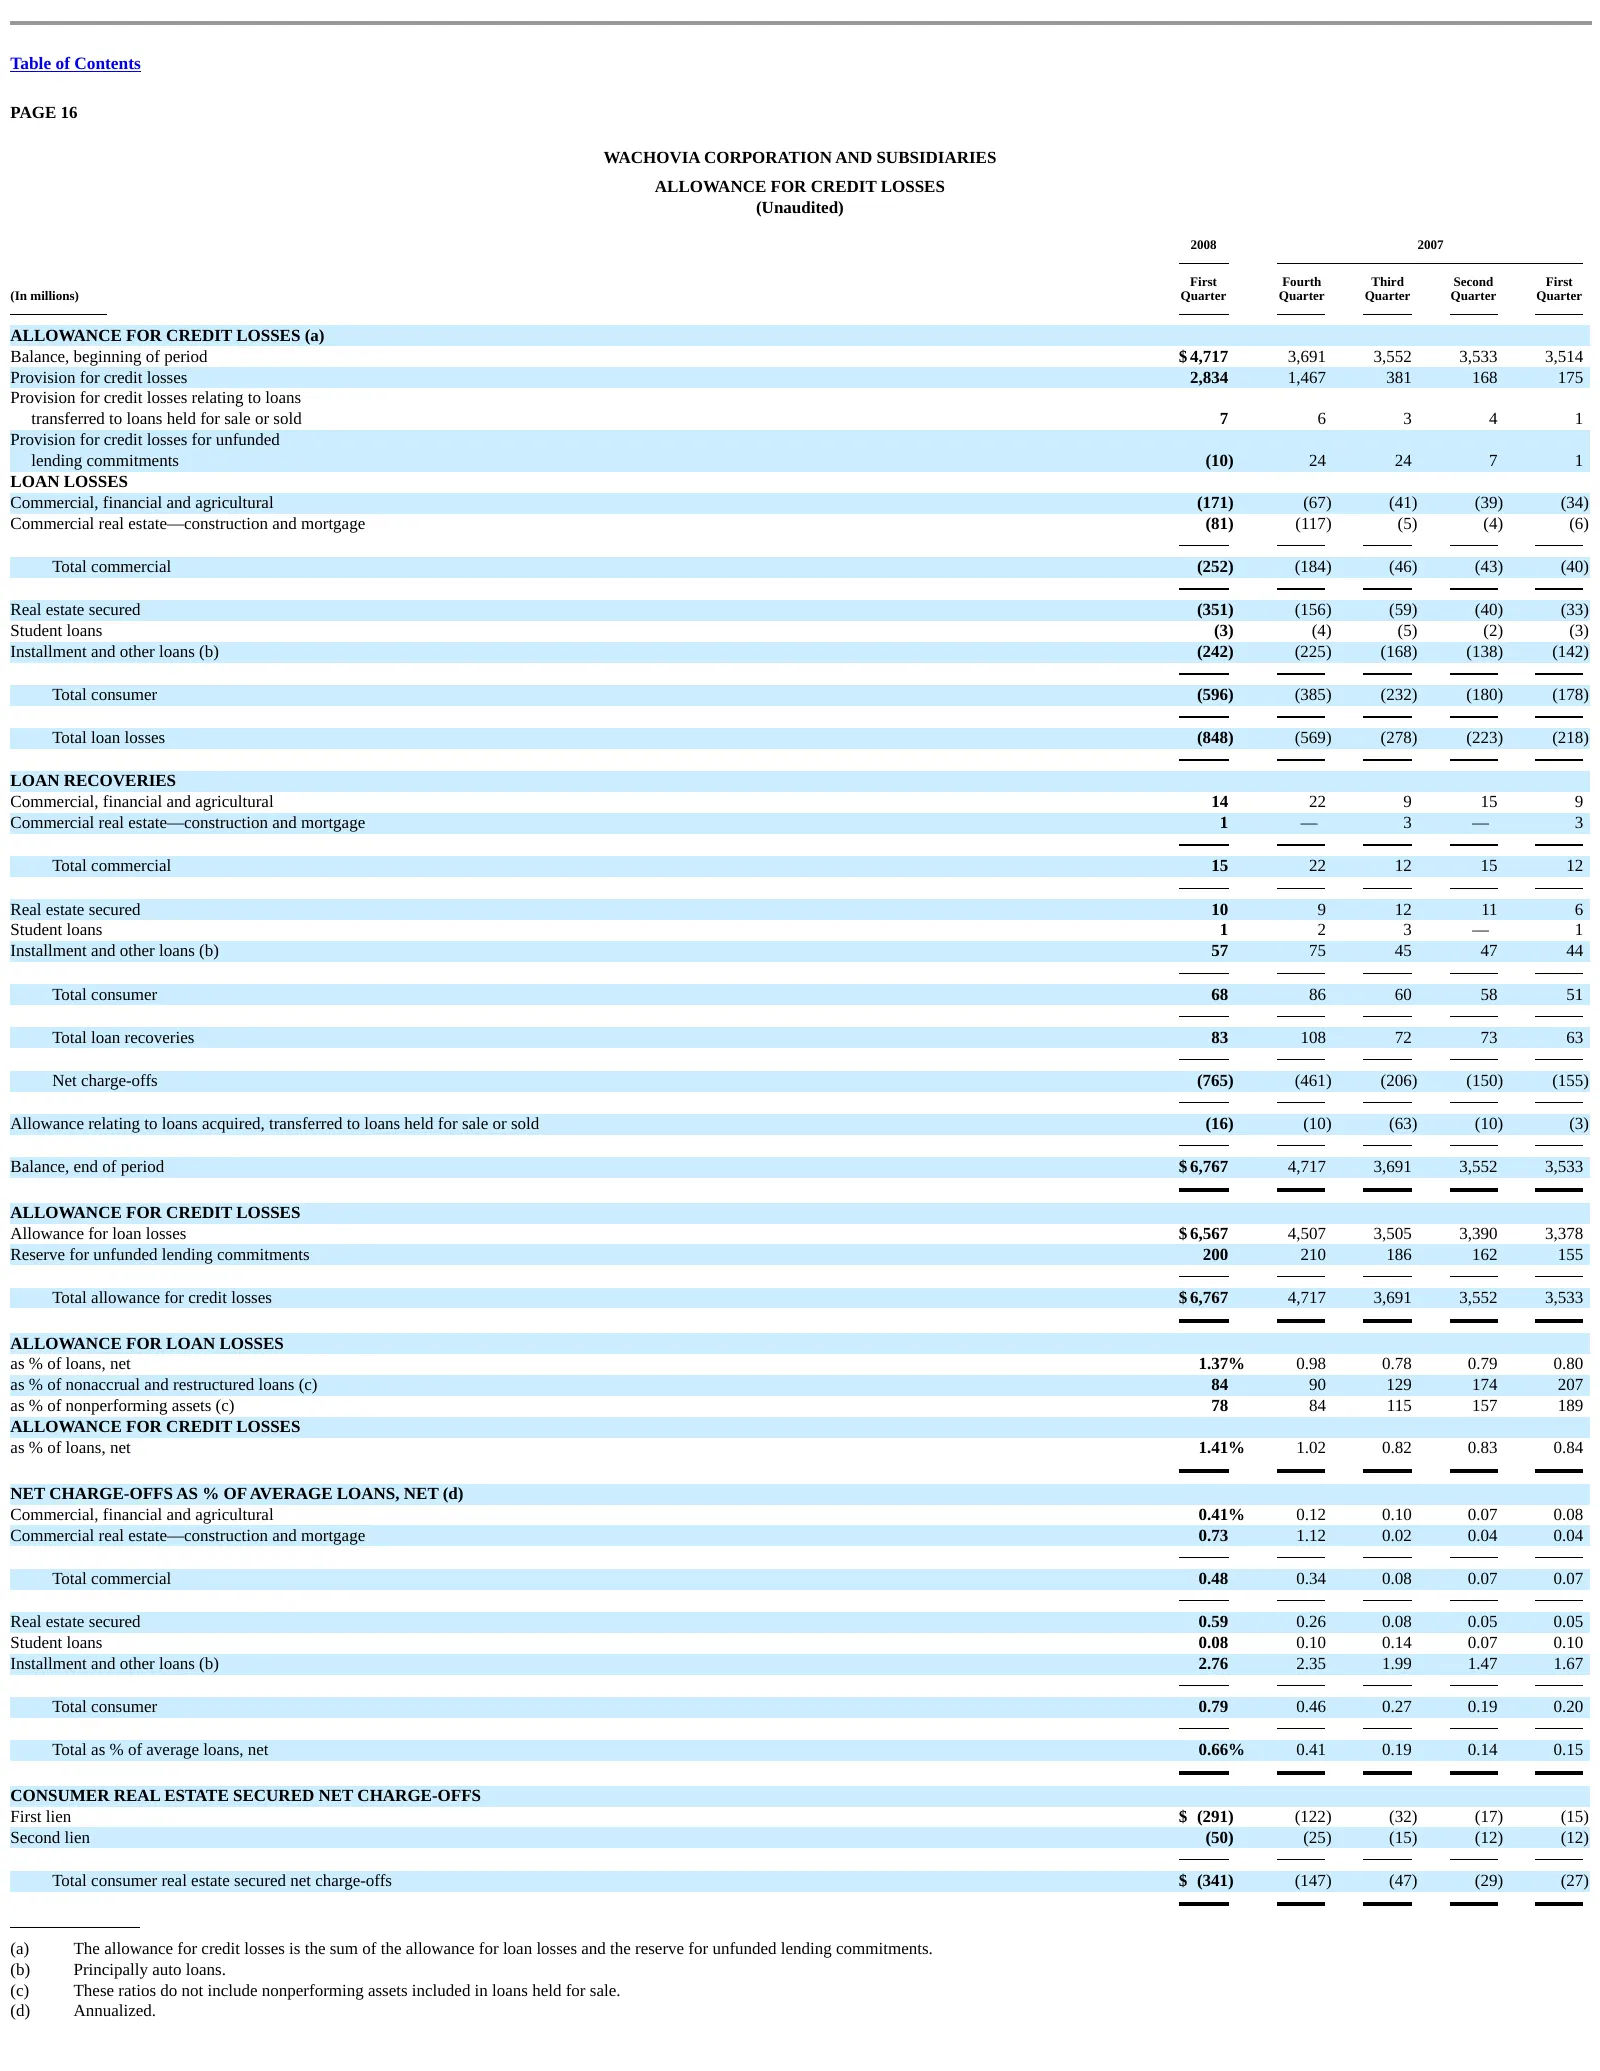
Slide 16: Allowance for Credit Losses
Table of Contents PAGE 16 WACHOVIA CORPORATION AND SUBSIDIARIES ALLOWANCE FOR CREDIT LOSSES (Unaudited) 2008 2007 First Fourth Third Second First (In millions) Quarter Quarter Quarter Quarter Quarter ALLOWANCE FOR CREDIT LOSSES (a) Balance, beginning of period $ 4,717 3,691 3,552 3,533 3,514 Provisi
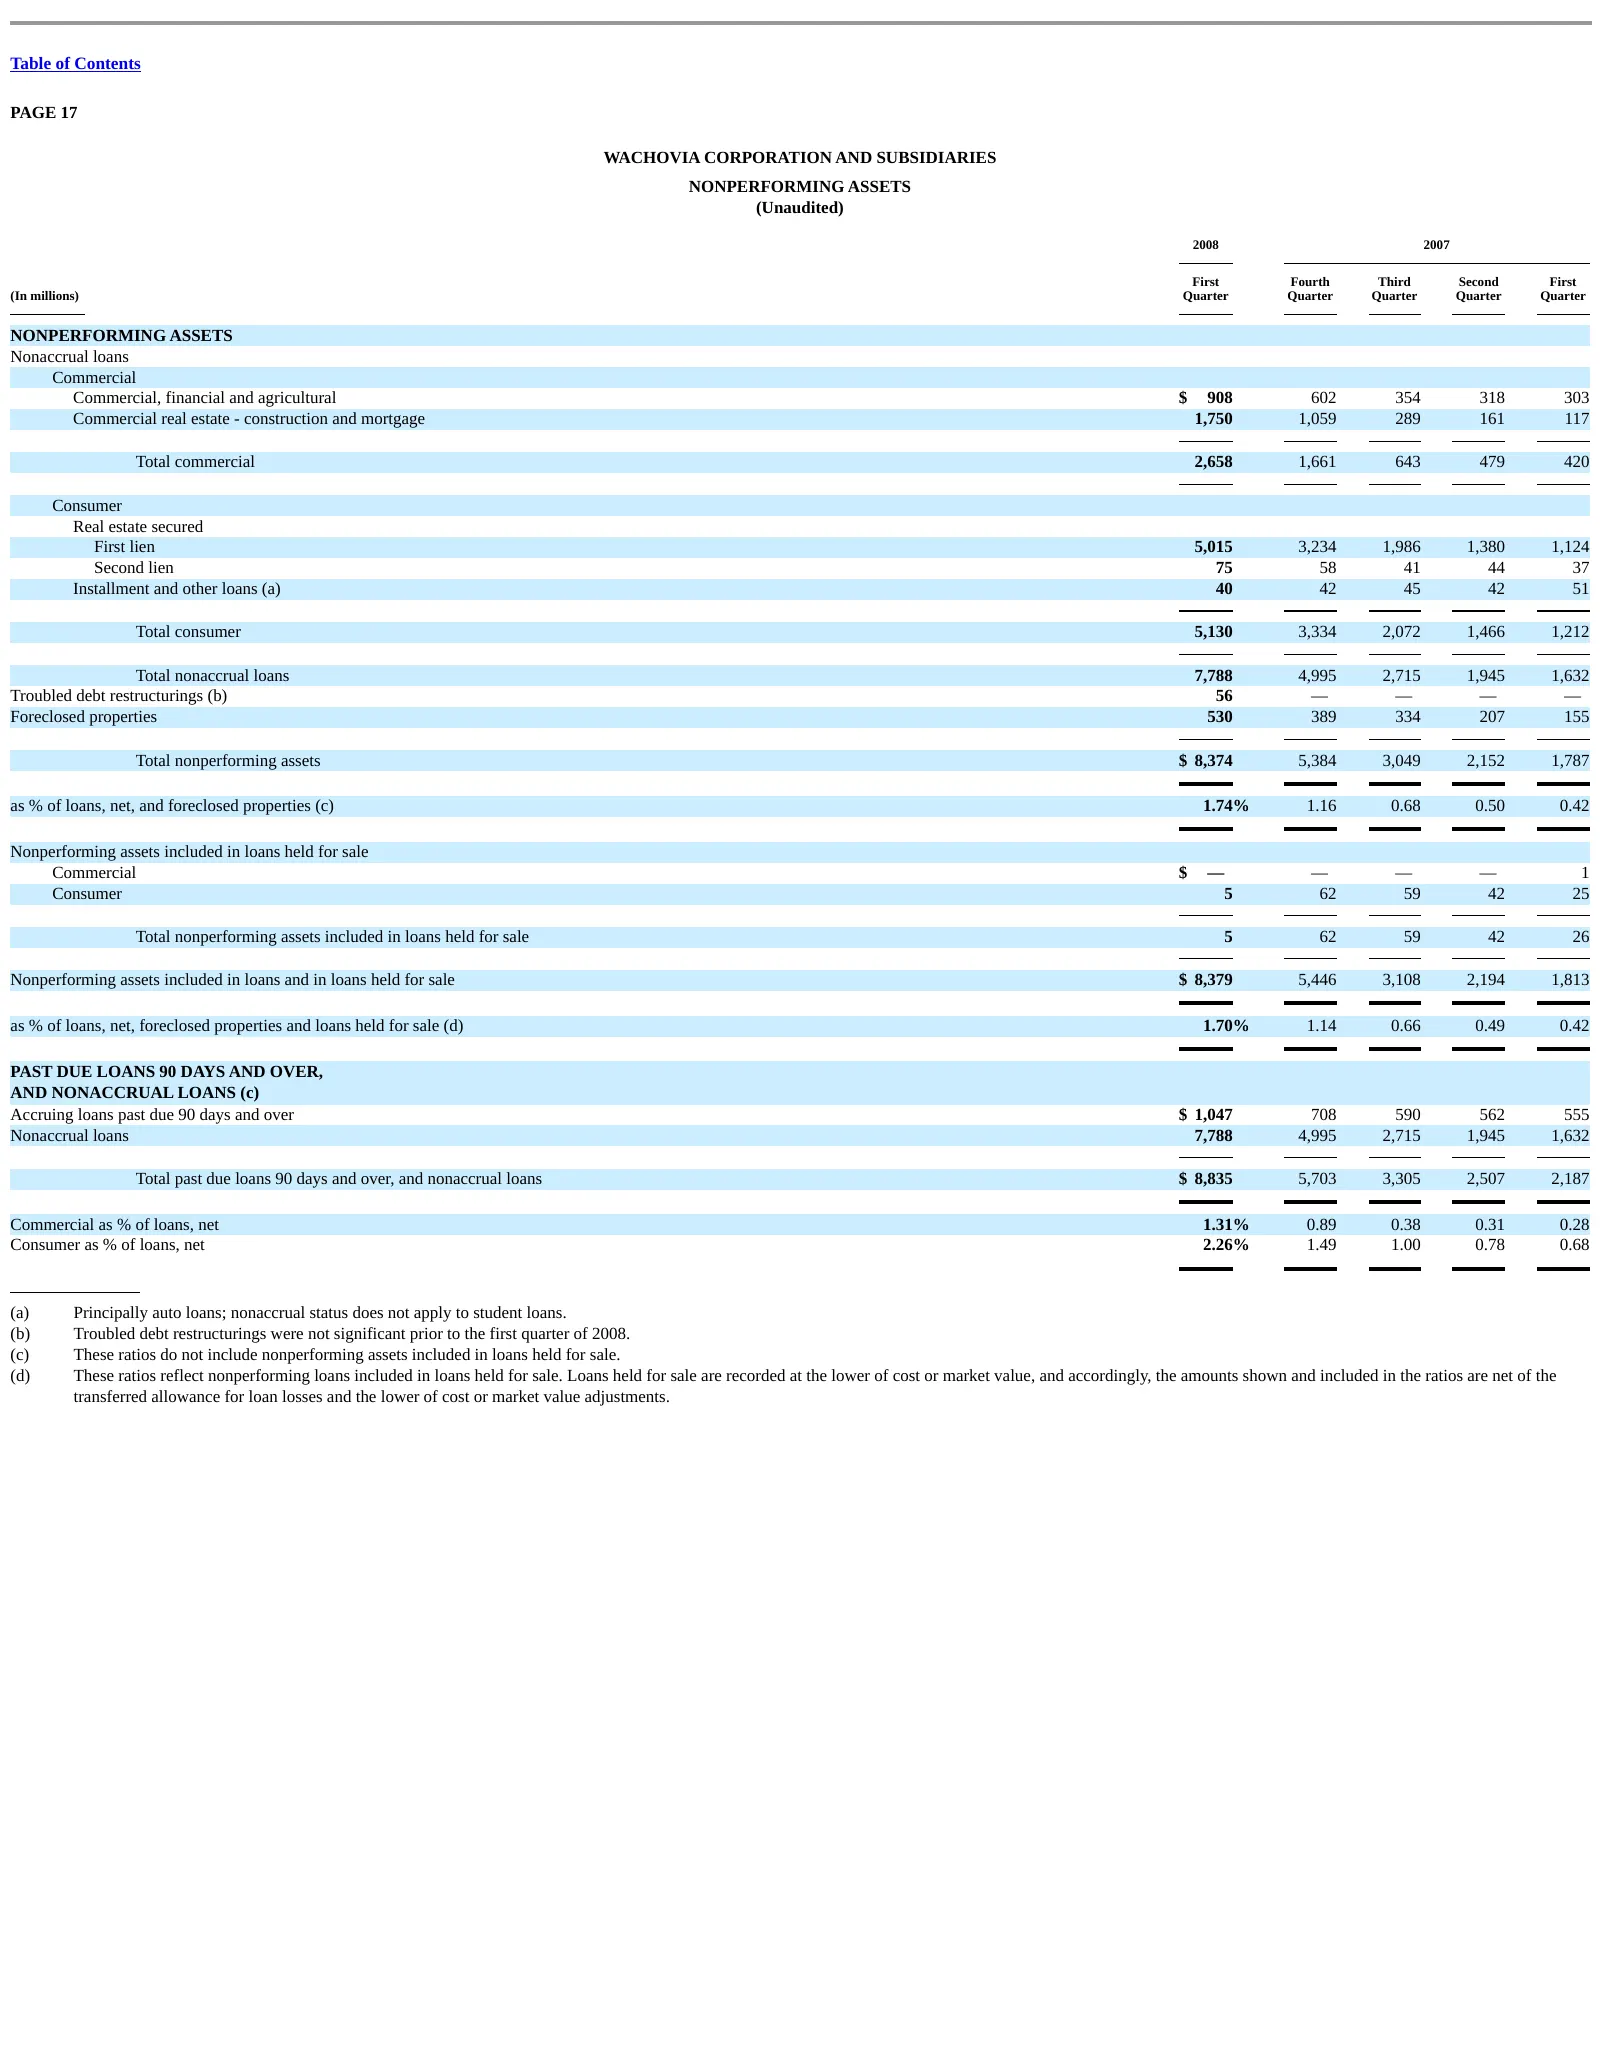
Slide 17: Nonperforming Assets
Table of Contents PAGE 17 WACHOVIA CORPORATION AND SUBSIDIARIES NONPERFORMING ASSETS (Unaudited) 2008 2007 First Fourth Third Second First (In millions) Quarter Quarter Quarter Quarter Quarter NONPERFORMING ASSETS Nonaccrual loans Commercial Commercial, financial and agricultural $ 908 602 354 318 3
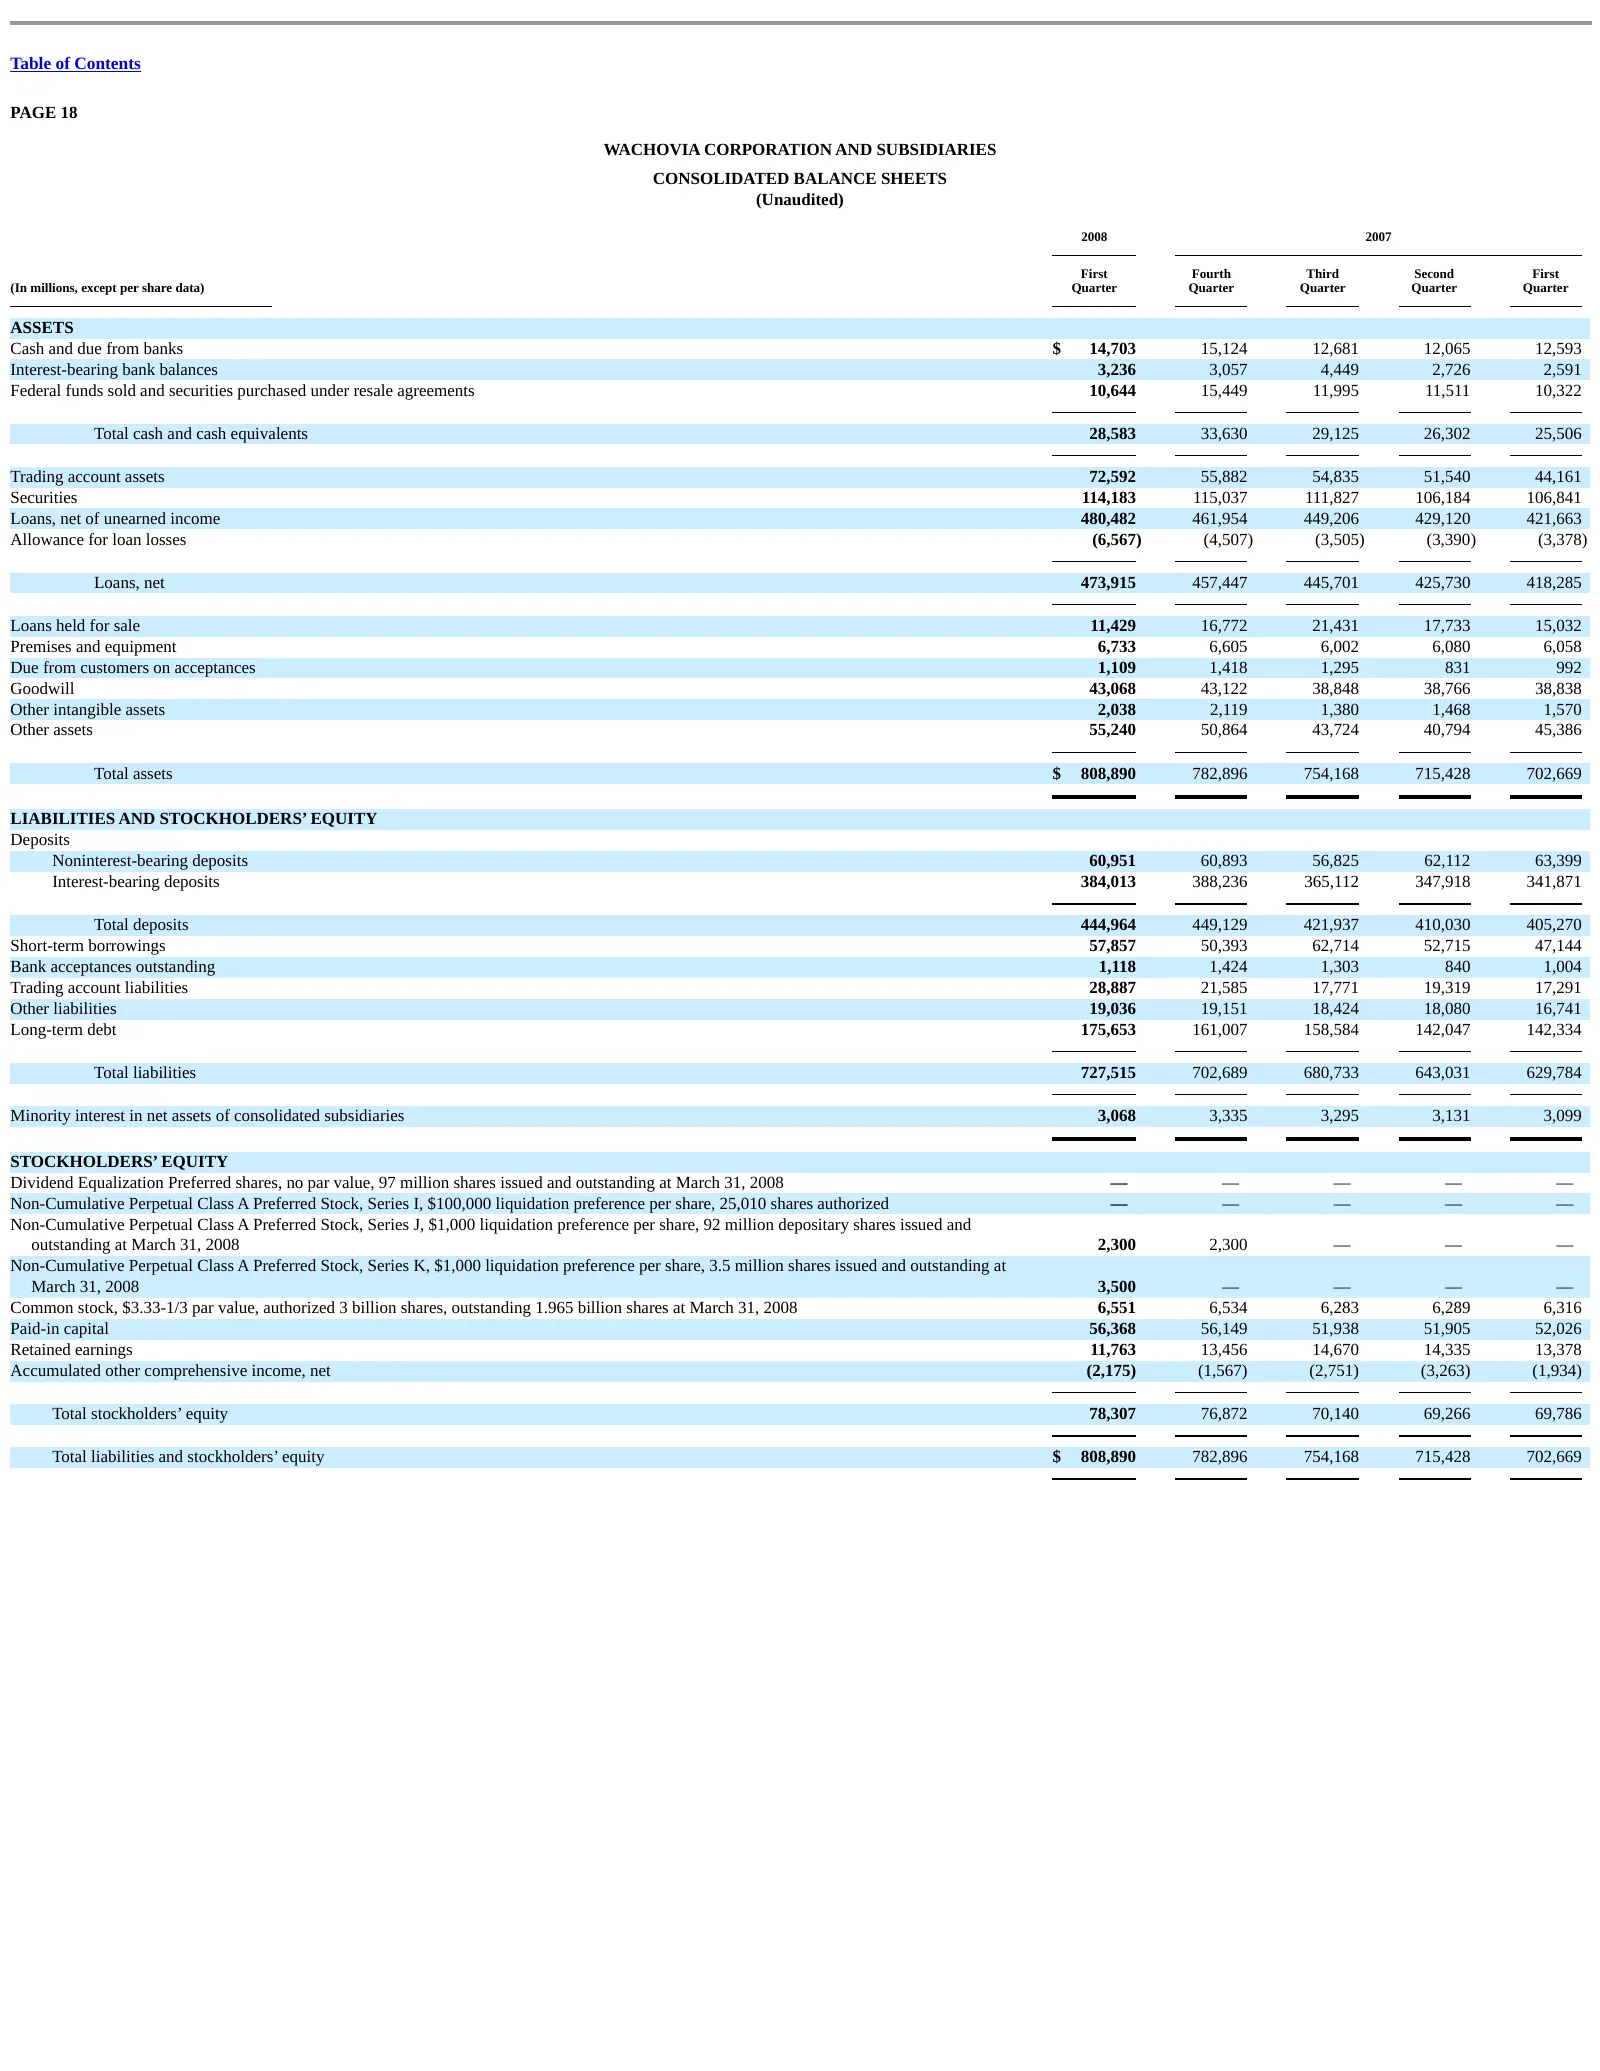
Slide 18: Consolidated Balance Sheets
Table of Contents PAGE 18 WACHOVIA CORPORATION AND SUBSIDIARIES CONSOLIDATED BALANCE SHEETS (Unaudited) 2008 2007 First Fourth Third Second First (In millions, except per share data) Quarter Quarter Quarter Quarter Quarter ASSETS Cash and due from banks $ 14,703 15,124 12,681 12,065 12,593 Interest-
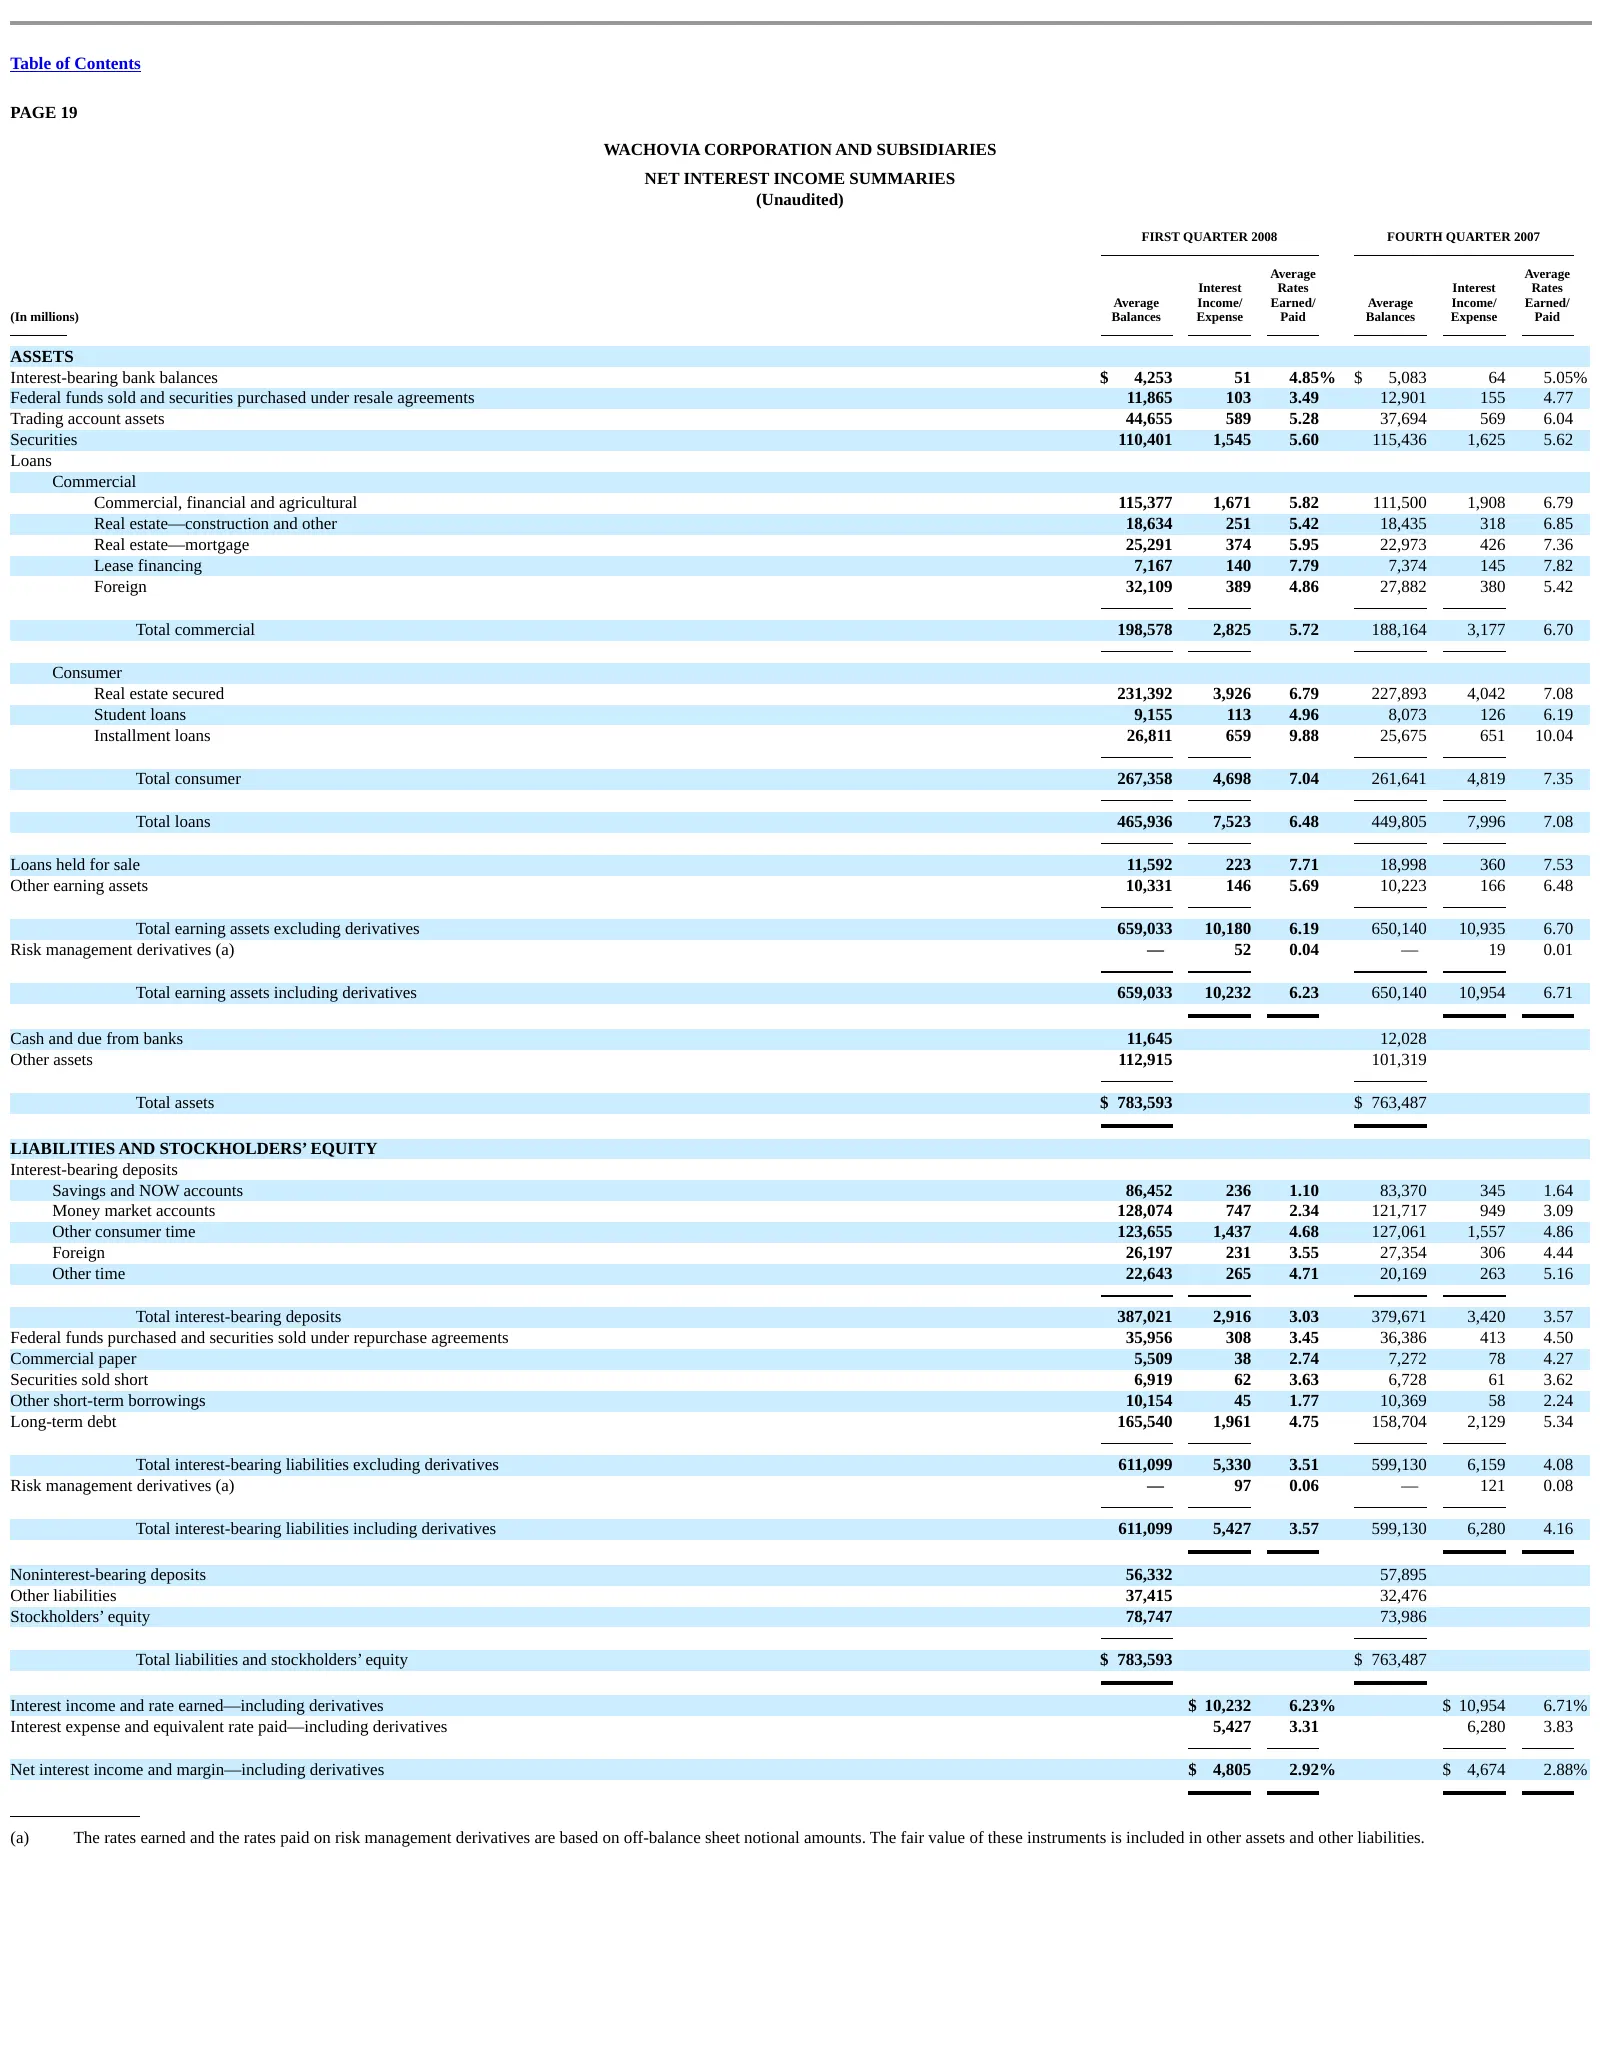
Slide 19: Net Interest Income Summaries
Table of Contents PAGE 19 WACHOVIA CORPORATION AND SUBSIDIARIES NET INTEREST INCOME SUMMARIES (Unaudited) FIRST QUARTER 2008 FOURTH QUARTER 2007 Average Average Interest Rates Interest Rates Average Income/ Earned/ Average Income/ Earned/ (In millions) Balances Expense Paid Balances Expense Paid ASS
Slide 20: Net Interest Income Summaries (continued)
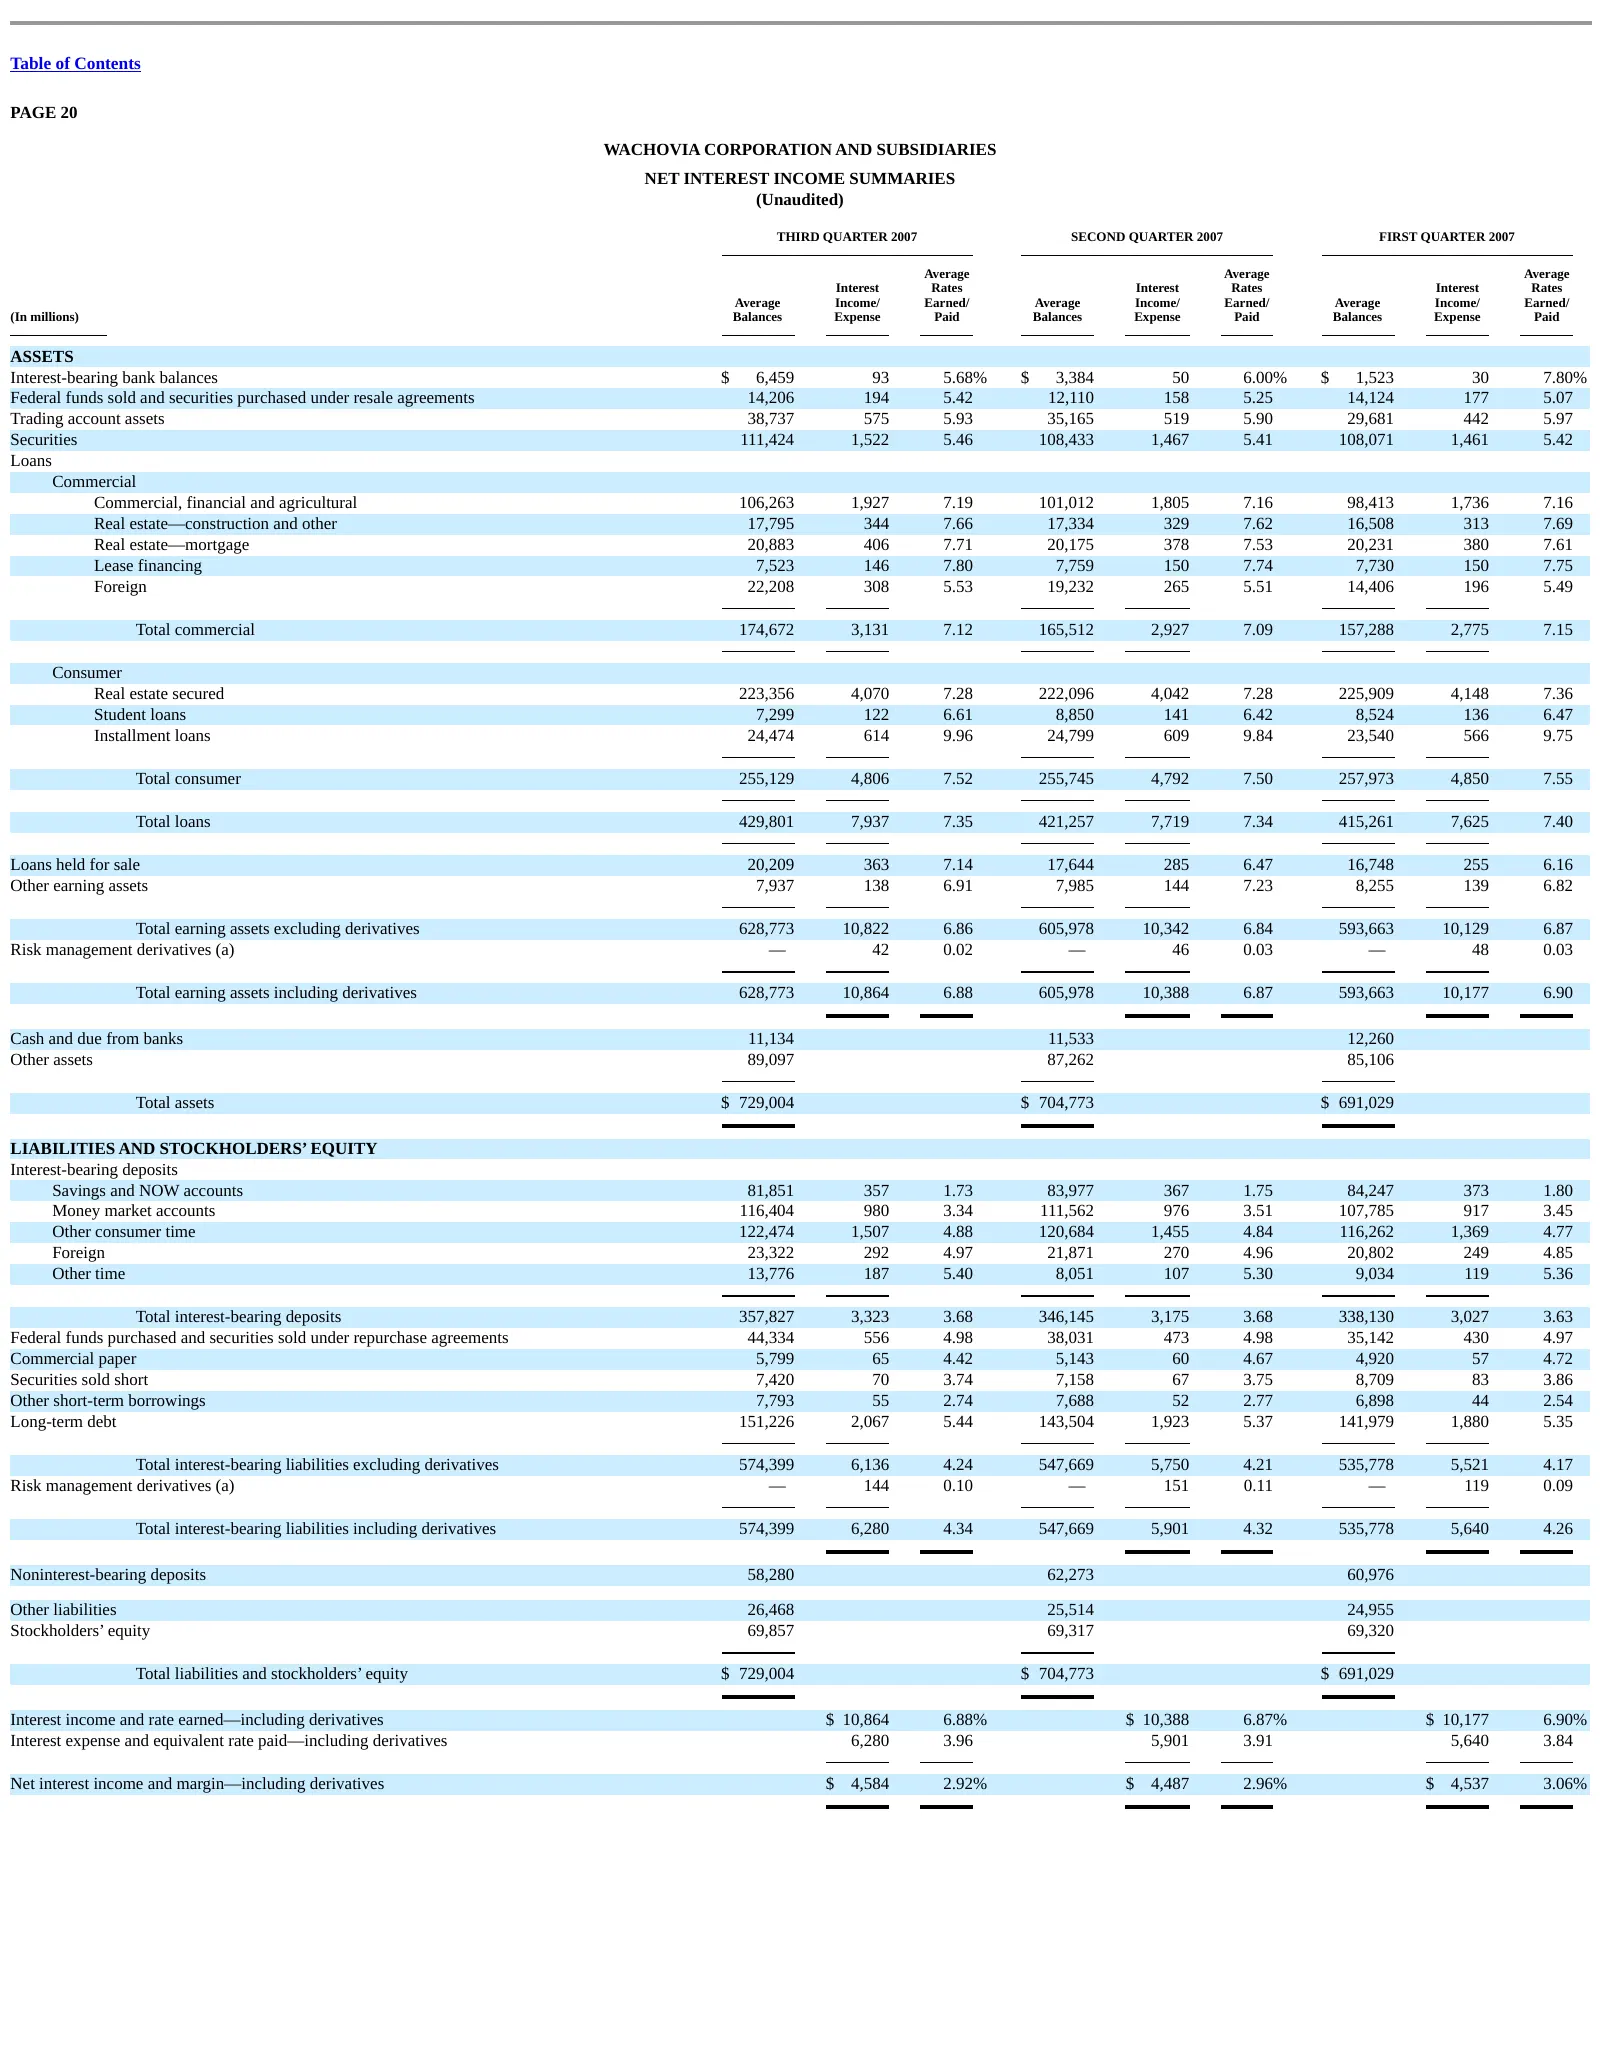
Table of Contents PAGE 20 WACHOVIA CORPORATION AND SUBSIDIARIES NET INTEREST INCOME SUMMARIES (Unaudited) THIRD QUARTER 2007 SECOND QUARTER 2007 FIRST QUARTER 2007 Average Average Average Interest Rates Interest Rates Interest Rates Average Income/ Earned/ Average Income/ Earned/ Average Income/ Ear
Slide 21: Reconciliation of Certain Non-GAAP Financial Measures
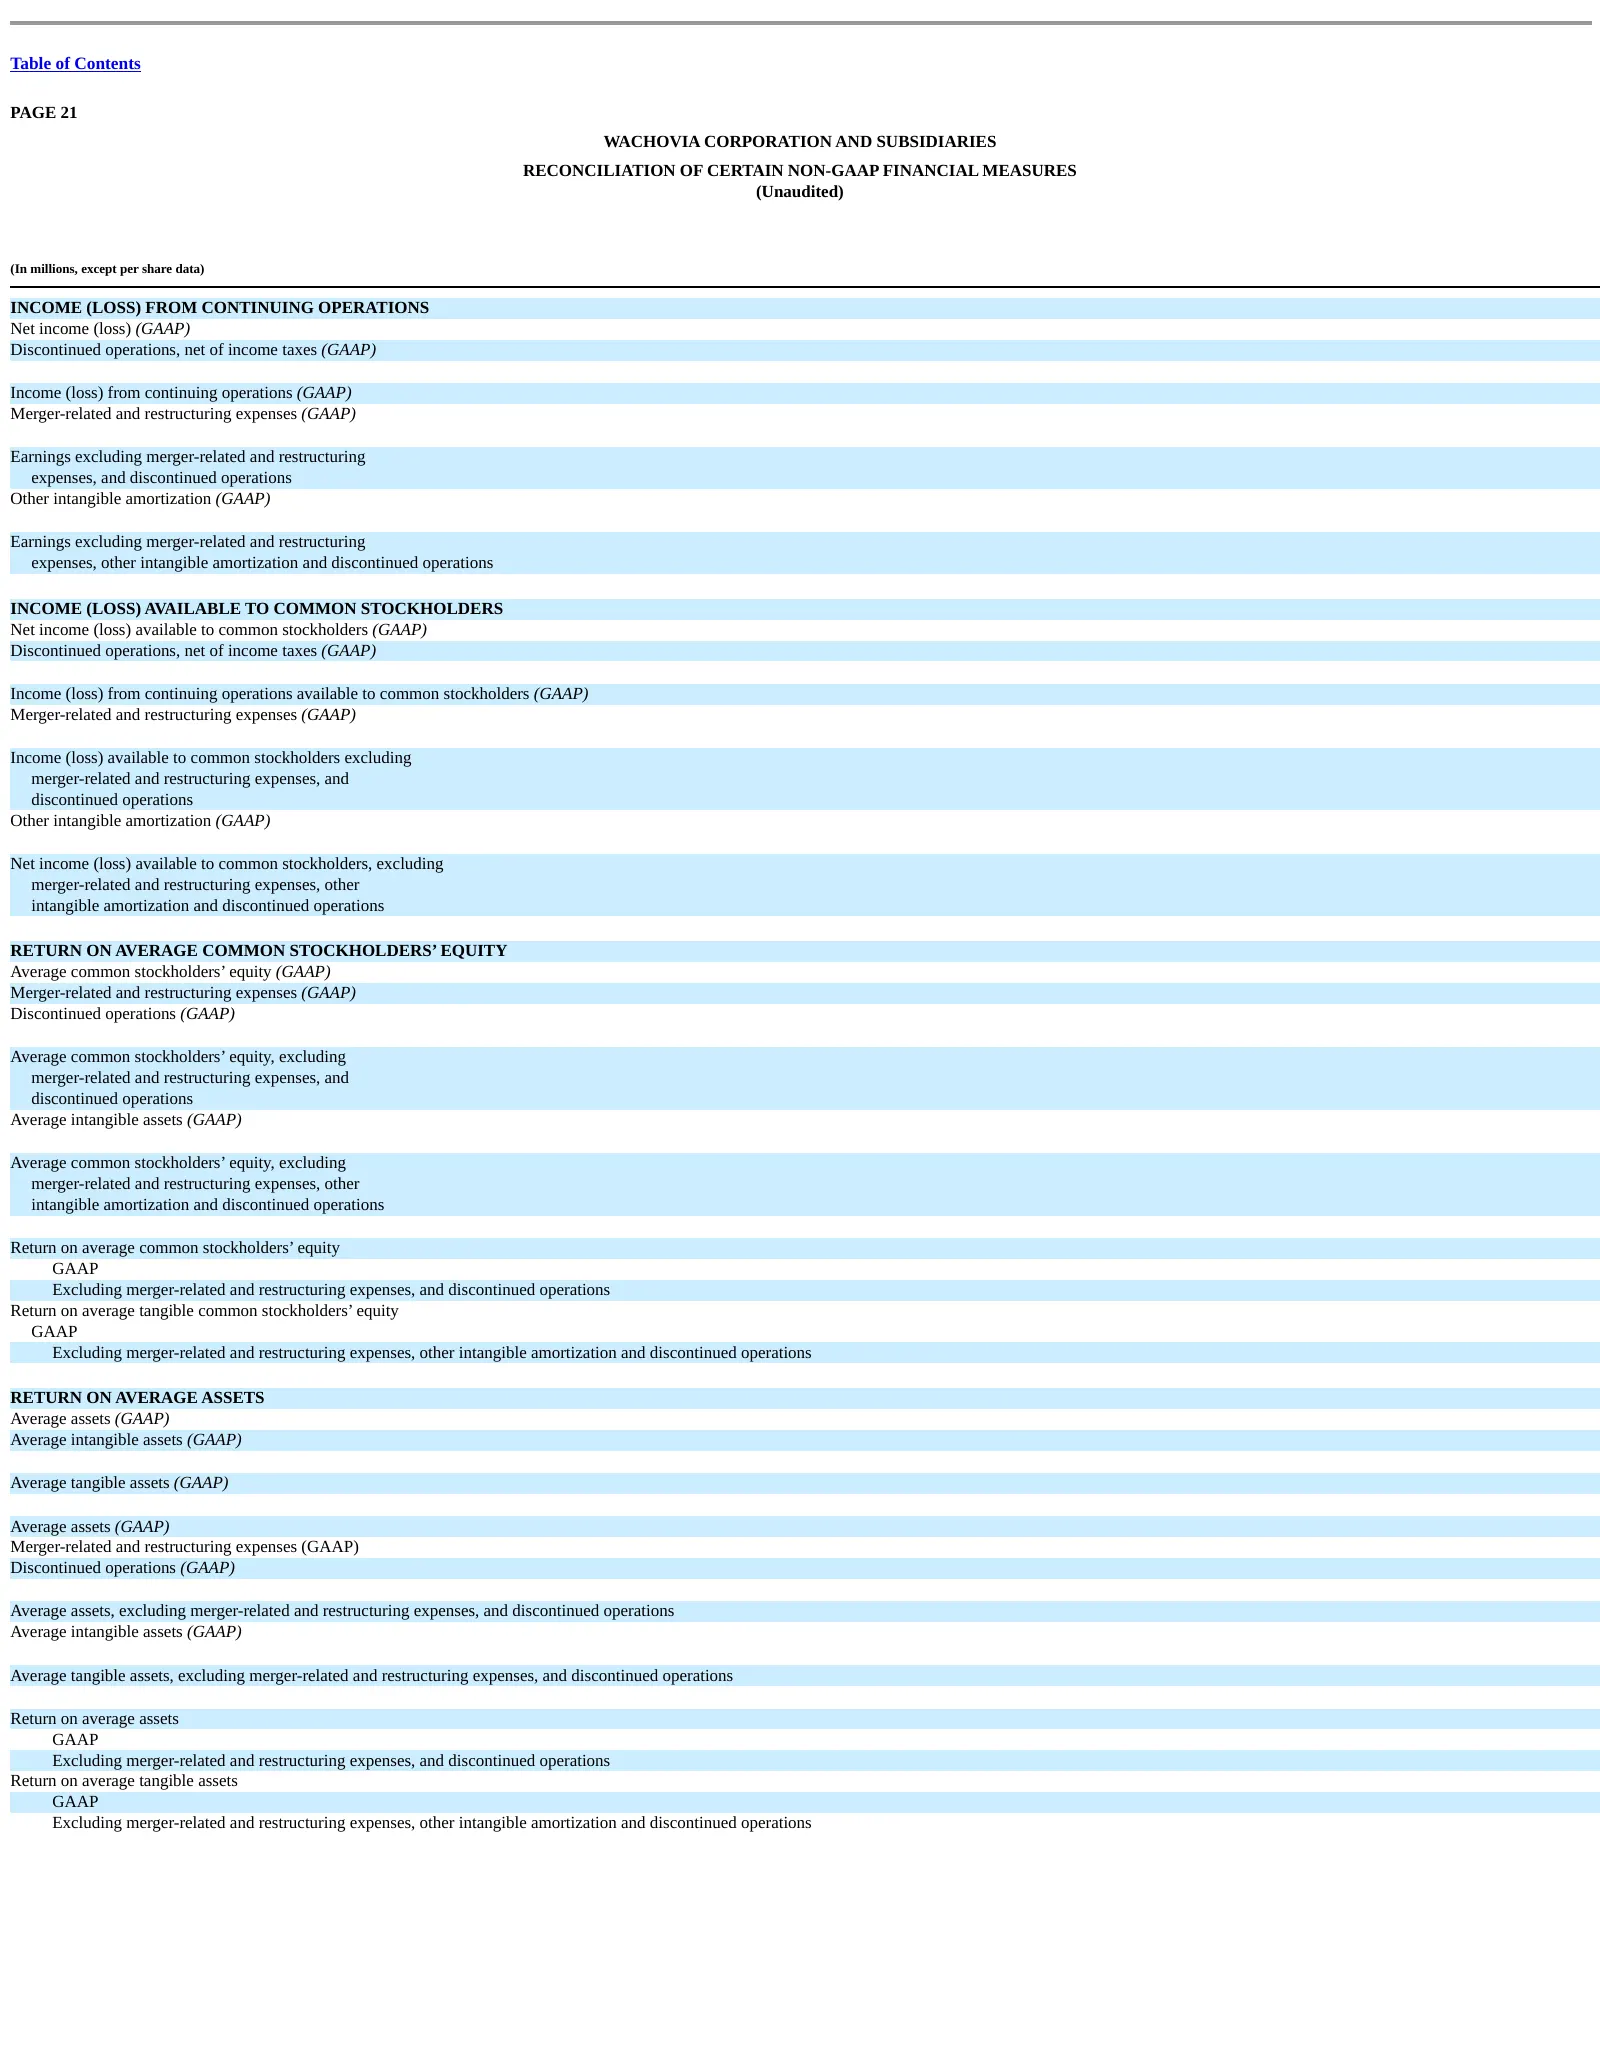
Table of Contents PAGE 21 WACHOVIA CORPORATION AND SUBSIDIARIES RECONCILIATION OF CERTAIN NON-GAAP FINANCIAL MEASURES (Unaudited) (In millions, except per share data) INCOME (LOSS) FROM CONTINUING OPERATIONS Net income (loss) (GAAP) Discontinued operations, net of income taxes (GAAP) Income (loss) f
Slide 22: Reconciliation of Certain Non-GAAP Financial Measures (continued)
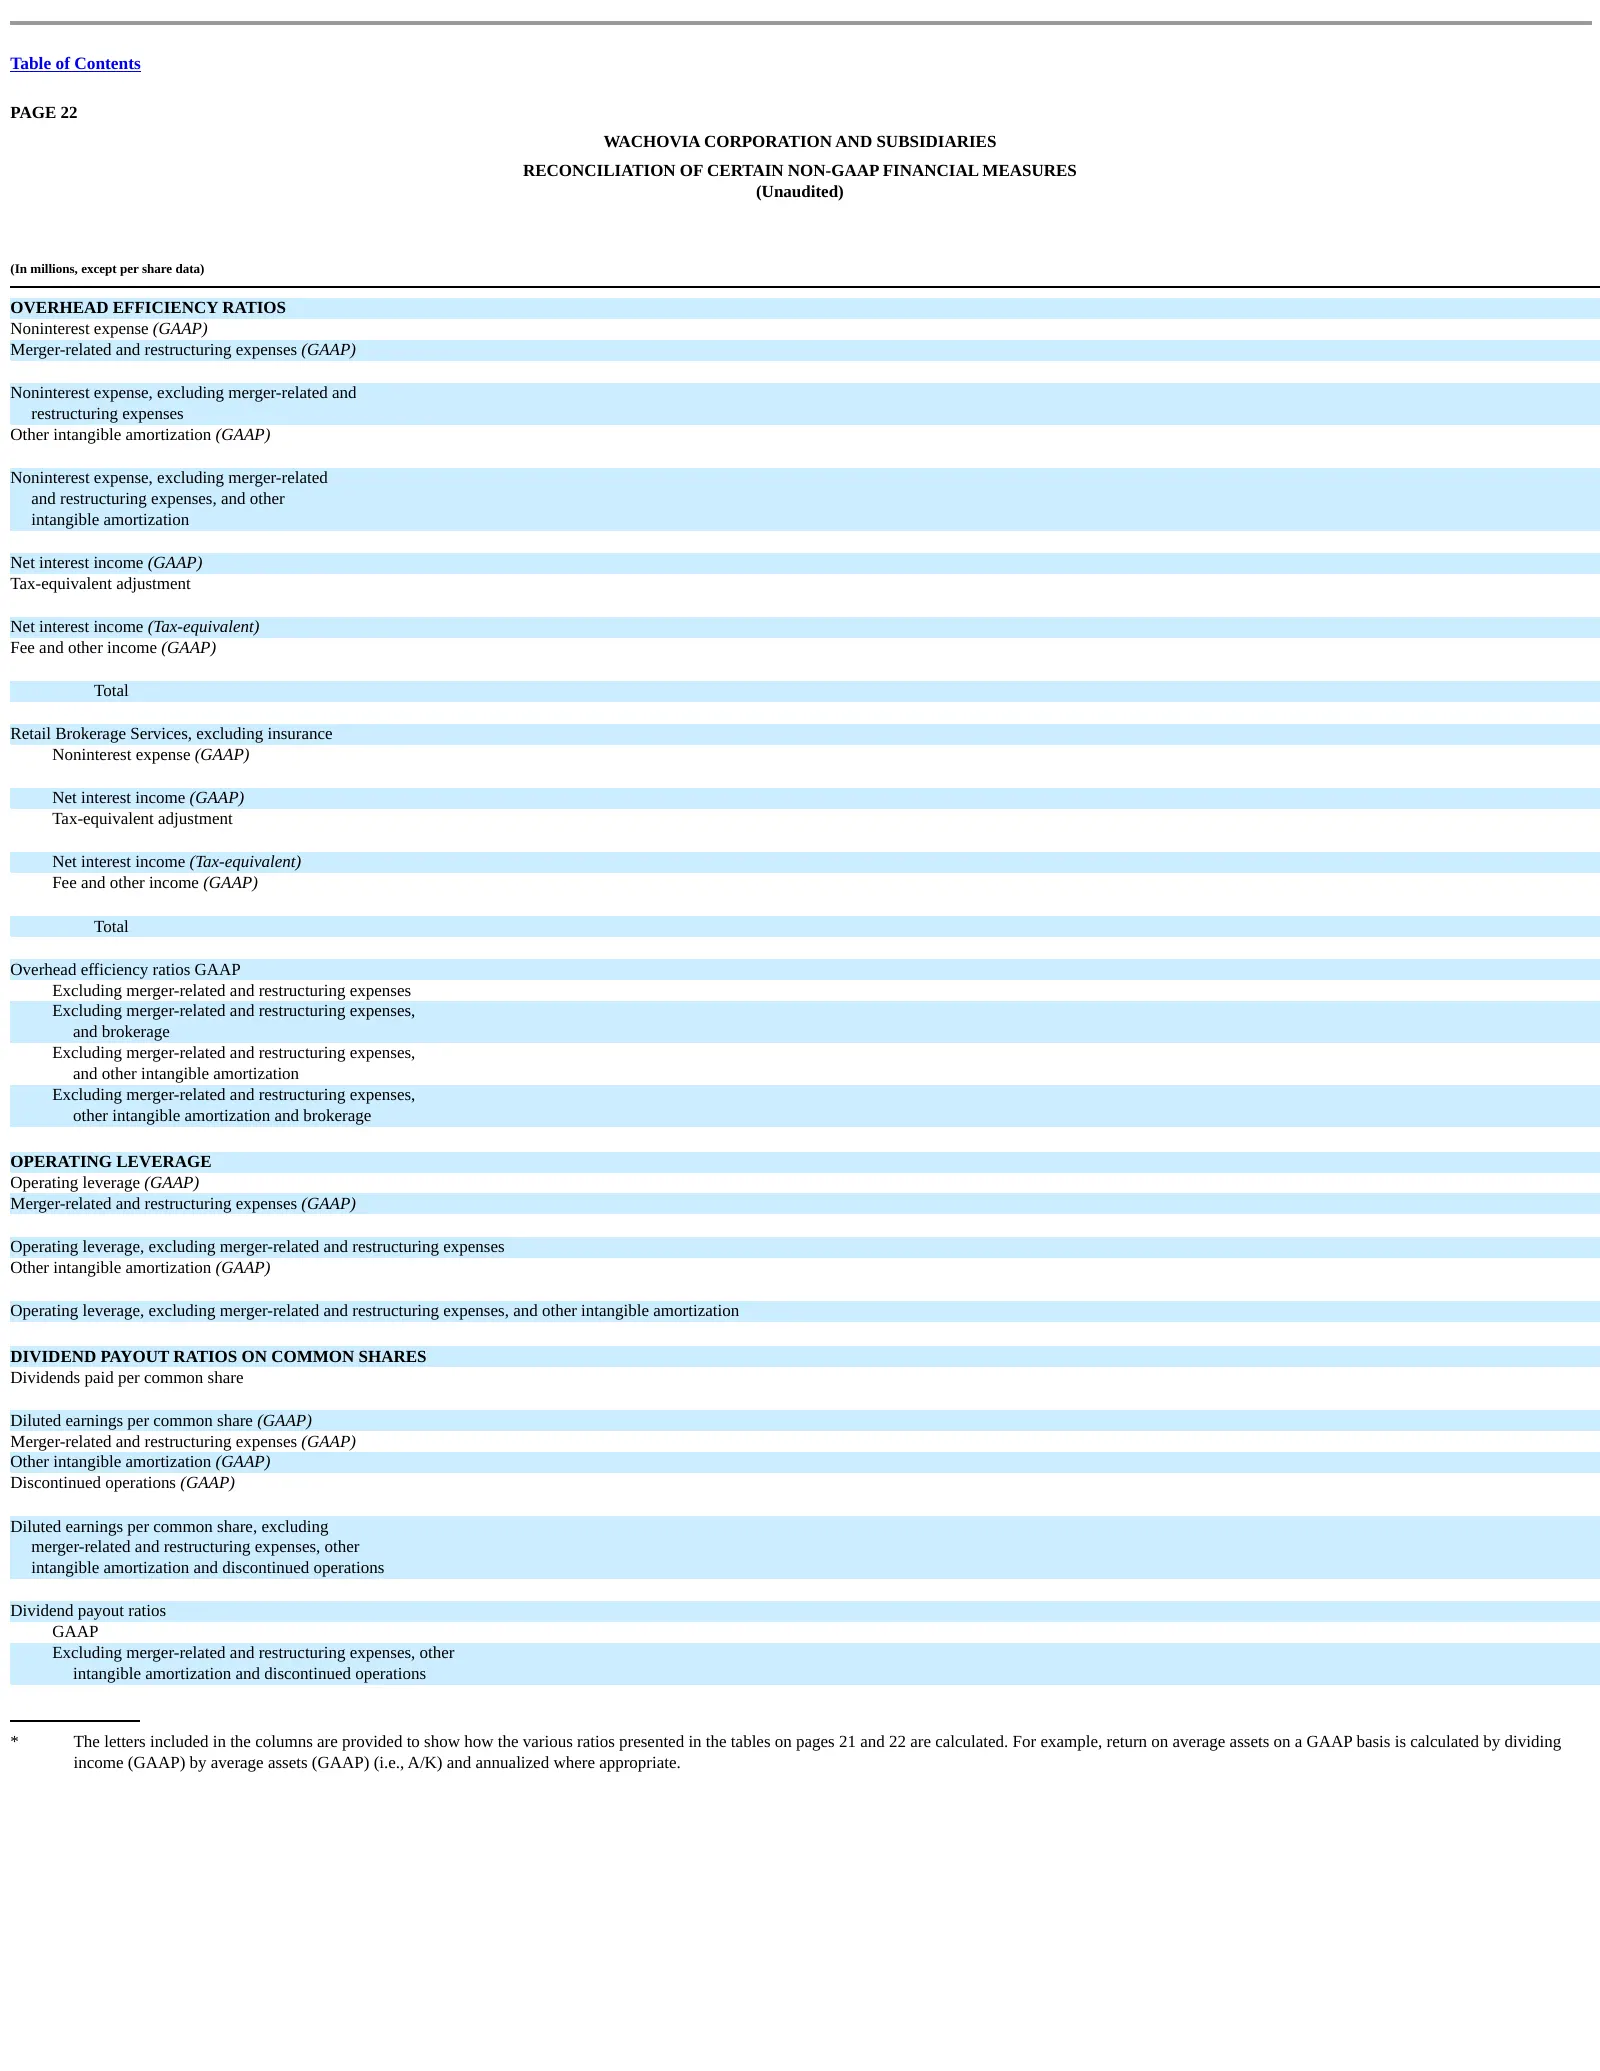
Table of Contents PAGE 22 WACHOVIA CORPORATION AND SUBSIDIARIES RECONCILIATION OF CERTAIN NON-GAAP FINANCIAL MEASURES (Unaudited) (In millions, except per share data) OVERHEAD EFFICIENCY RATIOS Noninterest expense (GAAP) Merger-related and restructuring expenses (GAAP) Noninterest expense, excluding
Slide 23: 1Q08 Financial Highlights
Table of Contents Wachovia Corporation 1Q08 Financial Highlights April 14, 2008
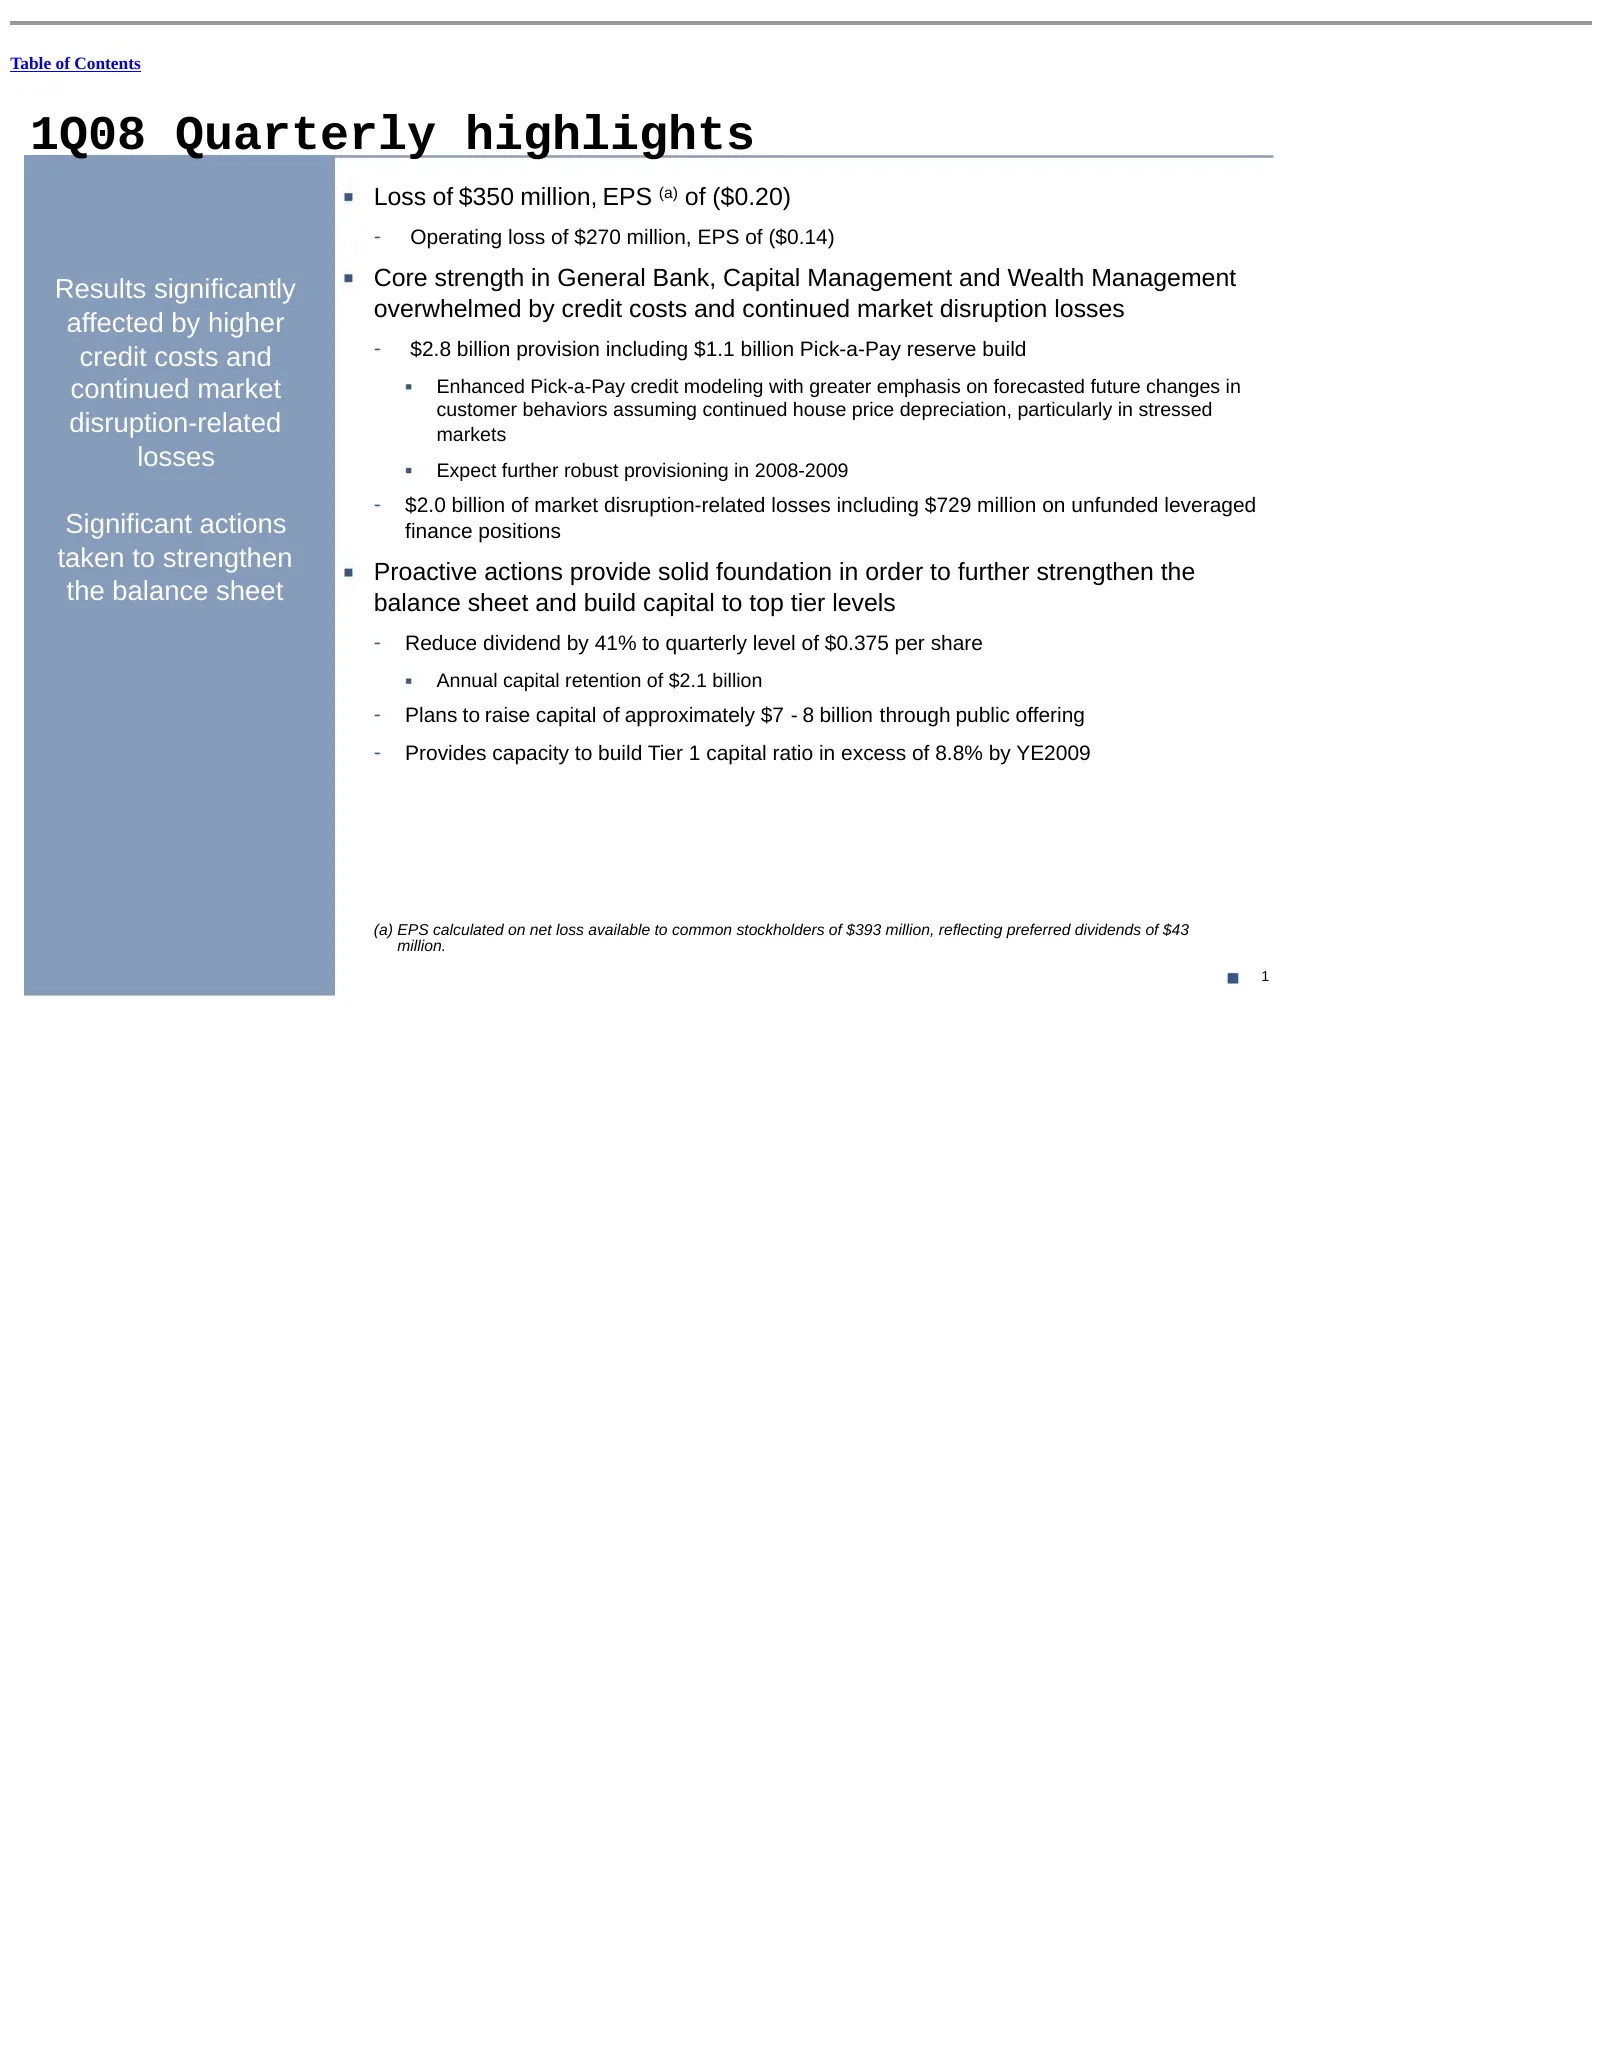
Slide 24: 1Q08 Quarterly highlights
Table of Contents 1Q08 Quarterly highlights Loss of $350 million, EPS (a) of ($0.20) - Operating loss of $270 million, EPS of ($0.14) Results significantly Core strength in General Bank, Capital Management and Wealth Management overwhelmed by credit costs and continued market disruption losses affec
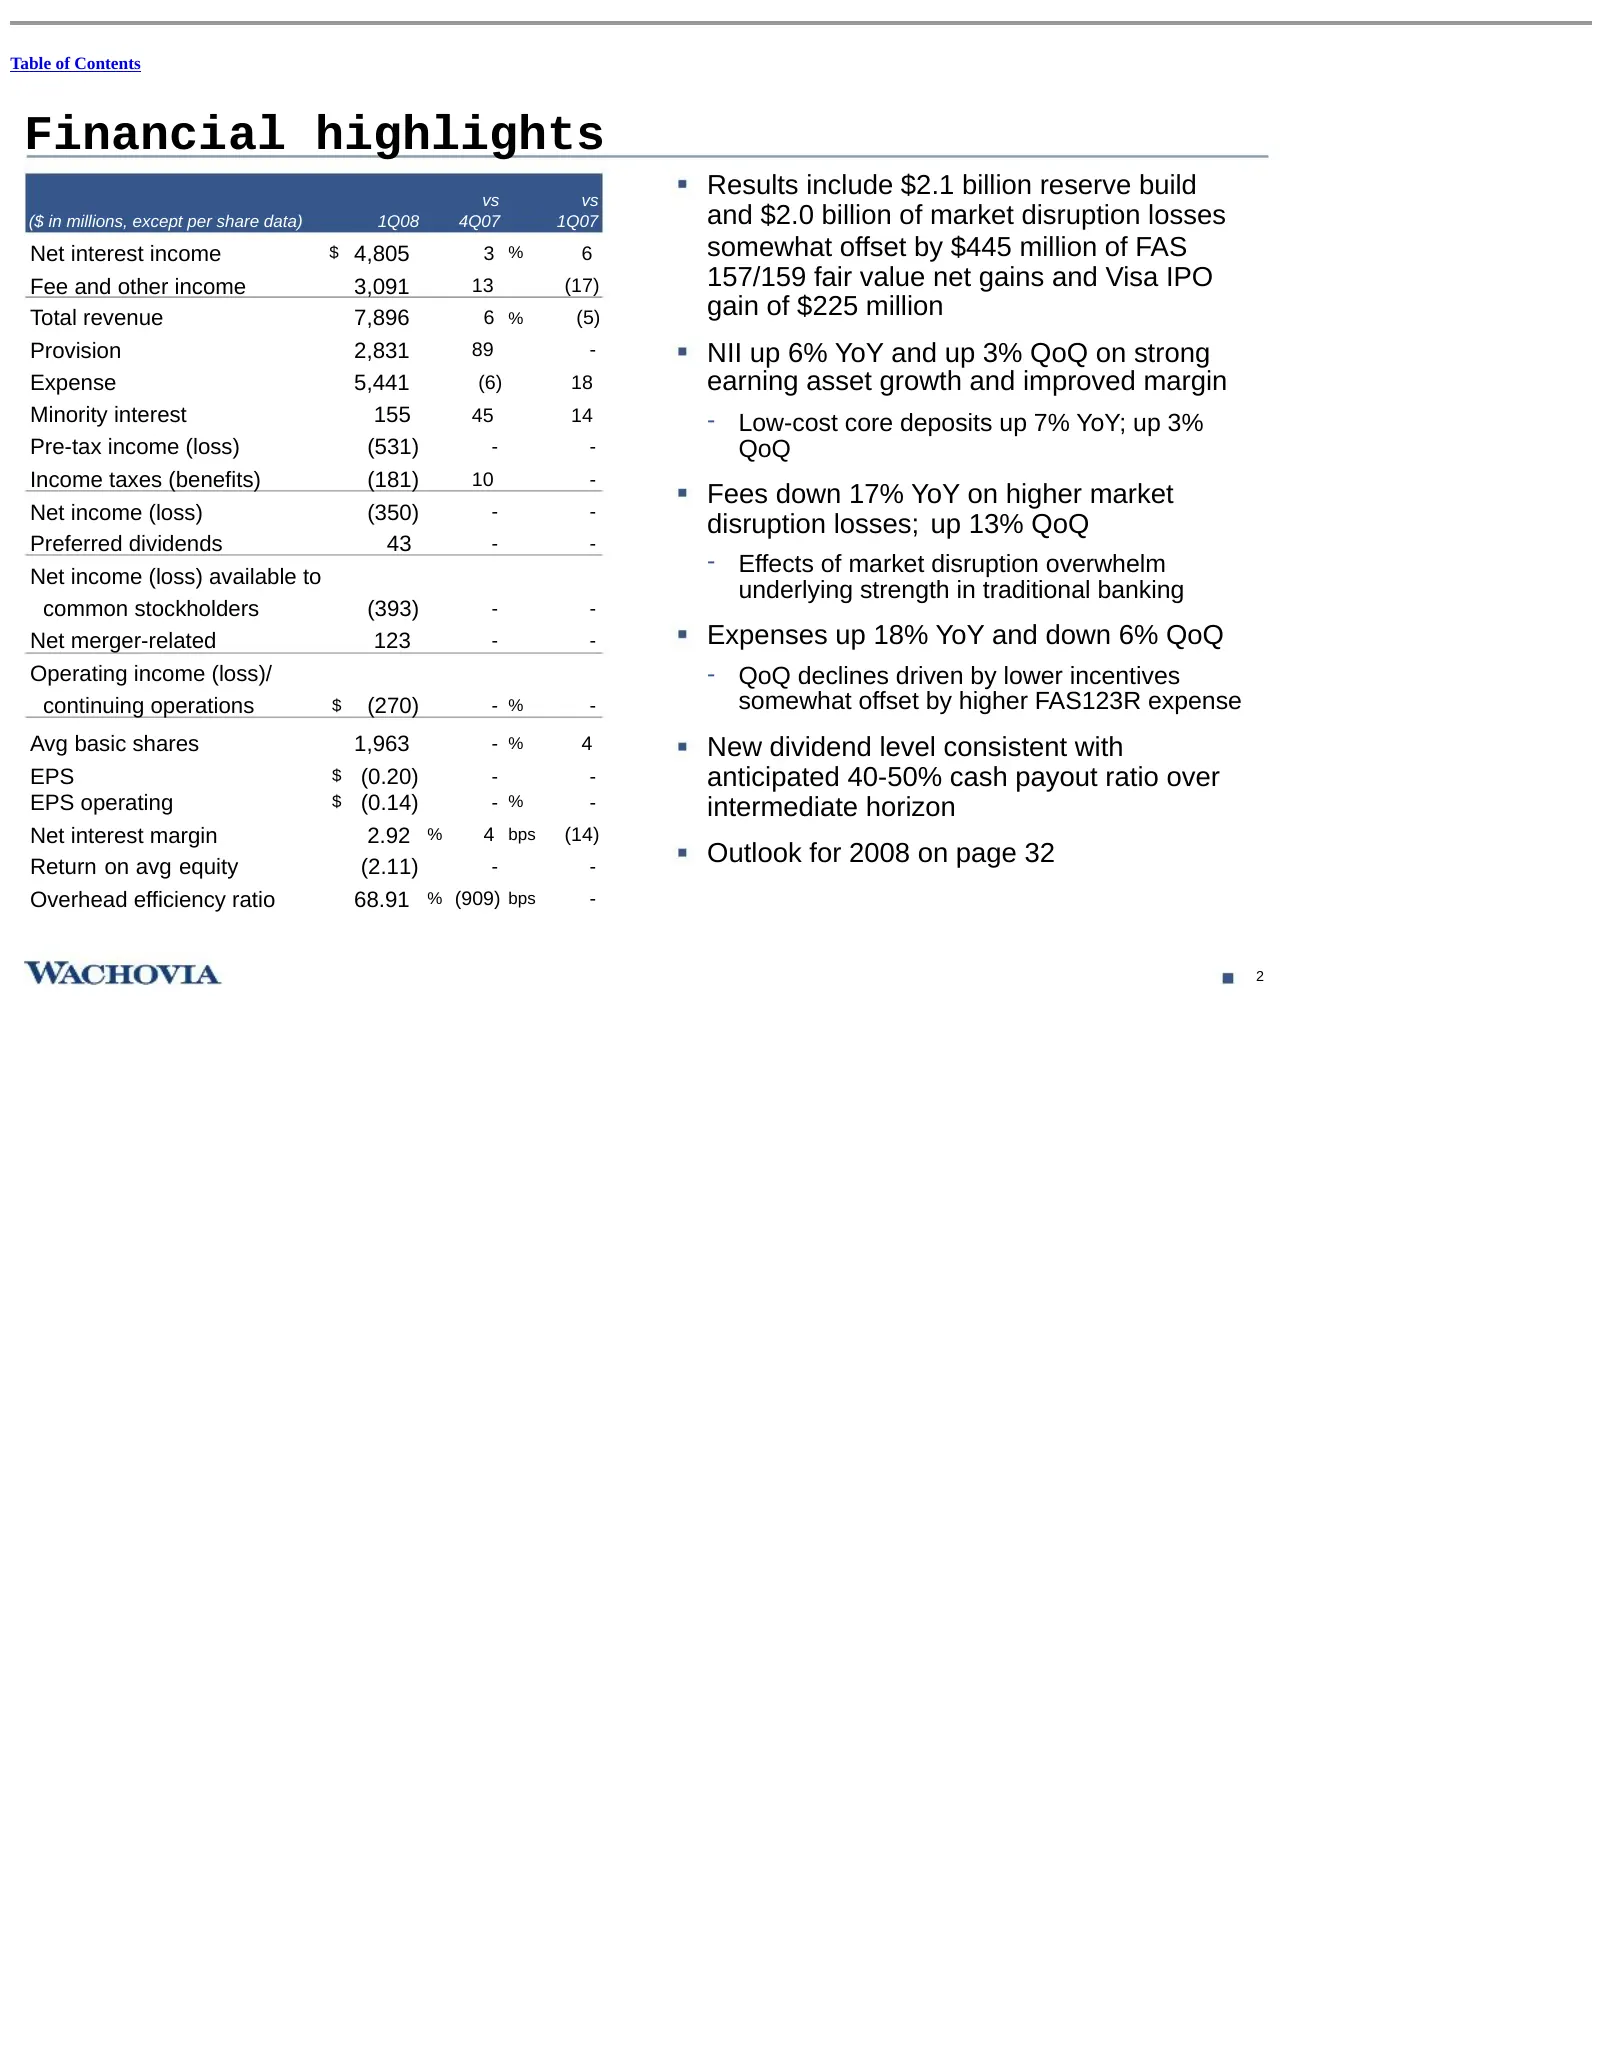
Slide 25: Financial highlights
Table of Contents Financial highlights vs vs Results include $2.1 billion reserve build ($ in millions, except per share data) 1Q08 4Q07 1Q07 and $2.0 billion of market disruption losses Net interest income $ 4,805 3 % 6 somewhat offset by $445 million of FAS Fee and other income 3,091 13 (17) 157/1
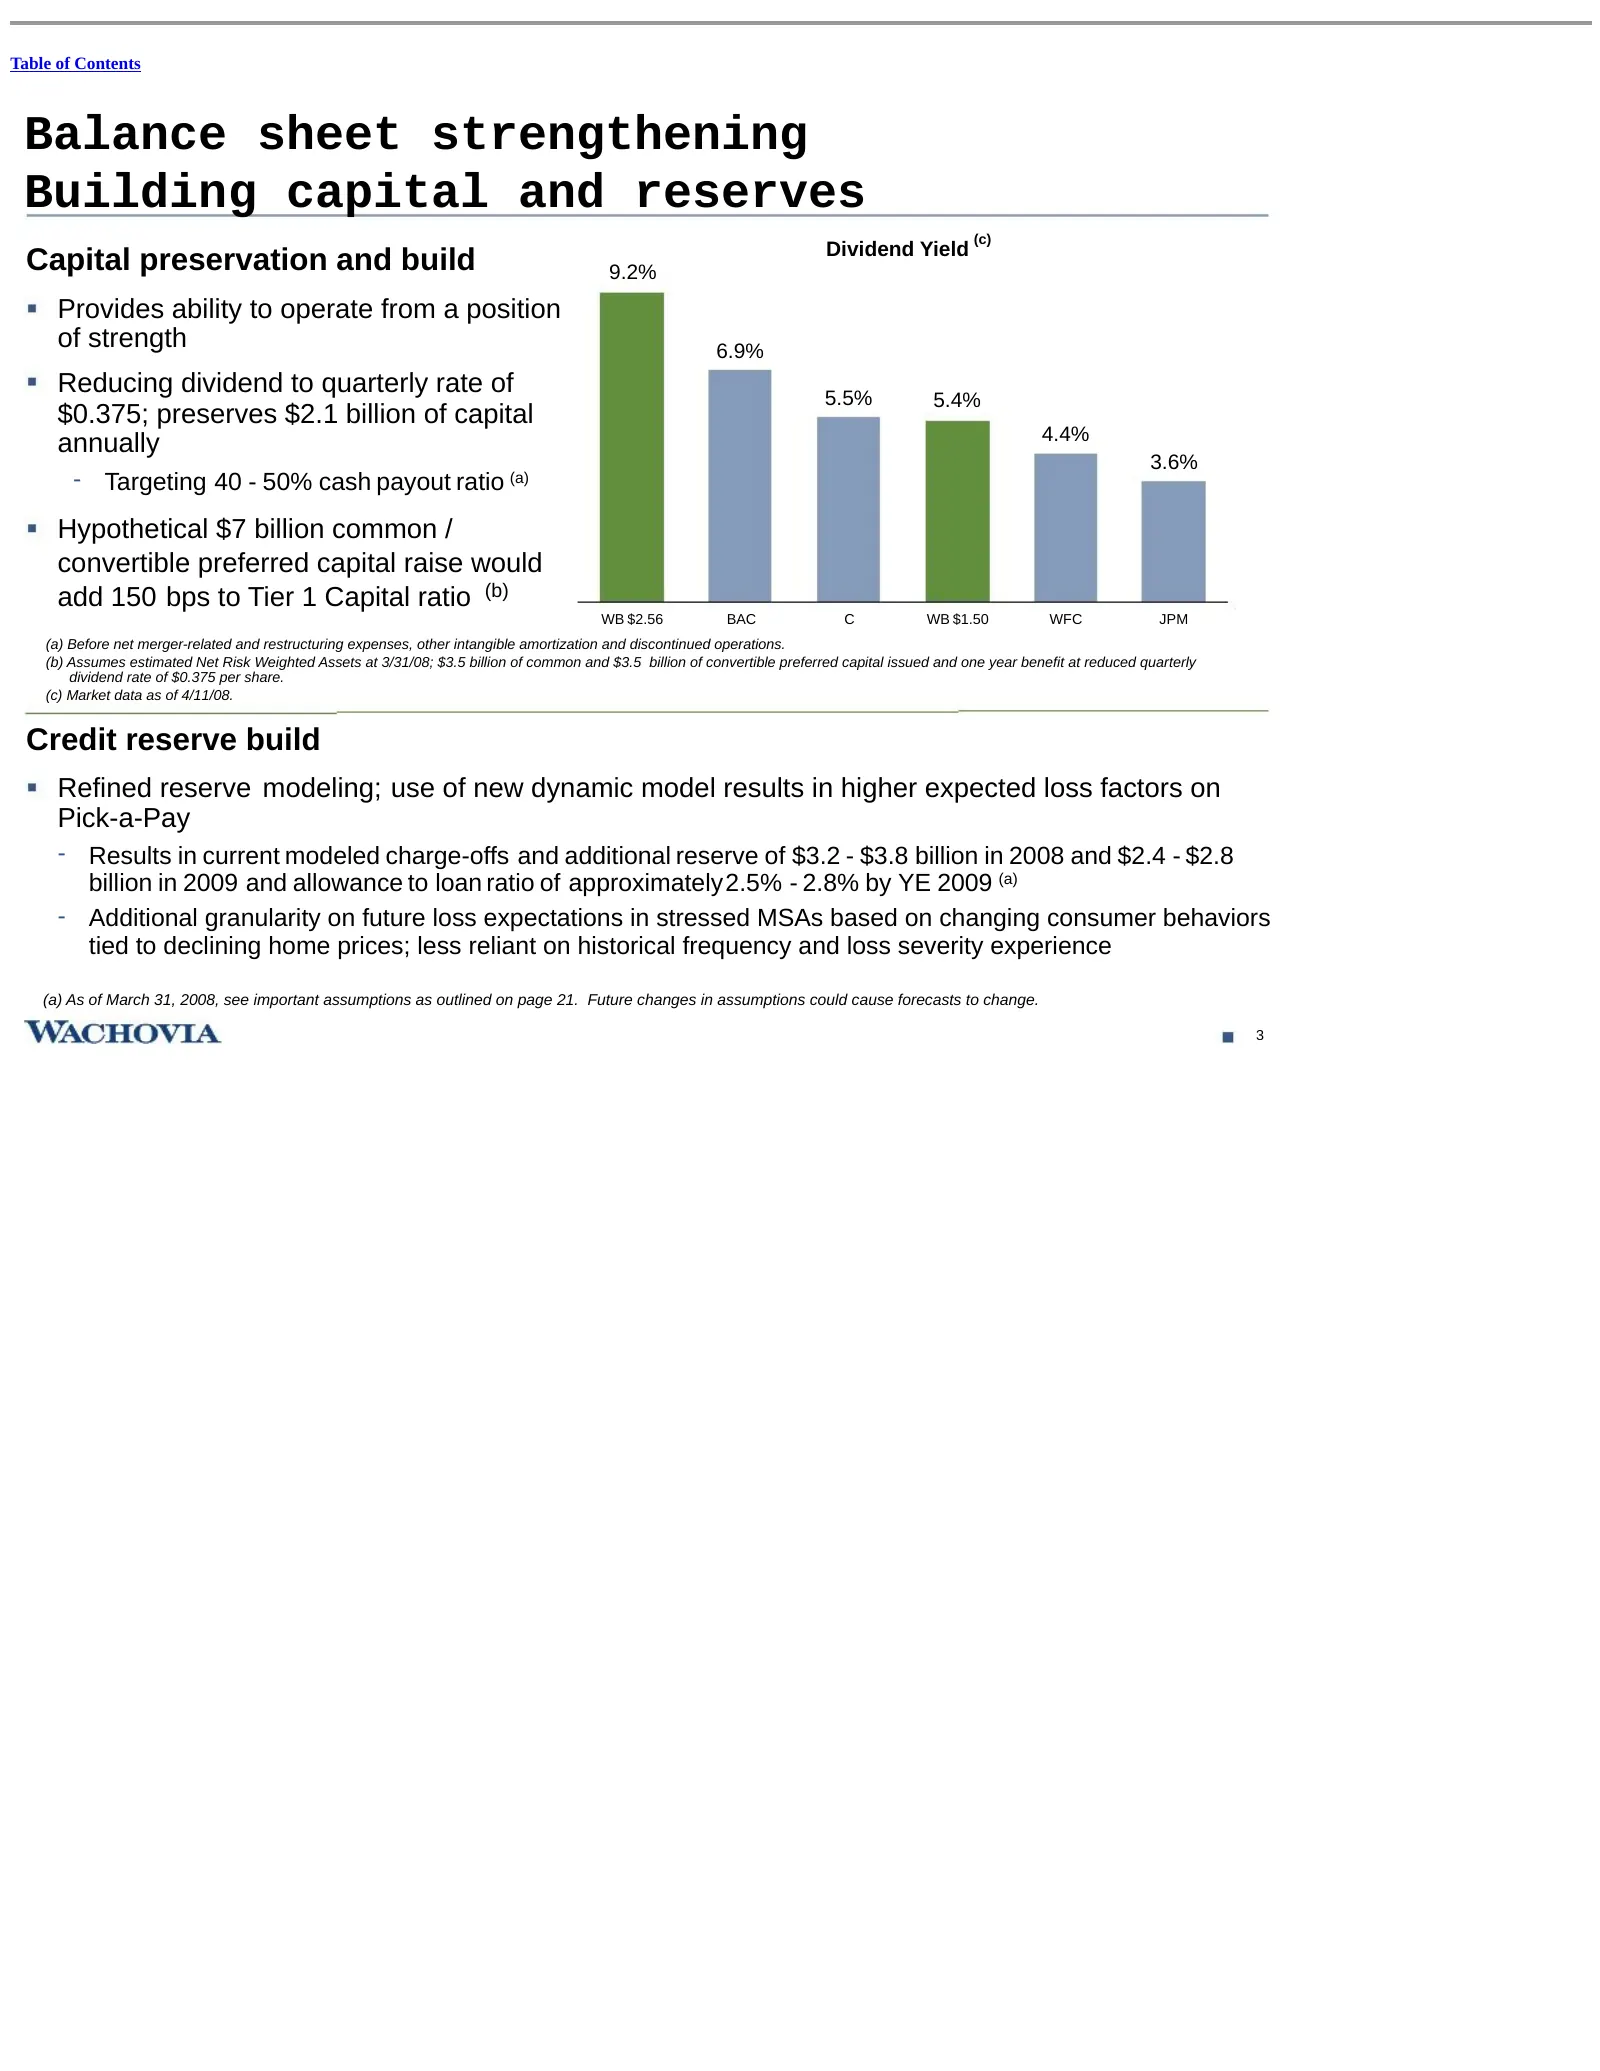
Slide 26: Balance sheet strengthening: Building capital and reserves
Table of Contents Balance sheet strengthening Building capital and reserves (c) Dividend Yield Capital preservation and build 9.2% Provides ability to operate from a position of strength 6.9% Reducing dividend to quarterly rate of 5.5% 5.4% $0.375; preserves $2.1 billion of capital 4.4% annually 3.6
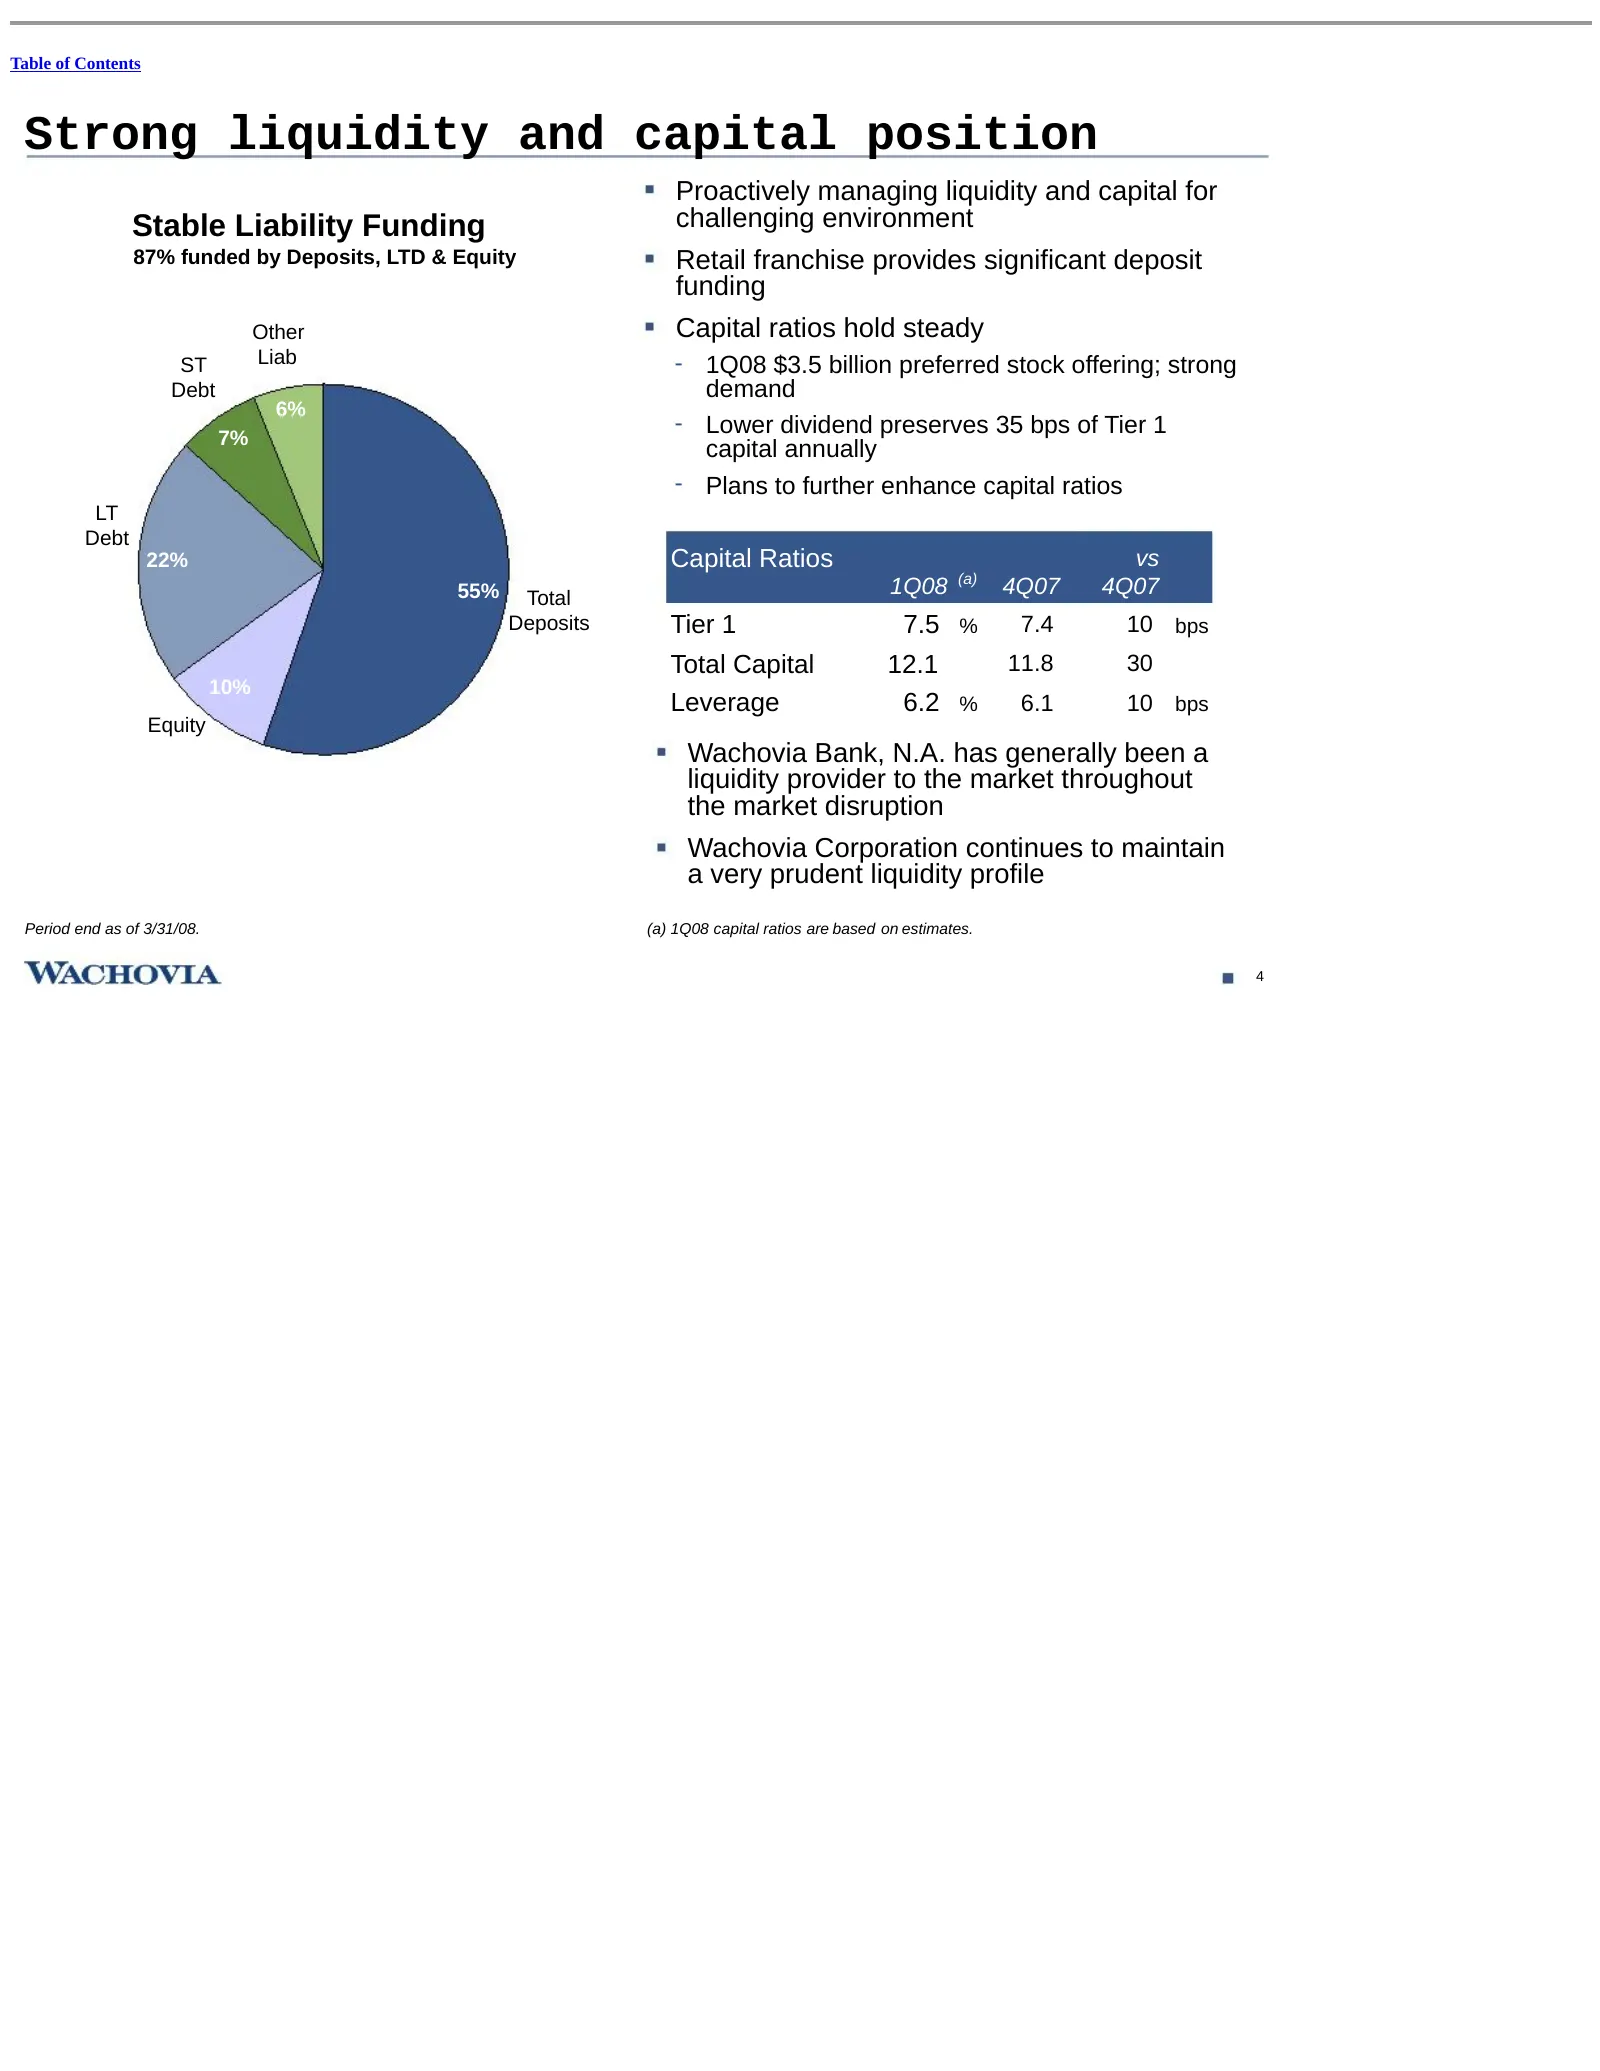
Slide 27: Strong liquidity and capital position
Table of Contents Strong liquidity and capital position Proactively managing liquidity and capital for Stable Liability Funding challenging environment 87% funded by Deposits, LTD & Equity Retail franchise provides significant deposit funding Other Capital ratios hold steady ST Liab - 1Q08 $3.5 bill
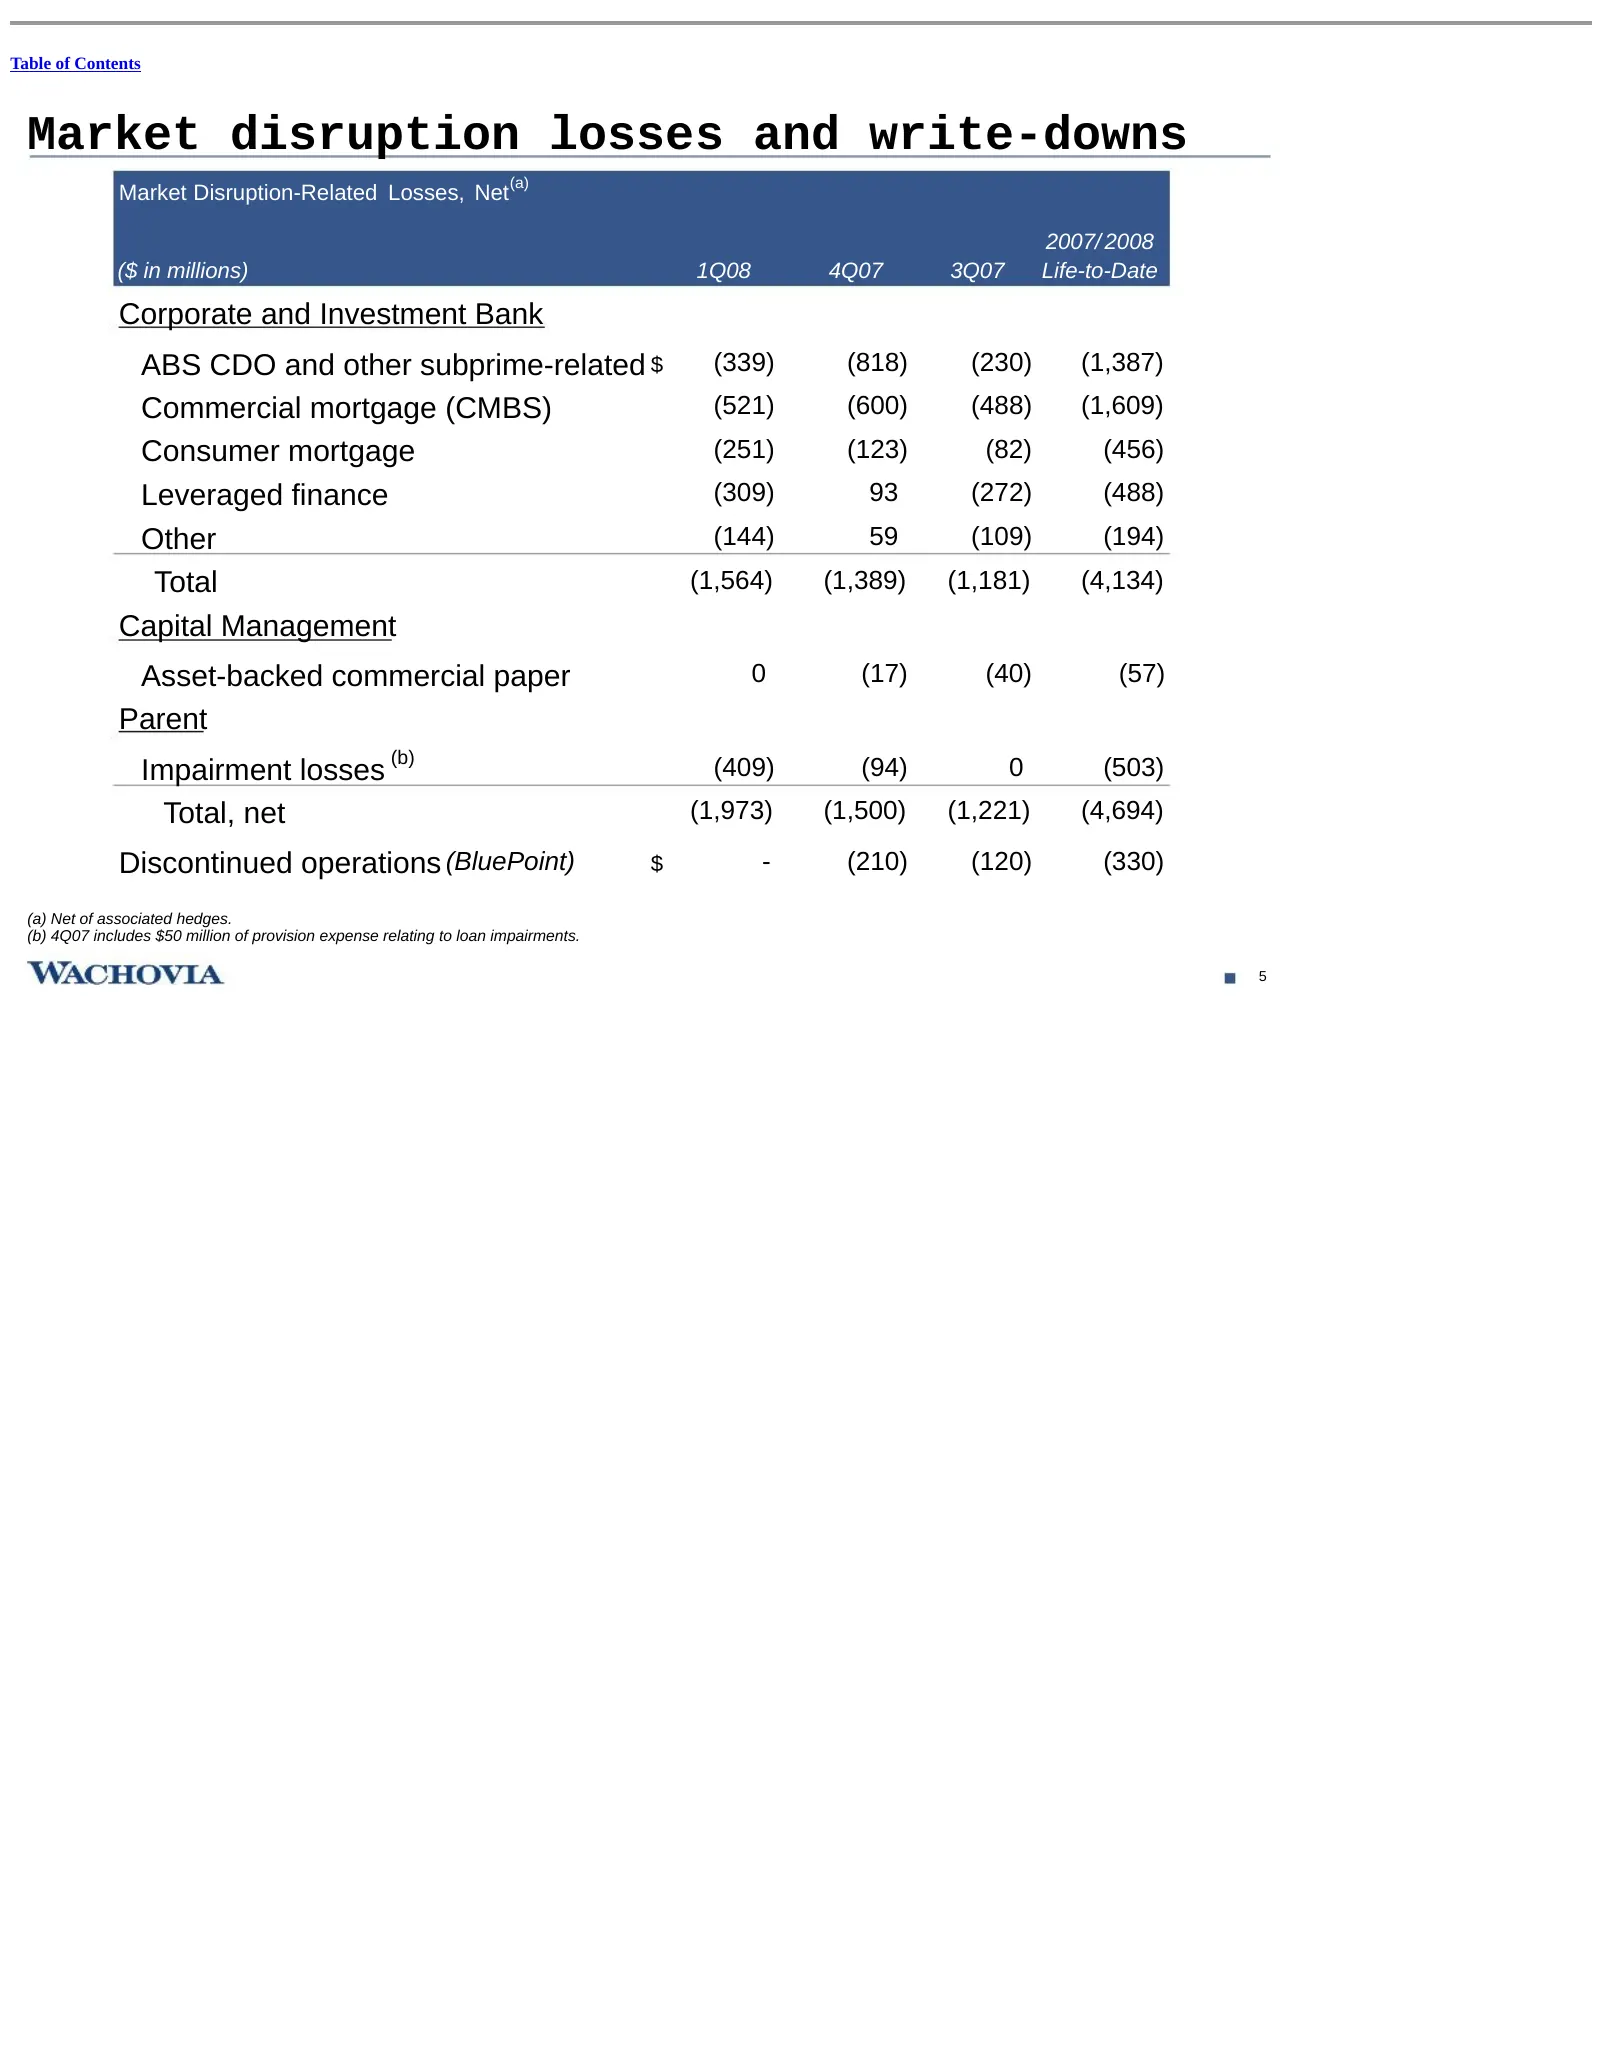
Slide 28: Market disruption losses and write-downs
Table of Contents Market disruption losses and write-downs (a) Market Disruption-Related Losses, Net 2007/ 2008 ($ in millions) 1Q08 4Q07 3Q07 Life-to-Date Corporate and Investment Bank ABS CDO and other subprime-related $ (339) (818) (230) (1,387) Commercial mortgage (CMBS) (521) (600) (488) (1,609
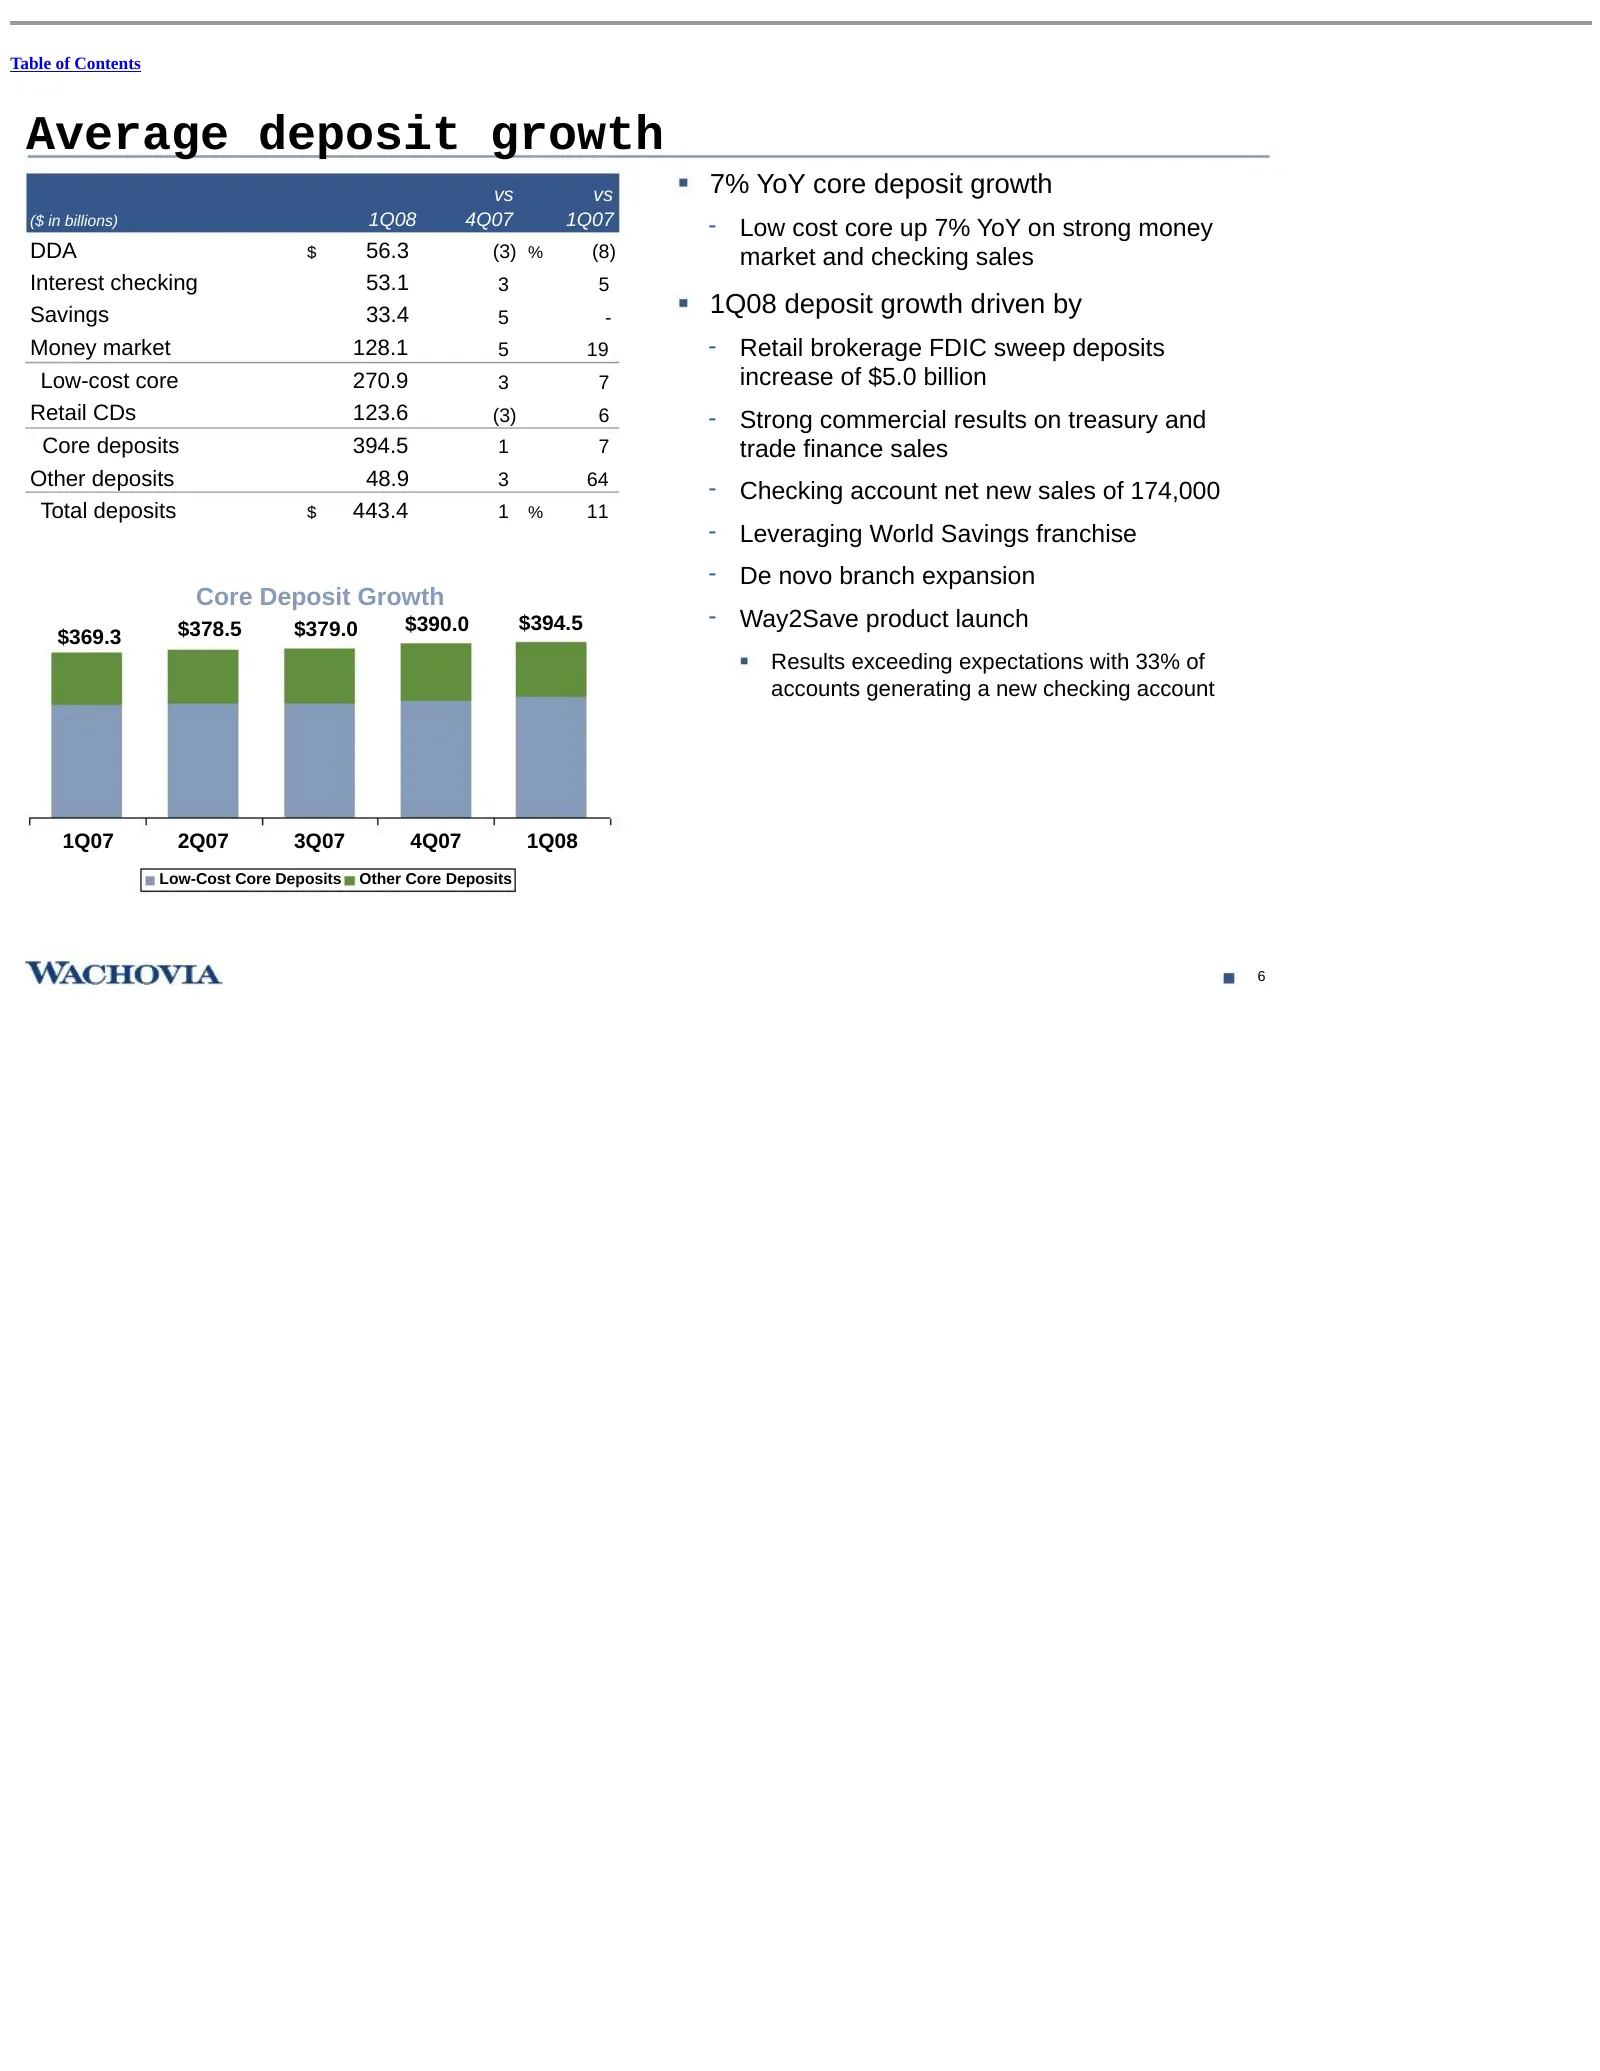
Slide 29: Average deposit growth
Table of Contents Average deposit growth vs vs 7% YoY core deposit growth ($ in billions) 1Q08 4Q07 1Q07 - Low cost core up 7% YoY on strong money DDA $ 56.3 (3) % (8) market and checking sales Interest checking 53.1 3 5 Savings 33.4 5 - 1Q08 deposit growth driven by Money market 128.1 5 19 - Retail
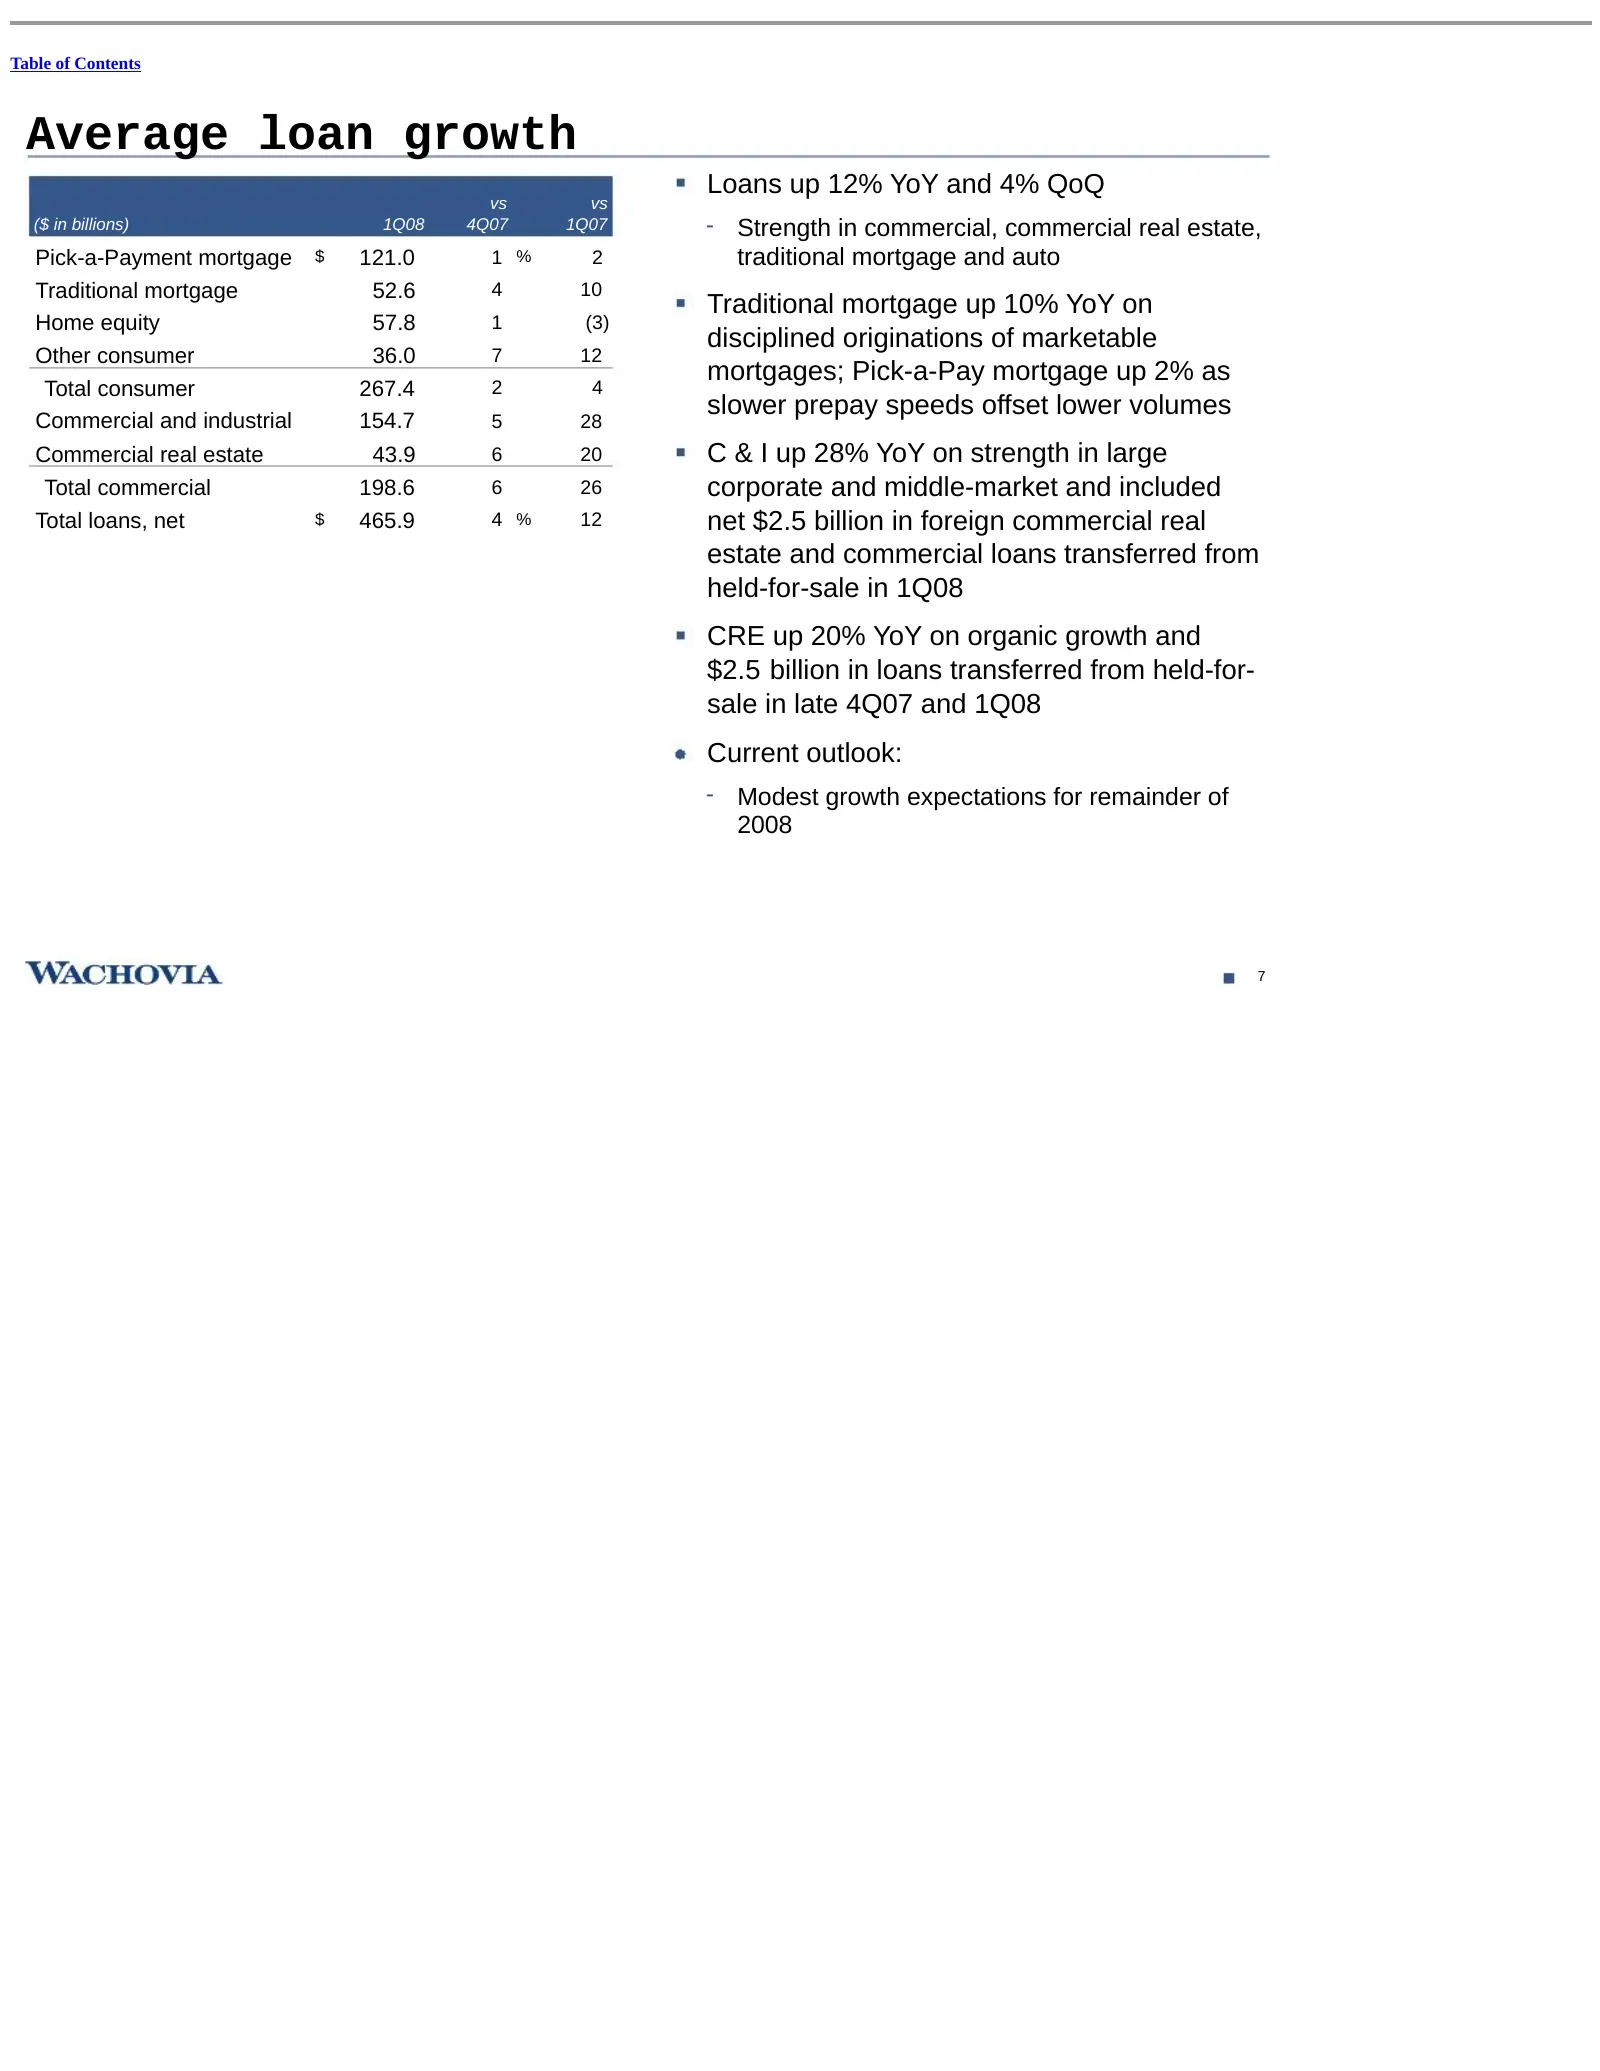
Slide 30: Average loan growth
Table of Contents Average loan growth Loans up 12% YoY and 4% QoQ vs vs ($ in billions) 1Q08 4Q07 1Q07 - Strength in commercial, commercial real estate, Pick-a-Payment mortgage $ 121.0 1 % 2 traditional mortgage and auto Traditional mortgage 52.6 4 10 Traditional mortgage up 10% YoY on Home equity 5
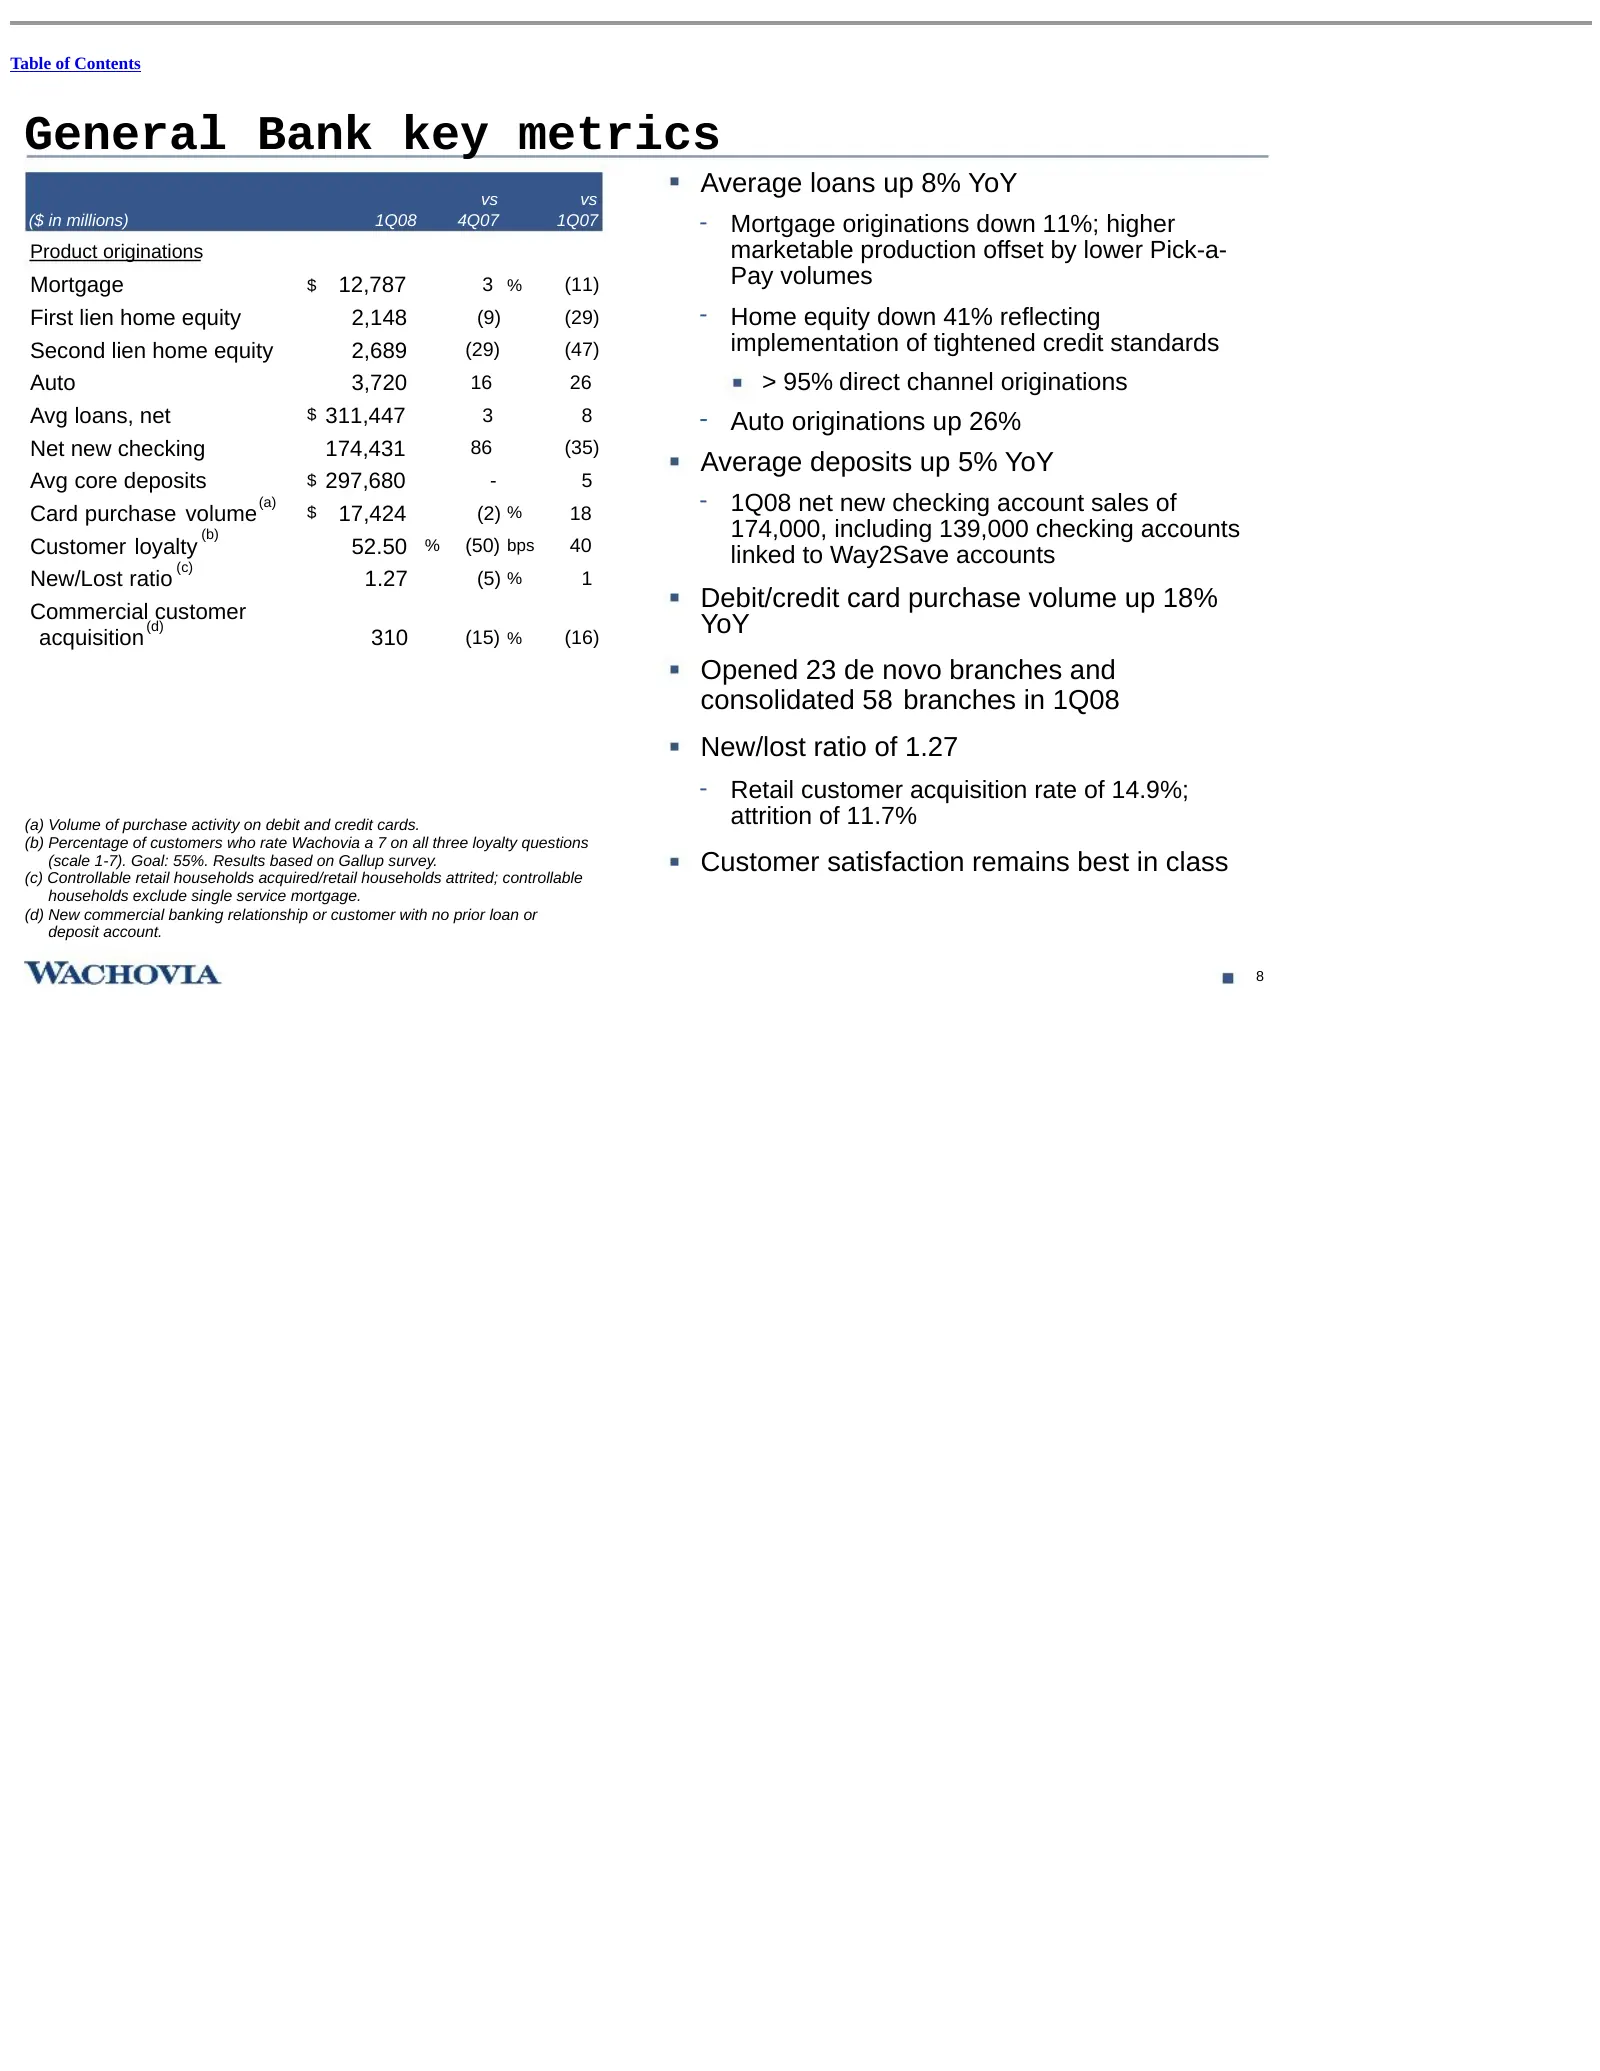
Slide 31: General Bank key metrics
Table of Contents General Bank key metrics vs vs Average loans up 8% YoY ($ in millions) 1Q08 4Q07 1Q07 - Mortgage originations down 11%; higher Product originations marketable production offset by lower Pick-a- Mortgage $ 12,787 3 % (11) Pay volumes First lien home equity 2,148 (9) (29) - Home equi
Slide 32: General Bank summary
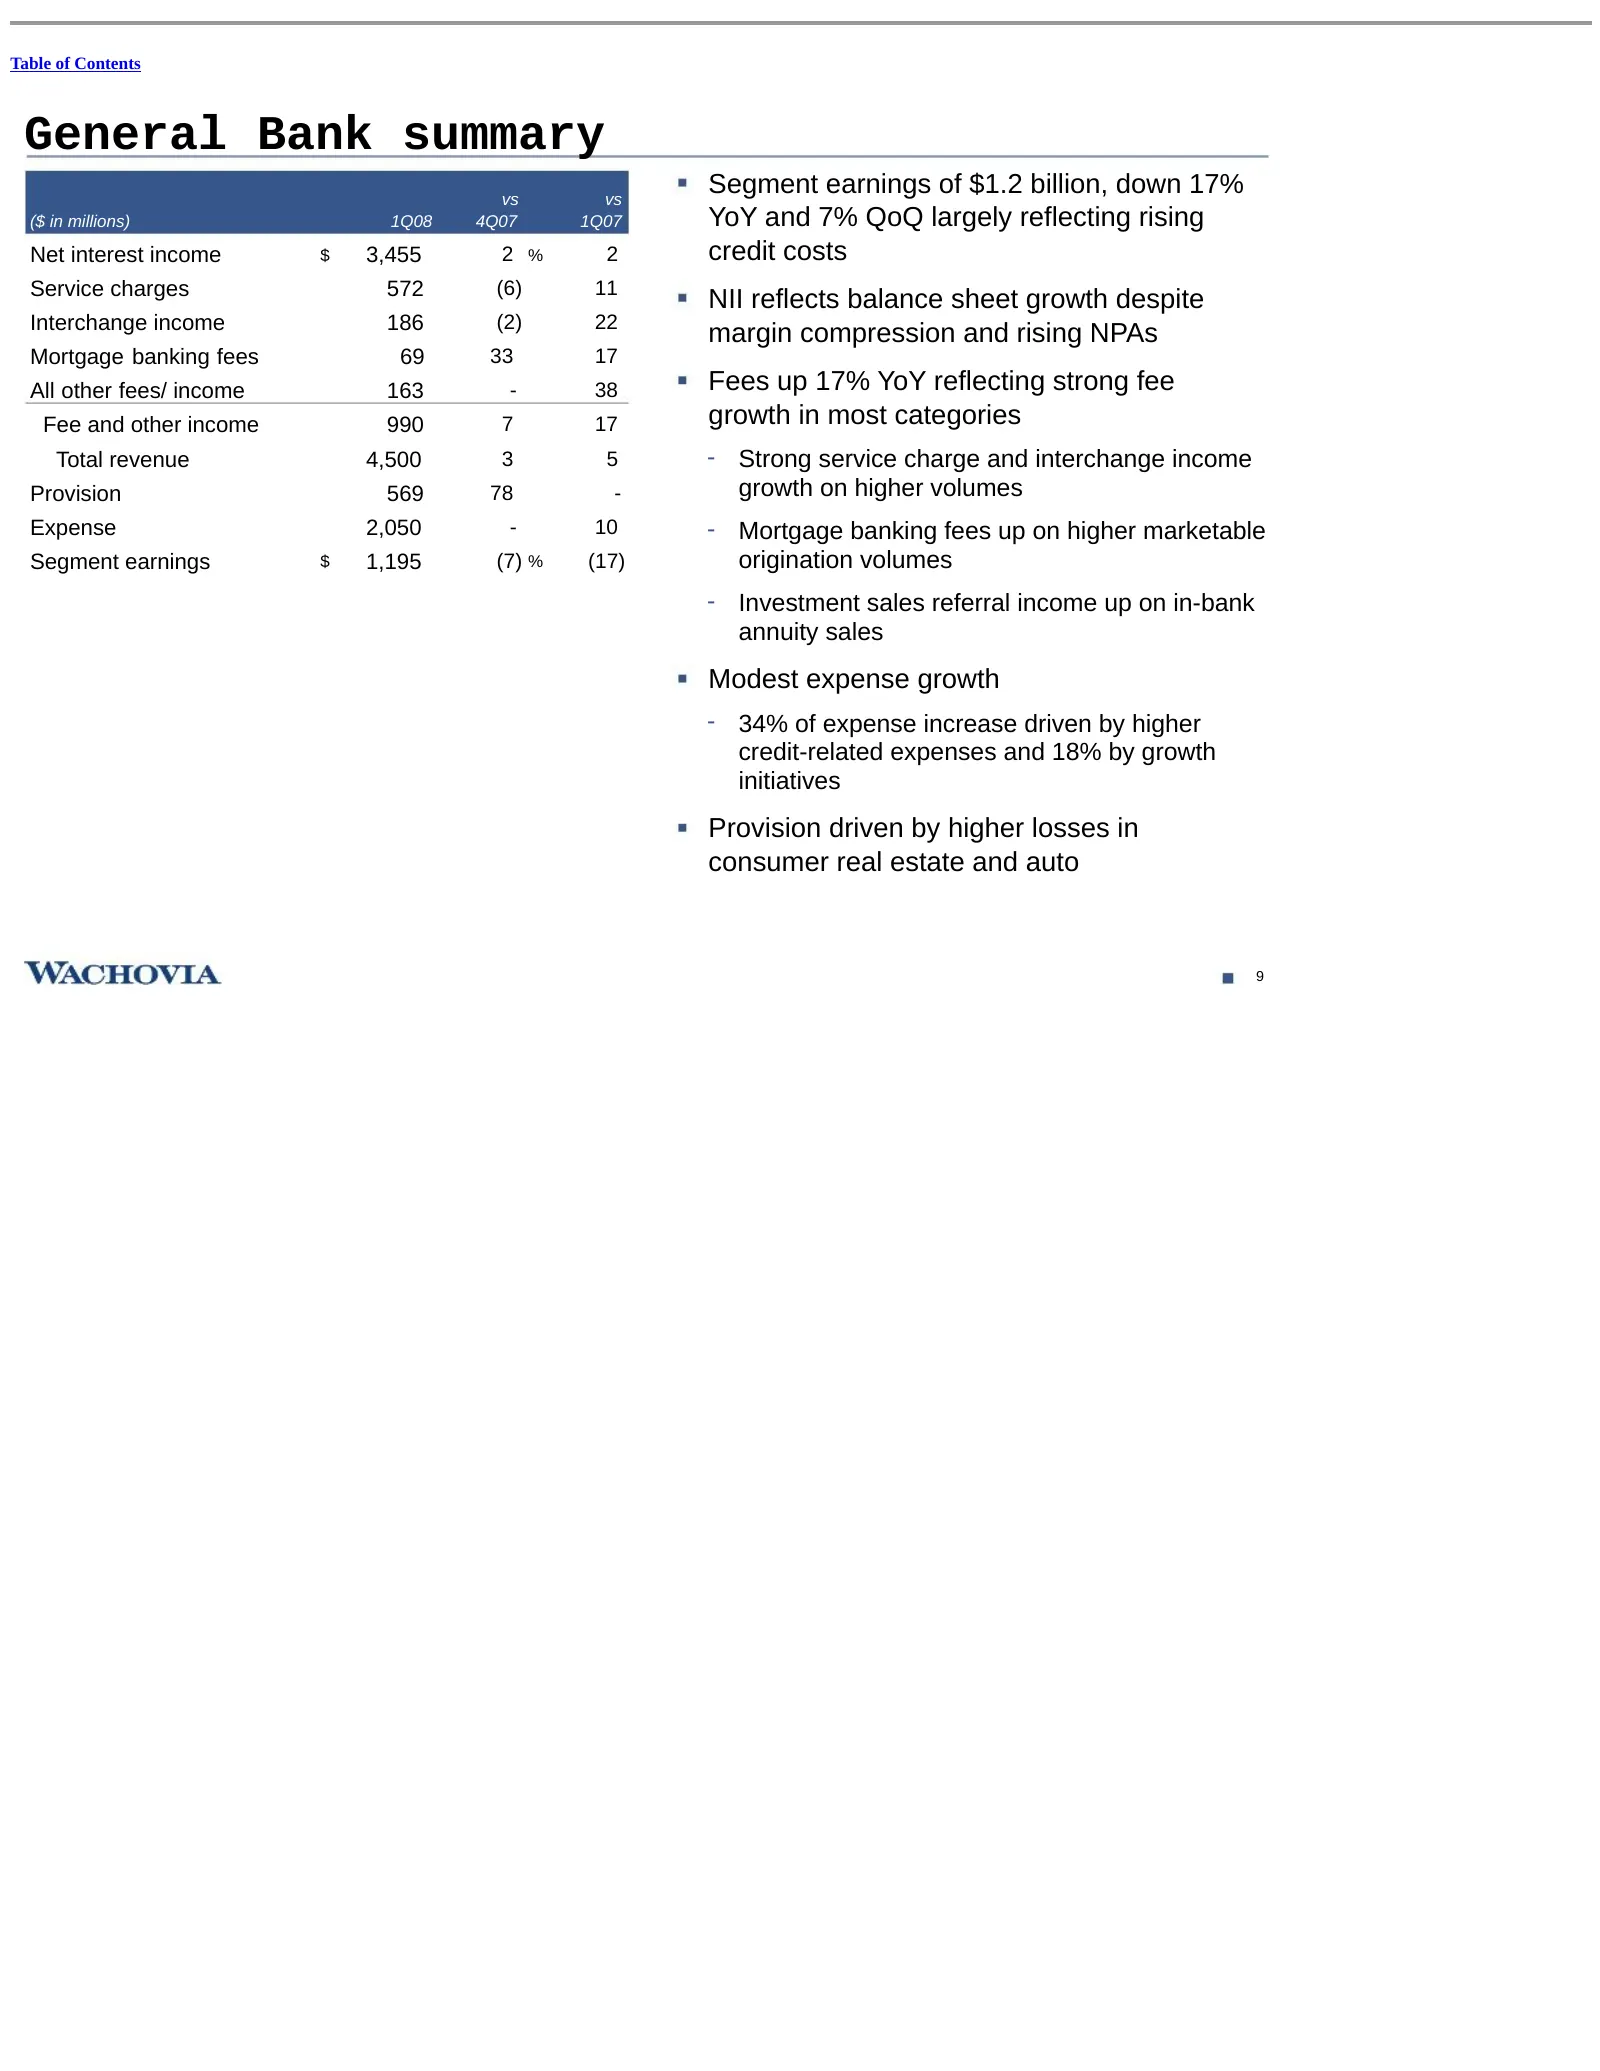
Table of Contents General Bank summary vs vs Segment earnings of $1.2 billion, down 17% ($ in millions) 1Q08 4Q07 1Q07 YoY and 7% QoQ largely reflecting rising Net interest income $ 3,455 2 % 2 credit costs Service charges 572 (6) 11 NII reflects balance sheet growth despite Interchange income 186 (
Slide 33: Wealth Management summary
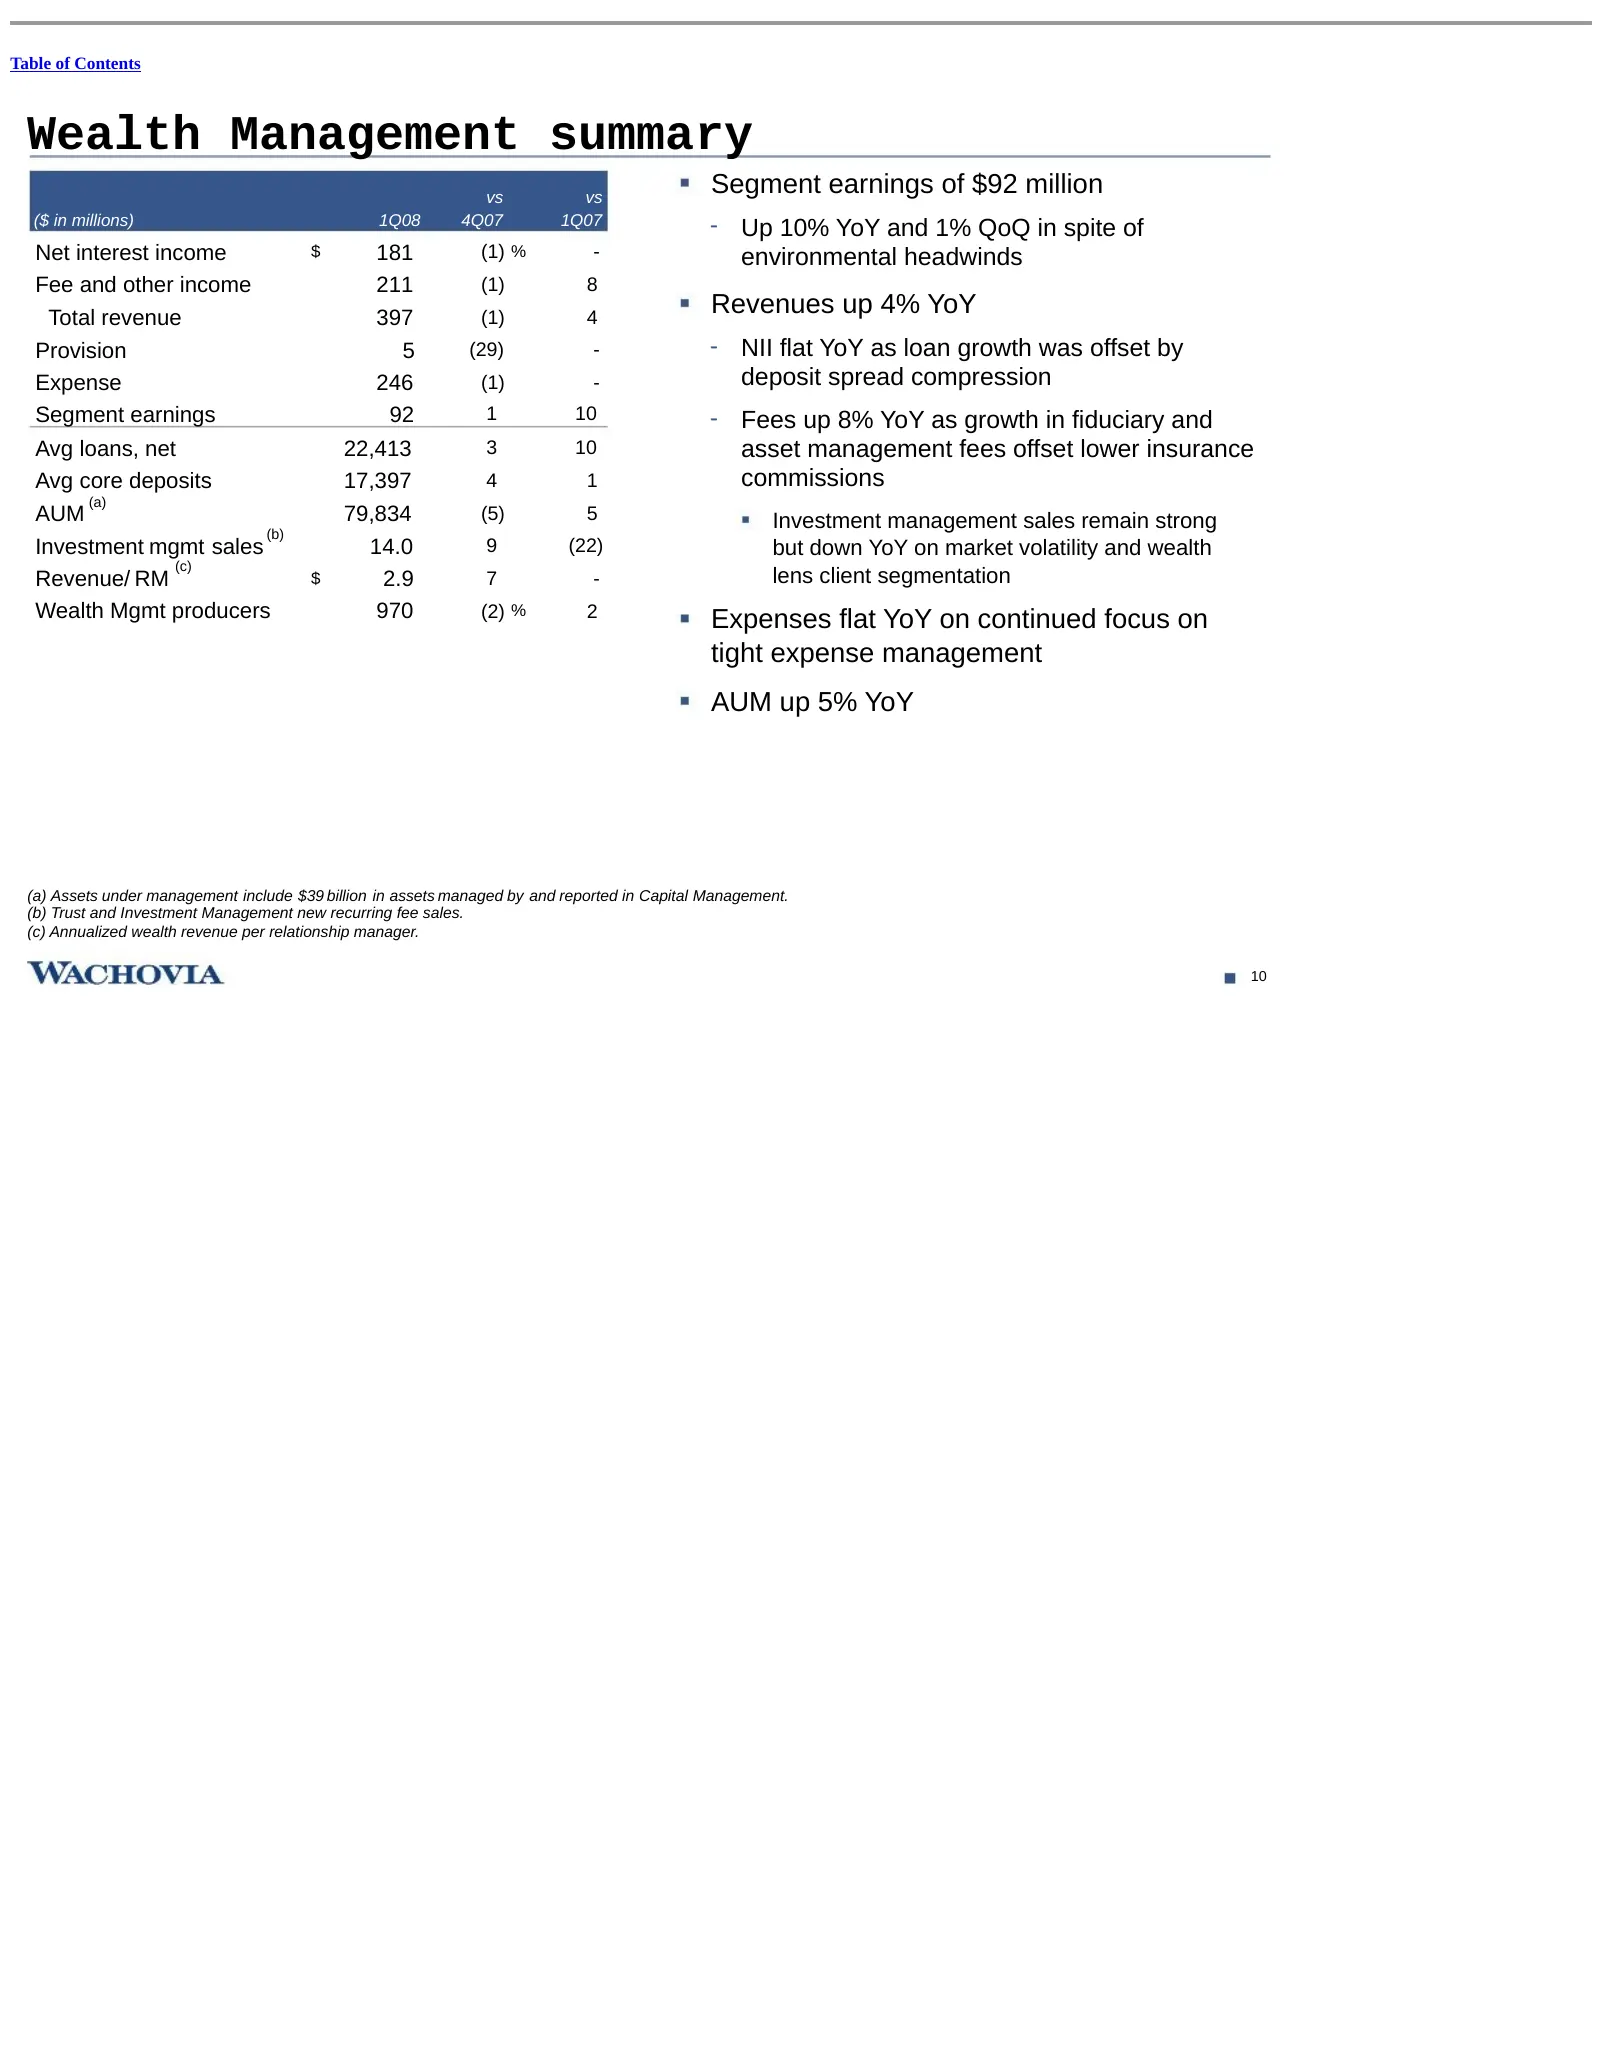
Table of Contents Wealth Management summary vs vs Segment earnings of $92 million ($ in millions) 1Q08 4Q07 1Q07 - Up 10% YoY and 1% QoQ in spite of Net interest income $ 181 (1) % - environmental headwinds Fee and other income 211 (1) 8 Total revenue 397 (1) 4 Revenues up 4% YoY Provision 5 (29) -
Slide 34: Corporate and Investment Bank summary
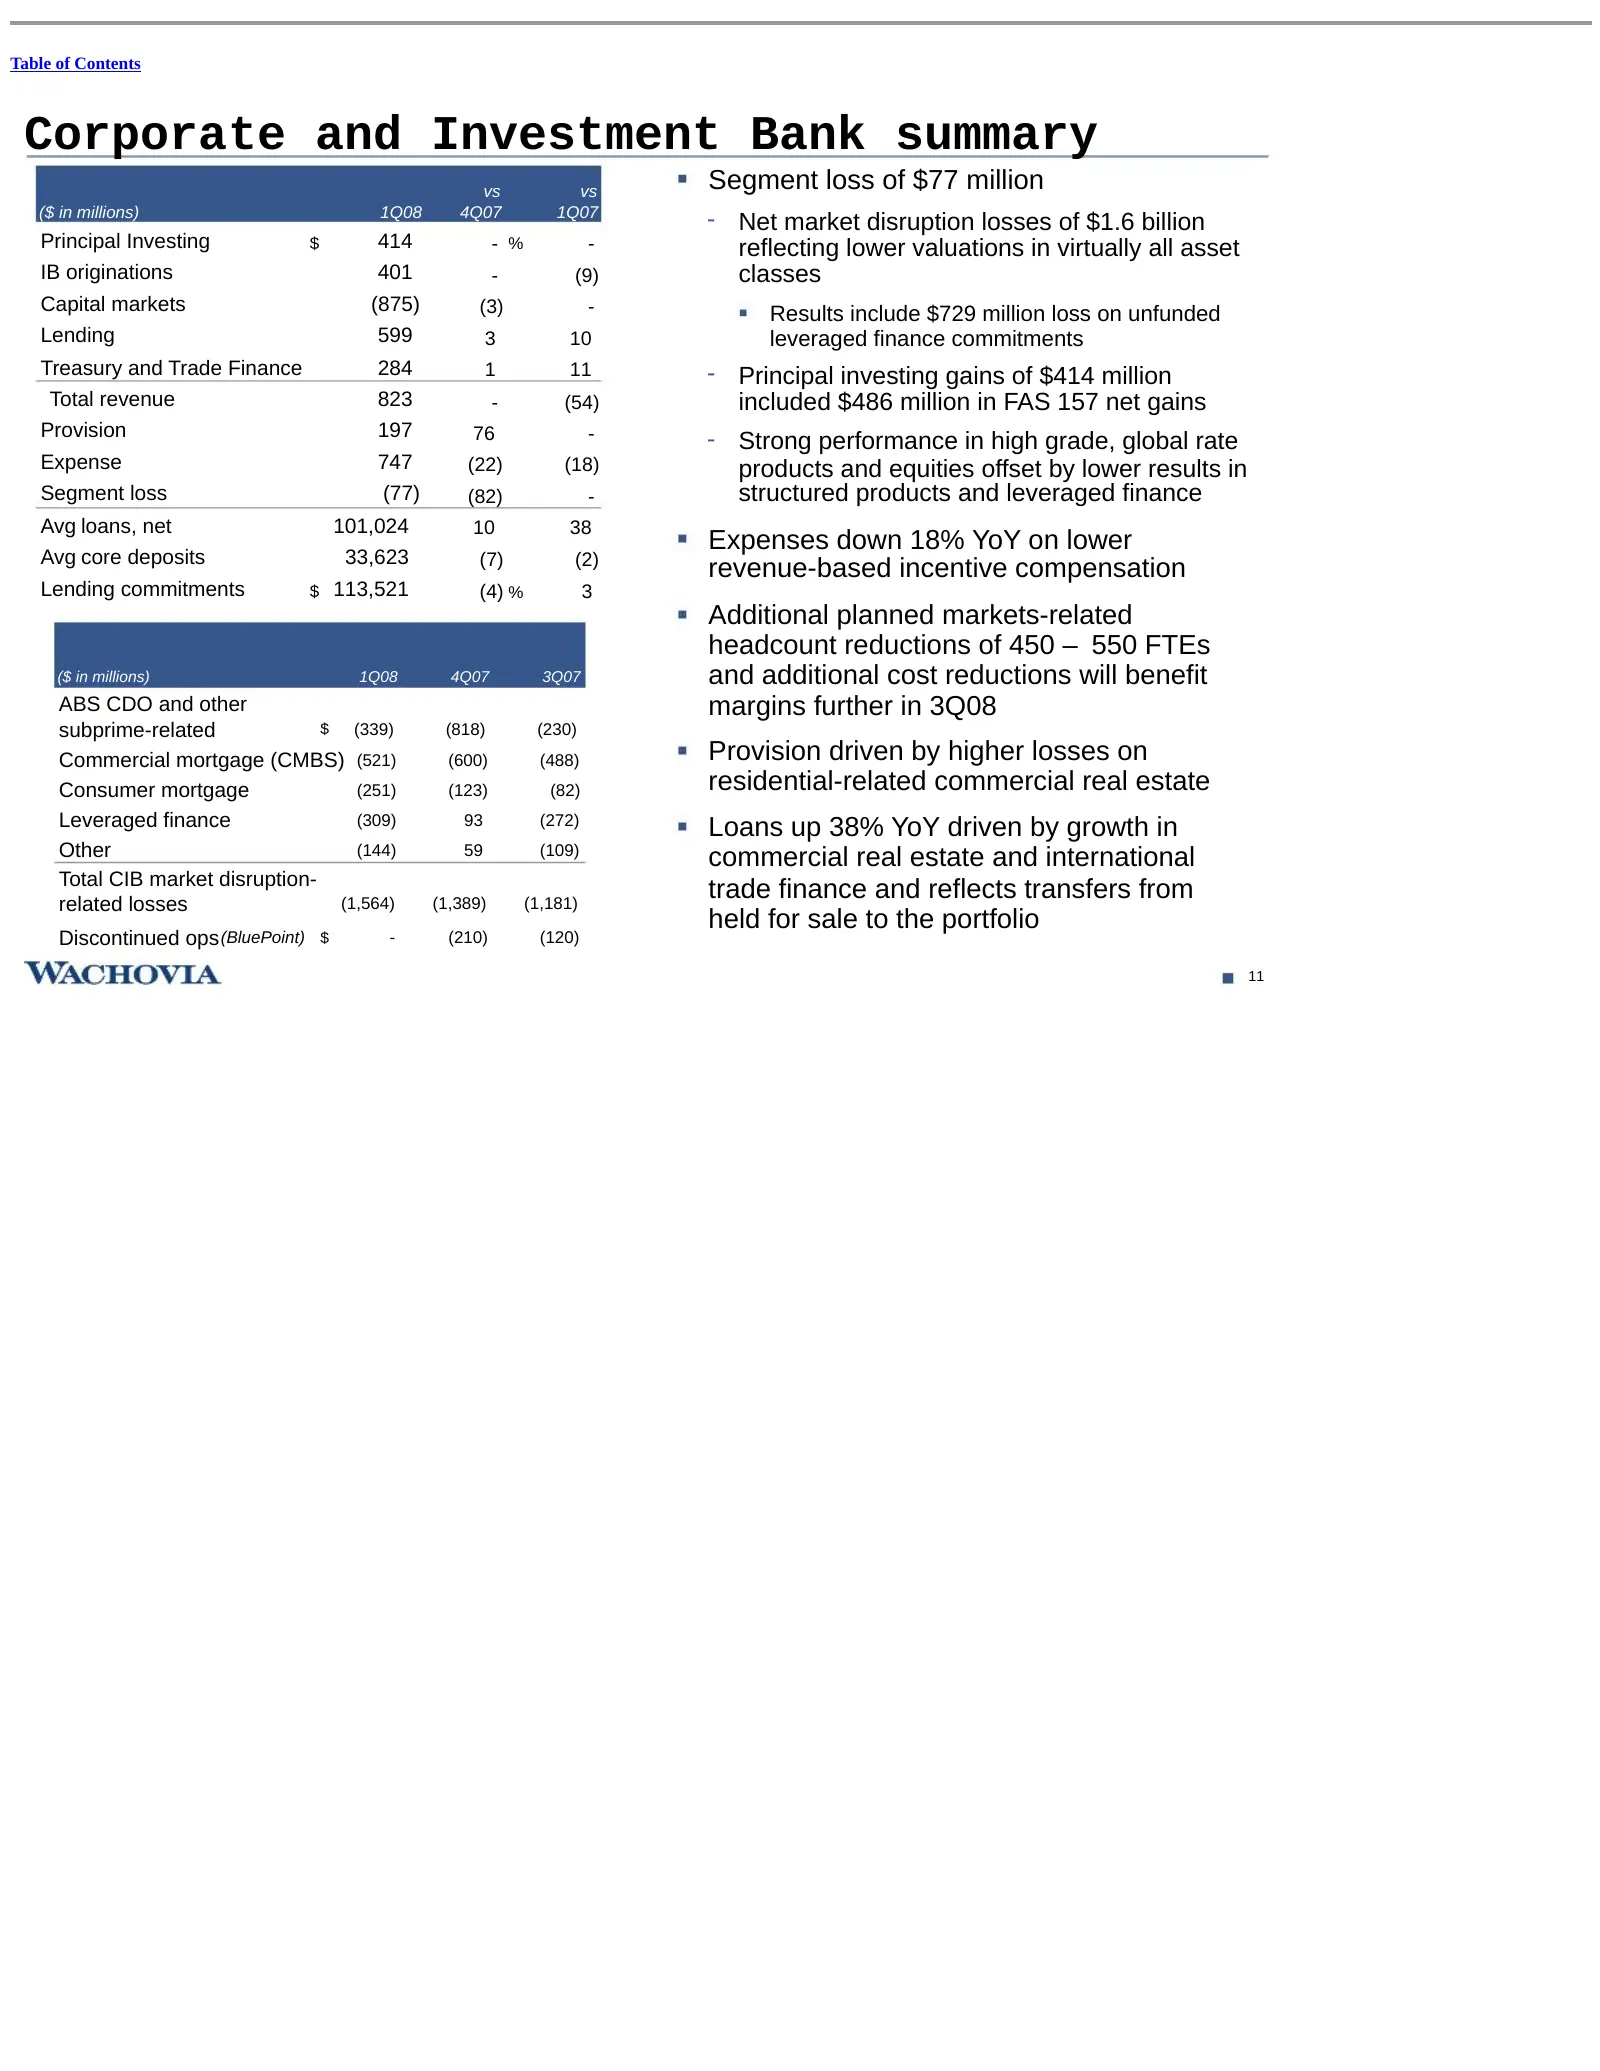
Table of Contents Corporate and Investment Bank summary vs vs Segment loss of $77 million ($ in millions) 1Q08 4Q07 1Q07 - Net market disruption losses of $1.6 billion Principal Investing $ 414 - % - reflecting lower valuations in virtually all asset IB originations 401 - (9) classes Capital markets
Slide 35: Commercial mortgage and leveraged finance
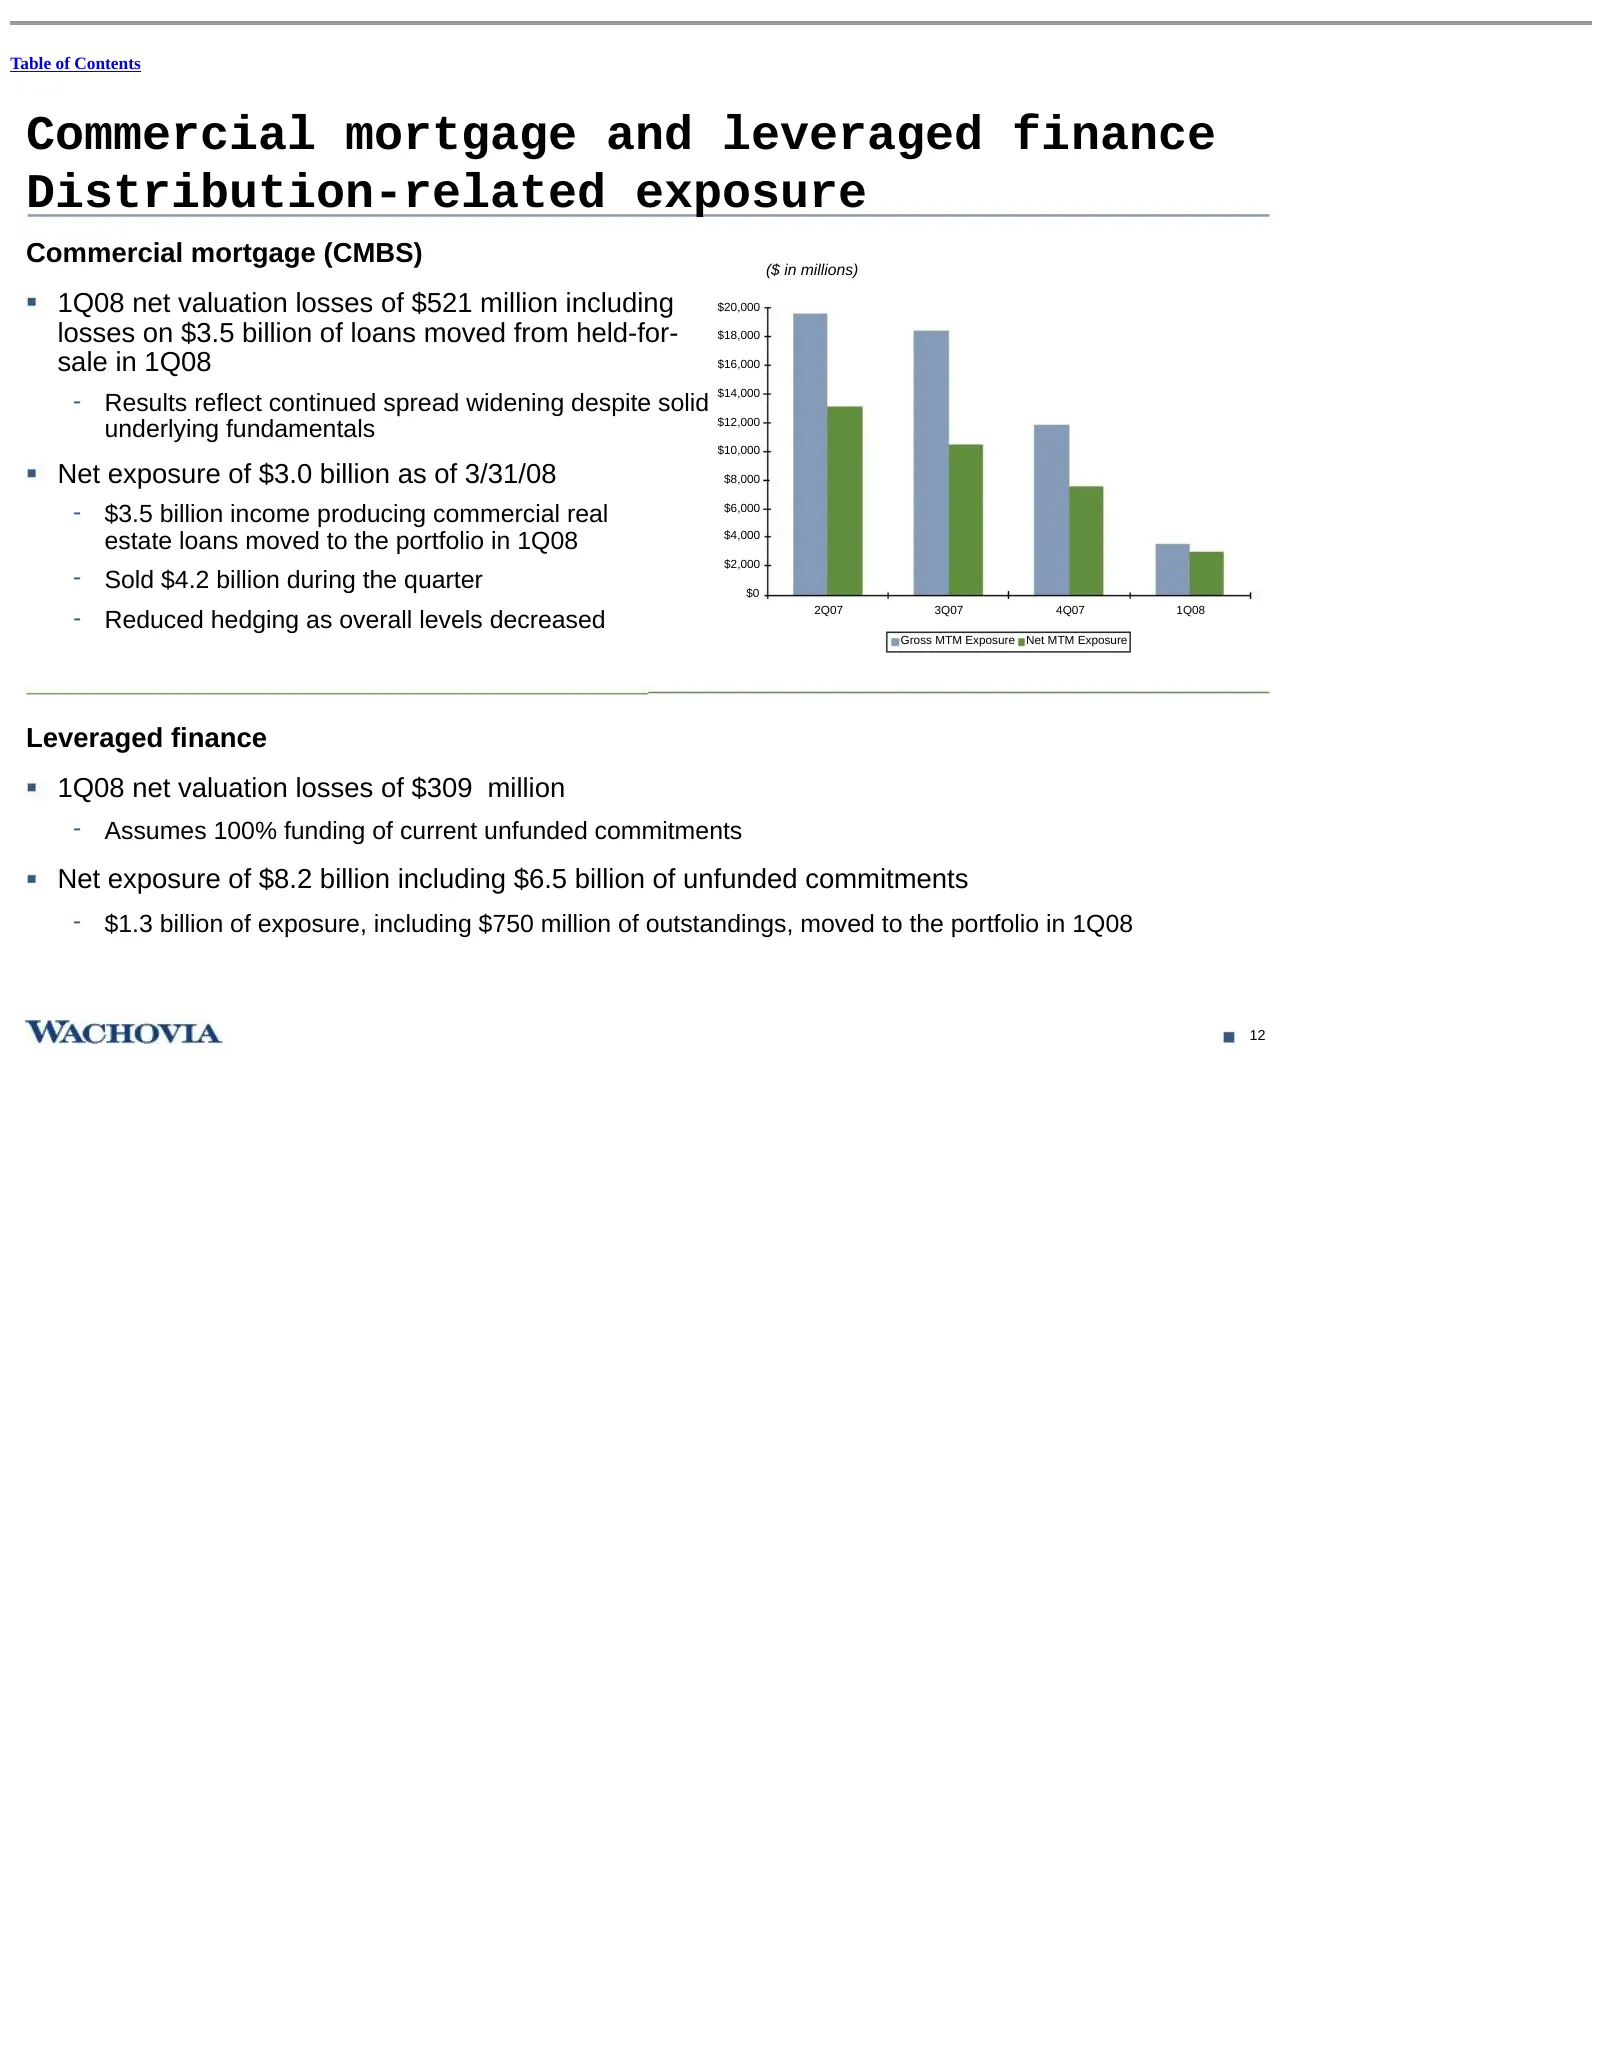
Table of Contents Commercial mortgage and leveraged finance Distribution-related exposure Commercial mortgage (CMBS) ($ in millions) 1Q08 net valuation losses of $521 million including $20,000 losses on $3.5 billion of loans moved from held-for- $18,000 sale in 1Q08 $16,000 - Results reflect continu
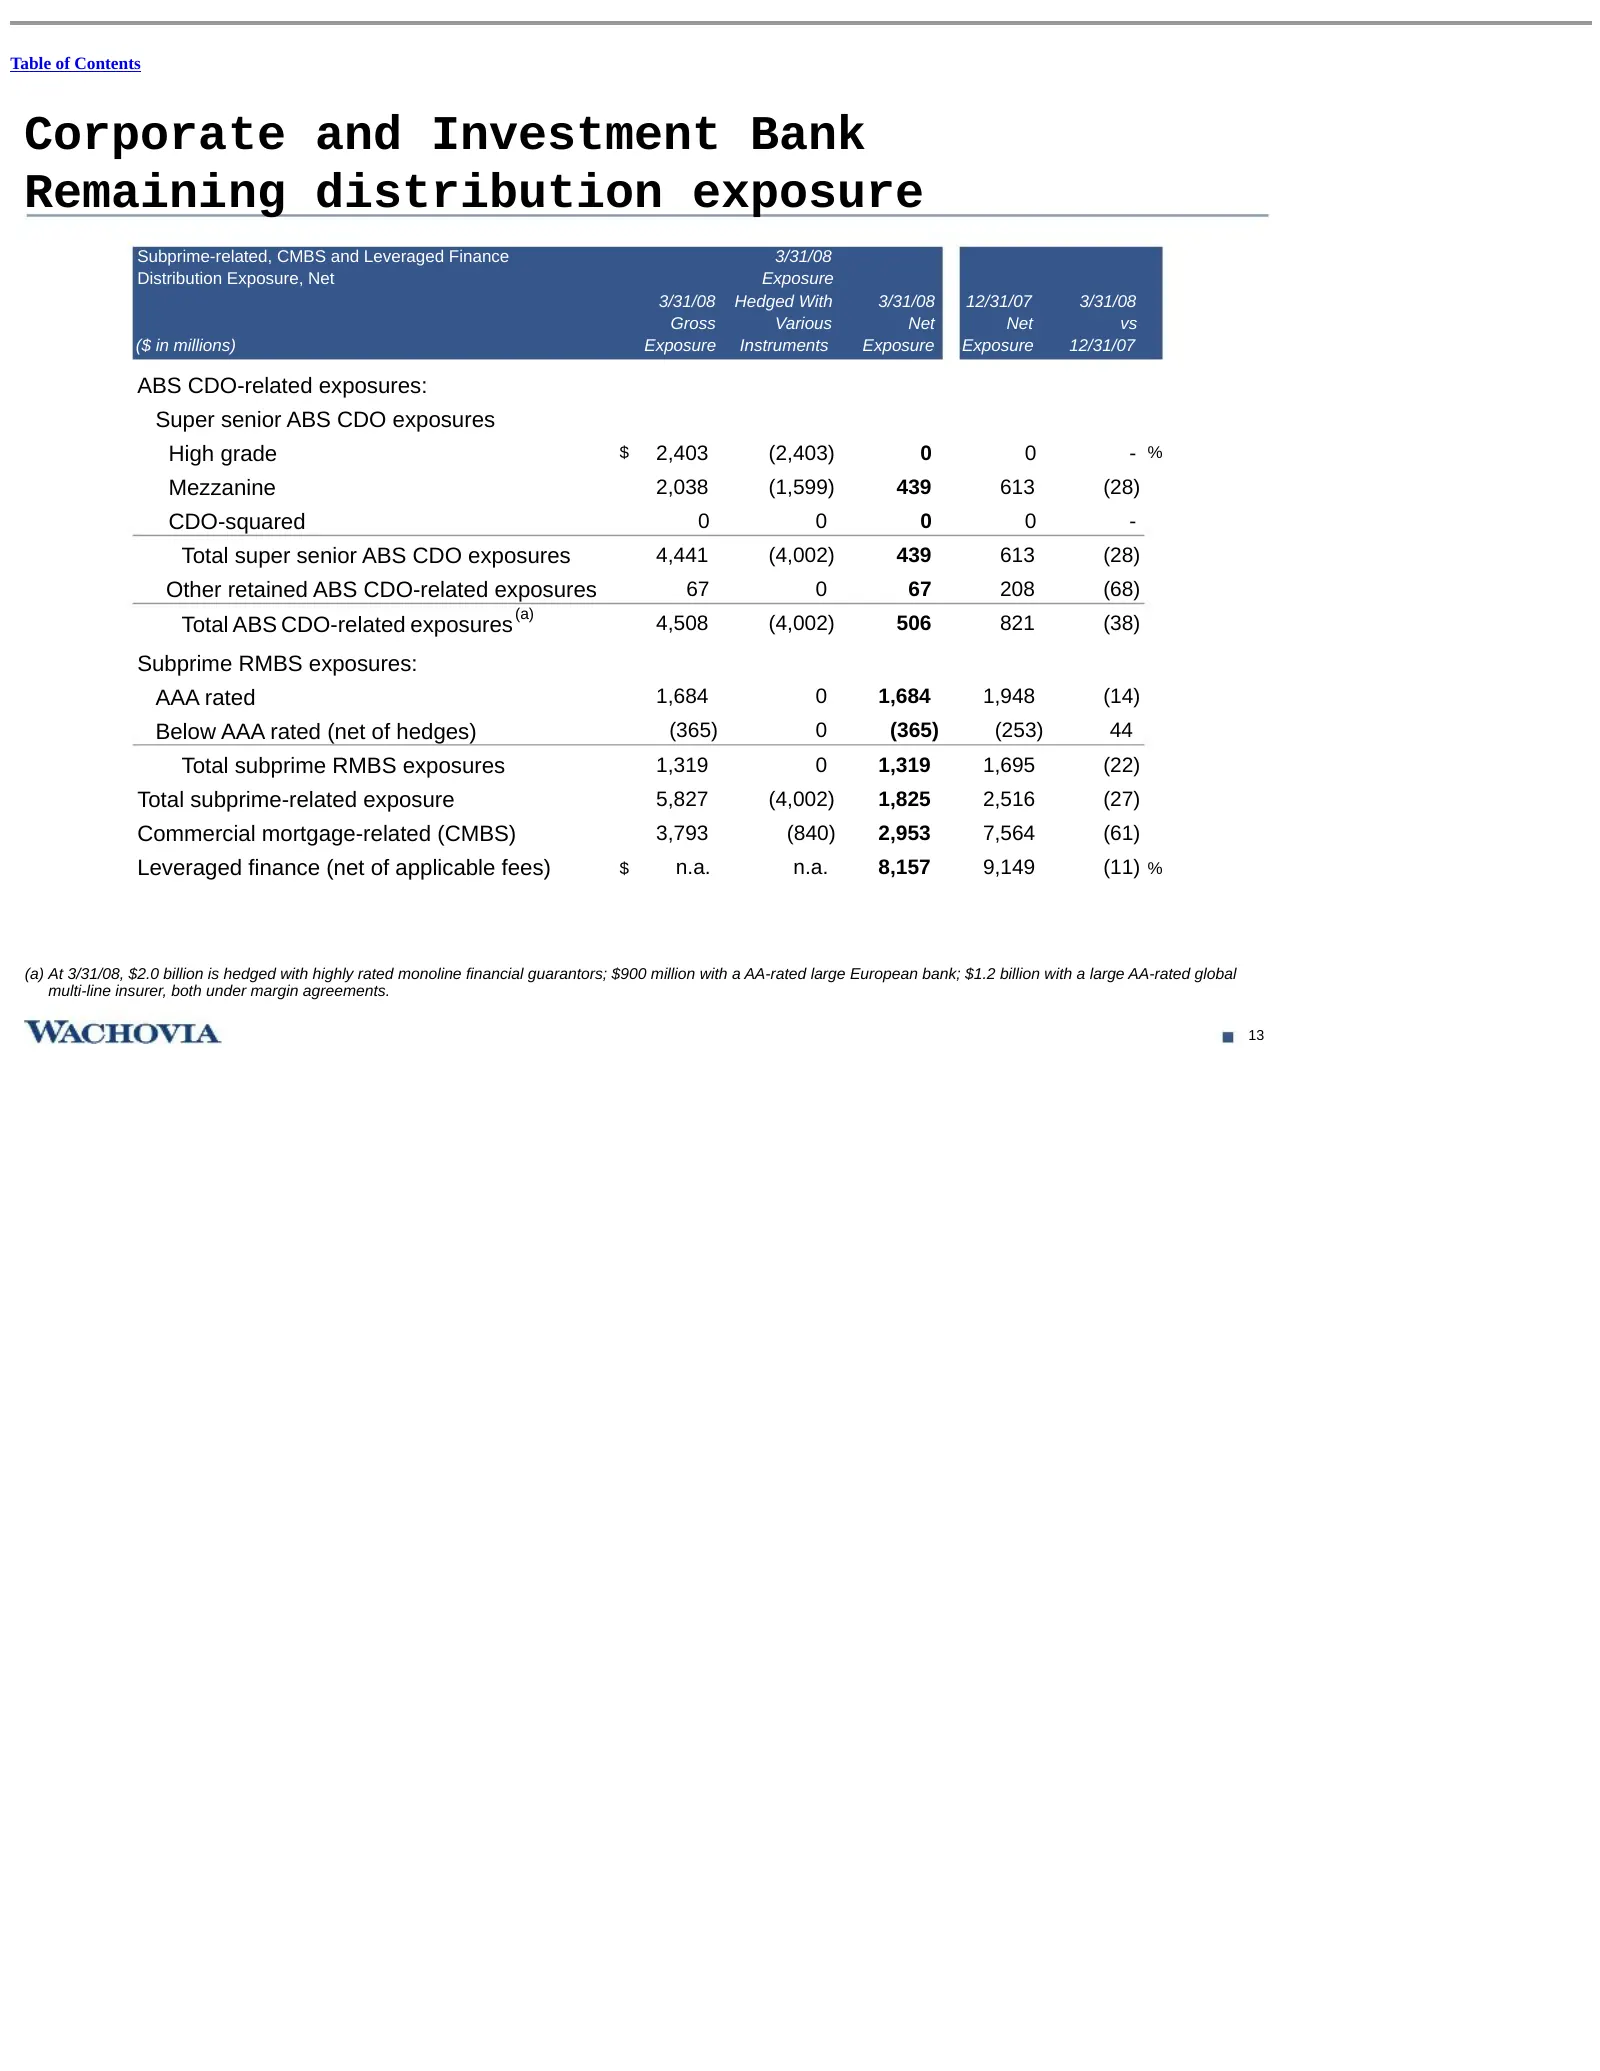
Slide 36: Corporate and Investment Bank: Remaining distribution exposure
Table of Contents Corporate and Investment Bank Remaining distribution exposure Subprime-related, CMBS and Leveraged Finance 3/31/08 Distribution Exposure, Net Exposure 3/31/08 Hedged With 3/31/08 12/31/07 3/31/08 Gross Various Net Net vs ($ in millions) Exposure Instruments Exposure Exposure 12/31/
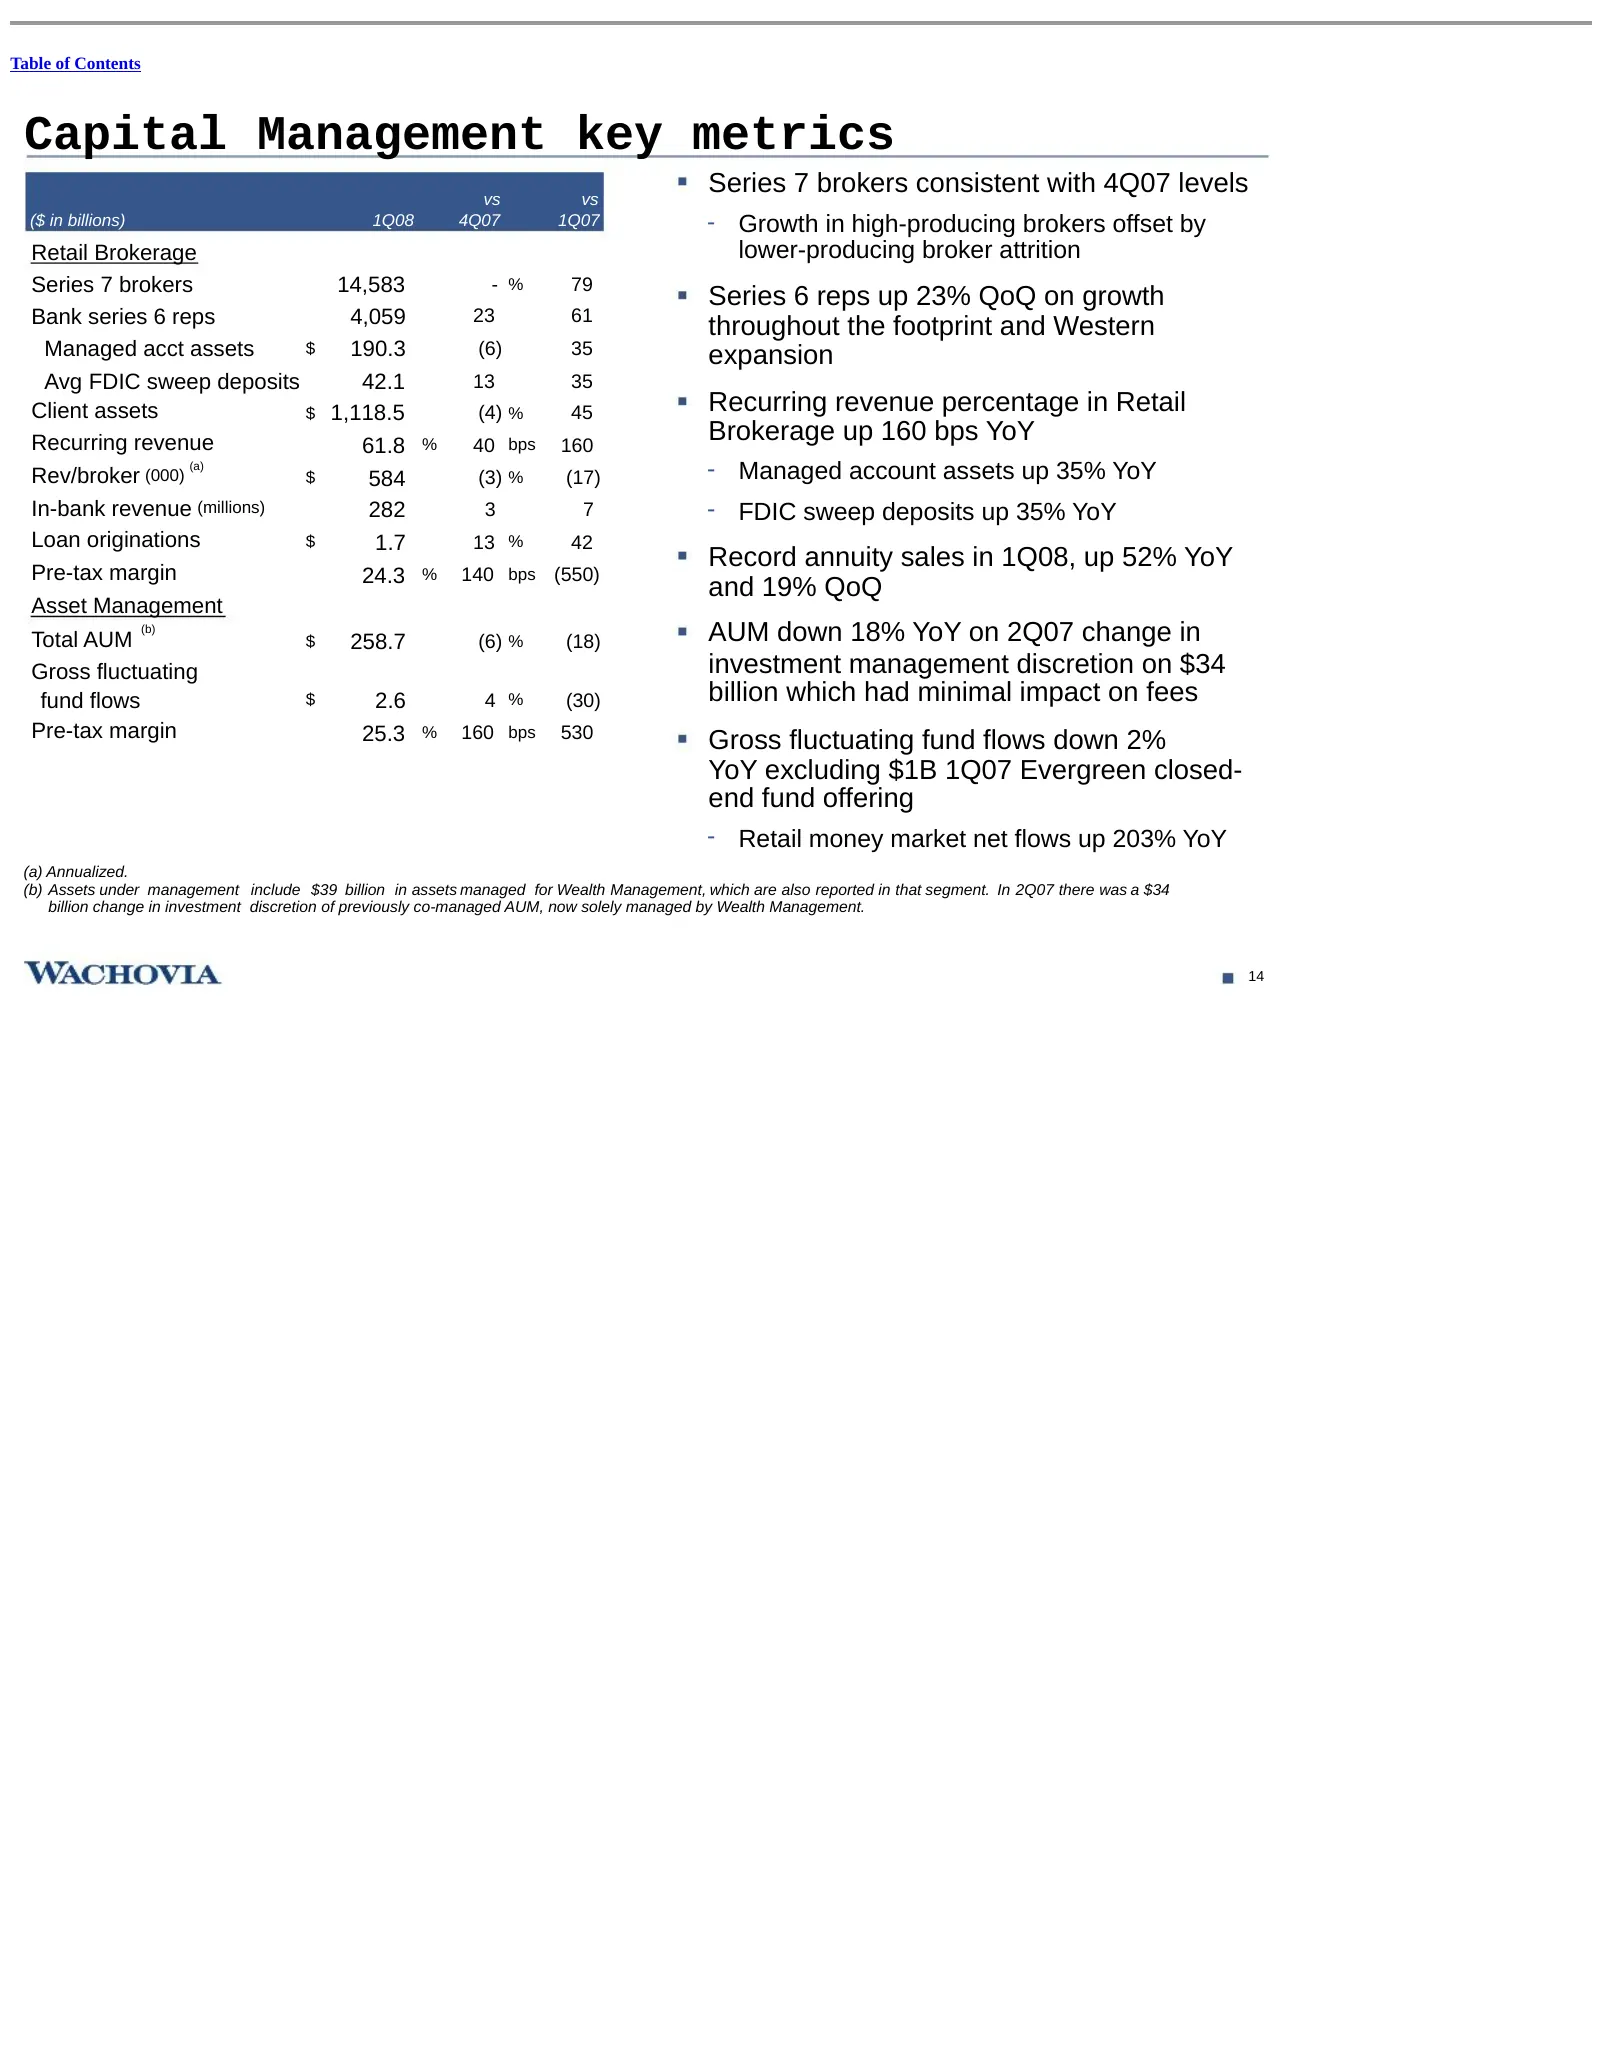
Slide 37: Capital Management key metrics
Table of Contents Capital Management key metrics vs vs Series 7 brokers consistent with 4Q07 levels ($ in billions) 1Q08 4Q07 1Q07 - Growth in high-producing brokers offset by Retail Brokerage lower-producing broker attrition Series 7 brokers 14,583 - % 79 Series 6 reps up 23% QoQ on growth Bank ser
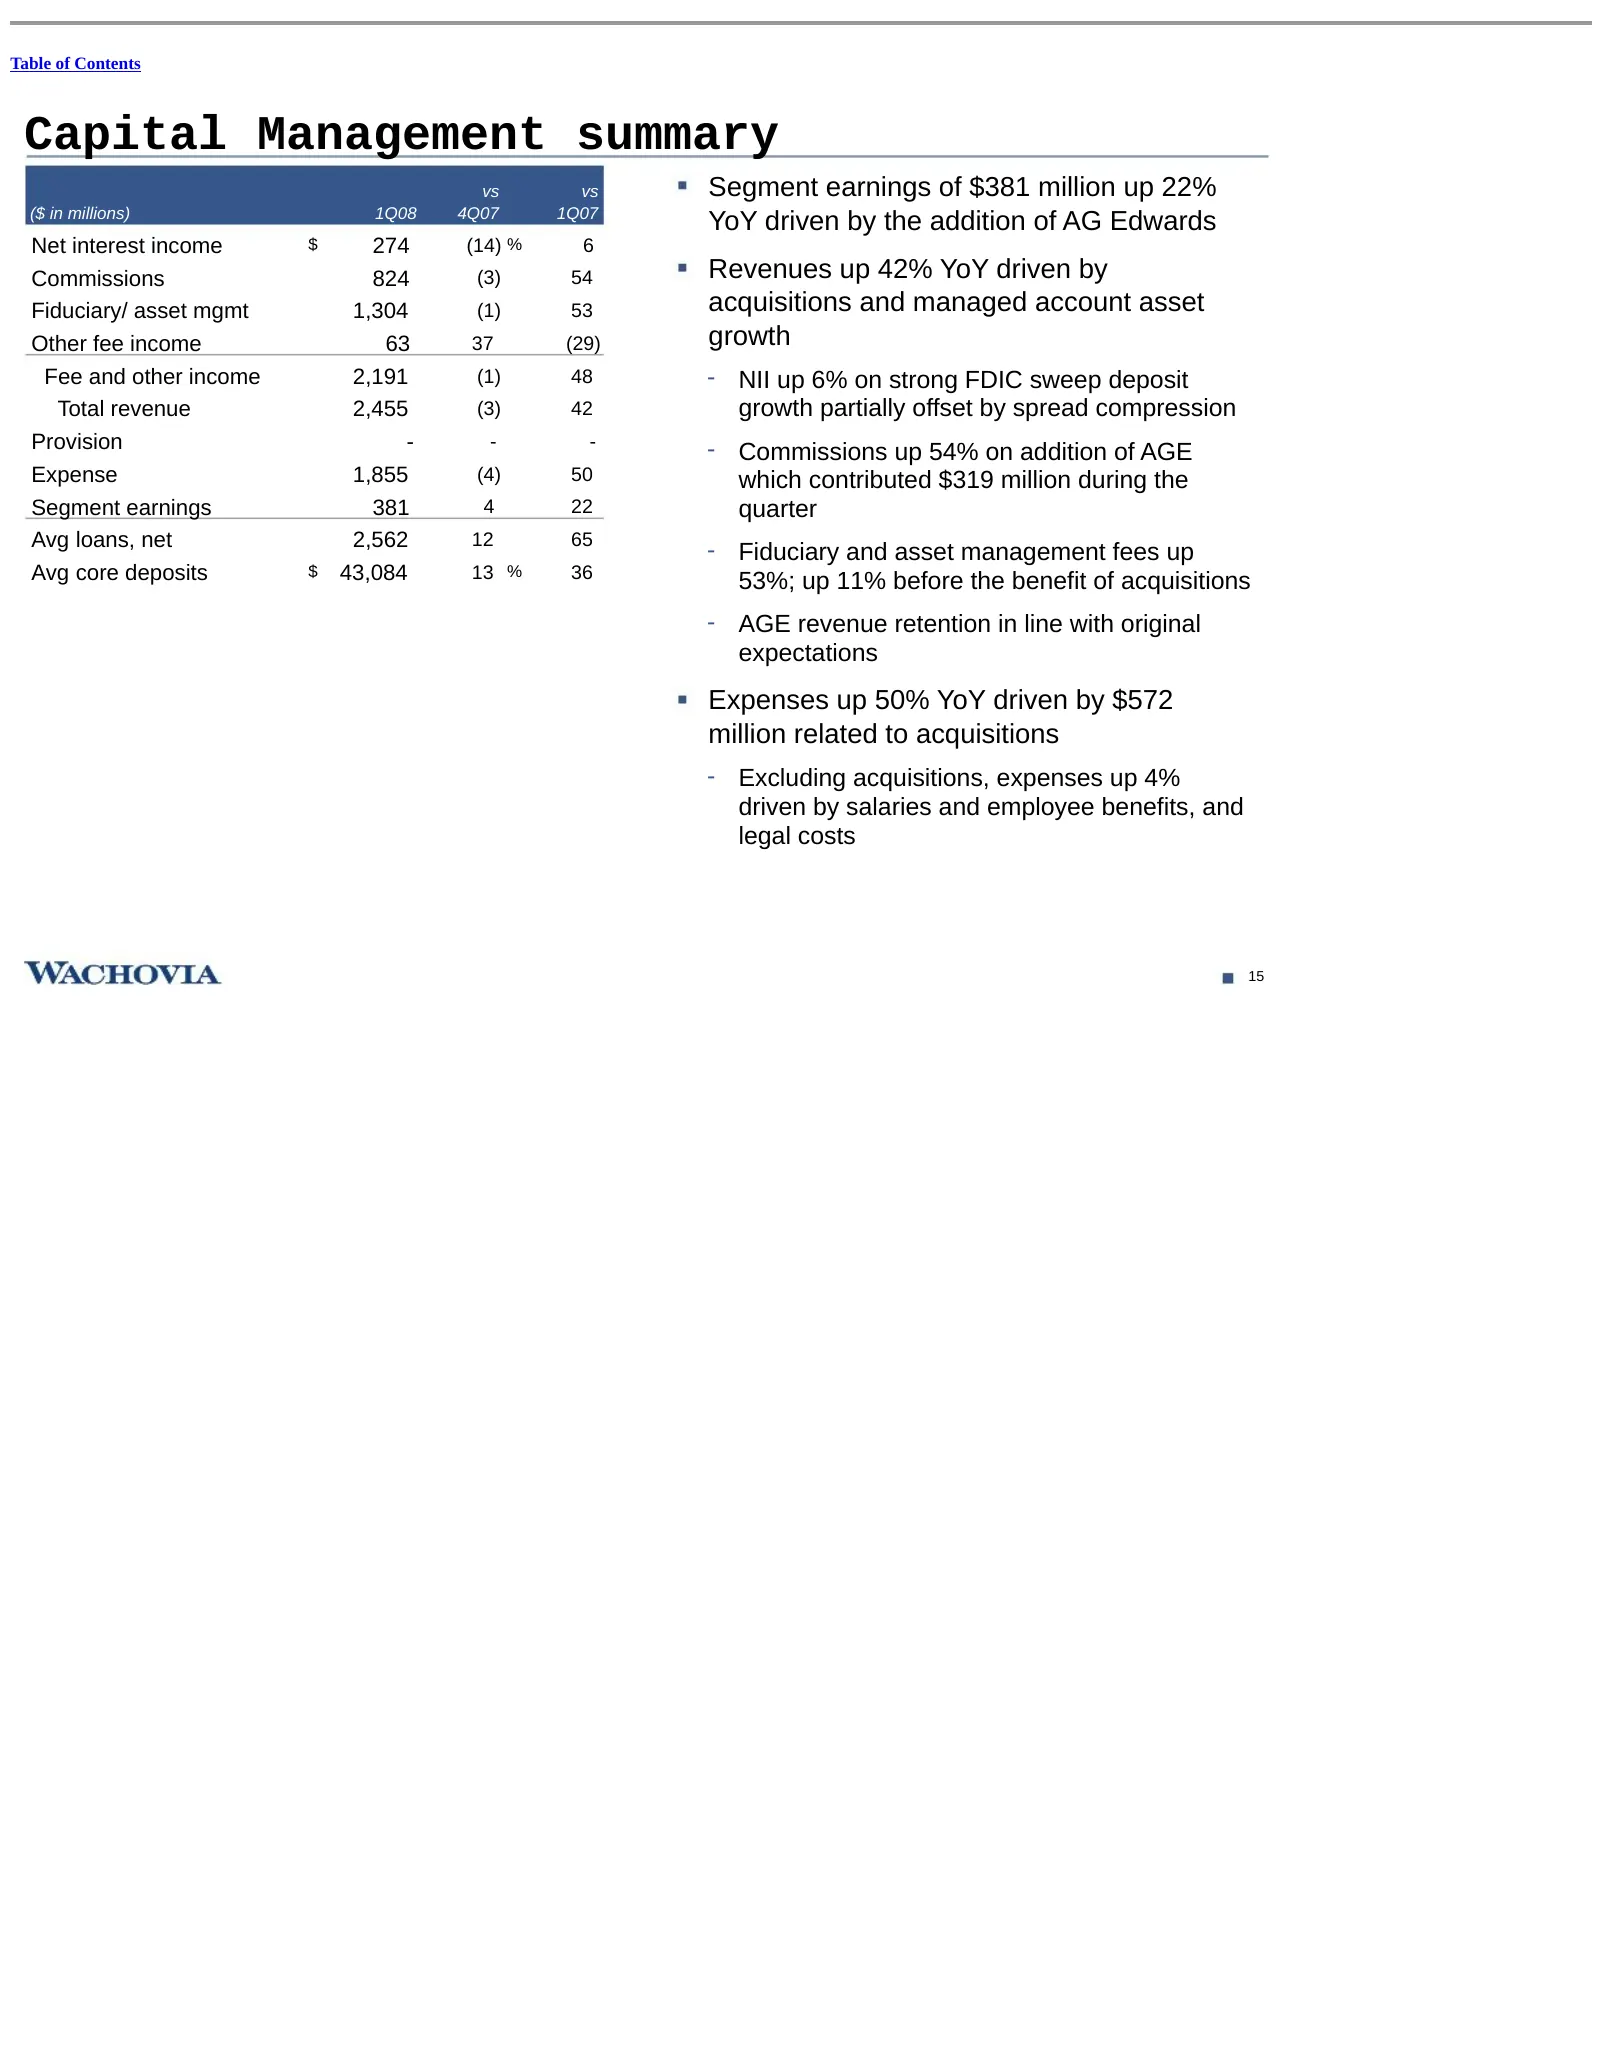
Slide 38: Capital Management summary
Table of Contents Capital Management summary vs vs Segment earnings of $381 million up 22% ($ in millions) 1Q08 4Q07 1Q07 YoY driven by the addition of AG Edwards Net interest income $ 274 (14) % 6 Commissions 824 (3) 54 Revenues up 42% YoY driven by Fiduciary/ asset mgmt 1,304 (1) 53 acquisitions a
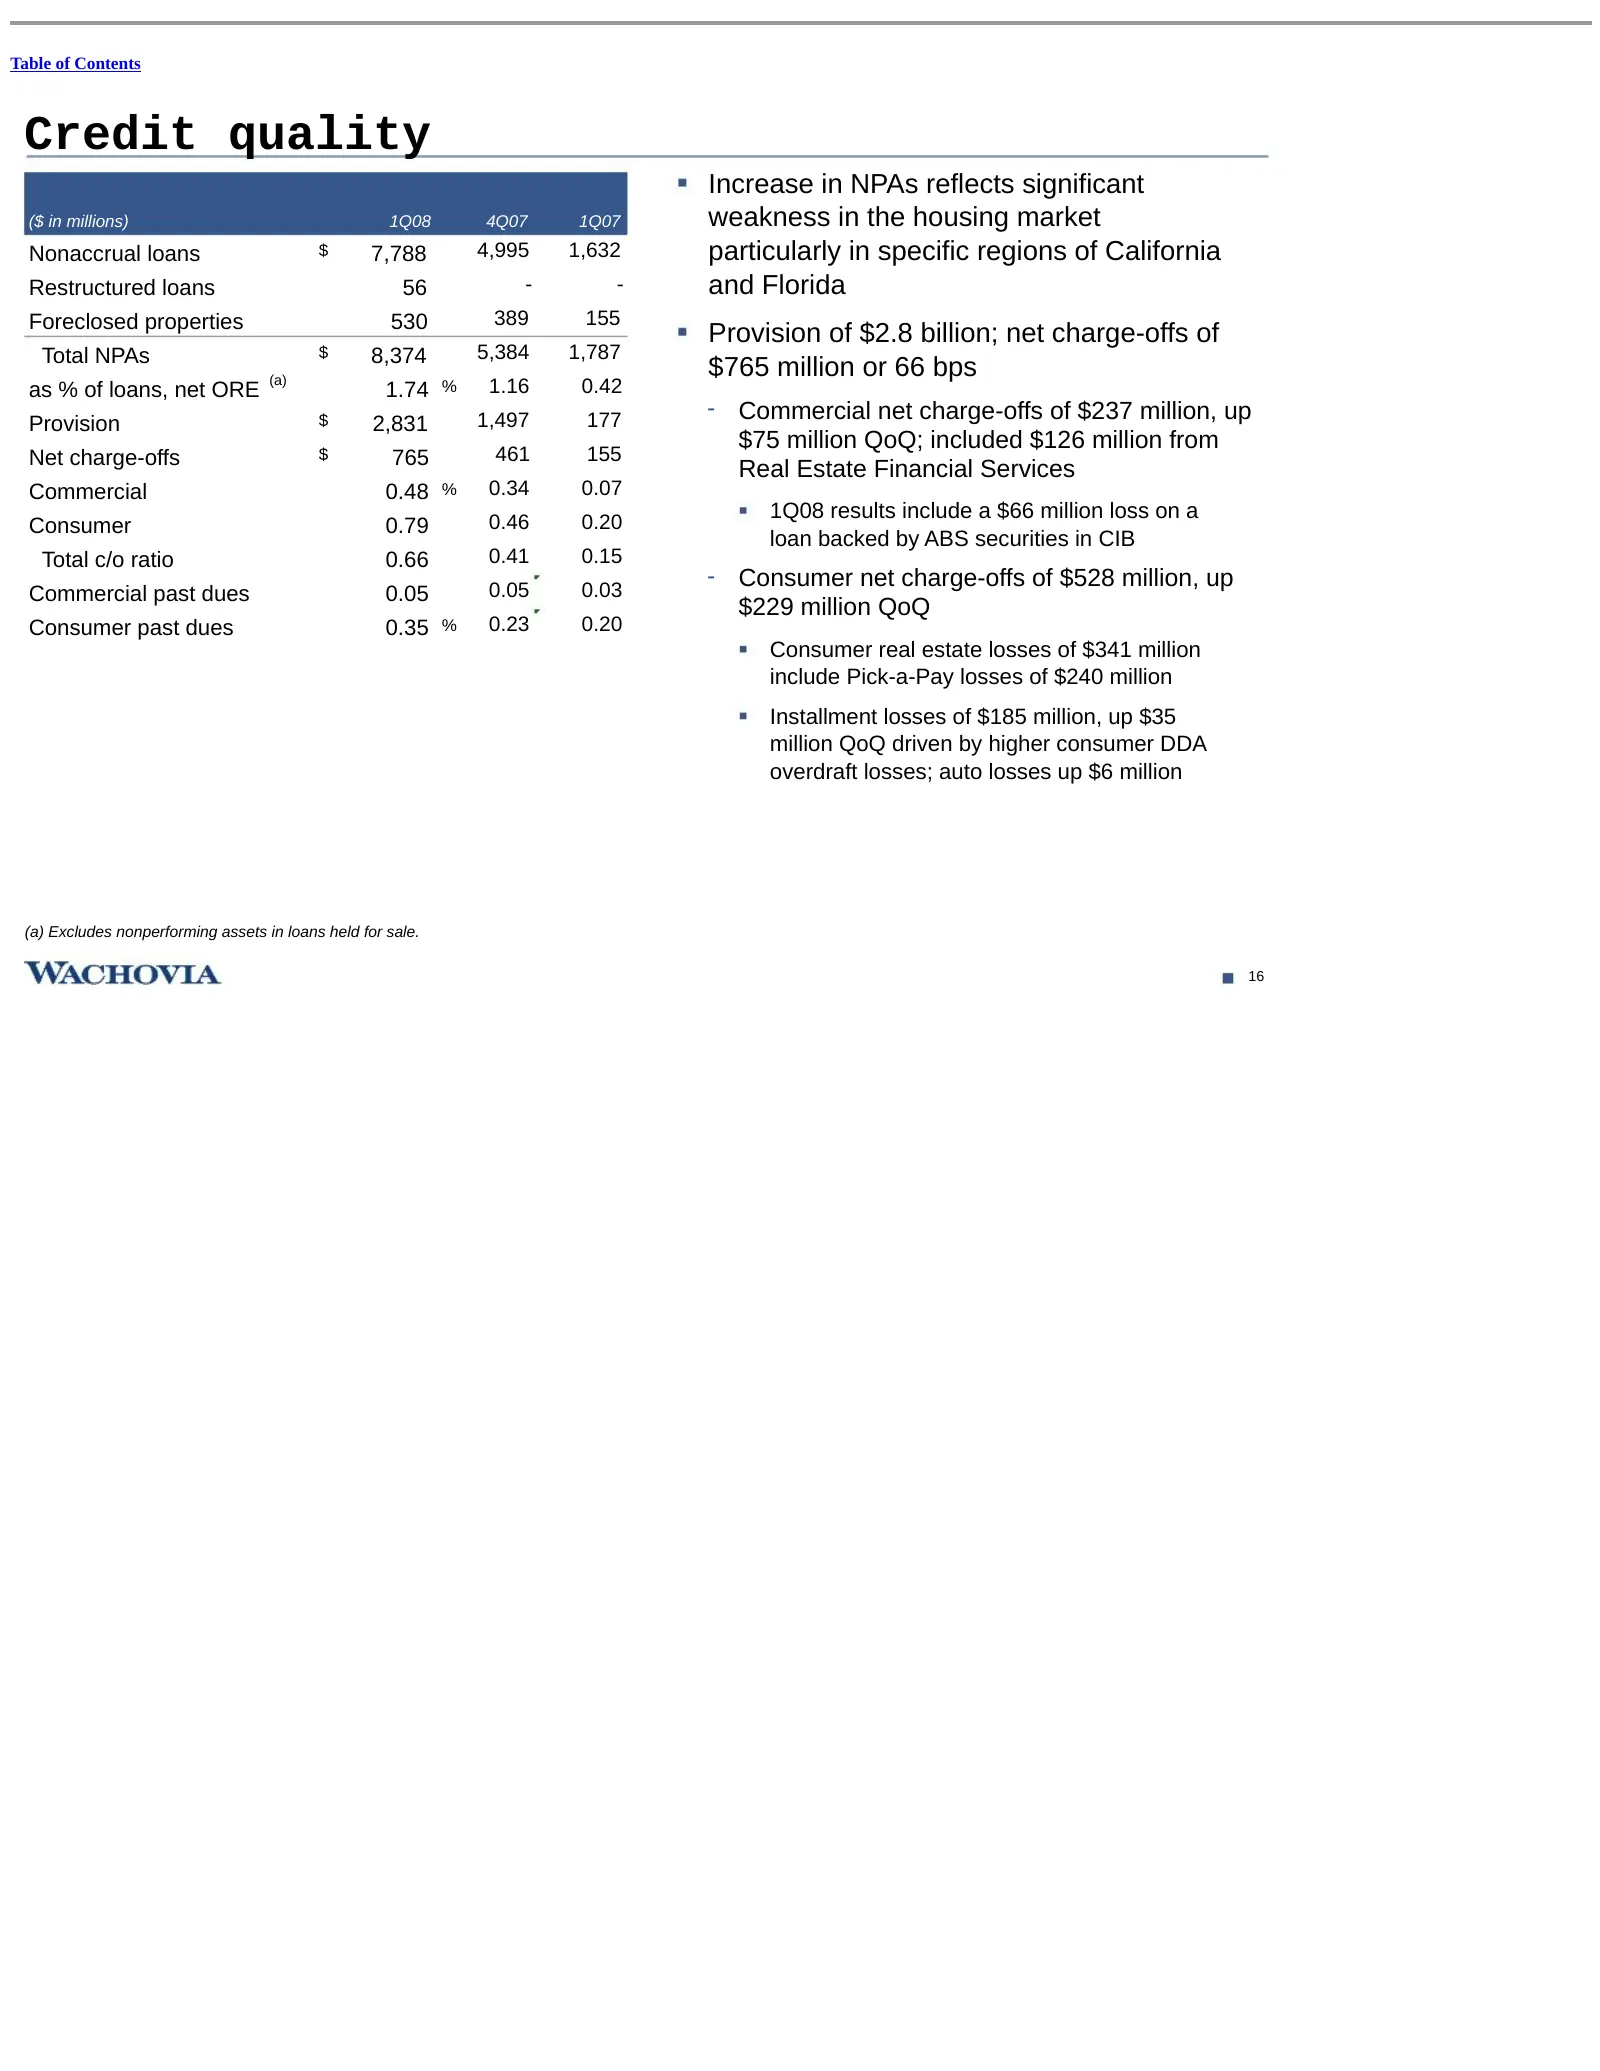
Slide 39: Credit quality
Table of Contents Credit quality Increase in NPAs reflects significant ($ in millions) 1Q08 4Q07 1Q07 weakness in the housing market Nonaccrual loans $ 7,788 4,995 1,632 particularly in specific regions of California Restructured loans 56 - - and Florida Foreclosed properties 530 389 155 Provision o
Slide 40: Allowance for credit losses
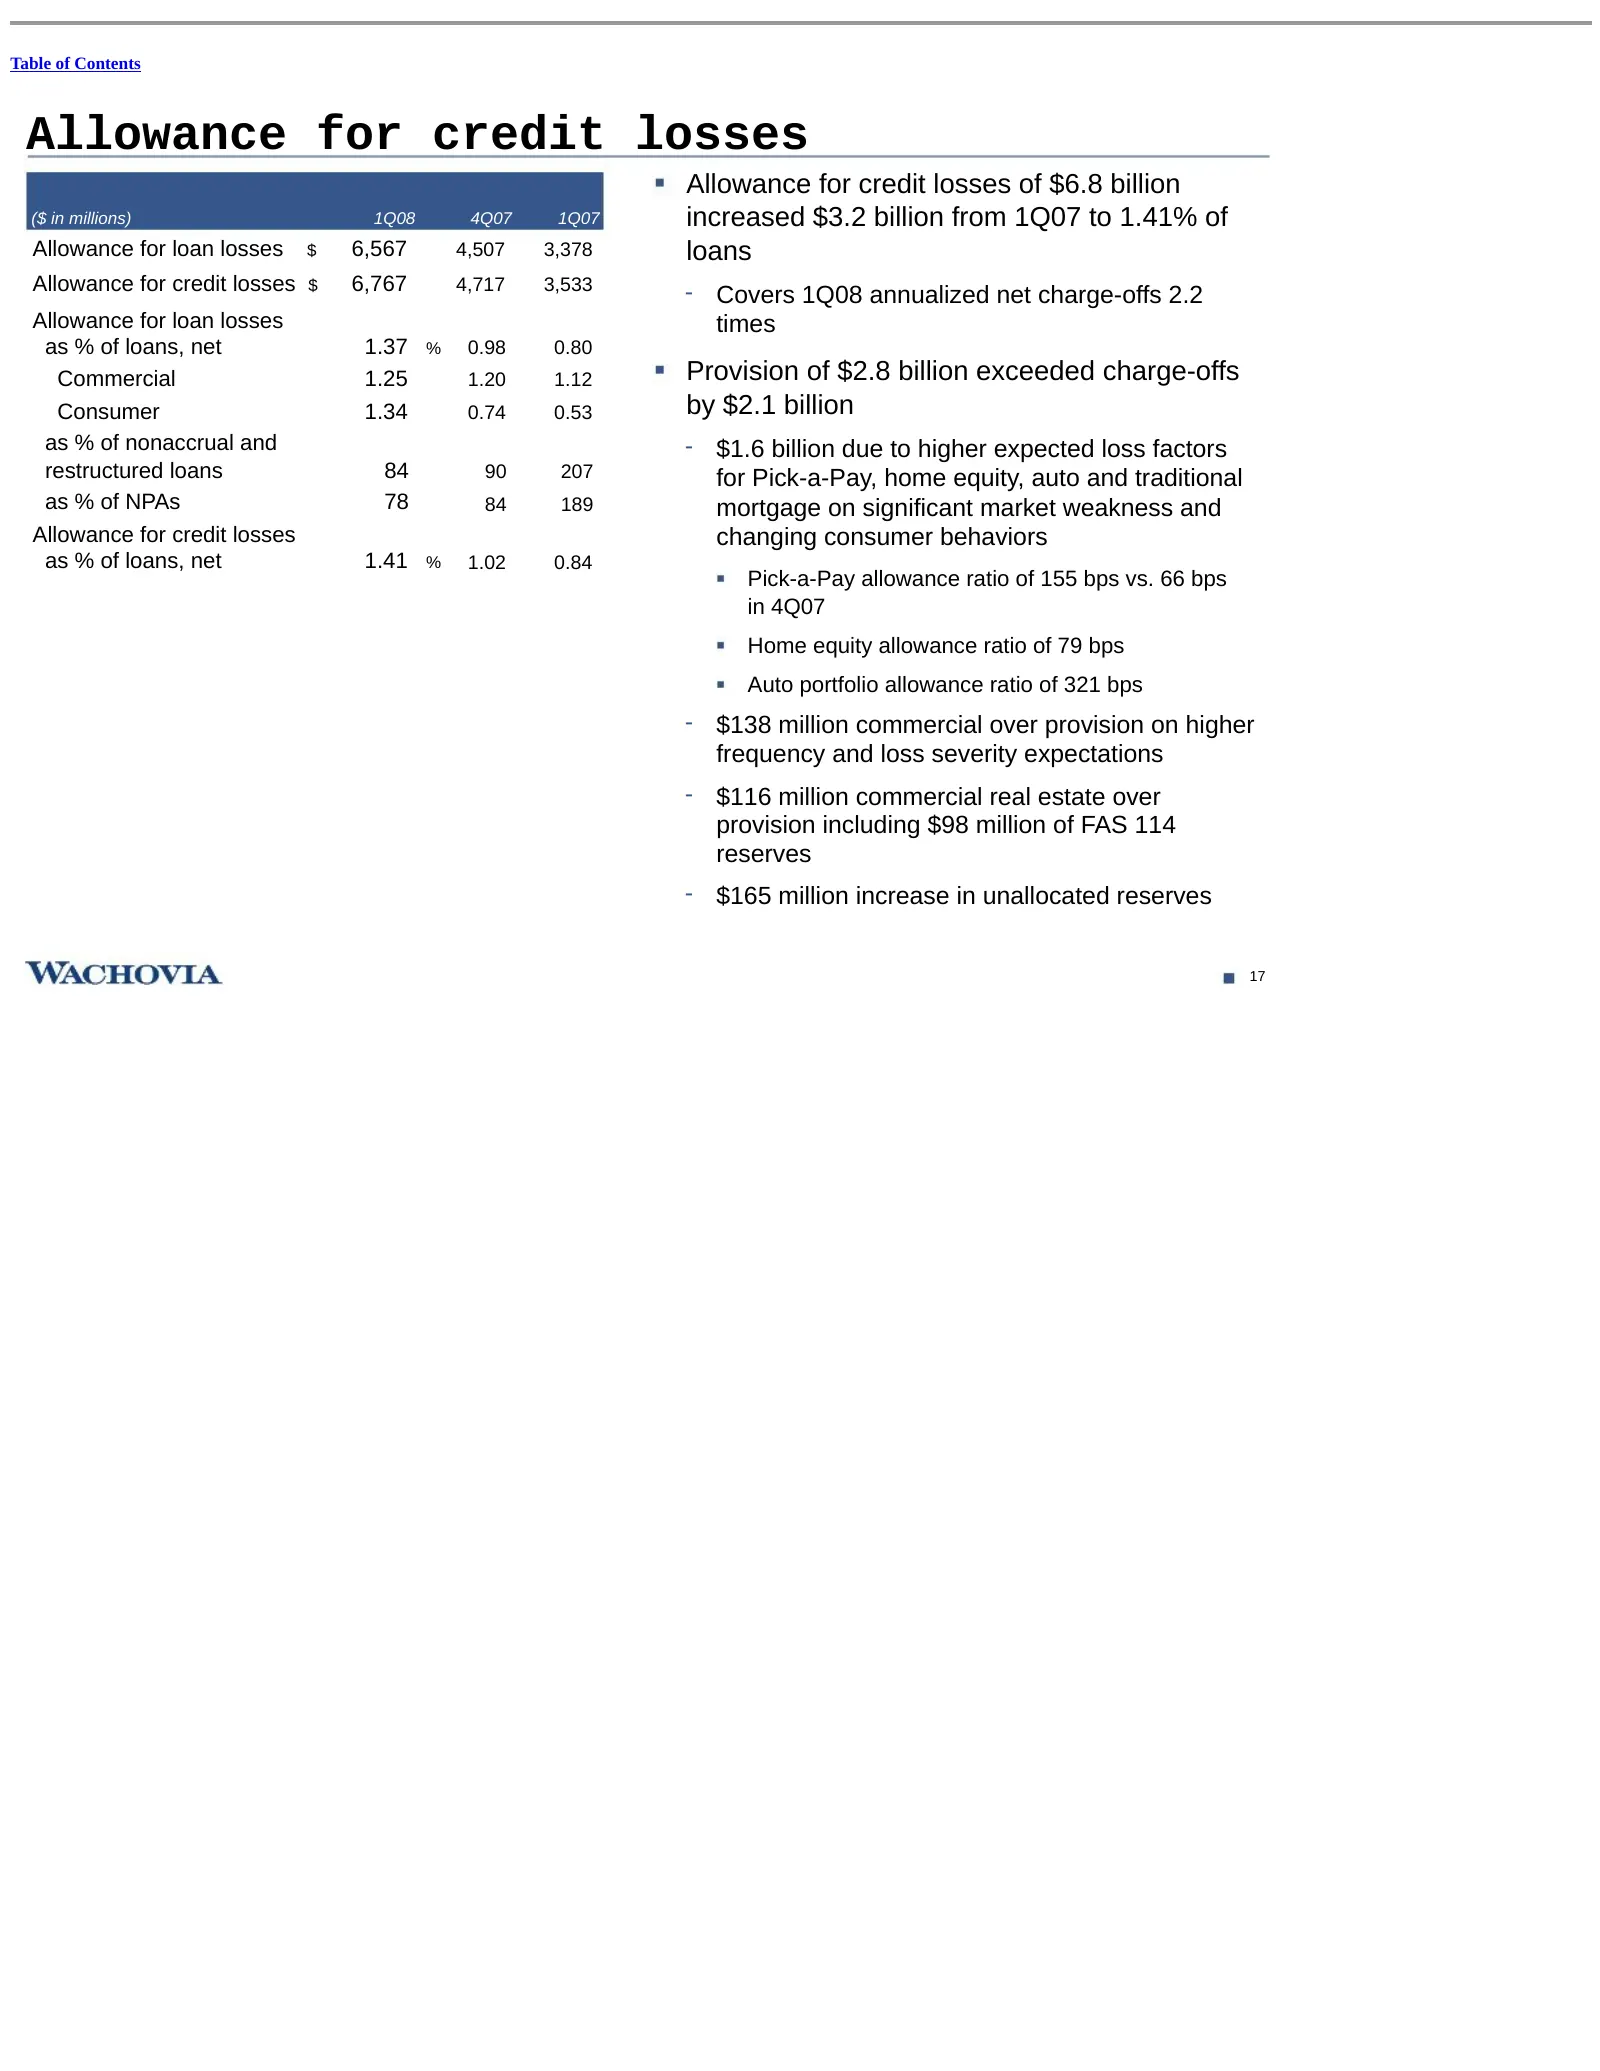
Table of Contents Allowance for credit losses Allowance for credit losses of $6.8 billion ($ in millions) 1Q08 4Q07 1Q07 increased $3.2 billion from 1Q07 to 1.41% of Allowance for loan losses $ 6,567 4,507 3,378 loans Allowance for credit losses $ 6,767 4,717 3,533 - Covers 1Q08 annualized net charg
Slide 41: Mortgage portfolio
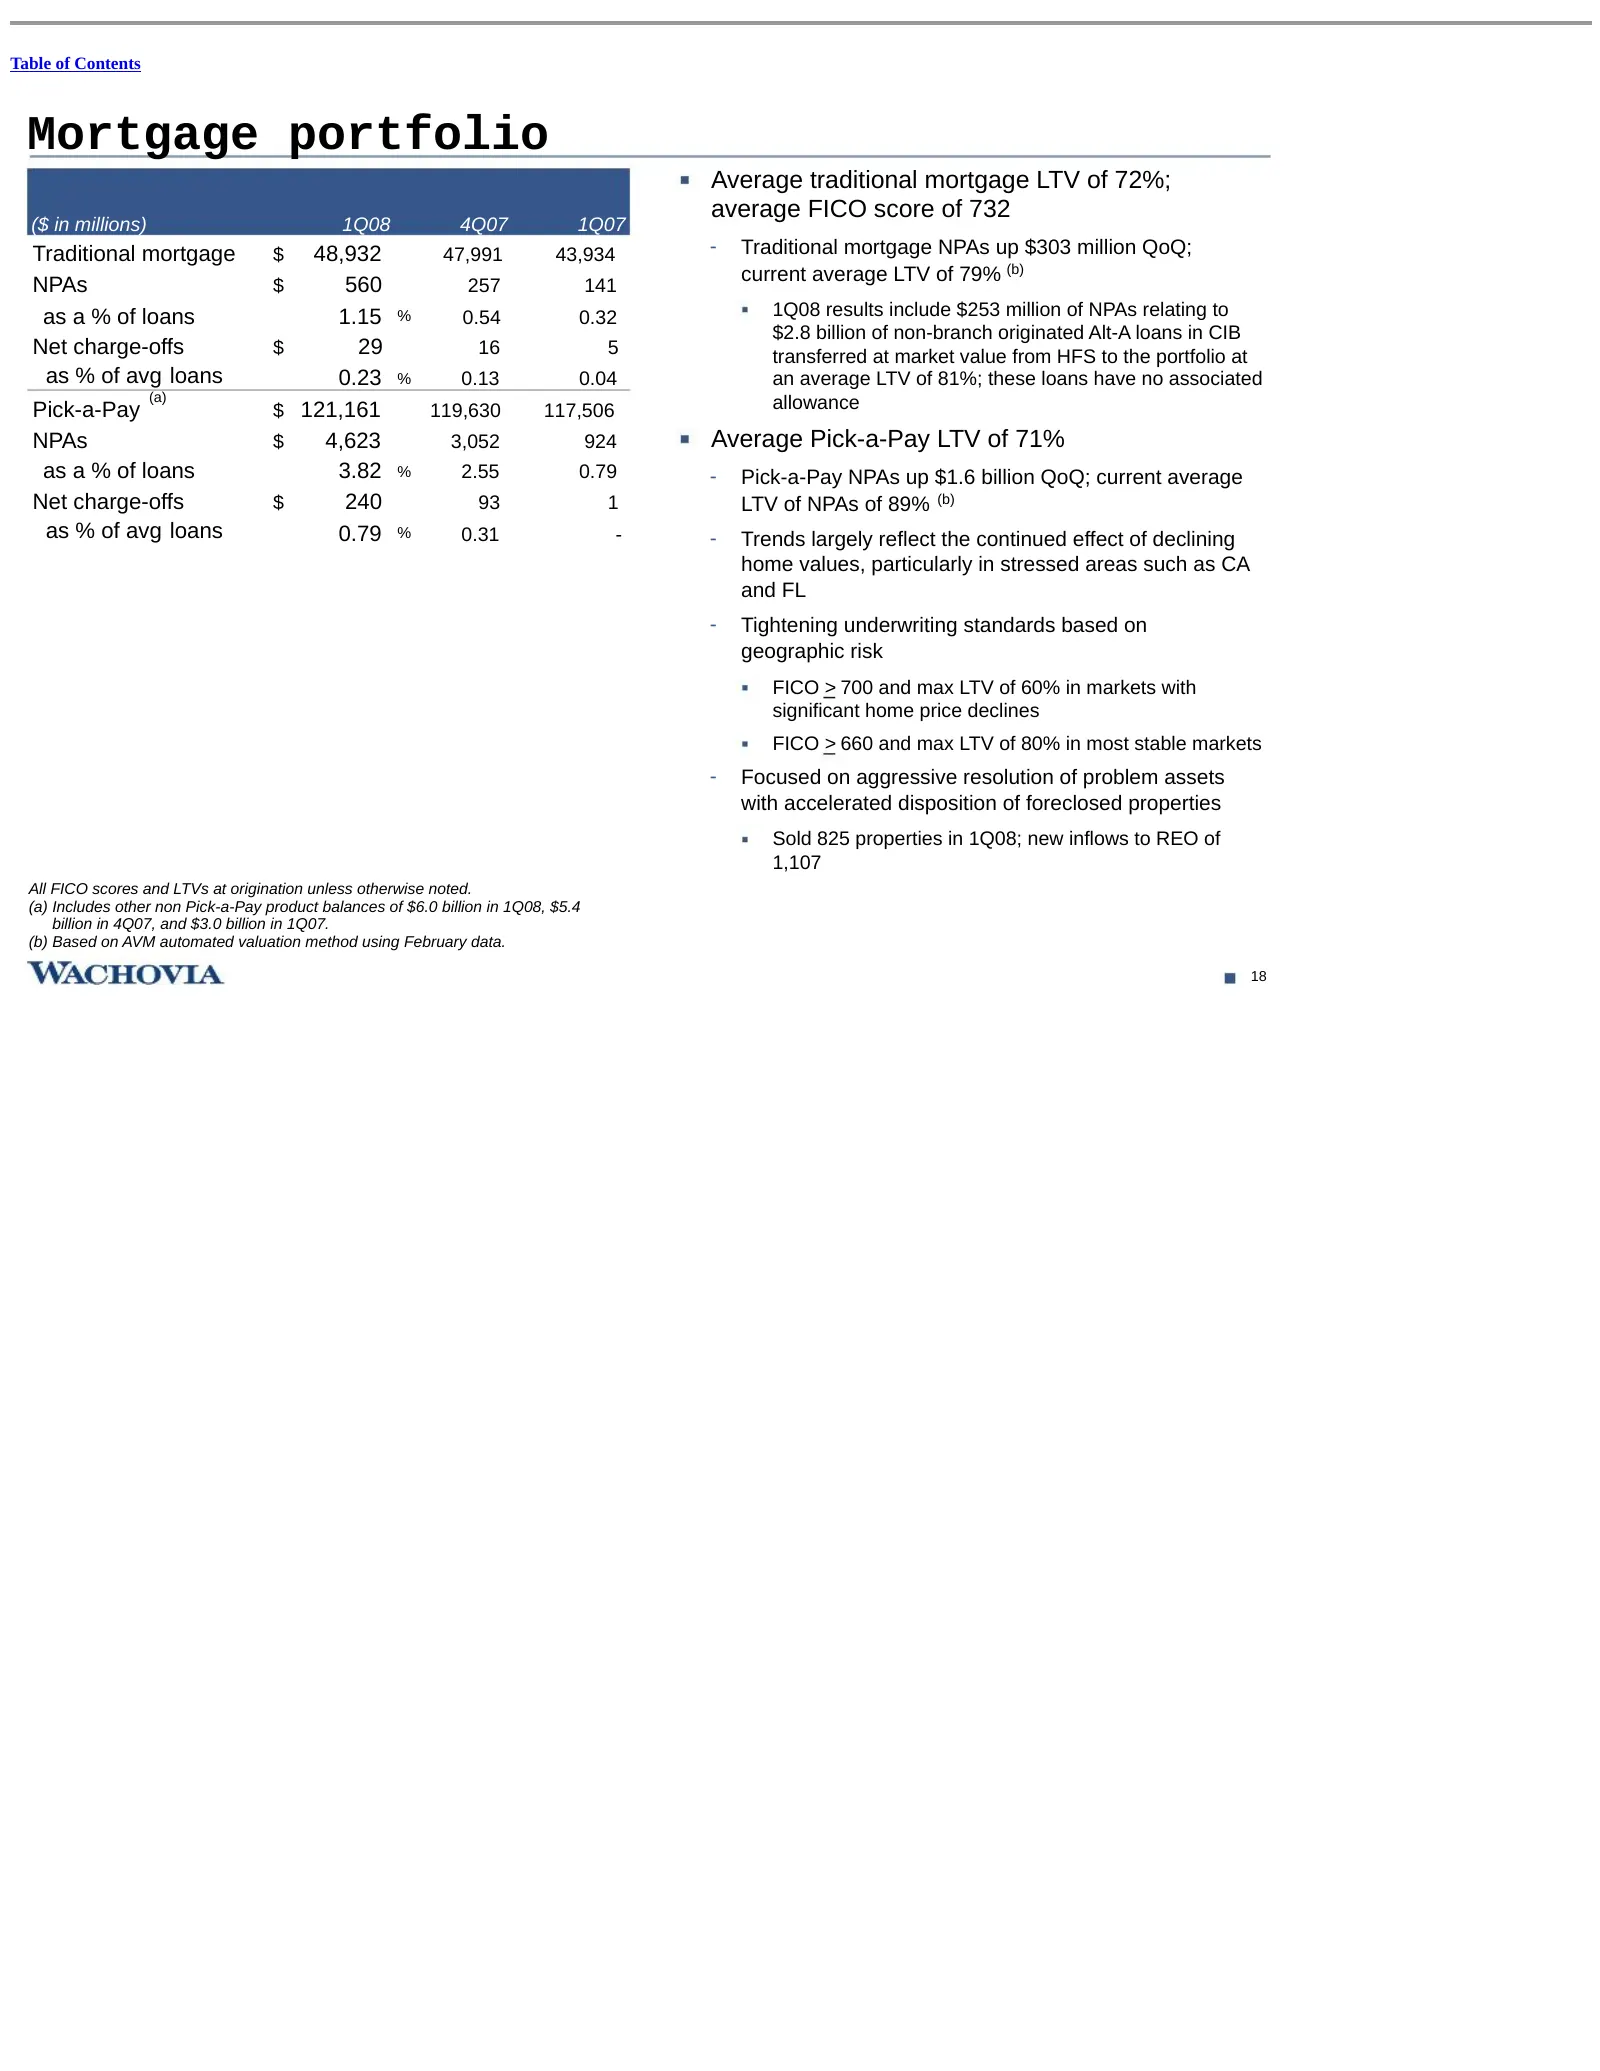
Table of Contents Mortgage portfolio Average traditional mortgage LTV of 72%; average FICO score of 732 ($ in millions) 1Q08 4Q07 1Q07 Traditional mortgage $ 48,932 47,991 43,934 - Traditional mortgage NPAs up $303 million QoQ; current average LTV of 79% (b) NPAs $ 560 257 141 as a % of loans 1.15 %
Slide 42: Mortgage 90+ days past due vs. industry
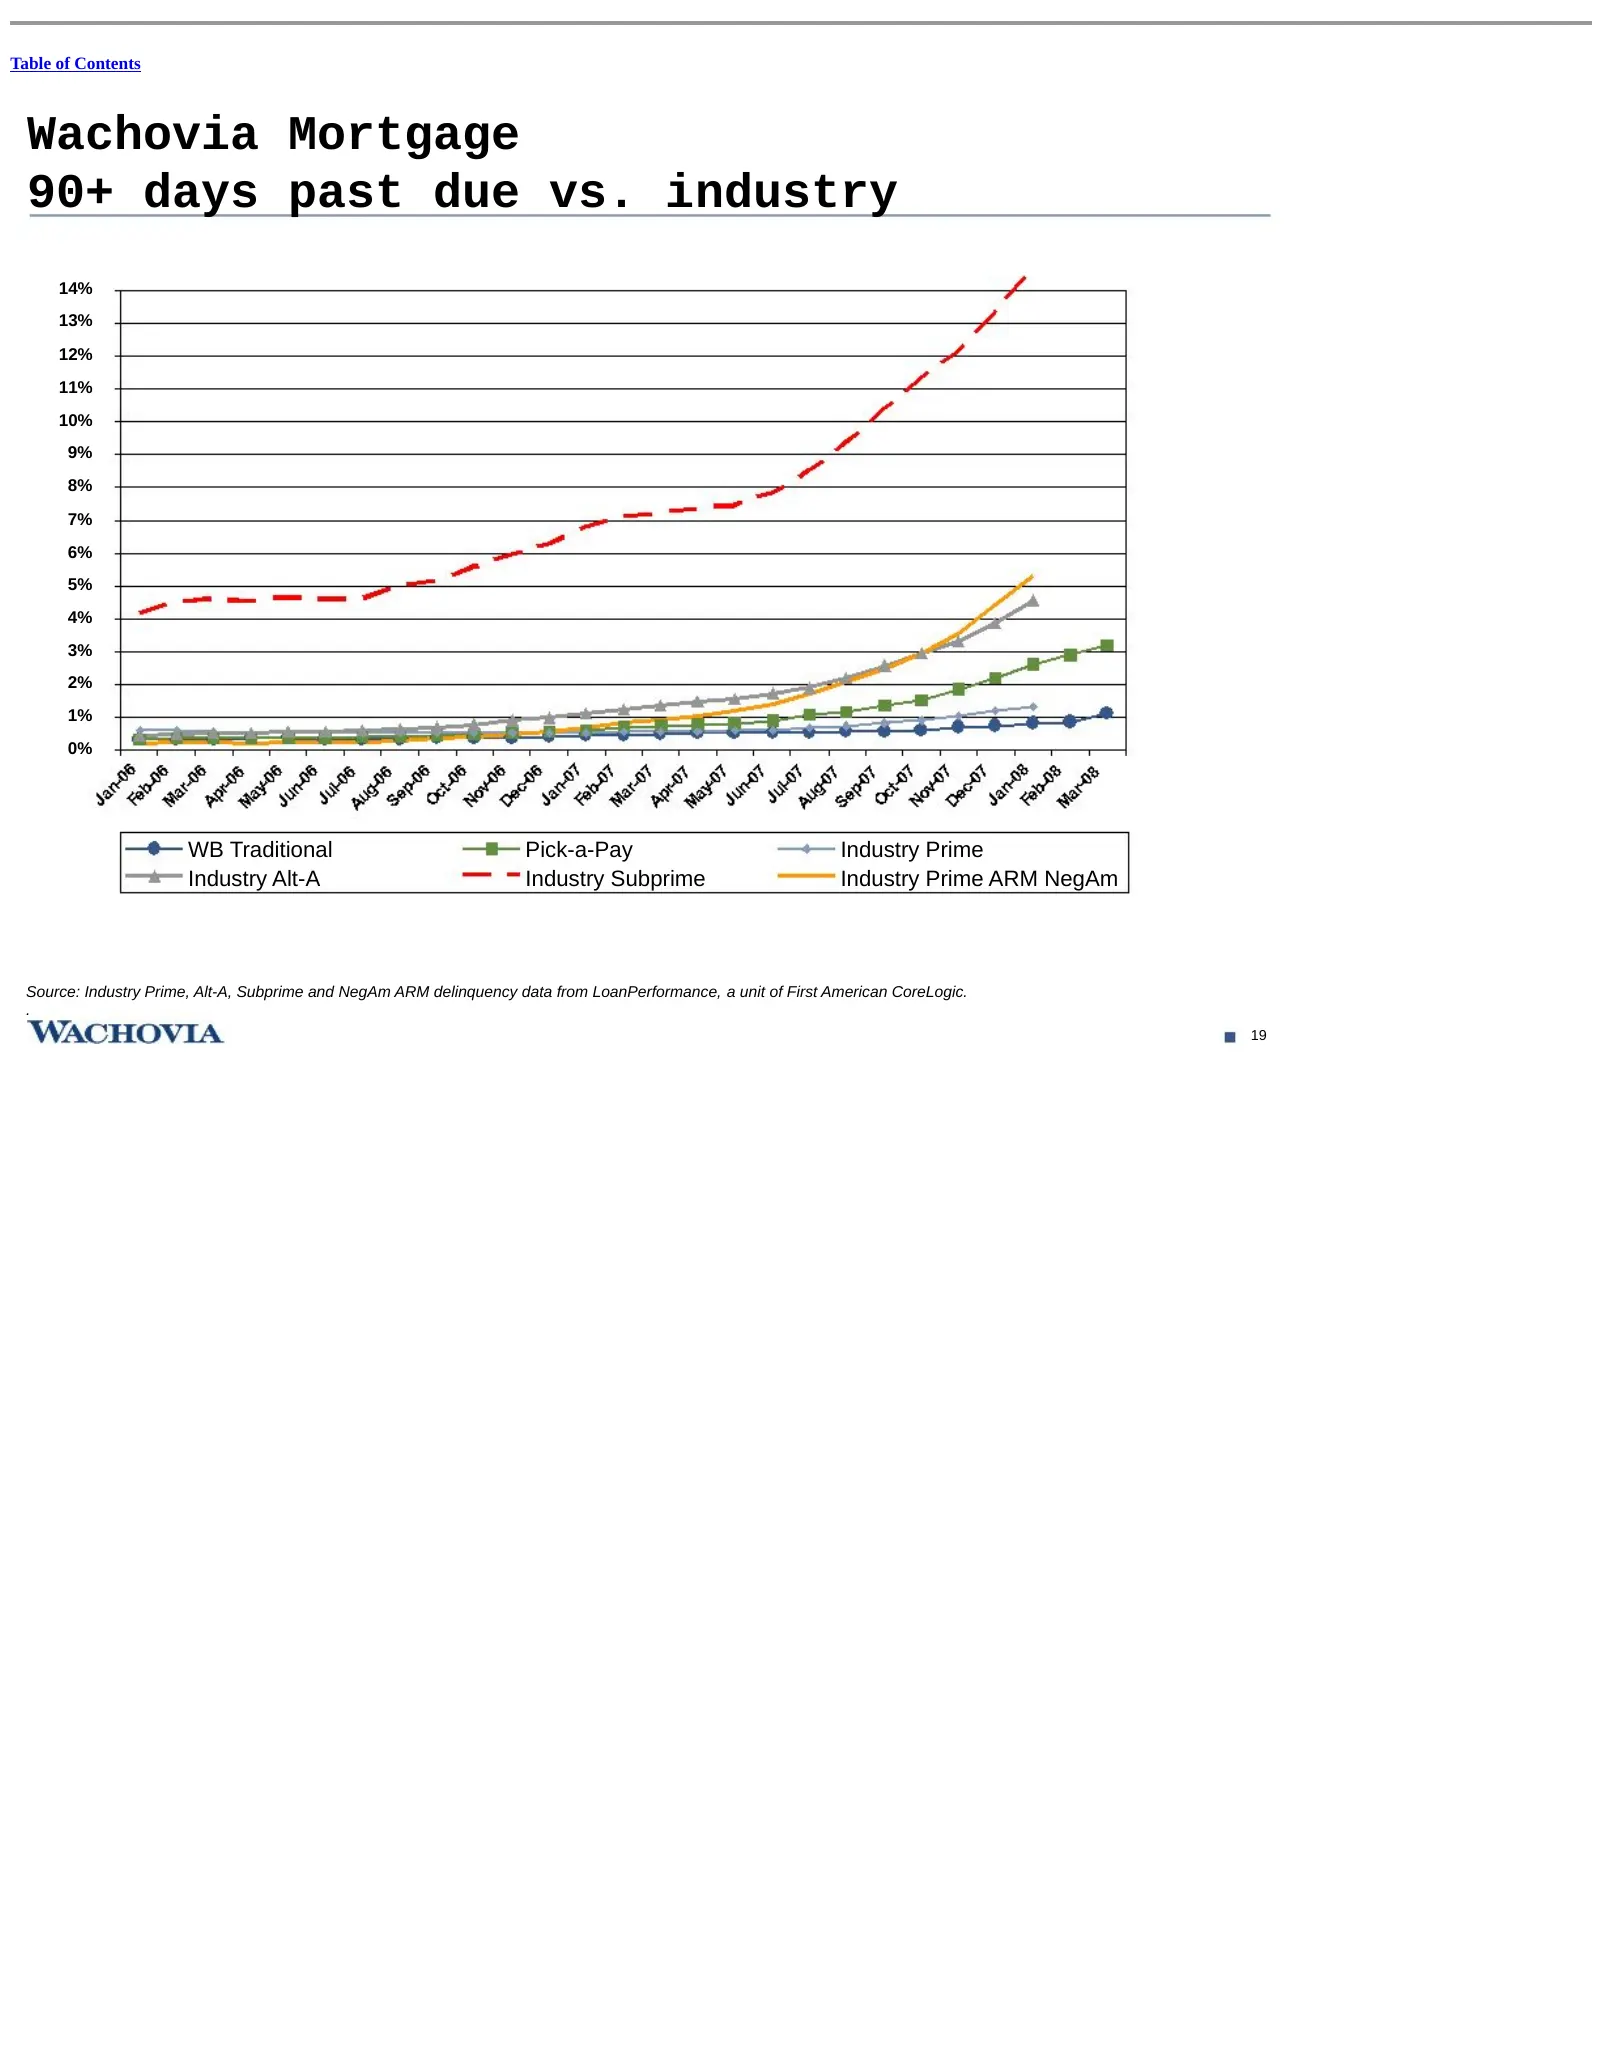
Table of Contents Wachovia Mortgage 90+ days past due vs. industry 14% 13% 12% 11% 10% 9% 8% 7% 6% 5% 4% 3% 2% 1% 0% WB Traditional Pick-a-Pay Industry Prime Industry Alt-A Industry Subprime Industry Prime ARM NegAm Source: Industry Prime, Alt-A, Subprime and NegAm ARM delinquency data from LoanPerf
Slide 43: Consumer real estate: Key market statistics
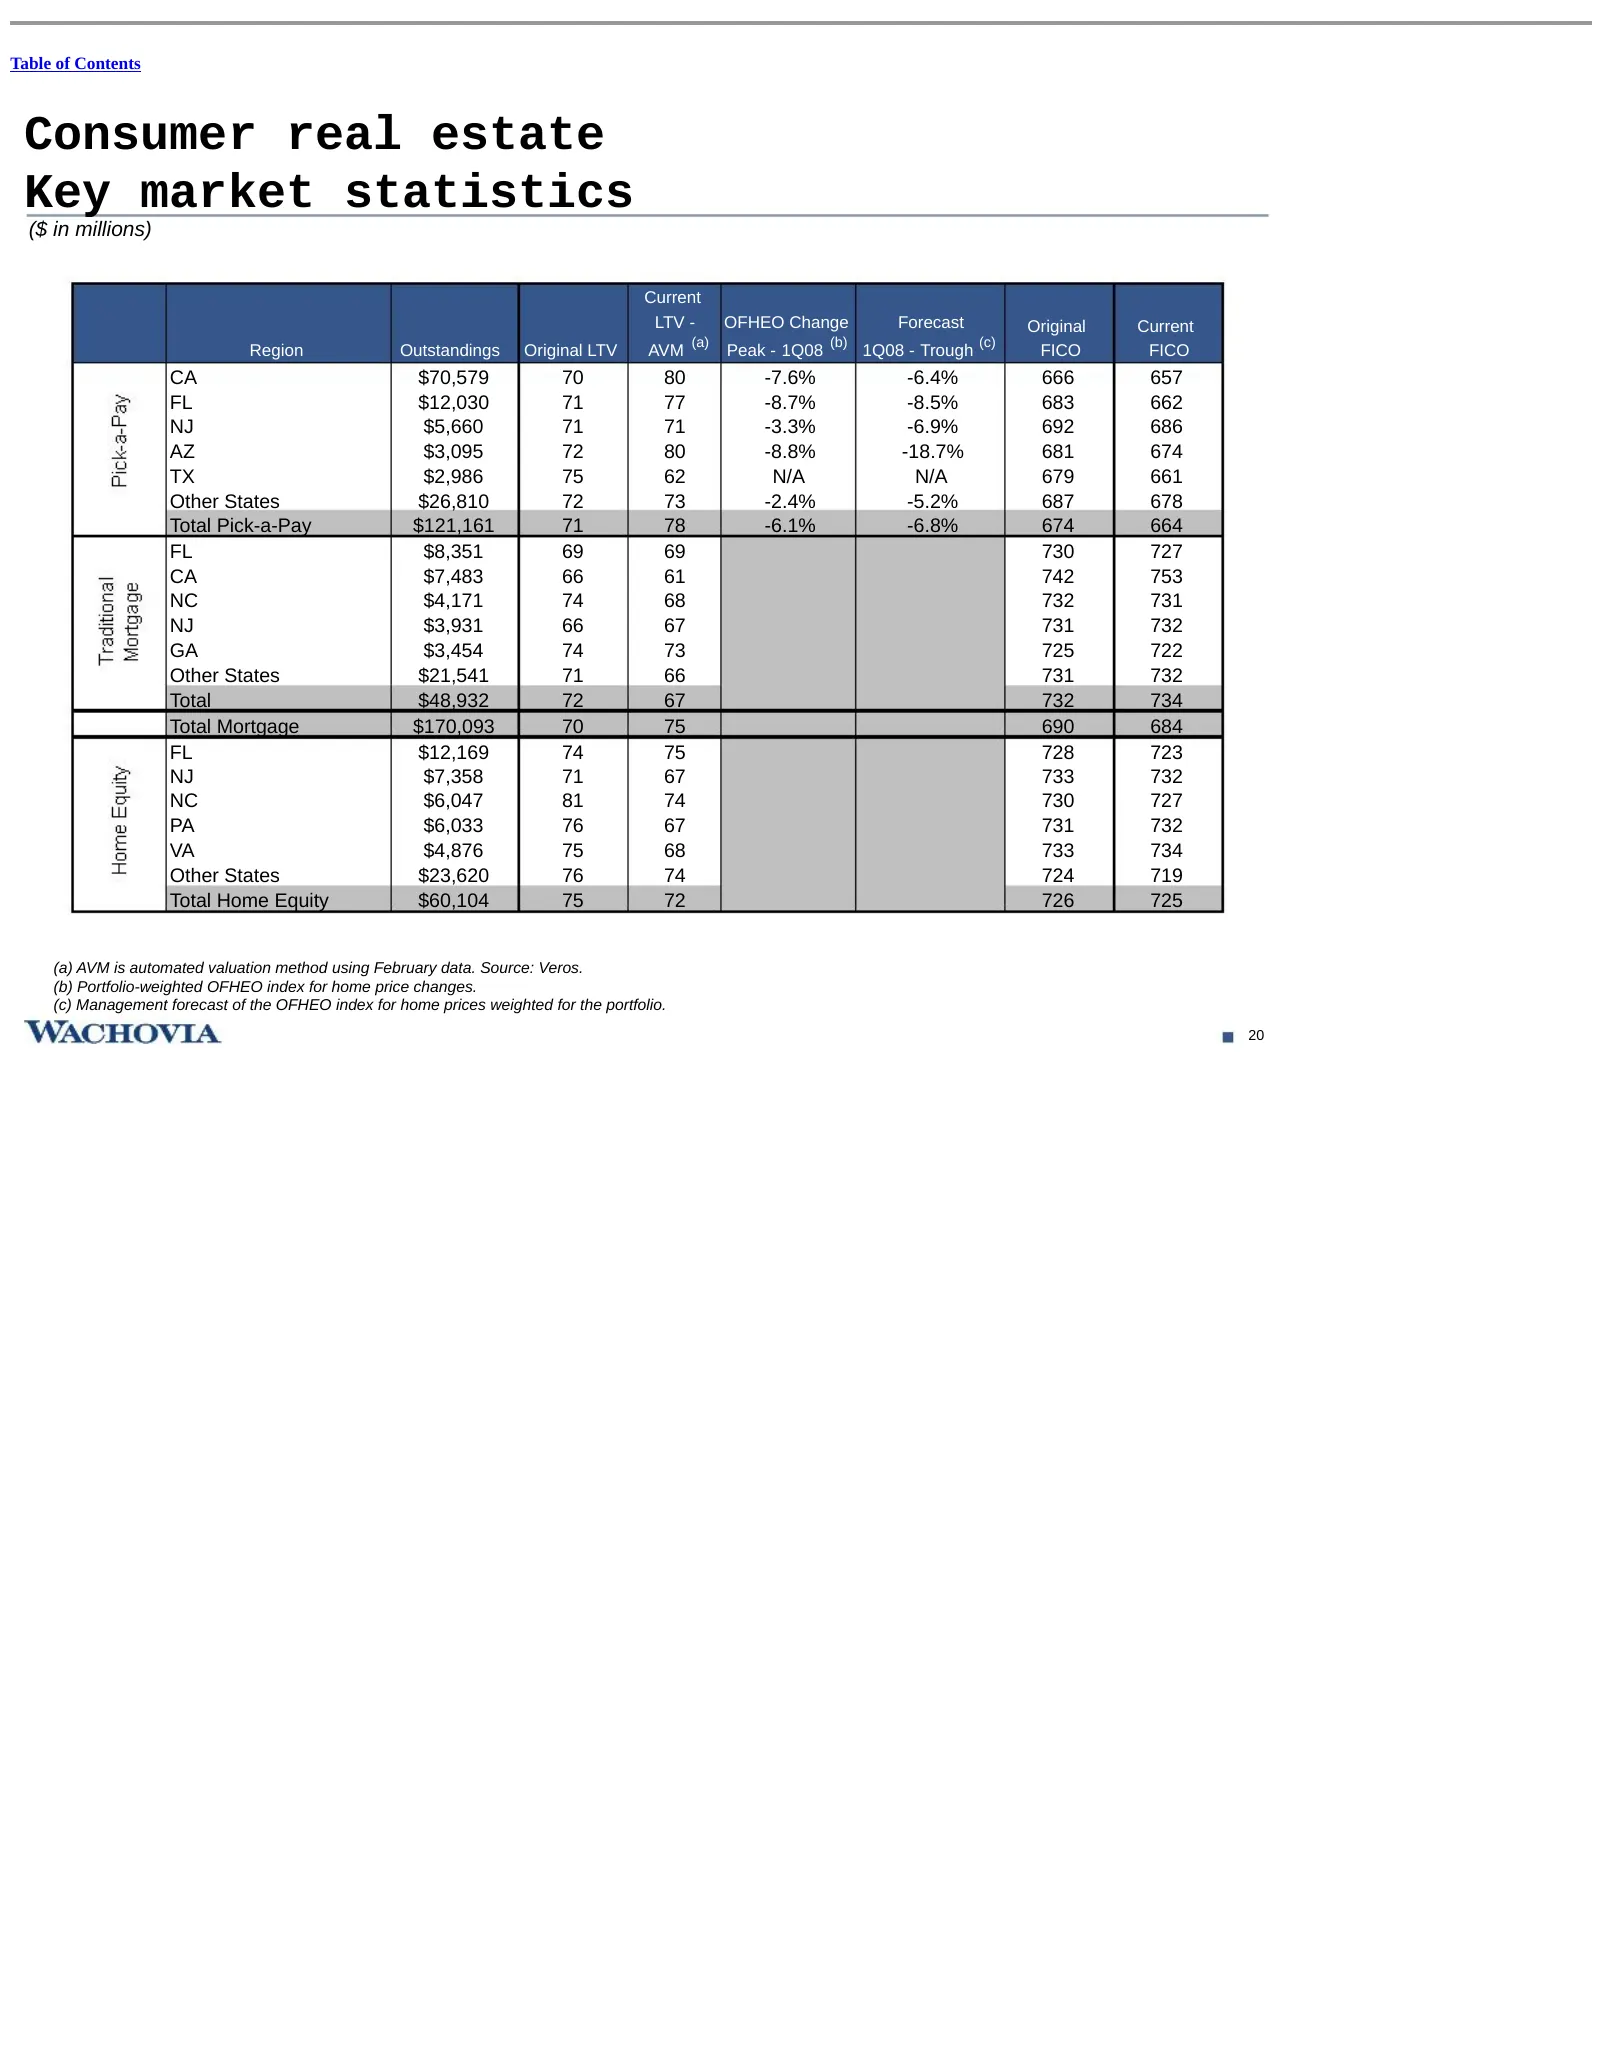
Table of Contents Consumer real estate Key market statistics ($ in millions) Current LTV - OFHEO Change Forecast Original Current (a) (b) (c) Region Outstandings Original LTV AVM Peak - 1Q08 1Q08 - Trough FICO FICO CA $70,579 70 80 -7.6% -6.4% 666 657 FL $12,030 71 77 -8.7% -8.5% 683 662 NJ $5,660 7
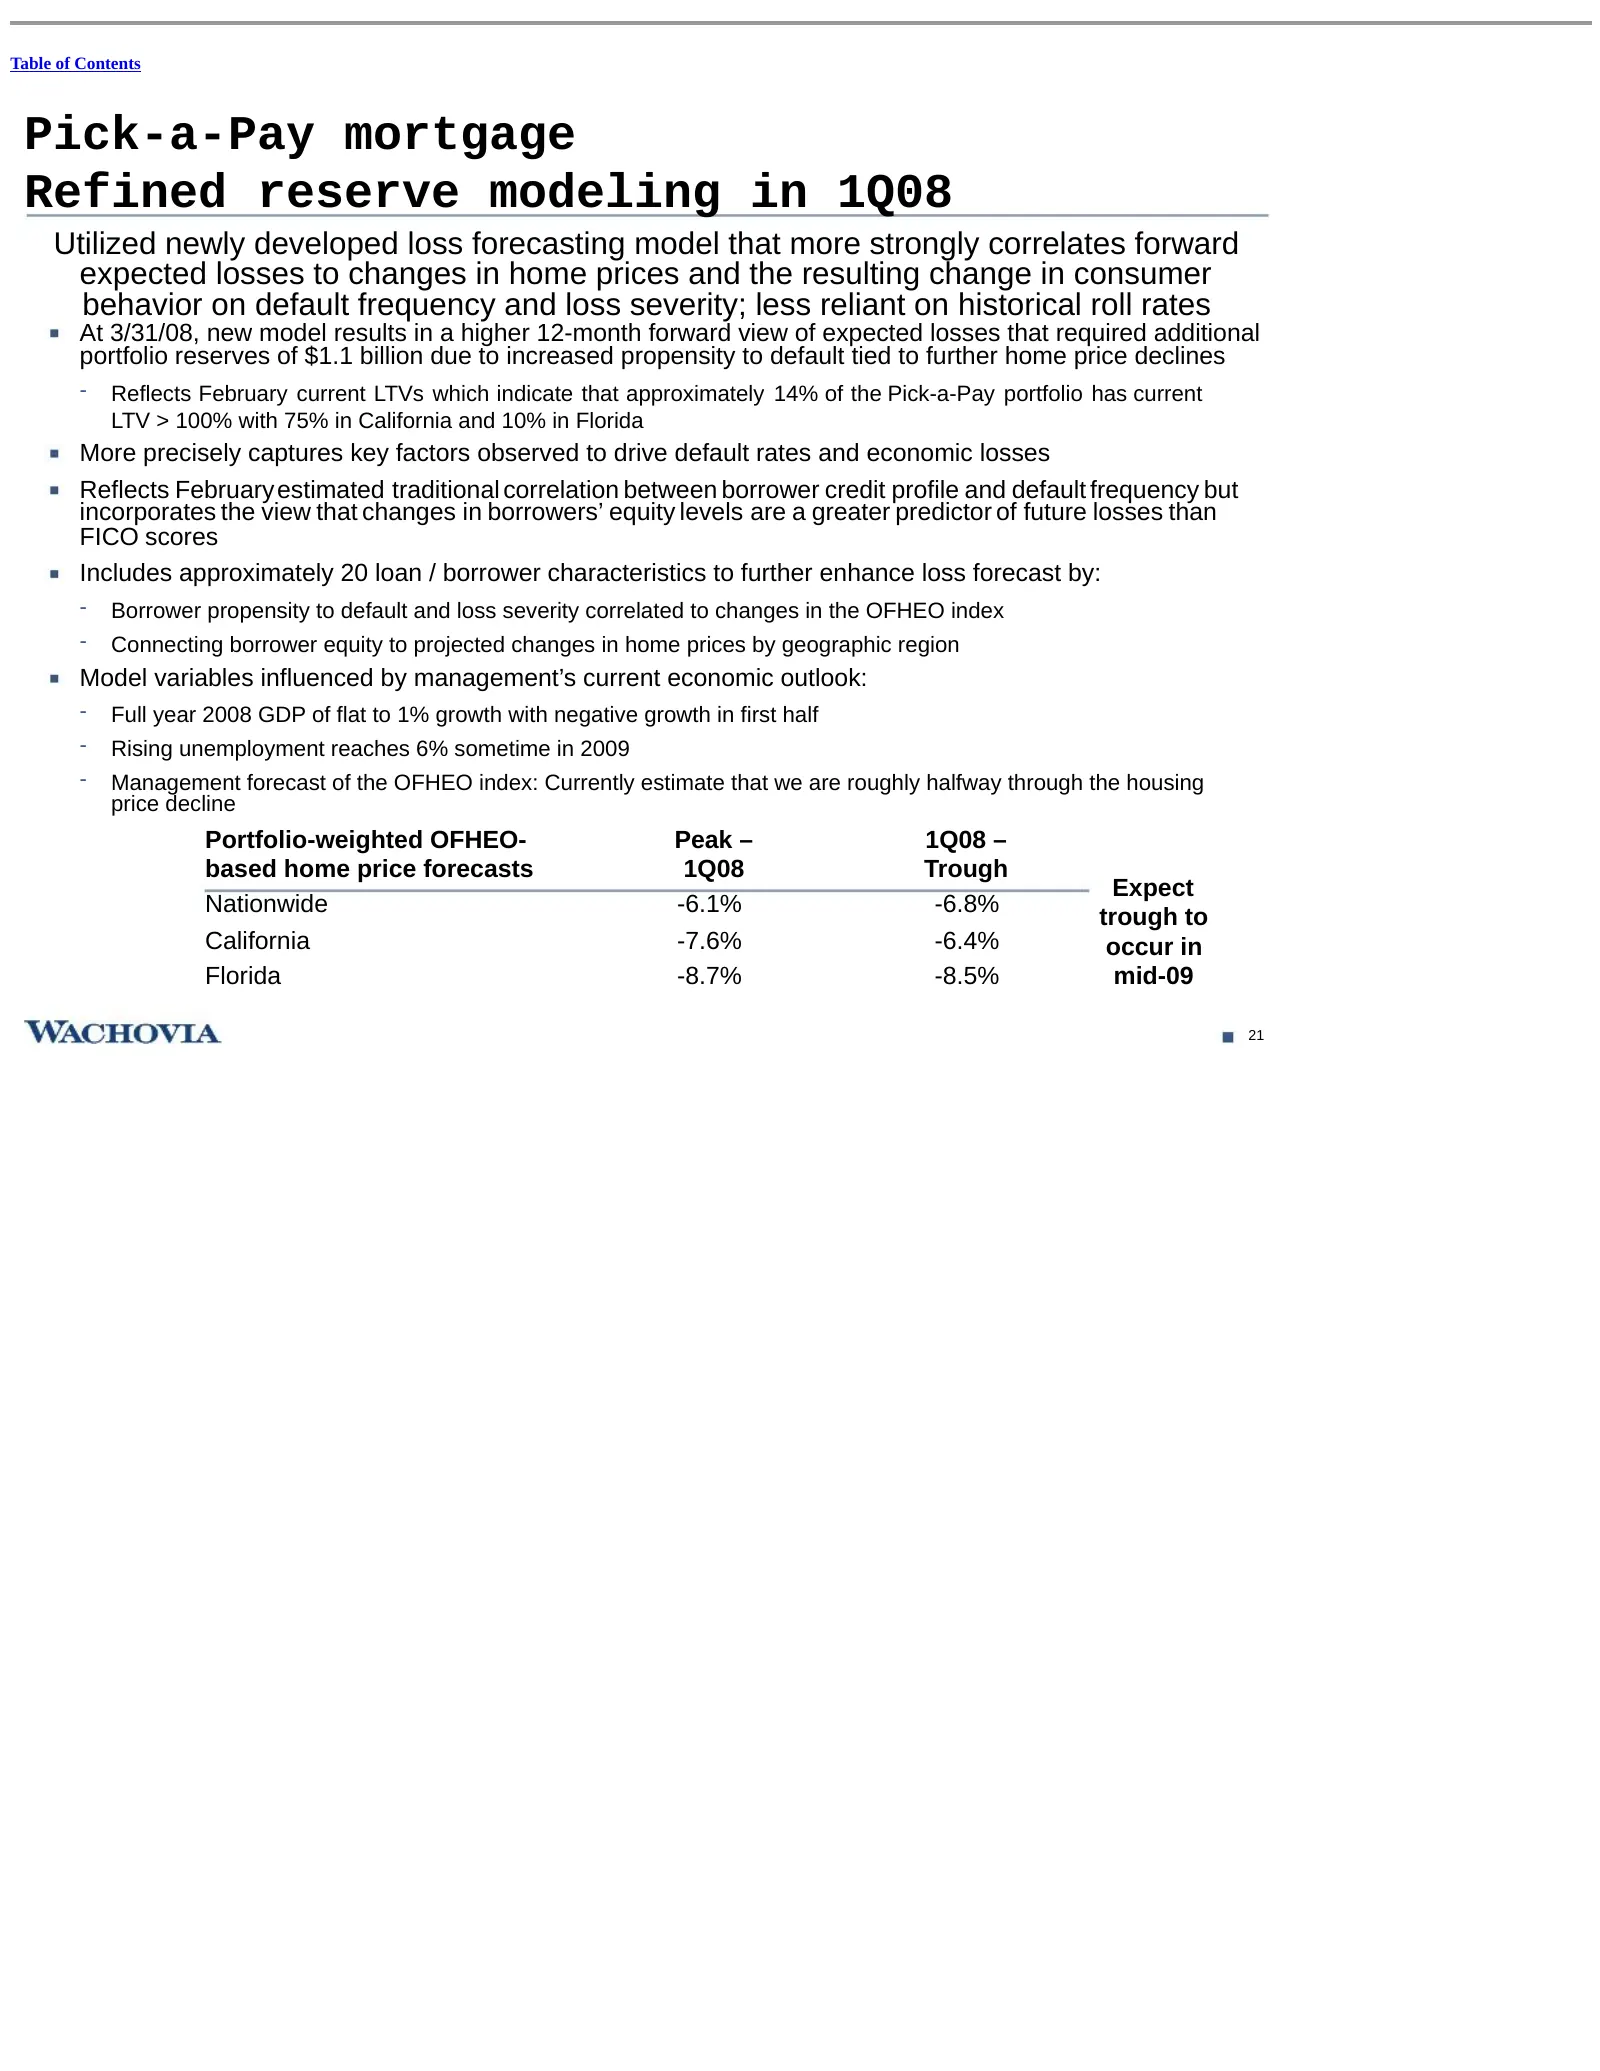
Slide 44: Pick-a-Pay mortgage: Refined reserve modeling in 1Q08
Table of Contents Pick-a-Pay mortgage Refined reserve modeling in 1Q08 Utilized newly developed loss forecasting model that more strongly correlates forward expected losses to changes in home prices and the resulting change in consumer behavior on default frequency and loss severity; less reliant on
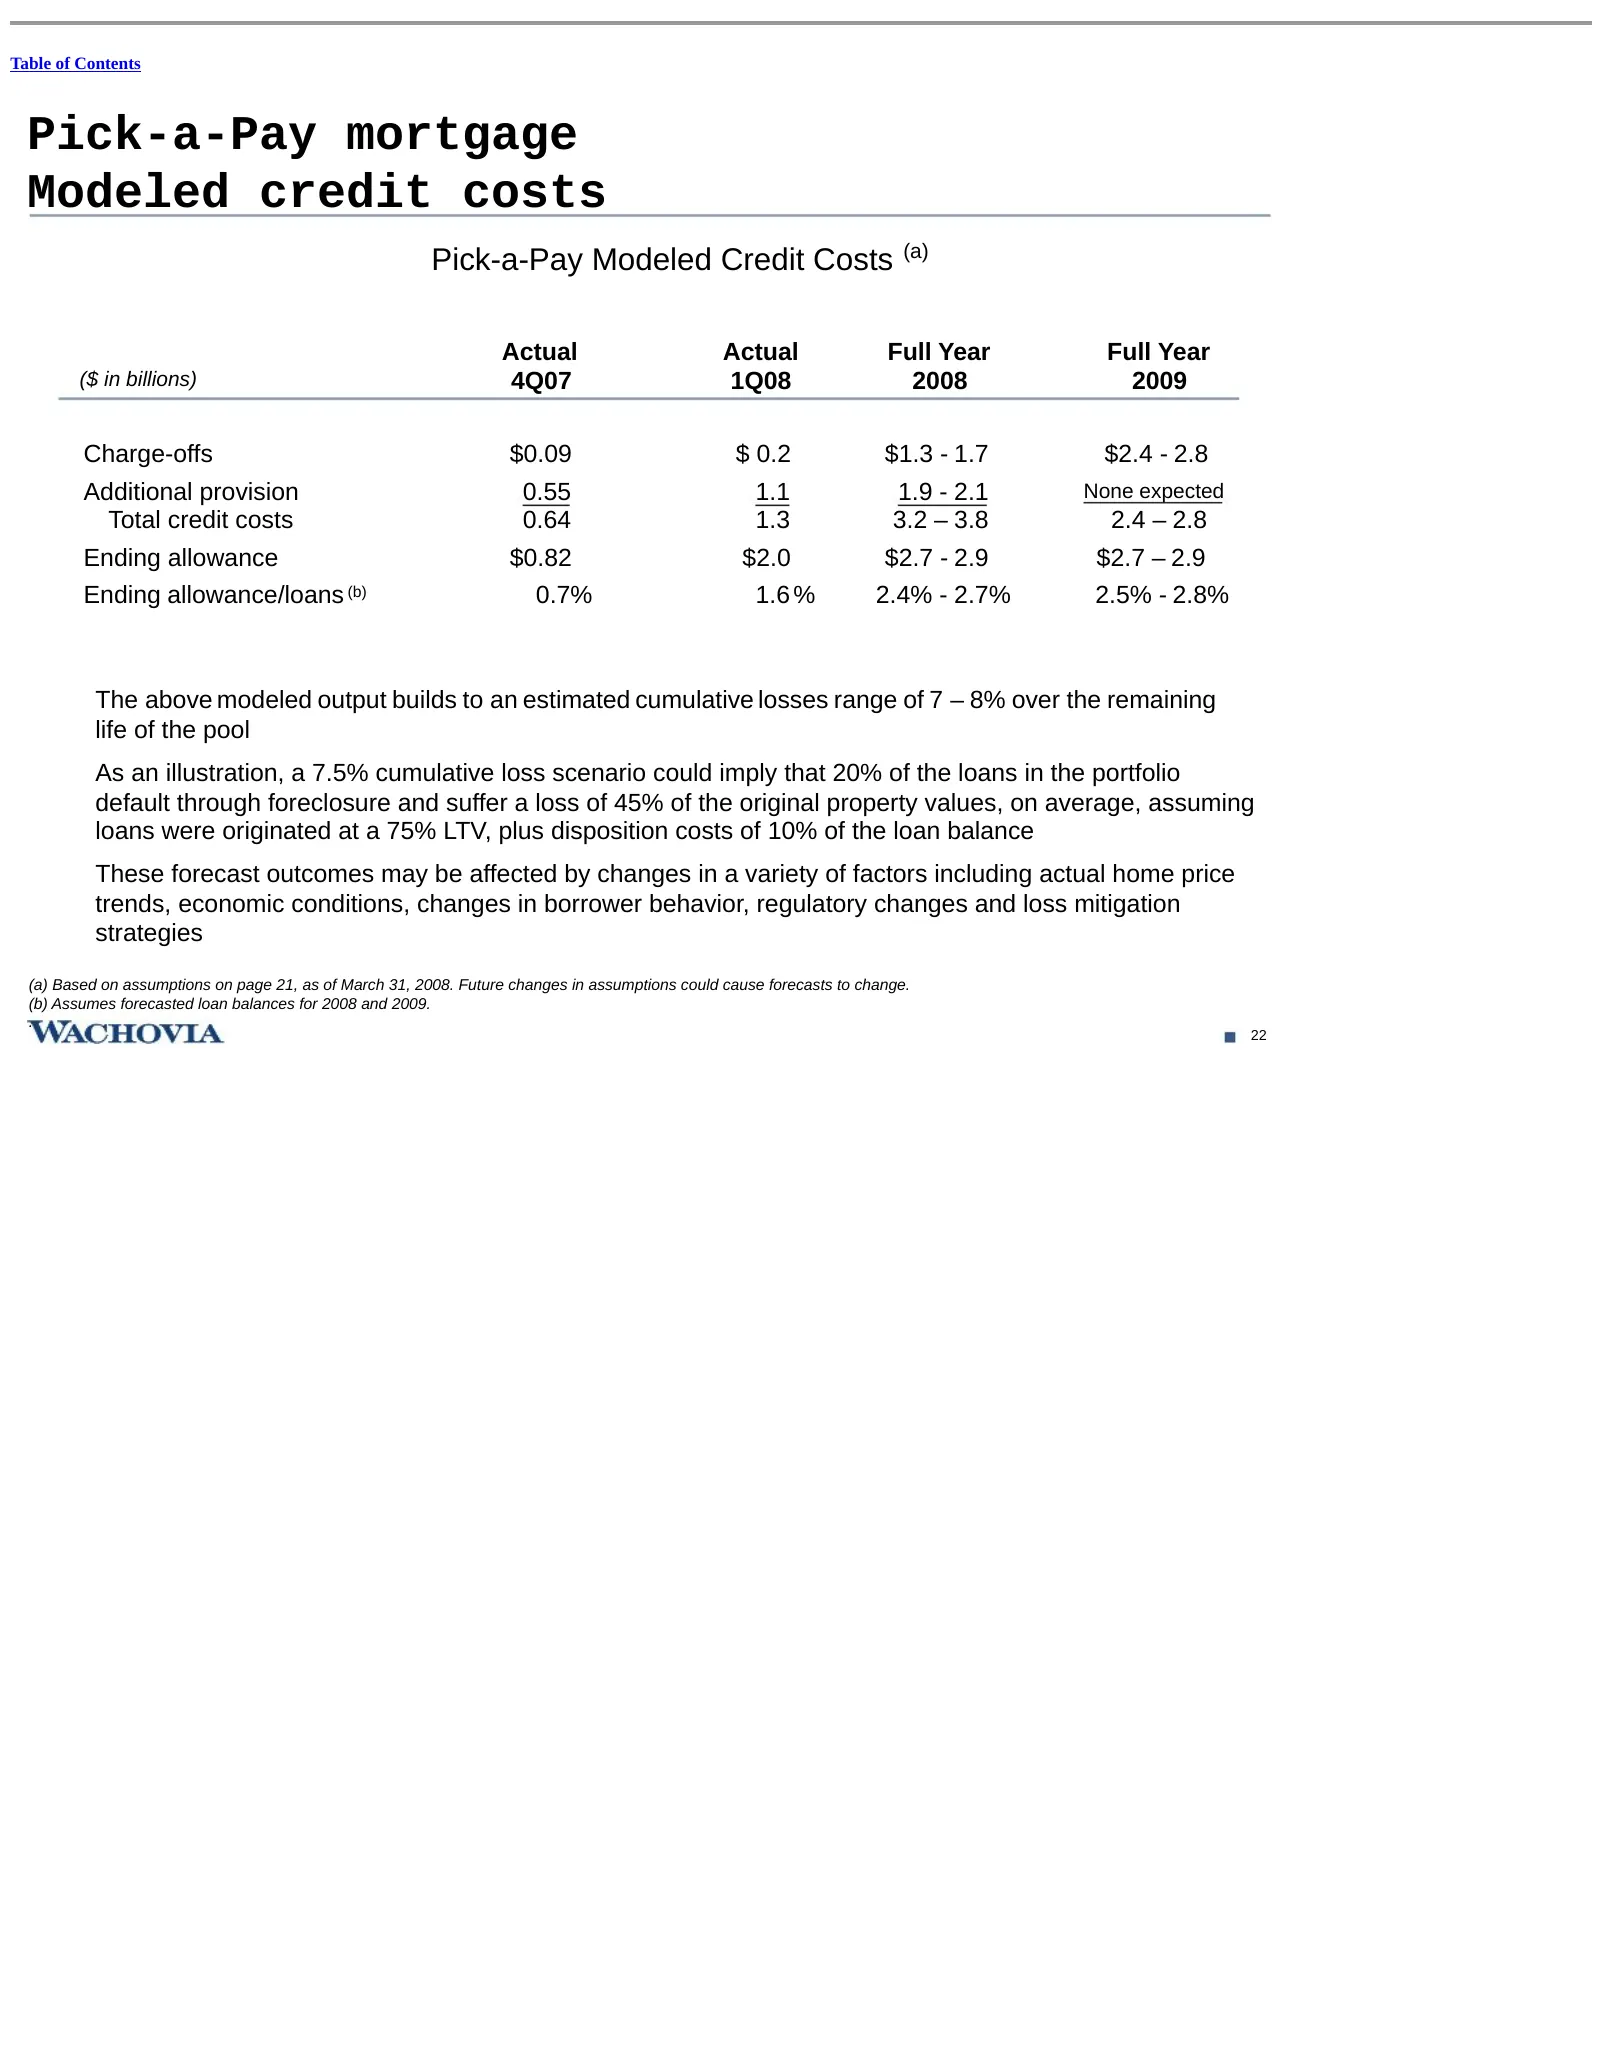
Slide 45: Pick-a-Pay mortgage: Modeled credit costs
Table of Contents Pick-a-Pay mortgage Modeled credit costs Pick-a-Pay Modeled Credit Costs (a) Actual Actual Full Year Full Year ($ in billions) 4Q07 1Q08 2008 2009 Charge-offs $0.09 $ 0.2 $1.3 - 1.7 $2.4 - 2.8 Additional provision 0.55 1.1 1.9 - 2.1 None expected Total credit costs 0.64 1.3 3.2 – 3
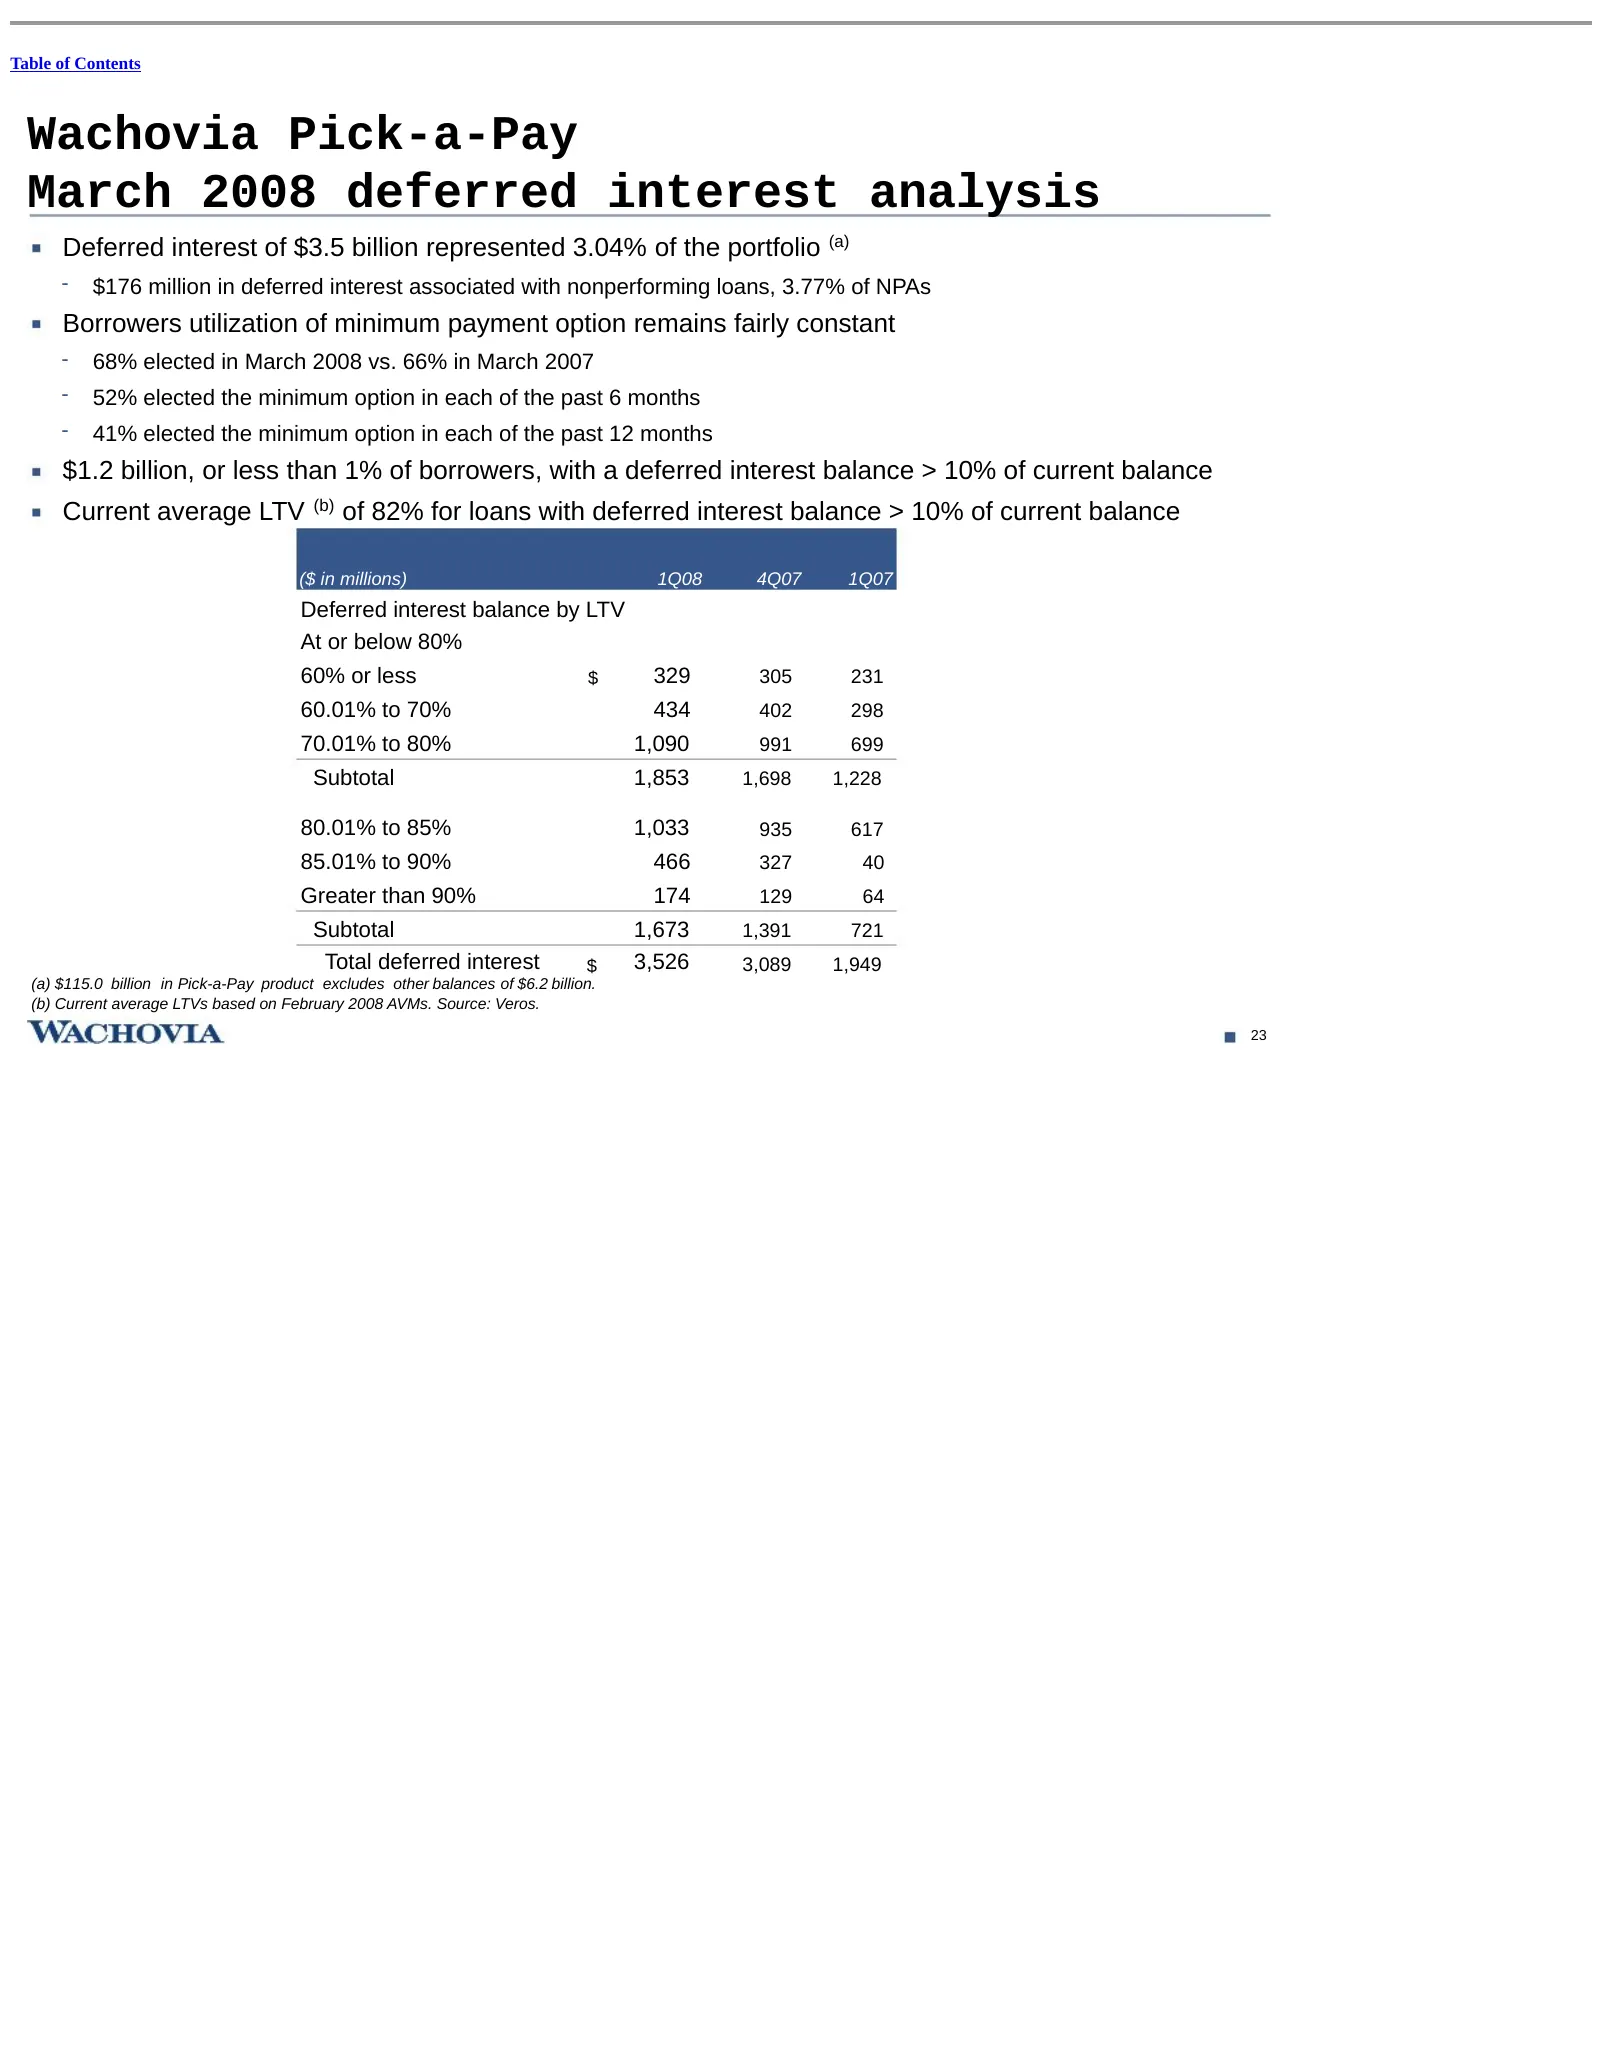
Slide 46: Pick-a-Pay: March 2008 deferred interest analysis
Table of Contents Wachovia Pick-a-Pay March 2008 deferred interest analysis Deferred interest of $3.5 billion represented 3.04% of the portfolio (a) - $176 million in deferred interest associated with nonperforming loans, 3.77% of NPAs Borrowers utilization of minimum payment option remains fairly c
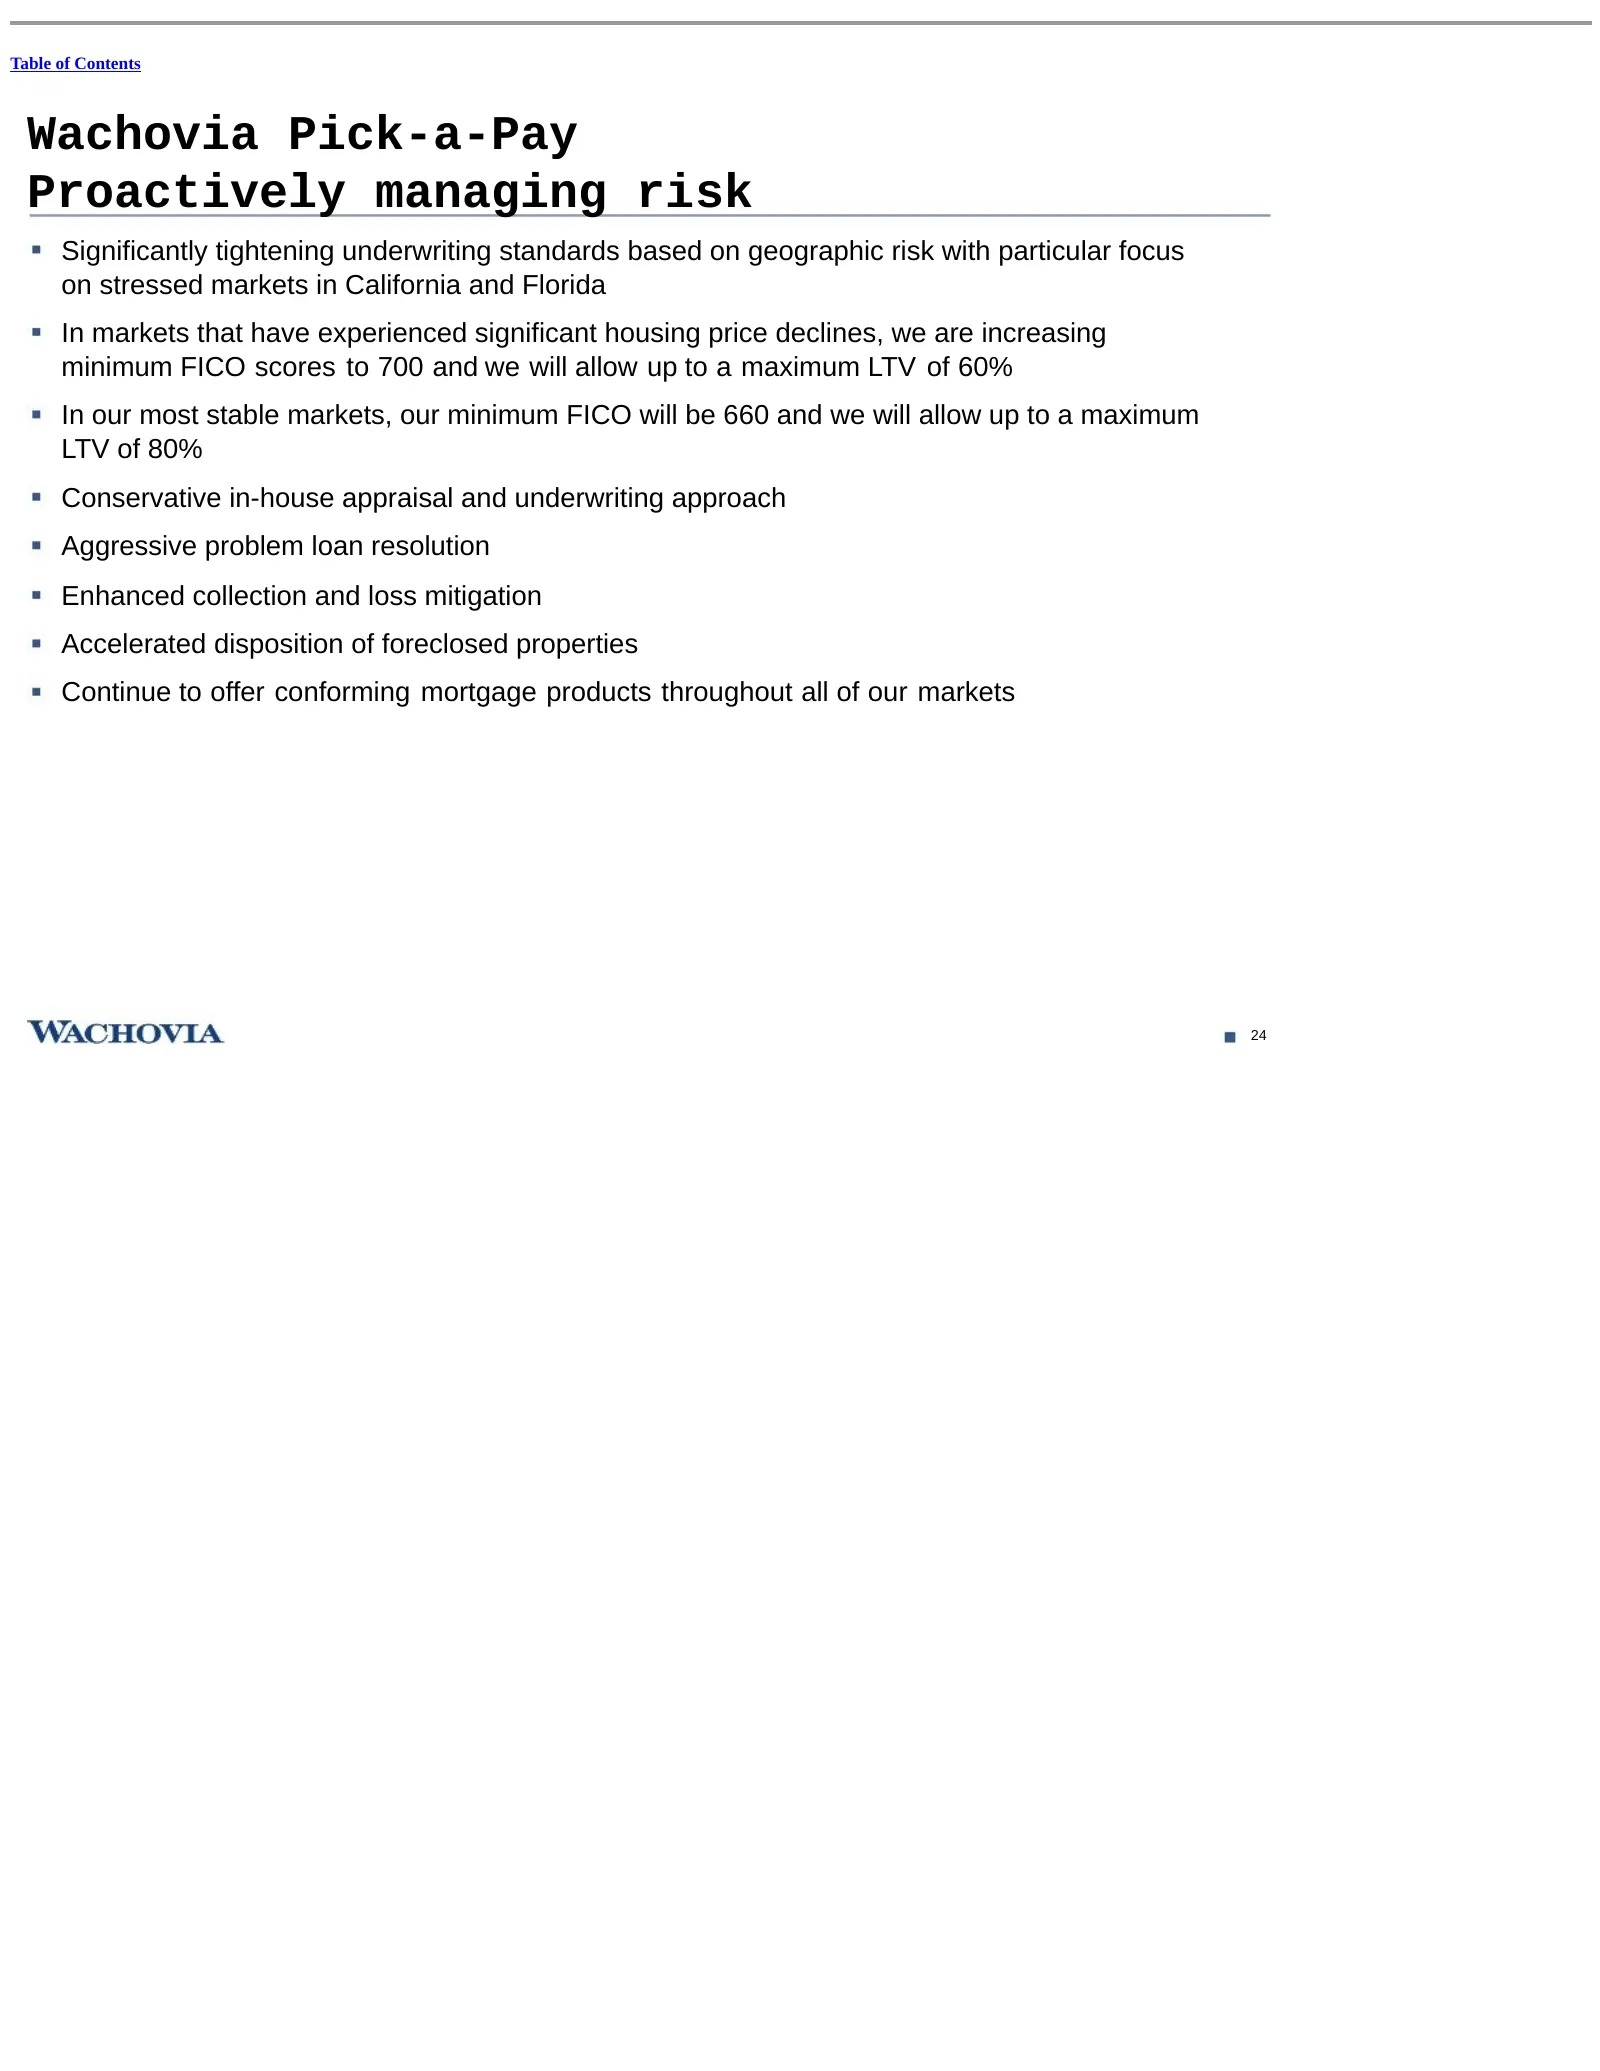
Slide 47: Pick-a-Pay: Proactively managing risk
Table of Contents Wachovia Pick-a-Pay Proactively managing risk Significantly tightening underwriting standards based on geographic risk with particular focus on stressed markets in California and Florida In markets that have experienced significant housing price declines, we are increasing minimum
Slide 48: Home equity loans and lines
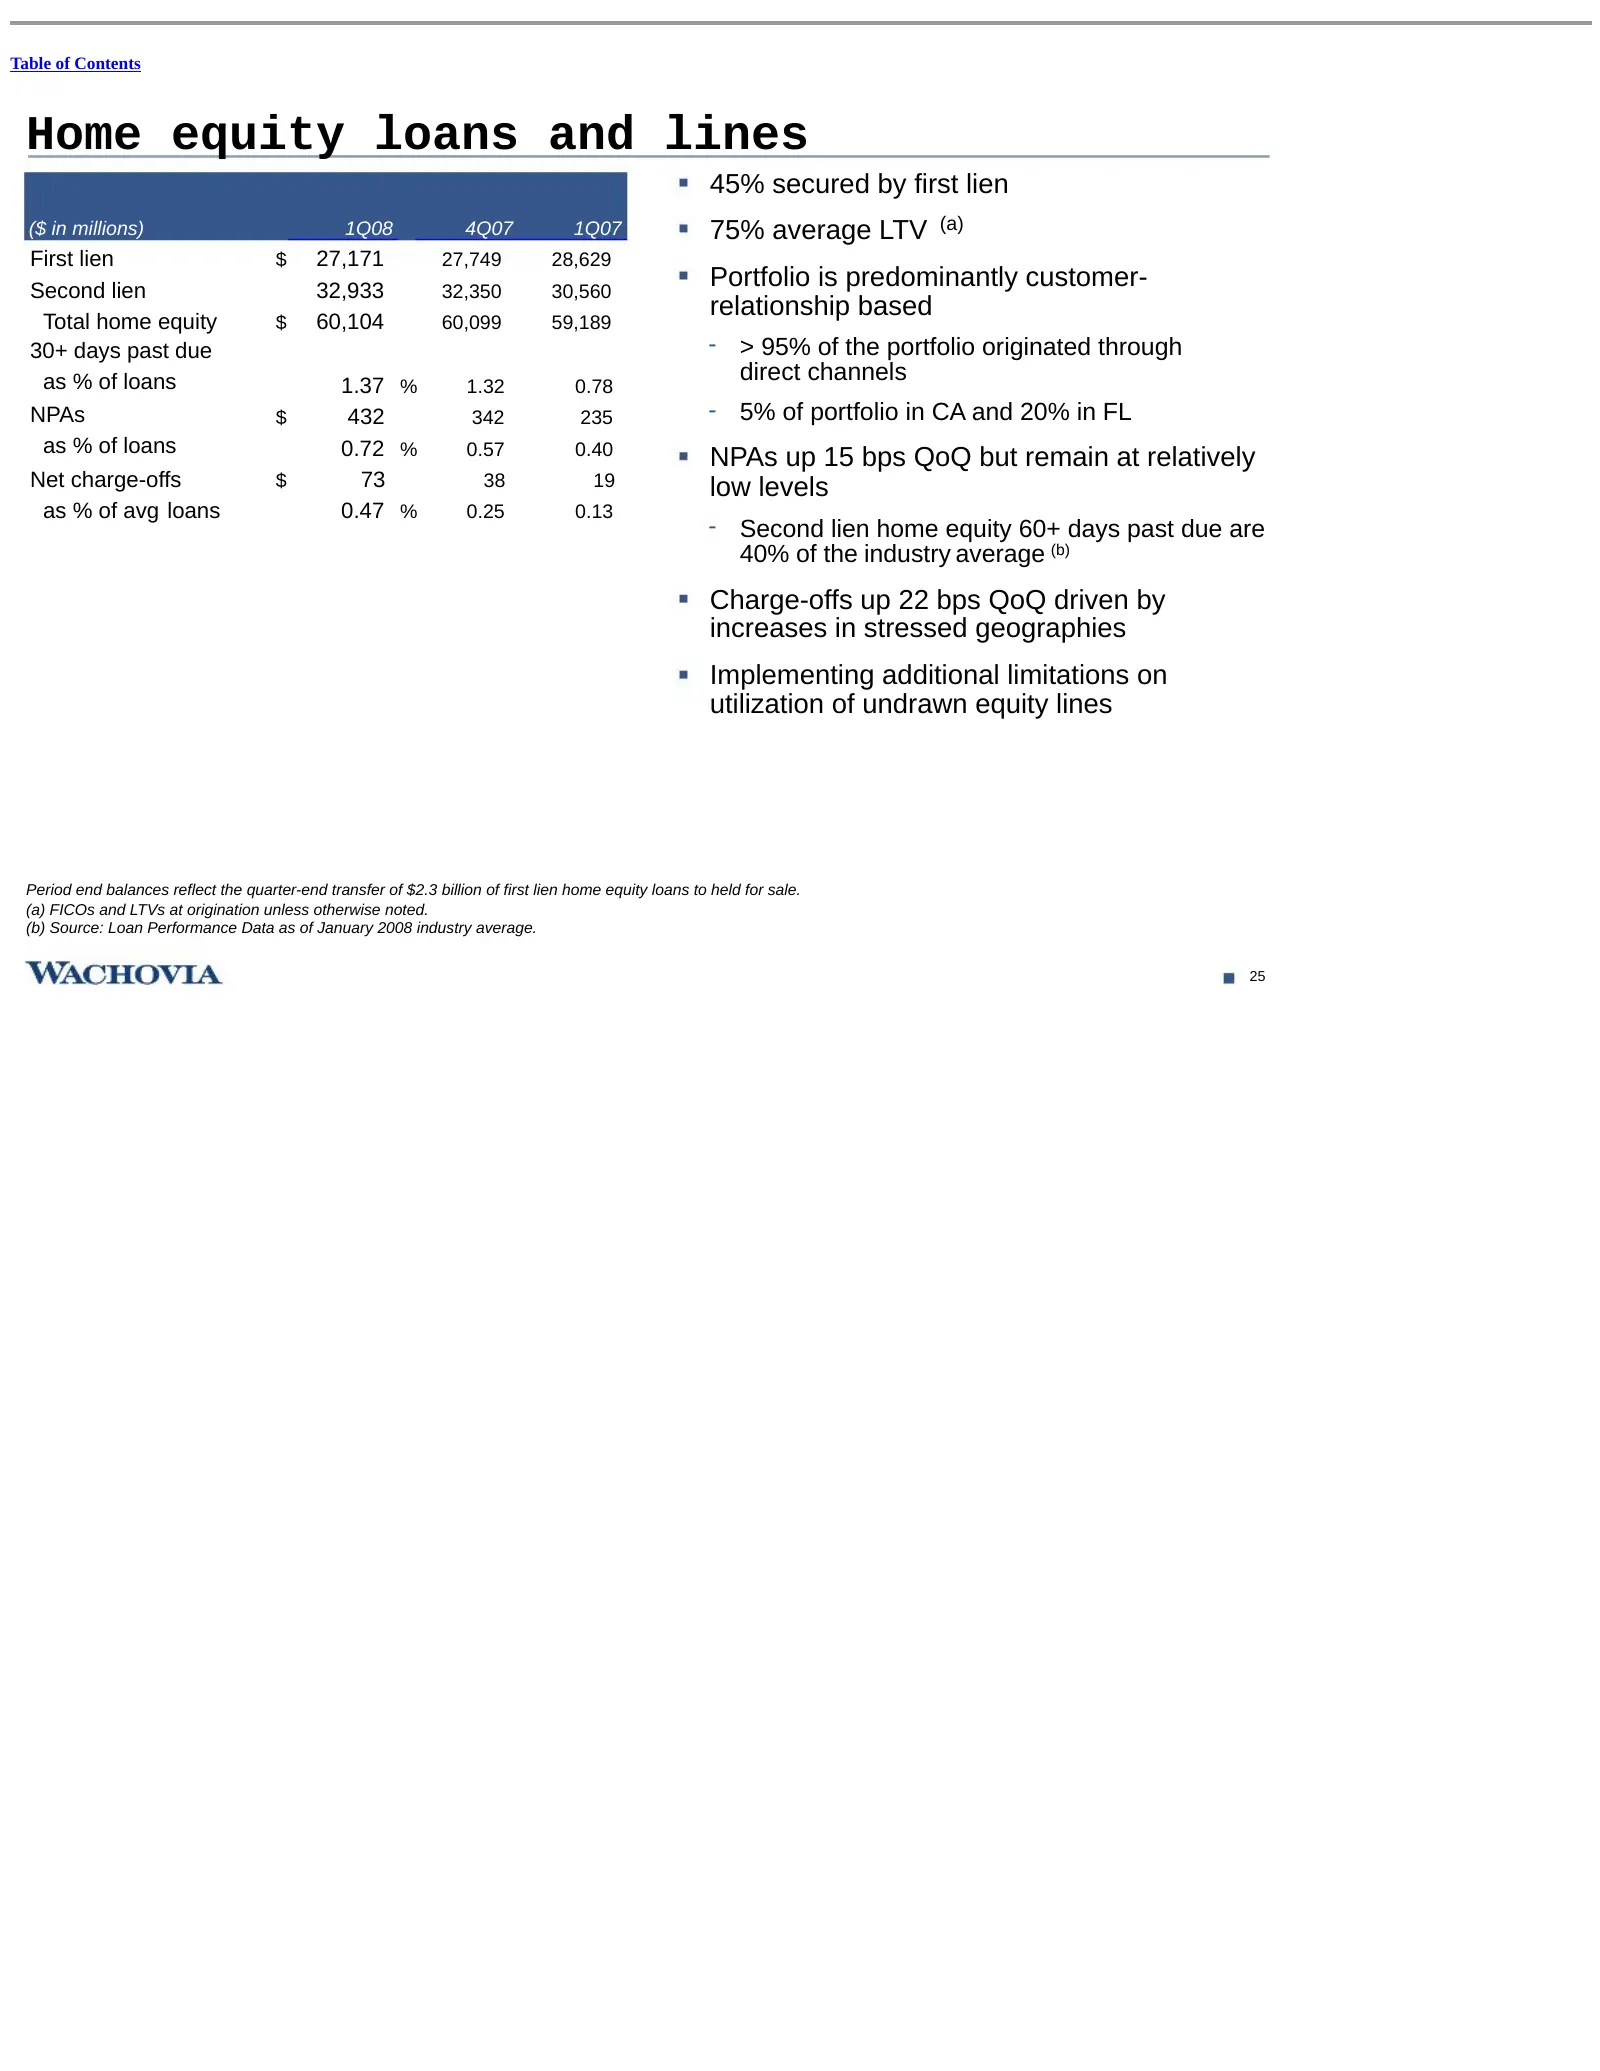
Table of Contents Home equity loans and lines 45% secured by first lien ($ in millions) 1Q08 4Q07 1Q07 75% average LTV (a) First lien $ 27,171 27,749 28,629 Second lien 32,933 32,350 30,560 Portfolio is predominantly customer- relationship based Total home equity $ 60,104 60,099 59,189 30+ days past
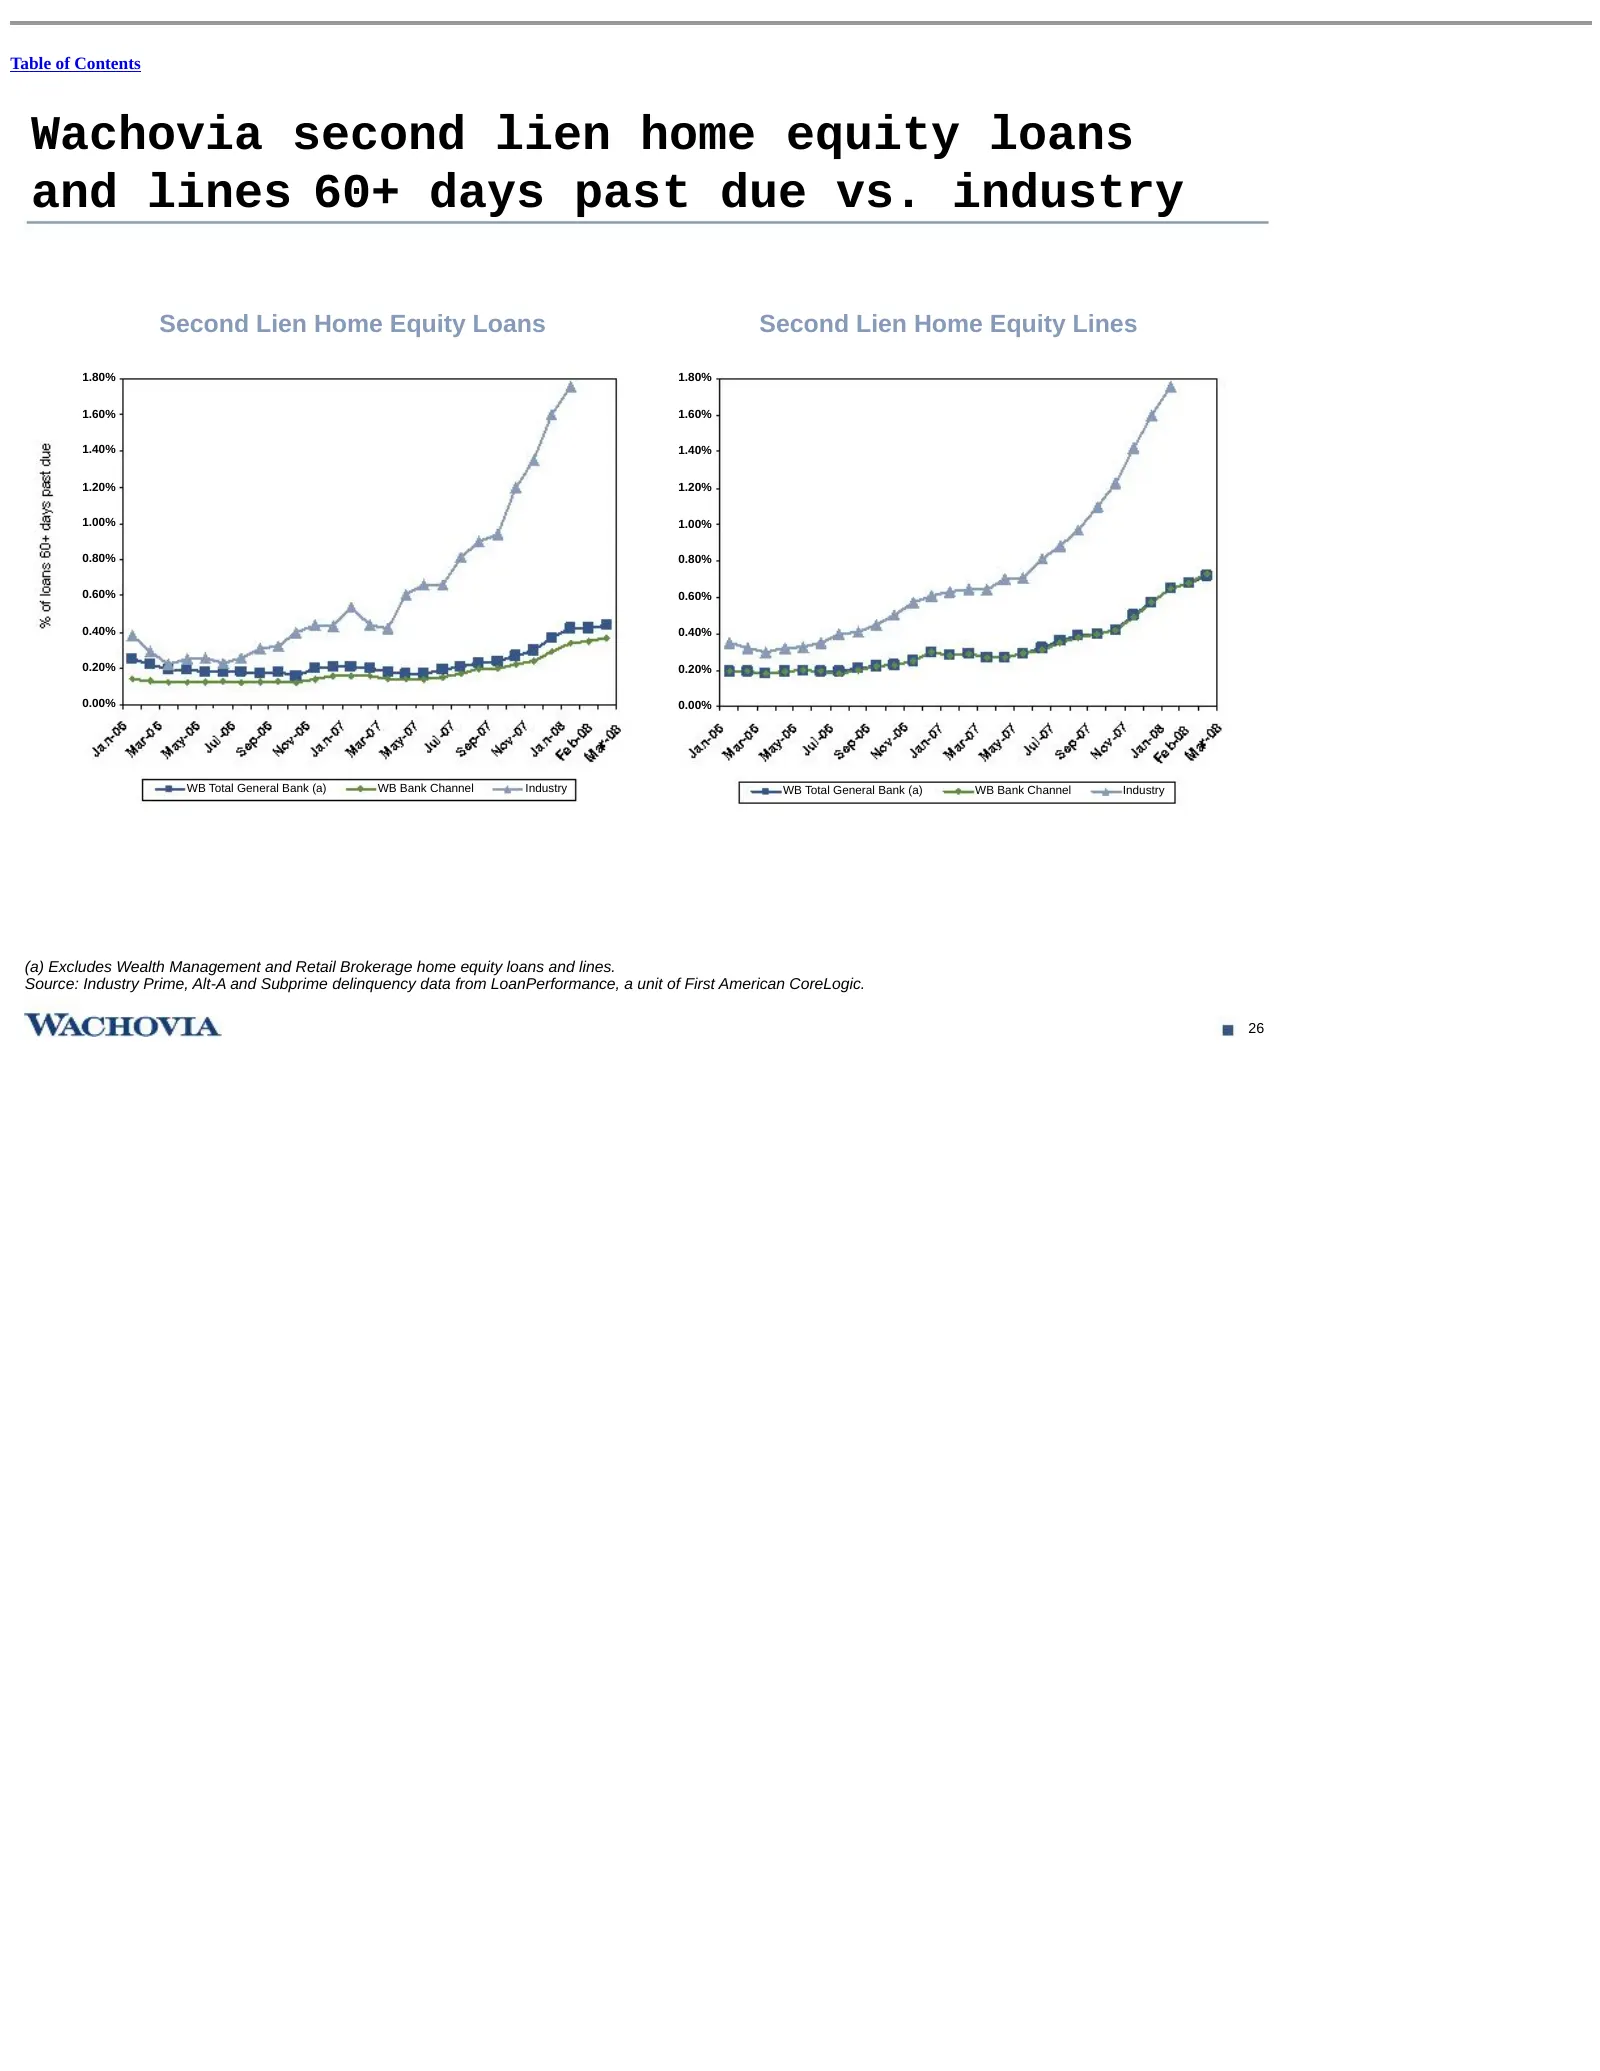
Slide 49: Second lien home equity 60+ days past due vs. industry
Table of Contents Wachovia second lien home equity loans and lines 60+ days past due vs. industry Second Lien Home Equity Loans Second Lien Home Equity Lines 1.80% 1.80% 1.60% 1.60% 1.40% 1.40% 1.20% 1.20% 1.00% 1.00% 0.80% 0.80% 0.60% 0.60% 0.40% 0.40% 0.20% 0.20% 0.00% 0.00% WB Total General Bank
Slide 50: Managed auto portfolio
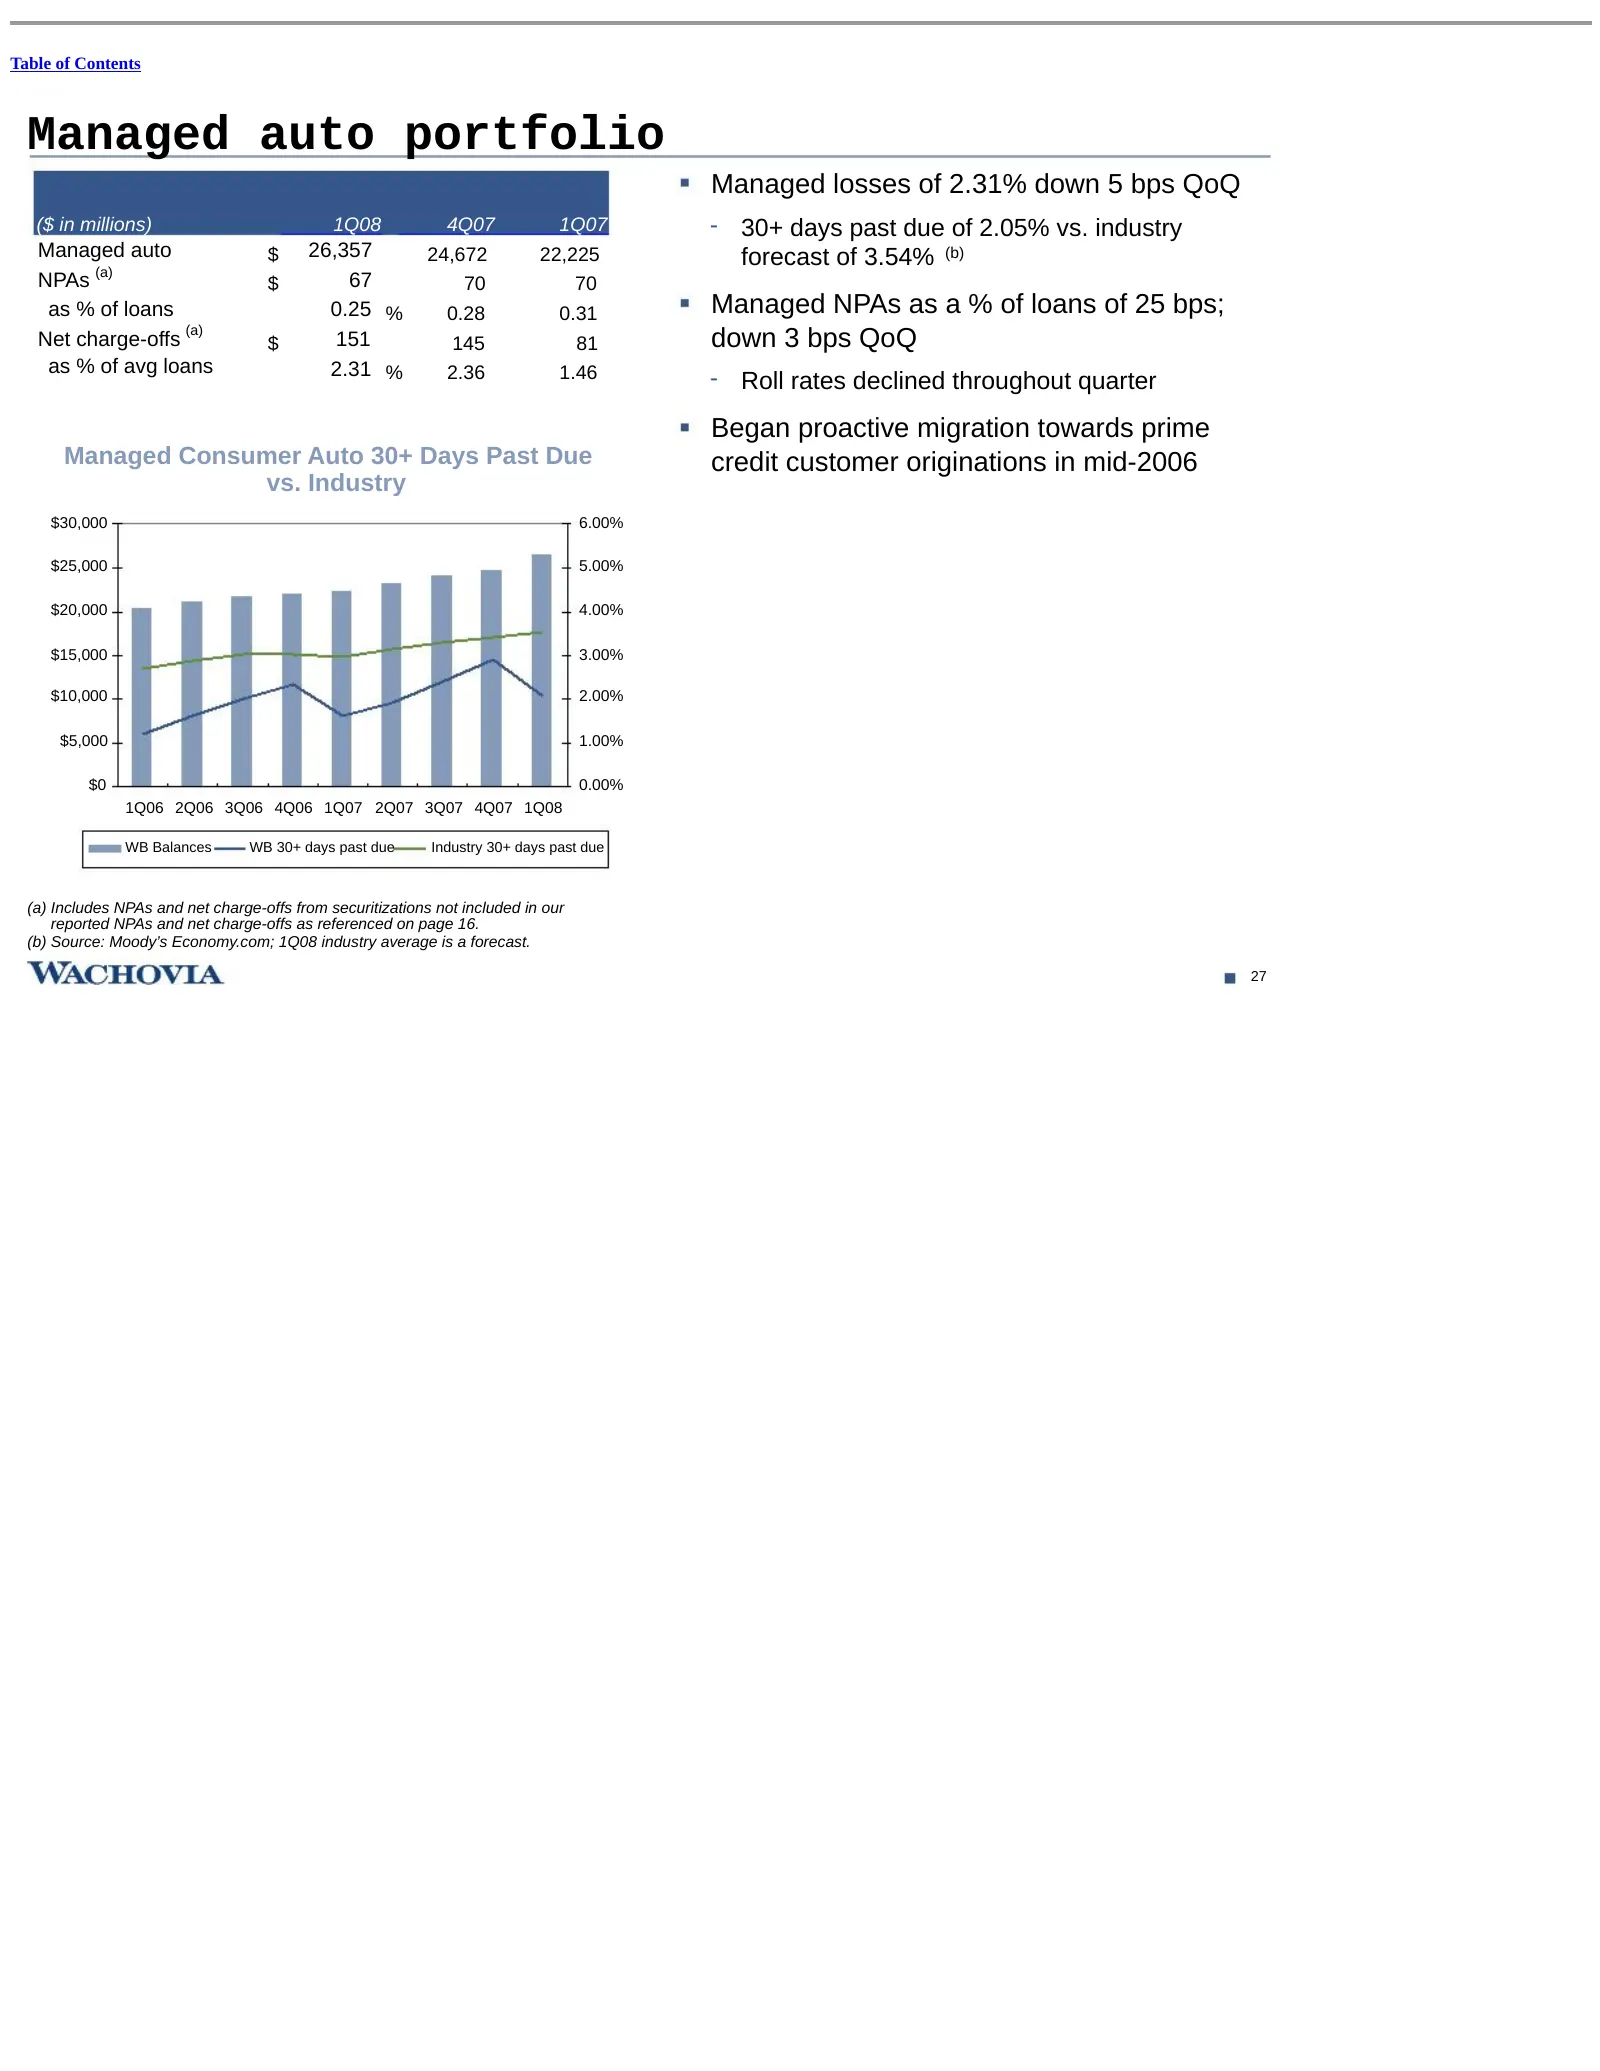
Table of Contents Managed auto portfolio Managed losses of 2.31% down 5 bps QoQ ($ in millions) 1Q08 4Q07 1Q07 - 30+ days past due of 2.05% vs. industry Managed auto $ 26,357 24,672 22,225 forecast of 3.54% (b) (a) NPAs $ 67 70 70 as % of loans 0.25 % 0.28 0.31 Managed NPAs as a % of loans of 25 bps
Slide 51: Commercial Real Estate: Real Estate Financial Services portfolio
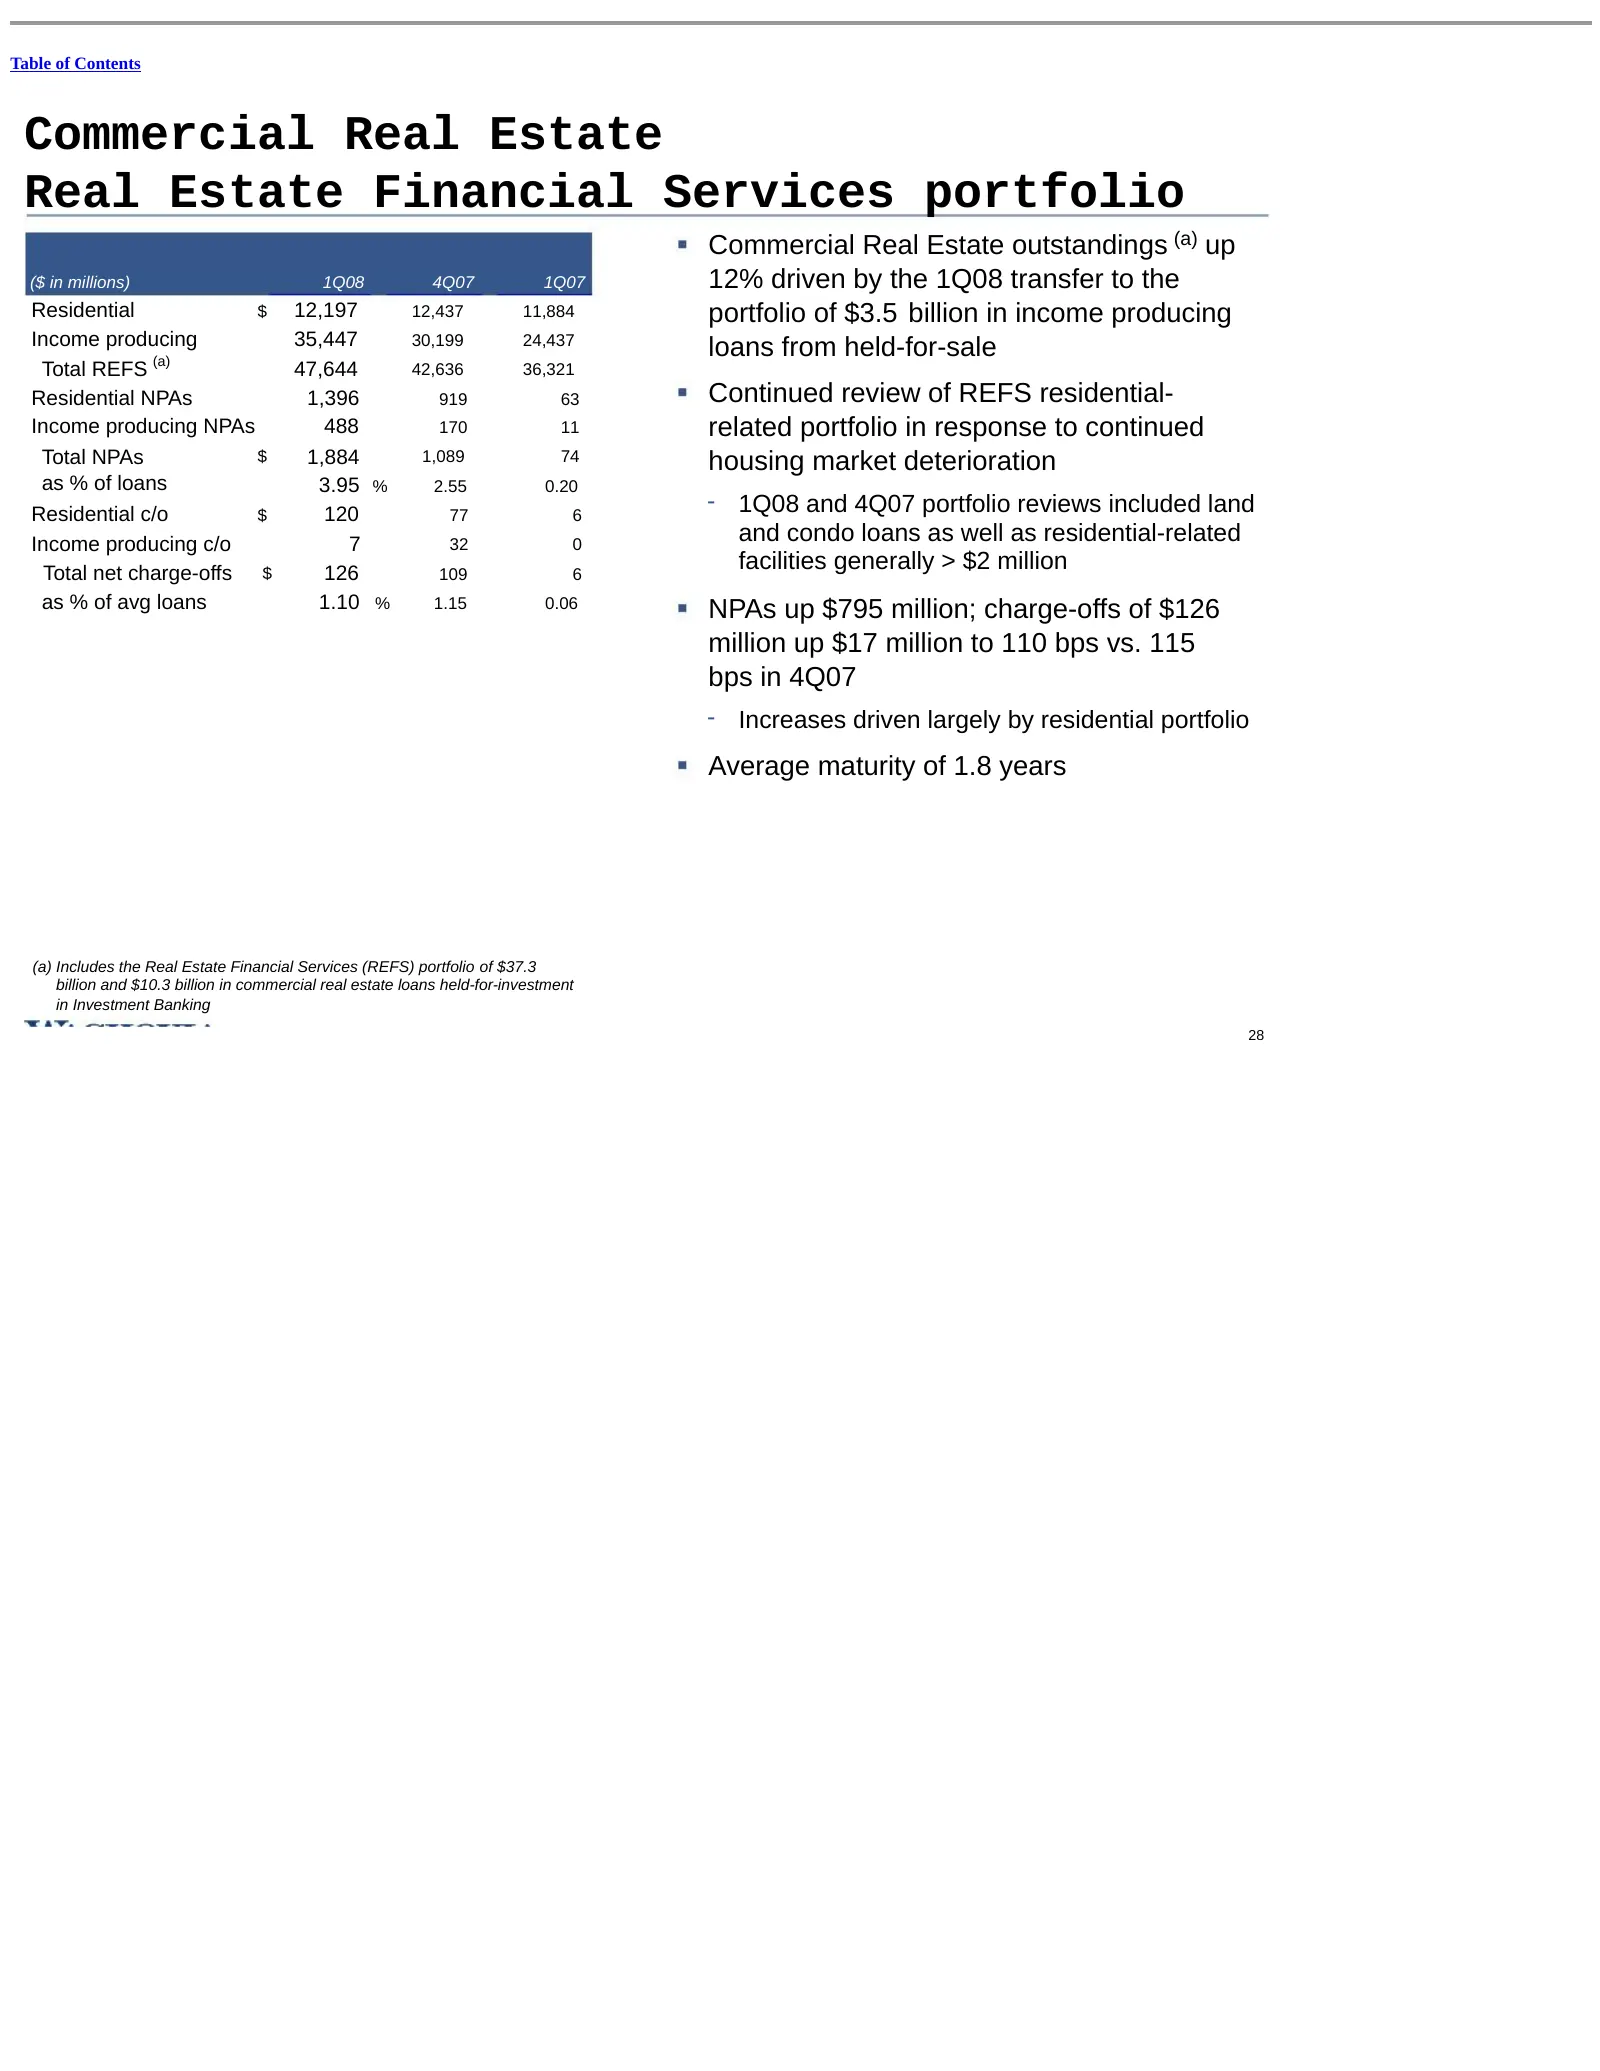
Table of Contents Commercial Real Estate Real Estate Financial Services portfolio Commercial Real Estate outstandings (a) up ($ in millions) 1Q08 4Q07 1Q07 12% driven by the 1Q08 transfer to the Residential $ 12,197 12,437 11,884 portfolio of $3.5 billion in income producing Income producing 35,447
Slide 52: Real Estate Financial Services: Well diversified loan portfolio
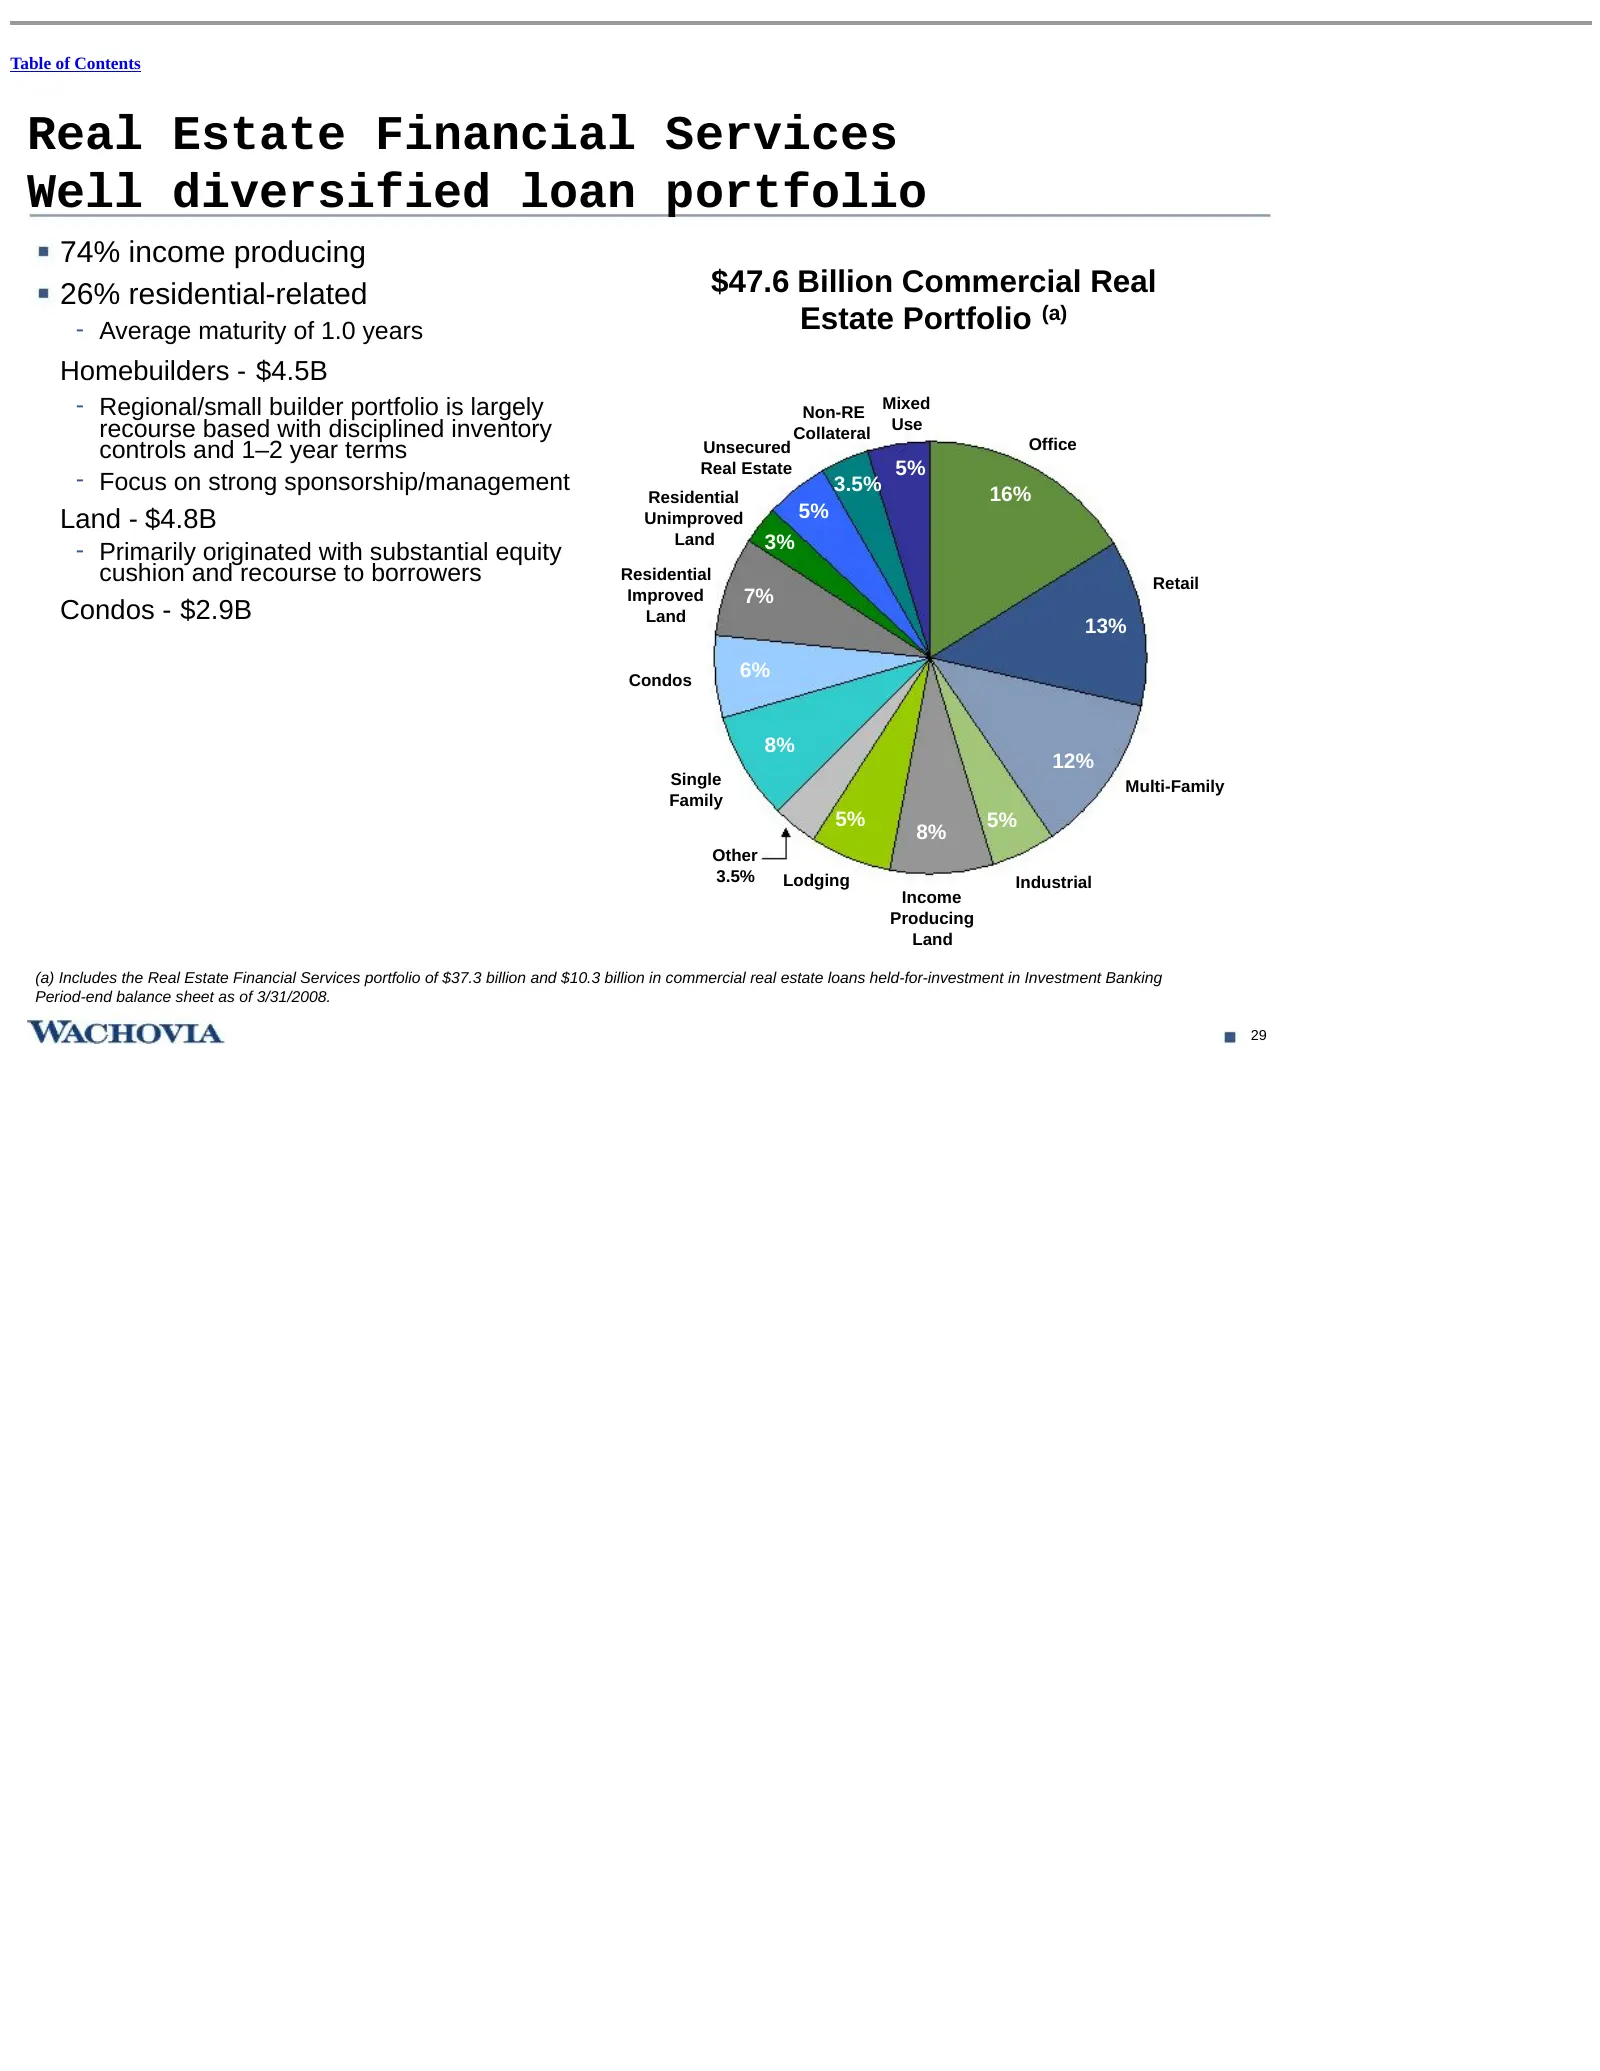
Table of Contents Real Estate Financial Services Well diversified loan portfolio 74% income producing 26% residential-related $47.6 Billion Commercial Real - Average maturity of 1.0 years Estate Portfolio (a) Homebuilders - $4.5B - Regional/small builder portfolio is largely Non-RE Mixed recourse ba
Slide 53: Real Estate Financial Services: Geographic concentrations
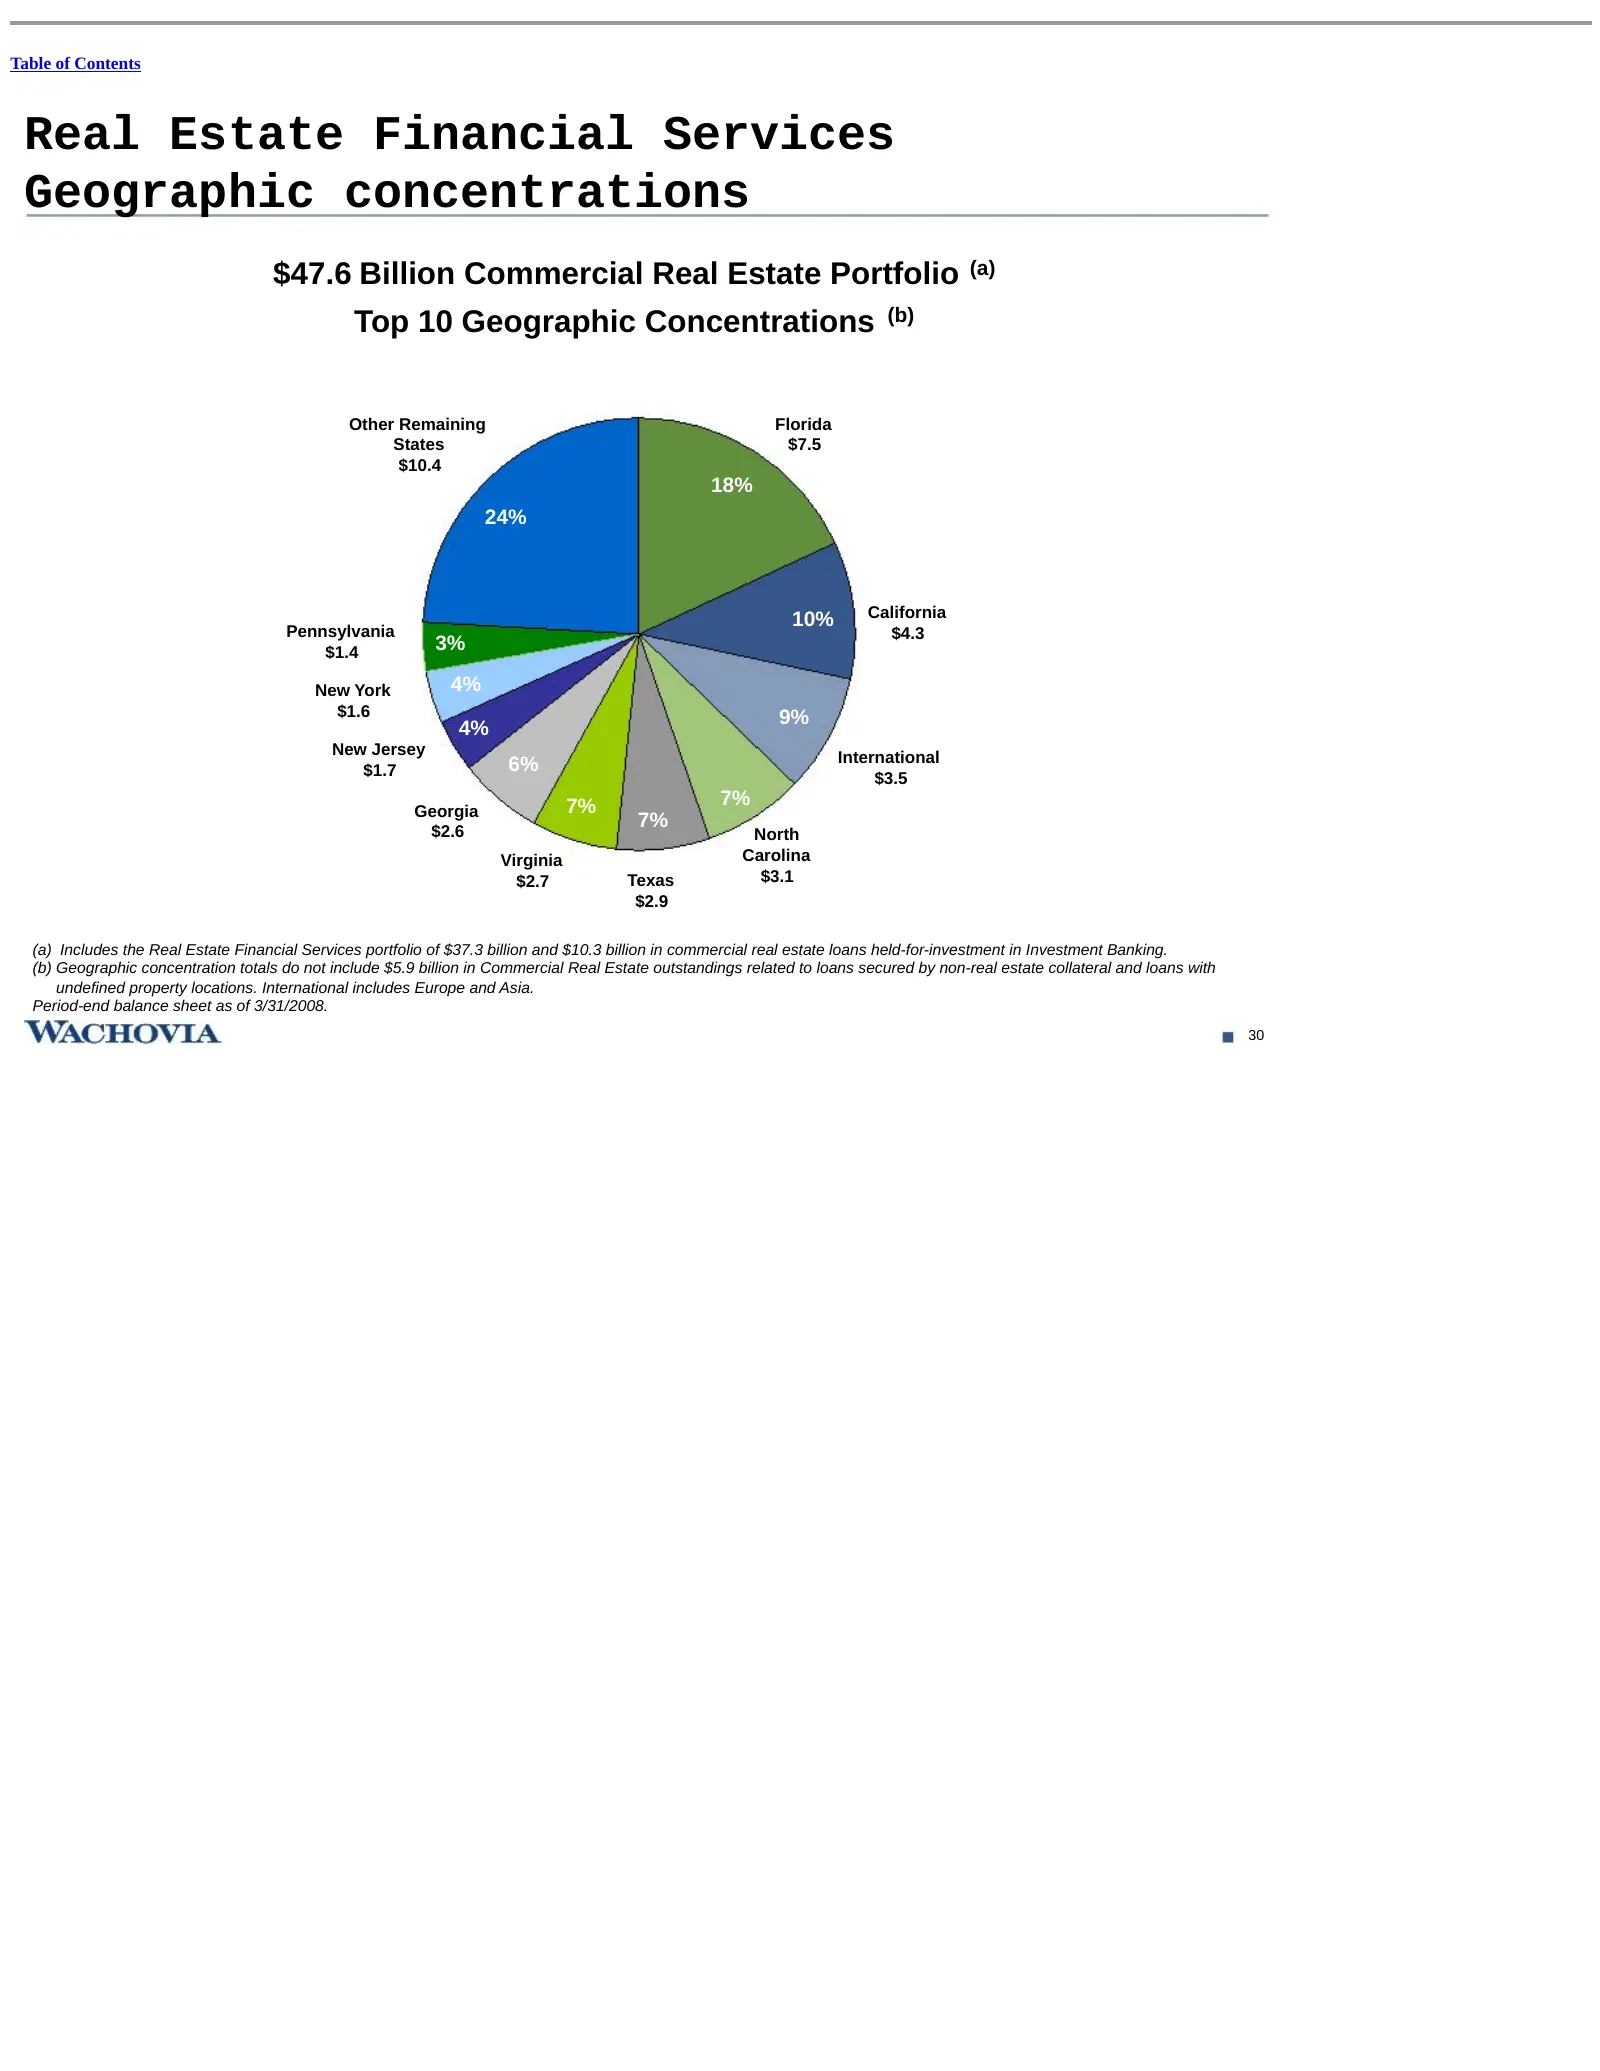
Table of Contents Real Estate Financial Services Geographic concentrations $47.6 Billion Commercial Real Estate Portfolio (a) Top 10 Geographic Concentrations (b) Other Remaining Florida States $7.5 $10.4 18% 24% 10% California Pennsylvania $4.3 $1.4 3% New York 4% $1.6 9% 4% New Jersey Internationa
Slide 54: Middle-market and large corporate
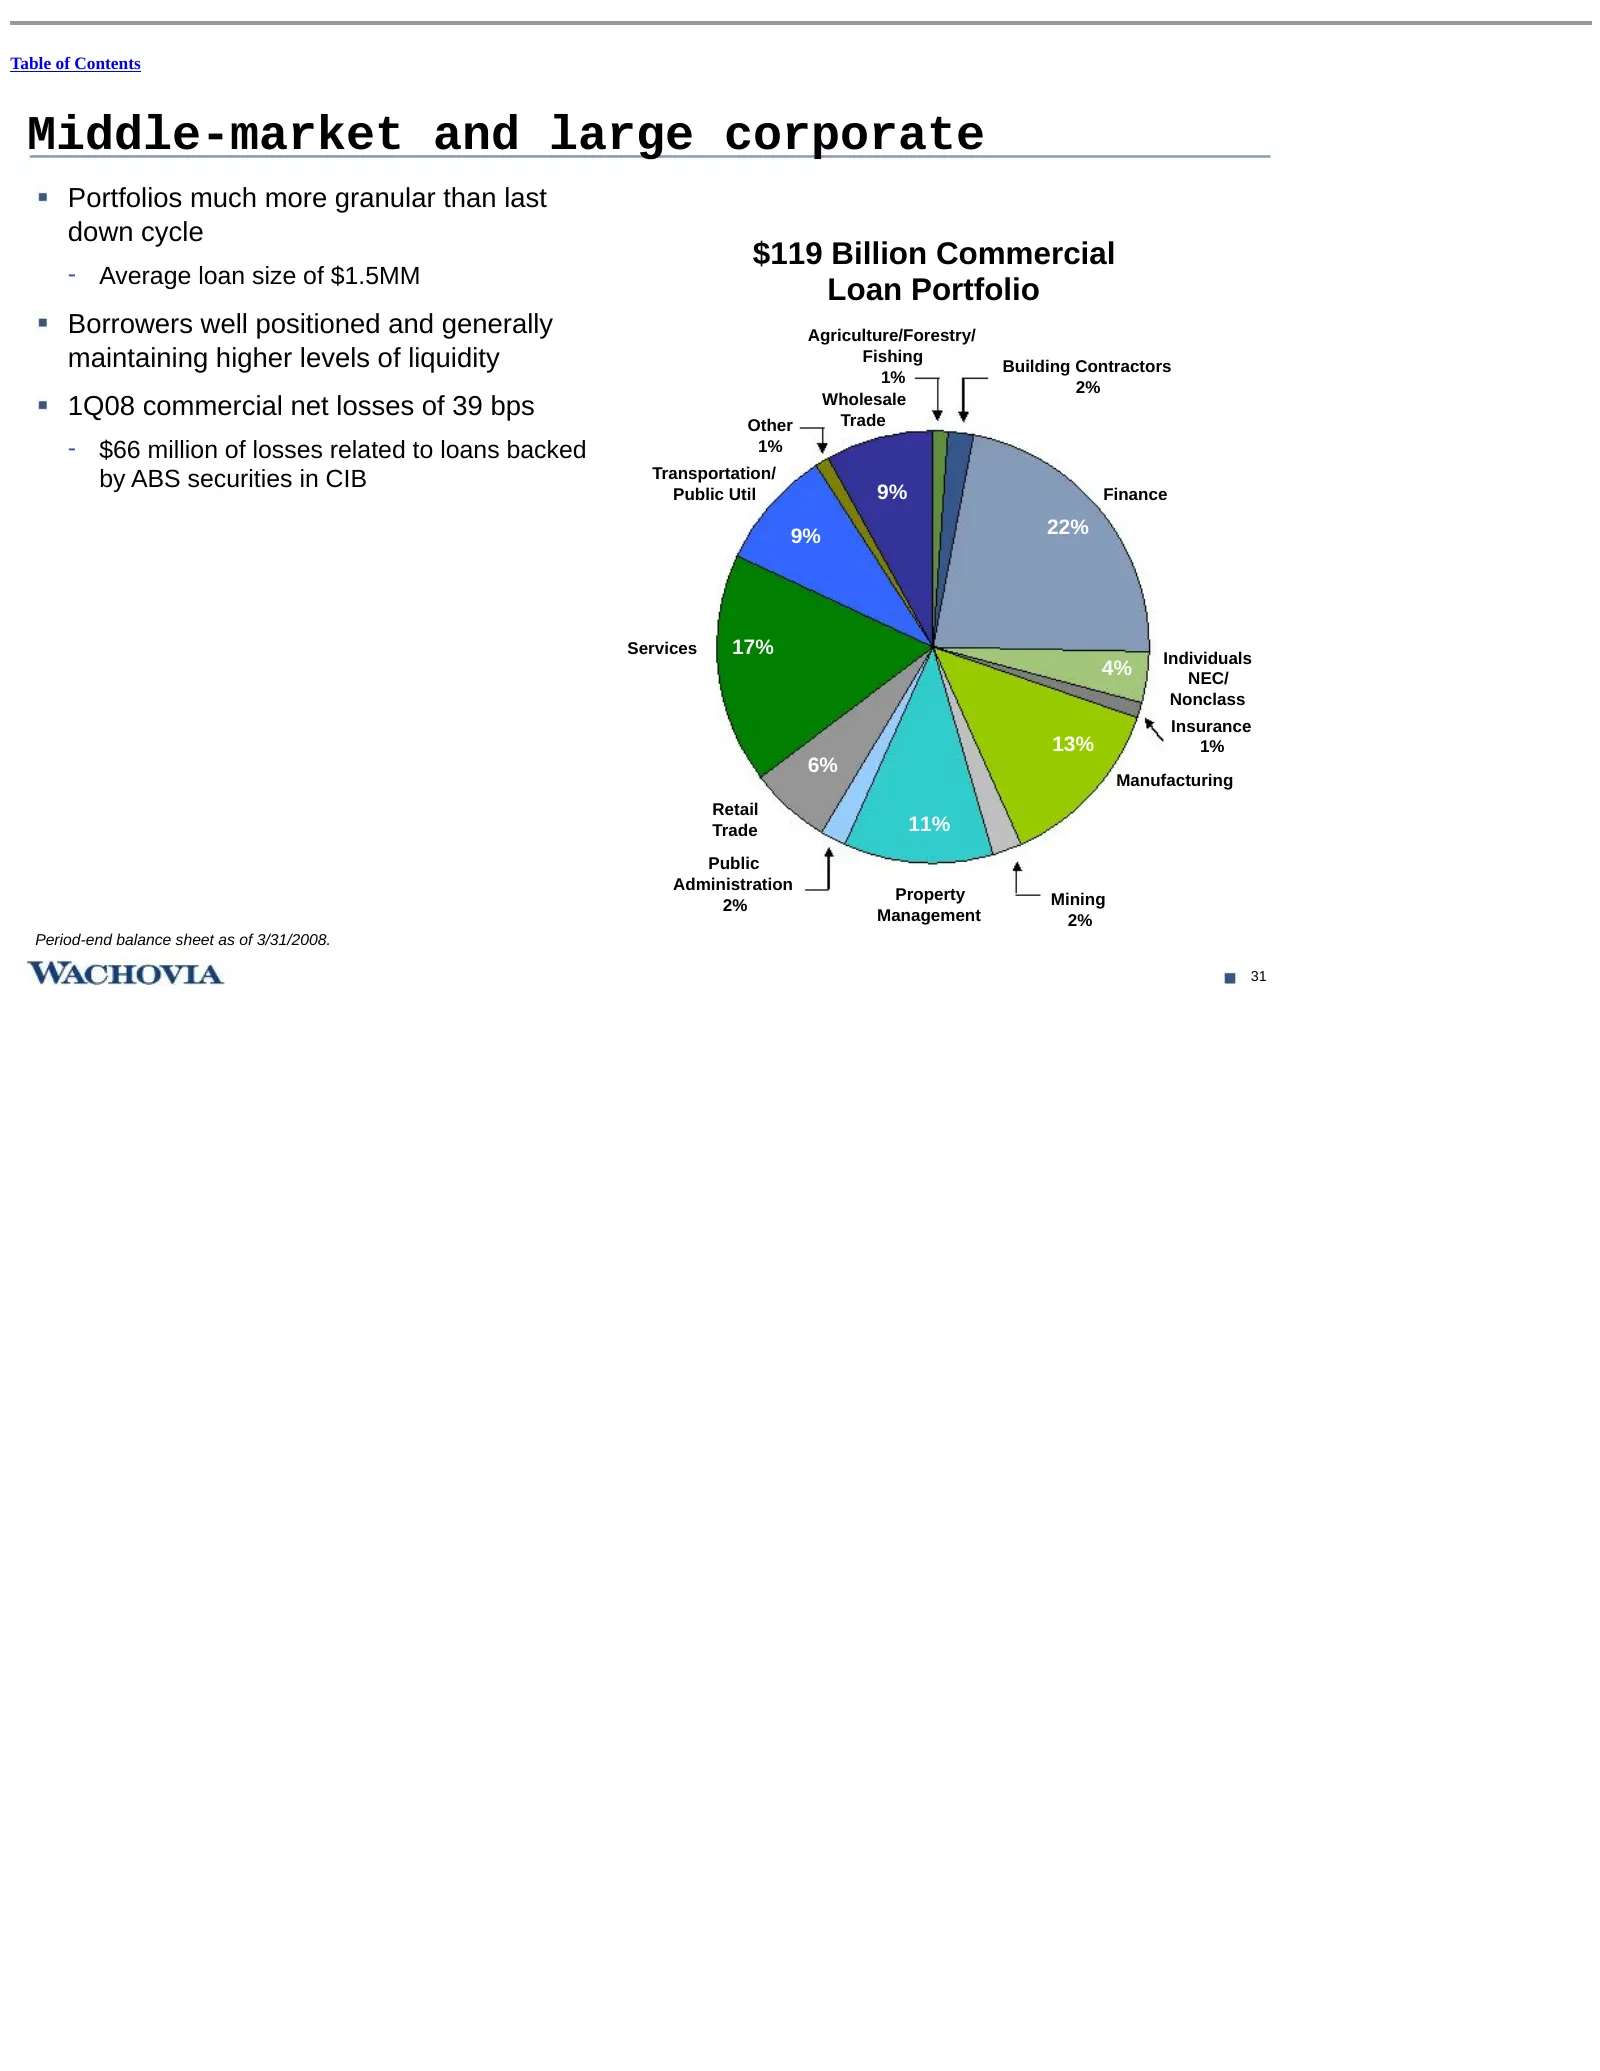
Table of Contents Middle-market and large corporate Portfolios much more granular than last down cycle $119 Billion Commercial - Average loan size of $1.5MM Loan Portfolio Borrowers well positioned and generally Agriculture/Forestry/ maintaining higher levels of liquidity Fishing Building Contractor
Slide 55: Summary and Outlook
Table of Contents Summary and Outlook Expect 2Q08 net interest income to grow by approximately 5 - 7% over 1Q08 and then grow modestly over remaining period of 2008 - Sources of growth to include: Modest loan growth from 1Q08 levels Continued deposit growth including growth in FDIC sweep deposits Be

Slide 56: Appendix
Table of Contents Appendix 33
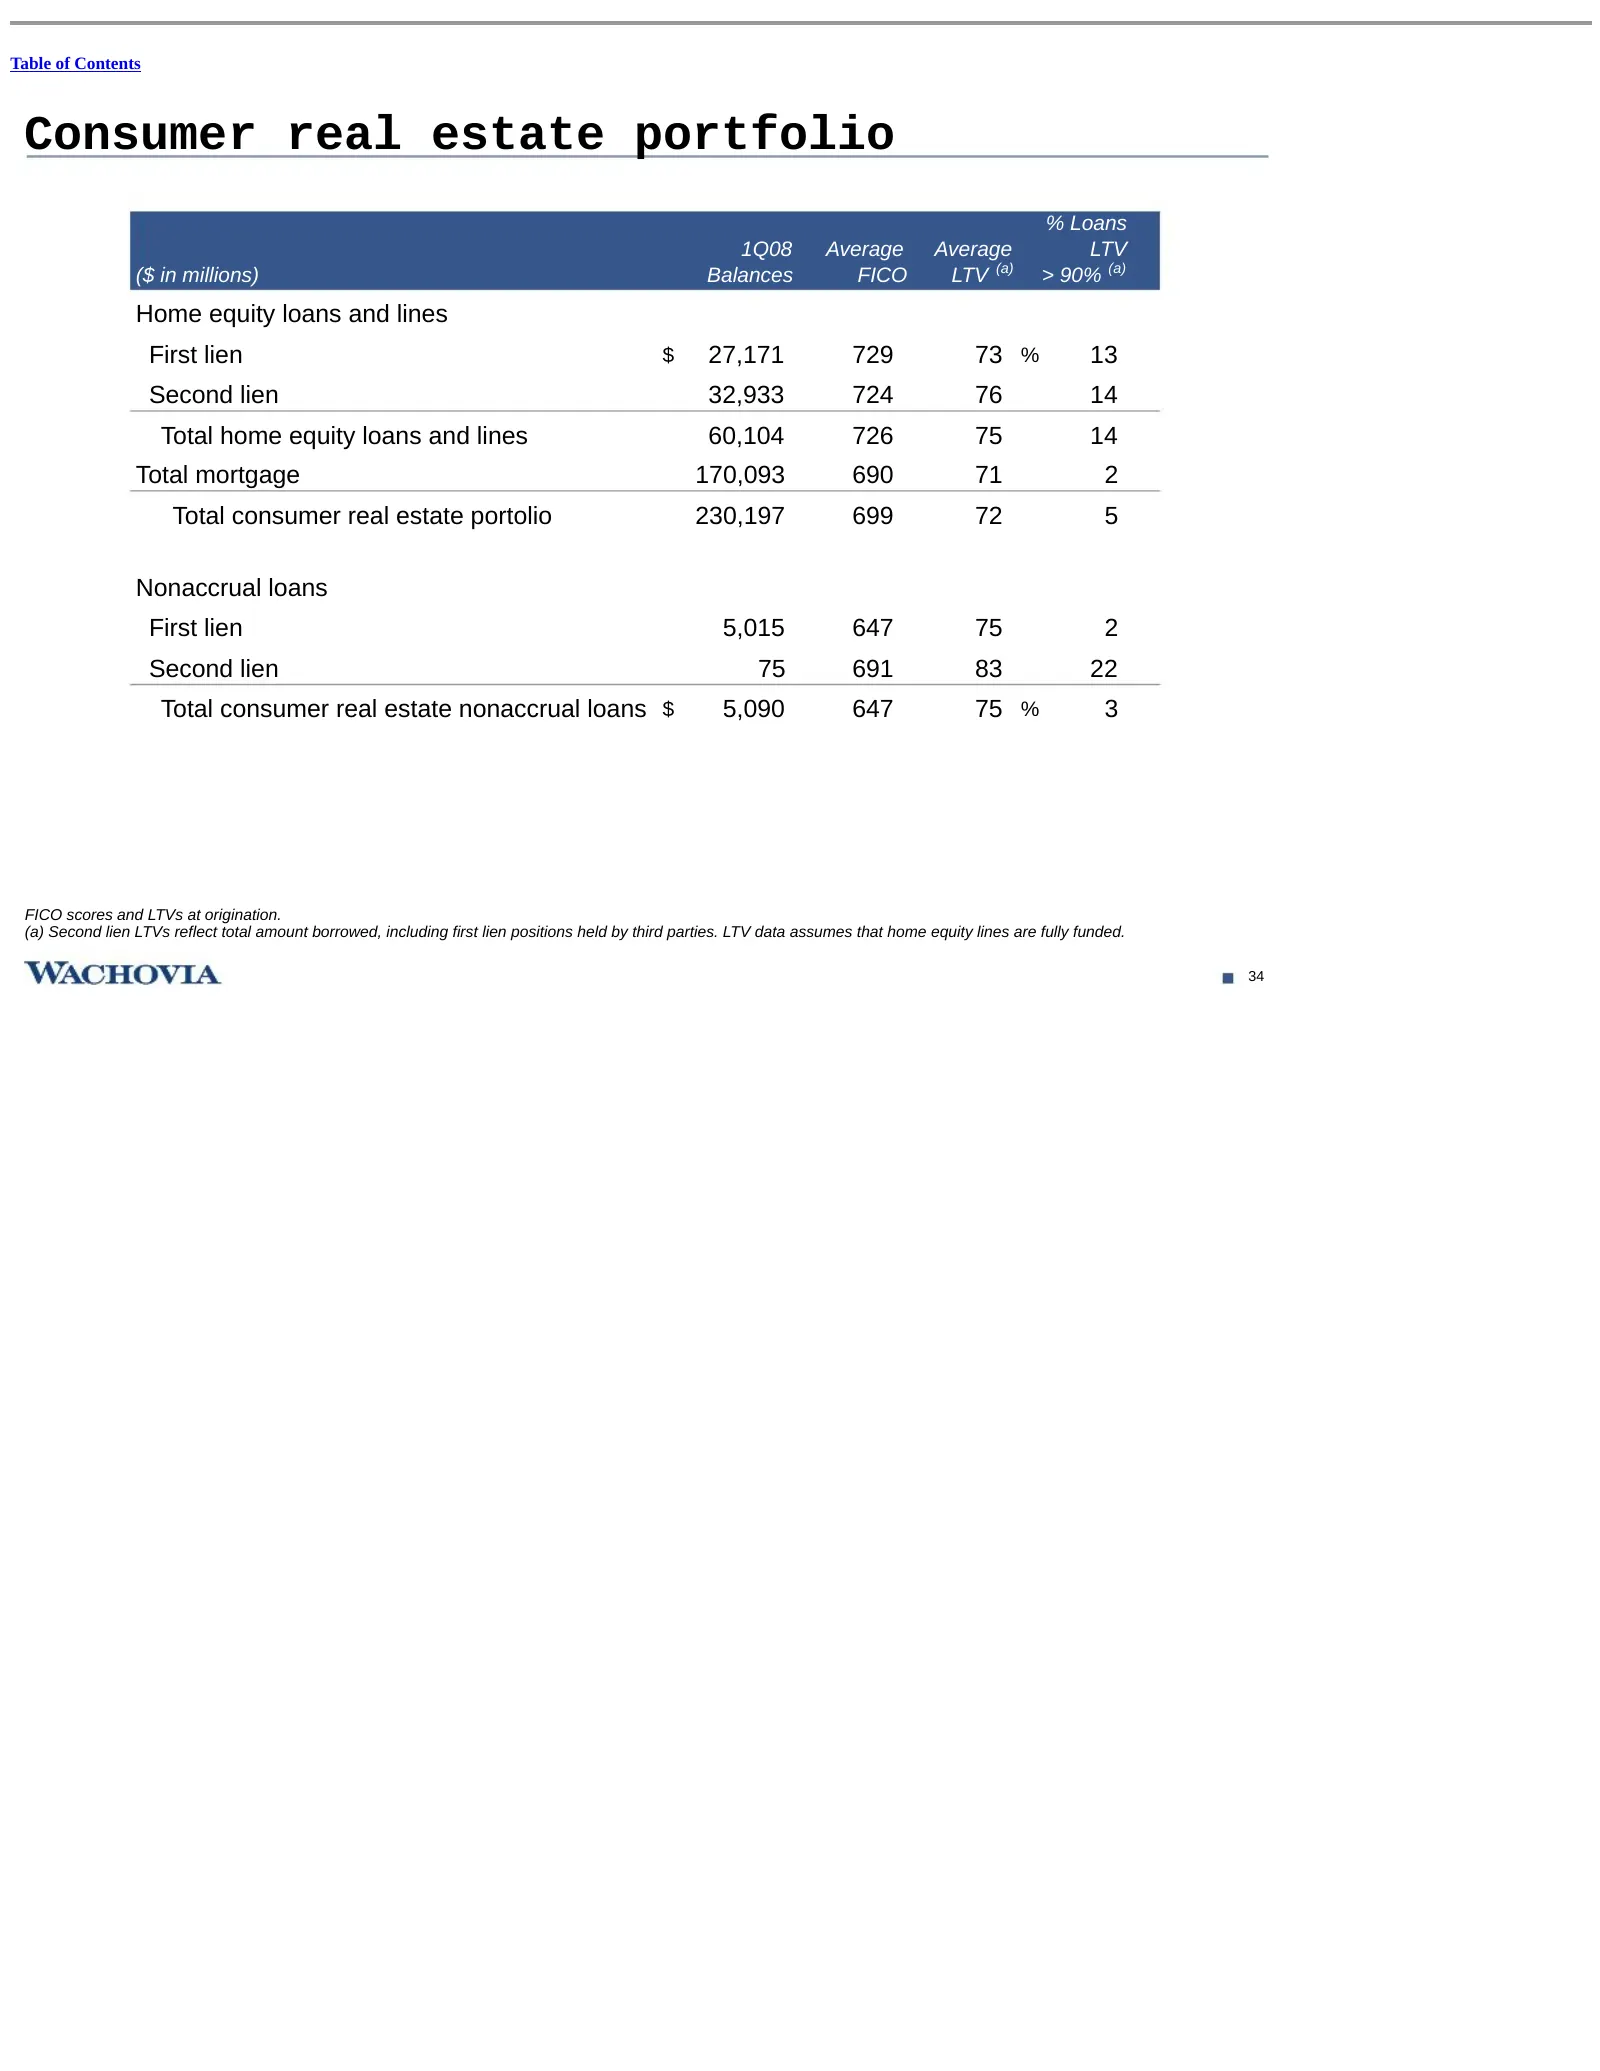
Slide 57: Consumer real estate portfolio
Table of Contents Consumer real estate portfolio % Loans 1Q08 Average Average LTV ($ in millions) Balances FICO LTV (a) > 90% (a) Home equity loans and lines First lien $ 27,171 729 73 % 13 Second lien 32,933 724 76 14 Total home equity loans and lines 60,104 726 75 14 Total mortgage 170,093 690 71
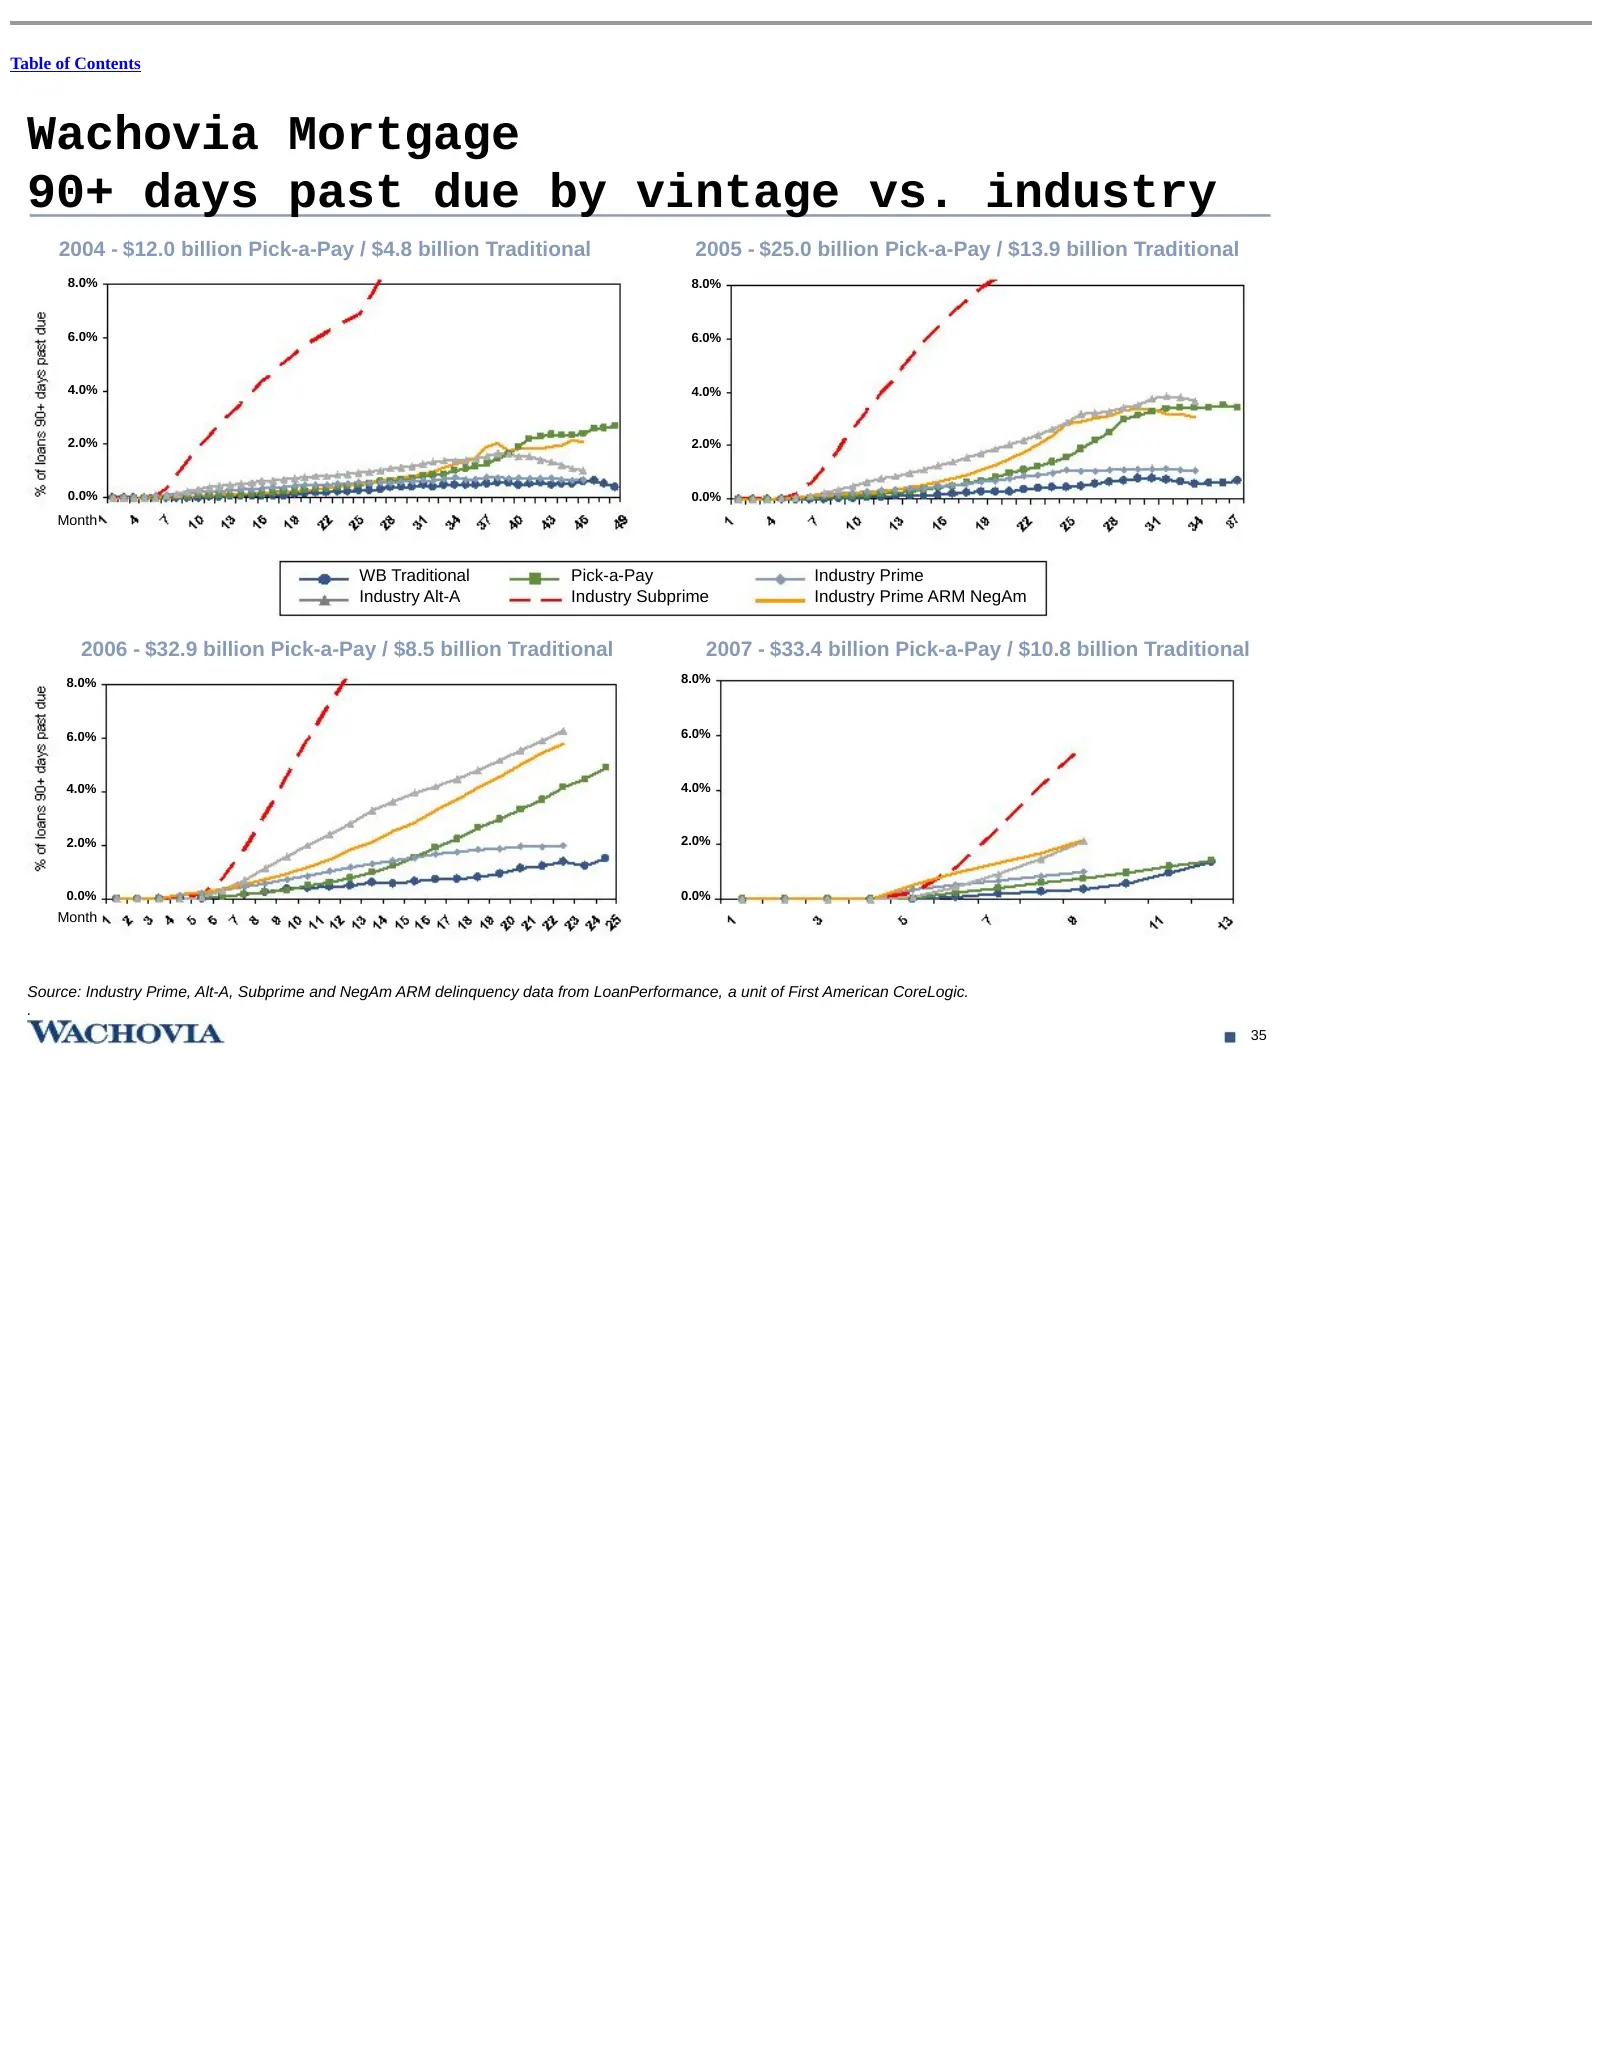
Slide 58: Mortgage 90+ days past due by vintage vs. industry
Table of Contents Wachovia Mortgage 90+ days past due by vintage vs. industry 2004 - $12.0 billion Pick-a-Pay / $4.8 billion Traditional 2005 - $25.0 billion Pick-a-Pay / $13.9 billion Traditional 8.0% 8.0% 6.0% 6.0% 4.0% 4.0% 2.0% 2.0% 0.0% 0.0% Month WB Traditional Pick-a-Pay Industry Prime Indust
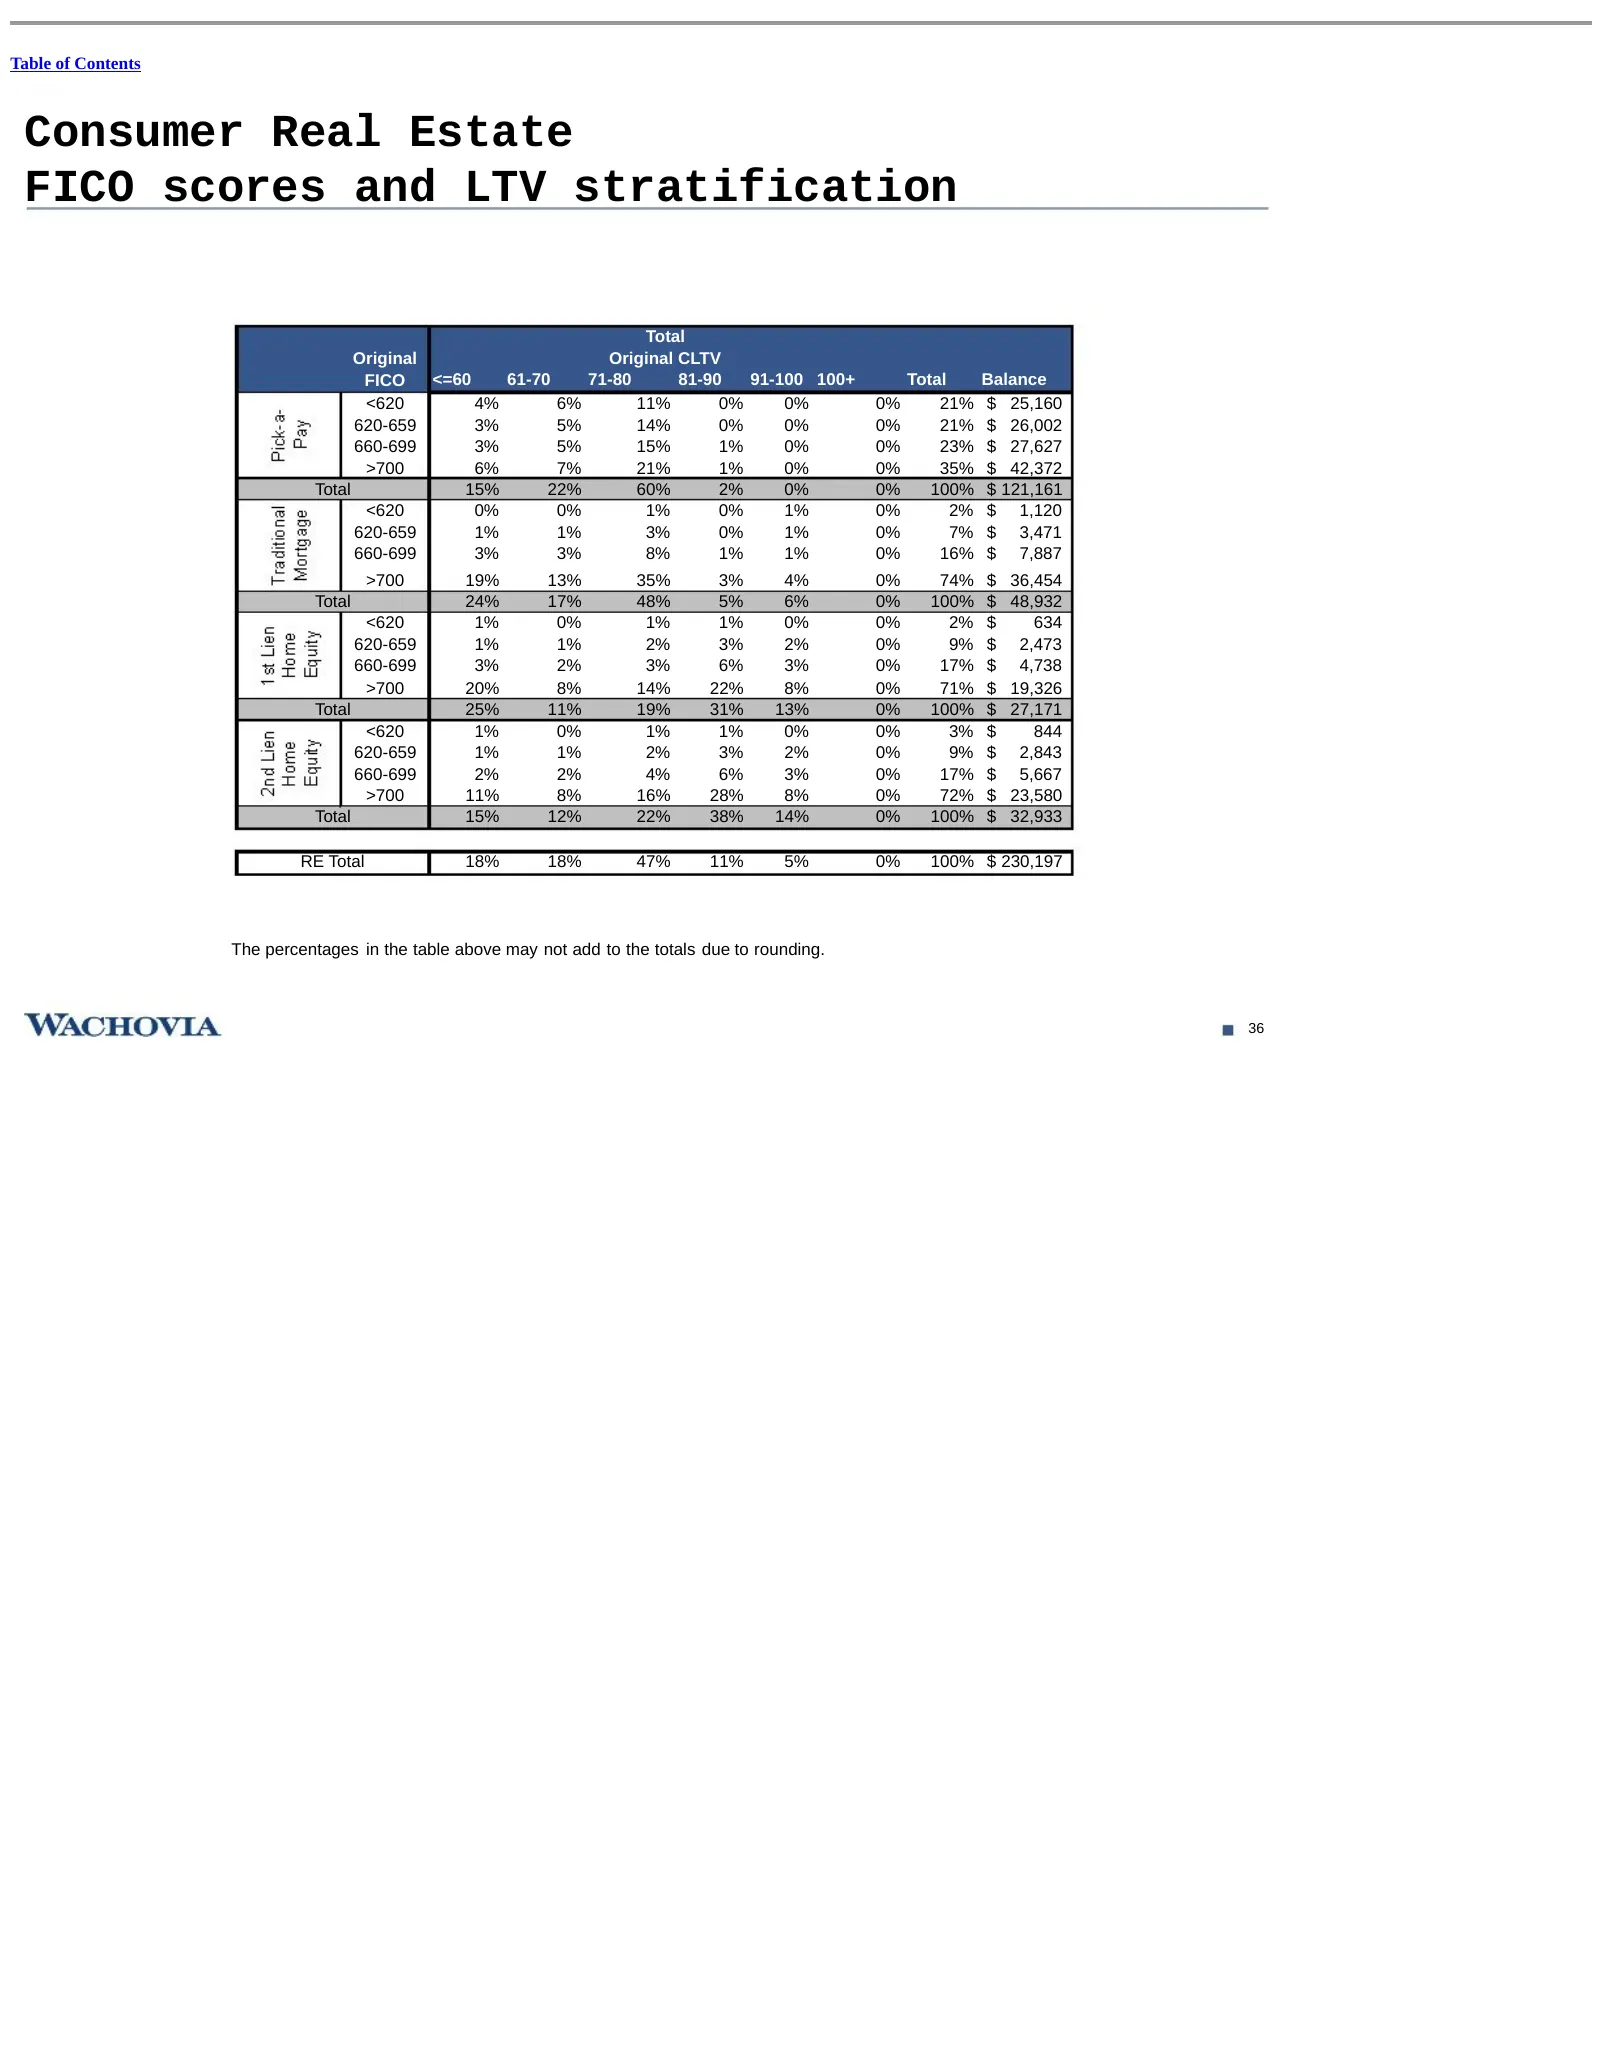
Slide 59: Consumer Real Estate FICO scores and LTV stratification
Table of Contents Consumer Real Estate FICO scores and LTV stratification Total Original Original CLTV FICO <=60 61-70 71-80 81-90 91-100 100+ Total Balance <620 4% 6% 11% 0% 0% 0% 21% $ 25,160 620-659 3% 5% 14% 0% 0% 0% 21% $ 26,002 660-699 3% 5% 15% 1% 0% 0% 23% $ 27,627 >700 6% 7% 21% 1% 0% 0% 35
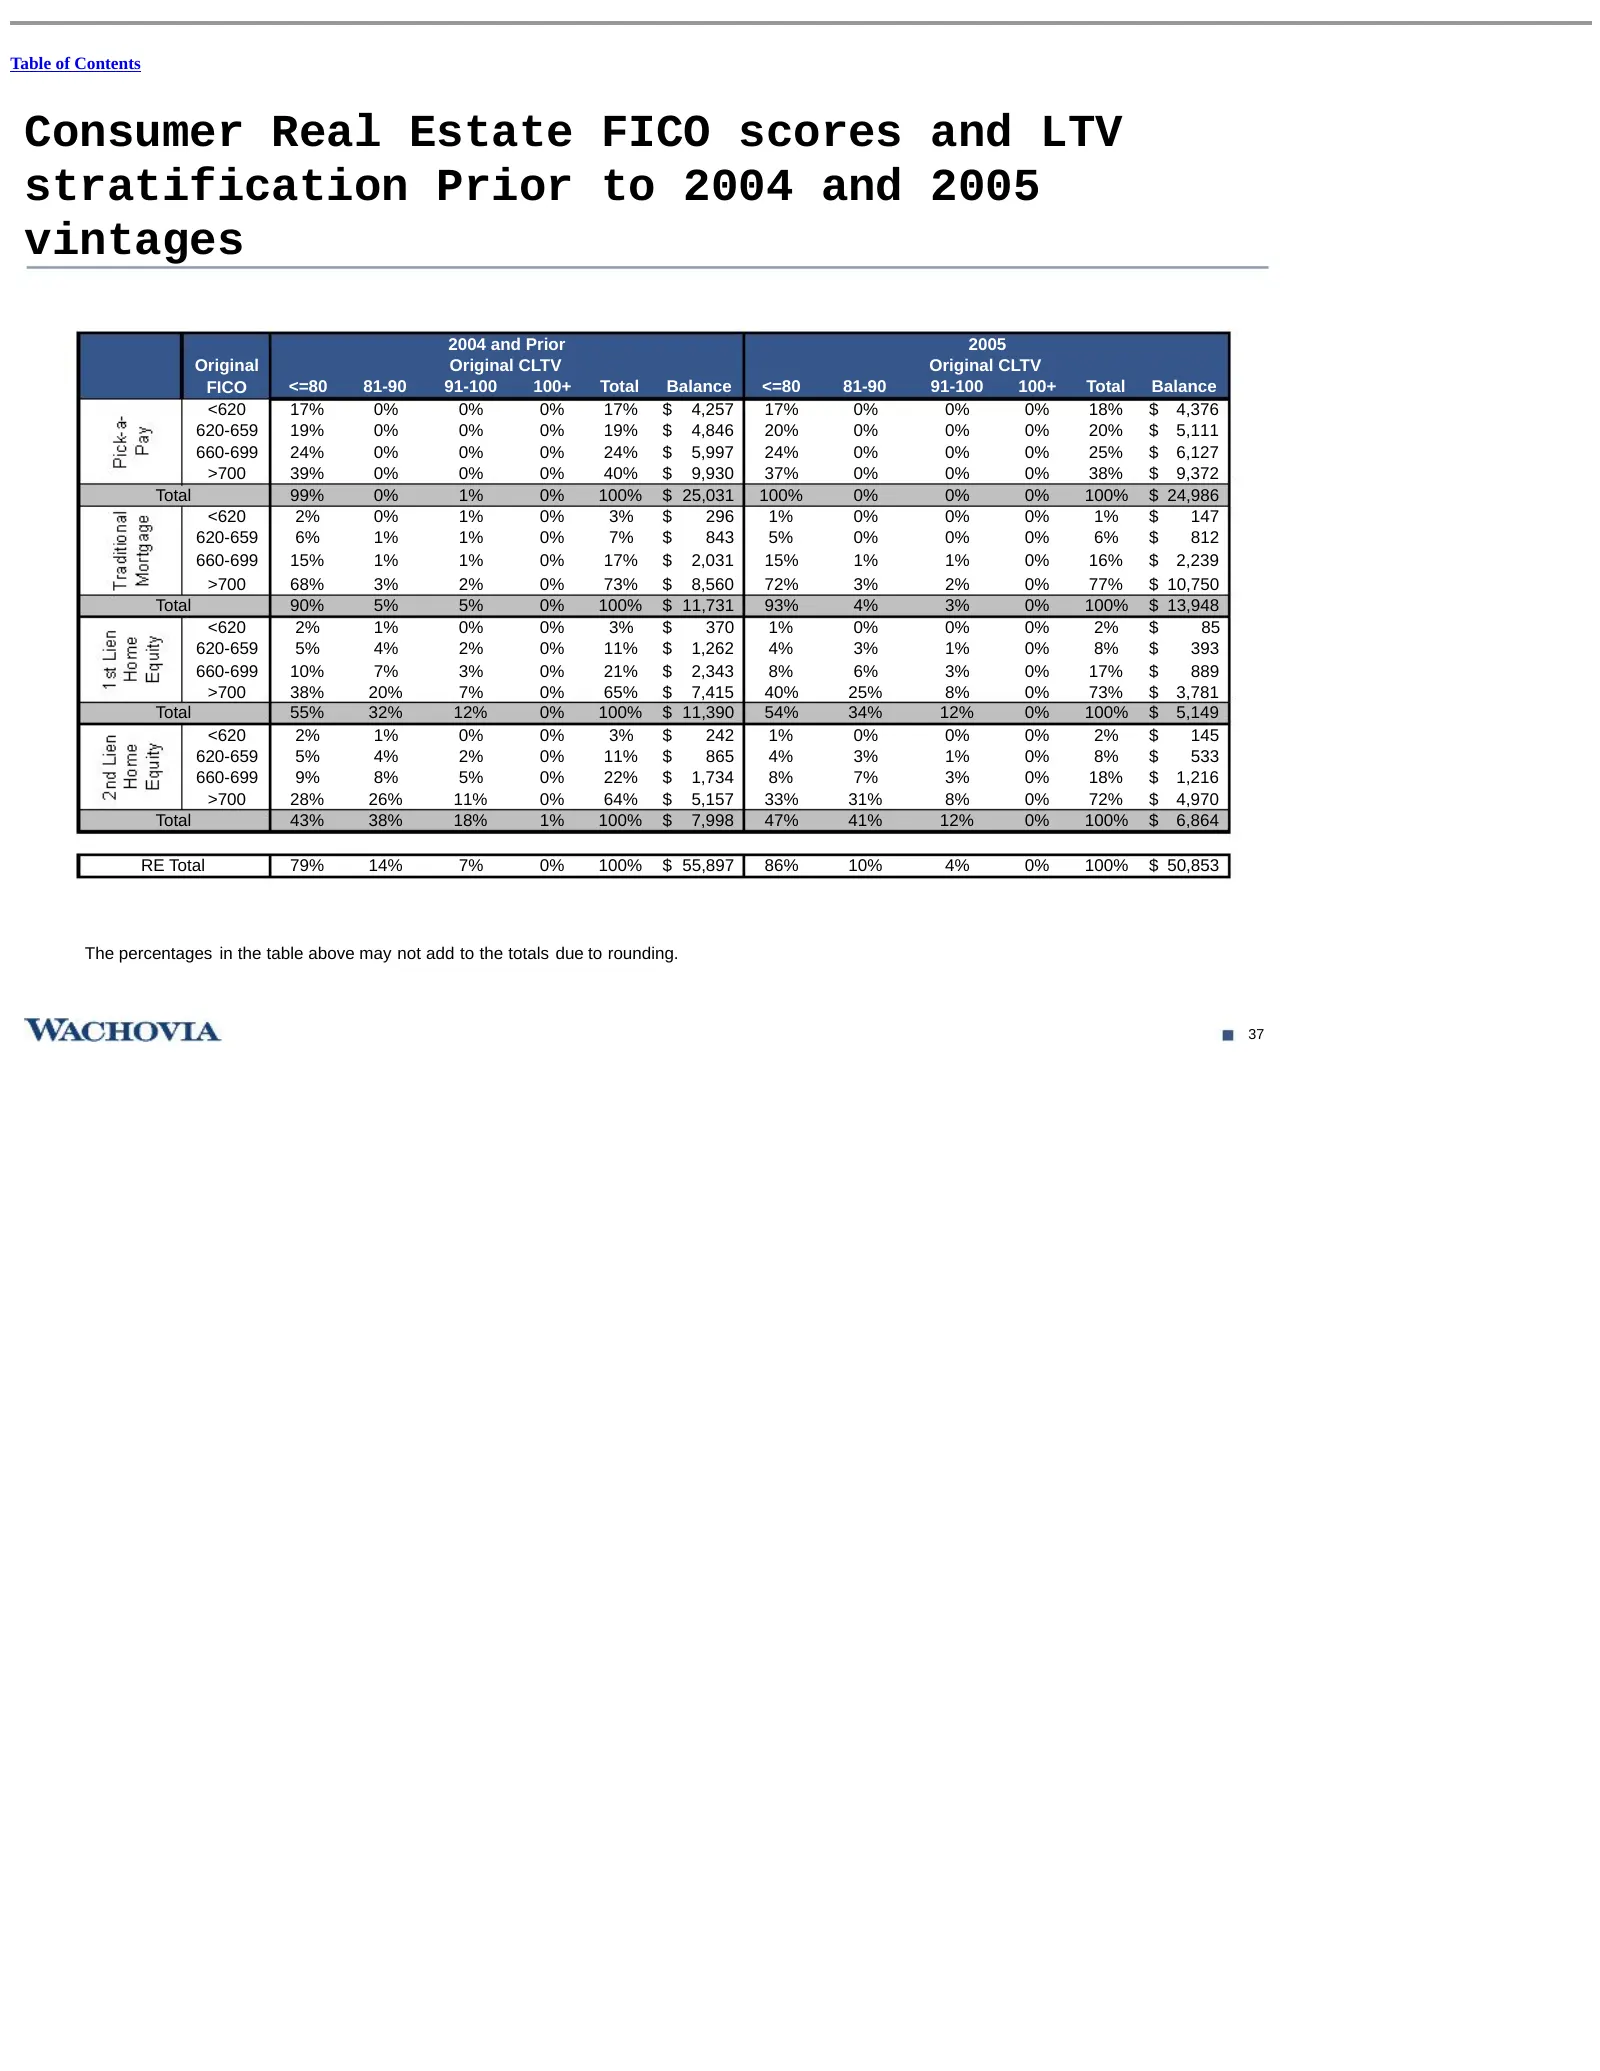
Slide 60: FICO and LTV stratification: 2004 and 2005 vintages
Table of Contents Consumer Real Estate FICO scores and LTV stratification Prior to 2004 and 2005 vintages 2004 and Prior 2005 Original Original CLTV Original CLTV FICO <=80 81-90 91-100 100+ Total Balance <=80 81-90 91-100 100+ Total Balance <620 17% 0% 0% 0% 17% $ 4,257 17% 0% 0% 0% 18% $ 4,376 620
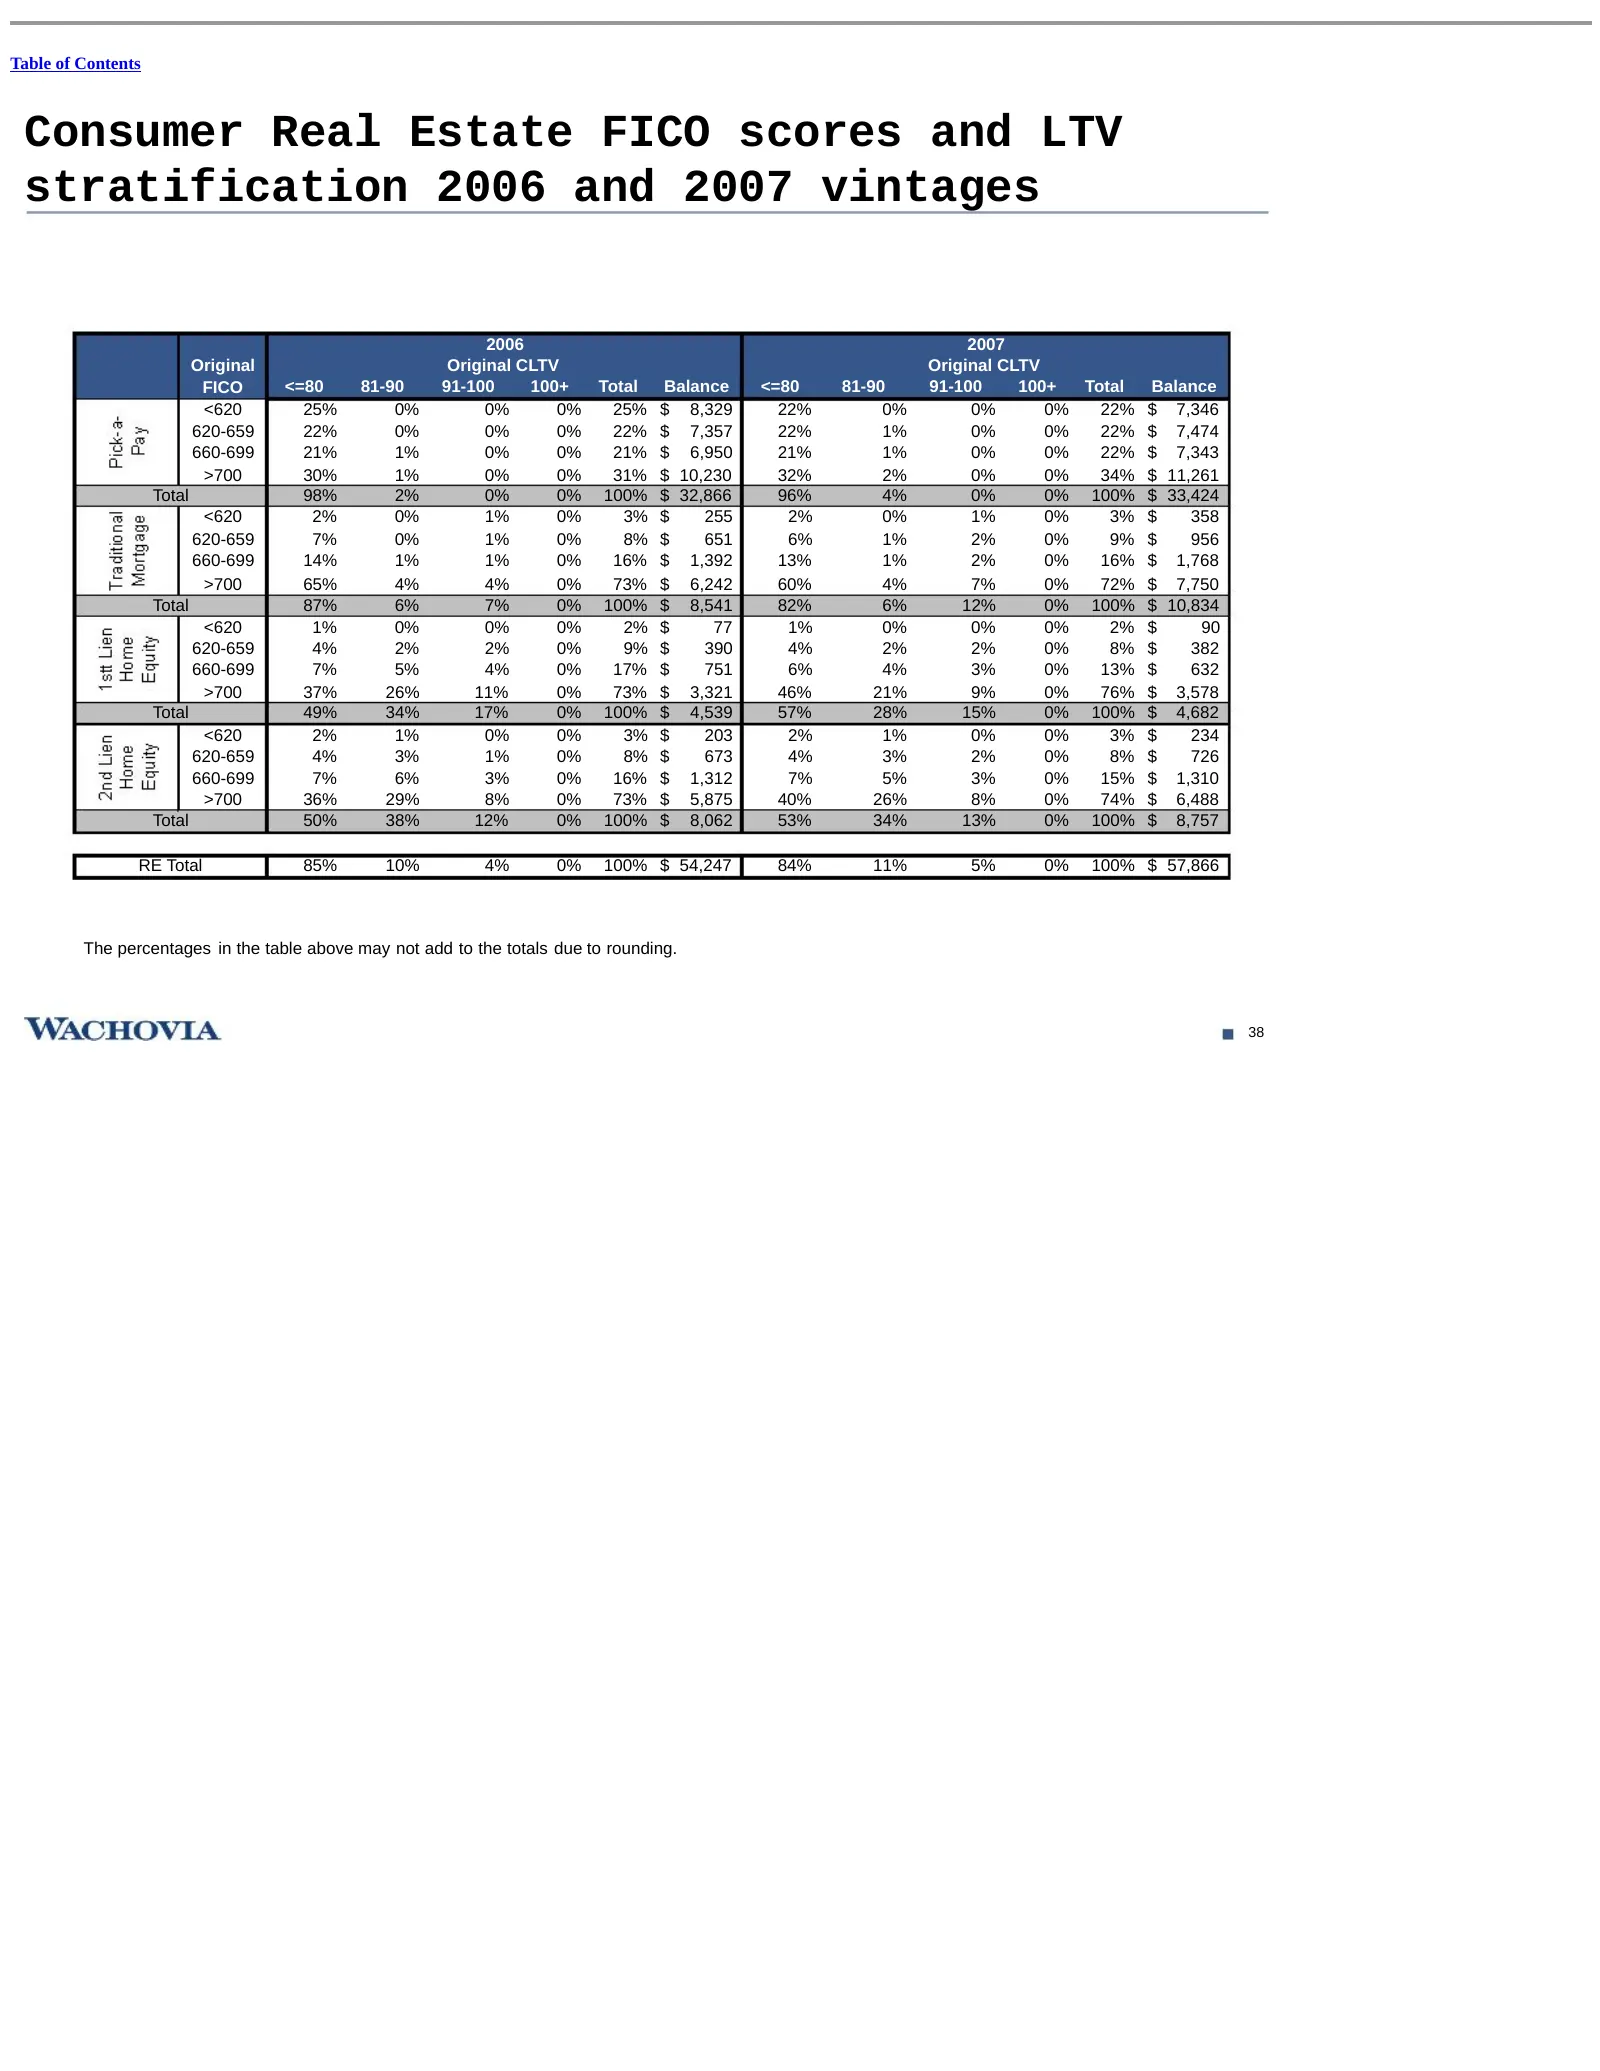
Slide 61: FICO and LTV stratification: 2006 and 2007 vintages
Table of Contents Consumer Real Estate FICO scores and LTV stratification 2006 and 2007 vintages 2006 2007 Original Original CLTV Original CLTV FICO <=80 81-90 91-100 100+ Total Balance <=80 81-90 91-100 100+ Total Balance <620 25% 0% 0% 0% 25% $ 8,329 22% 0% 0% 0% 22% $ 7,346 620-659 22% 0% 0% 0% 2
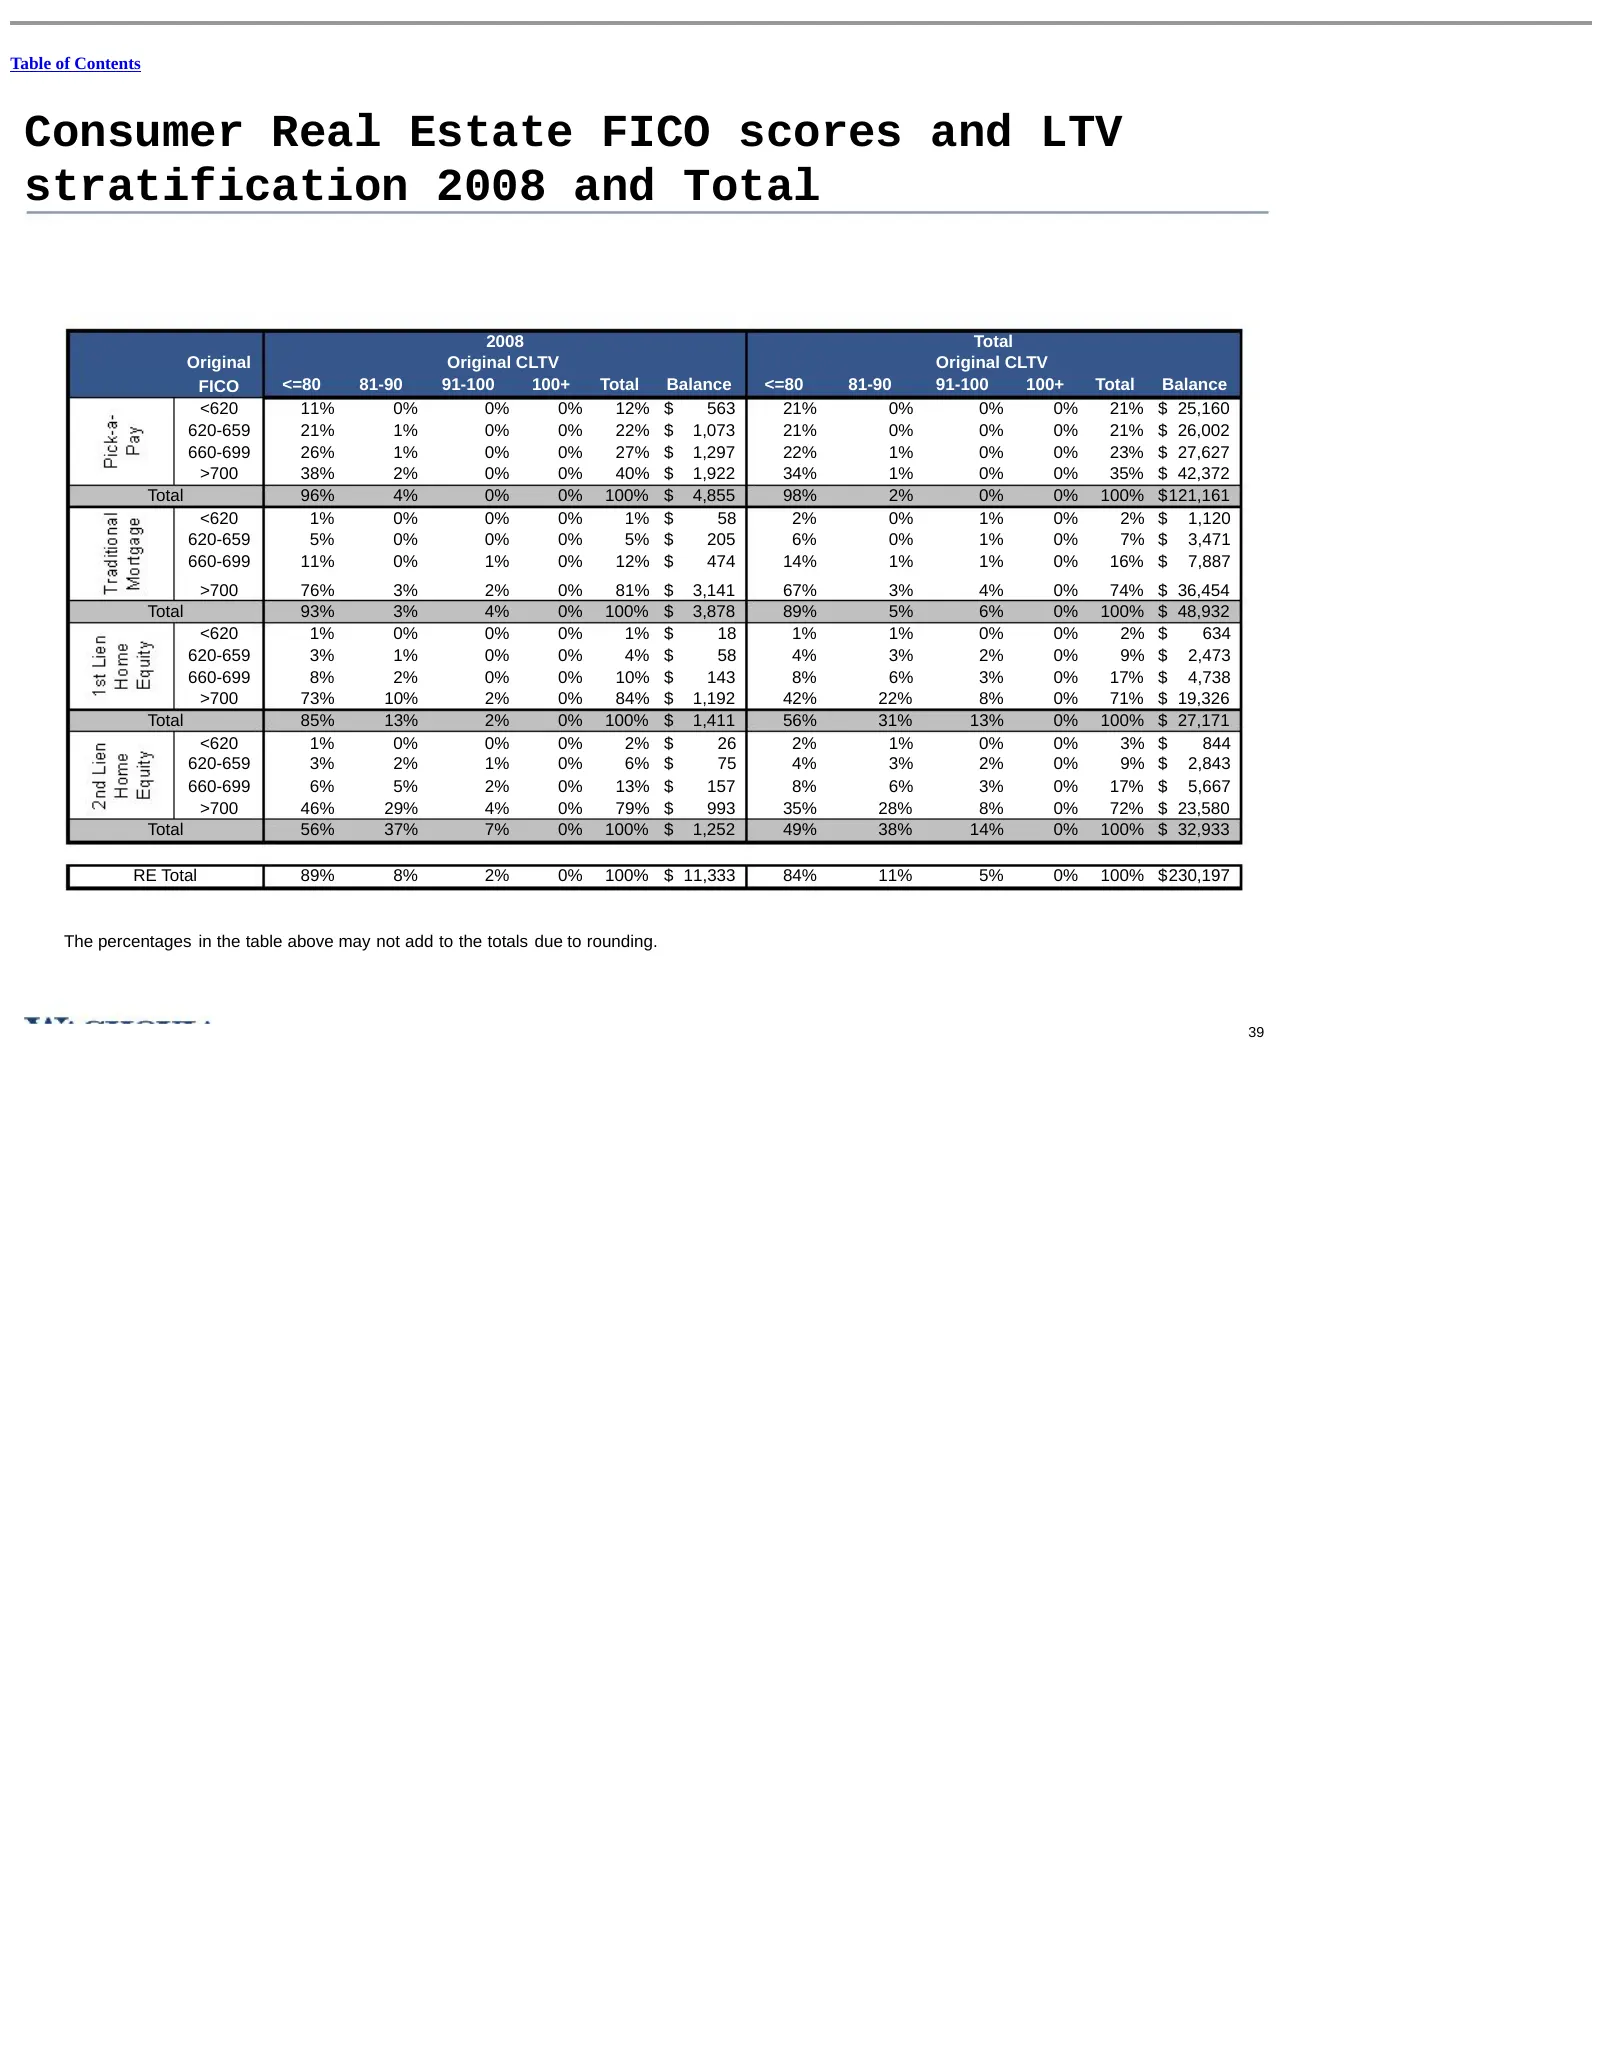
Slide 62: FICO and LTV stratification: 2008 and Total
Table of Contents Consumer Real Estate FICO scores and LTV stratification 2008 and Total 2008 Total Original Original CLTV Original CLTV FICO <=80 81-90 91-100 100+ Total Balance <=80 81-90 91-100 100+ Total Balance <620 11% 0% 0% 0% 12% $ 563 21% 0% 0% 0% 21% $ 25,160 620-659 21% 1% 0% 0% 22% $ 1,0
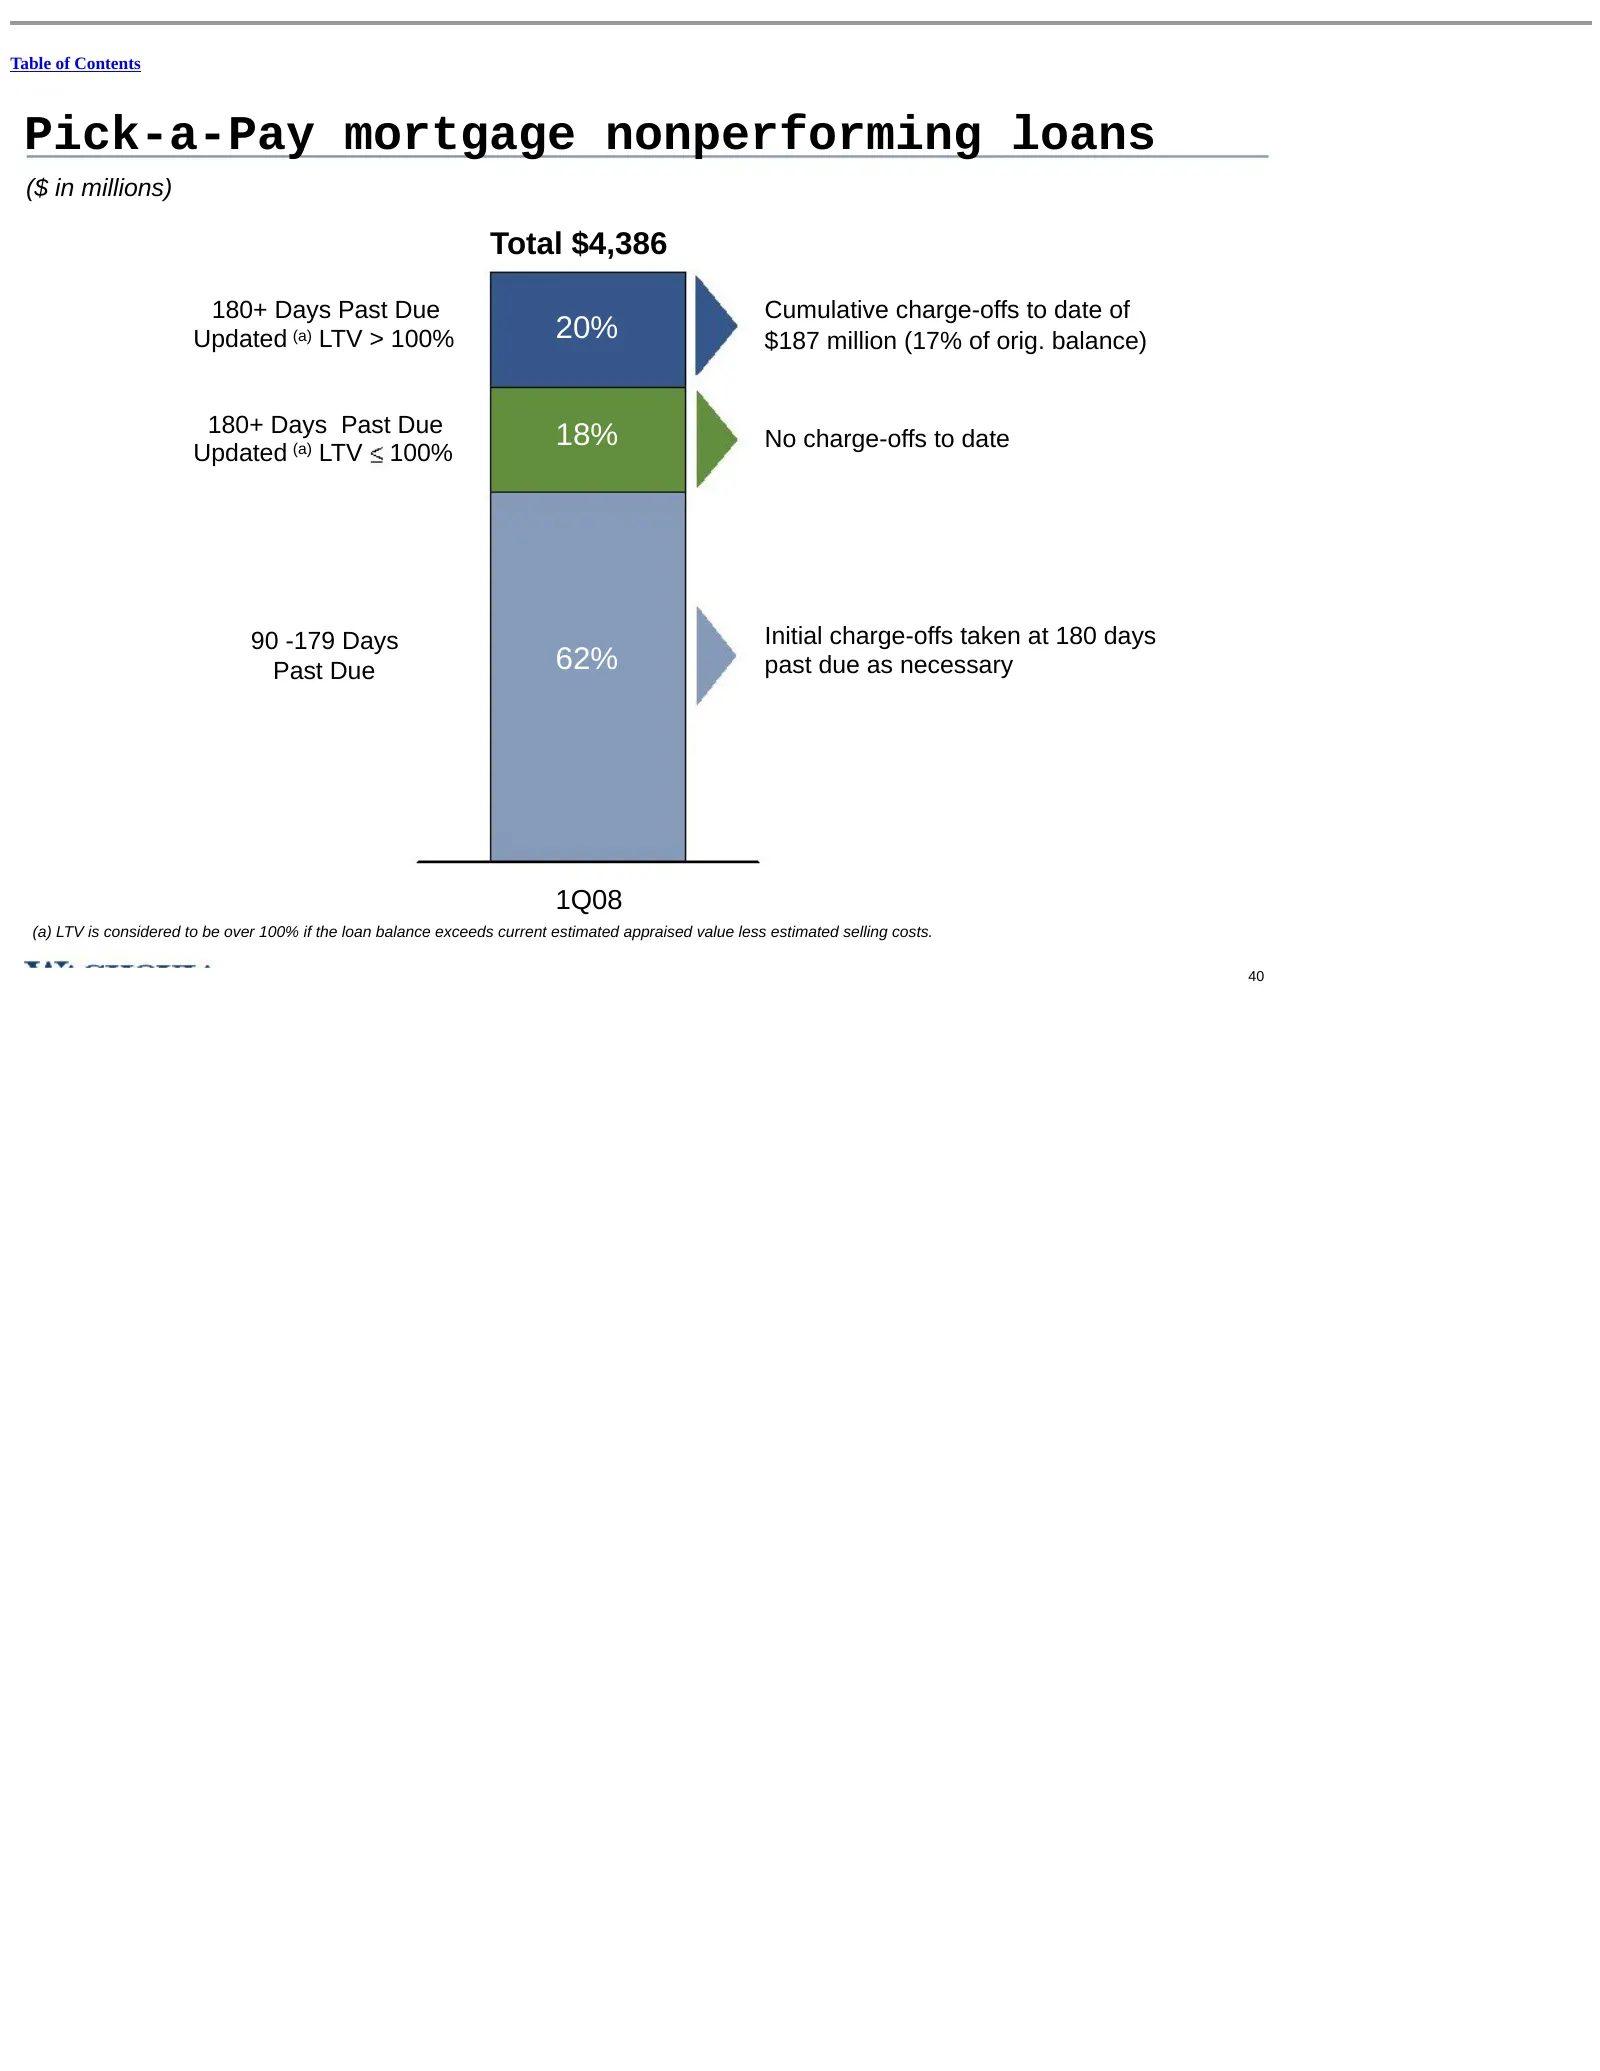
Slide 63: Pick-a-Pay mortgage nonperforming loans
Table of Contents Pick-a-Pay mortgage nonperforming loans ($ in millions) Total $4,386 180+ Days Past Due Cumulative charge-offs to date of Updated (a) LTV > 100% 20% $187 million (17% of orig. balance) 180+ Days Past Due 18% No charge-offs to date Updated (a) LTV 100% 90 -179 Days Initial charge-of
Slide 64: Pick-a-Pay reserve model: Our use of OFHEO in reserve modeling
Table of Contents Pick-a-Pay reserve model Our use of OFHEO in reserve modeling Office of Federal Housing Enterprise Oversight (OFHEO) is a widely recognized source of data that measures average price changes in home sales financed by conventional mortgages, purchased by Fannie Mae or Freddie Mac, a
Slide 65: Cautionary statement
Table of Contents Cautionary statement The foregoing materials and management’s discussion of them may contain, among other things, certain forward-looking statements with respect to Wachovia, as well as the goals, plans, objectives, intentions, expectations, financial condition, results of operatio
Slide 66: Notes on non-GAAP financial measures
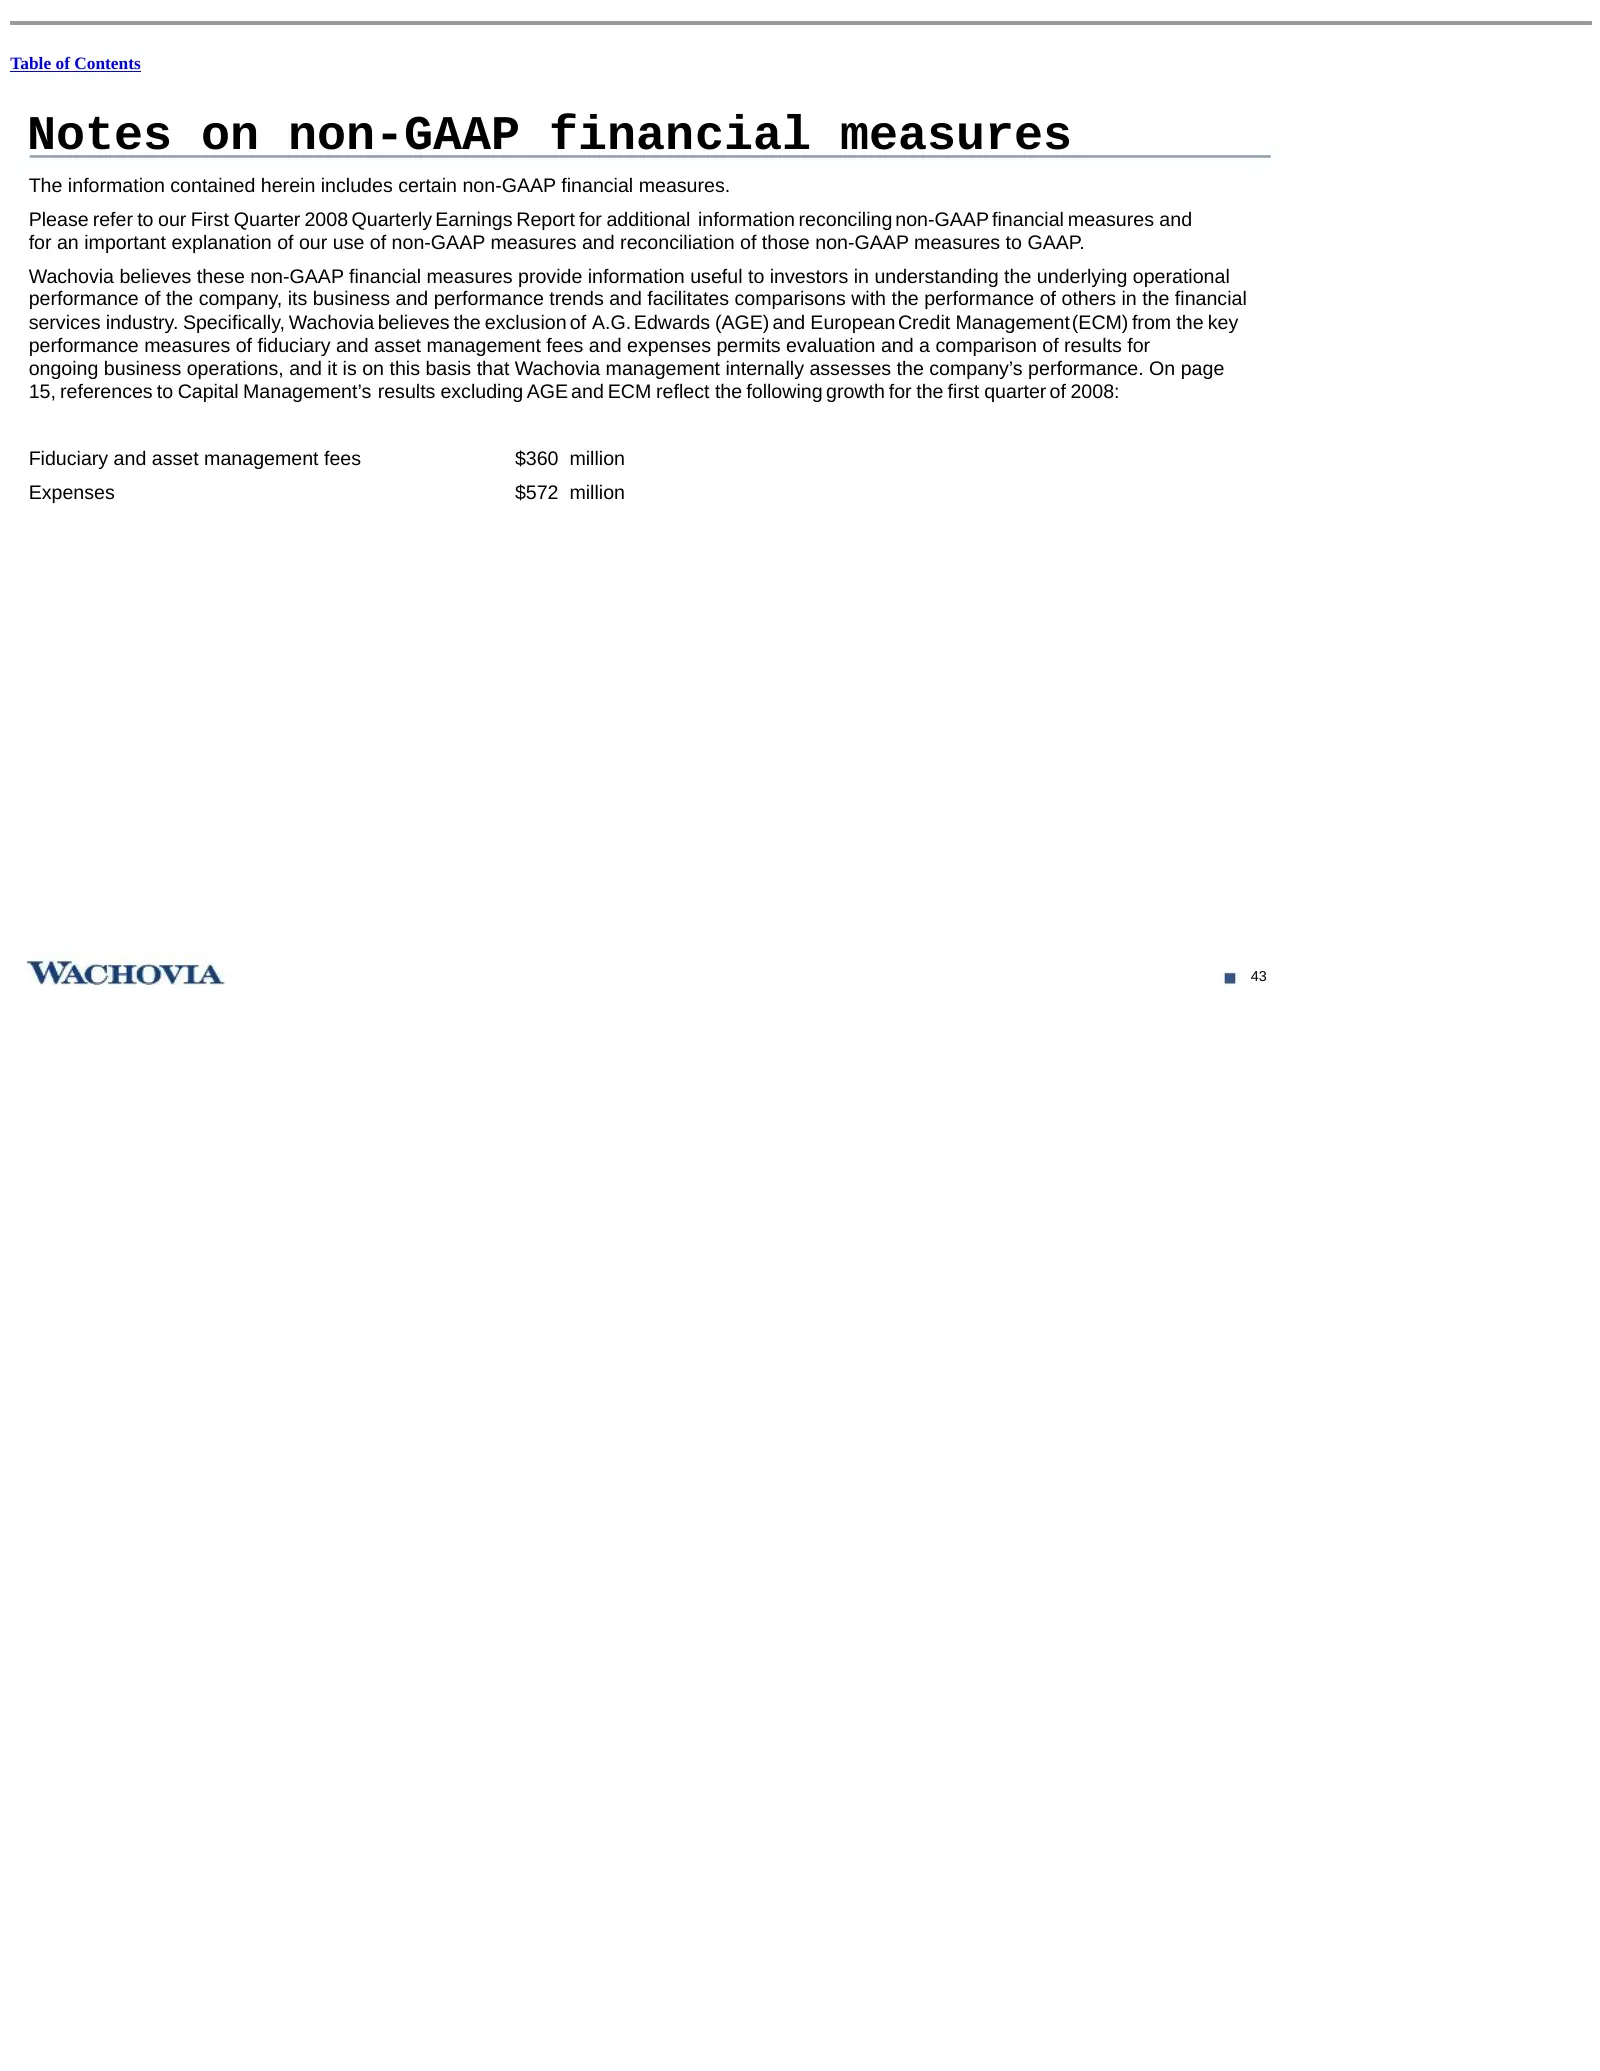
Table of Contents Notes on non-GAAP financial measures The information contained herein includes certain non-GAAP financial measures. Please refer to our First Quarter 2008 Quarterly Earnings Report for additional information reconciling non-GAAP financial measures and for an important explanation o
Slide 67: Notes on non-GAAP financial measures
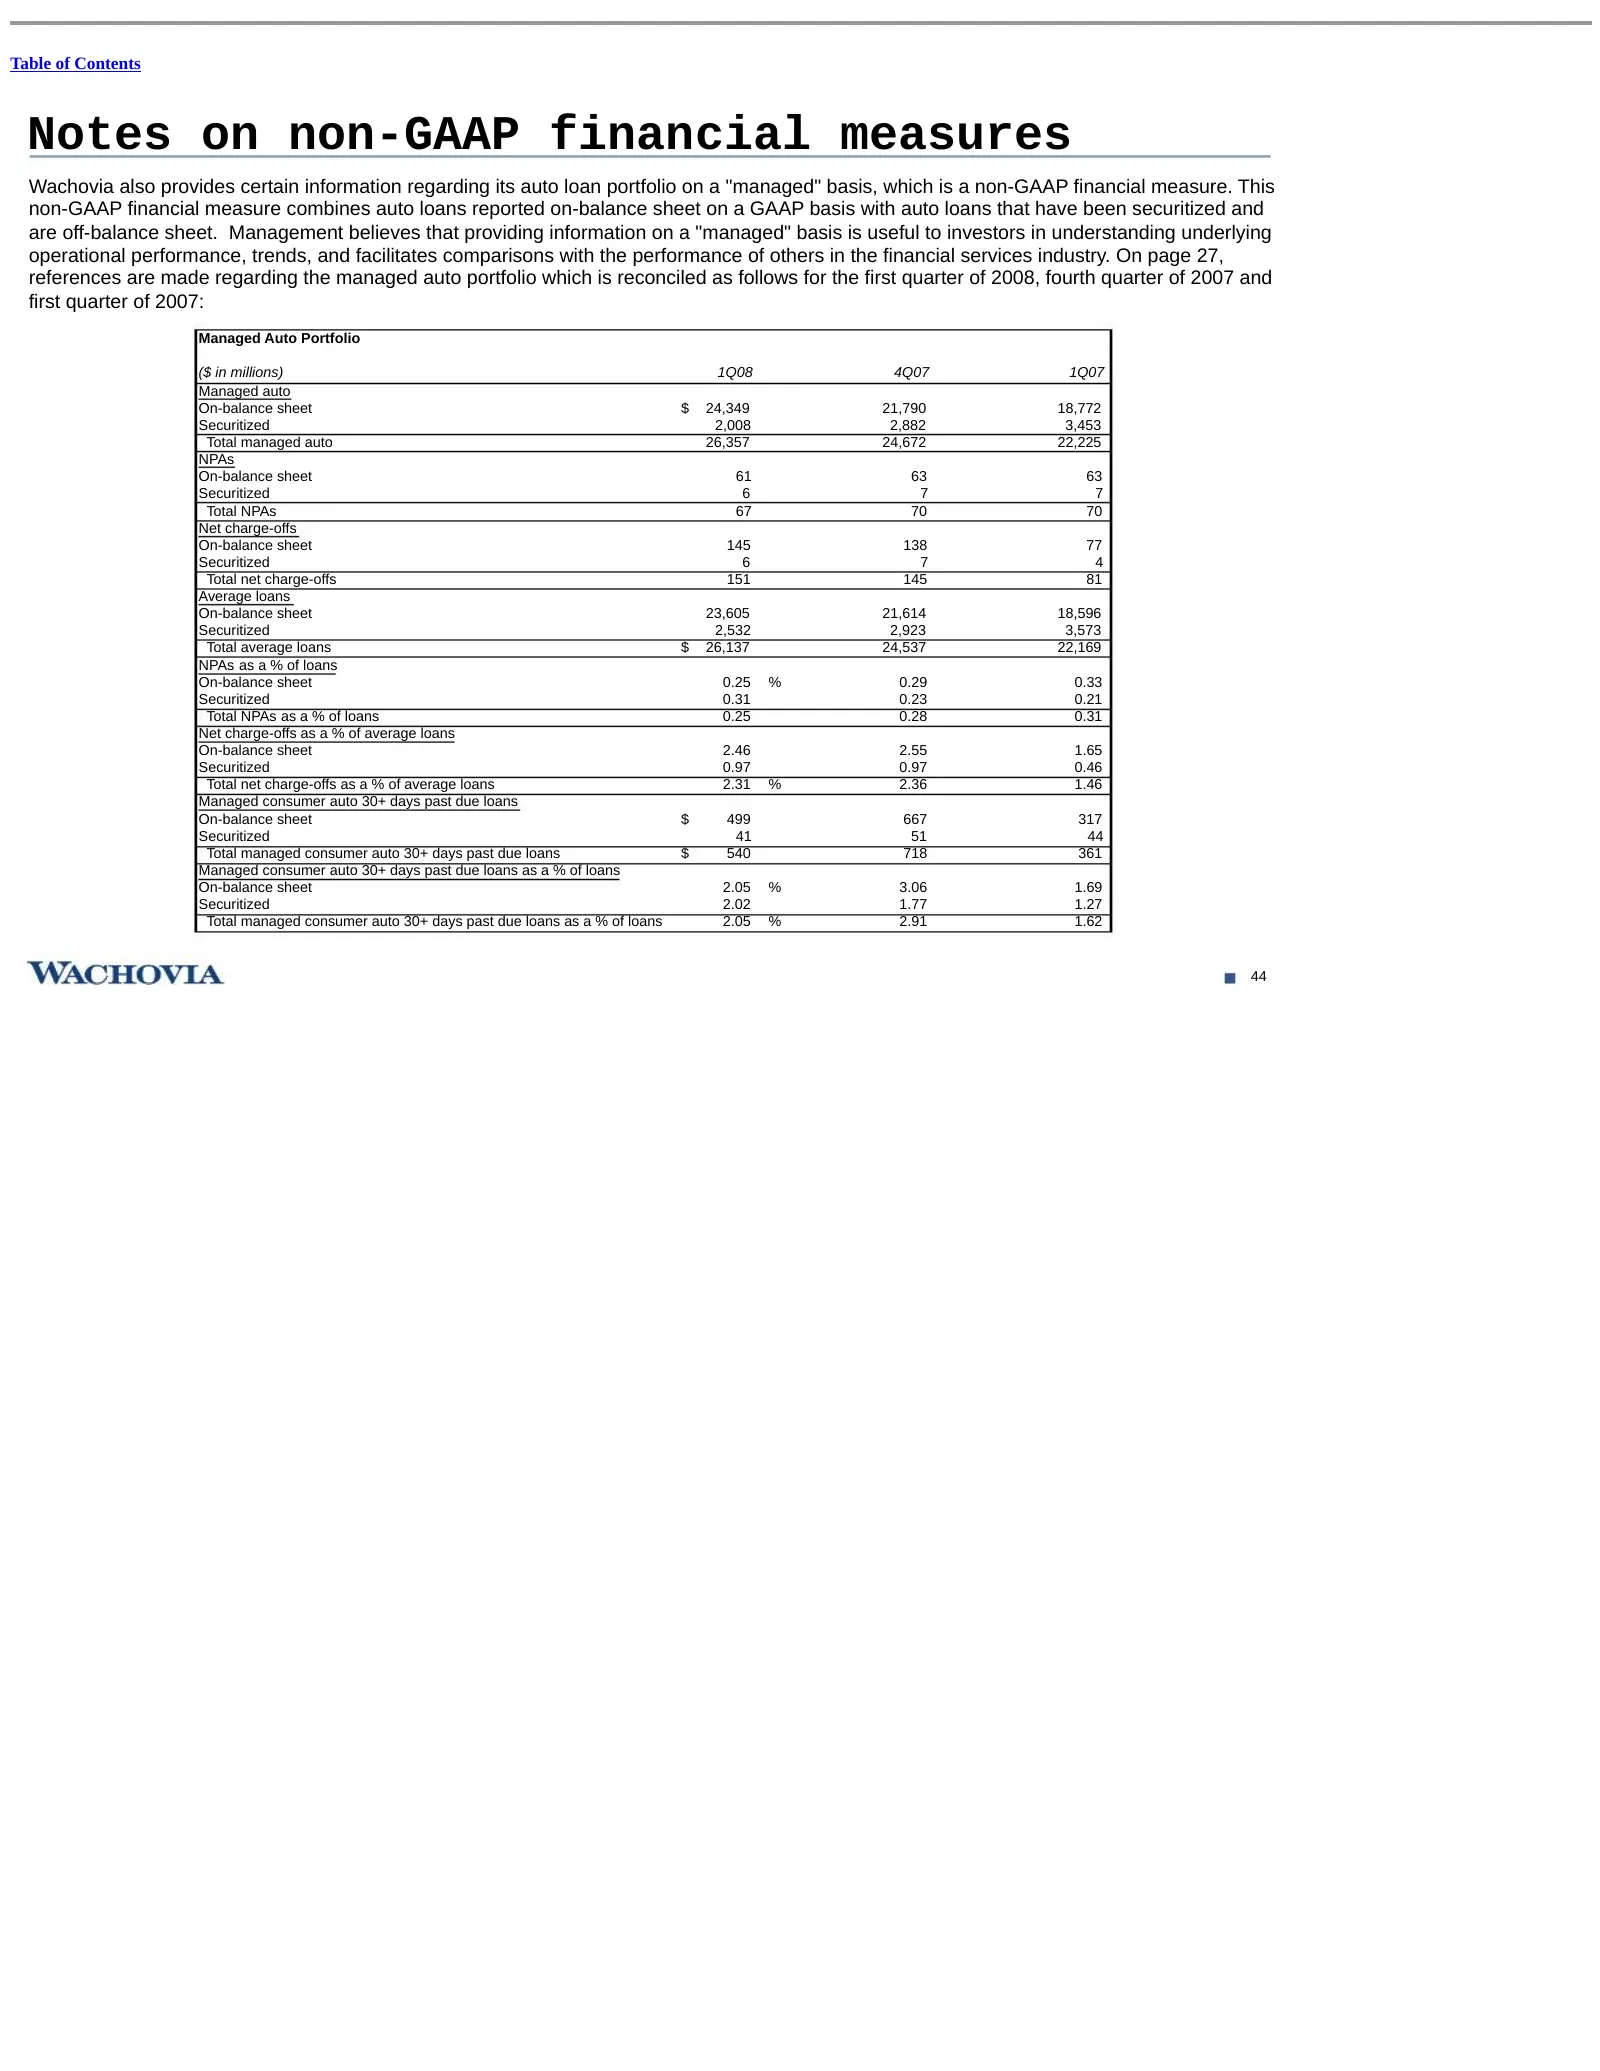
Table of Contents Notes on non-GAAP financial measures Wachovia also provides certain information regarding its auto loan portfolio on a "managed" basis, which is a non-GAAP financial measure. This non-GAAP financial measure combines auto loans reported on-balance sheet on a GAAP basis with auto loa
Slide 68: Wachovia First Quarter 2008 Quarterly Earnings Report
Table of Contents WACHOVIA FIRST QUARTER 2008 QUARTERLY EARNINGS REPORT APRIL 14, 2008 TABLE OF CONTENTS Earnings Summary 1 Other Financial Measures 3 Fee and Other Income 4 Noninterest Expense 6 Balance Sheet 7 Asset Quality 10 Summary Operating Results 15 General Bank 17 Wealth Management 20 Corpo
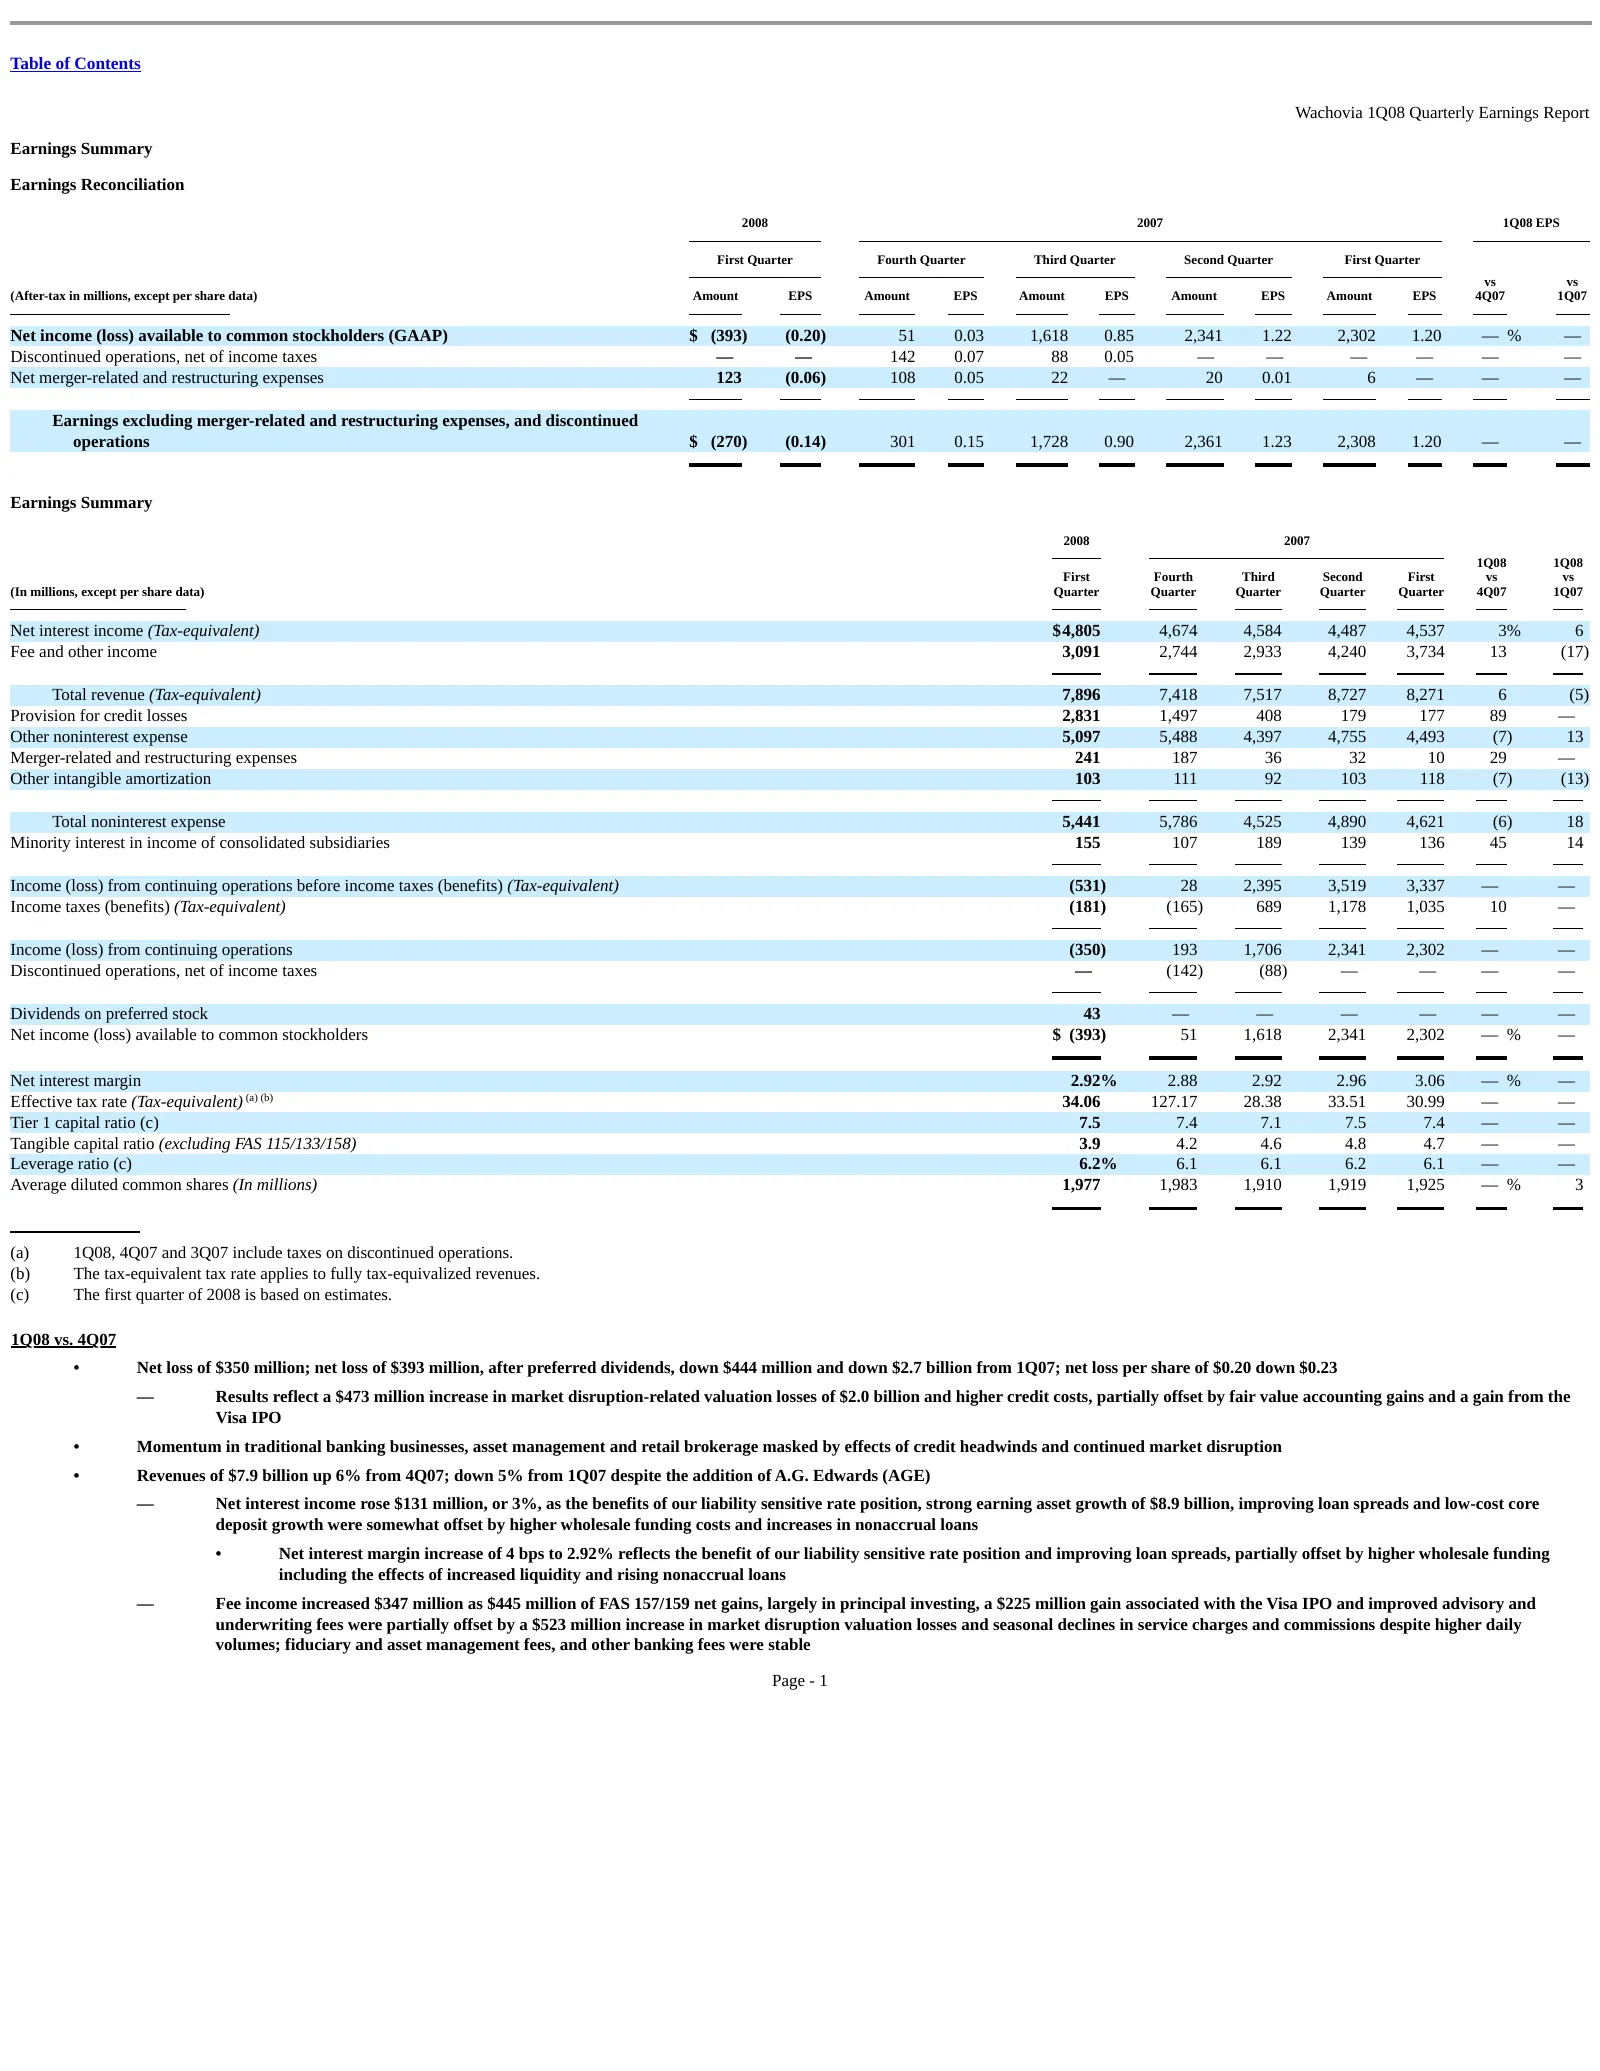
Slide 69: Earnings Summary
Table of Contents Wachovia 1Q08 Quarterly Earnings Report Earnings Summary Earnings Reconciliation 2008 2007 1Q08 EPS First Quarter Fourth Quarter Third Quarter Second Quarter First Quarter vs vs (After-tax in millions, except per share data) Amount EPS Amount EPS Amount EPS Amount EPS Amount EPS 4Q

Slide 70: Earnings Summary key points
Table of Contents Wachovia 1Q08 Quarterly Earnings Report • Other noninterest expense decreased $391 million, or 7%, largely reflecting lower salaries and benefits expense, despite $109 million in retirement-eligible employee stock compensation expense, as well as lower sundry expense; 1Q08 results
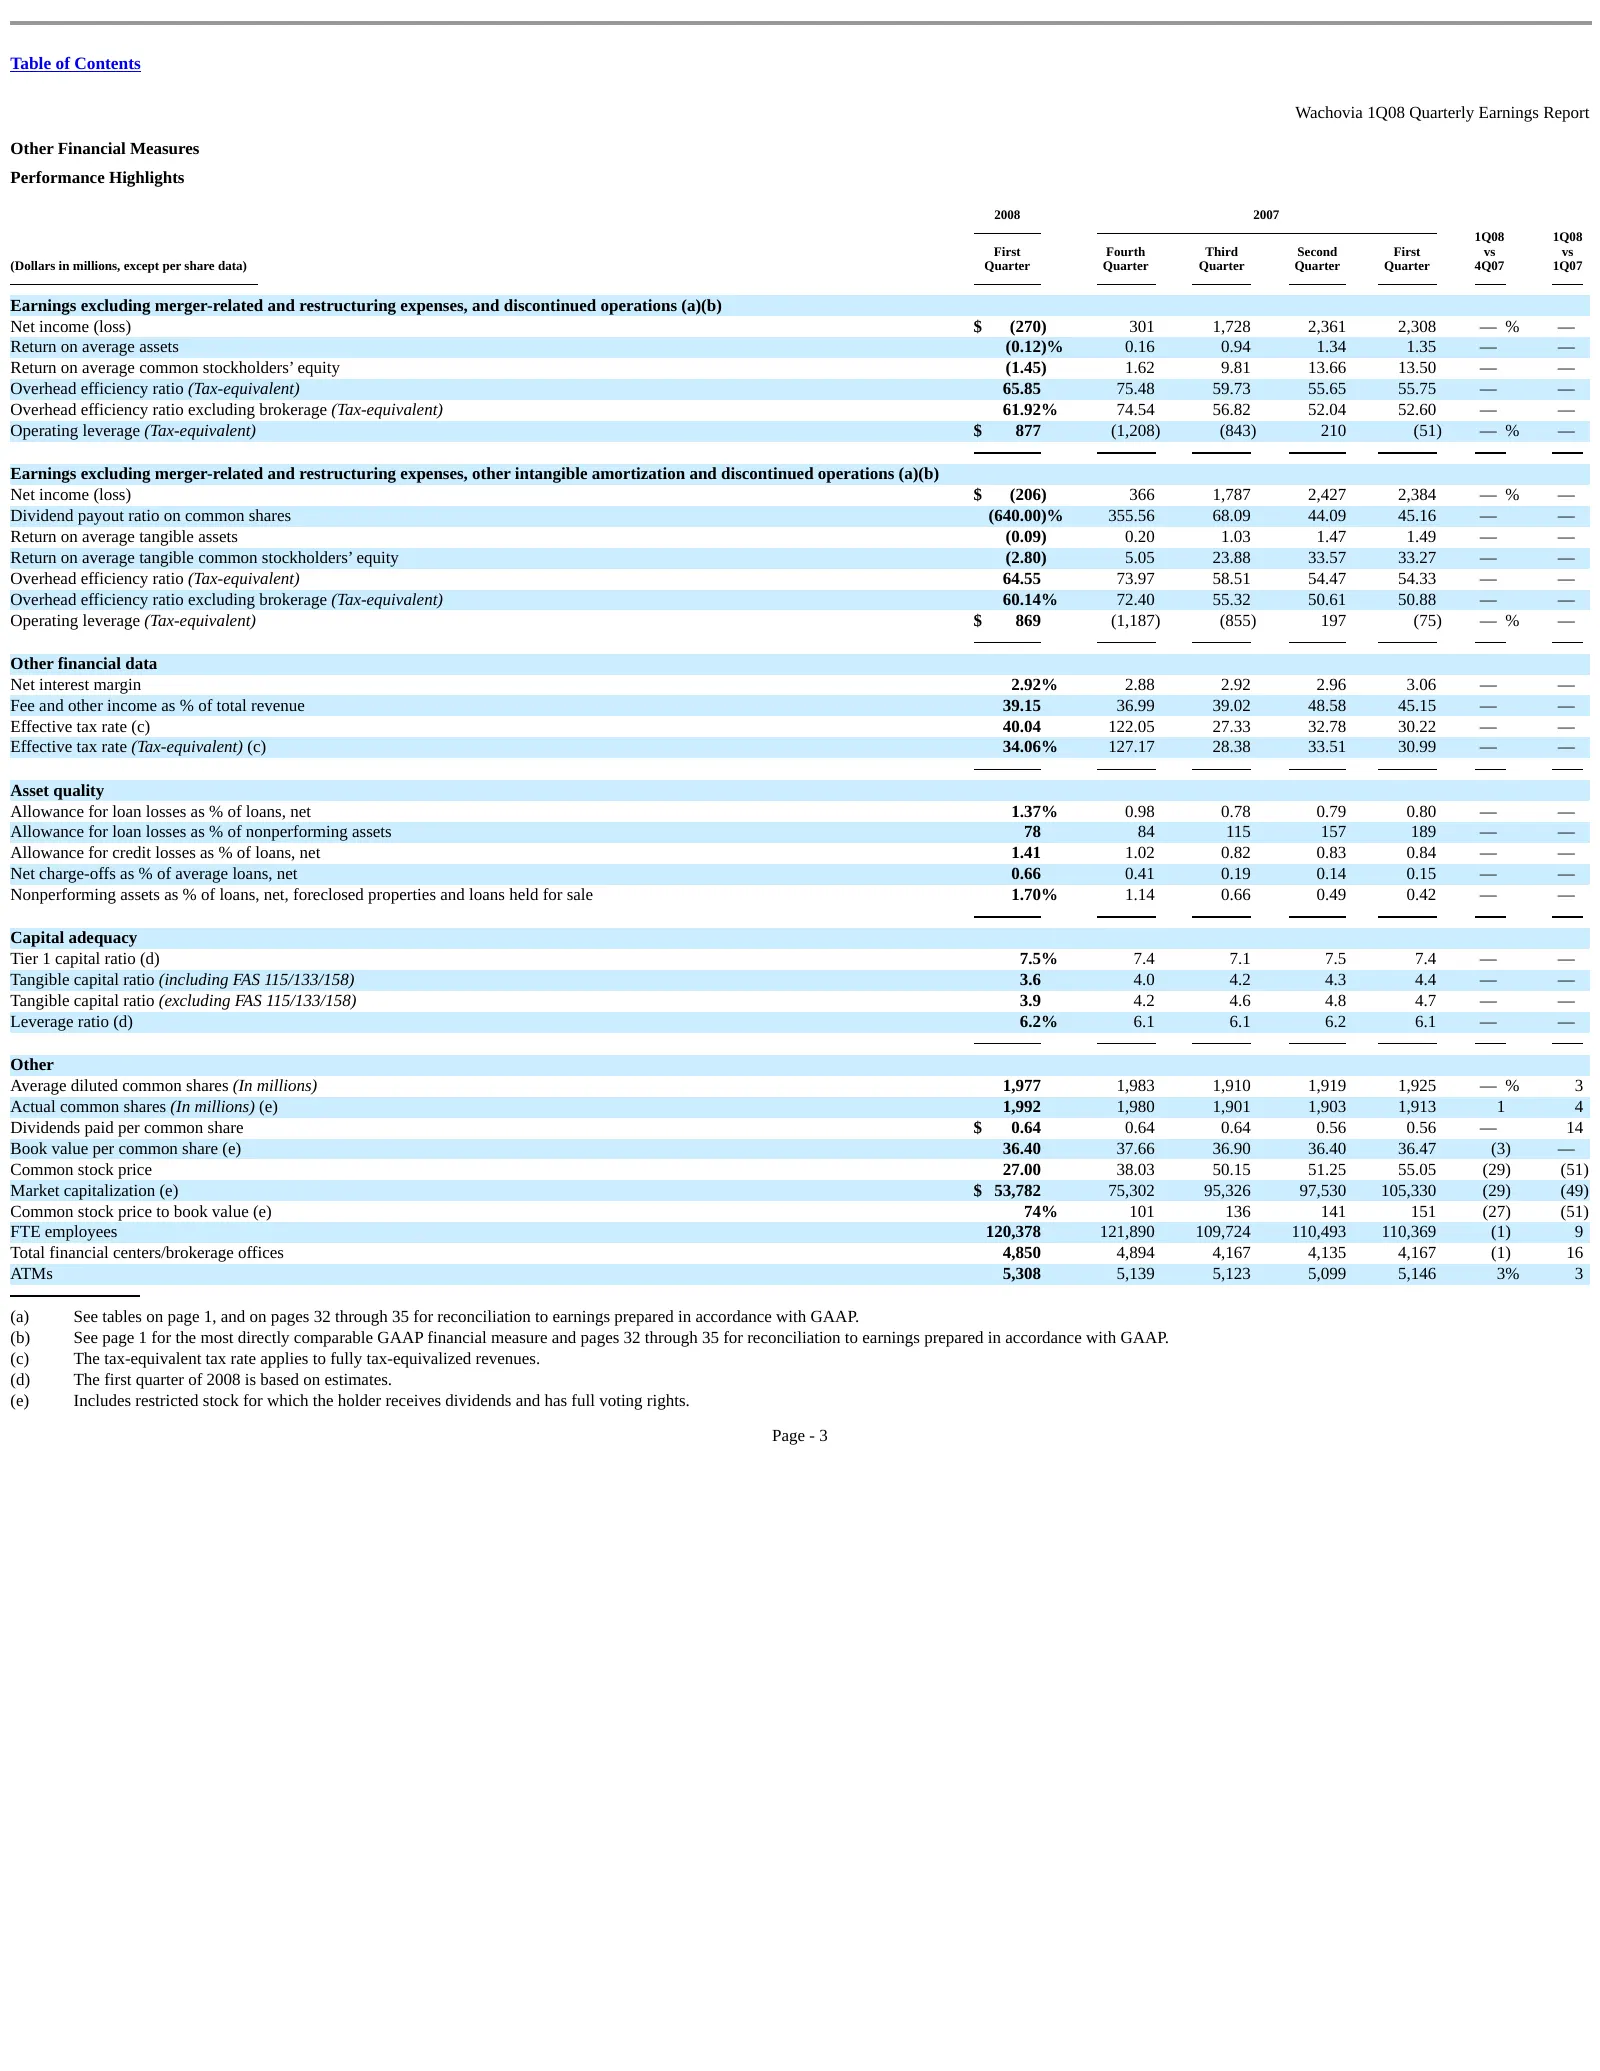
Slide 71: Other Financial Measures
Table of Contents Wachovia 1Q08 Quarterly Earnings Report Other Financial Measures Performance Highlights 2008 2007 1Q08 1Q08 First Fourth Third Second First vs vs (Dollars in millions, except per share data) Quarter Quarter Quarter Quarter Quarter 4Q07 1Q07 Earnings excluding merger-related and res
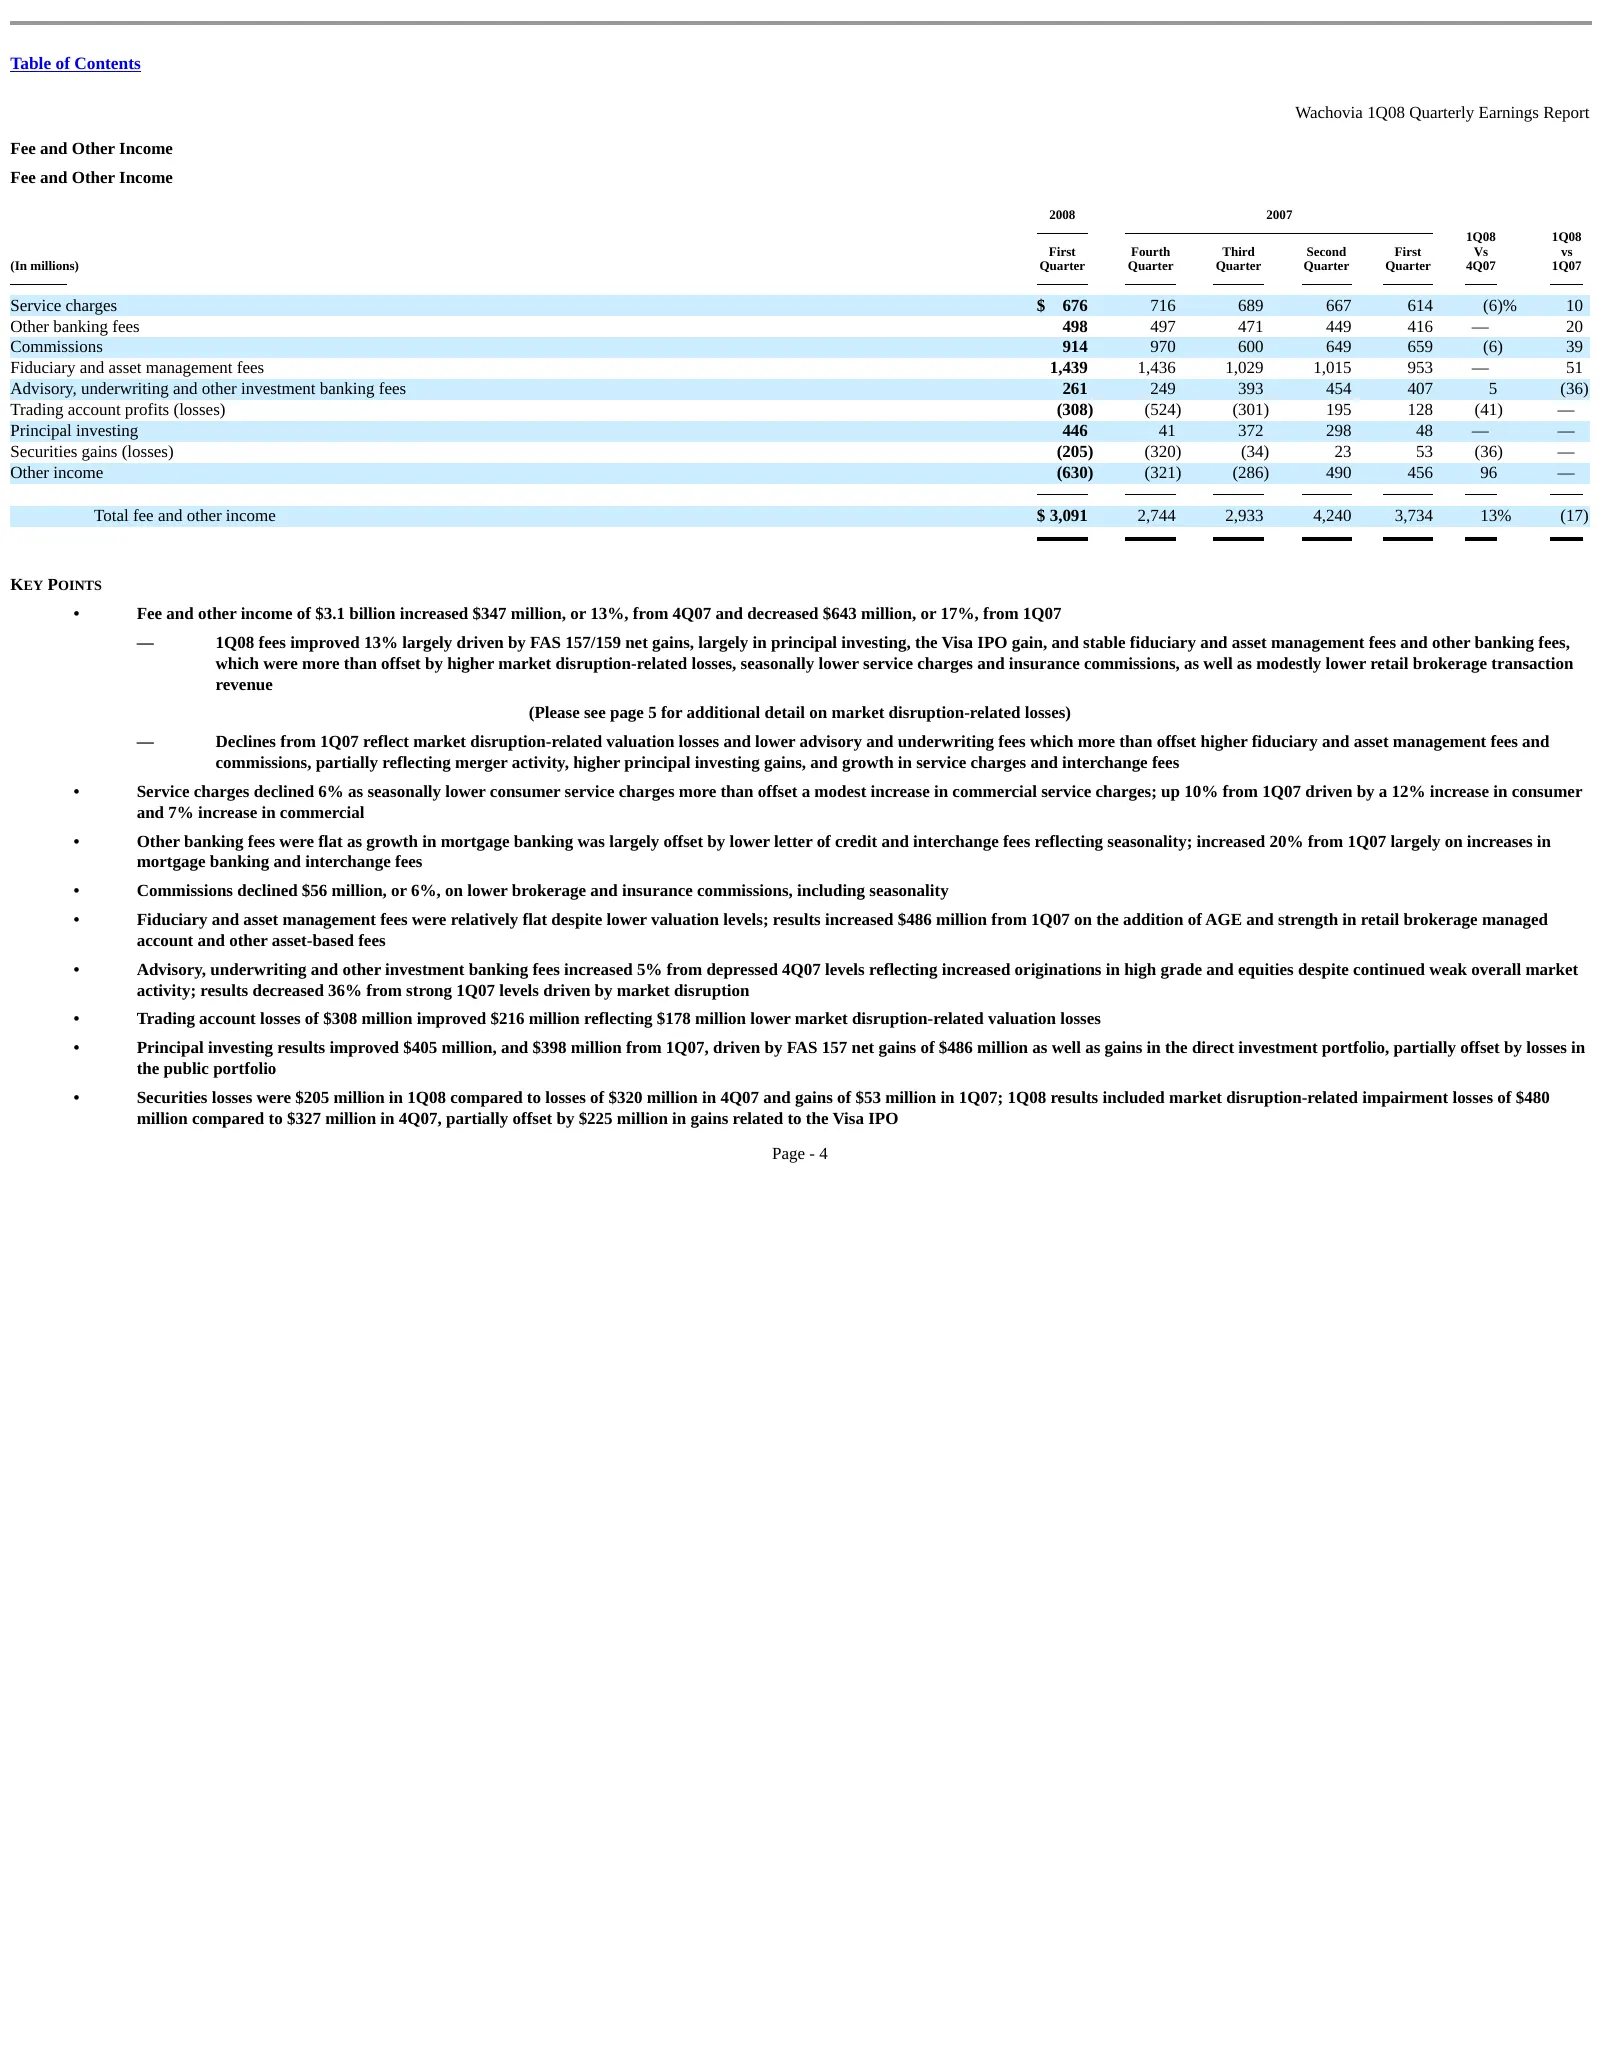
Slide 72: Fee and Other Income
Table of Contents Wachovia 1Q08 Quarterly Earnings Report Fee and Other Income Fee and Other Income 2008 2007 1Q08 1Q08 First Fourth Third Second First Vs vs (In millions) Quarter Quarter Quarter Quarter Quarter 4Q07 1Q07 Service charges $ 676 716 689 667 614 (6)% 10 Other banking fees 498 497 471 4
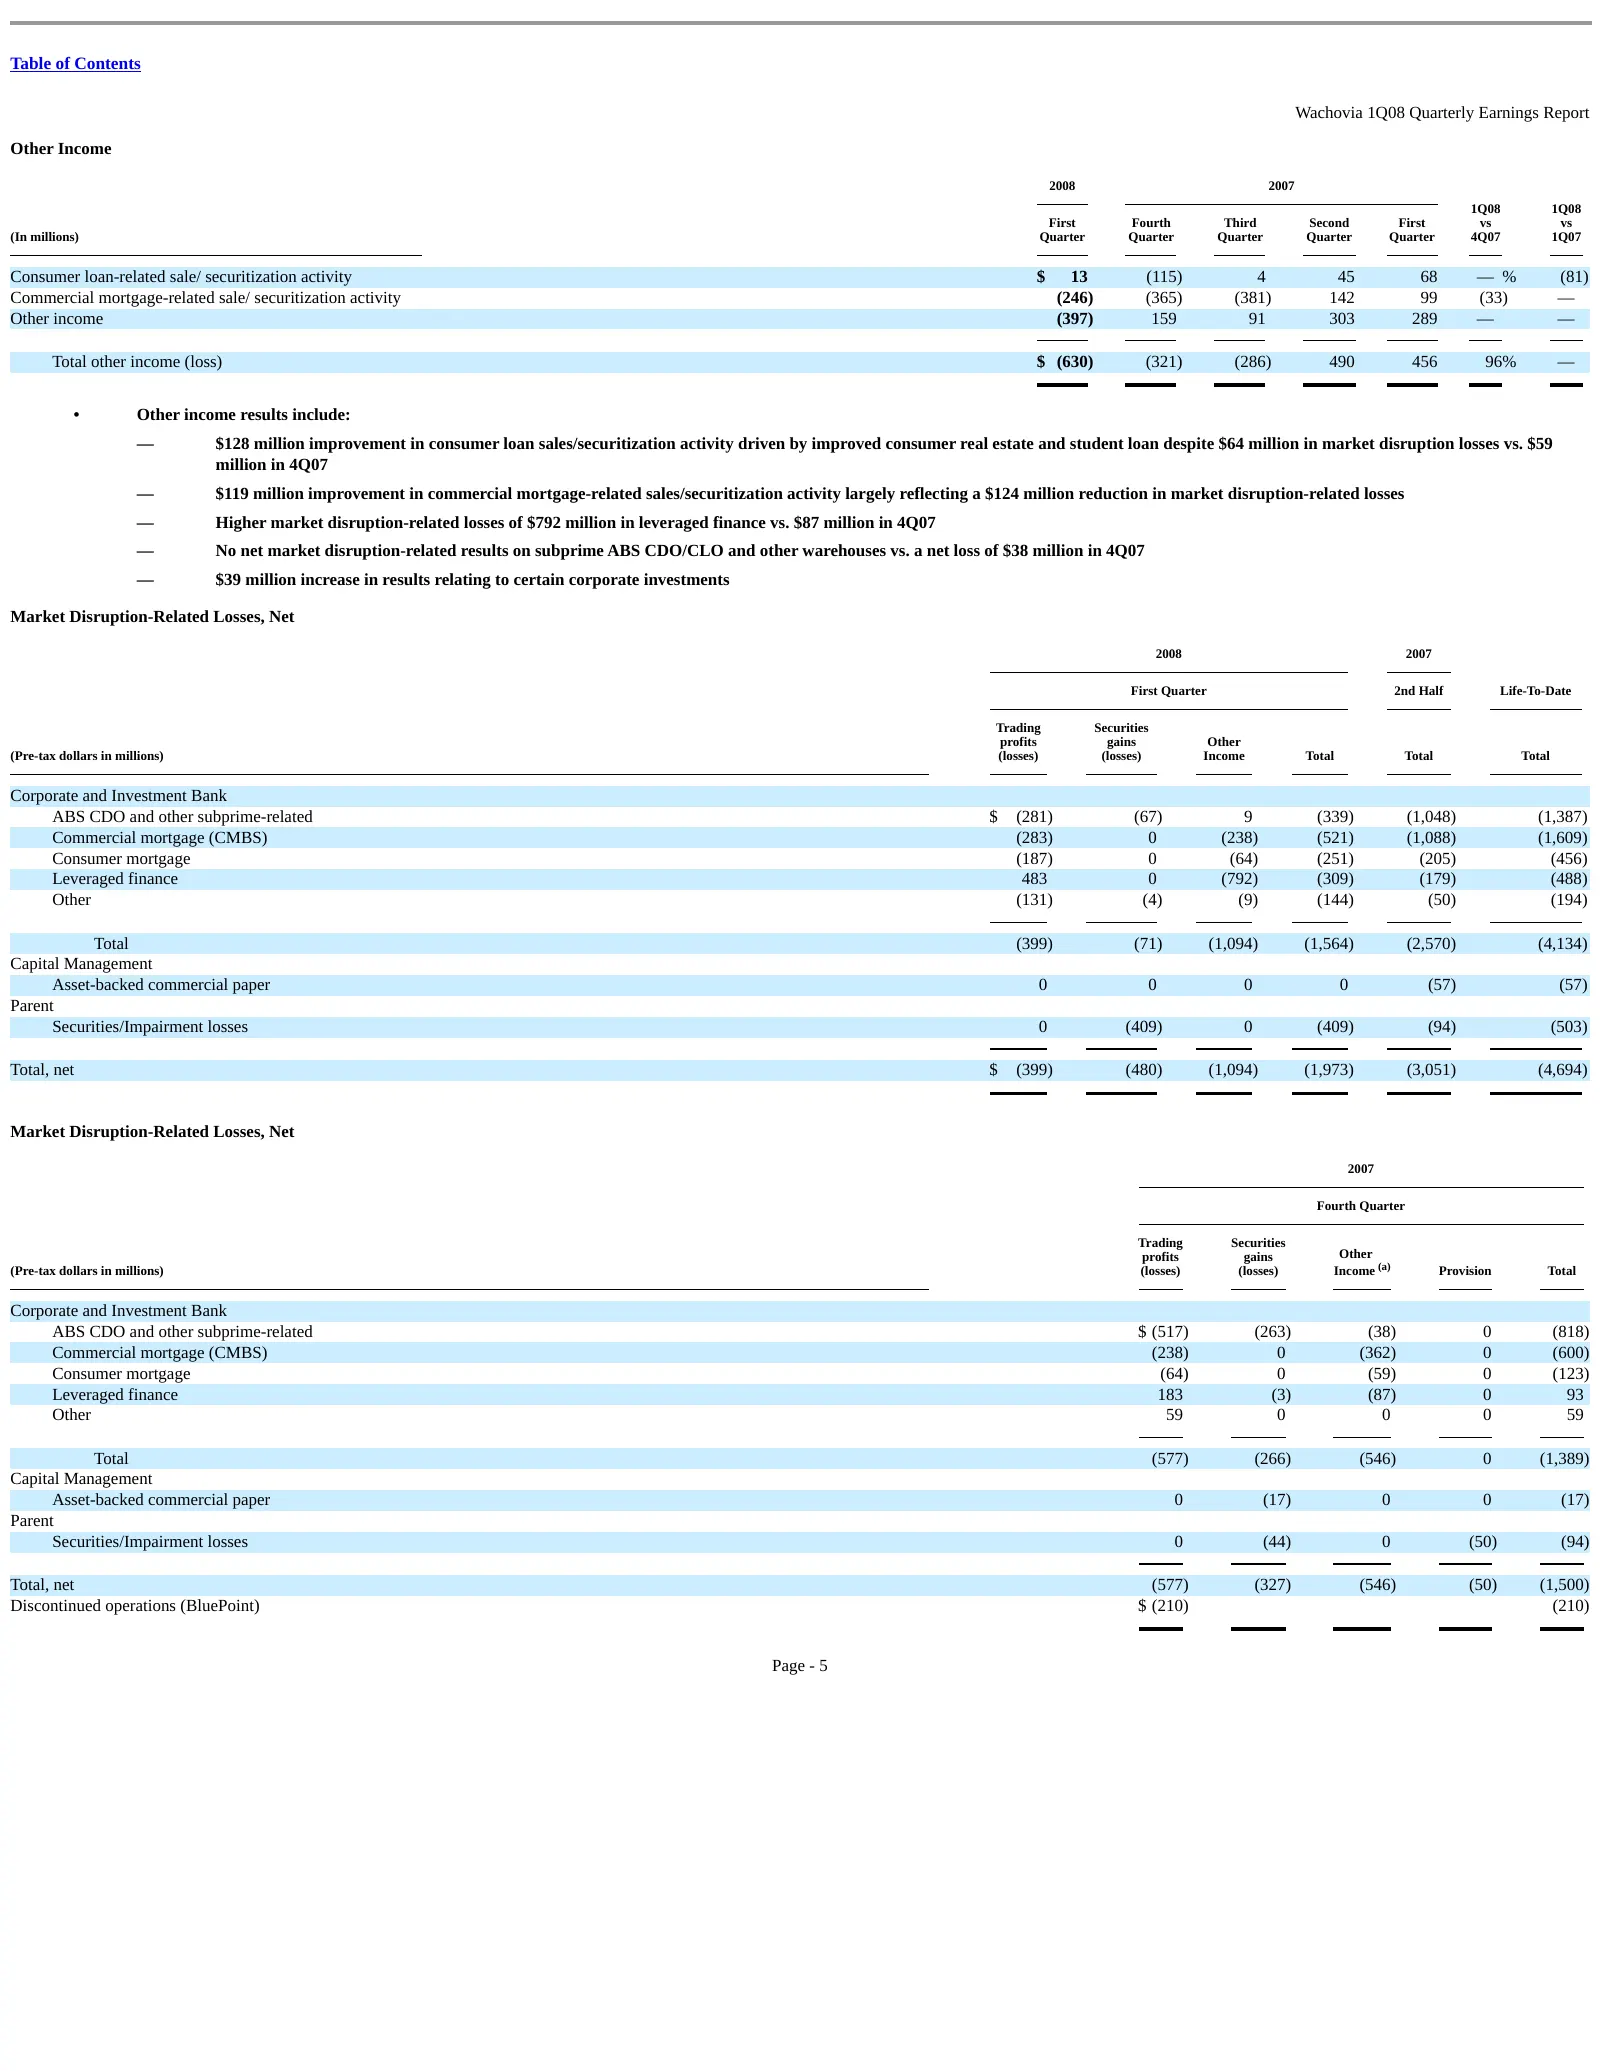
Slide 73: Other Income
Table of Contents Wachovia 1Q08 Quarterly Earnings Report Other Income 2008 2007 1Q08 1Q08 First Fourth Third Second First vs vs (In millions) Quarter Quarter Quarter Quarter Quarter 4Q07 1Q07 Consumer loan-related sale/ securitization activity $ 13 (115) 4 45 68 — % (81) Commercial mortgage-related
Slide 74: Noninterest Expense
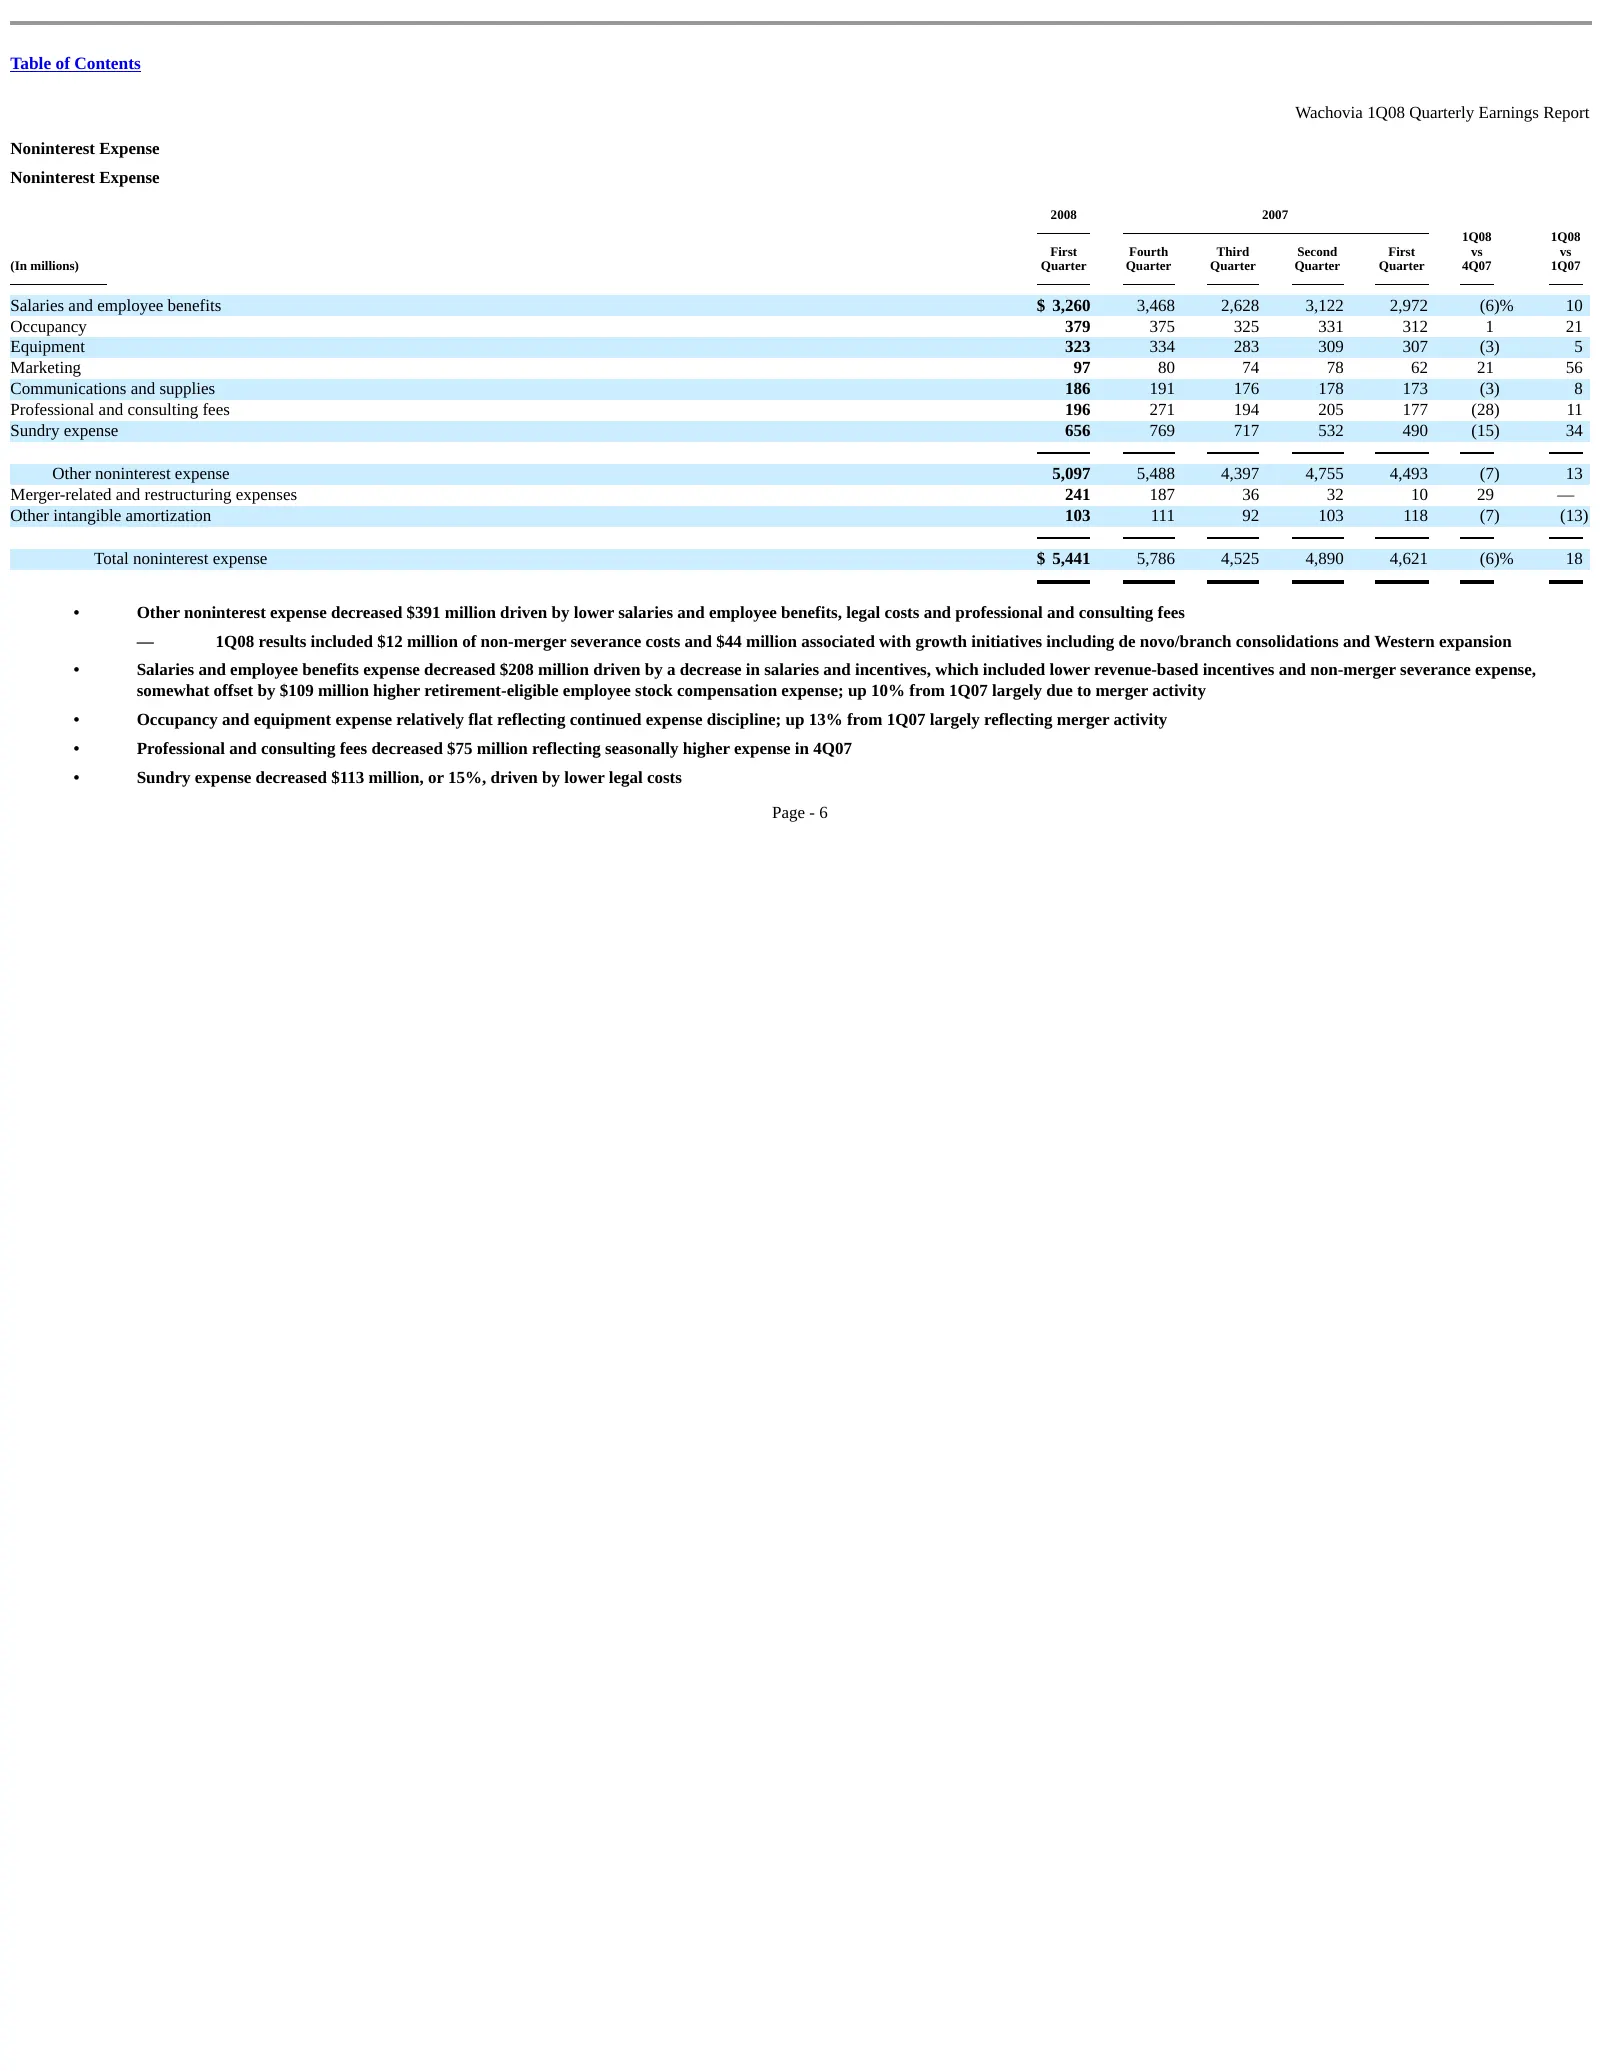
Table of Contents Wachovia 1Q08 Quarterly Earnings Report Noninterest Expense Noninterest Expense 2008 2007 1Q08 1Q08 First Fourth Third Second First vs vs (In millions) Quarter Quarter Quarter Quarter Quarter 4Q07 1Q07 Salaries and employee benefits $ 3,260 3,468 2,628 3,122 2,972 (6)% 10 Occupancy
Slide 75: Balance Sheet
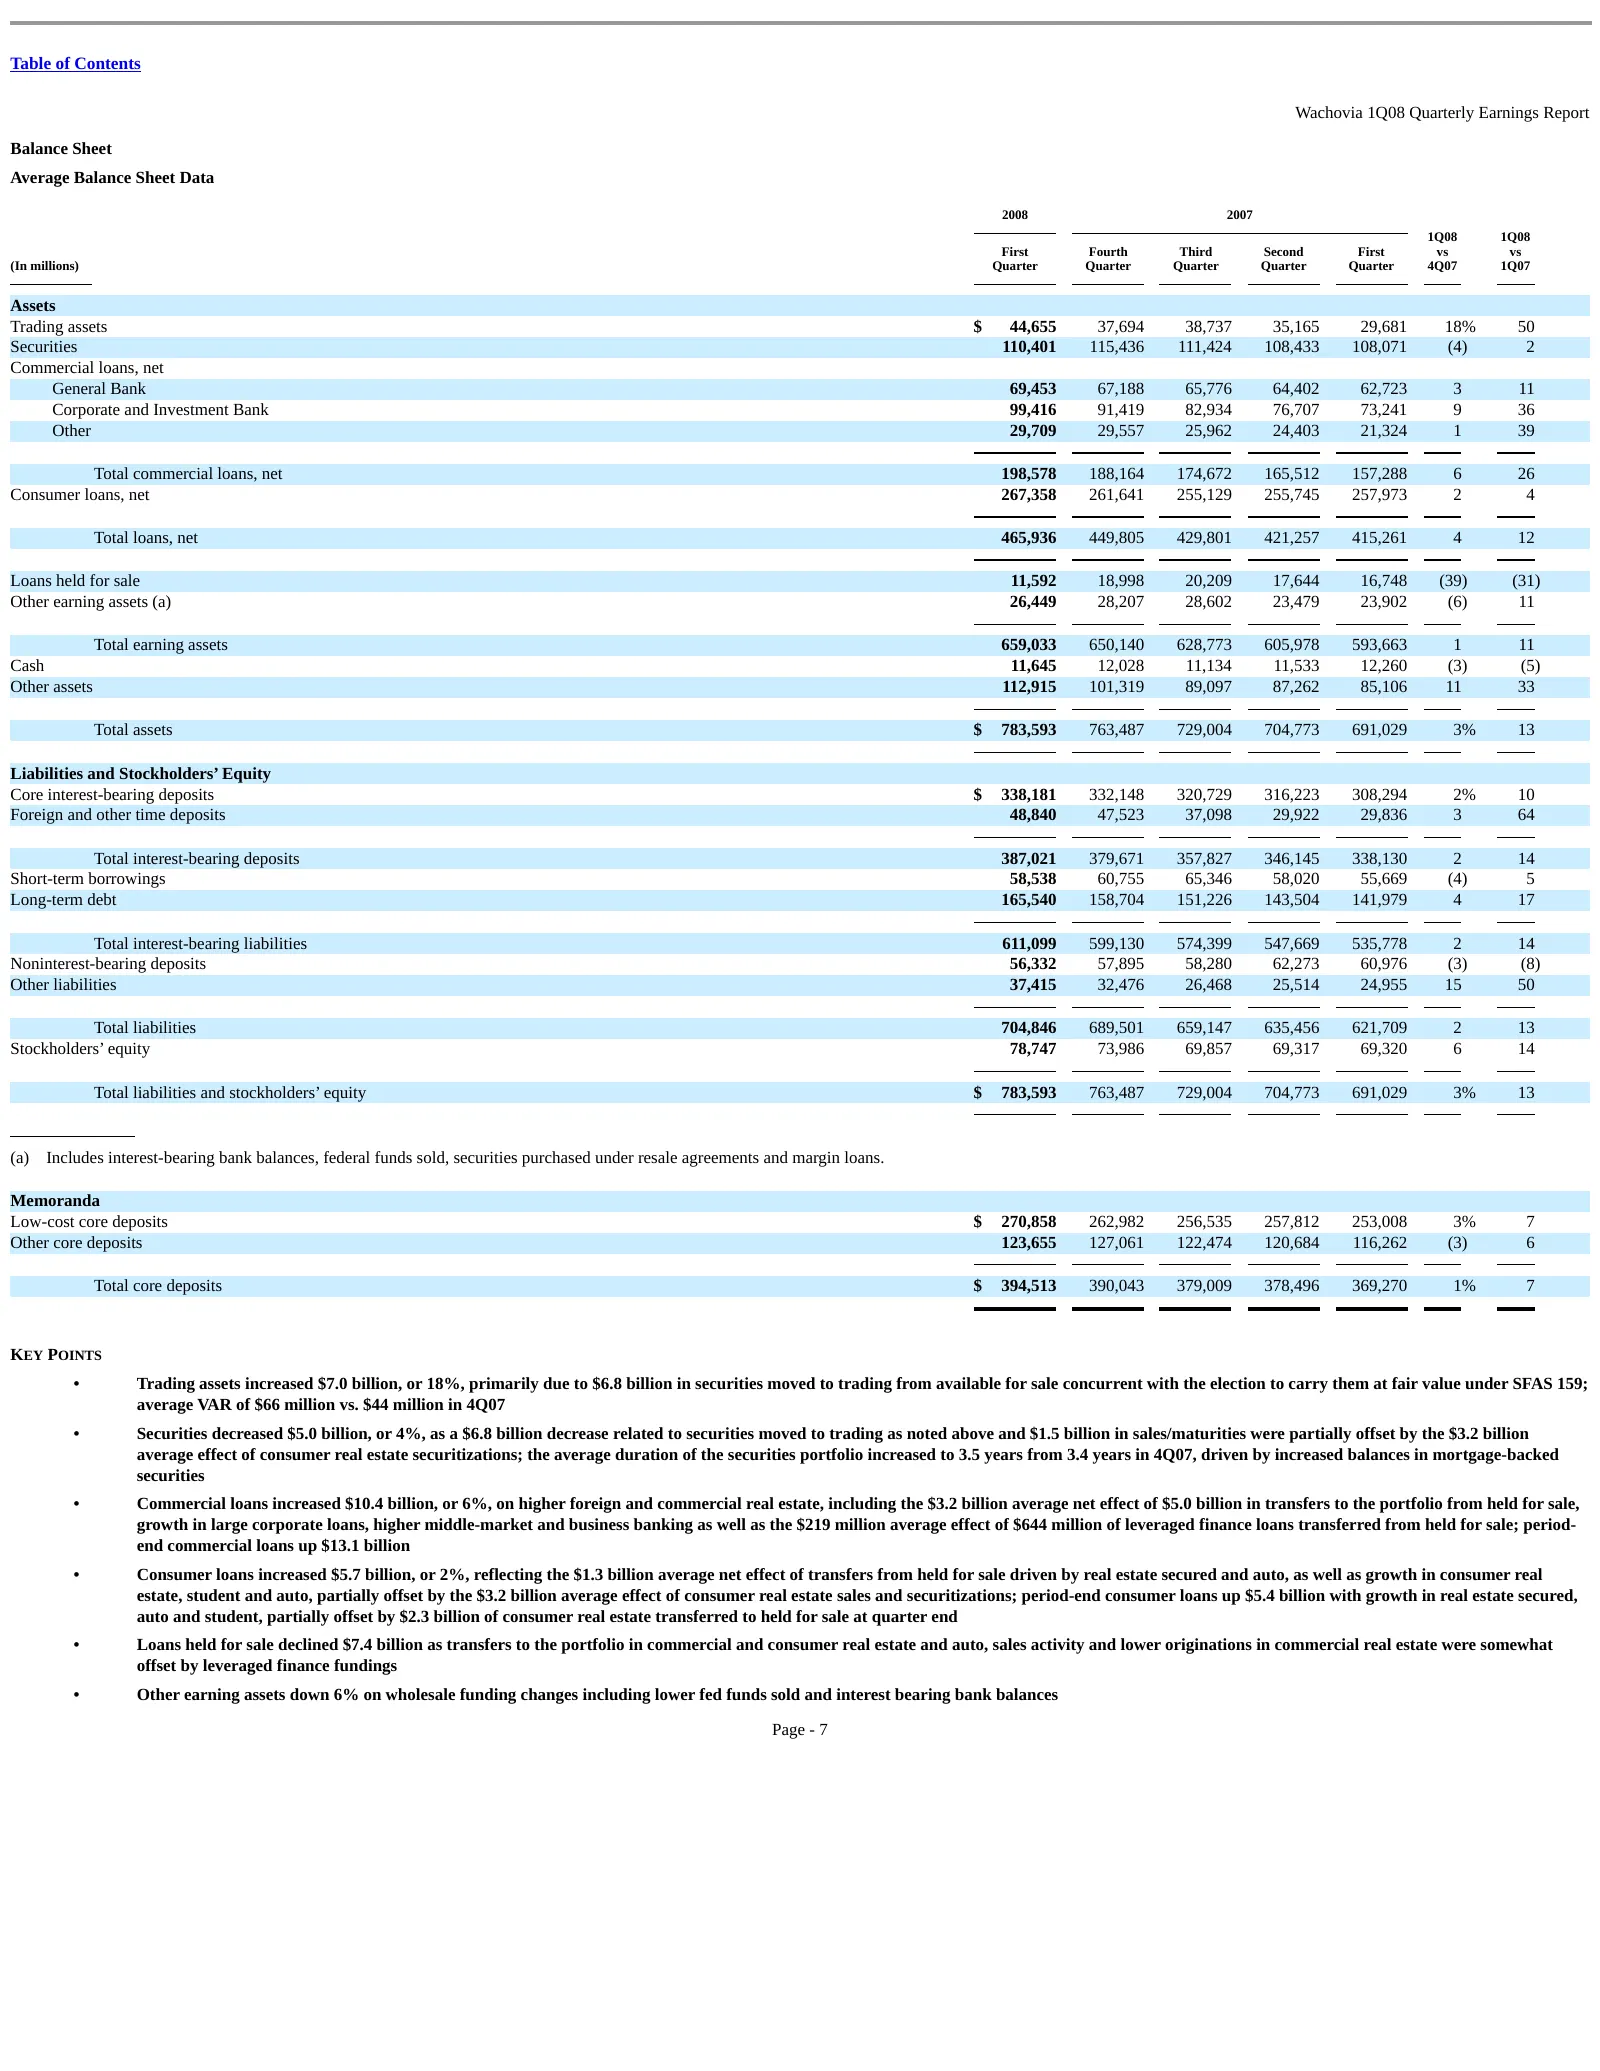
Table of Contents Wachovia 1Q08 Quarterly Earnings Report Balance Sheet Average Balance Sheet Data 2008 2007 1Q08 1Q08 First Fourth Third Second First vs vs (In millions) Quarter Quarter Quarter Quarter Quarter 4Q07 1Q07 Assets Trading assets $ 44,655 37,694 38,737 35,165 29,681 18% 50 Securities 11
Slide 76: Average earning assets and consumer loans
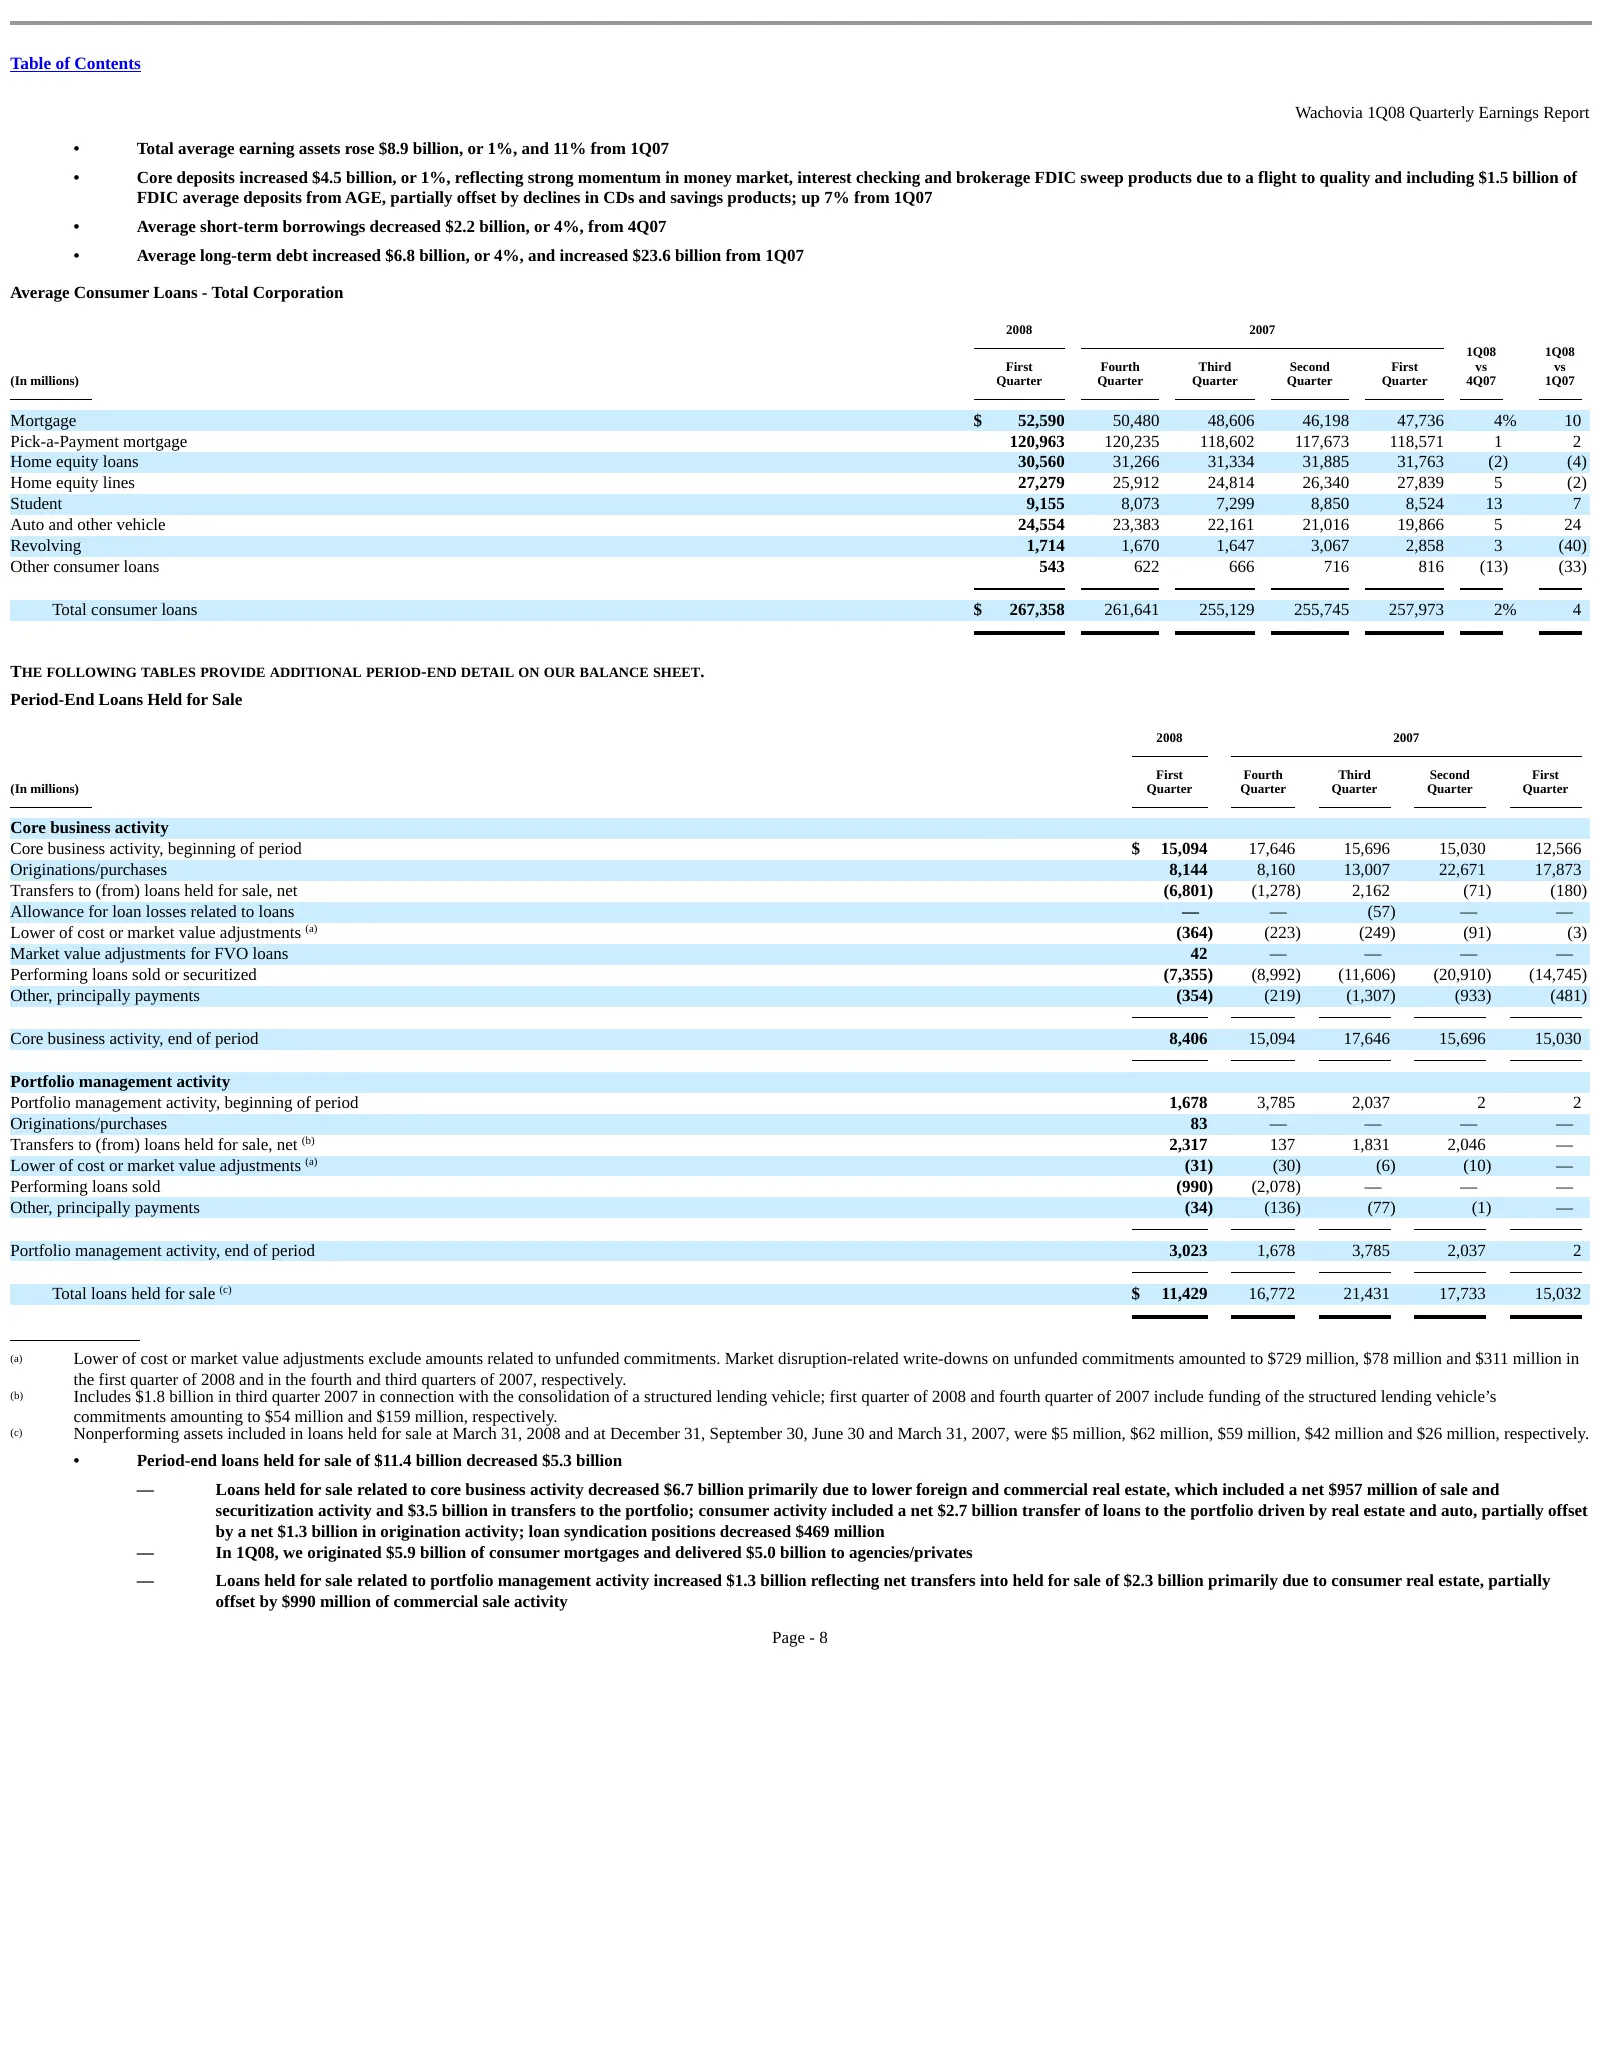
Table of Contents Wachovia 1Q08 Quarterly Earnings Report • Total average earning assets rose $8.9 billion, or 1%, and 11% from 1Q07 • Core deposits increased $4.5 billion, or 1%, reflecting strong momentum in money market, interest checking and brokerage FDIC sweep products due to a flight to quali
Slide 77: Period-End Managed Portfolio
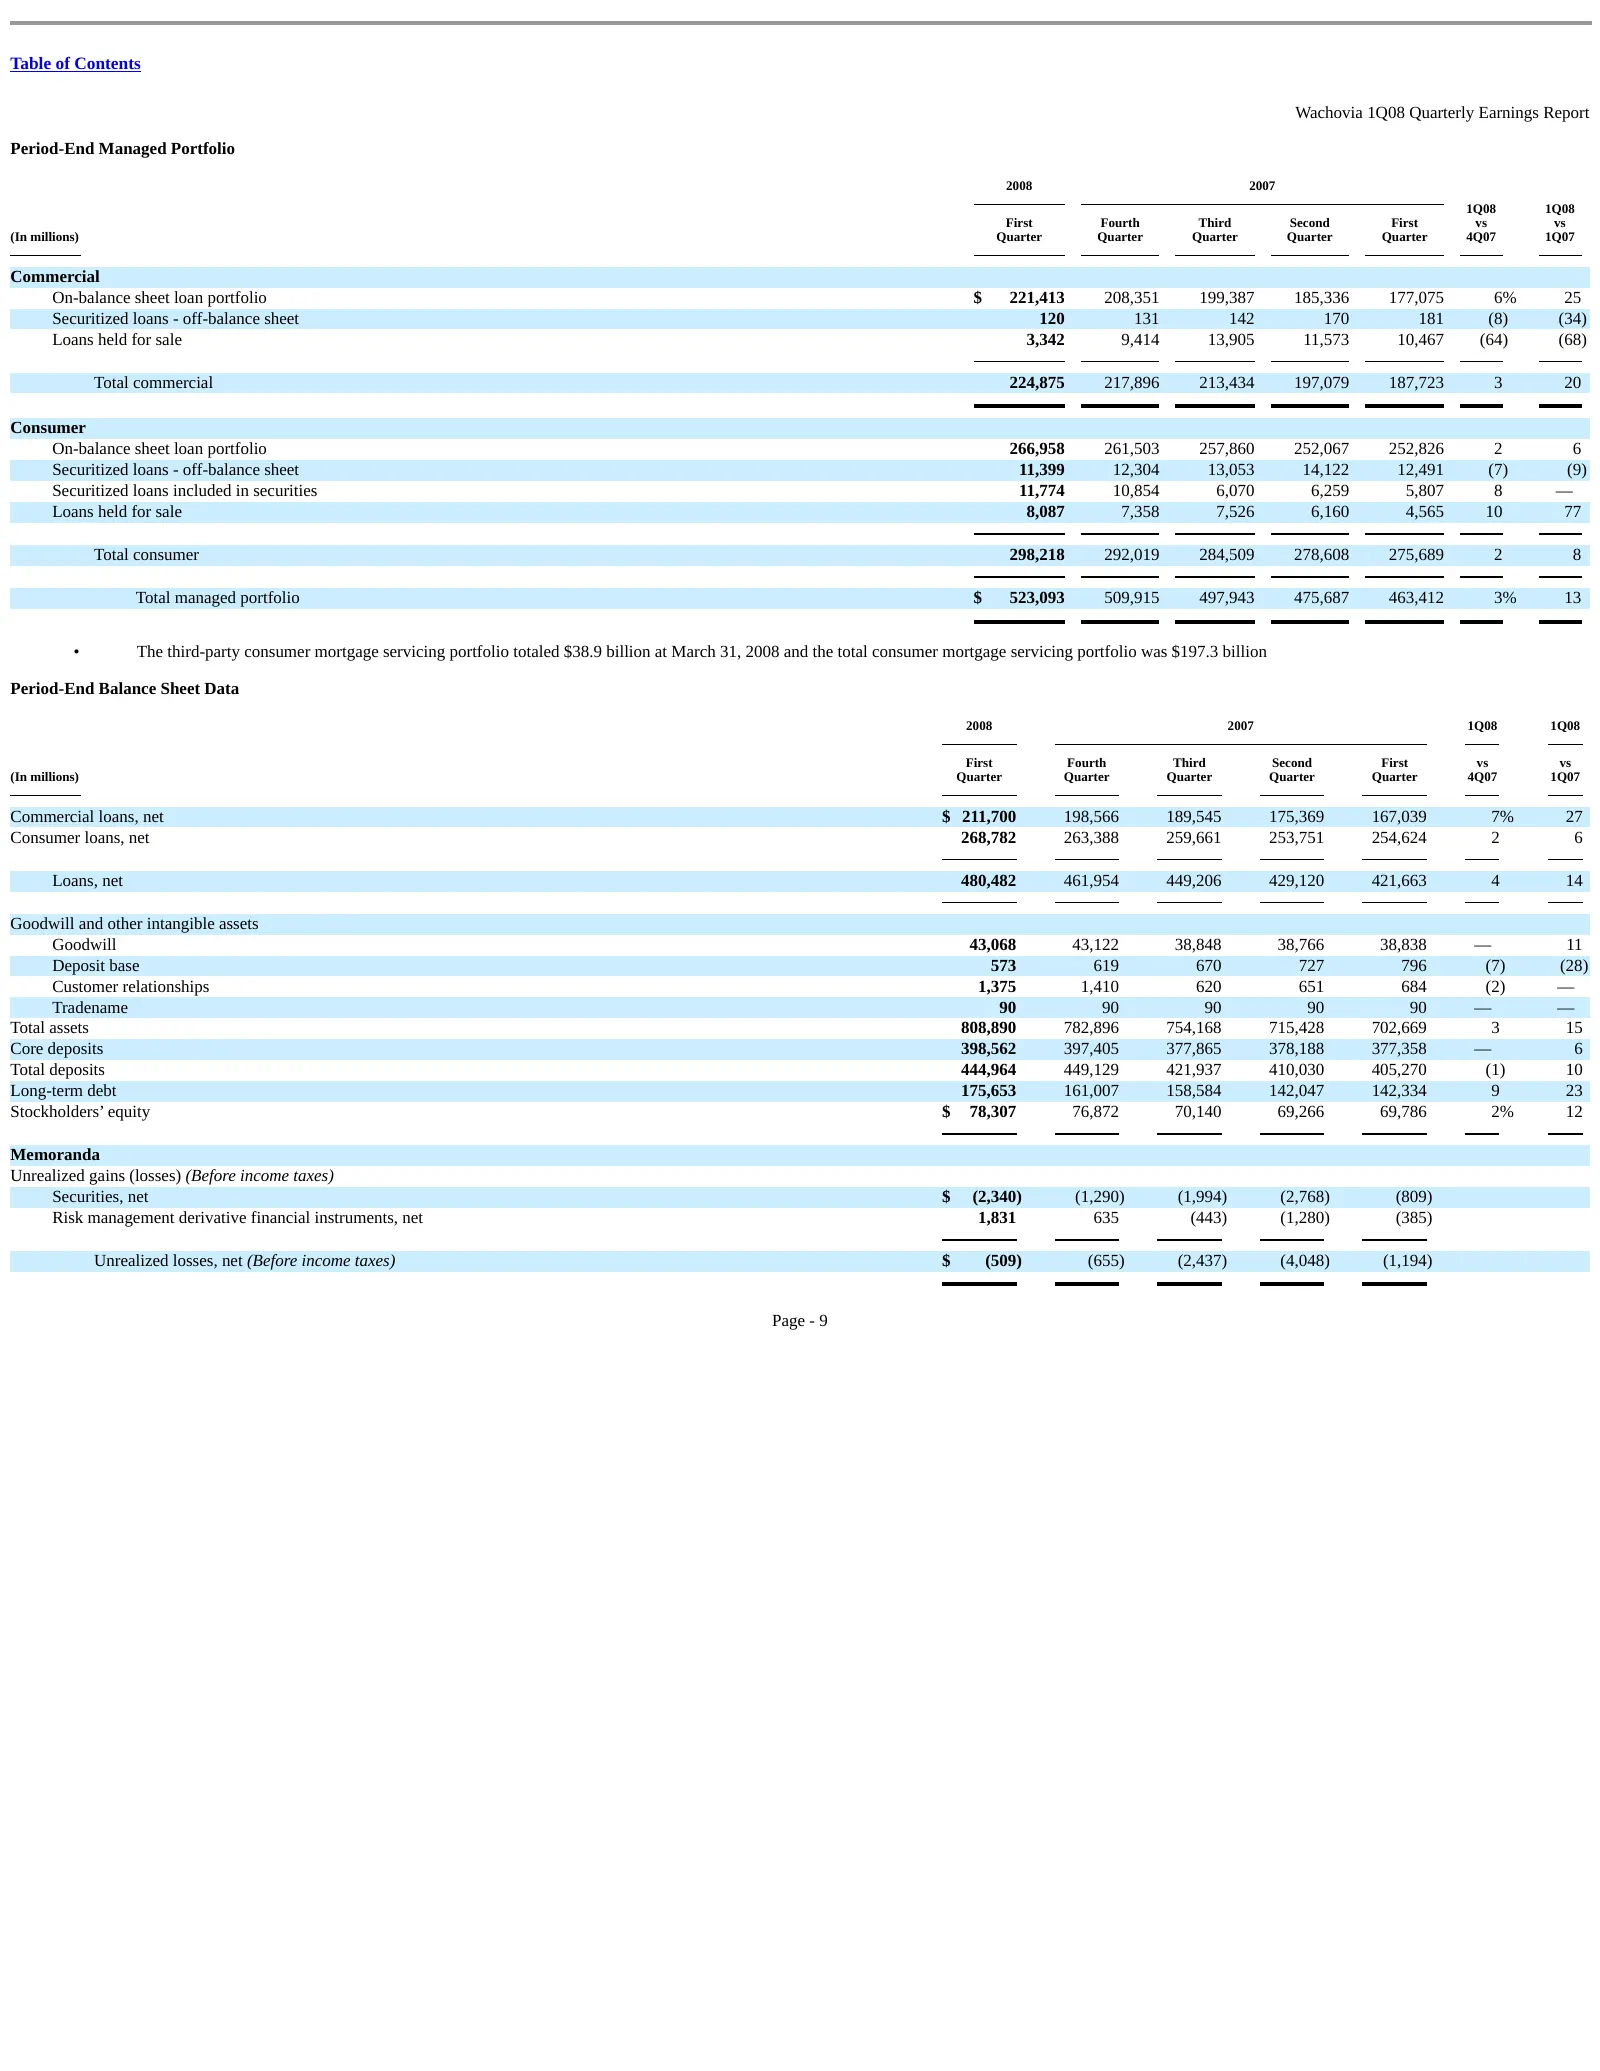
Table of Contents Wachovia 1Q08 Quarterly Earnings Report Period-End Managed Portfolio 2008 2007 1Q08 1Q08 First Fourth Third Second First vs vs (In millions) Quarter Quarter Quarter Quarter Quarter 4Q07 1Q07 Commercial On-balance sheet loan portfolio $ 221,413 208,351 199,387 185,336 177,075 6% 25
Slide 78: Asset Quality
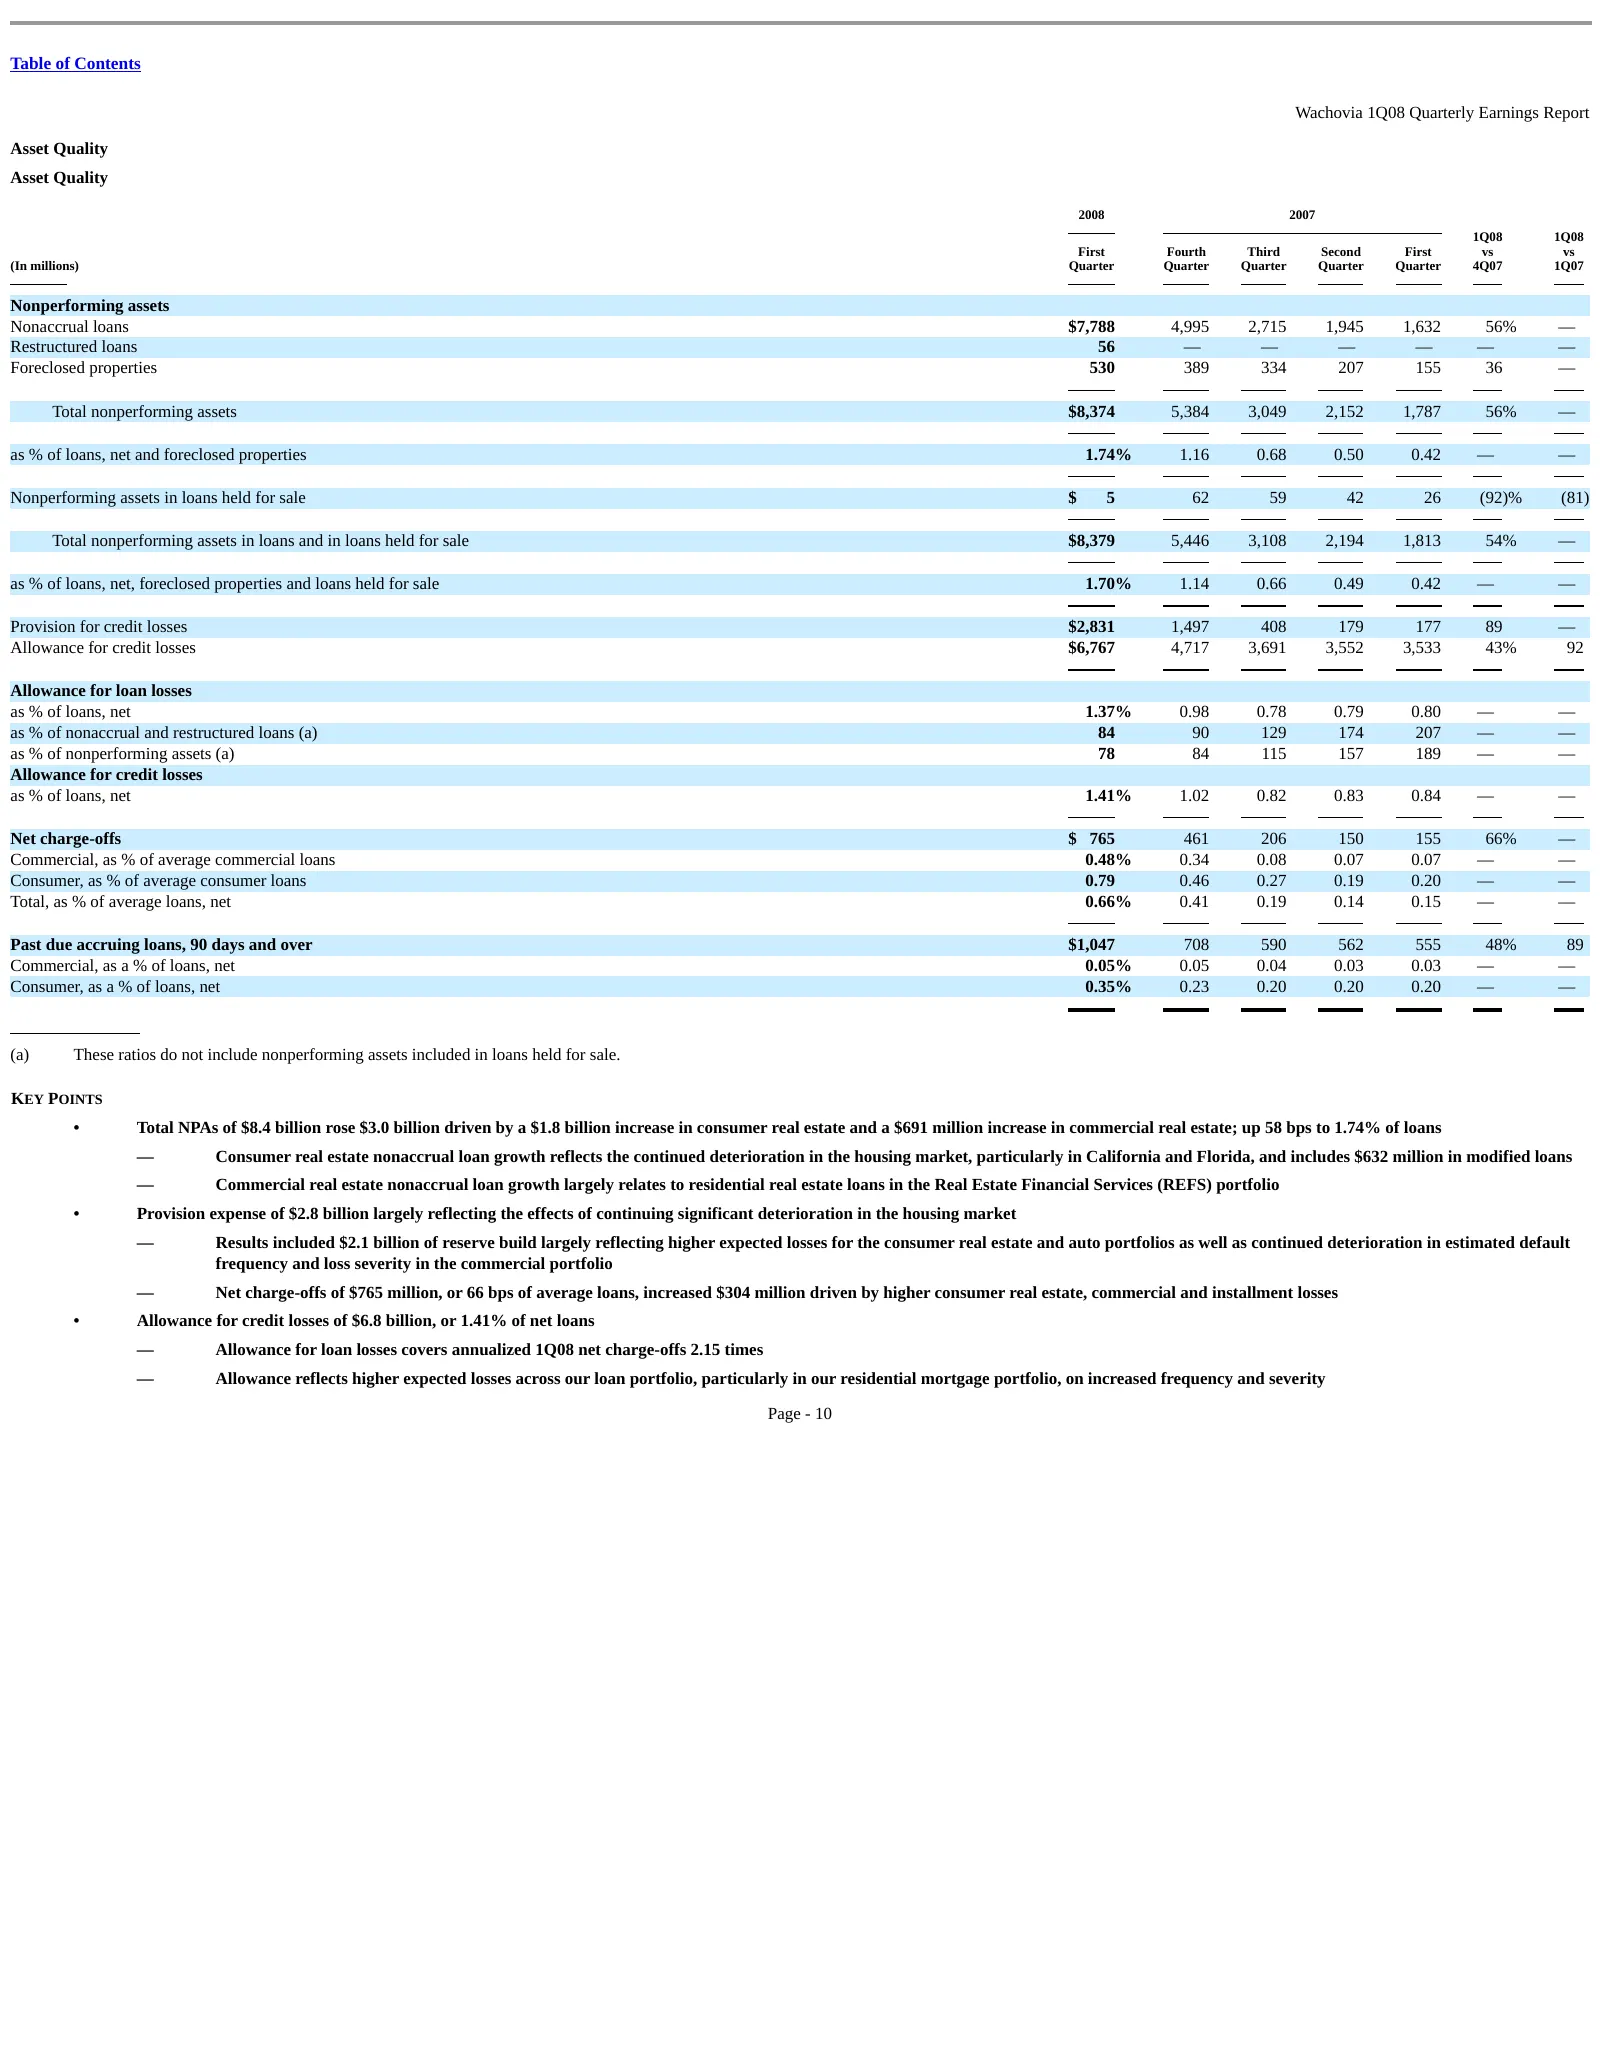
Table of Contents Wachovia 1Q08 Quarterly Earnings Report Asset Quality Asset Quality 2008 2007 1Q08 1Q08 First Fourth Third Second First vs vs (In millions) Quarter Quarter Quarter Quarter Quarter 4Q07 1Q07 Nonperforming assets Nonaccrual loans $7,788 4,995 2,715 1,945 1,632 56% — Restructured loan
Slide 79: Charge-Offs
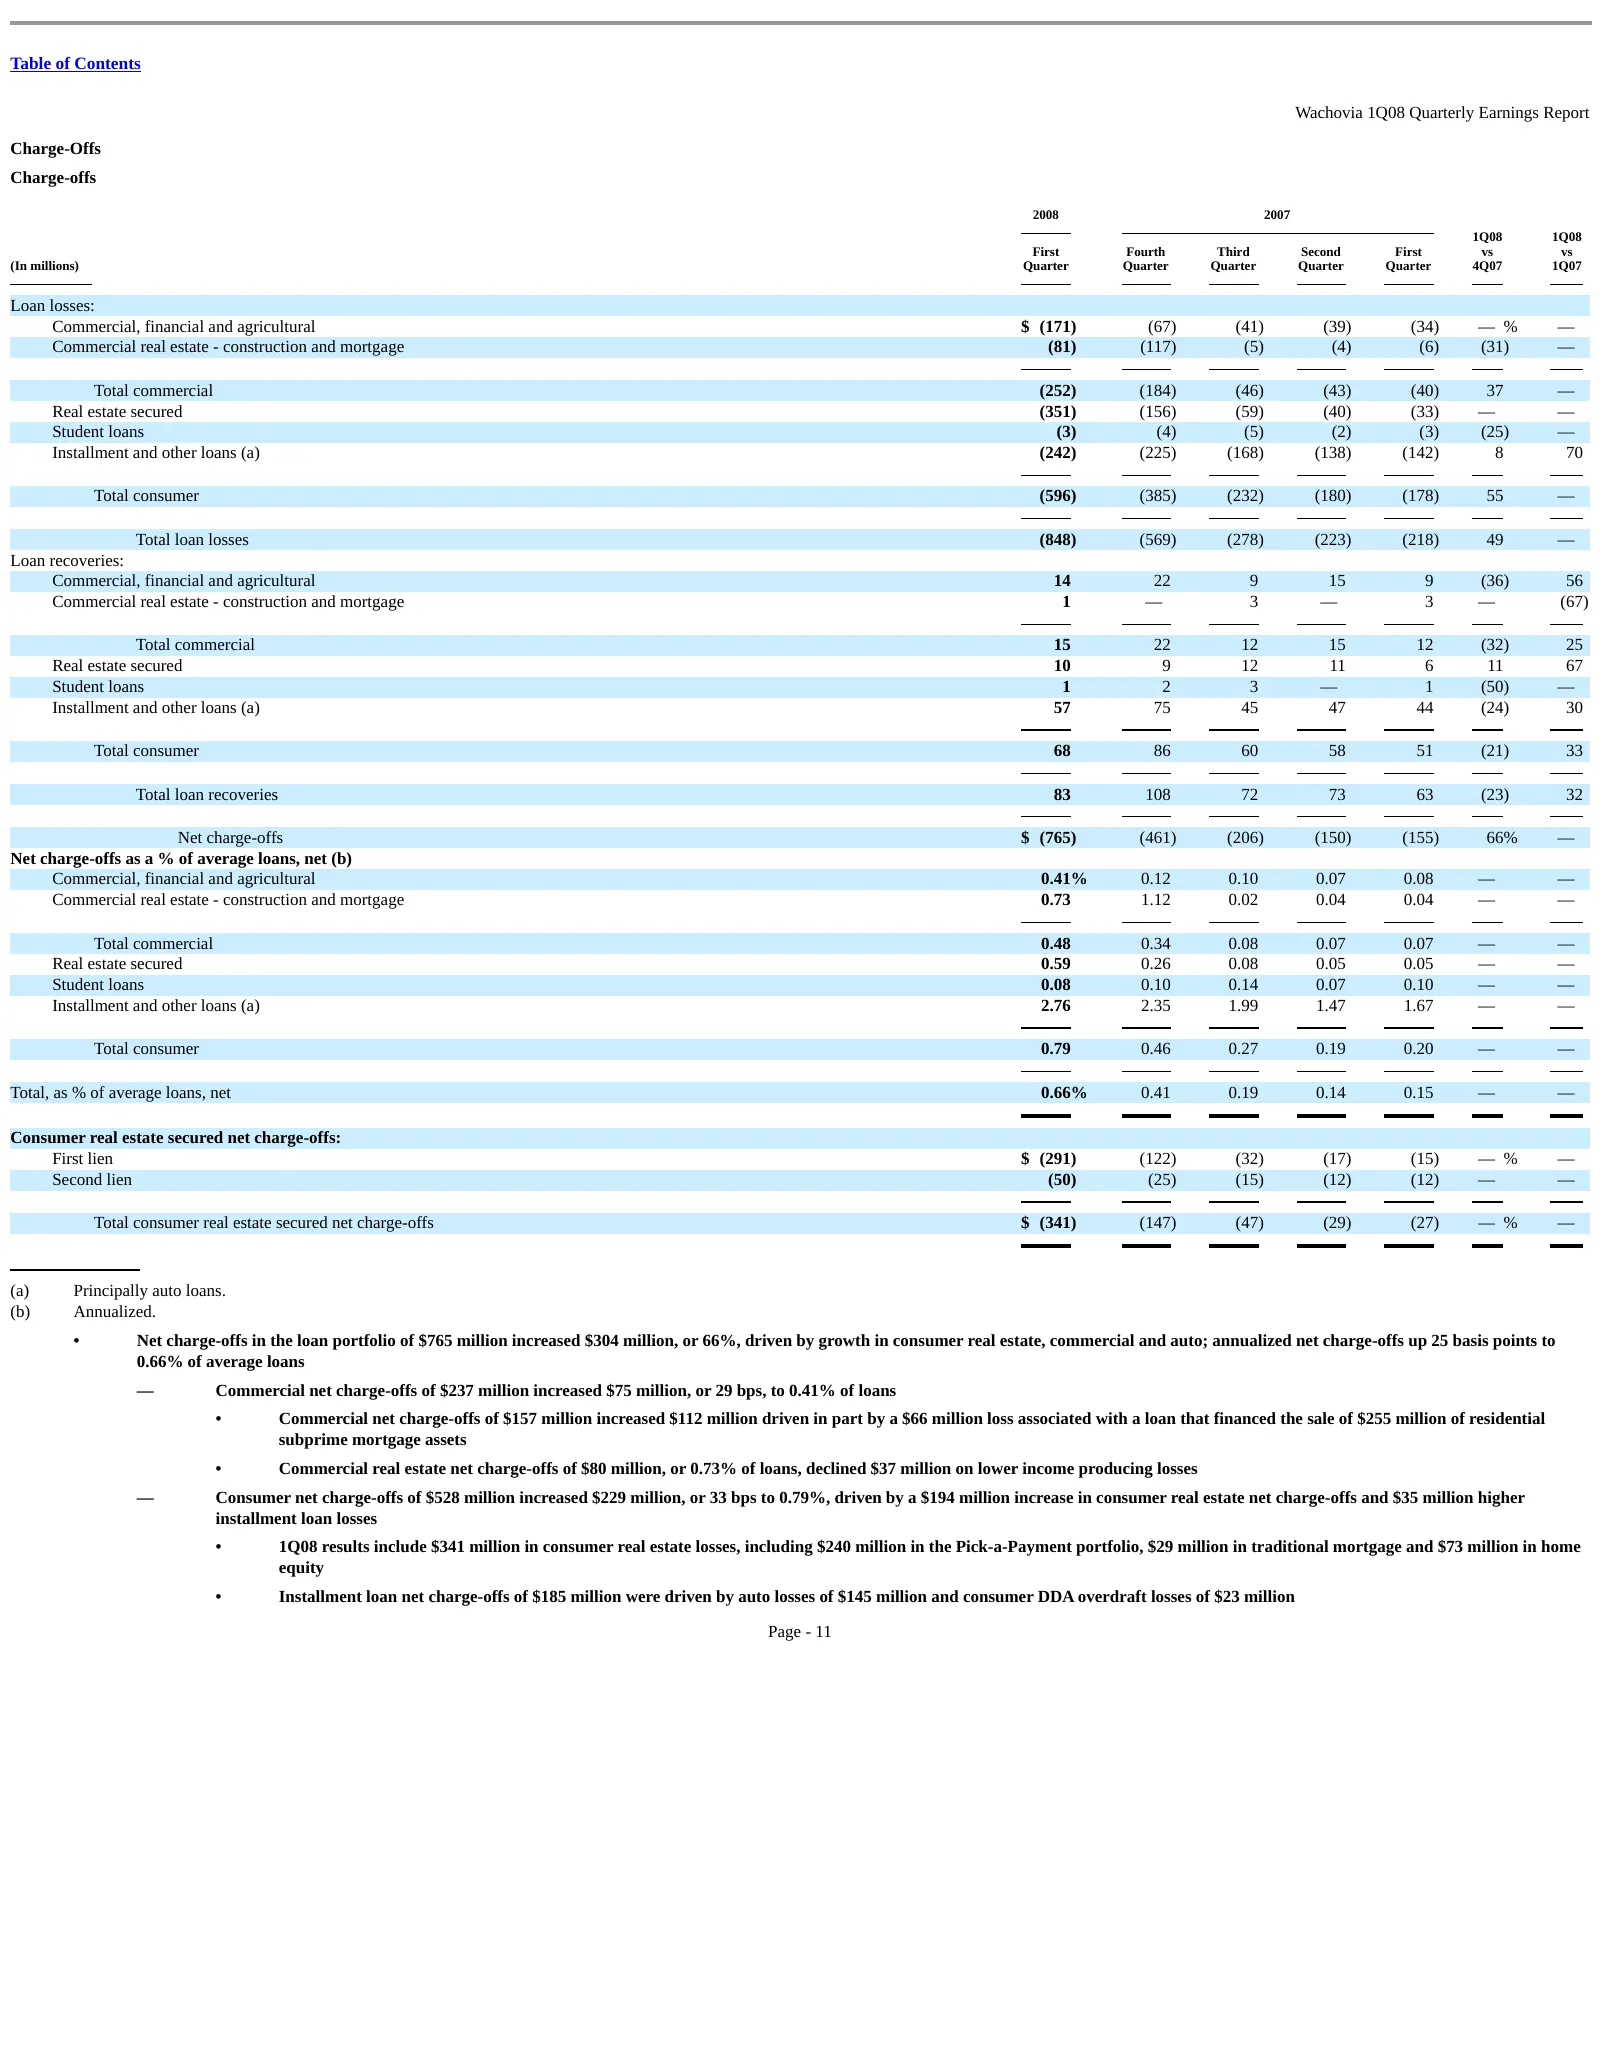
Table of Contents Wachovia 1Q08 Quarterly Earnings Report Charge-Offs Charge-offs 2008 2007 1Q08 1Q08 First Fourth Third Second First vs vs (In millions) Quarter Quarter Quarter Quarter Quarter 4Q07 1Q07 Loan losses: Commercial, financial and agricultural $ (171) (67) (41) (39) (34) — % — Commercial
Slide 80: Allowance For Credit Losses
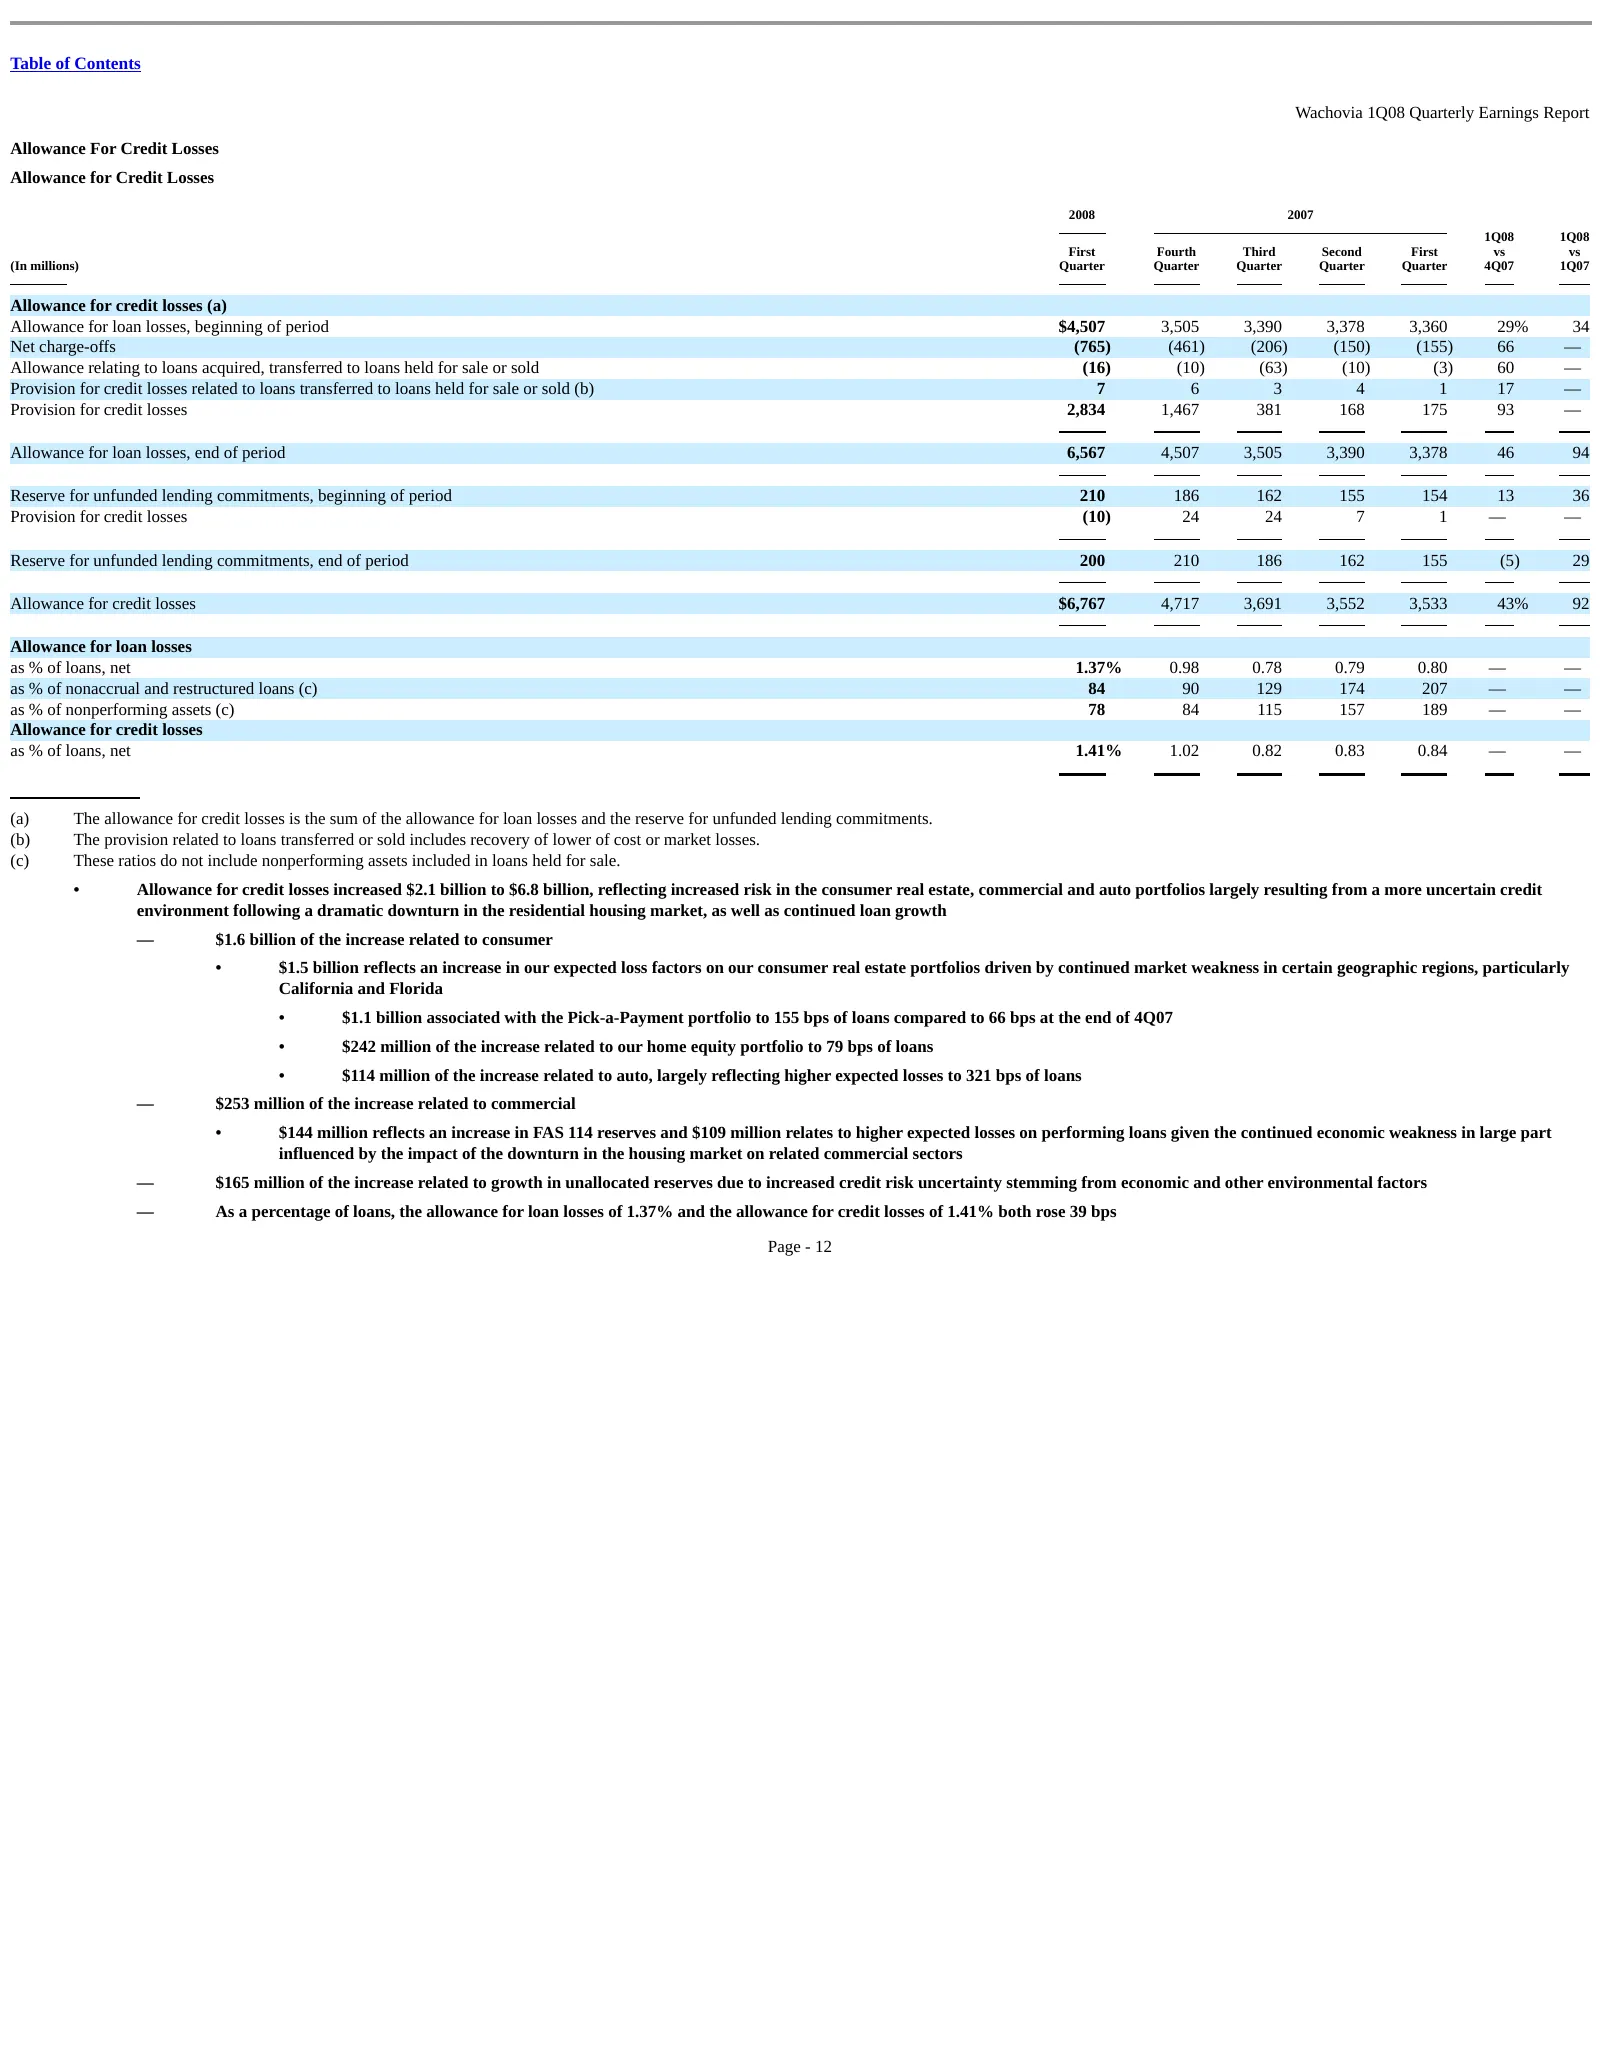
Table of Contents Wachovia 1Q08 Quarterly Earnings Report Allowance For Credit Losses Allowance for Credit Losses 2008 2007 1Q08 1Q08 First Fourth Third Second First vs vs (In millions) Quarter Quarter Quarter Quarter Quarter 4Q07 1Q07 Allowance for credit losses (a) Allowance for loan losses, begin
Slide 81: Allowance for Credit Losses and Nonperforming Assets
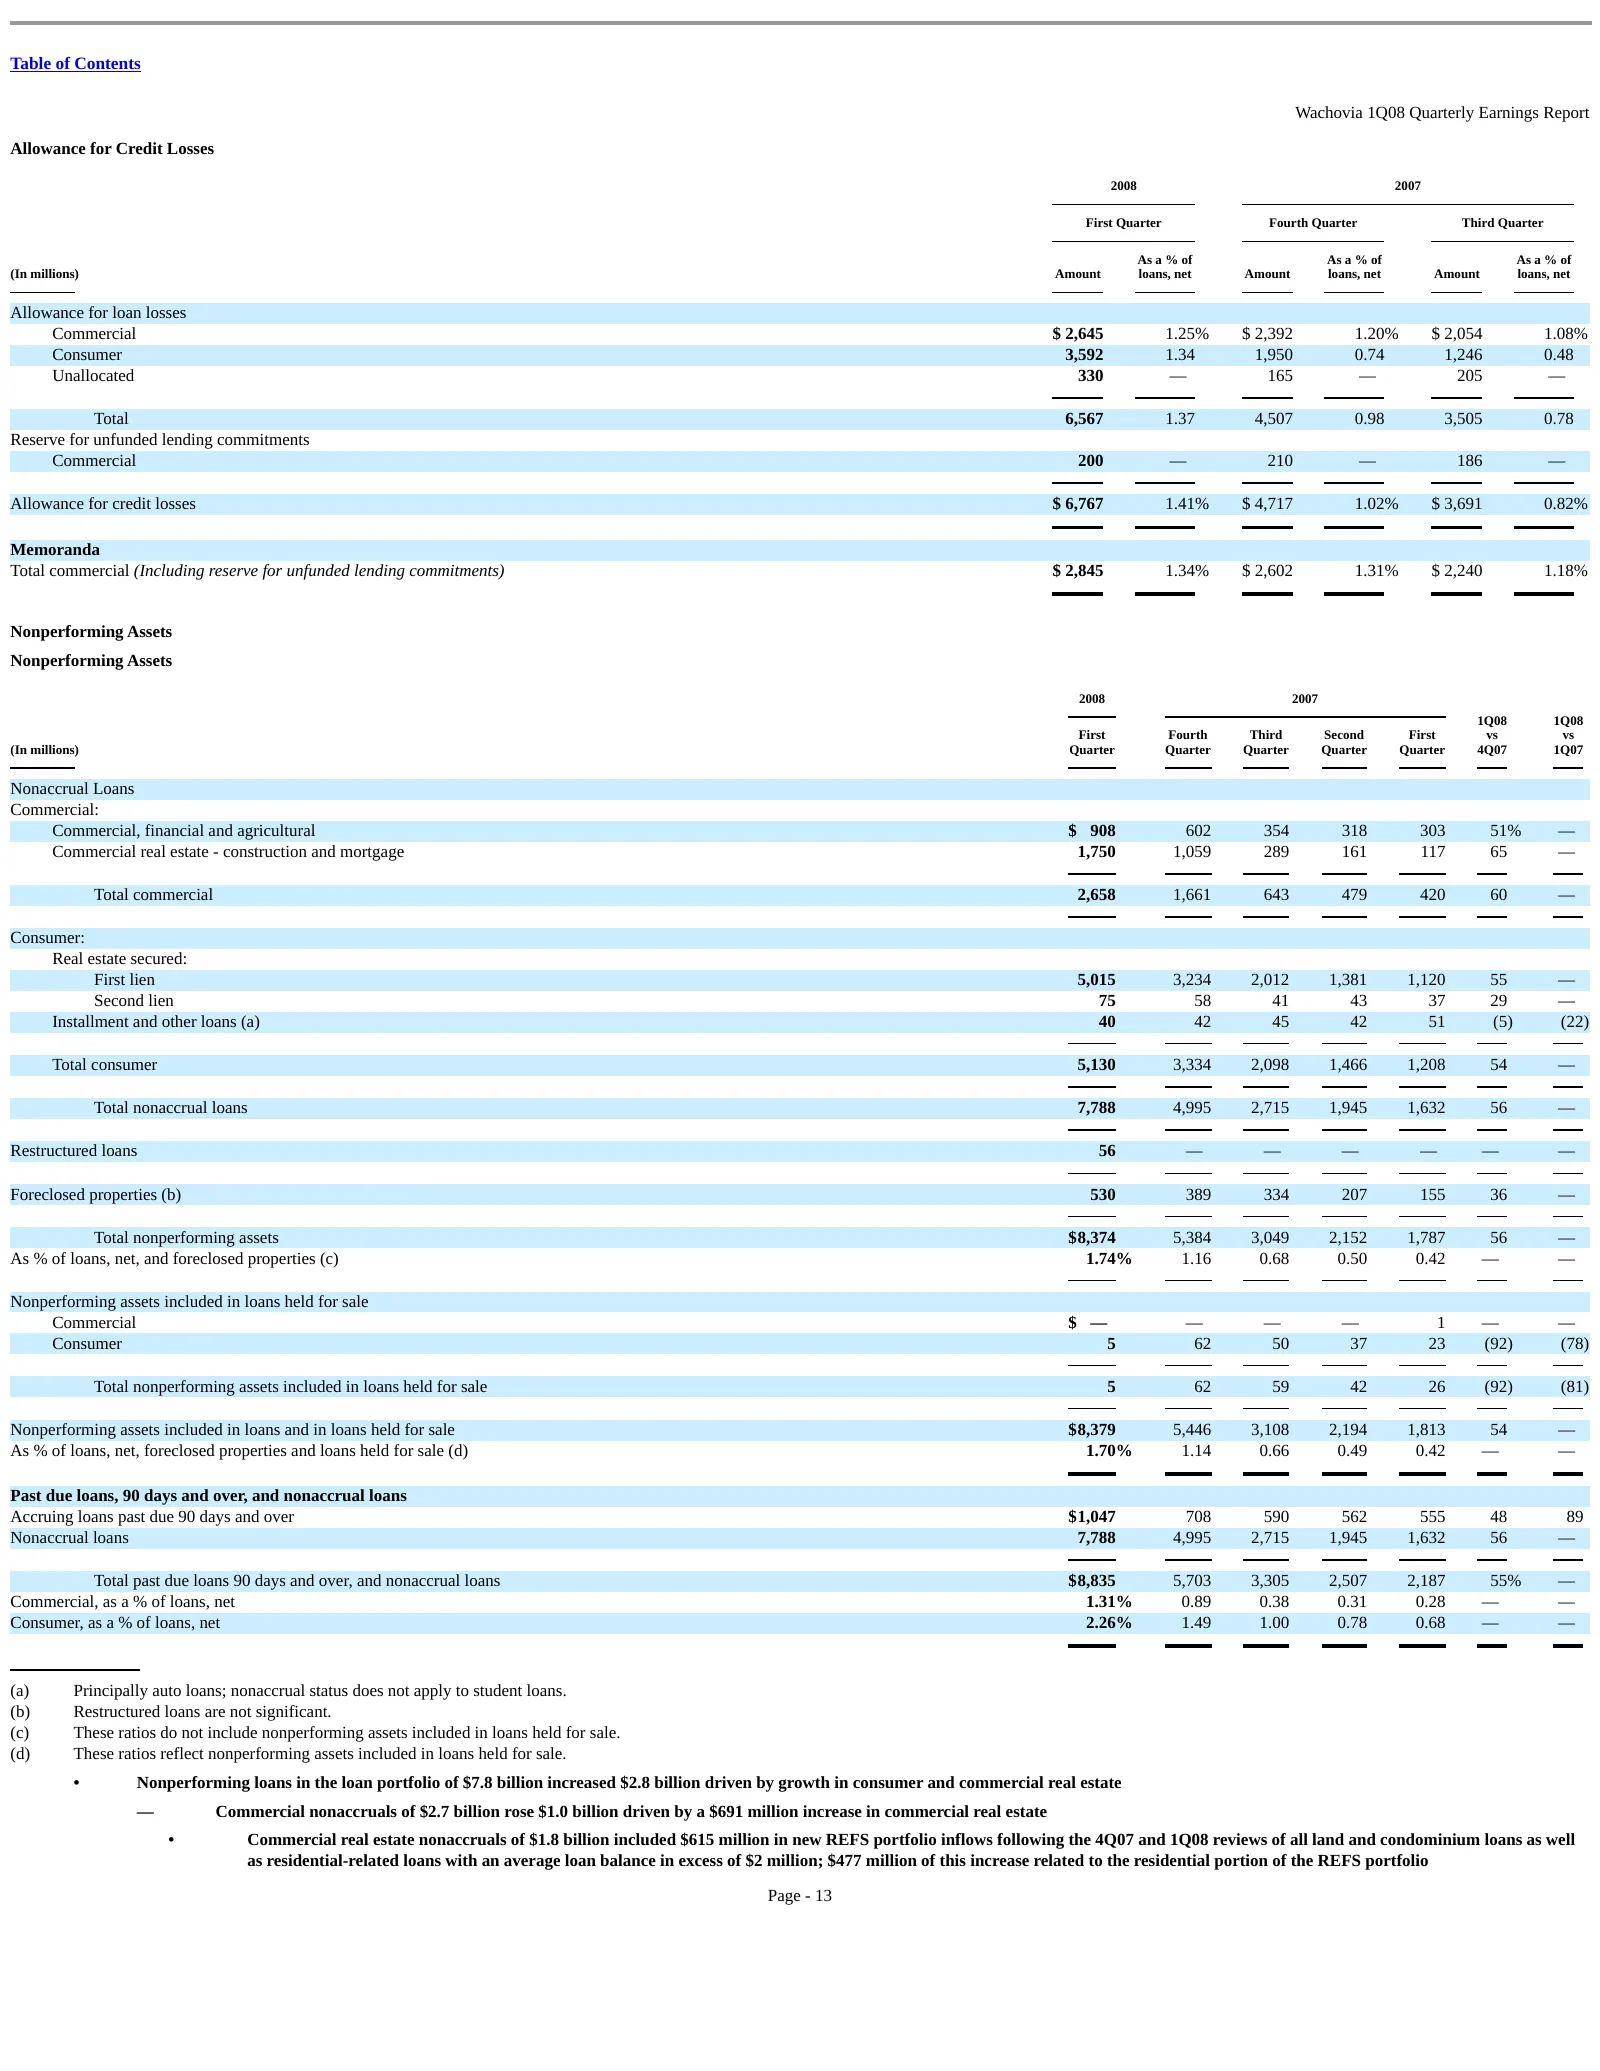
Table of Contents Wachovia 1Q08 Quarterly Earnings Report Allowance for Credit Losses 2008 2007 First Quarter Fourth Quarter Third Quarter As a % of As a % of As a % of (In millions) Amount loans, net Amount loans, net Amount loans, net Allowance for loan losses Commercial $ 2,645 1.25% $ 2,392 1.20
Slide 82: Nonaccrual loans commentary
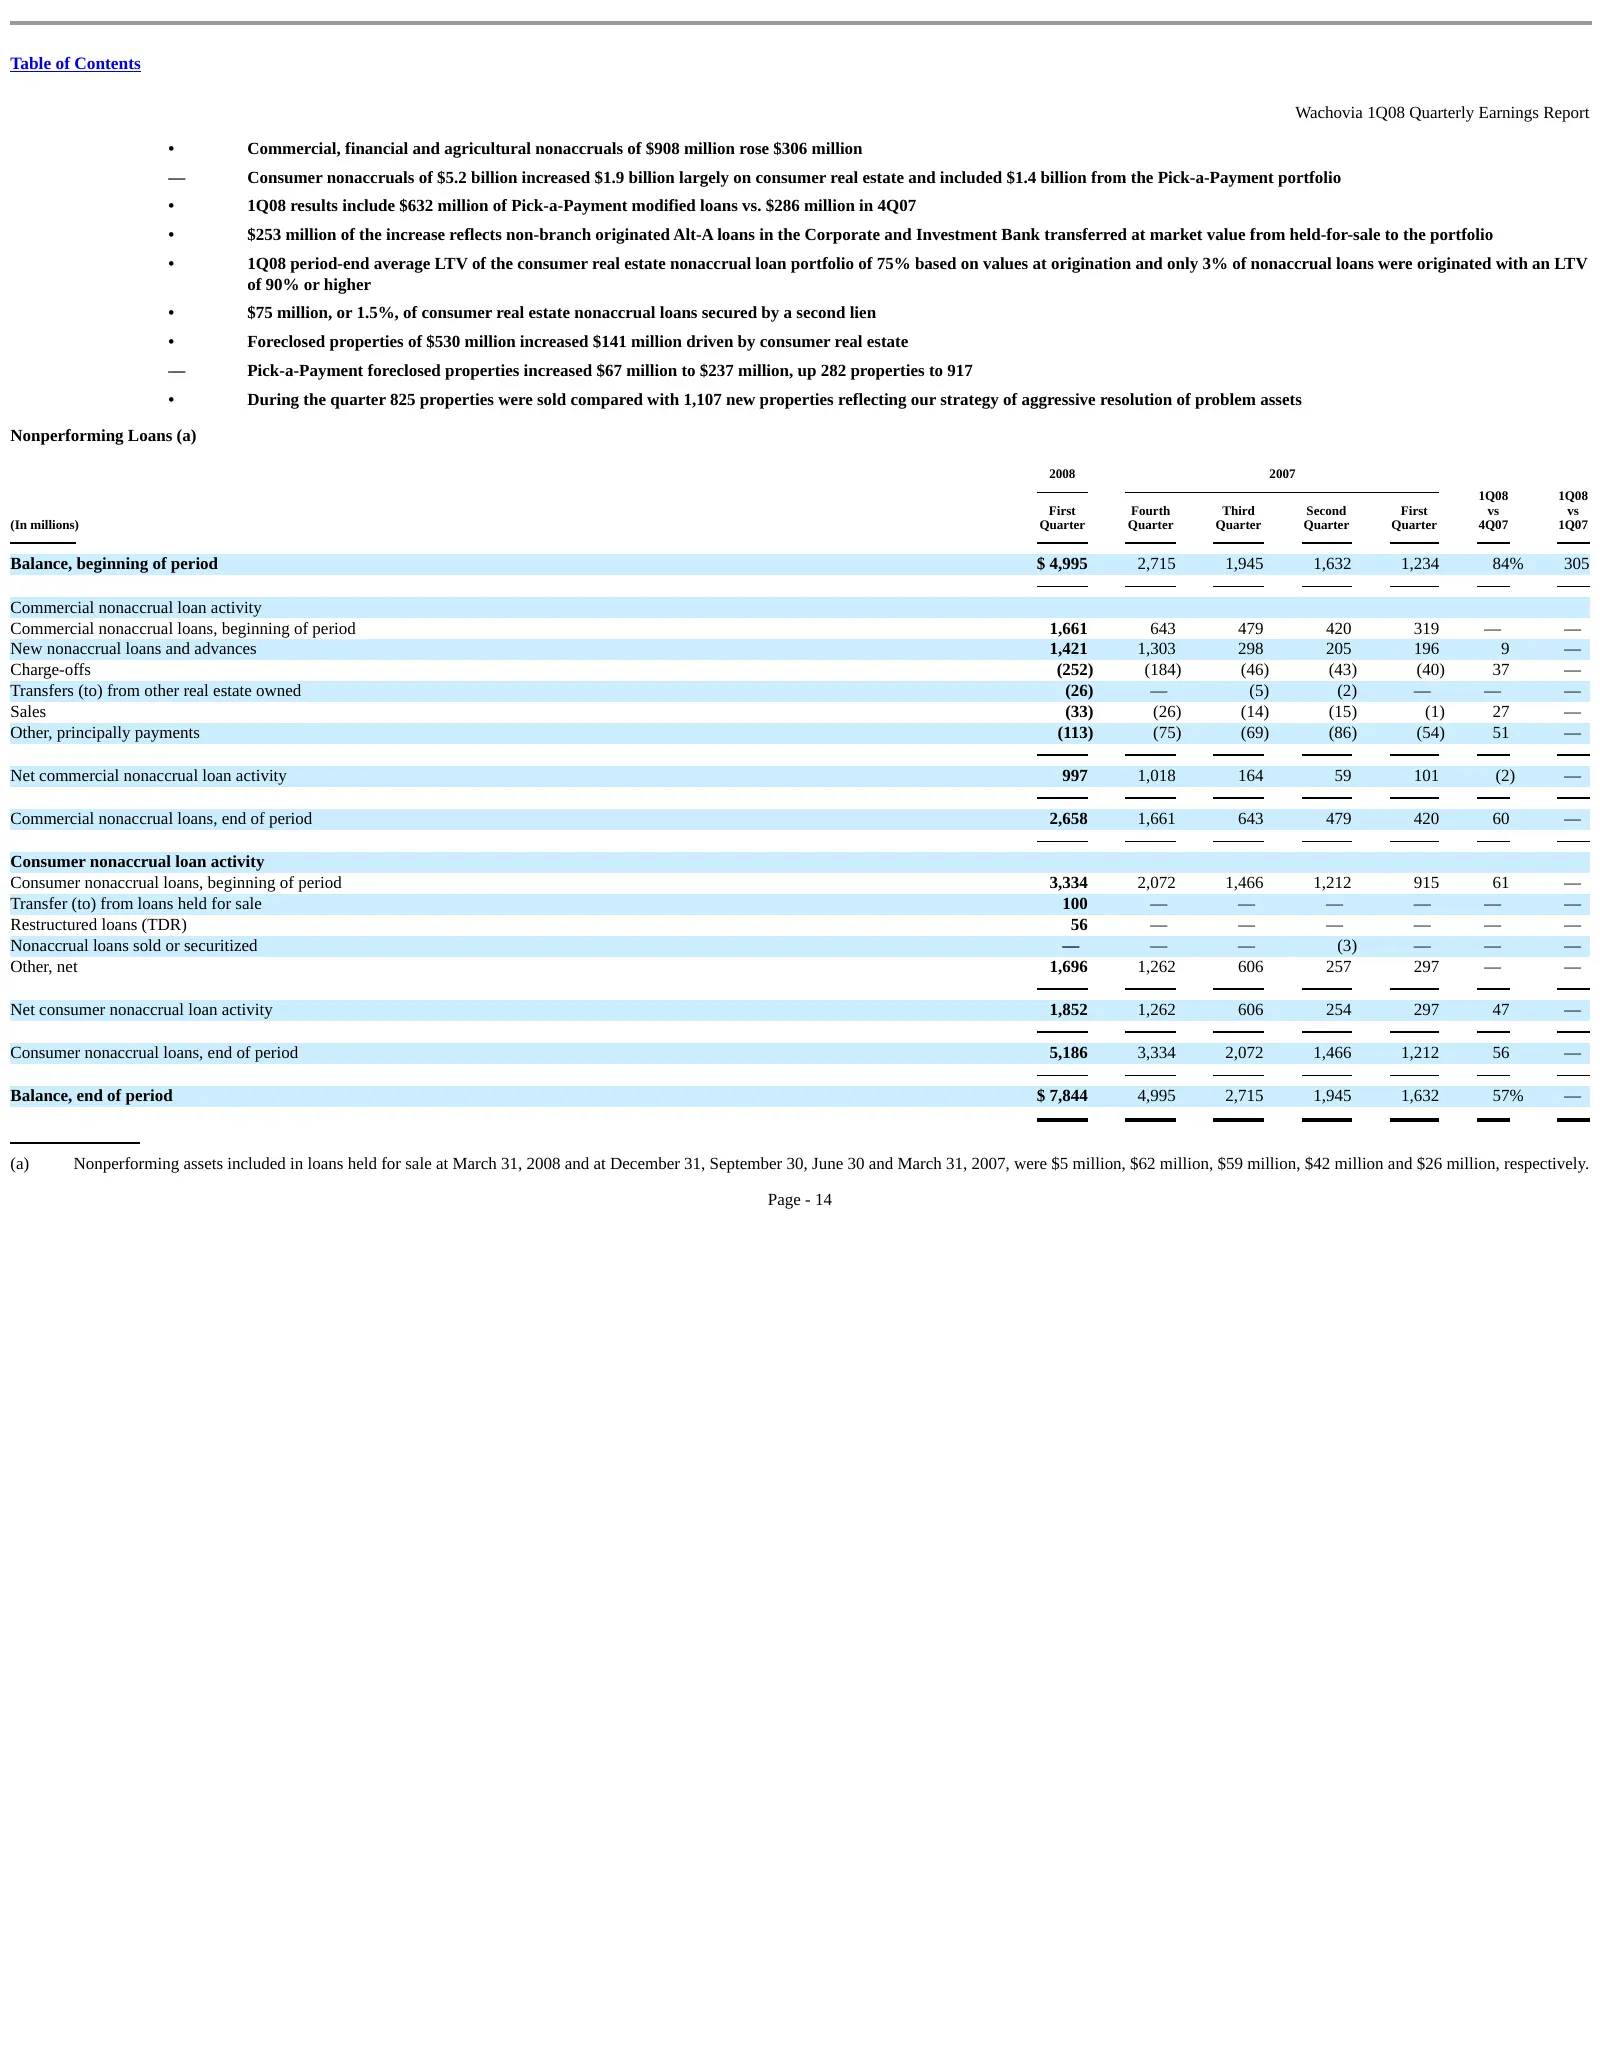
Table of Contents Wachovia 1Q08 Quarterly Earnings Report • Commercial, financial and agricultural nonaccruals of $908 million rose $306 million — Consumer nonaccruals of $5.2 billion increased $1.9 billion largely on consumer real estate and included $1.4 billion from the Pick-a-Payment portfolio •

Slide 83: Summary Operating Results
Table of Contents Wachovia 1Q08 Quarterly Earnings Report SUMMARY OPERATING RESULTS BUSINESS SEGMENTS Business segment results are presented excluding (i) merger-related and restructuring expenses, (ii) deposit base intangible and other intangible amortization expense, (iii) amounts presented as dis

Slide 84: SFAS 157/159 adoption and Investment in BluePoint
Table of Contents Wachovia 1Q08 Quarterly Earnings Report To summarize, the total impact of adoption of SFAS 157 was a net gain of $517 million, and the total impact of adoption of SFAS 159 was a net charge of $72 million, for a total net gain of $445 million in results of operations. On January 1,
Slide 85: General Bank
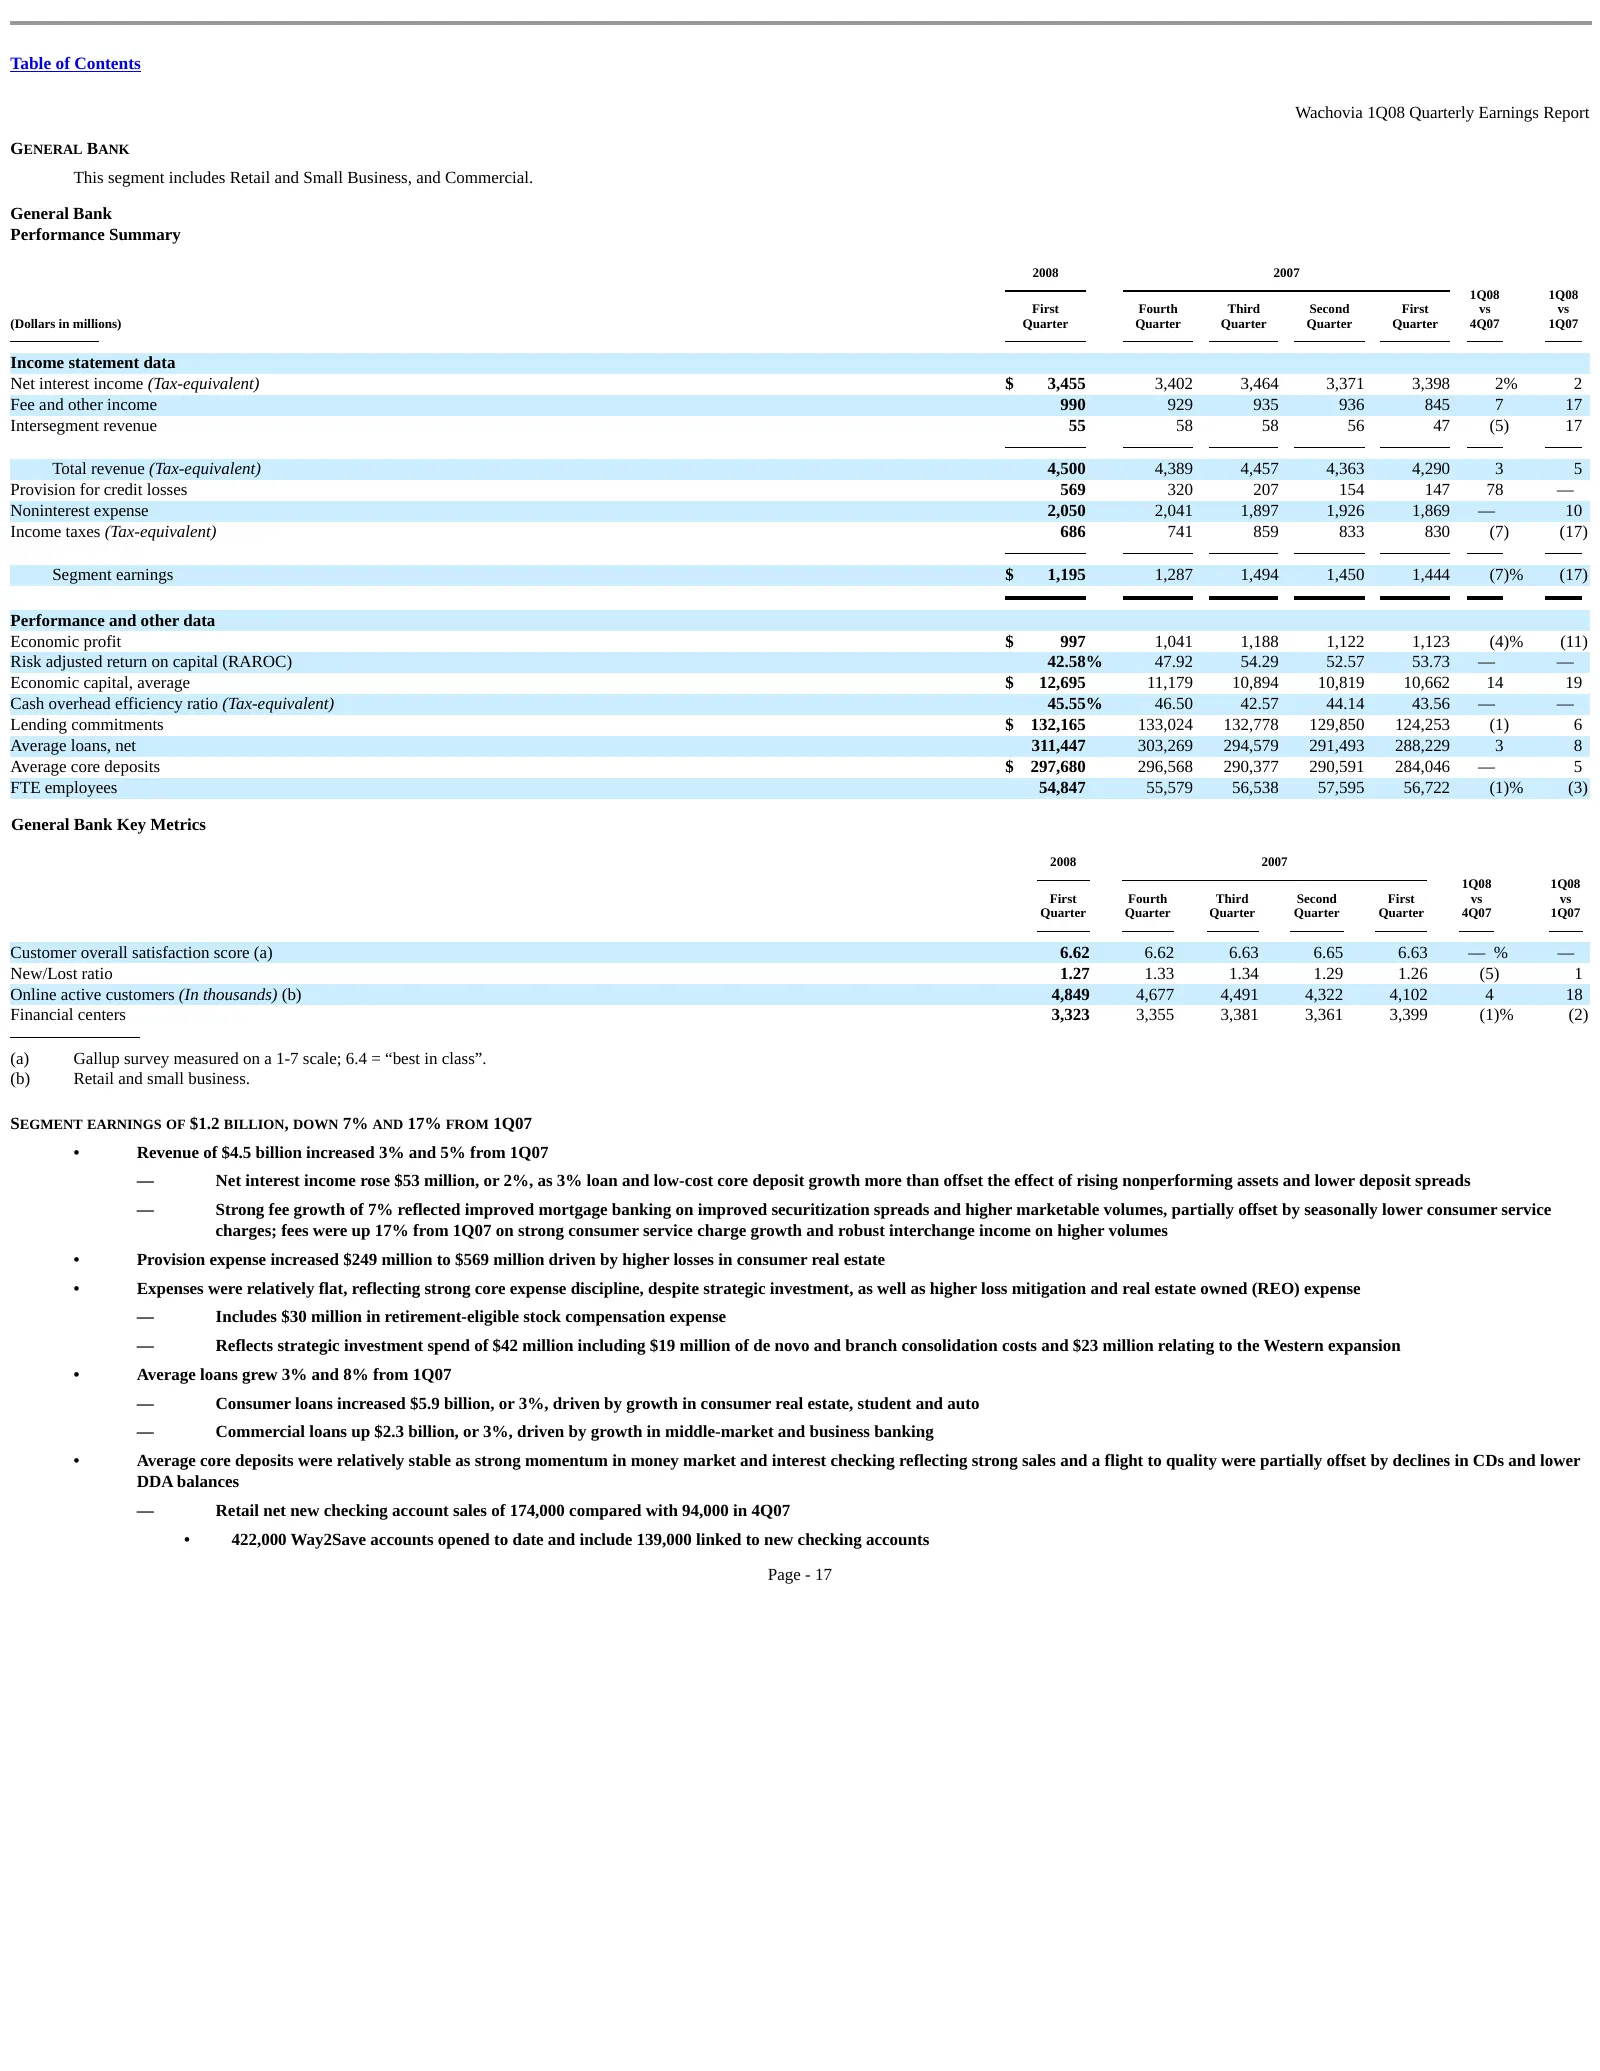
Table of Contents Wachovia 1Q08 Quarterly Earnings Report GENERAL BANK This segment includes Retail and Small Business, and Commercial. General Bank Performance Summary 2008 2007 1Q08 1Q08 First Fourth Third Second First vs vs (Dollars in millions) Quarter Quarter Quarter Quarter Quarter 4Q07 1Q07 I
Slide 86: Retail and Small Business
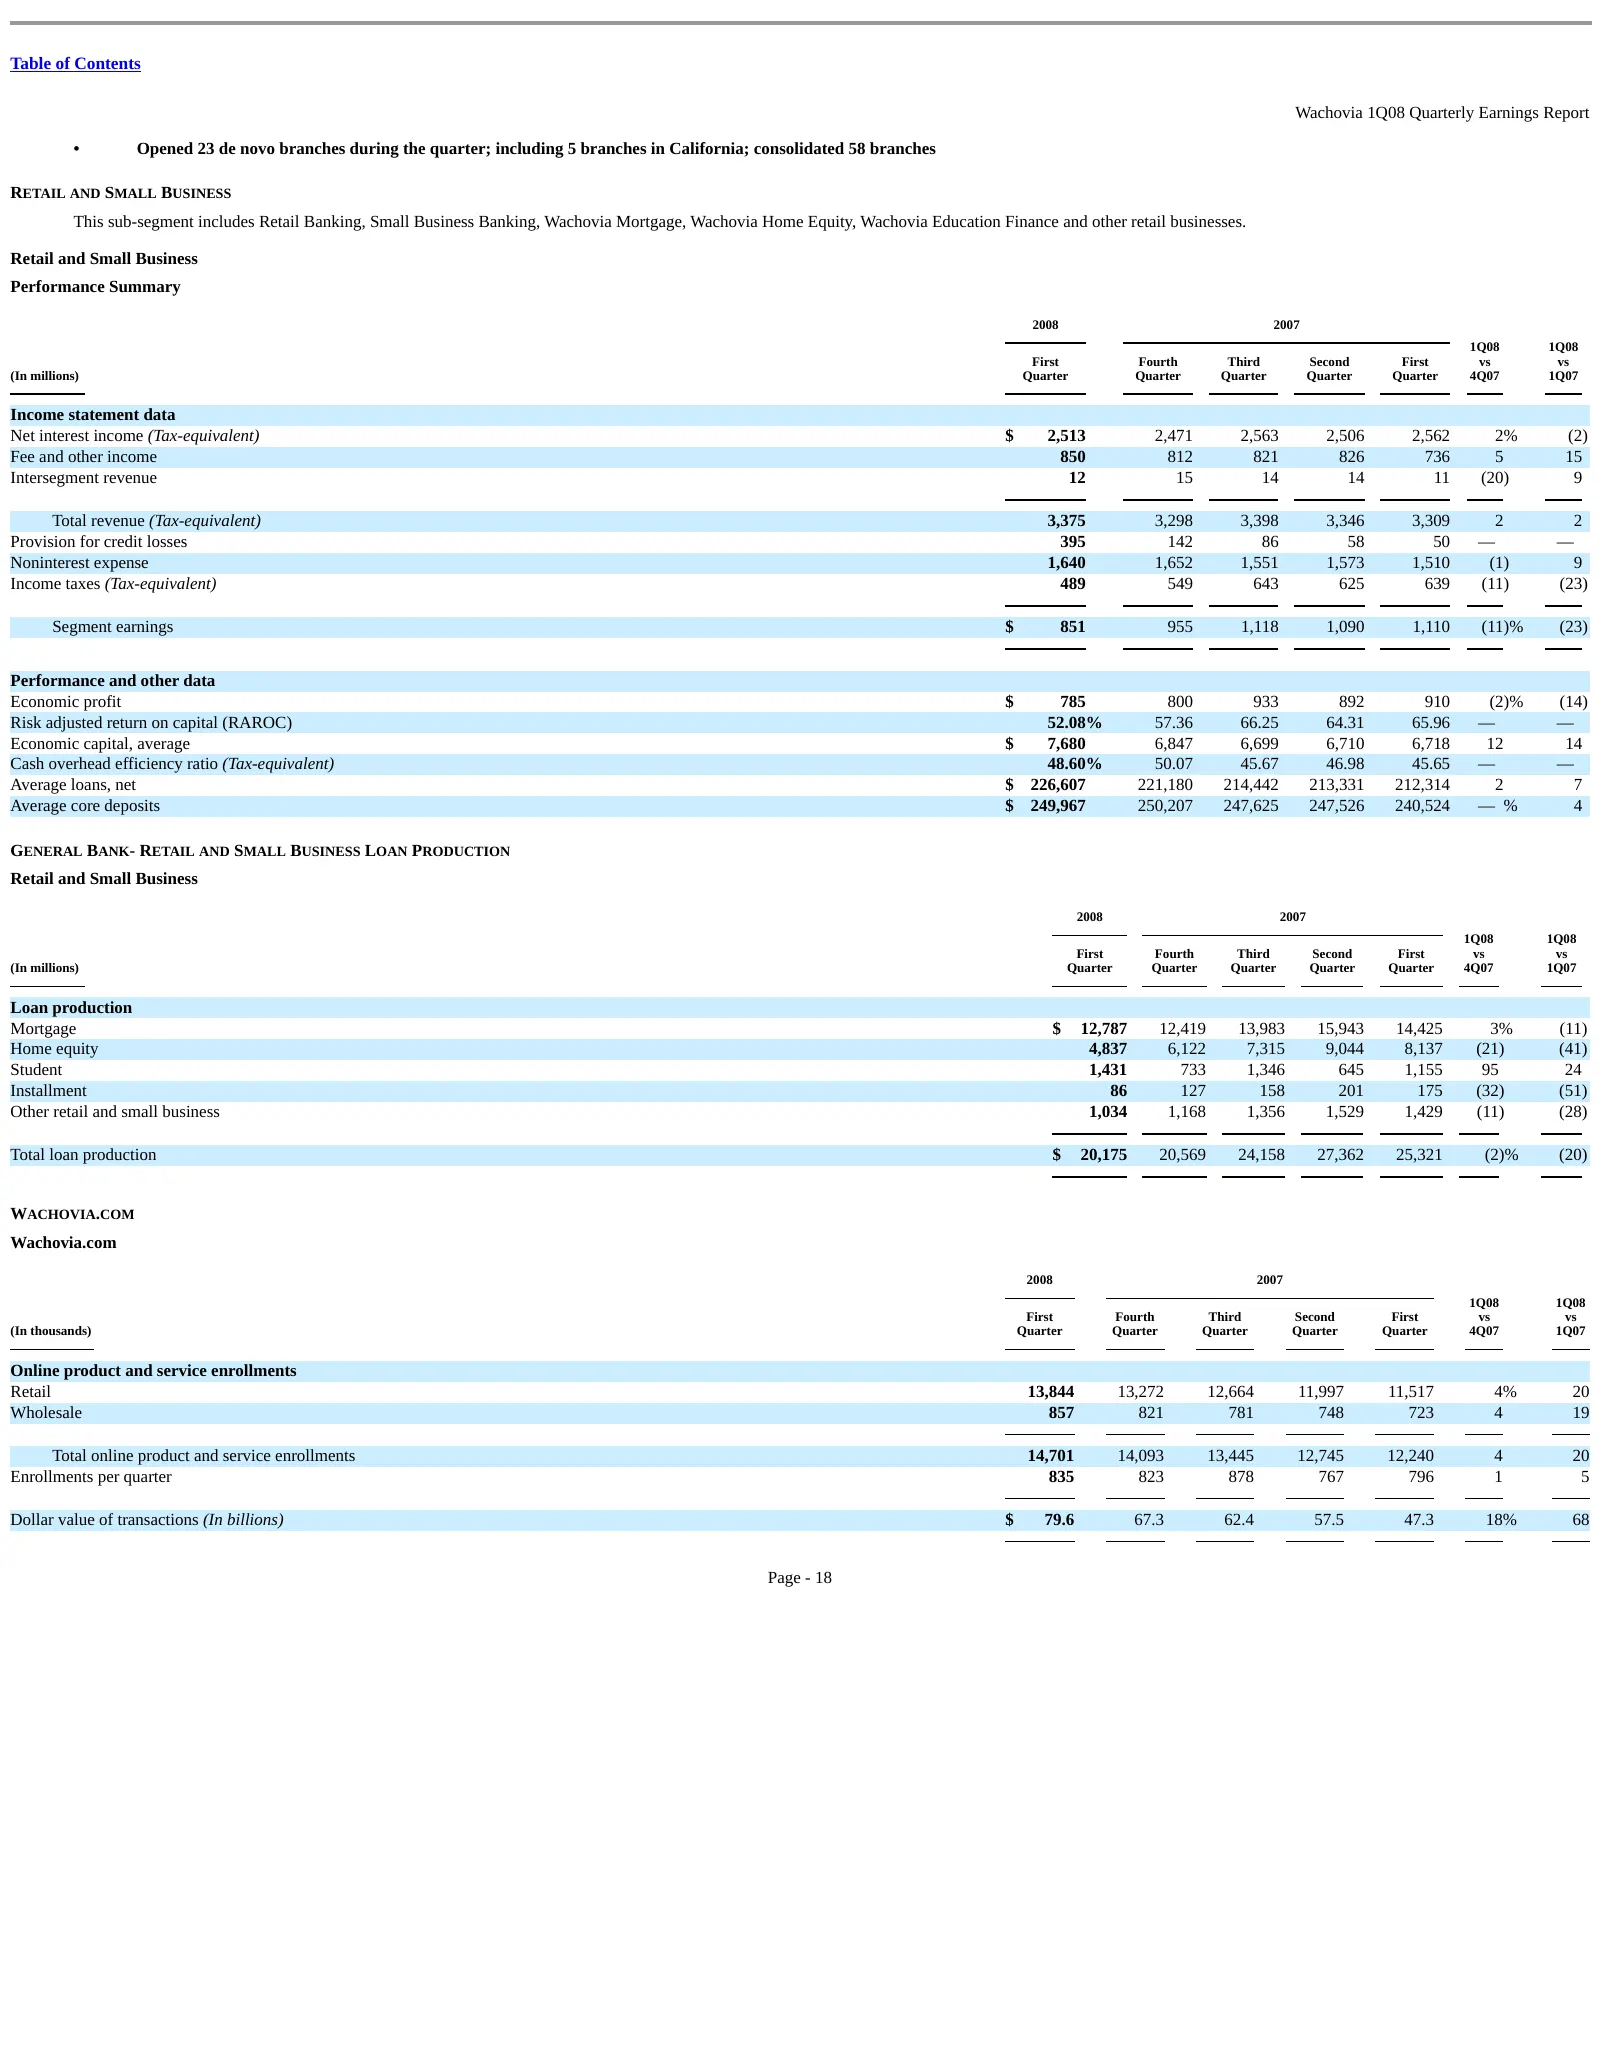
Table of Contents Wachovia 1Q08 Quarterly Earnings Report • Opened 23 de novo branches during the quarter; including 5 branches in California; consolidated 58 branches RETAIL AND SMALL BUSINESS This sub-segment includes Retail Banking, Small Business Banking, Wachovia Mortgage, Wachovia Home Equity,
Slide 87: Commercial
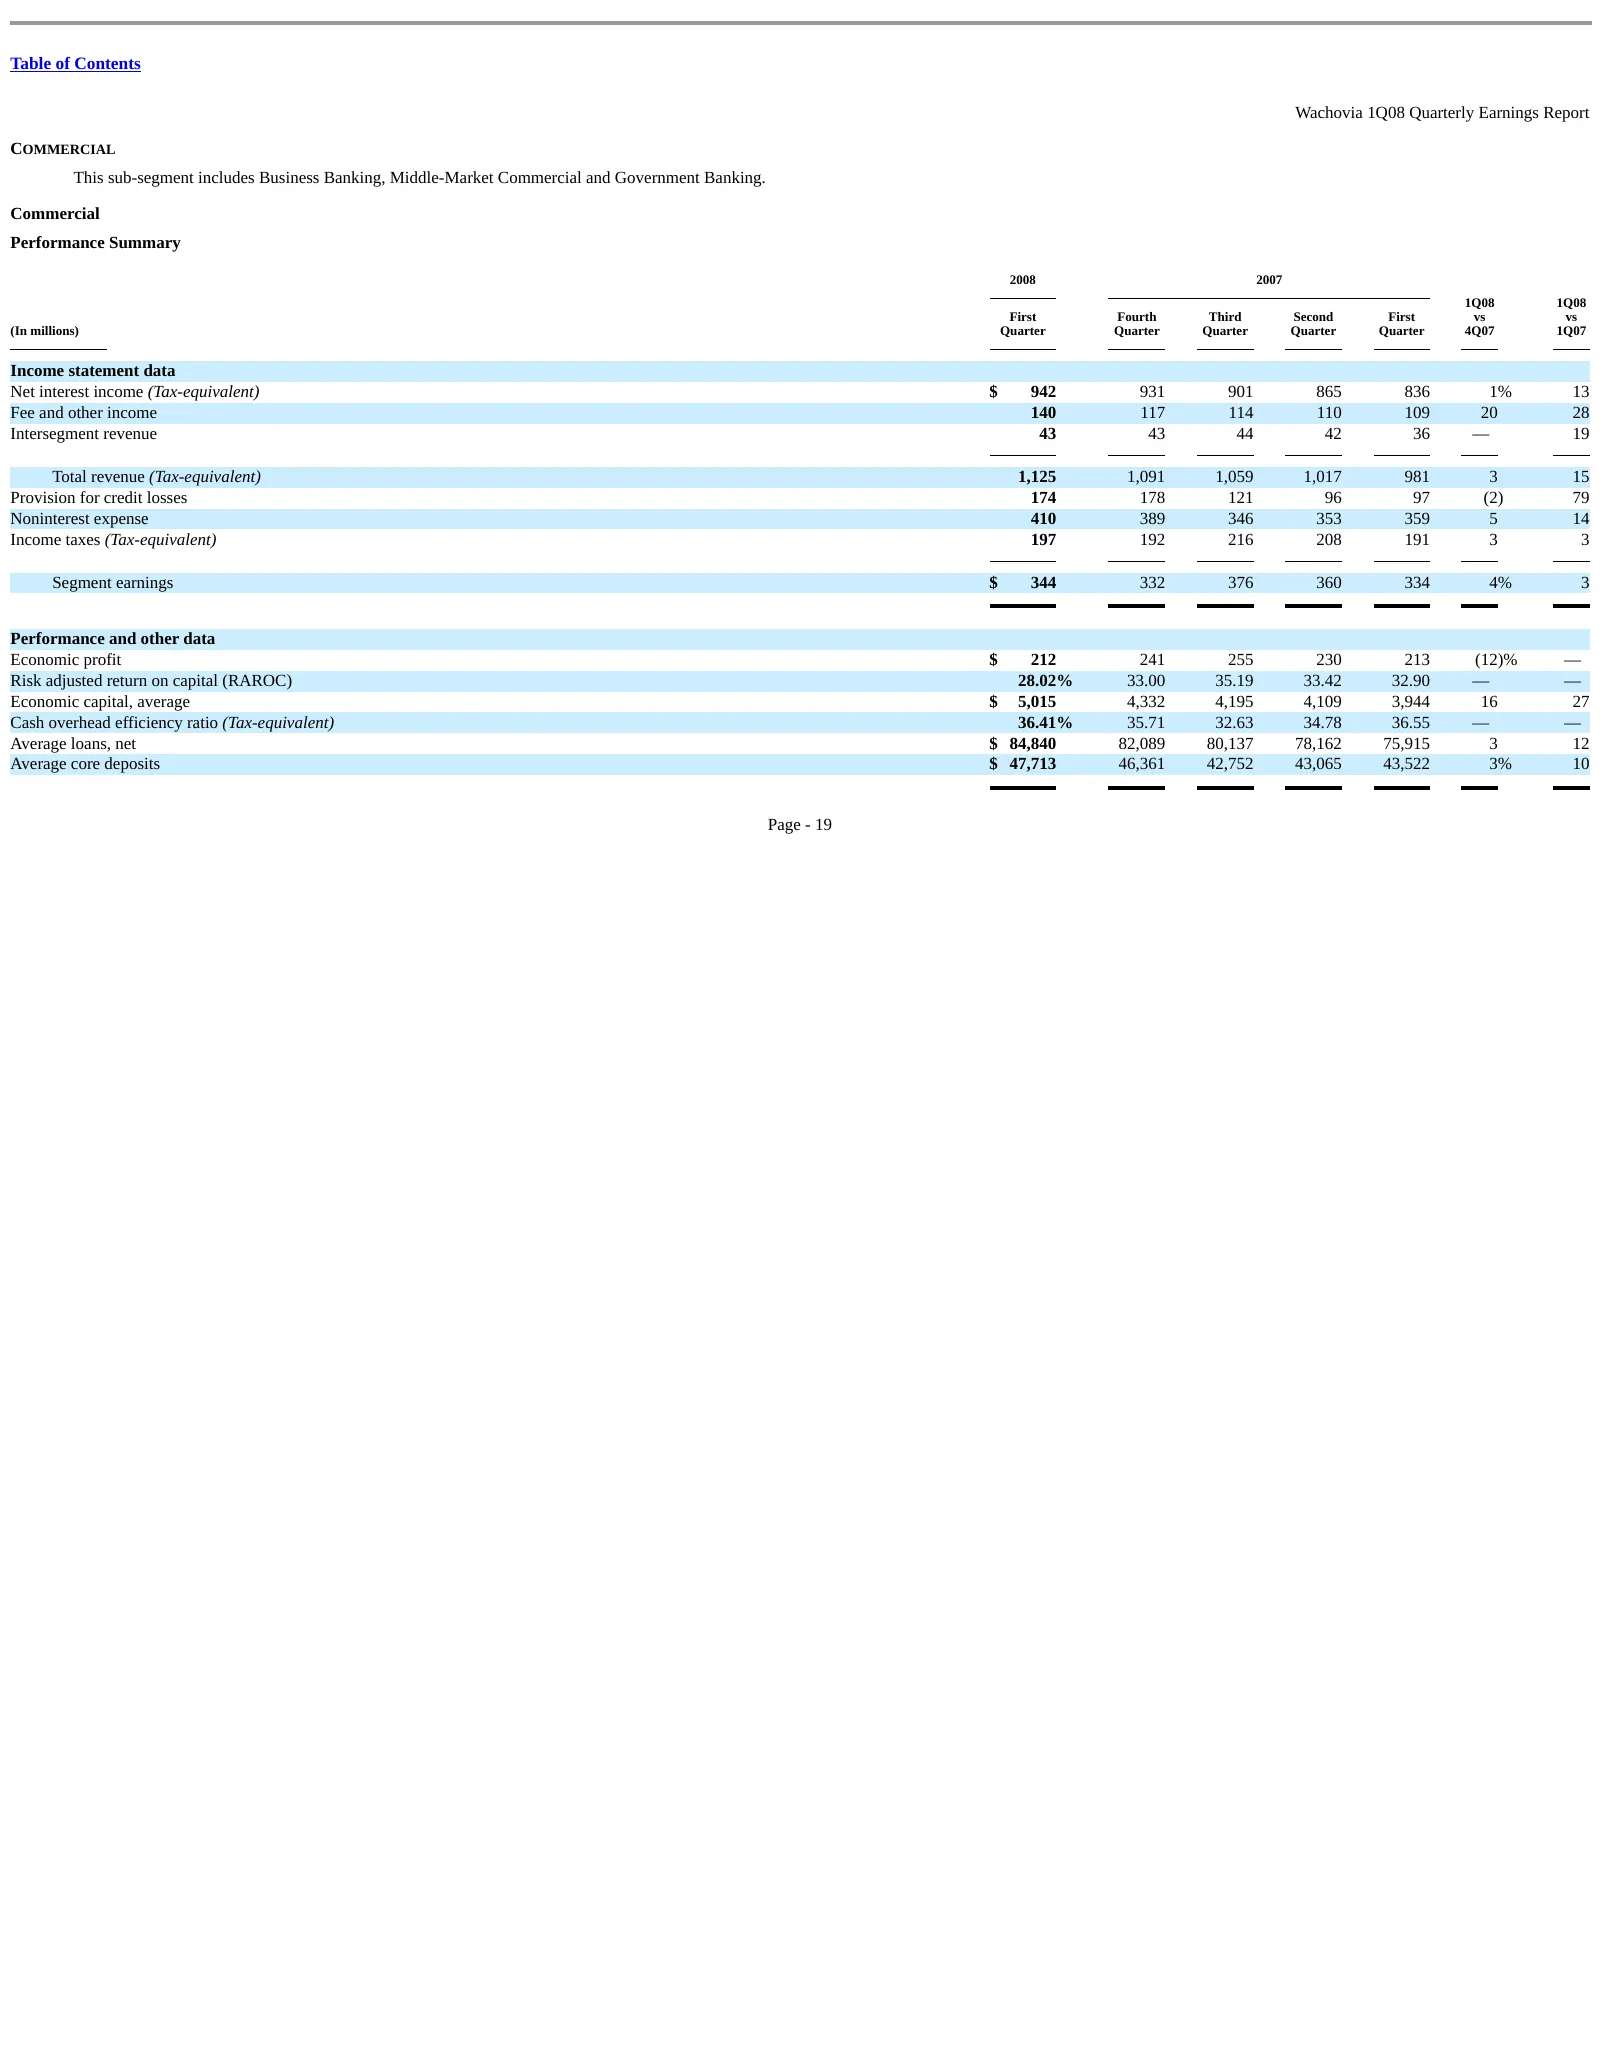
Table of Contents Wachovia 1Q08 Quarterly Earnings Report COMMERCIAL This sub-segment includes Business Banking, Middle-Market Commercial and Government Banking. Commercial Performance Summary 2008 2007 1Q08 1Q08 First Fourth Third Second First vs vs (In millions) Quarter Quarter Quarter Quarter Qua
Slide 88: Wealth Management
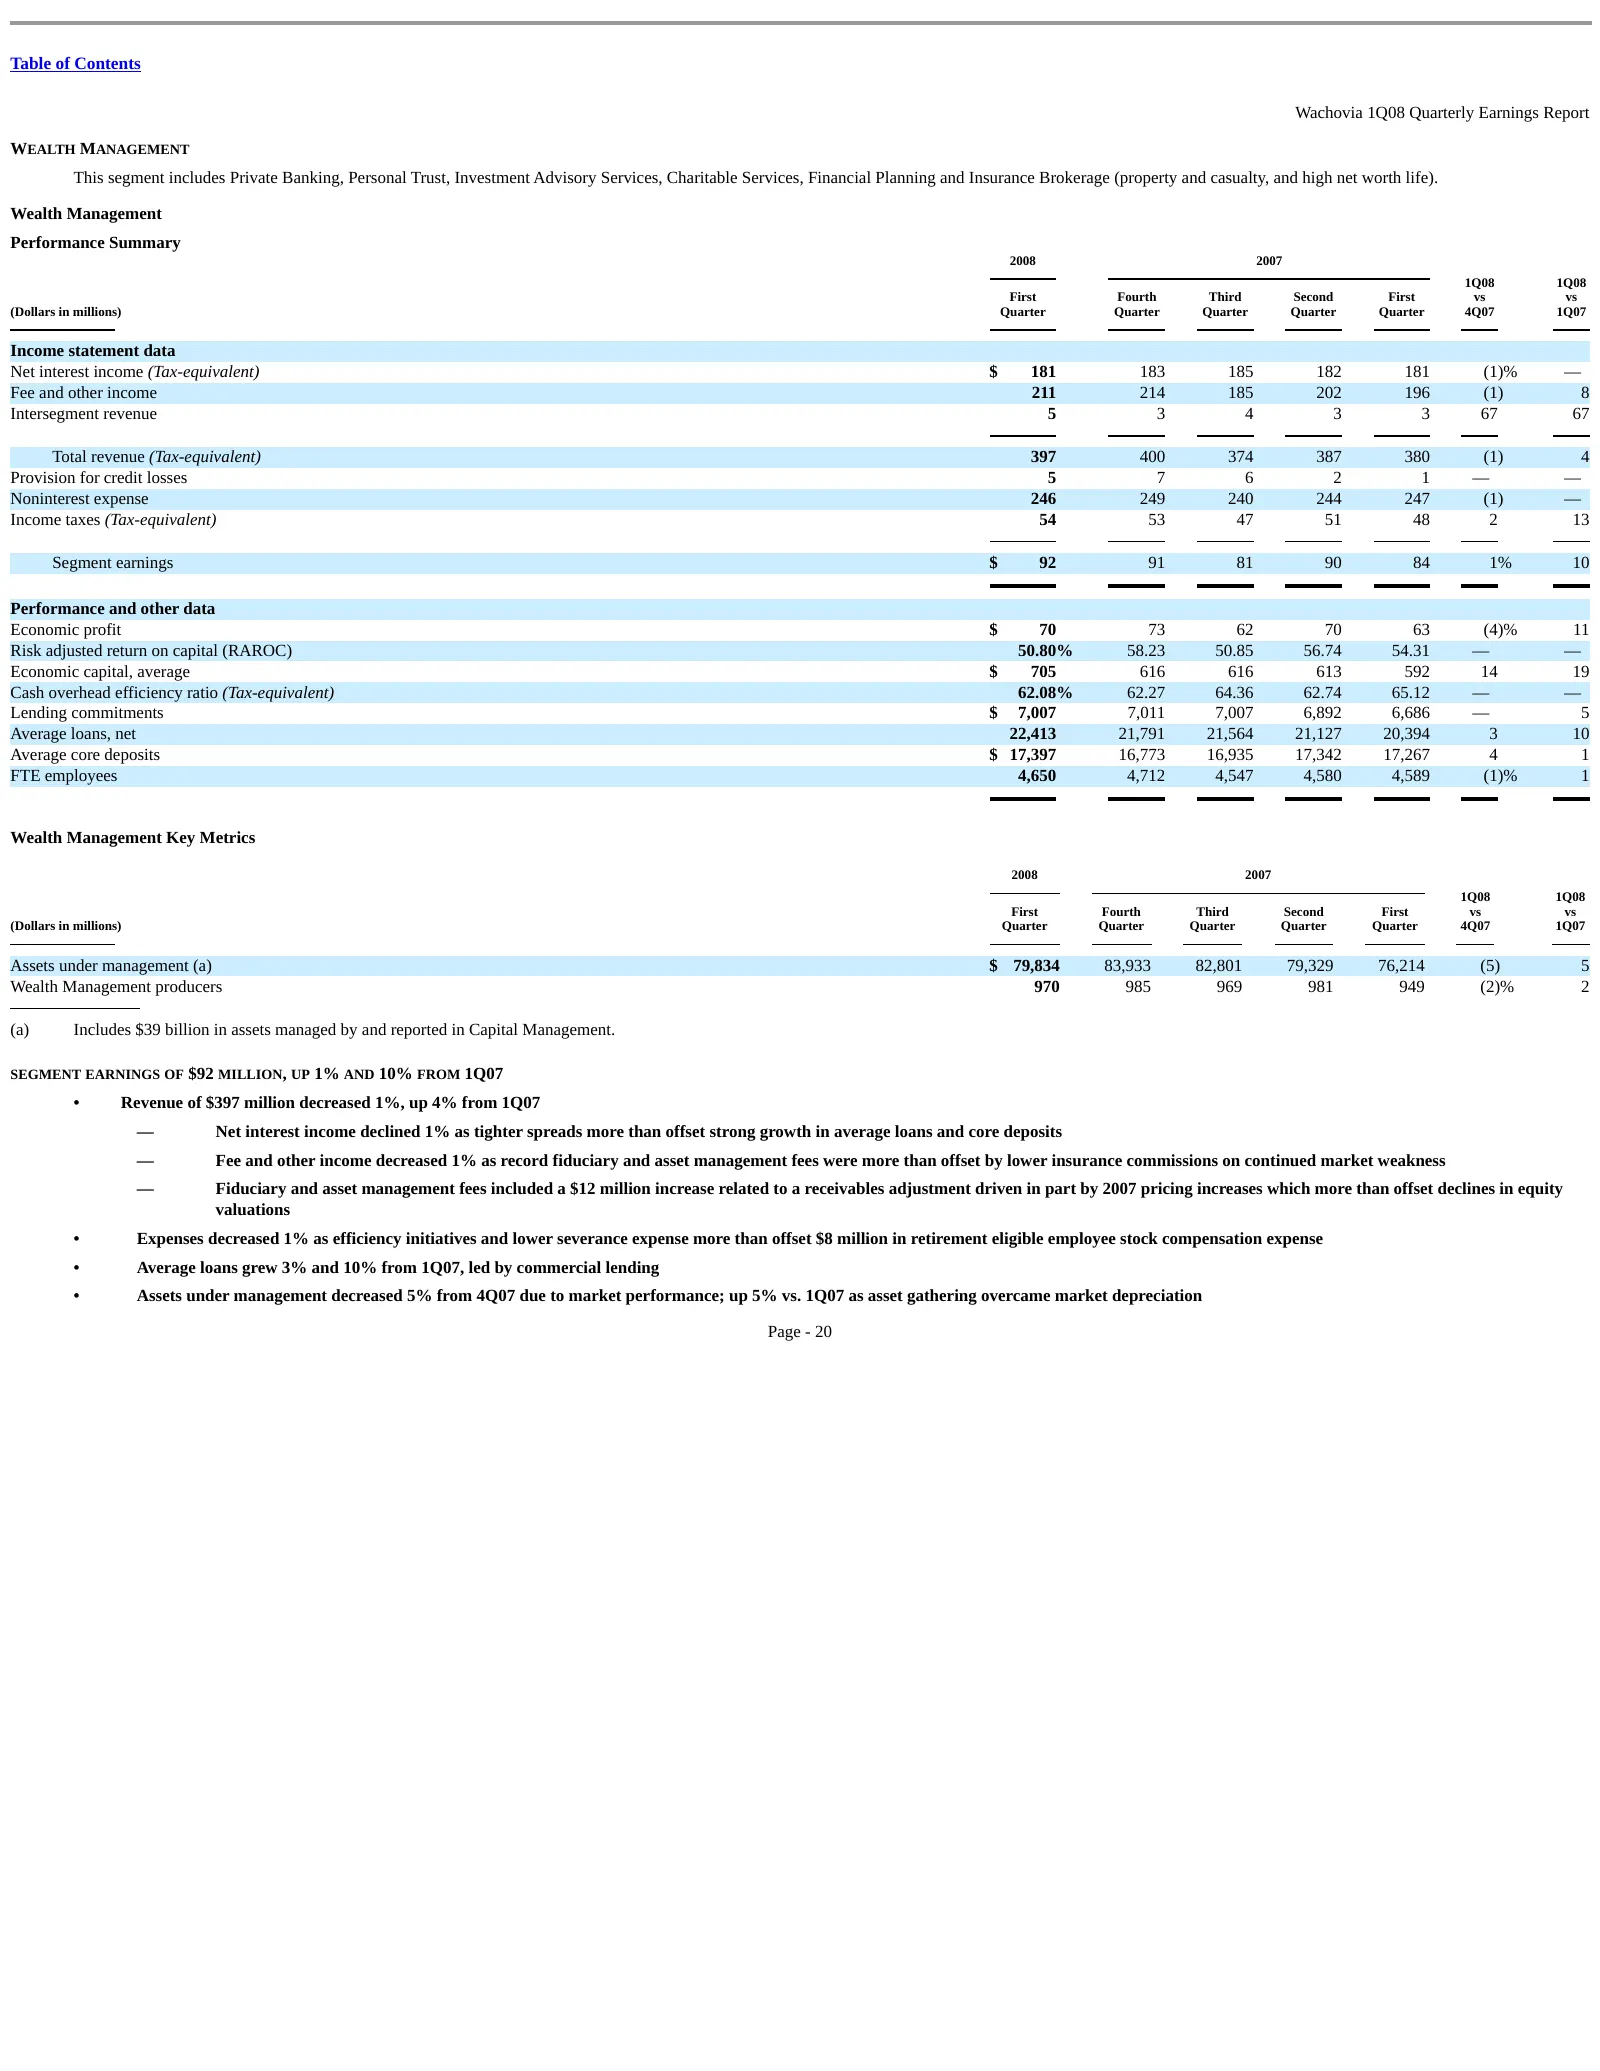
Table of Contents Wachovia 1Q08 Quarterly Earnings Report WEALTH MANAGEMENT This segment includes Private Banking, Personal Trust, Investment Advisory Services, Charitable Services, Financial Planning and Insurance Brokerage (property and casualty, and high net worth life). Wealth Management Perform
Slide 89: Corporate and Investment Bank
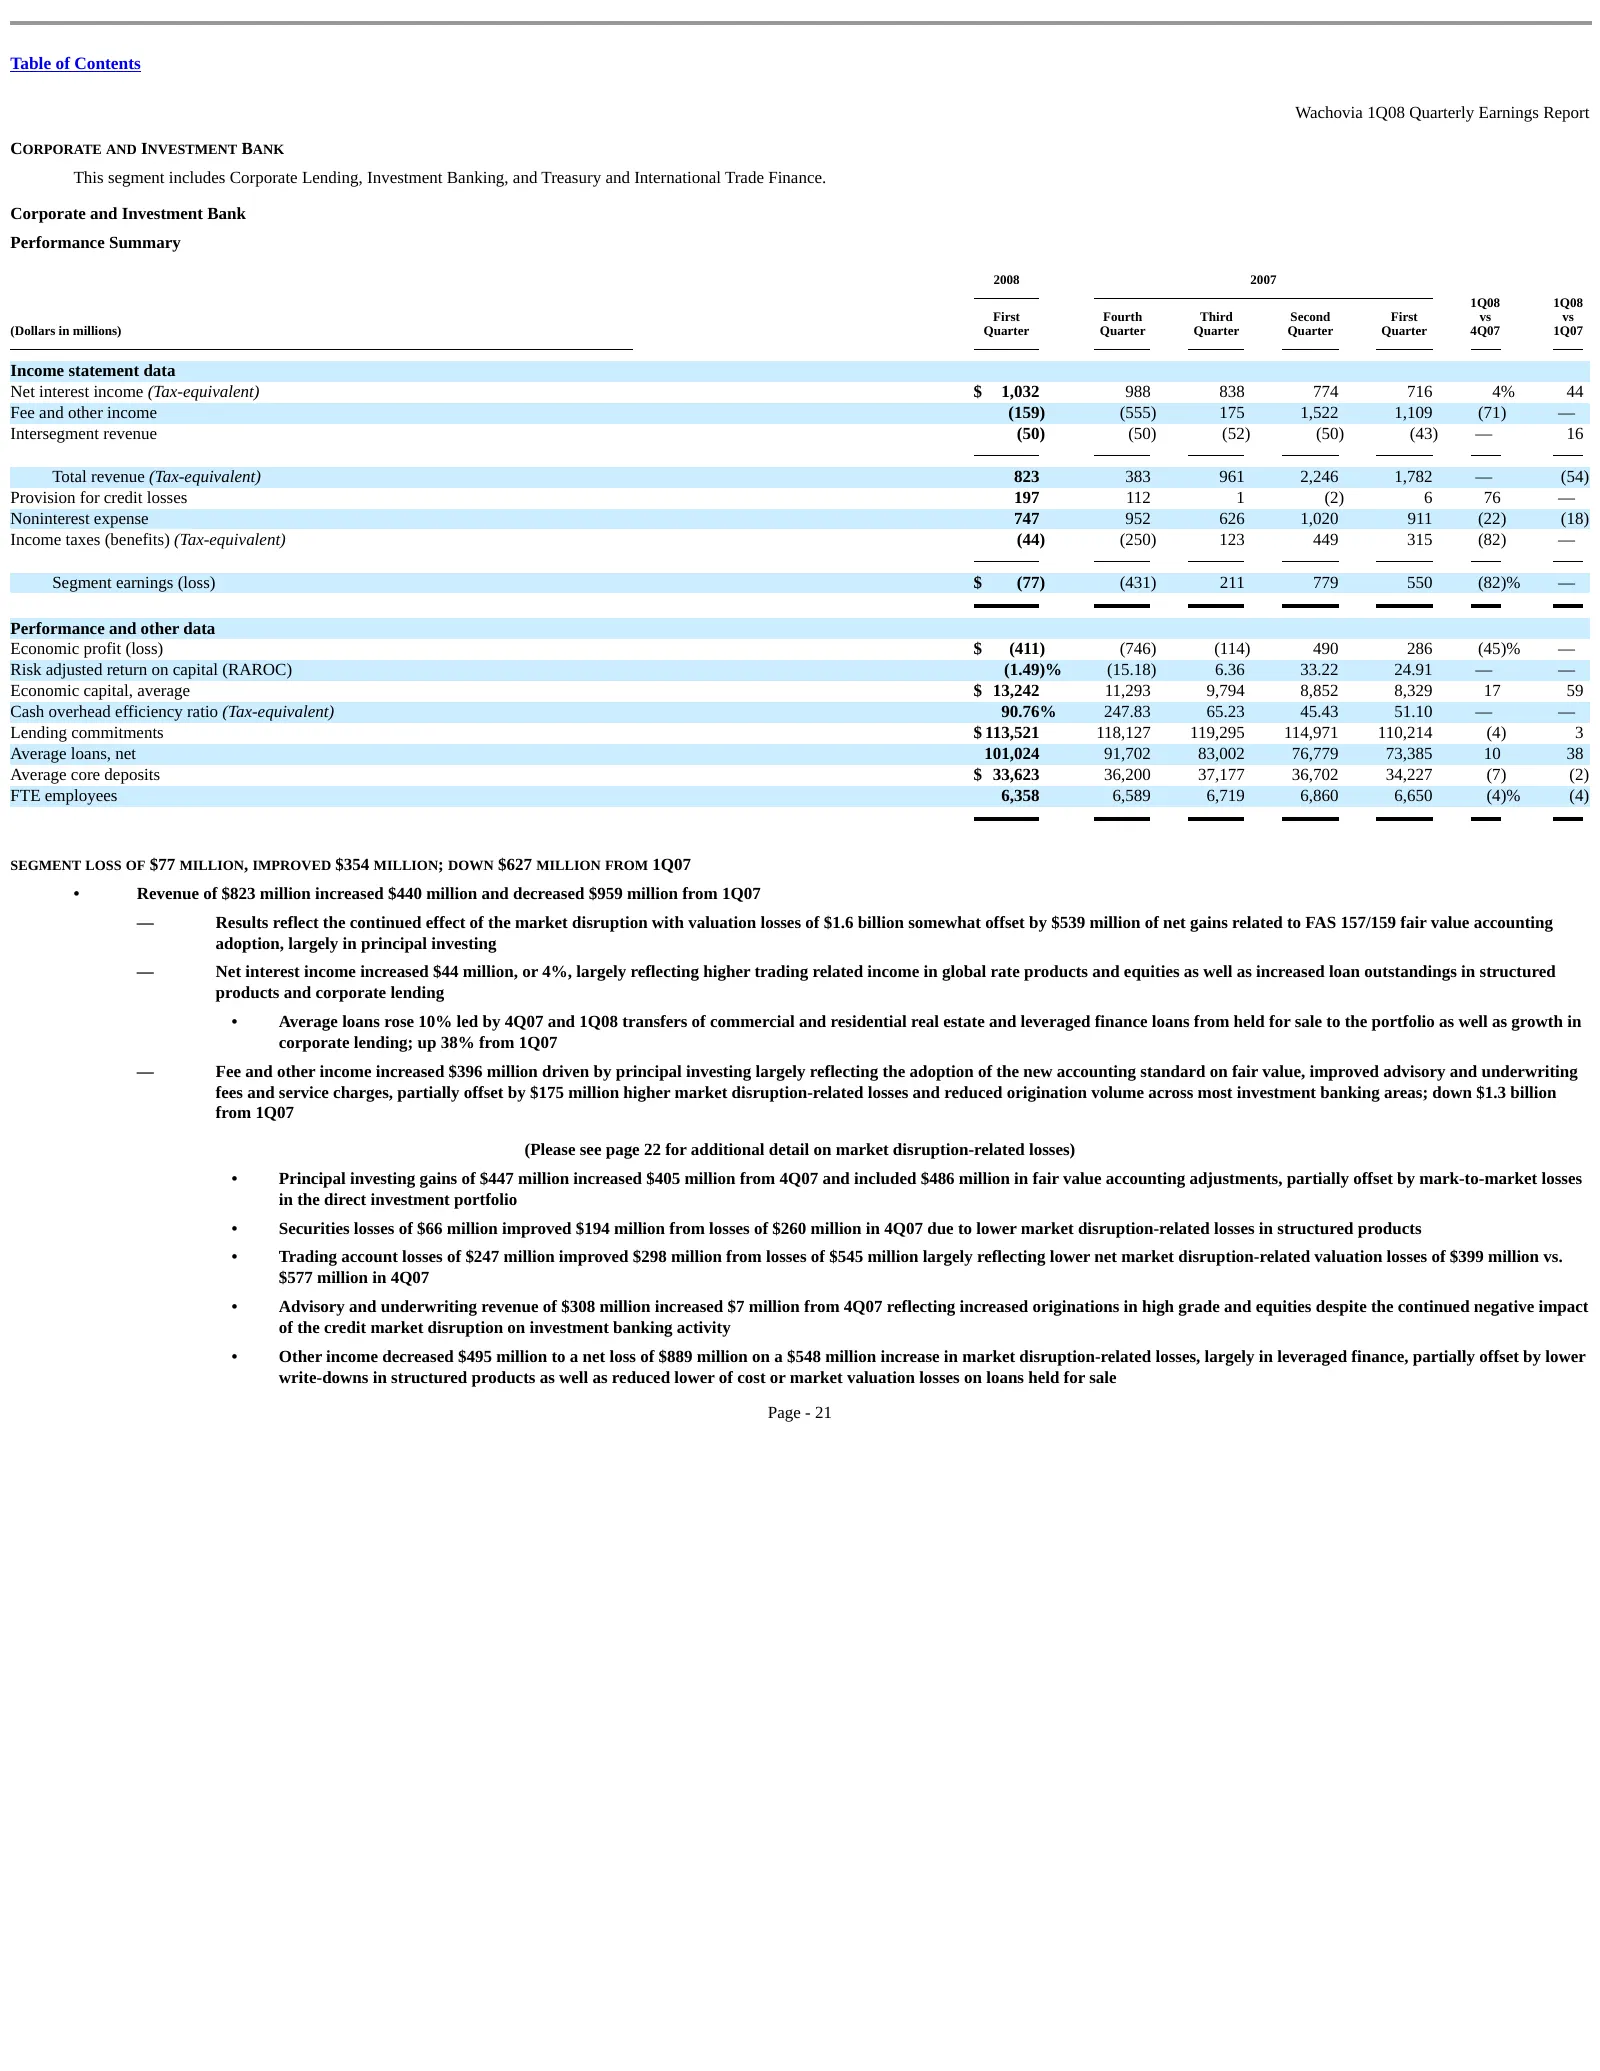
Table of Contents Wachovia 1Q08 Quarterly Earnings Report CORPORATE AND INVESTMENT BANK This segment includes Corporate Lending, Investment Banking, and Treasury and International Trade Finance. Corporate and Investment Bank Performance Summary 2008 2007 1Q08 1Q08 First Fourth Third Second First vs
Slide 90: Market disruption-related losses, net
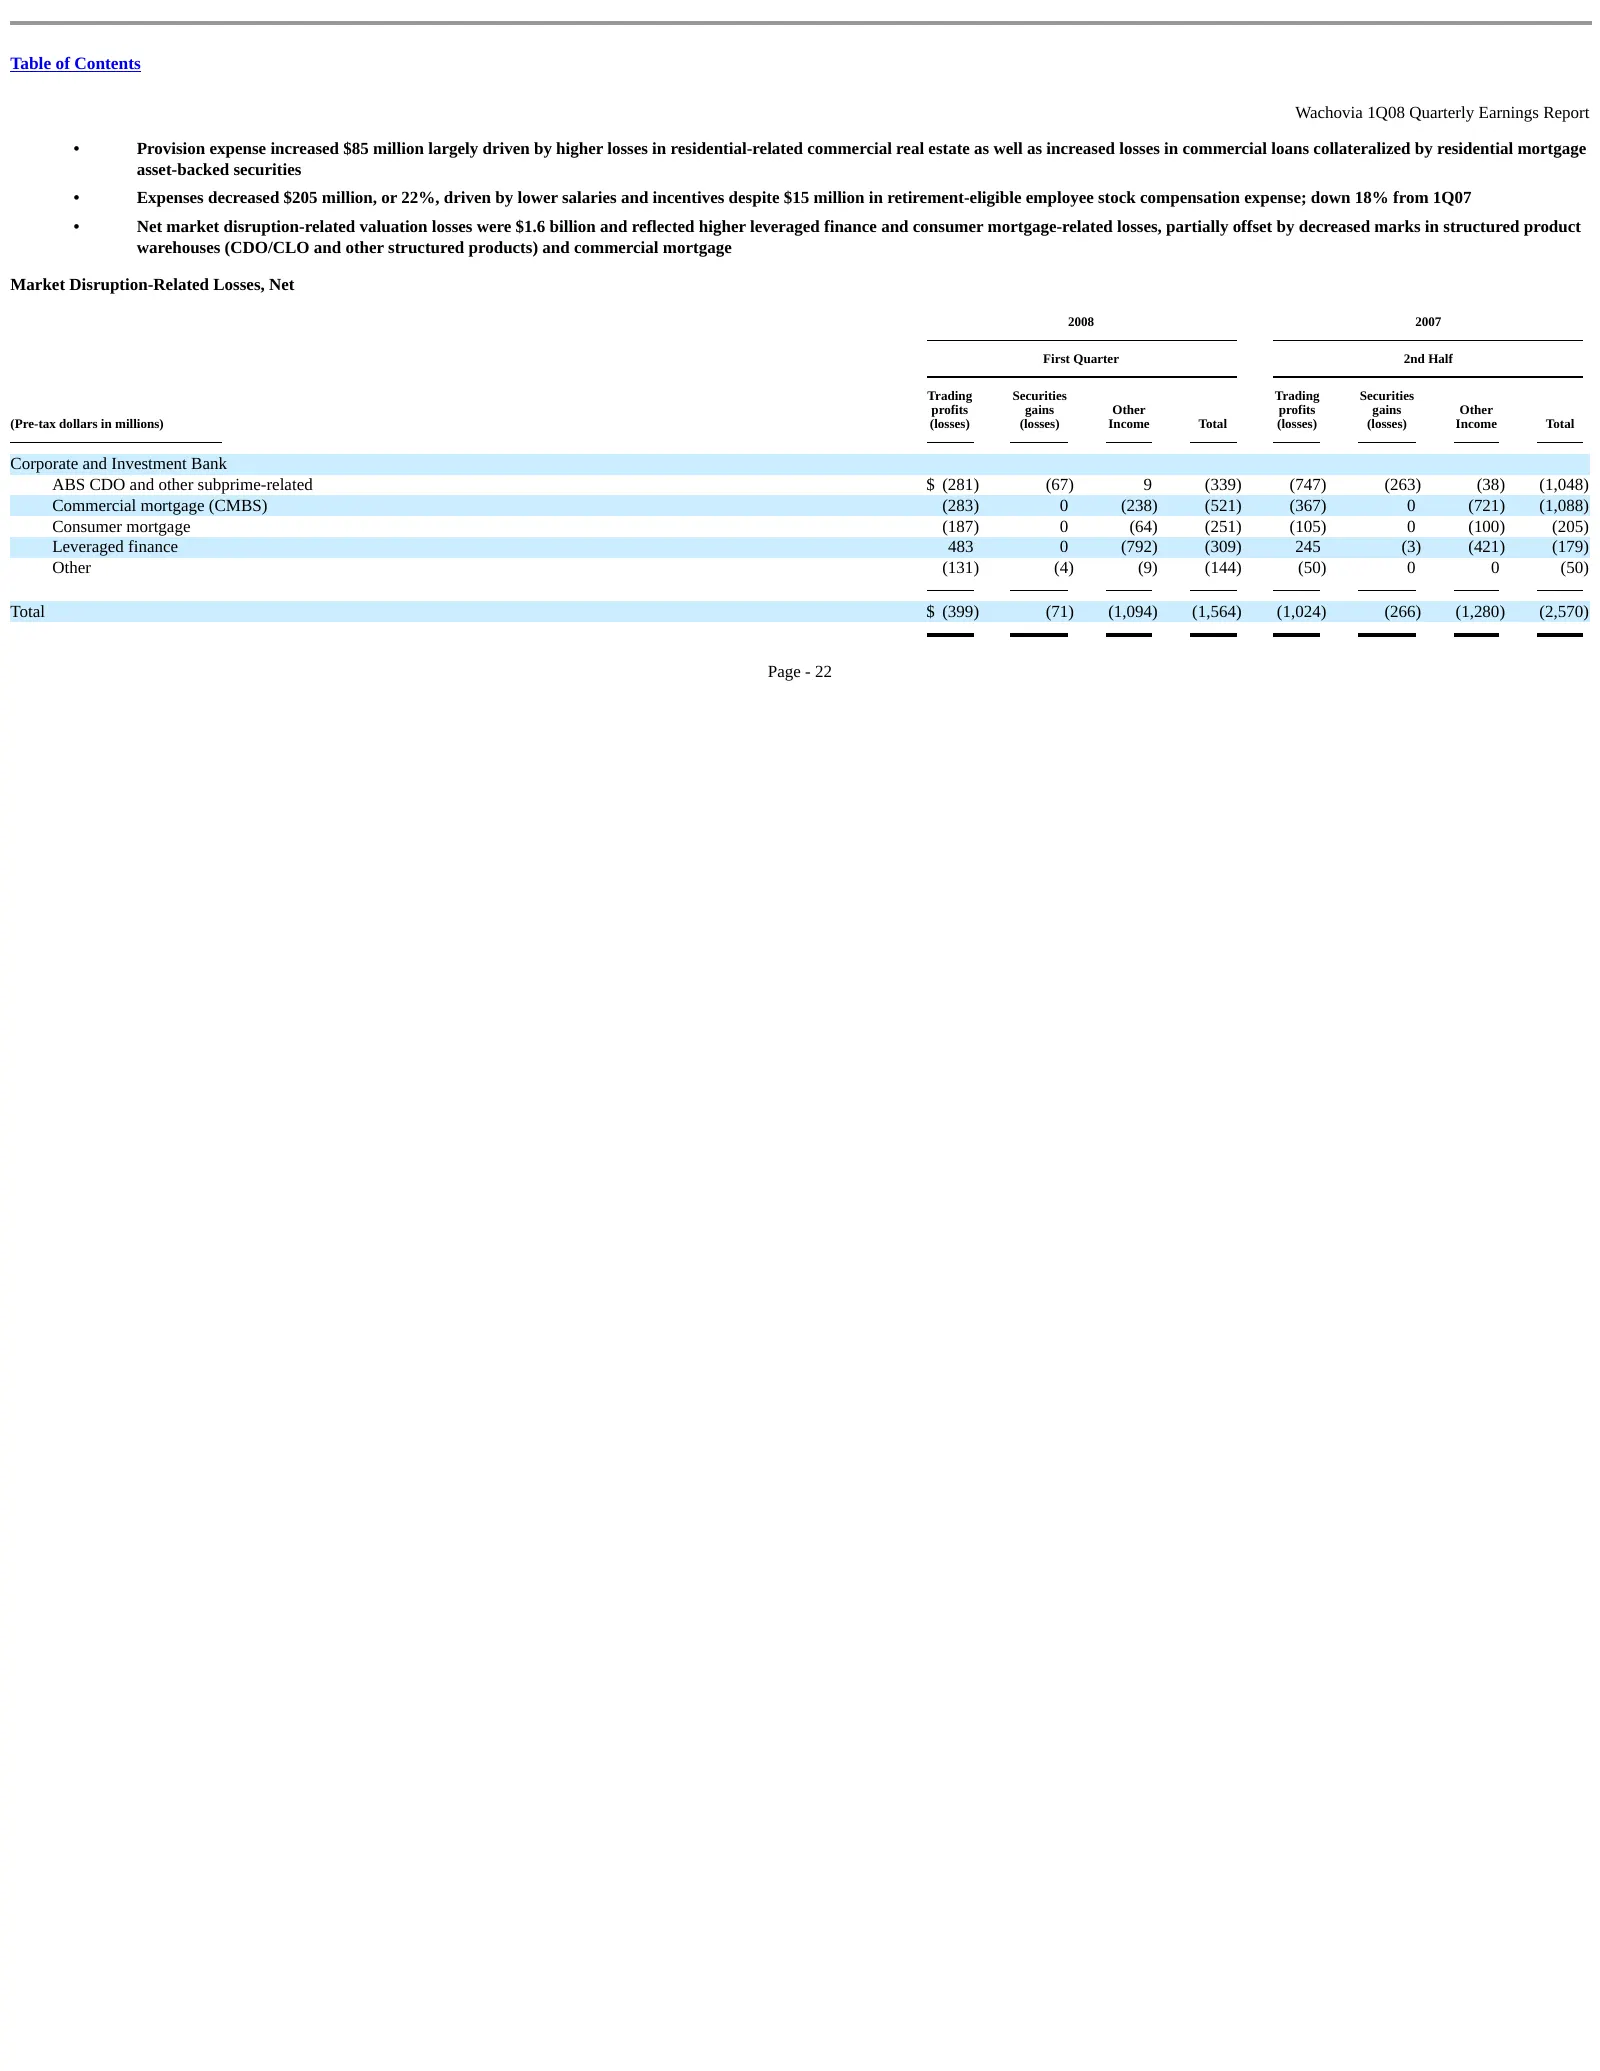
Table of Contents Wachovia 1Q08 Quarterly Earnings Report • Provision expense increased $85 million largely driven by higher losses in residential-related commercial real estate as well as increased losses in commercial loans collateralized by residential mortgage asset-backed securities • Expenses
Slide 91: Corporate Lending
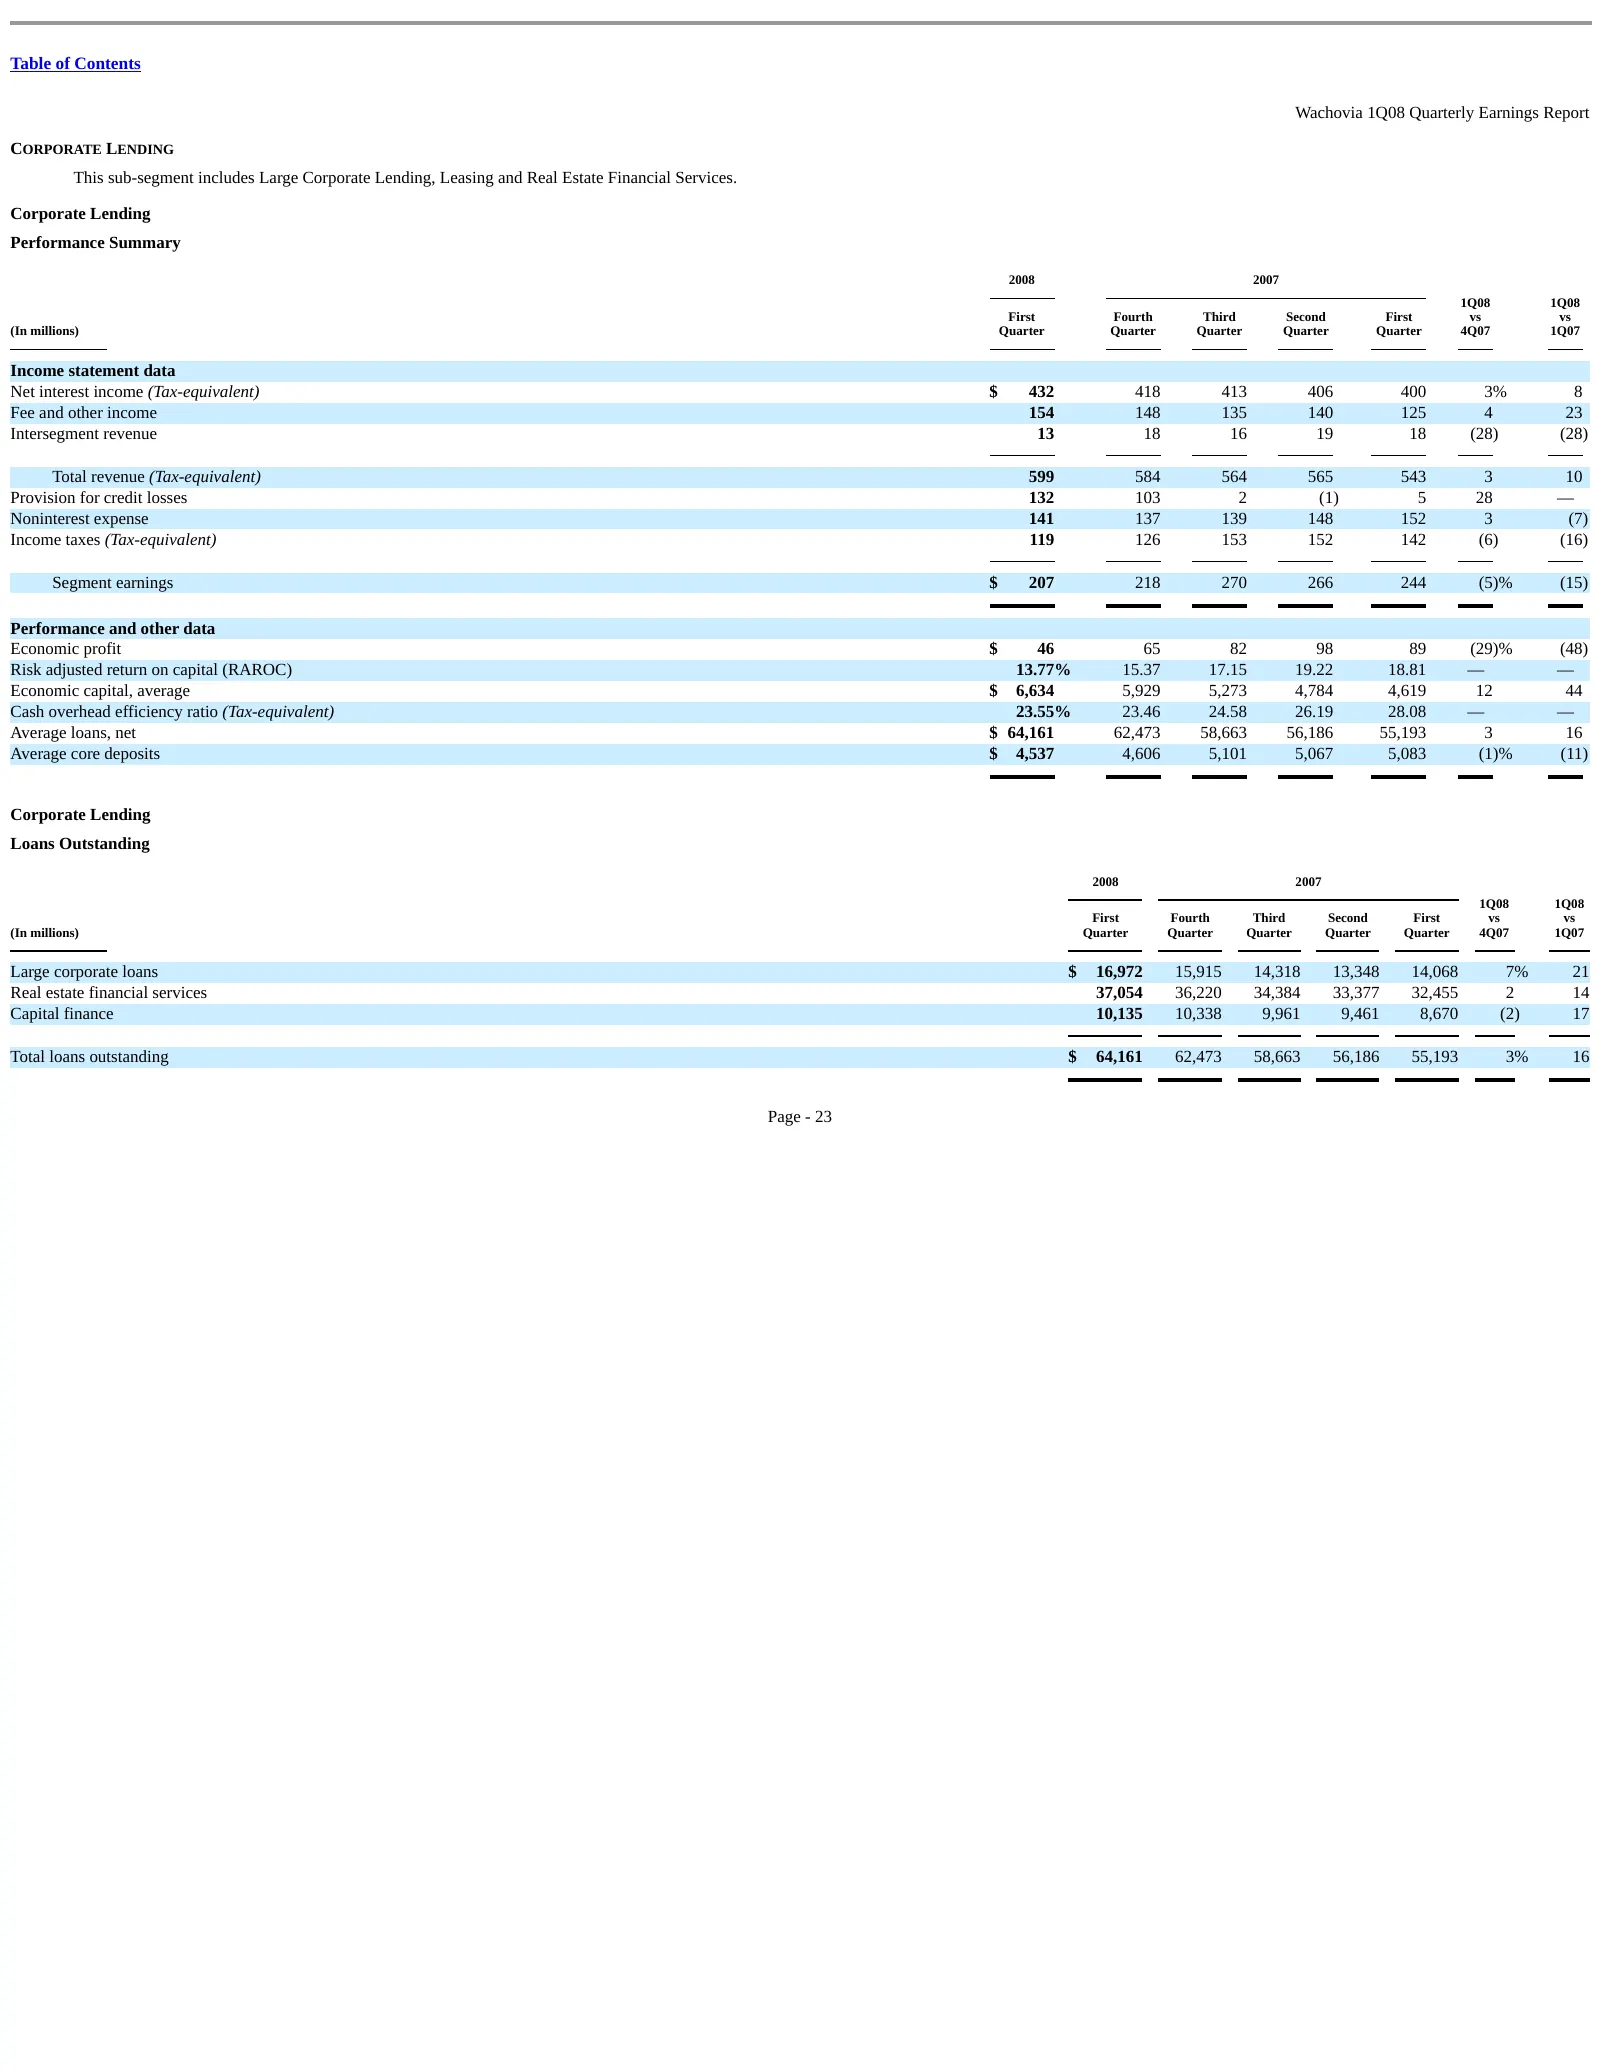
Table of Contents Wachovia 1Q08 Quarterly Earnings Report CORPORATE LENDING This sub-segment includes Large Corporate Lending, Leasing and Real Estate Financial Services. Corporate Lending Performance Summary 2008 2007 1Q08 1Q08 First Fourth Third Second First vs vs (In millions) Quarter Quarter Qua
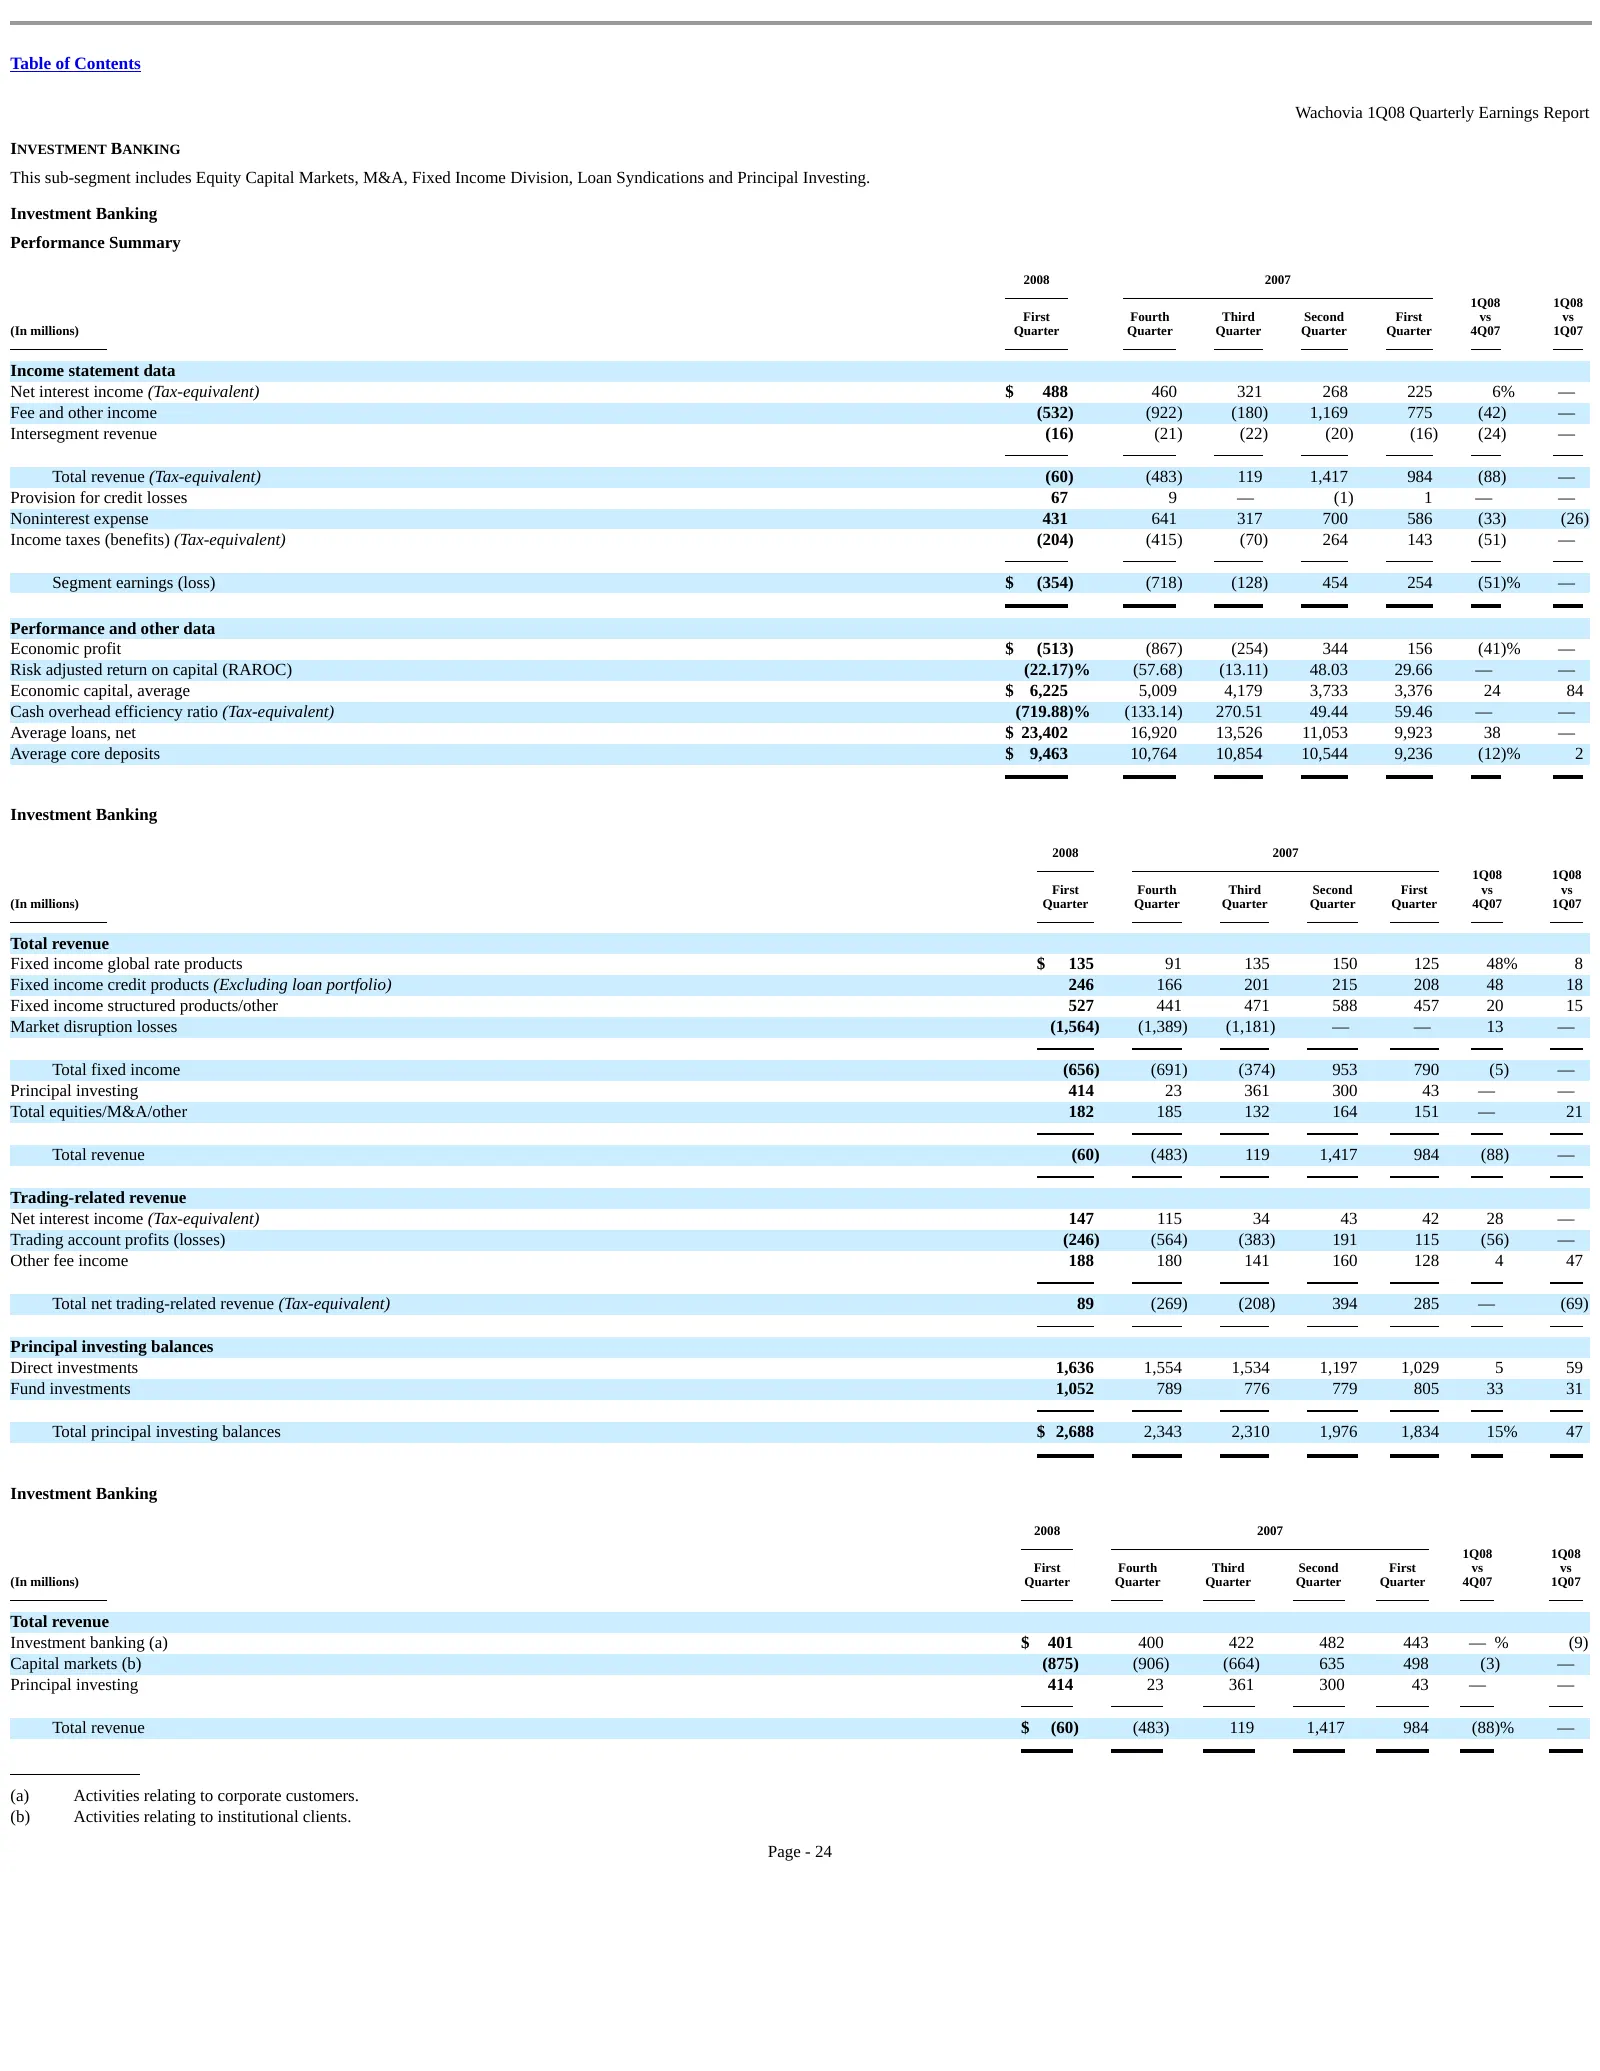
Slide 92: Investment Banking
Table of Contents Wachovia 1Q08 Quarterly Earnings Report INVESTMENT BANKING This sub-segment includes Equity Capital Markets, M&A, Fixed Income Division, Loan Syndications and Principal Investing. Investment Banking Performance Summary 2008 2007 1Q08 1Q08 First Fourth Third Second First vs vs (In m
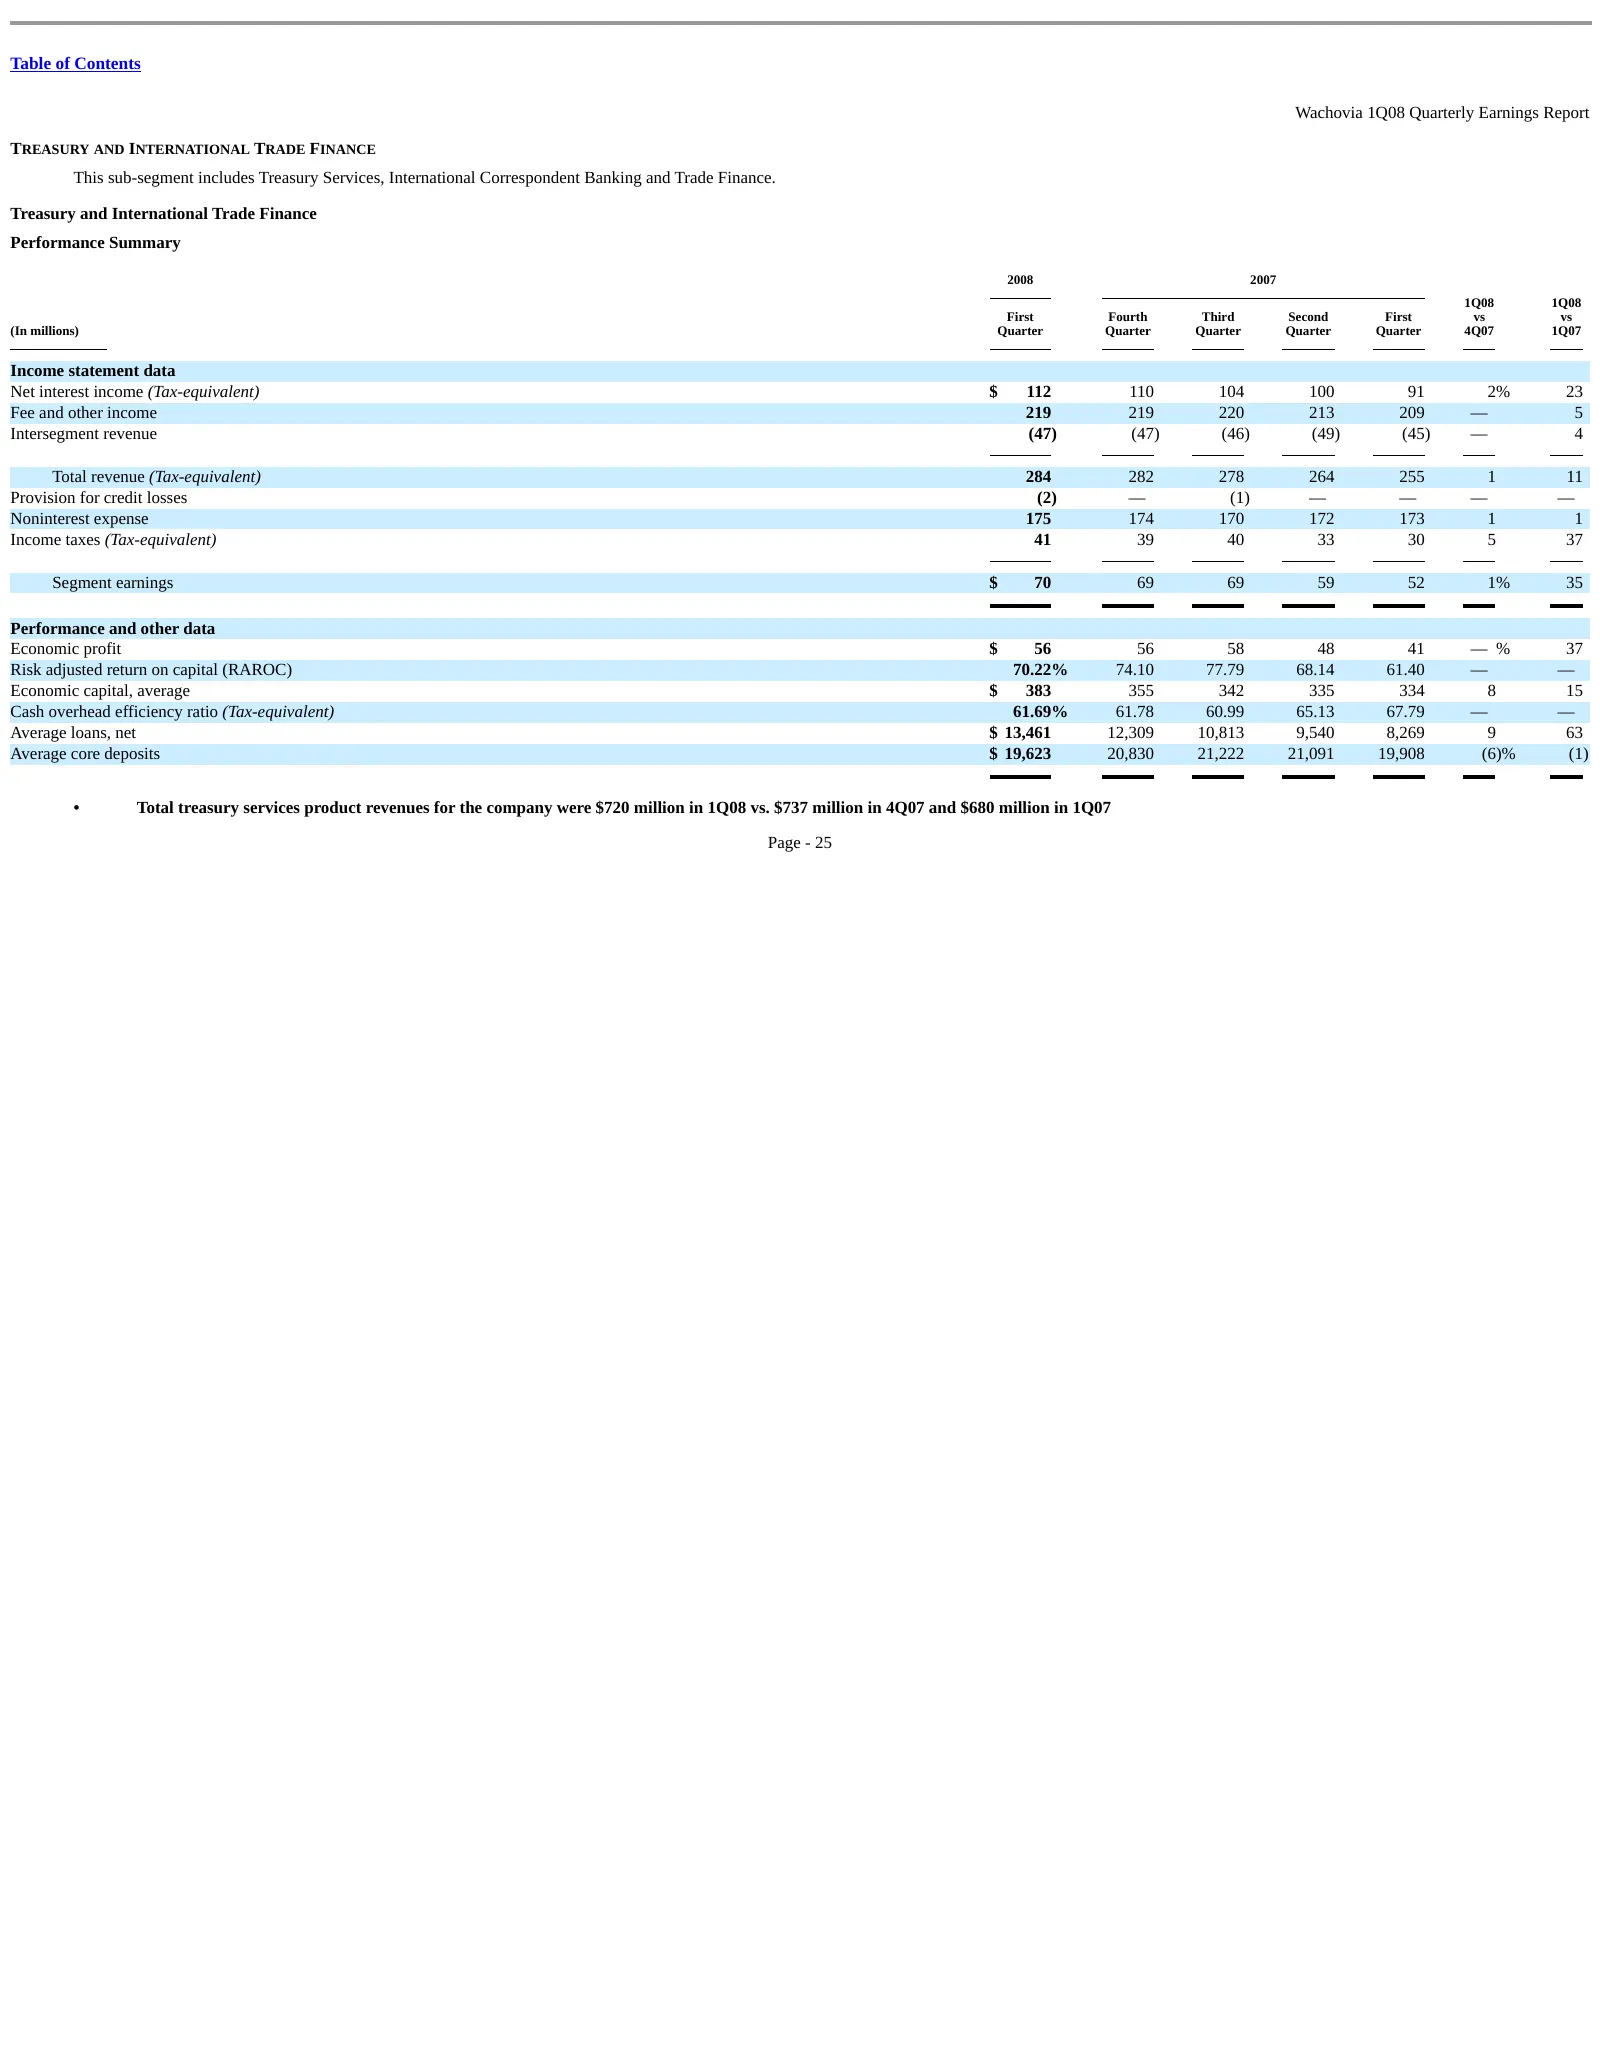
Slide 93: Treasury and International Trade Finance
Table of Contents Wachovia 1Q08 Quarterly Earnings Report TREASURY AND INTERNATIONAL TRADE FINANCE This sub-segment includes Treasury Services, International Correspondent Banking and Trade Finance. Treasury and International Trade Finance Performance Summary 2008 2007 1Q08 1Q08 First Fourth Third S
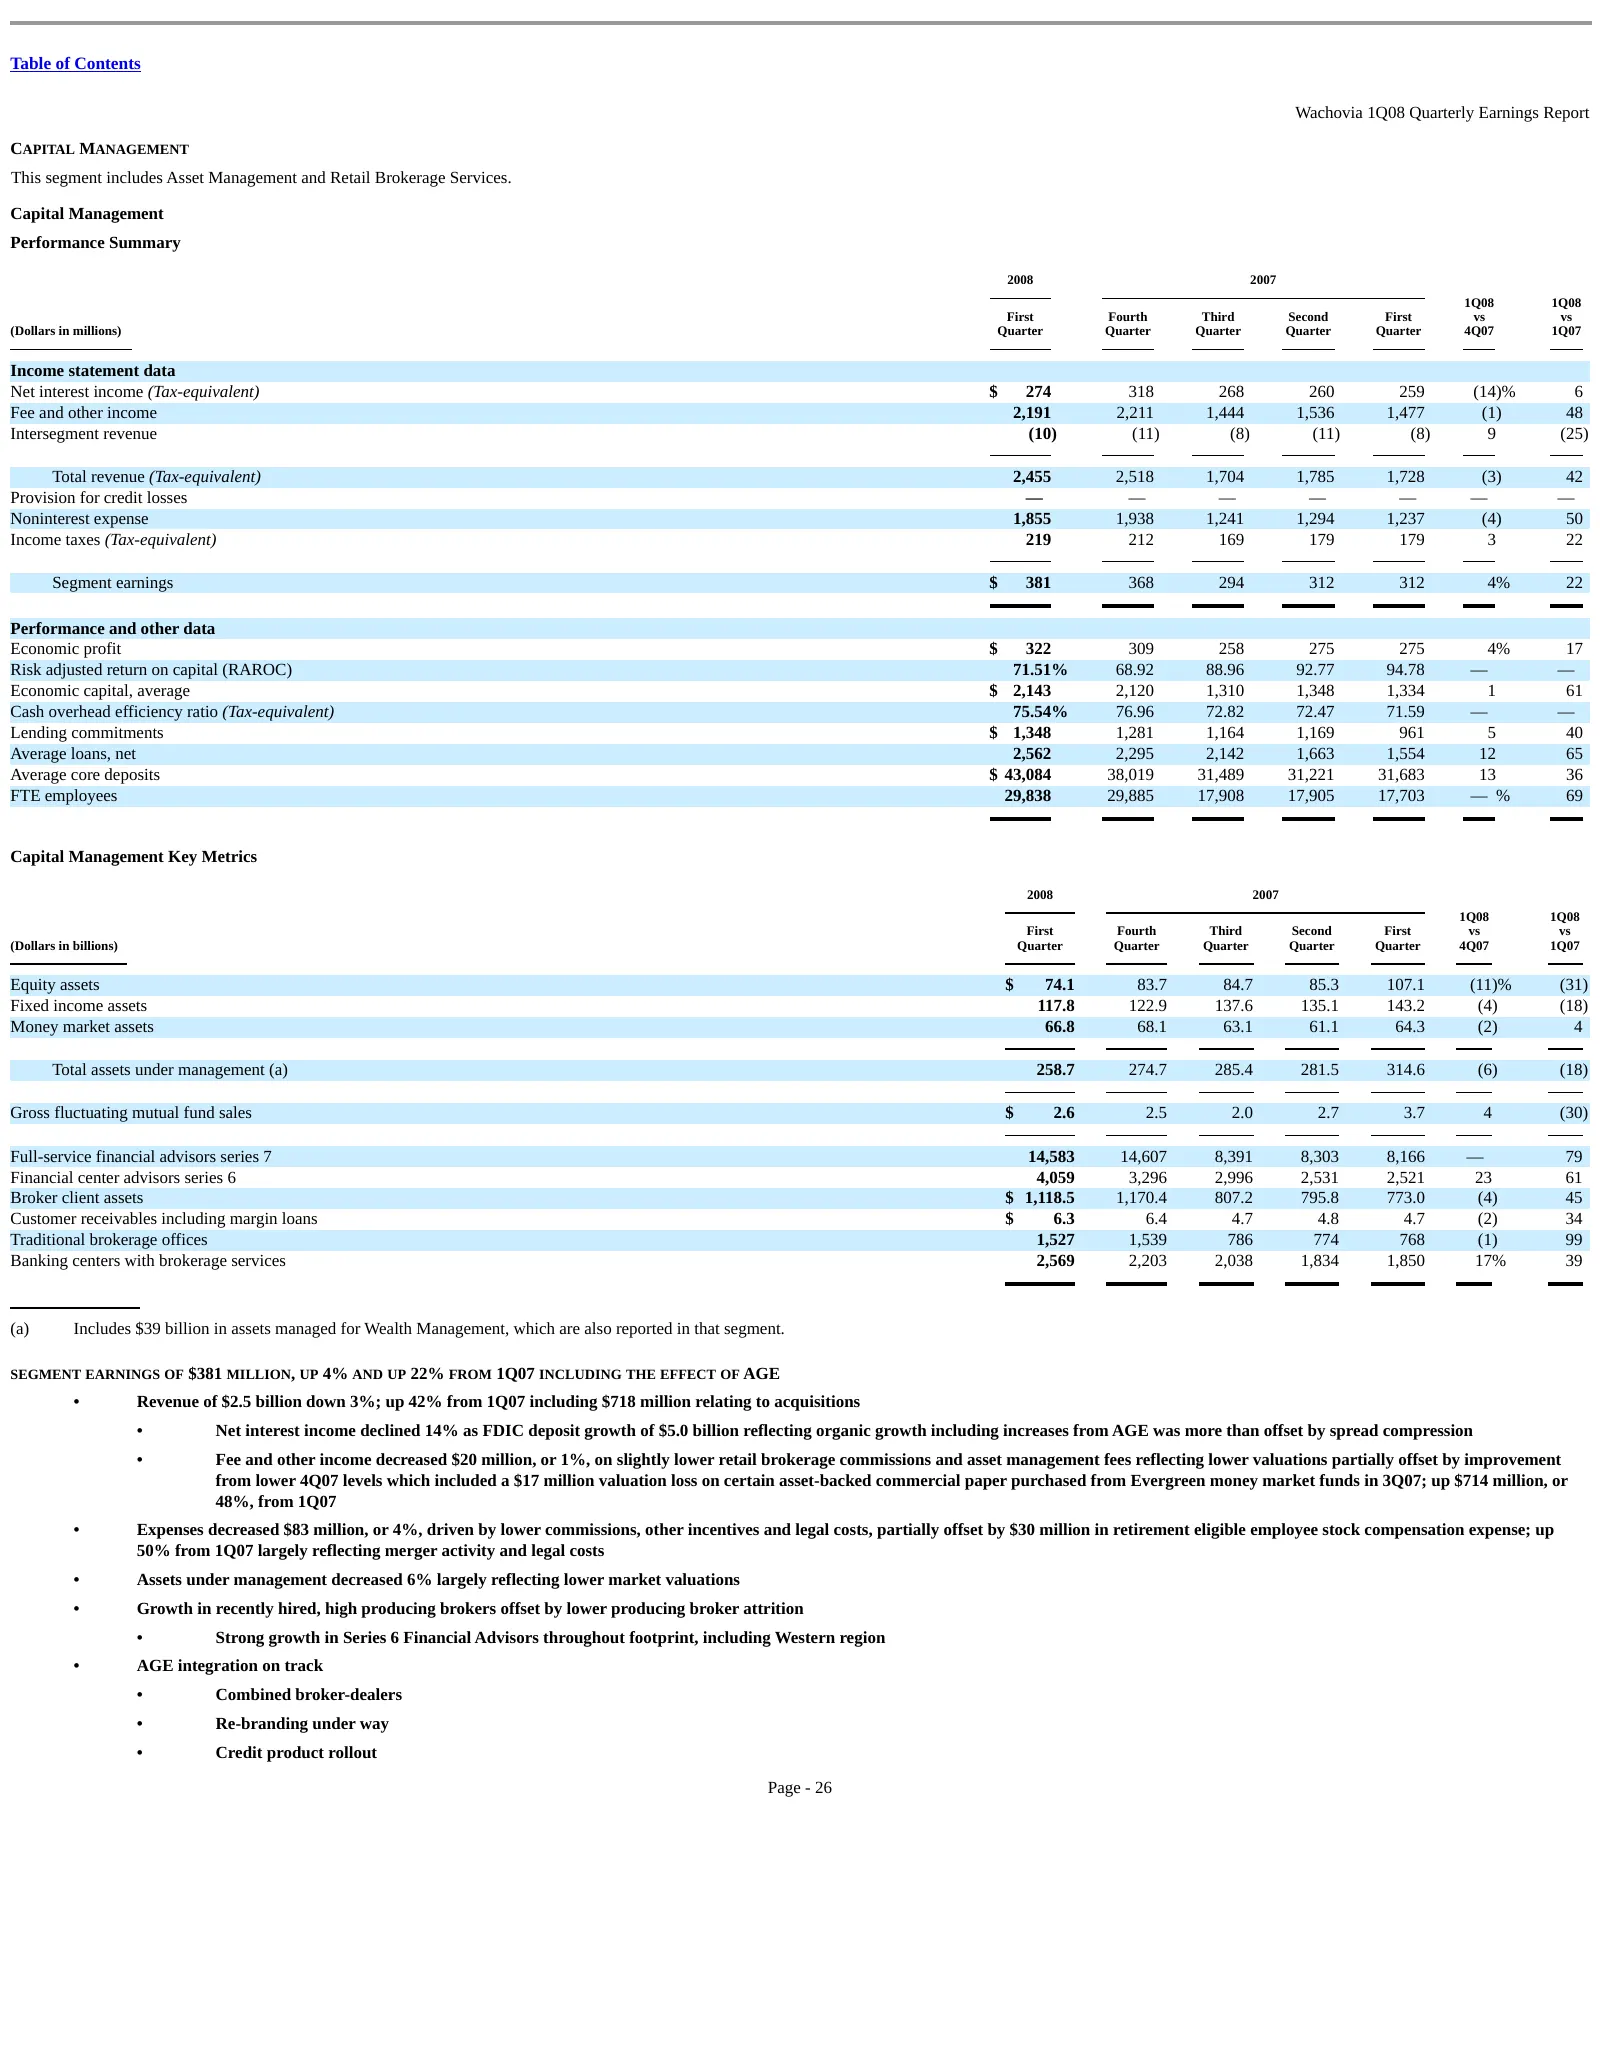
Slide 94: Capital Management
Table of Contents Wachovia 1Q08 Quarterly Earnings Report CAPITAL MANAGEMENT This segment includes Asset Management and Retail Brokerage Services. Capital Management Performance Summary 2008 2007 1Q08 1Q08 First Fourth Third Second First vs vs (Dollars in millions) Quarter Quarter Quarter Quarter Qu
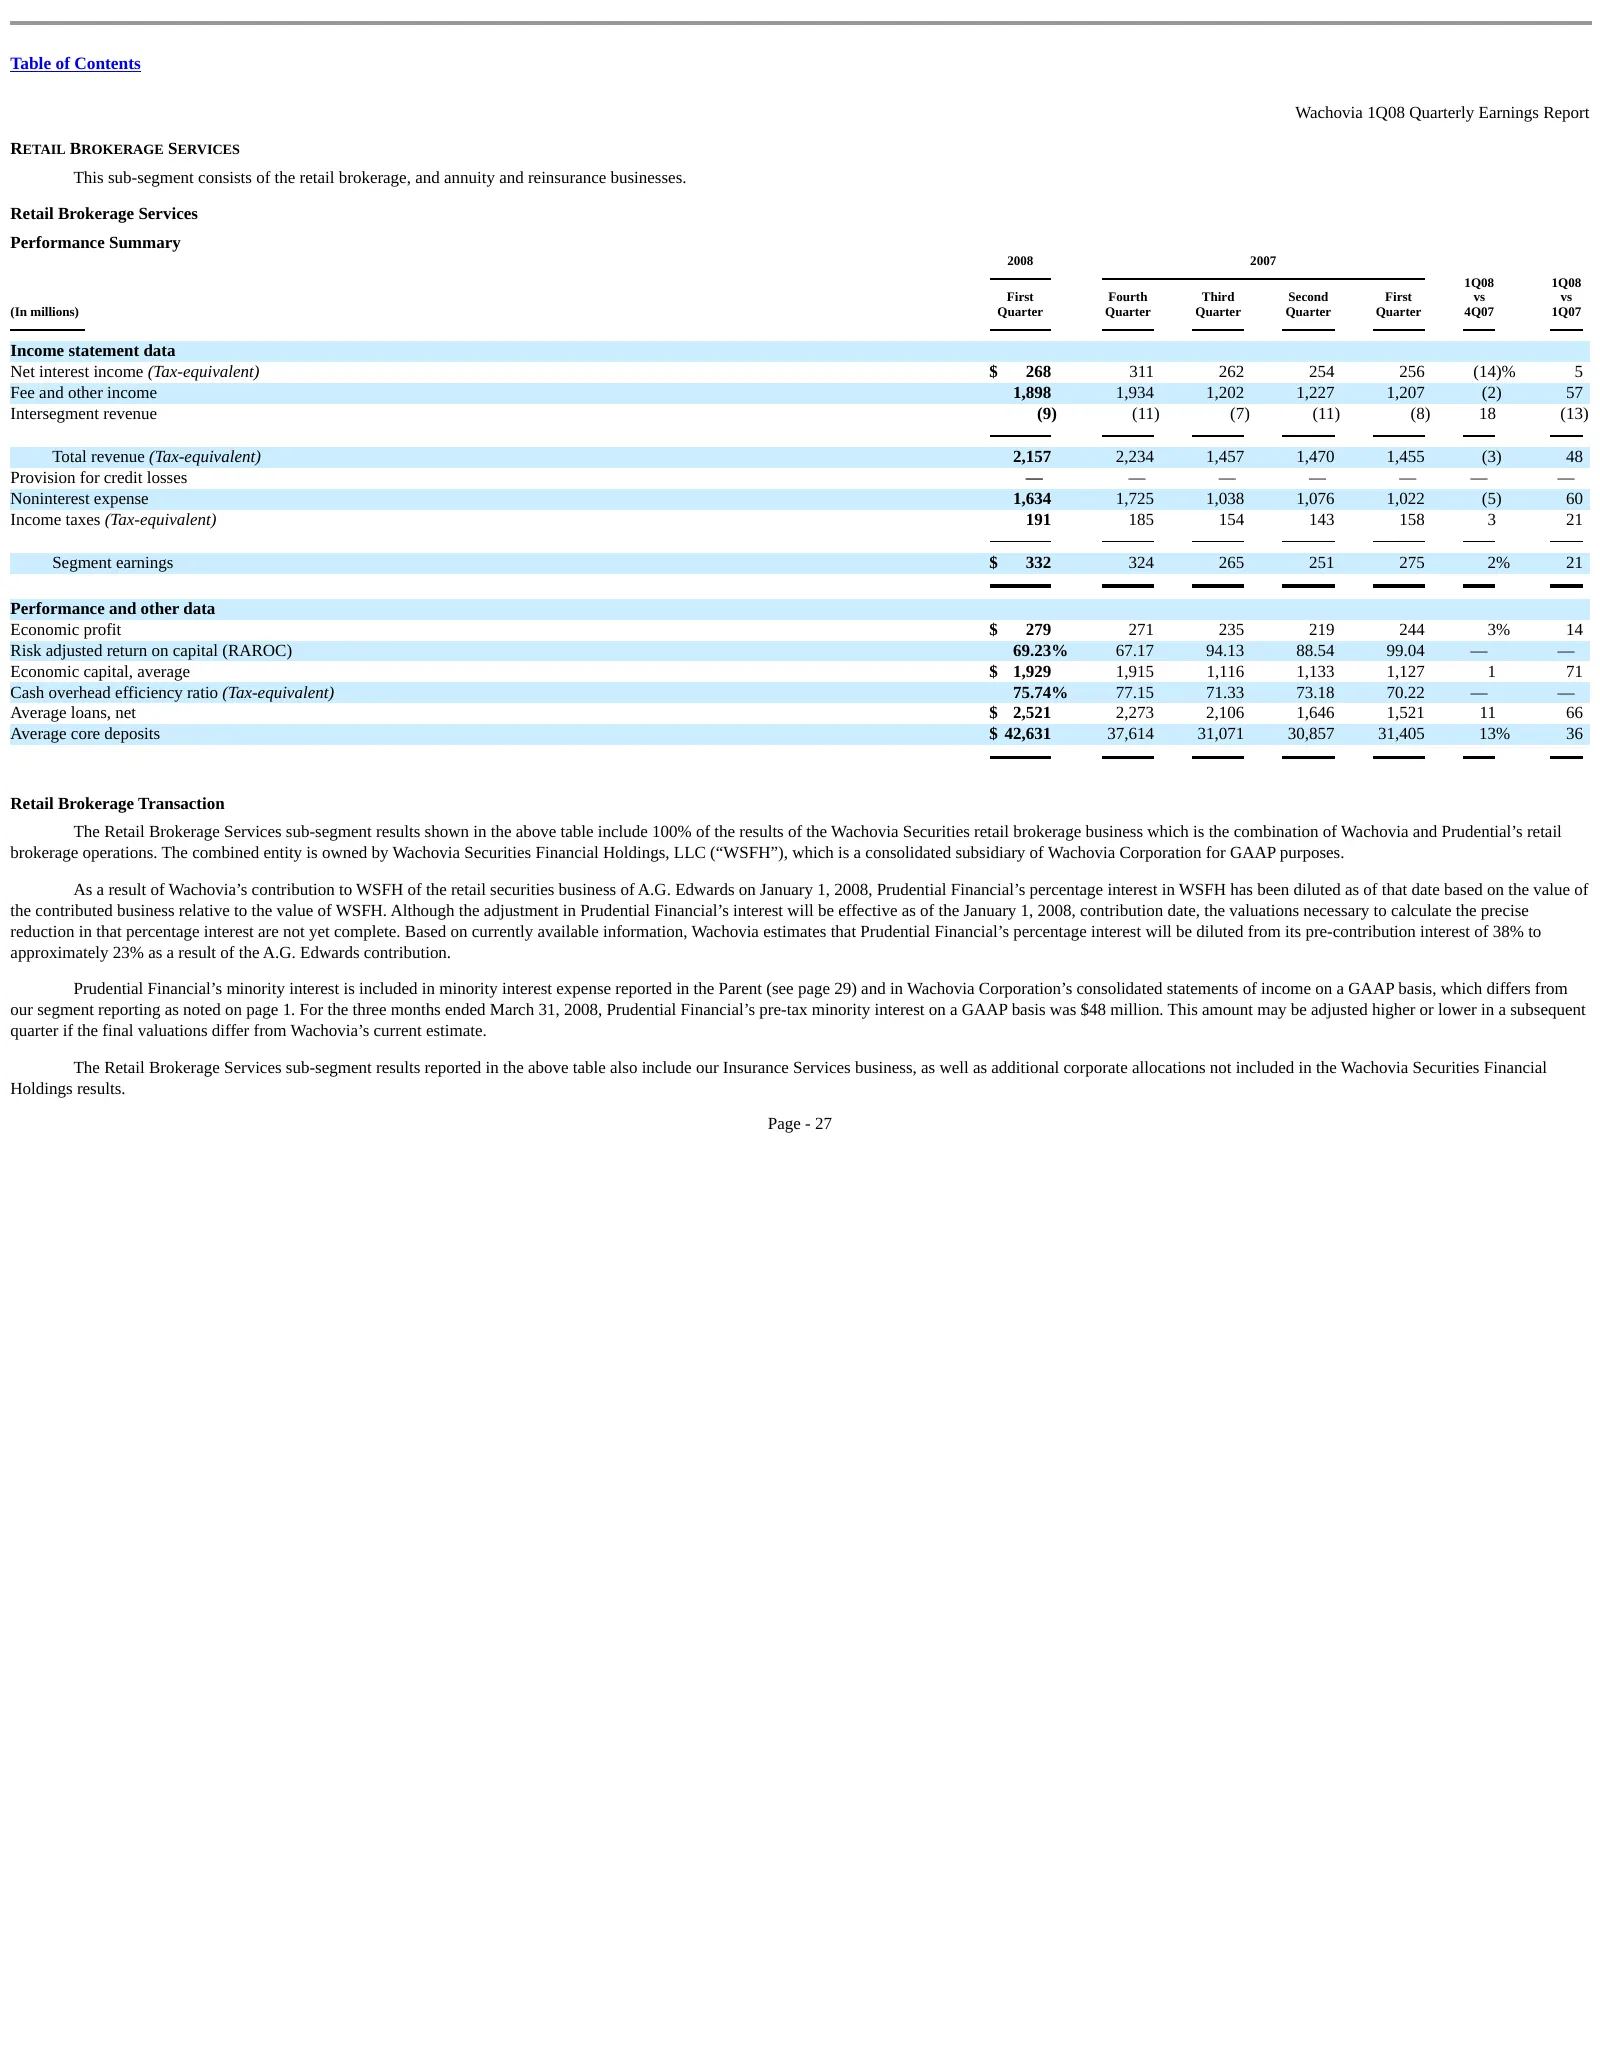
Slide 95: Retail Brokerage Services
Table of Contents Wachovia 1Q08 Quarterly Earnings Report RETAIL BROKERAGE SERVICES This sub-segment consists of the retail brokerage, and annuity and reinsurance businesses. Retail Brokerage Services Performance Summary 2008 2007 1Q08 1Q08 First Fourth Third Second First vs vs (In millions) Quarter
Slide 96: Asset Management
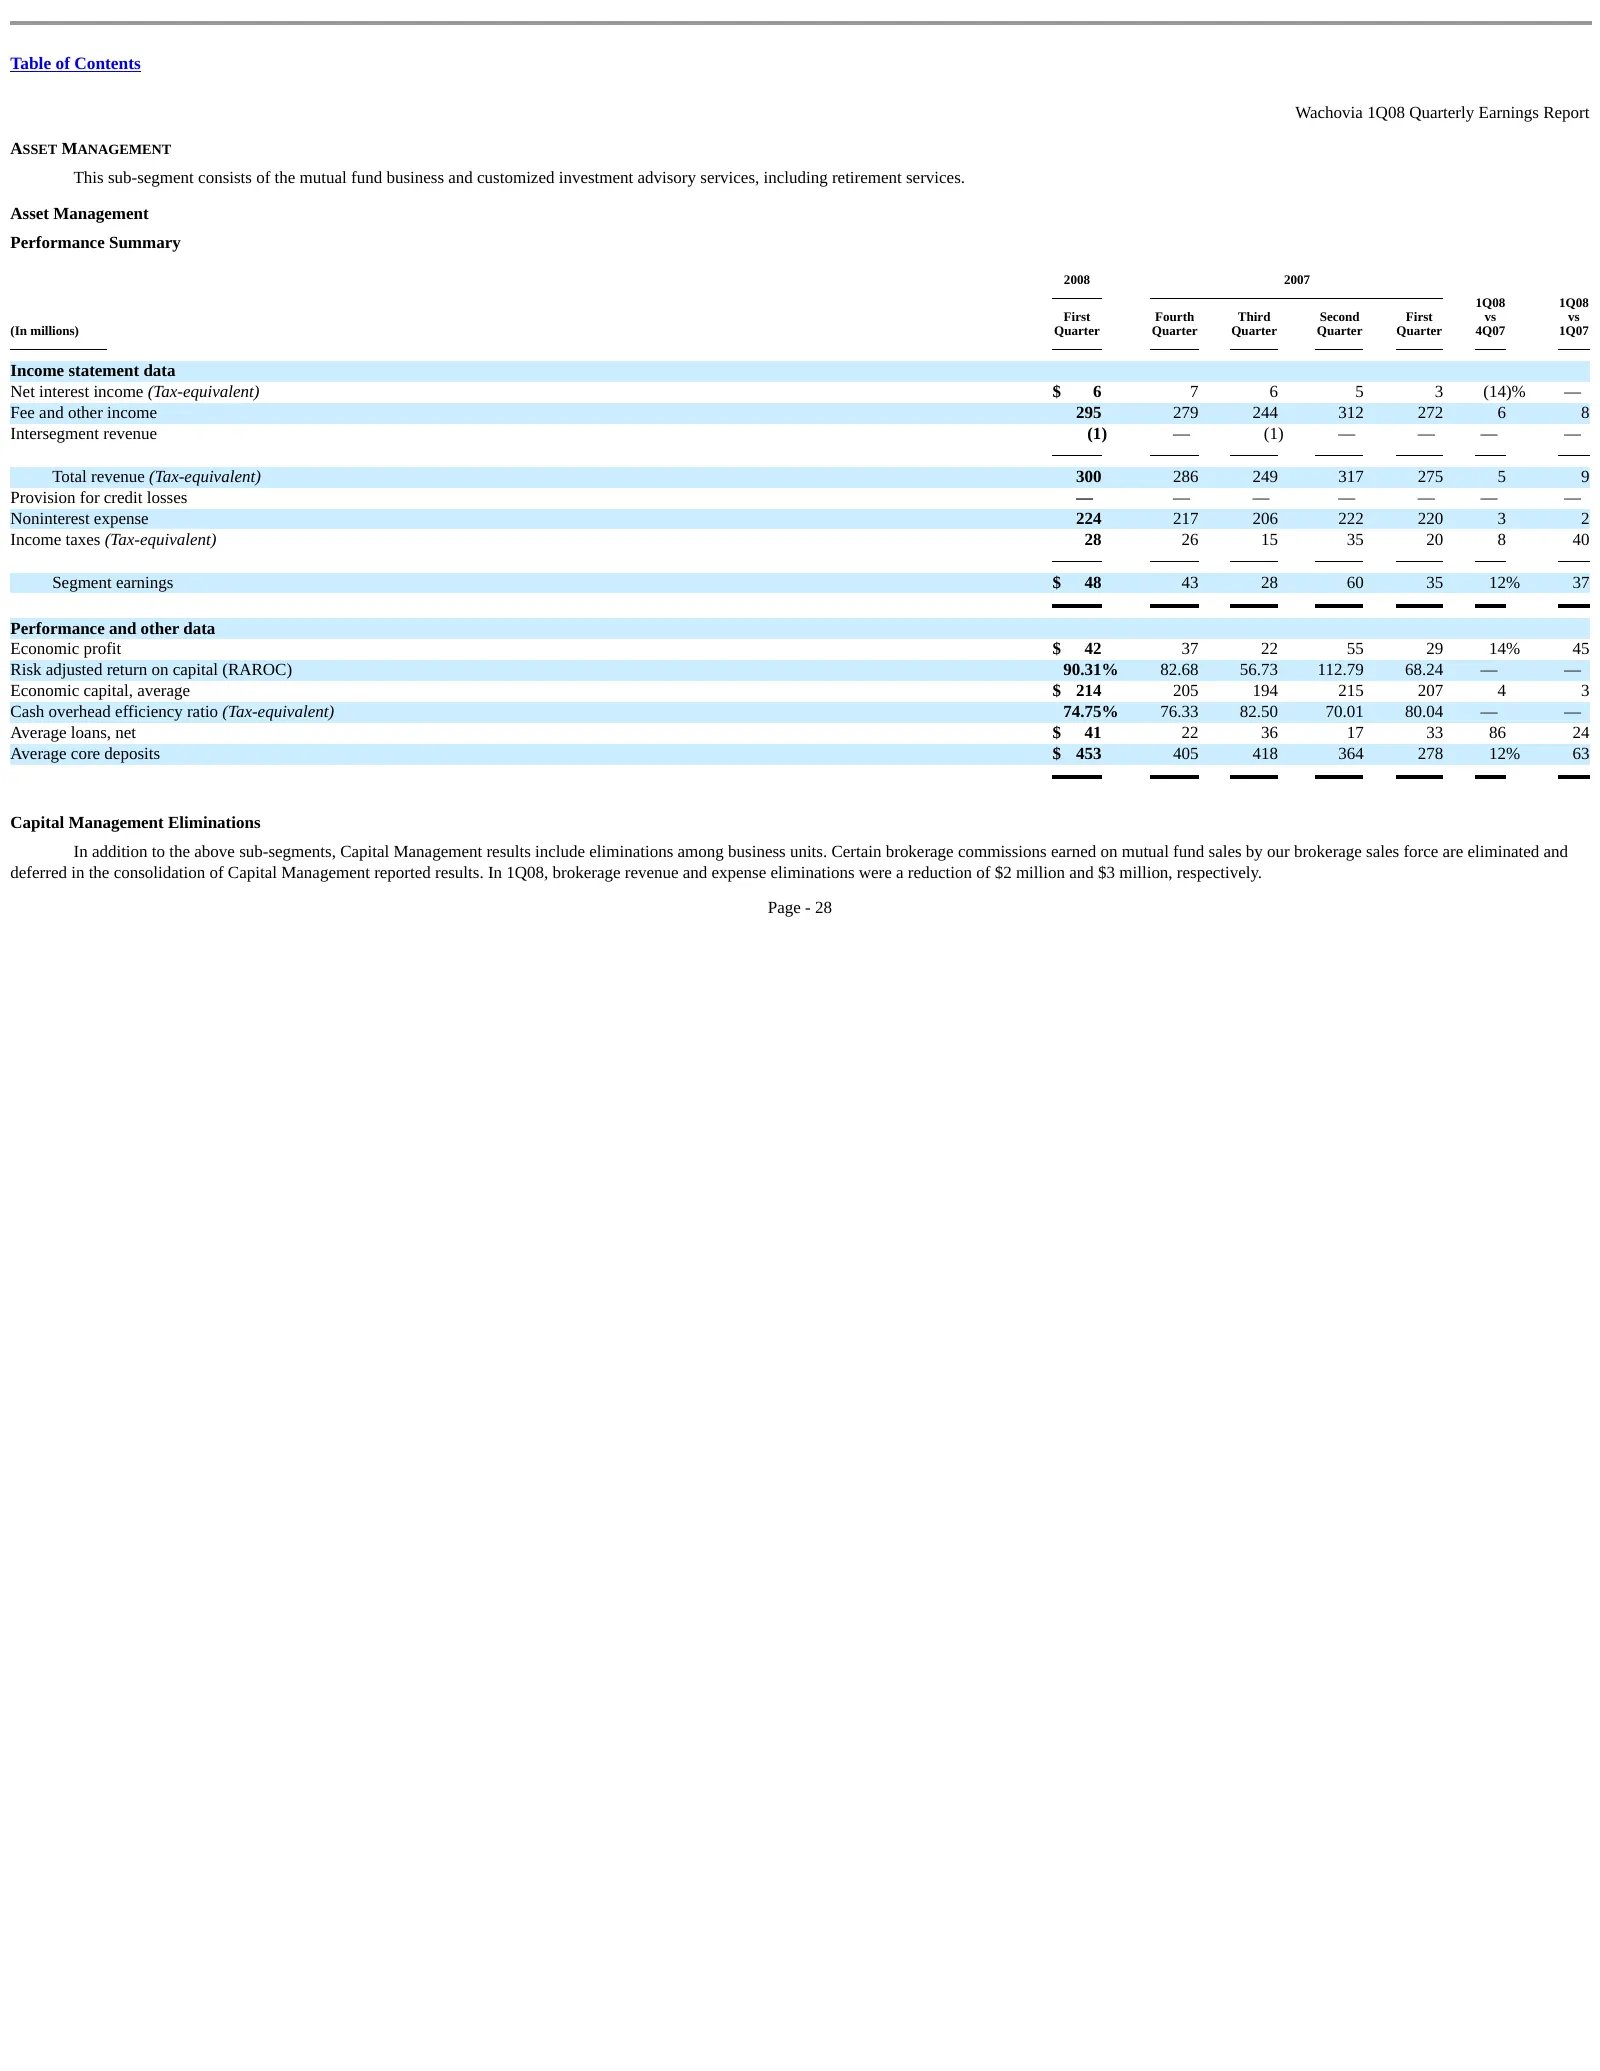
Table of Contents Wachovia 1Q08 Quarterly Earnings Report ASSET MANAGEMENT This sub-segment consists of the mutual fund business and customized investment advisory services, including retirement services. Asset Management Performance Summary 2008 2007 1Q08 1Q08 First Fourth Third Second First vs vs
Slide 97: Parent
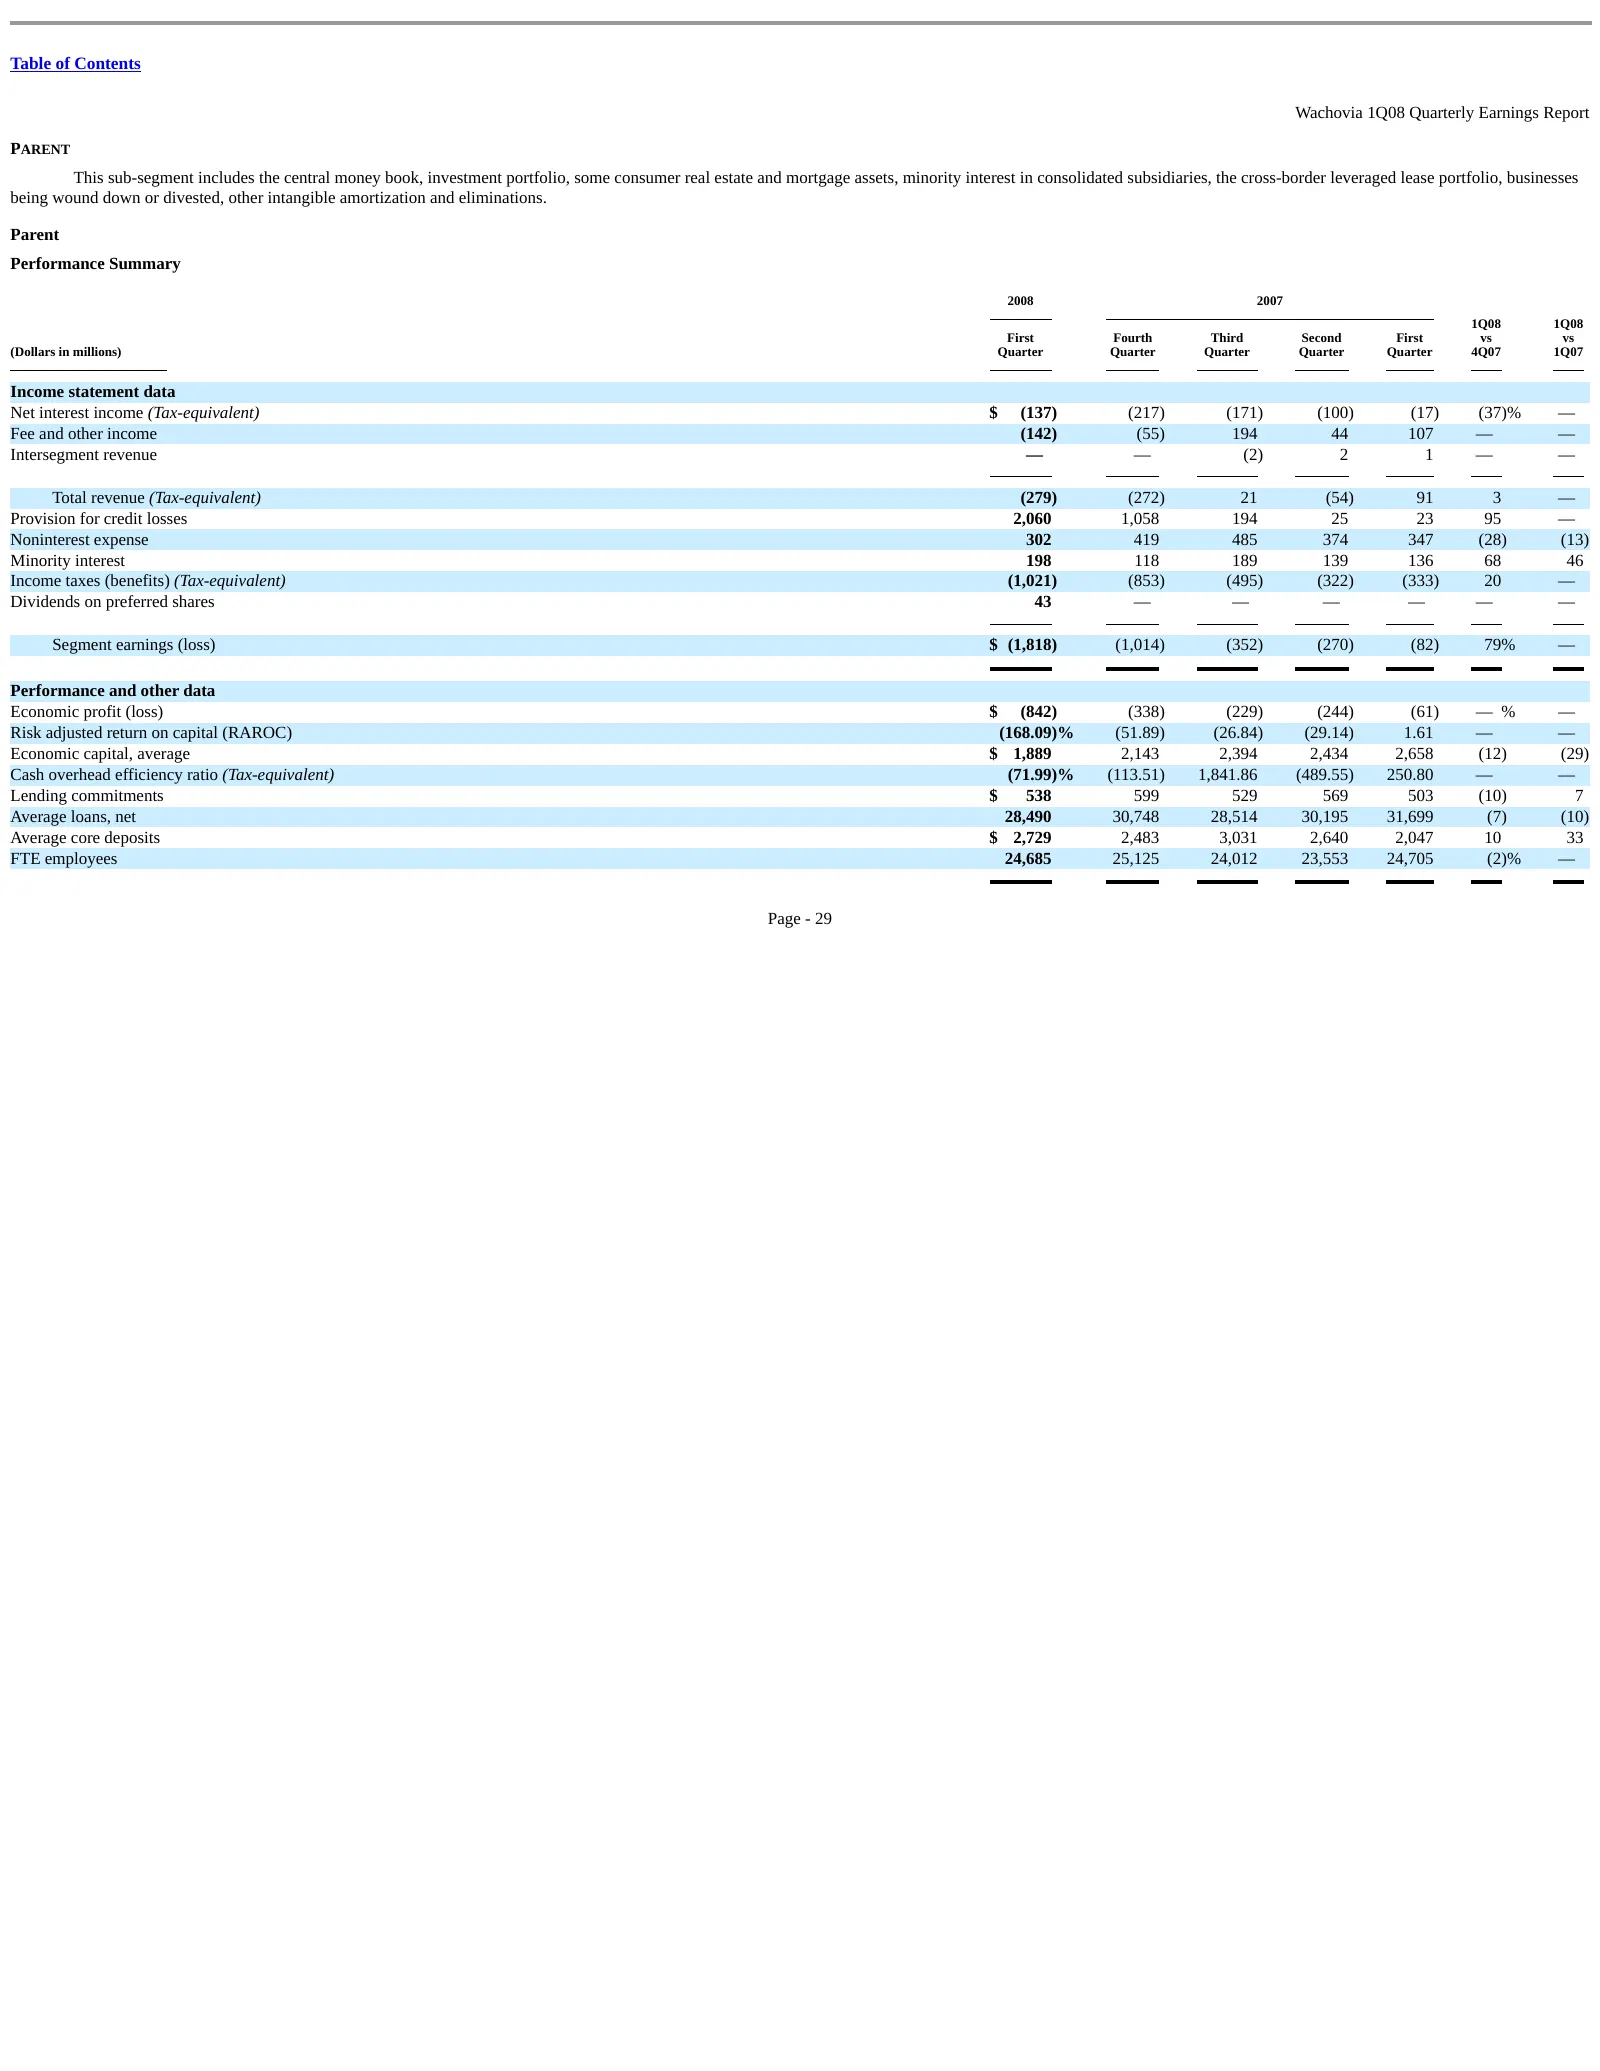
Table of Contents Wachovia 1Q08 Quarterly Earnings Report PARENT This sub-segment includes the central money book, investment portfolio, some consumer real estate and mortgage assets, minority interest in consolidated subsidiaries, the cross-border leveraged lease portfolio, businesses being wound d
Slide 98: Merger-Related and Restructuring Expenses
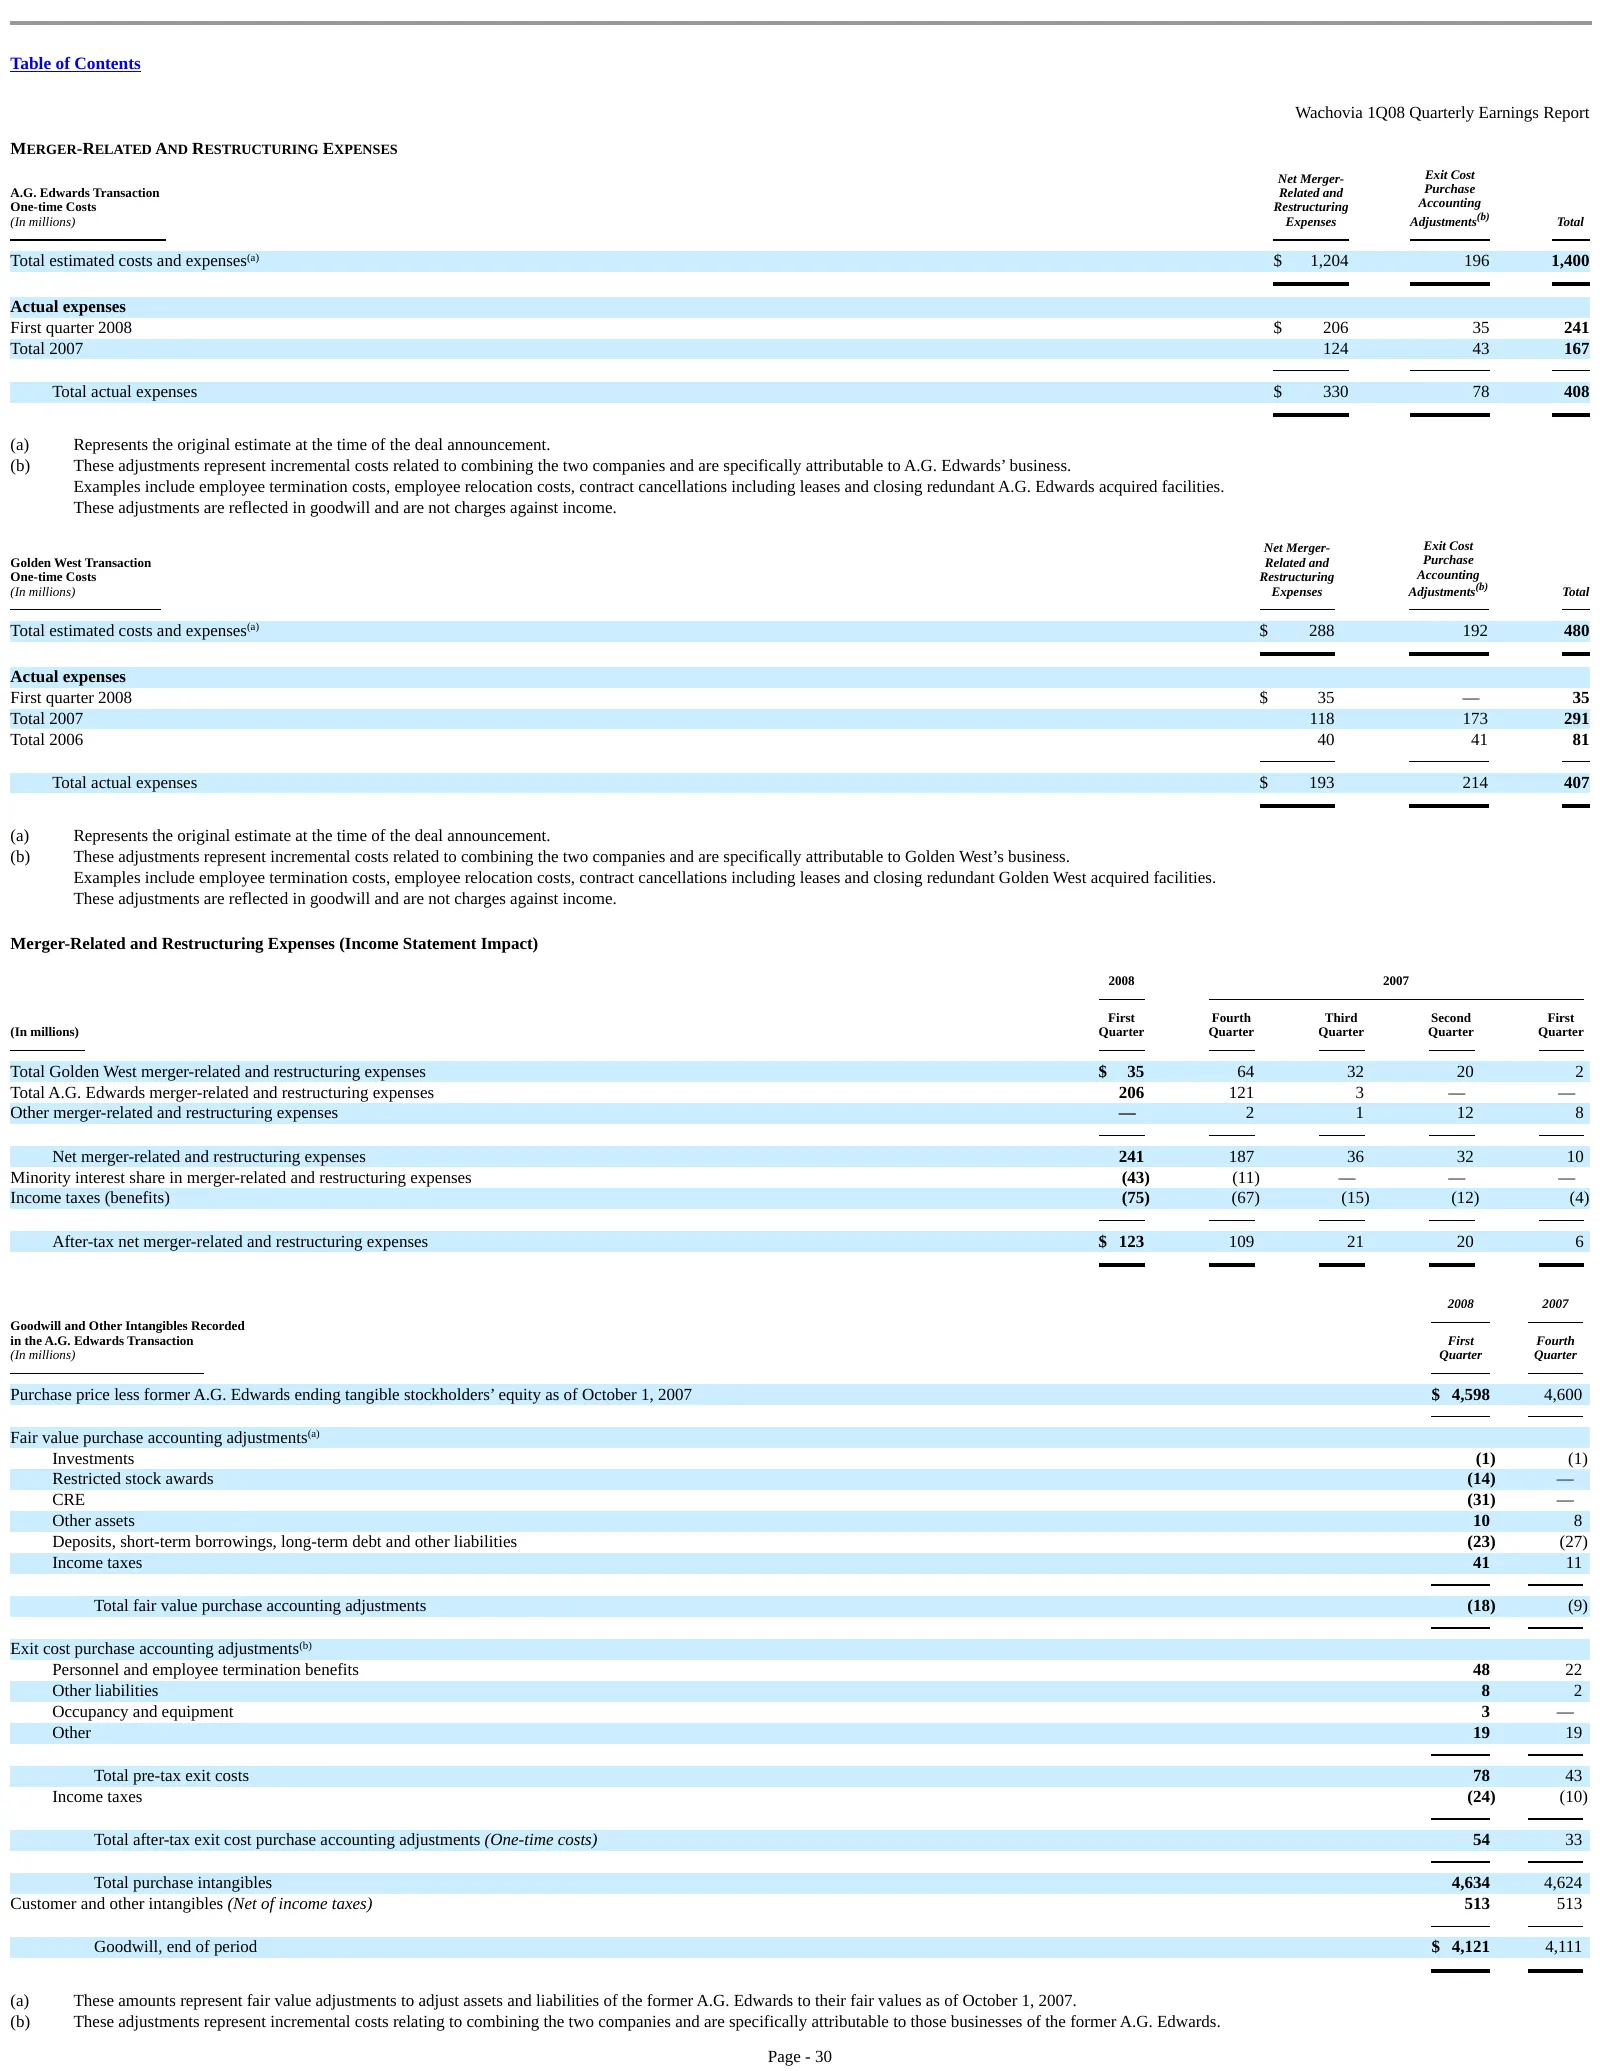
Table of Contents Wachovia 1Q08 Quarterly Earnings Report MERGER-RELATED AND RESTRUCTURING EXPENSES Net Merger- Exit Cost A.G. Edwards Transaction Related and Purchase One-time Costs Restructuring Accounting (In millions) Expenses Adjustments(b) Total (a) Total estimated costs and expenses $ 1,204 1

Slide 99: Explanation of Our Use of Certain Non-GAAP Financial Measures
Table of Contents Wachovia 1Q08 Quarterly Earnings Report EXPLANATION OF OUR USE OF CERTAIN NON-GAAP FINANCIAL MEASUR ES In addition to results presented in accordance with GAAP, this quarterly earnings report includes certain non-GAAP financial measures, including those presented on pages 1 and 3 u
Slide 100: Reconciliation of Certain Non-GAAP Financial Measures
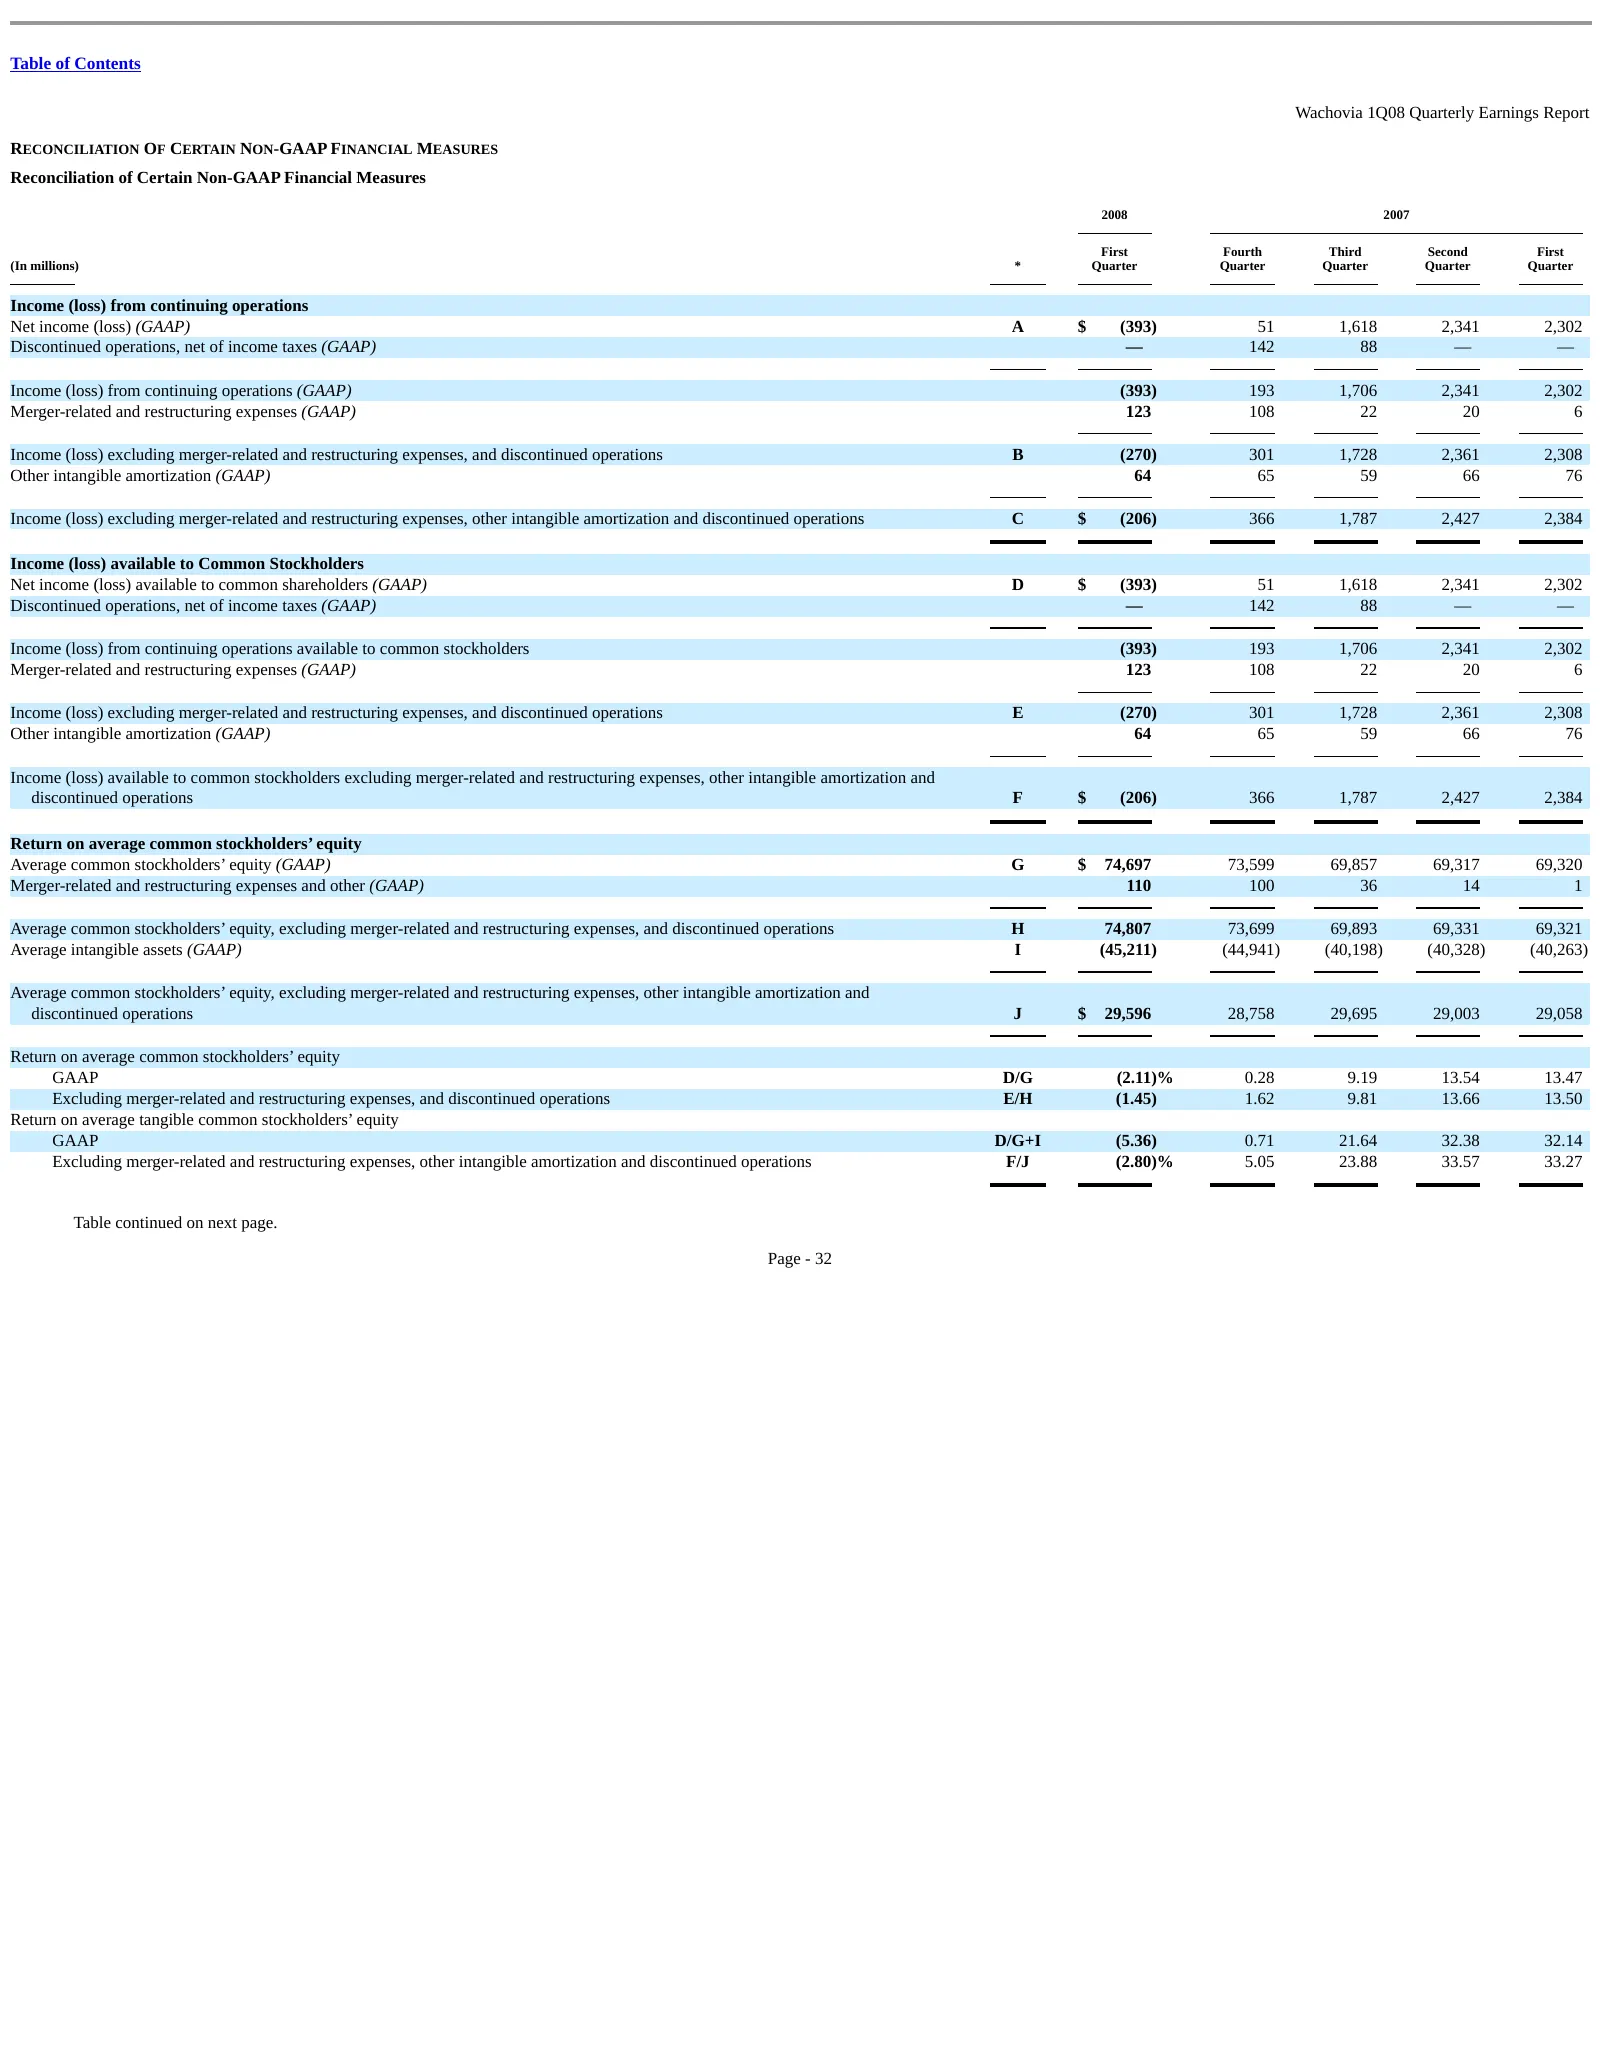
Table of Contents Wachovia 1Q08 Quarterly Earnings Report RECONCILIATION OF CERTAIN NON-GAAP FINANCIAL MEASURES Reconciliation of Certain Non-GAAP Financial Measures 2008 2007 First Fourth Third Second First (In millions) * Quarter Quarter Quarter Quarter Quarter Income (loss) from continuing operat
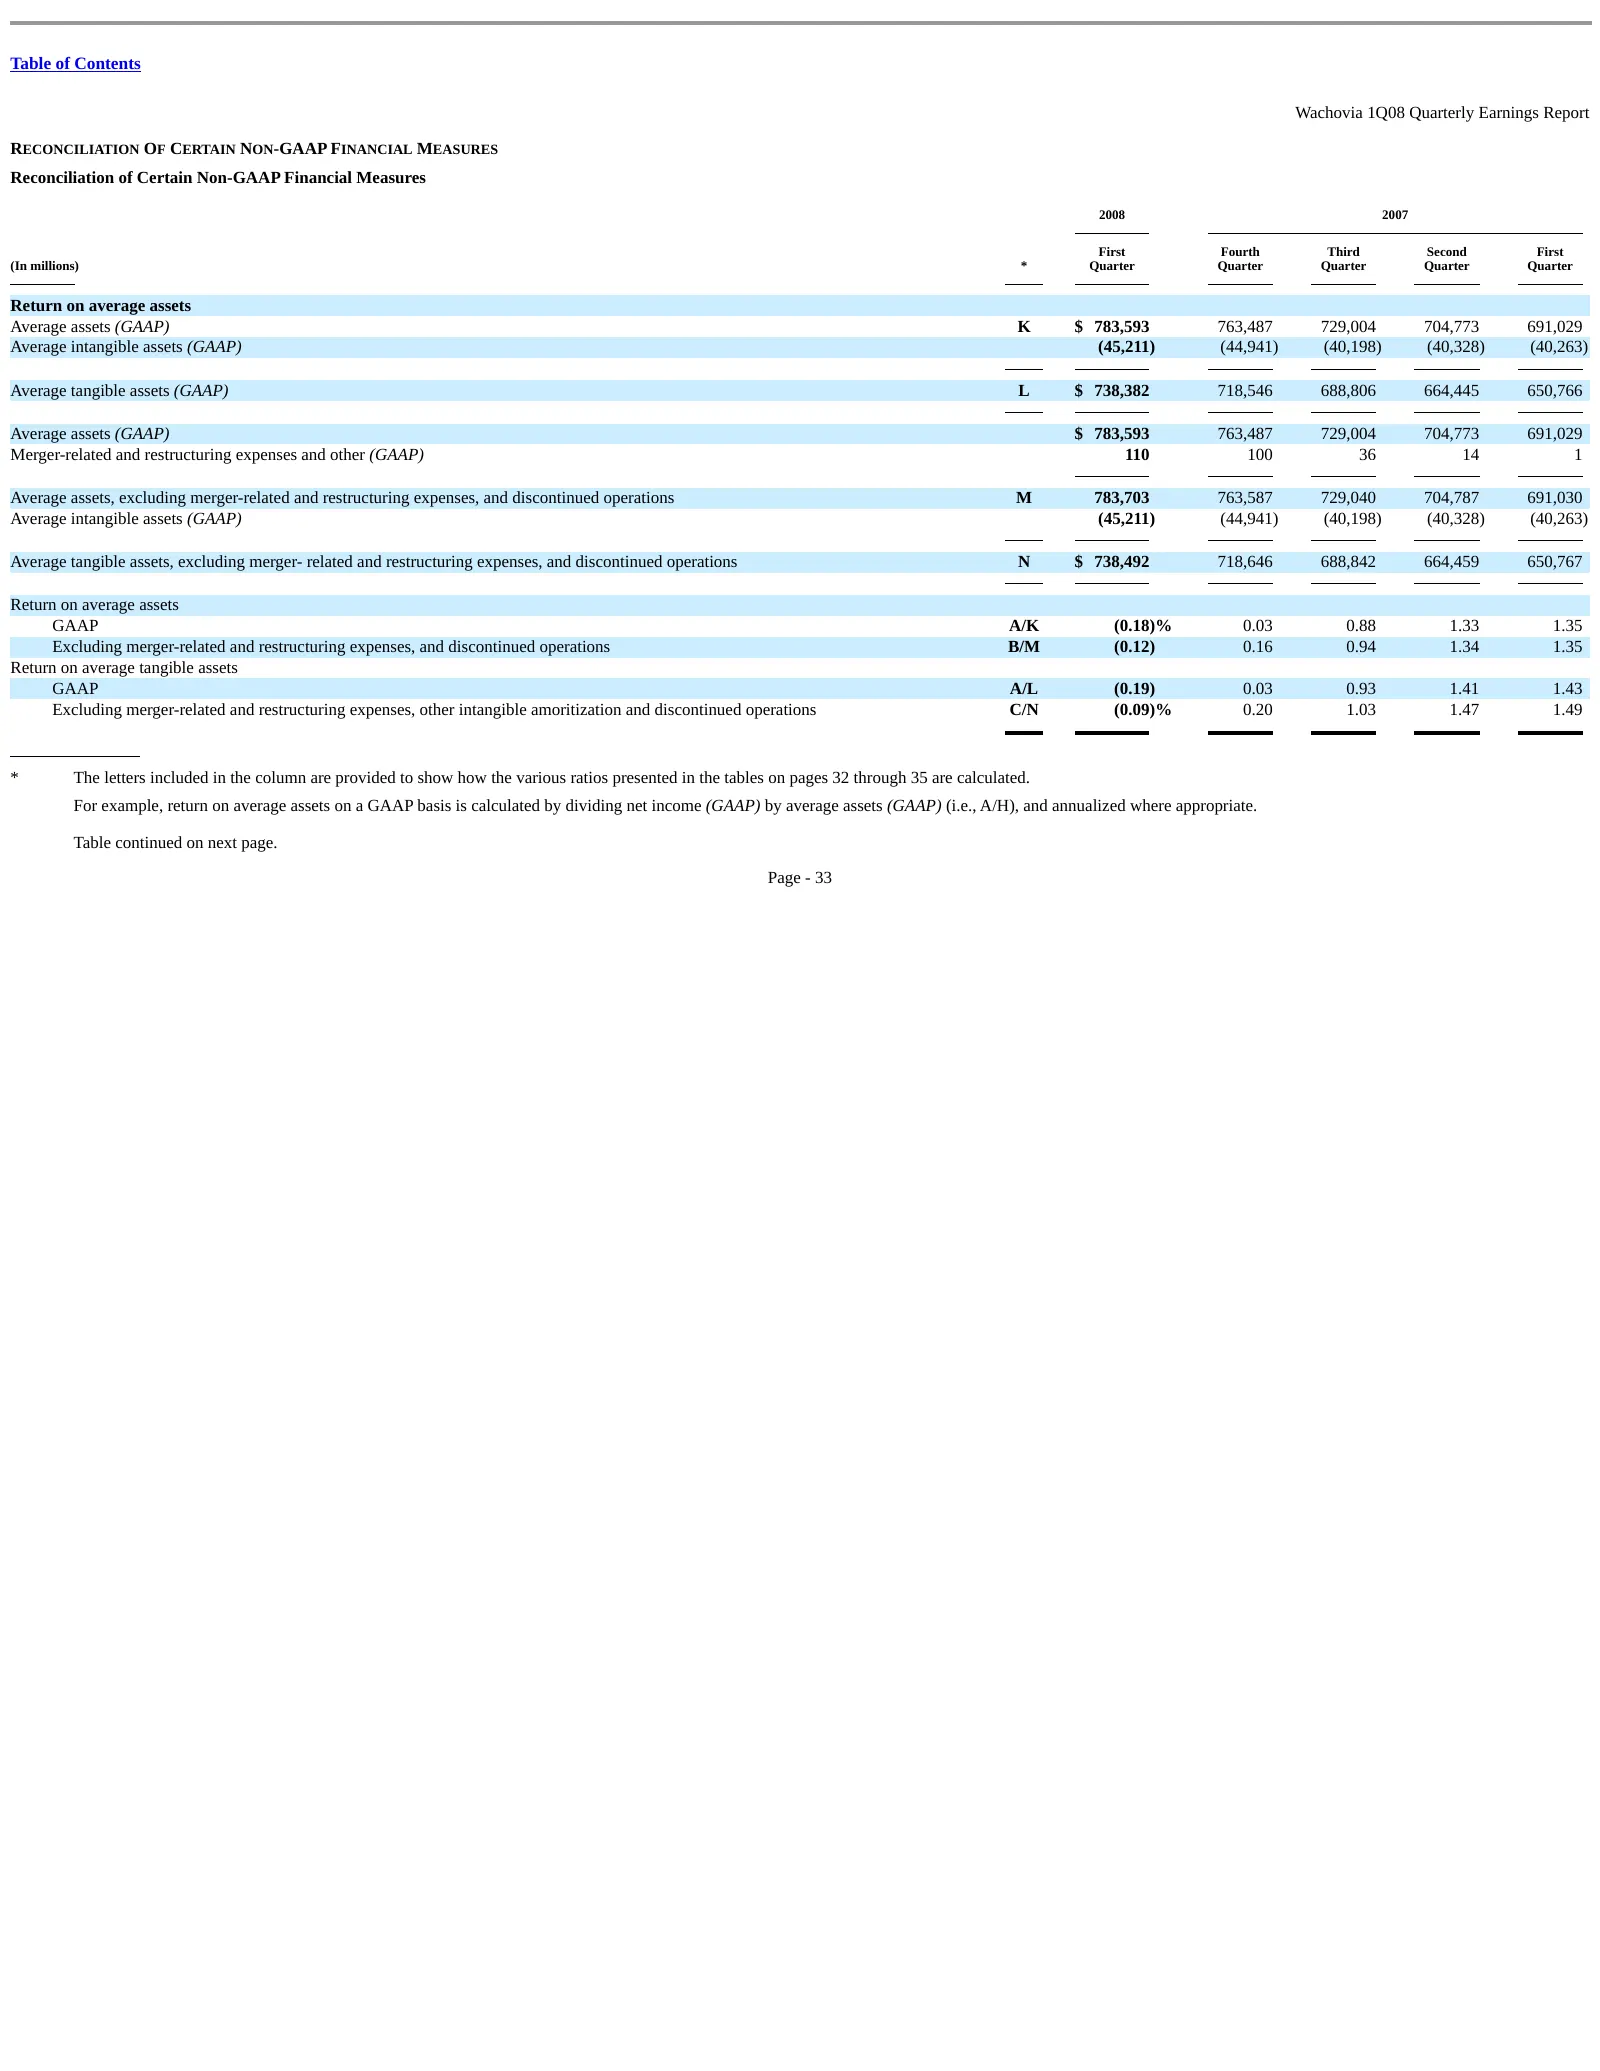
Slide 101: Reconciliation of Certain Non-GAAP Financial Measures
Table of Contents Wachovia 1Q08 Quarterly Earnings Report RECONCILIATION OF CERTAIN NON-GAAP FINANCIAL MEASURES Reconciliation of Certain Non-GAAP Financial Measures 2008 2007 First Fourth Third Second First (In millions) * Quarter Quarter Quarter Quarter Quarter Return on average assets Average ass
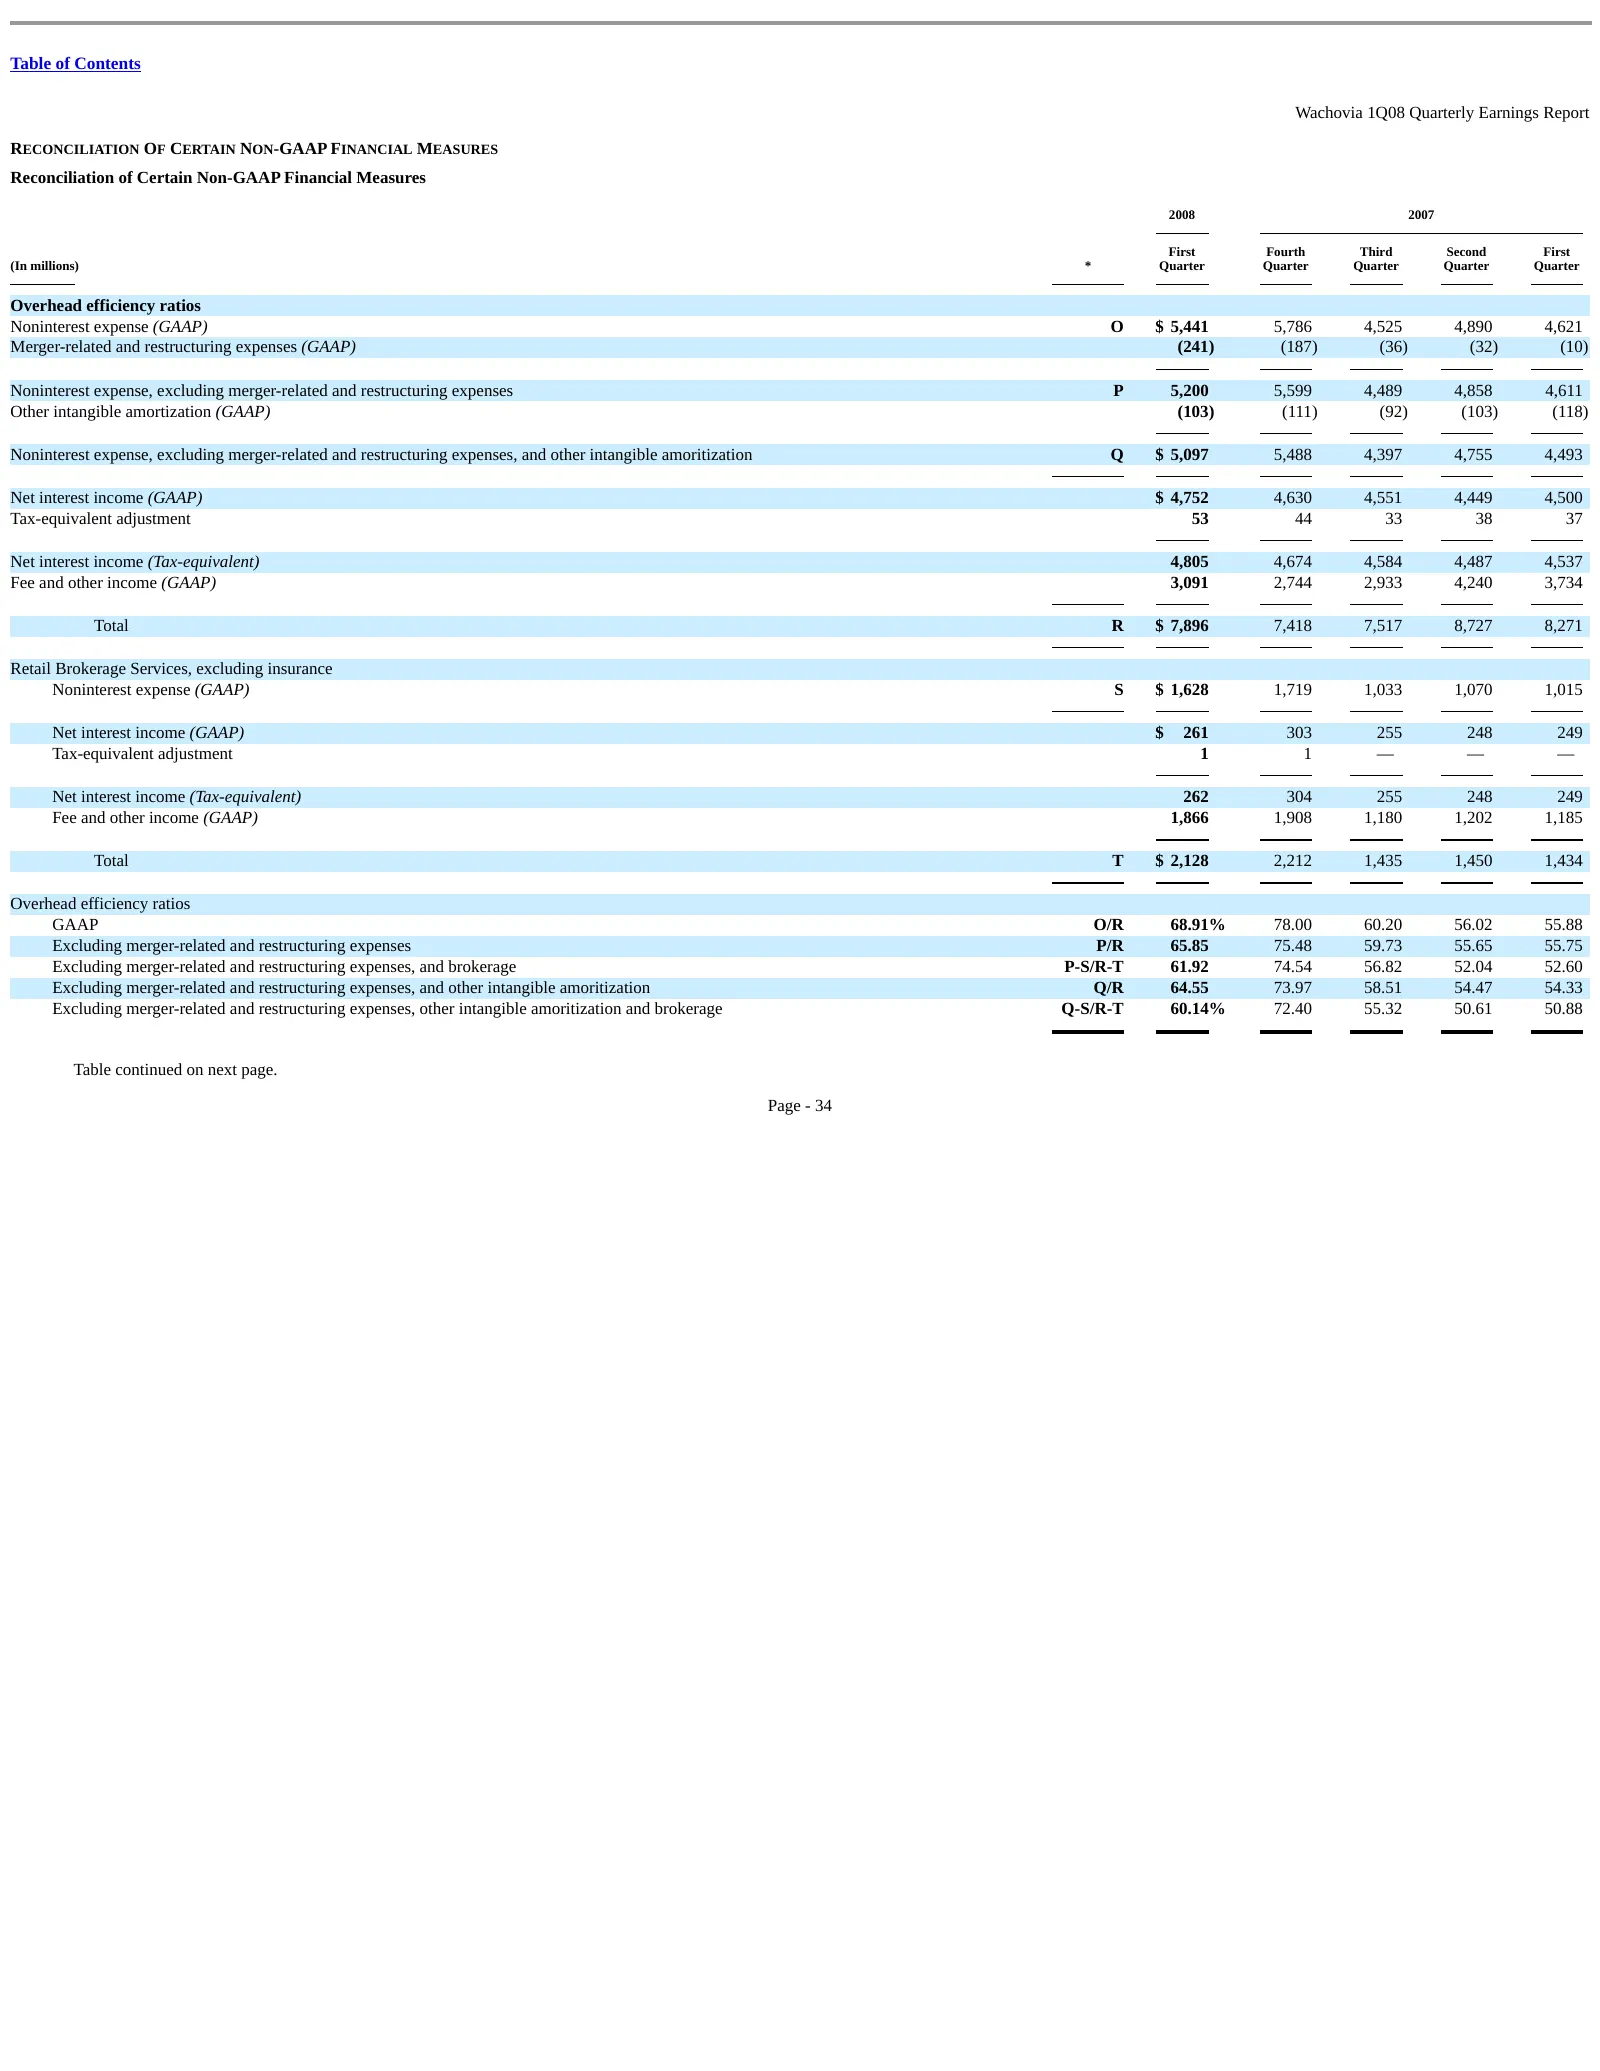
Slide 102: Reconciliation of Certain Non-GAAP Financial Measures
Table of Contents Wachovia 1Q08 Quarterly Earnings Report RECONCILIATION OF CERTAIN NON-GAAP FINANCIAL MEASURES Reconciliation of Certain Non-GAAP Financial Measures 2008 2007 First Fourth Third Second First (In millions) * Quarter Quarter Quarter Quarter Quarter Overhead efficiency ratios Nonintere
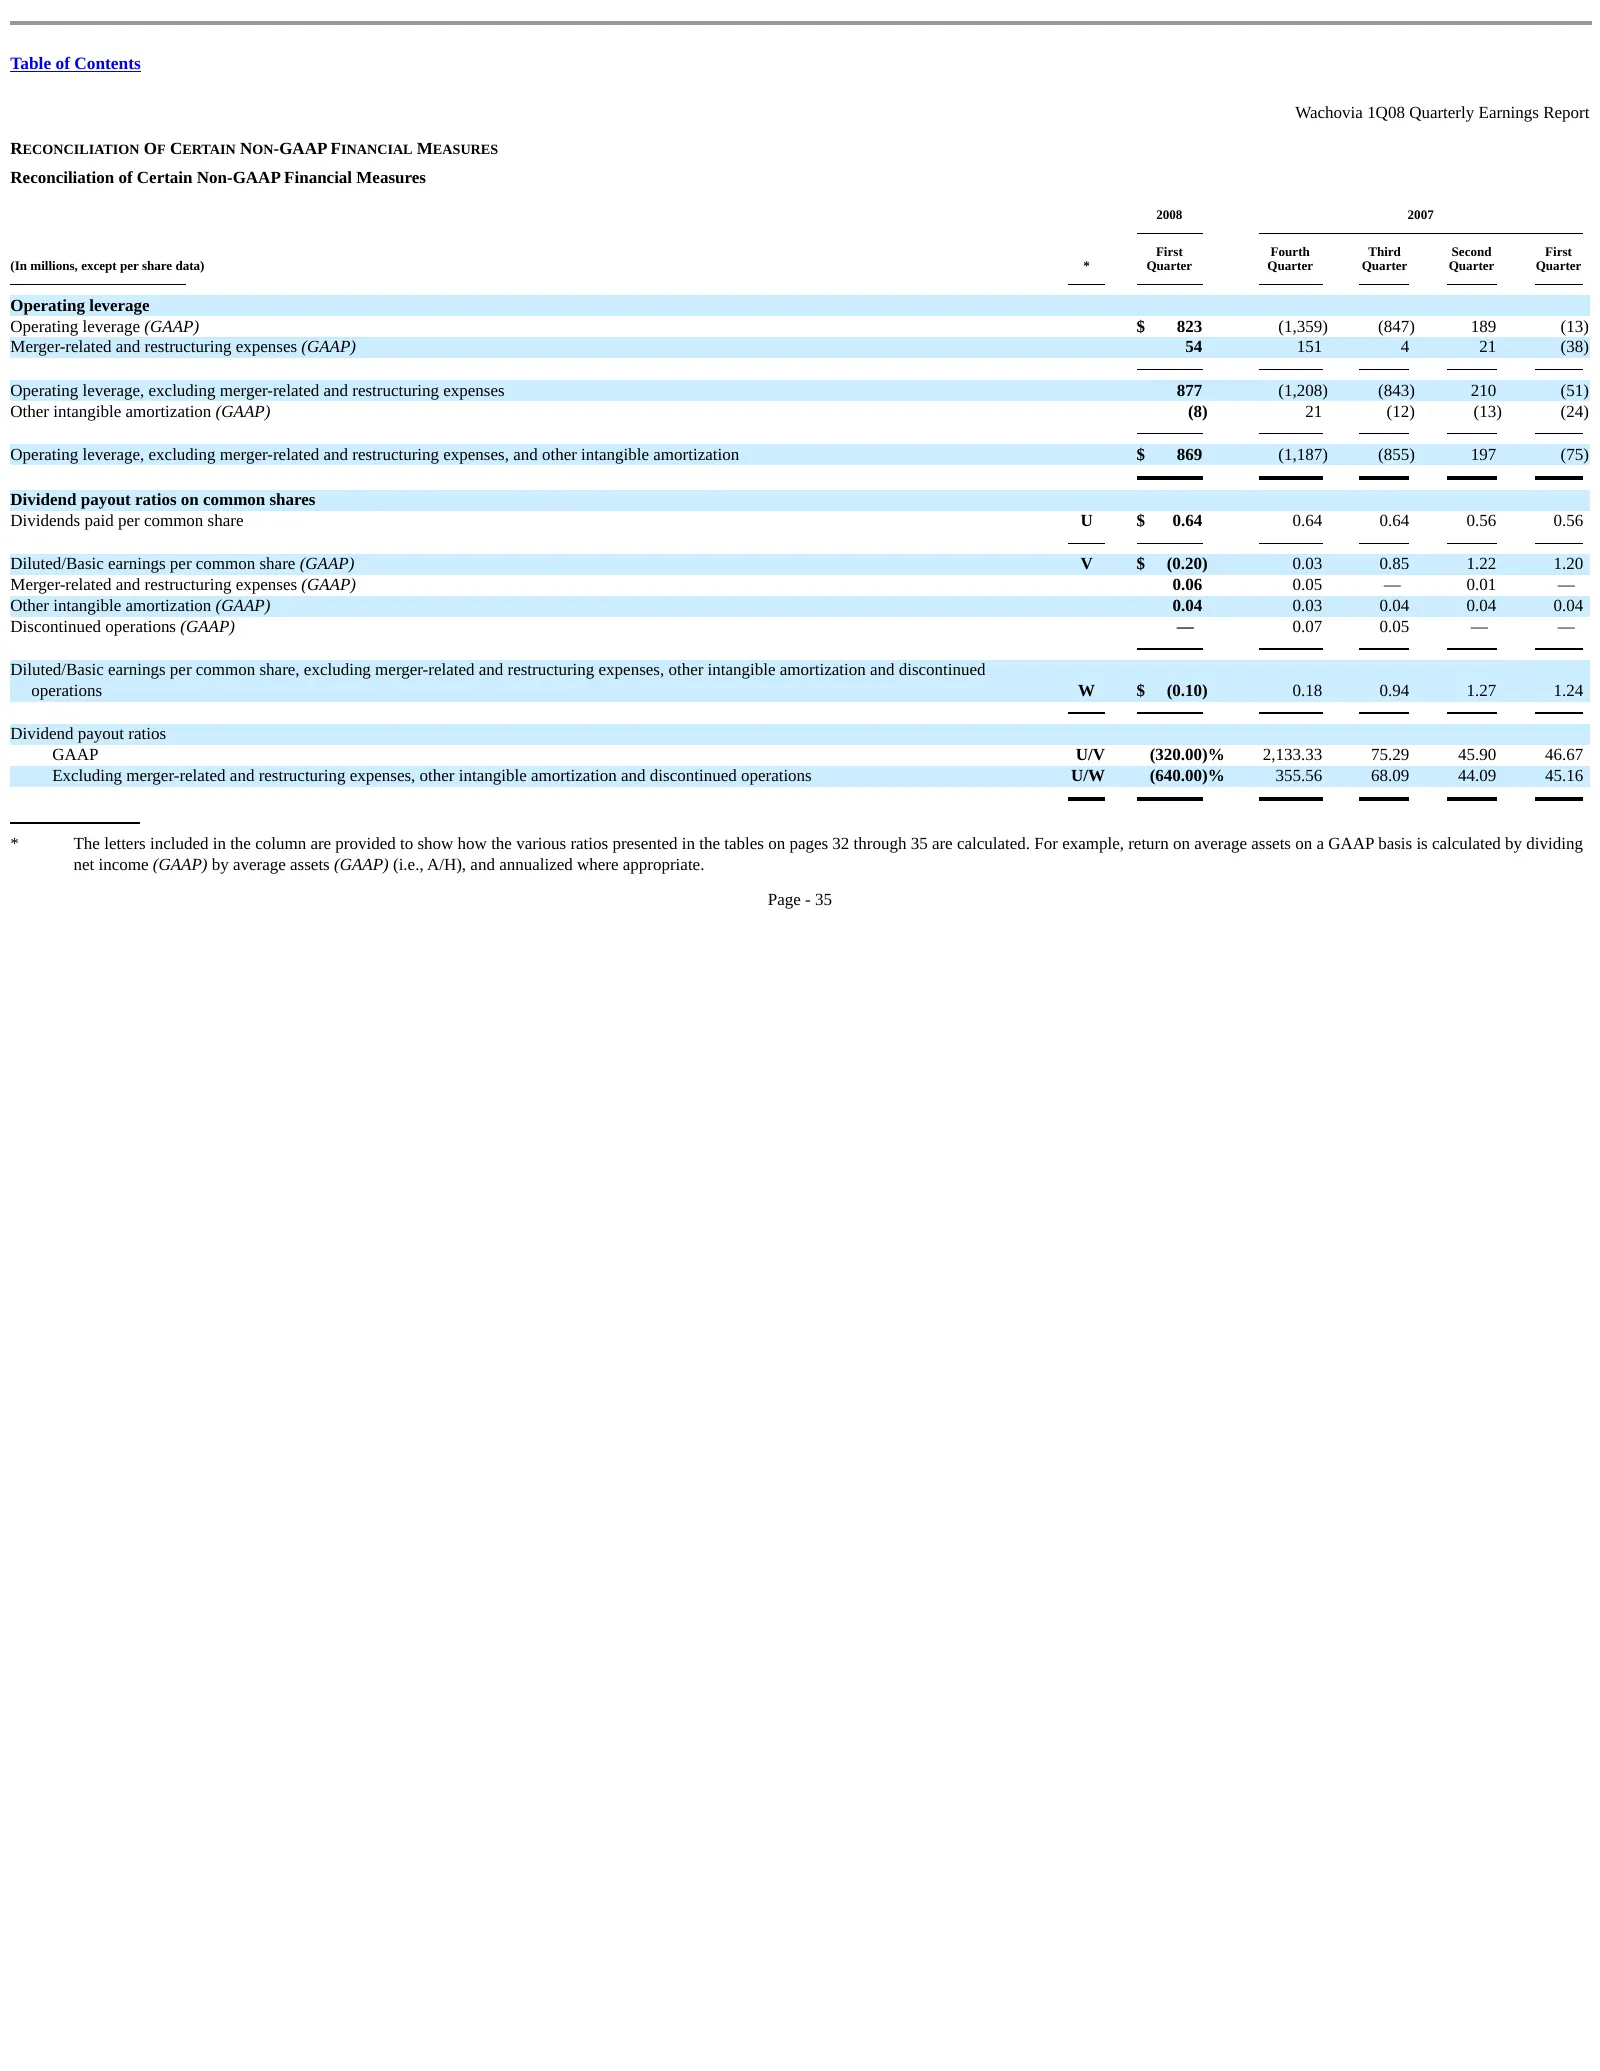
Slide 103: Reconciliation of Certain Non-GAAP Financial Measures
Table of Contents Wachovia 1Q08 Quarterly Earnings Report RECONCILIATION OF CERTAIN NON-GAAP FINANCIAL MEASURES Reconciliation of Certain Non-GAAP Financial Measures 2008 2007 First Fourth Third Second First (In millions, except per share data) * Quarter Quarter Quarter Quarter Quarter Operating lev

Slide 104: Cautionary Statement
Table of Contents Wachovia 1Q08 Quarterly Earnings Report CAUTIONARY STATEMENT The foregoing materials and management’s discussion of them may contain, among other things, certain forward-looking statements with respect to Wachovia, as well as the goals, plans, objectives, intentions, expectations,
Source: SEC EDGAR · FWP filed Apr 14, 2008
More decks from Wachovia Corp New
 Q3 2008 Earnings Presentation41 slides · Oct 22, 2008
 Merger or Acquisition (October 2008)15 slides · Oct 3, 2008
 Lehman Brothers Global Financial Services Conference 200828 slides · Sep 9, 2008
 Q2 2008 Earnings Presentation56 slides · Jul 22, 2008
 Q1 2008 Earnings Presentation45 slides · Apr 14, 2008
 Q4 2007 Earnings Presentation30 slides · Jan 22, 2008