Metro Bancorp — Shareholder Meeting (June 2015)
35 slides from Metro Bancorp's shareholder meeting presentation, Jun 19, 2015
Slide 1: Annual Shareholders' Meeting June 19, 2015
Annual Shareholders’ Meeting June 19, 2015

Slide 2: ante)
ante) BANK

Slide 3: Proposal #1 Election of Directors – 12 Nominees
Proposal #1 Election of Directors – 12 Nominees: Gary L. Nalbandian Richard J. Lashley James R. Adair J. Rodney Messick Douglas R. Berry Jessica E. Meyers John J. Cardello, CPA Michael A. Serluco Douglas S. Gelder Thomas F. Smida, Esq. Alan R. Hassman Samir J. Srouji, M.D. 3

Slide 4: Proposal #2 Approval of the 2016 Employee Stock Option and Restricted Stock Plan
Proposal #2 Approval of the 2016 Employee Stock Option and Restricted Stock Plan 4
Slide 5: Proposal #3 Amendment to the 2011 Director Stock Option and Restricted Stock Plan
Proposal #3 Approval of an Amendment to the 2011 Director Stock Option and Restricted Stock Plan 5

Slide 6: Proposal #4 Say-On-Pay Proposal
Proposal #4 Say-On-Pay Proposal 6
Slide 7: Proposal #5 Ratification of Independent Registered Public Accounting Firm
Proposal #5 Ratification of Independent Registered Public Accounting firm 7
Slide 8: Forward-Looking Statements
Forward-Looking Statements This presentation contains projections and other forward-looking statements regarding future events, strategic corporate objectives or the future financial performance of Metro. We wish to caution you that these forward-looking statements may differ materially from actual

Slide 9: 2014 Highlights
ake 2014 HIGHLIGHTS
Slide 10: 2014 Performance Highlights
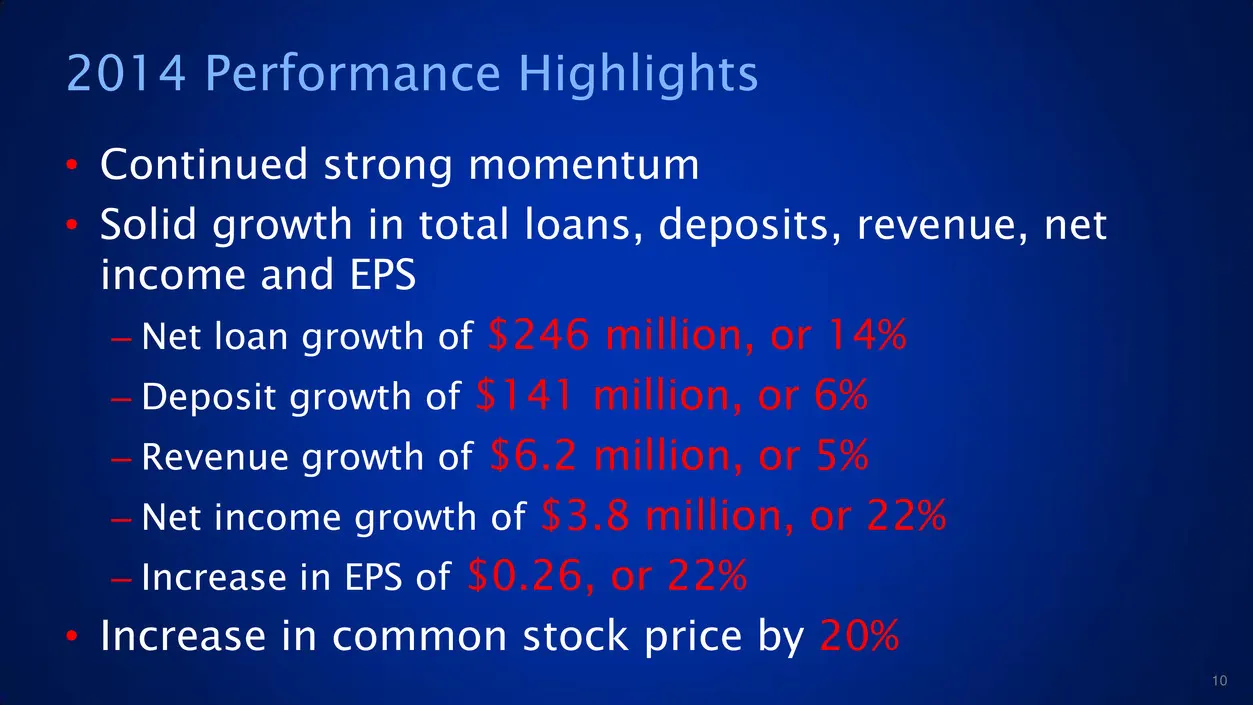
2014 Performance Highlights • Continued strong momentum • Solid growth in total loans, deposits, revenue, net income and EPS – Net loan growth of $246 million, or 14% – Deposit growth of $141 million, or 6% – Revenue growth of $6.2 million, or 5% – Net income growth of $3.8 million, or 22% – Increas
Slide 11: Shareholder Value
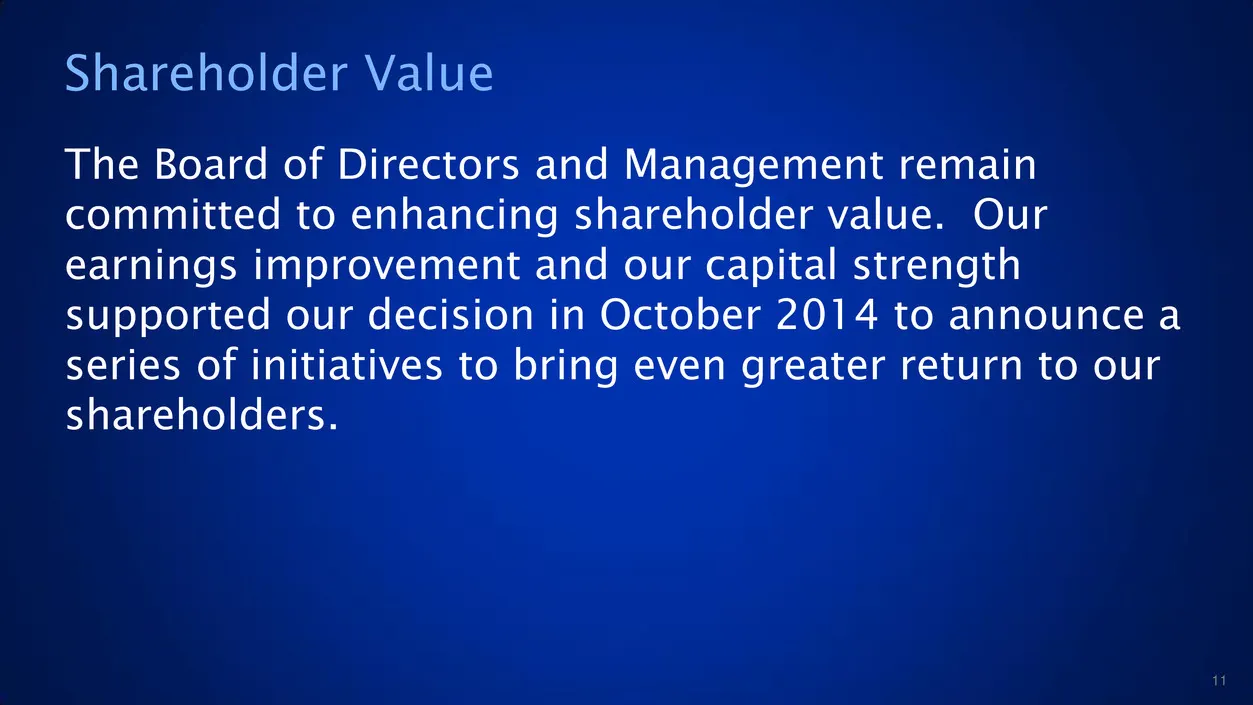
Shareholder Value The Board of Directors and Management remain committed to enhancing shareholder value. Our earnings improvement and our capital strength supported our decision in October 2014 to announce a series of initiatives to bring even greater return to our shareholders. 11
Slide 12: Announced New Strategic Initiatives
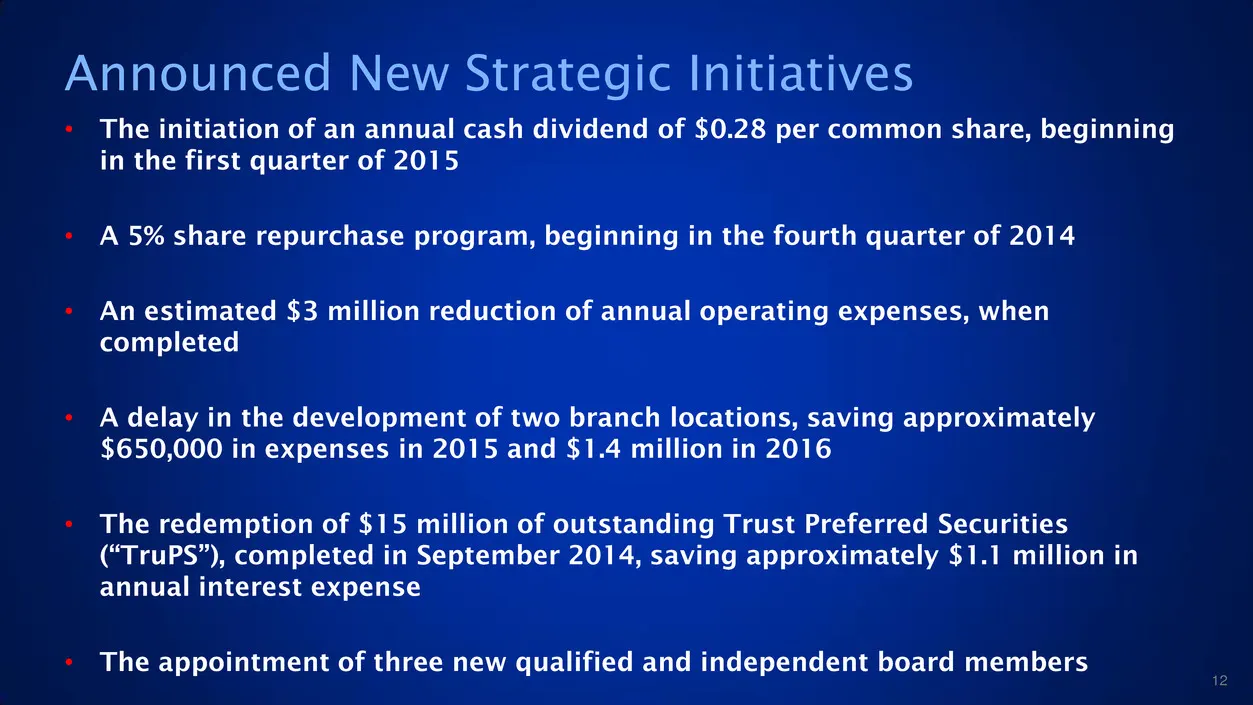
• The initiation of an annual cash dividend of $0.28 per common share, beginning in the first quarter of 2015 • A 5% share repurchase program, beginning in the fourth quarter of 2014 • An estimated $3 million reduction of annual operating expenses, when completed • A delay in the development of two
Slide 13: 2015 Key Priorities
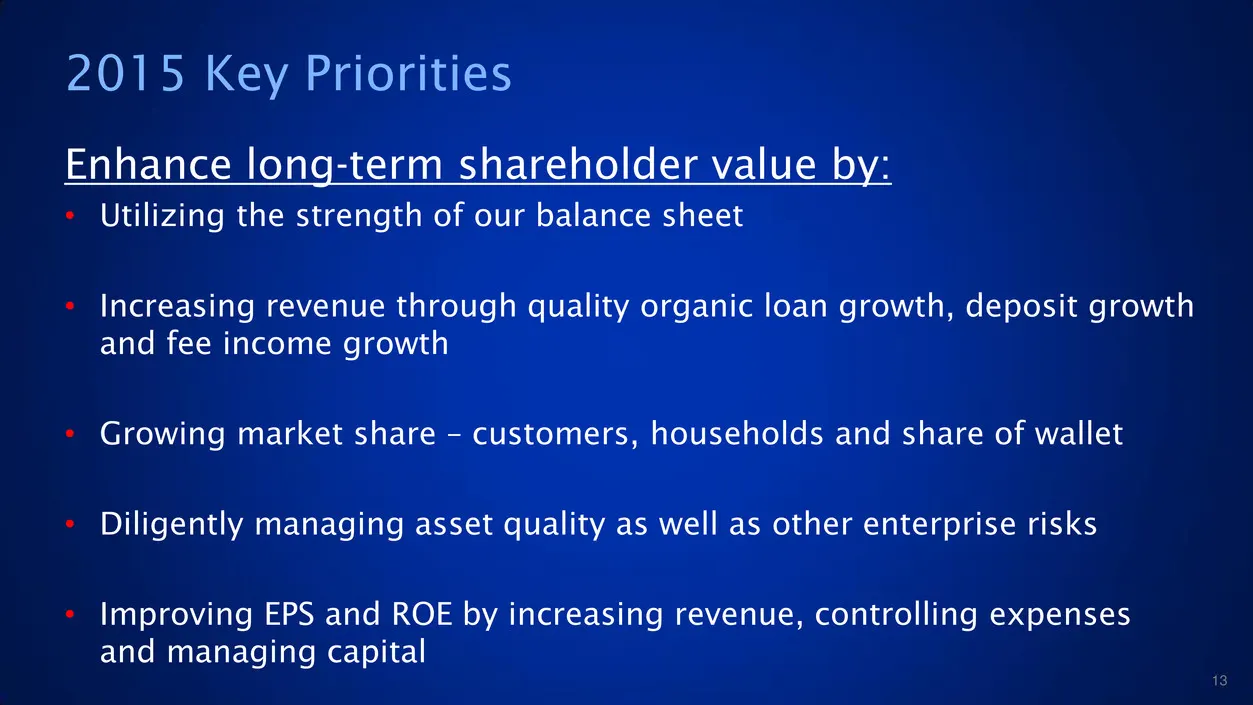
2015 Key Priorities Enhance long-term shareholder value by: • Utilizing the strength of our balance sheet • Increasing revenue through quality organic loan growth, deposit growth and fee income growth • Growing market share – customers, households and share of wallet • Diligently managing asset qual
Slide 14: Five Year Projected Growth
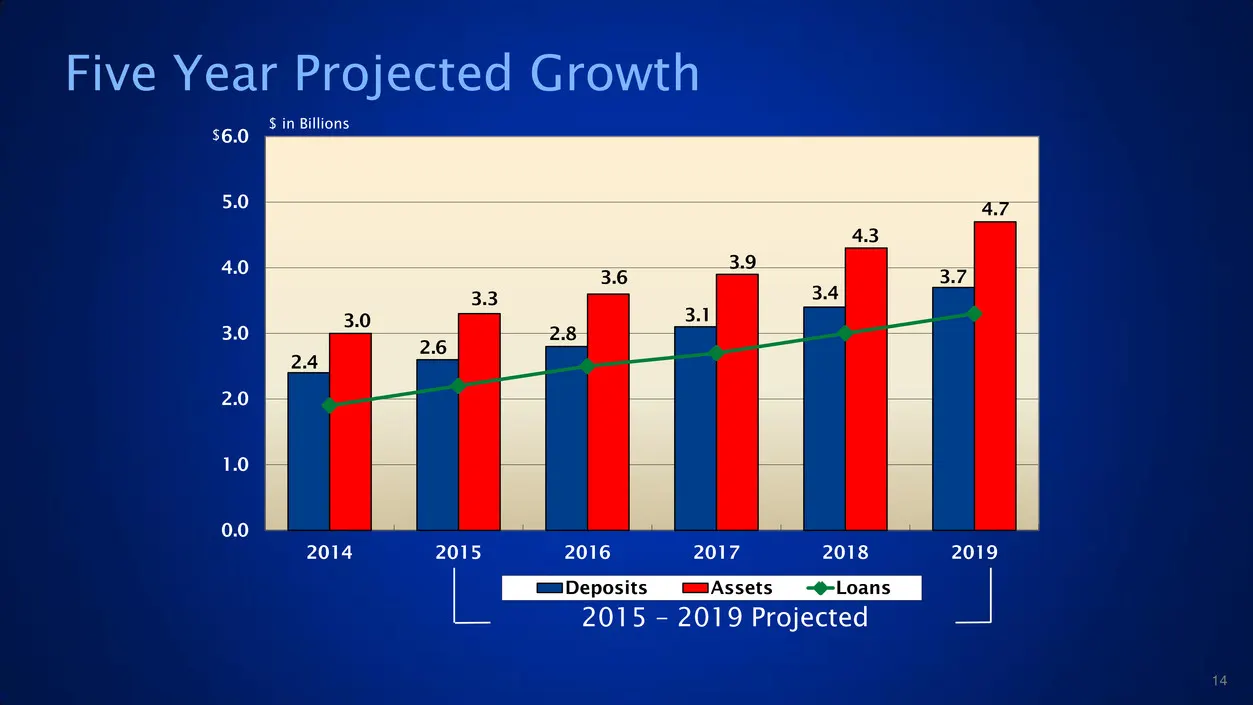
2.4 2.6 2.8 3.1 3.4 3.7 3.0 3.3 3.6 3.9 4.3 4.7 0.0 1.0 2.0 3.0 4.0 5.0 6.0 2014 2015 2016 2017 2018 2019 Deposits Assets Loans $ 2015 – 2019 Projected $ in Billions Five Year Projected Growth 14

Slide 15: Financial Review
ae FINANCIAL REVIEW
Slide 16: 2014 Highlights – Continued Momentum
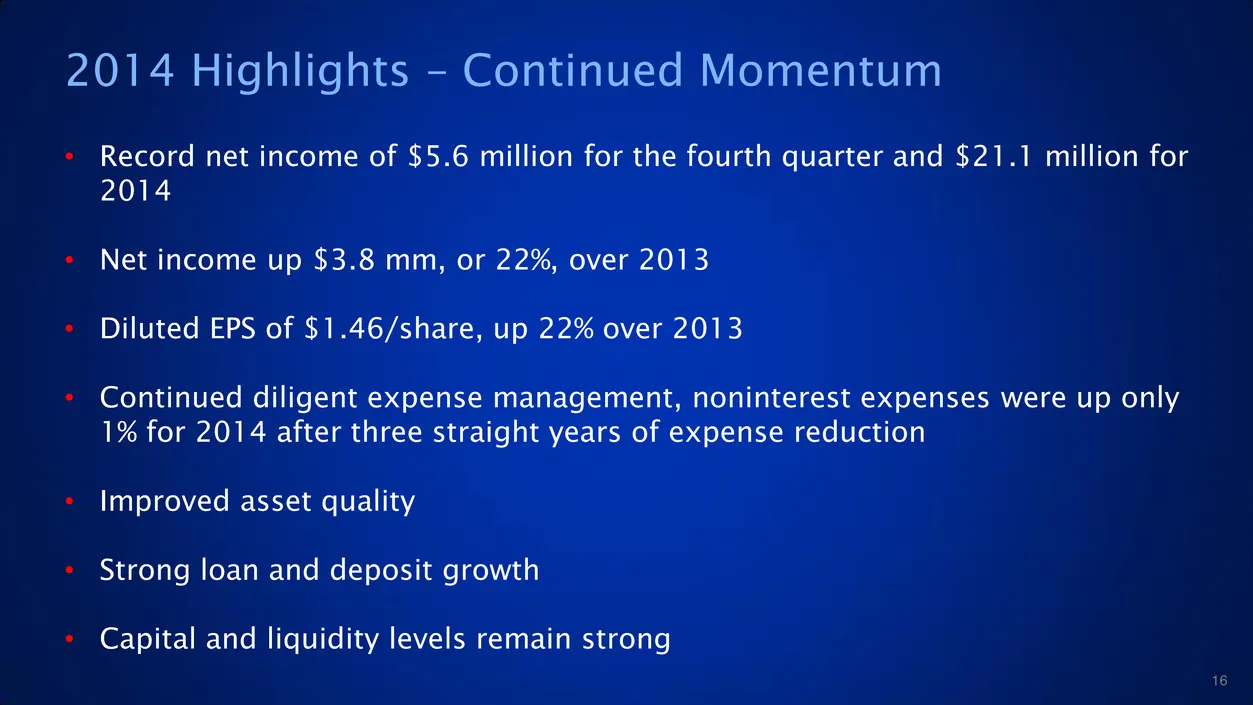
2014 Highlights – Continued Momentum • Record net income of $5.6 million for the fourth quarter and $21.1 million for 2014 • Net income up $3.8 mm, or 22%, over 2013 • Diluted EPS of $1.46/share, up 22% over 2013 • Continued diligent expense management, noninterest expenses were up only 1% for 2014
Slide 17: Continuously Improving Profitability
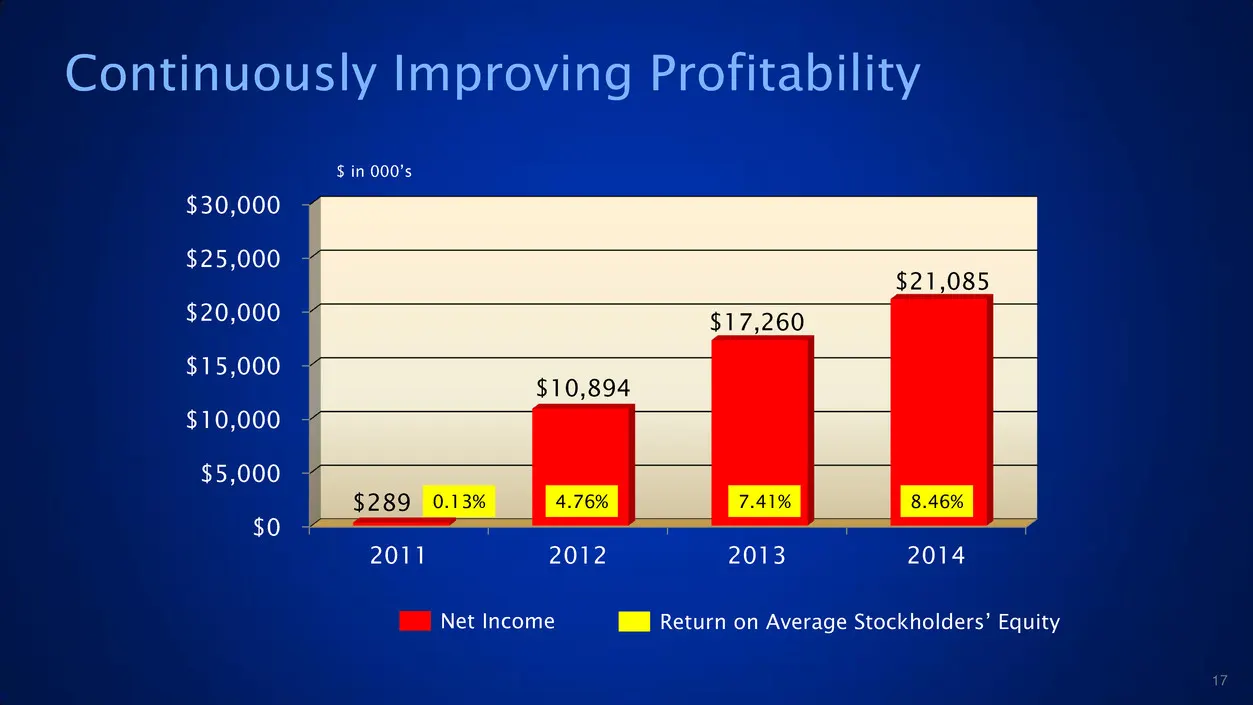
Continuously Improving Profitability $0 $5,000 $10,000 $15,000 $20,000 $25,000 $30,000 2011 2012 2013 2014 $289 $10,894 $17,260 $21,085 Net Income 0.13% 7.41% 8.46% $ in 000’s Return on Average Stockholders’ Equity 4.76% 17
Slide 18: ROE and EPS
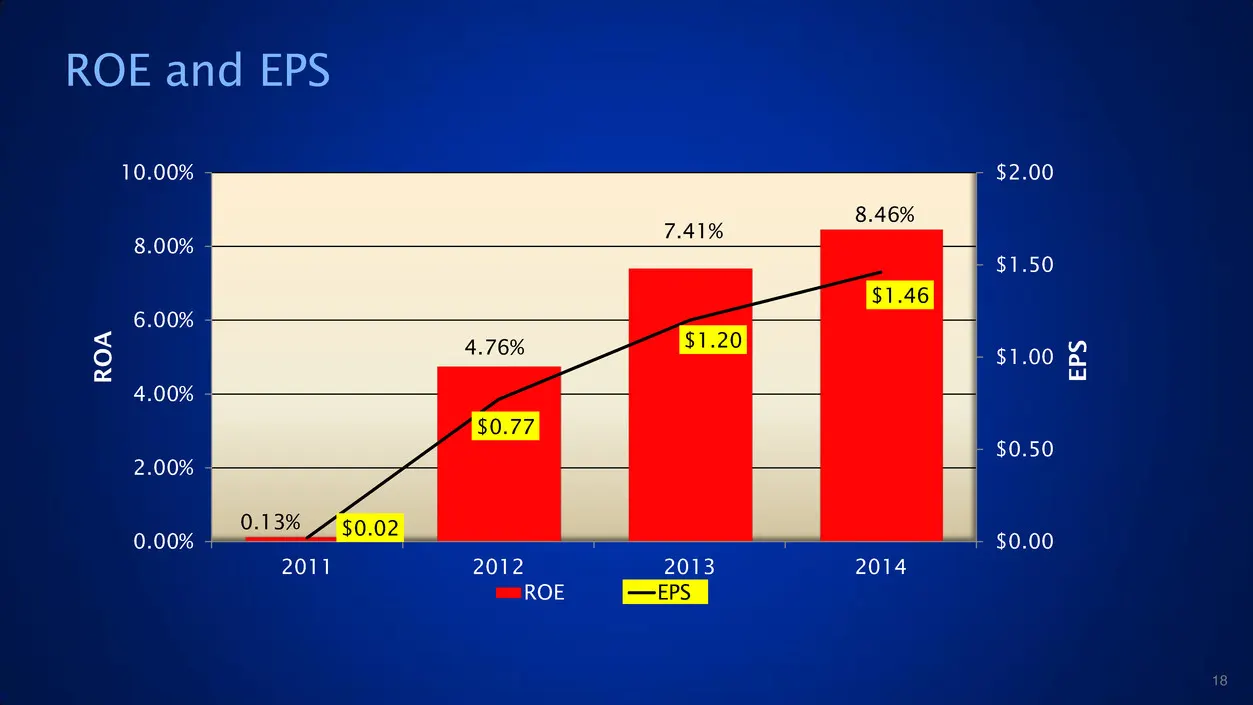
ROE and EPS 0.13% 4.76% 7.41% 8.46% $0.02 $0.77 $1.20 $1.46 $0.00 $0.50 $1.00 $1.50 $2.00 0.00% 2.00% 4.00% 6.00% 8.00% 10.00% 2011 2012 2013 2014 E P S R O A ROE EPS 18
Slide 19: Revenue Growth
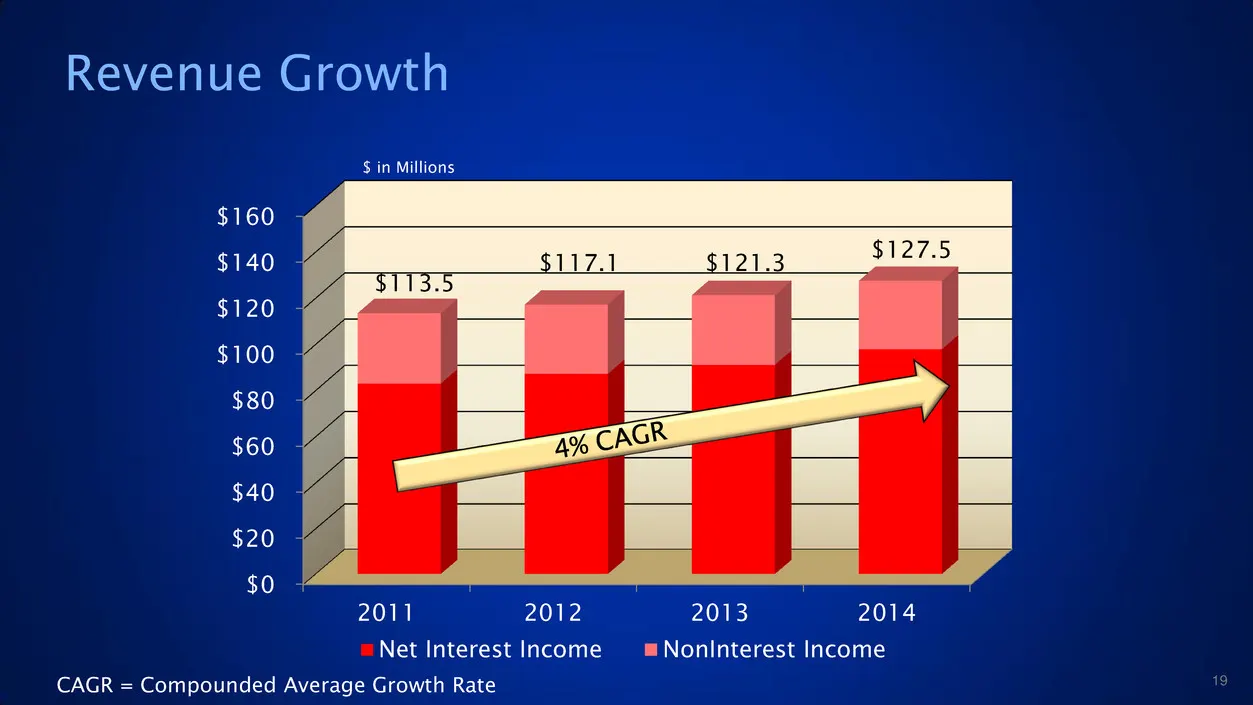
Revenue Growth $0 $20 $40 $60 $80 $100 $120 $140 $160 2011 2012 2013 2014 Net Interest Income NonInterest Income $ in Millions $113.5 $117.1 $121.3 $127.5 CAGR = Compounded Average Growth Rate 19
Slide 20: Prudent Expense Management
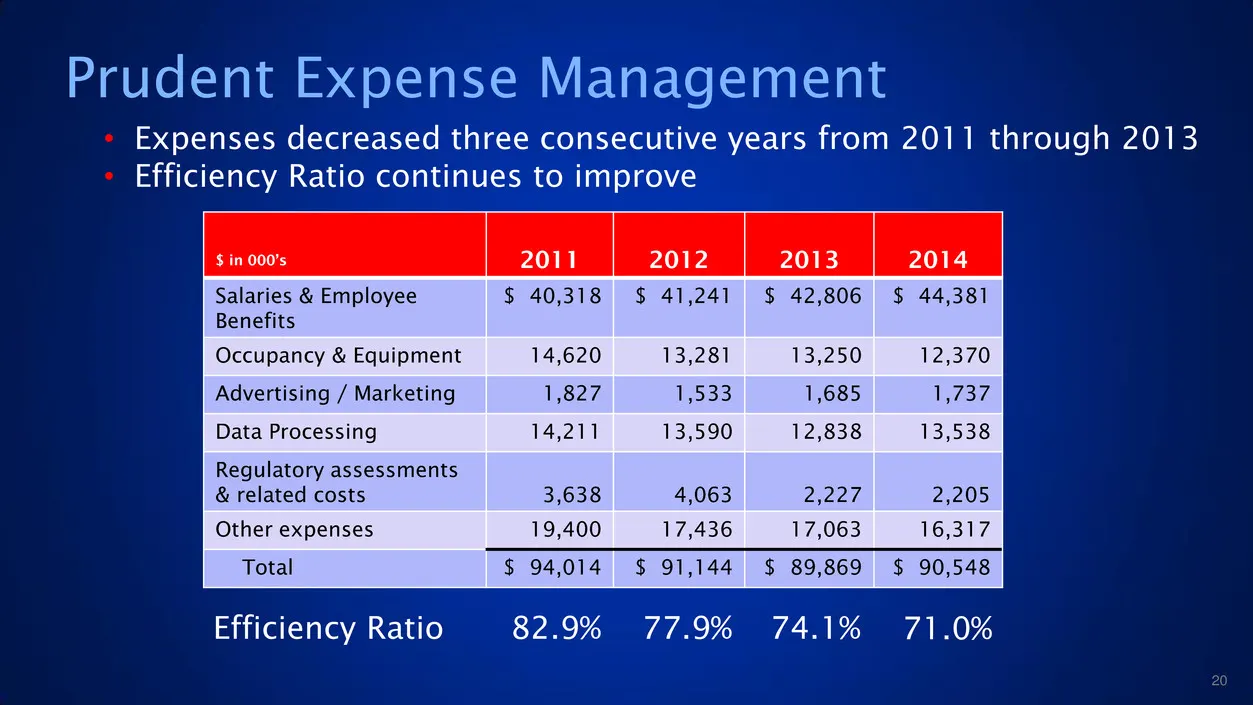
Prudent Expense Management $ in 000’s 2011 2012 2013 2014 Salaries & Employee Benefits $ 40,318 $ 41,241 $ 42,806 $ 44,381 Occupancy & Equipment 14,620 13,281 13,250 12,370 Advertising / Marketing 1,827 1,533 1,685 1,737 Data Processing 14,211 13,590 12,838 13,538 Regulatory assessments & related co
Slide 21: Growth With Cost Control
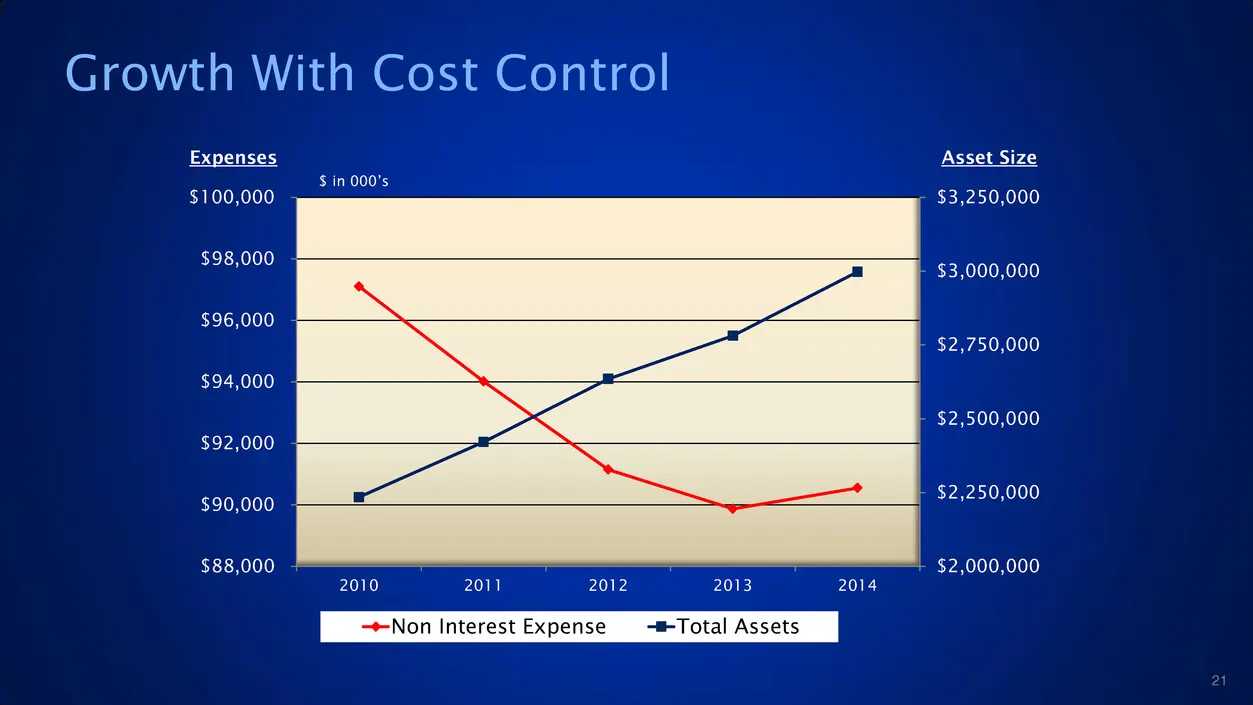
Growth With Cost Control $2,000,000 $2,250,000 $2,500,000 $2,750,000 $3,000,000 $3,250,000 $88,000 $90,000 $92,000 $94,000 $96,000 $98,000 $100,000 2010 2011 2012 2013 2014 Non Interest Expense Total Assets $ in 000’s Expenses Asset Size 21
Slide 22: Consistent Quality Loan Growth
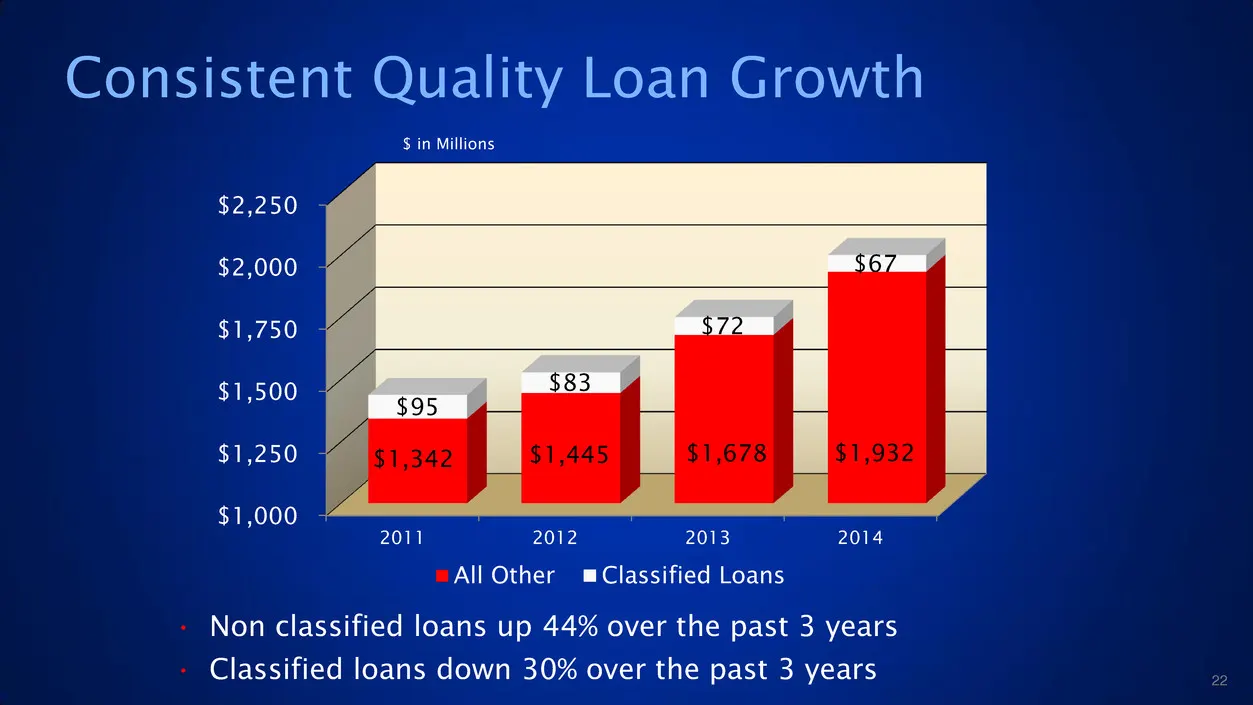
Consistent Quality Loan Growth $1,000 $1,250 $1,500 $1,750 $2,000 $2,250 2011 2012 2013 2014 $1,342 $1,445 $1,678 $1,932 $95 $83 $72 $67 All Other Classified Loans $ in Millions • Non classified loans up 44% over the past 3 years • Classified loans down 30% over the past 3 years 22
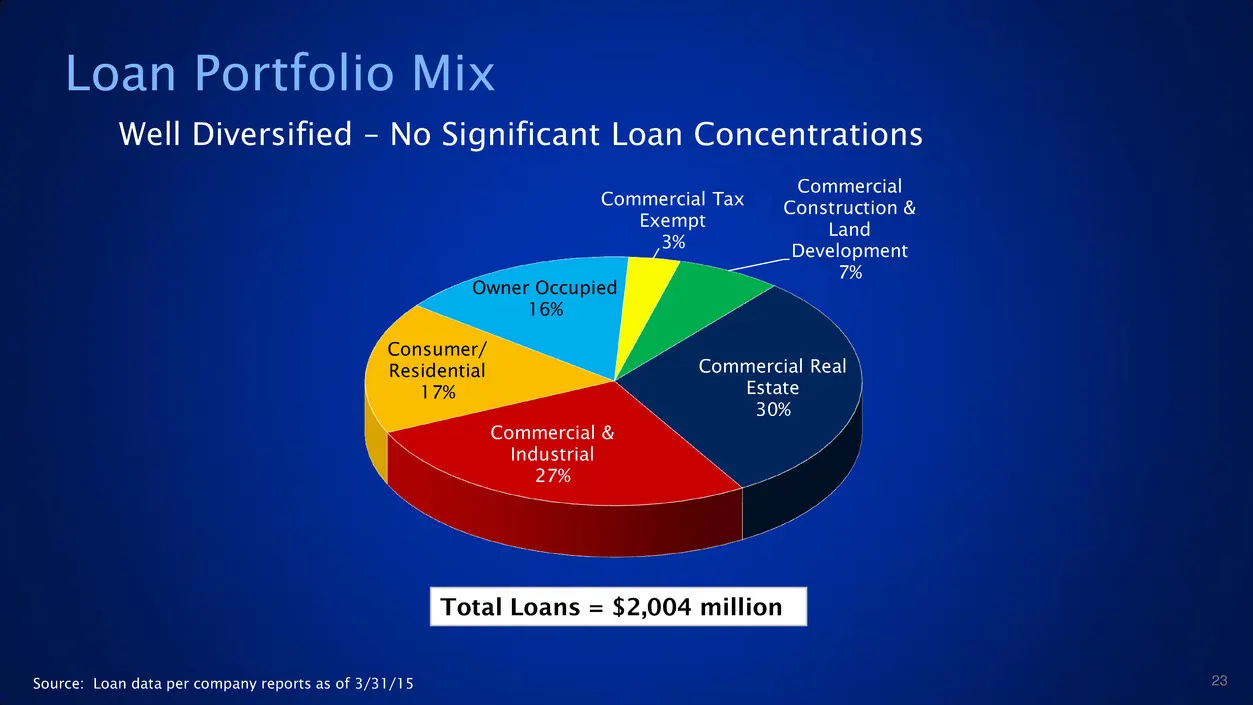
Slide 23: Loan Portfolio Mix
Commercial Real Estate 30% Commercial & Industrial 27% Consumer/ Residential 17% Owner Occupied 16% Commercial Tax Exempt 3% Commercial Construction & Land Development 7% Total Loans = $2,004 million Source: Loan data per company reports as of 3/31/15 Loan Portfolio Mix Well Diversified – No Signifi
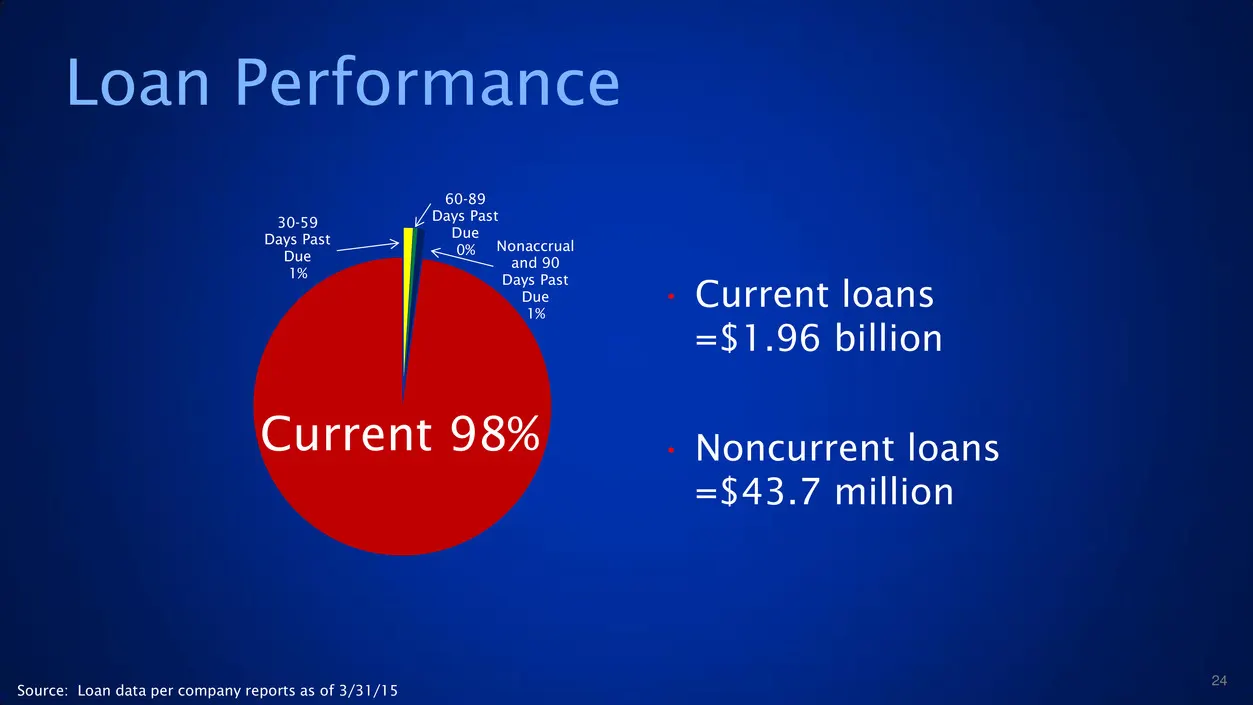
Slide 24: Loan Performance
Source: Loan data per company reports as of 3/31/15 Loan Performance 30-59 Days Past Due 1% 60-89 Days Past Due 0% Nonaccrual and 90 Days Past Due 1% Current 98% • Current loans =$1.96 billion • Noncurrent loans =$43.7 million 24
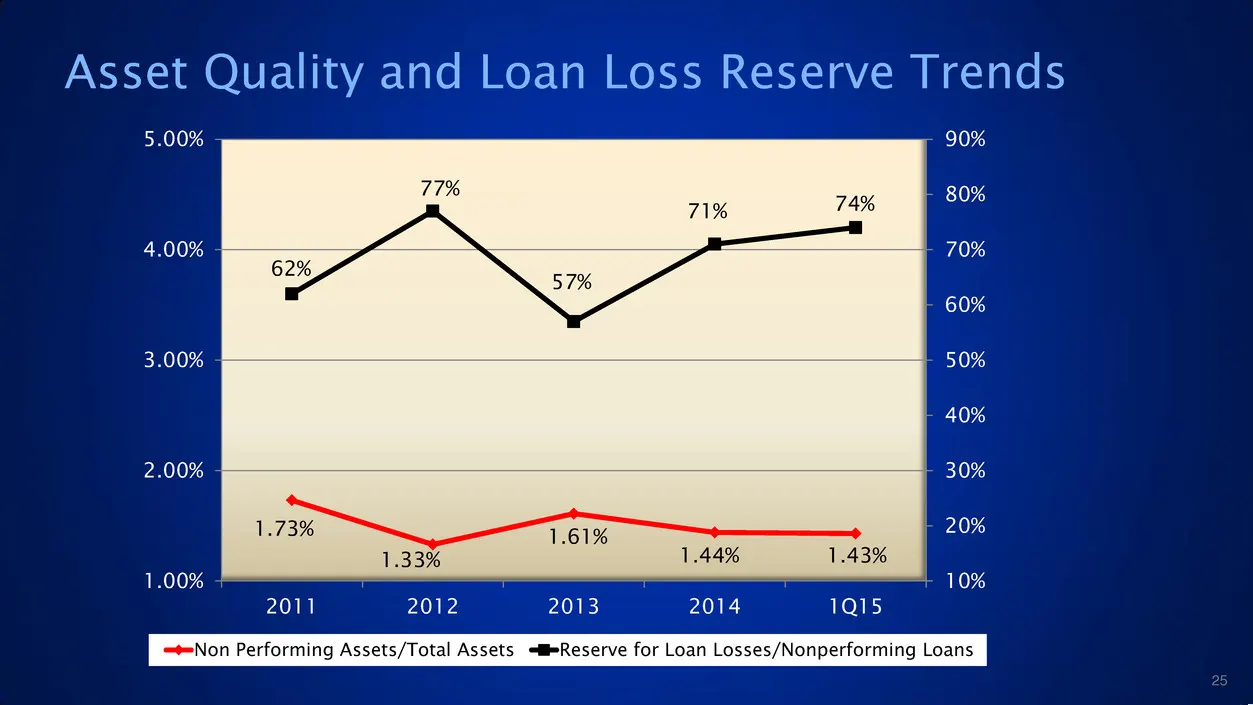
Slide 25: Asset Quality and Loan Loss Reserve Trends
Asset Quality and Loan Loss Reserve Trends 1.73% 1.33% 1.61% 1.44% 1.43% 62% 77% 57% 71% 74% 10% 20% 30% 40% 50% 60% 70% 80% 90% 1.00% 2.00% 3.00% 4.00% 5.00% 2011 2012 2013 2014 1Q15 Non Performing Assets/Total Assets Reserve for Loan Losses/Nonperforming Loans 25
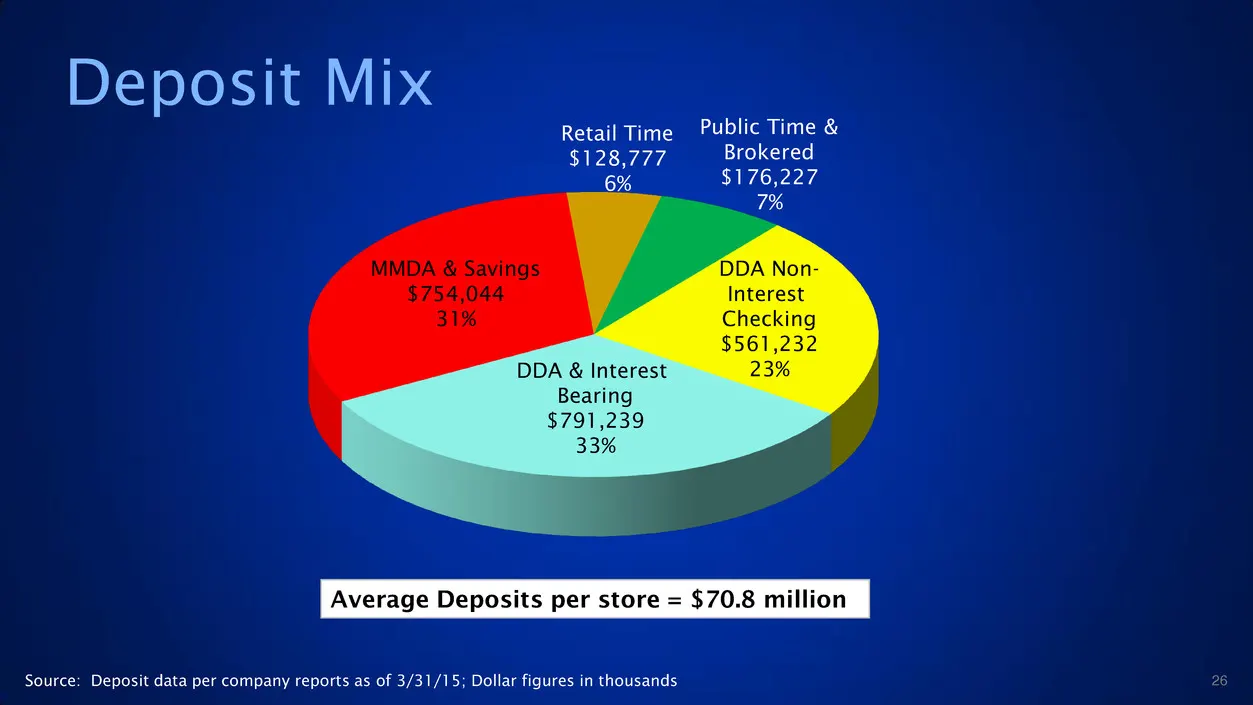
Slide 26: Deposit Mix
Average Deposits per store = $70.8 million Source: Deposit data per company reports as of 3/31/15; Dollar figures in thousands Deposit Mix 26 DDA Non- Interest Checking $561,232 23% DDA & Interest Bearing $791,239 33% MMDA & Savings $754,044 31% Retail Time $128,777 6% Public Time & Brokered $176,22
Slide 27: Strong Core Deposit Foundation
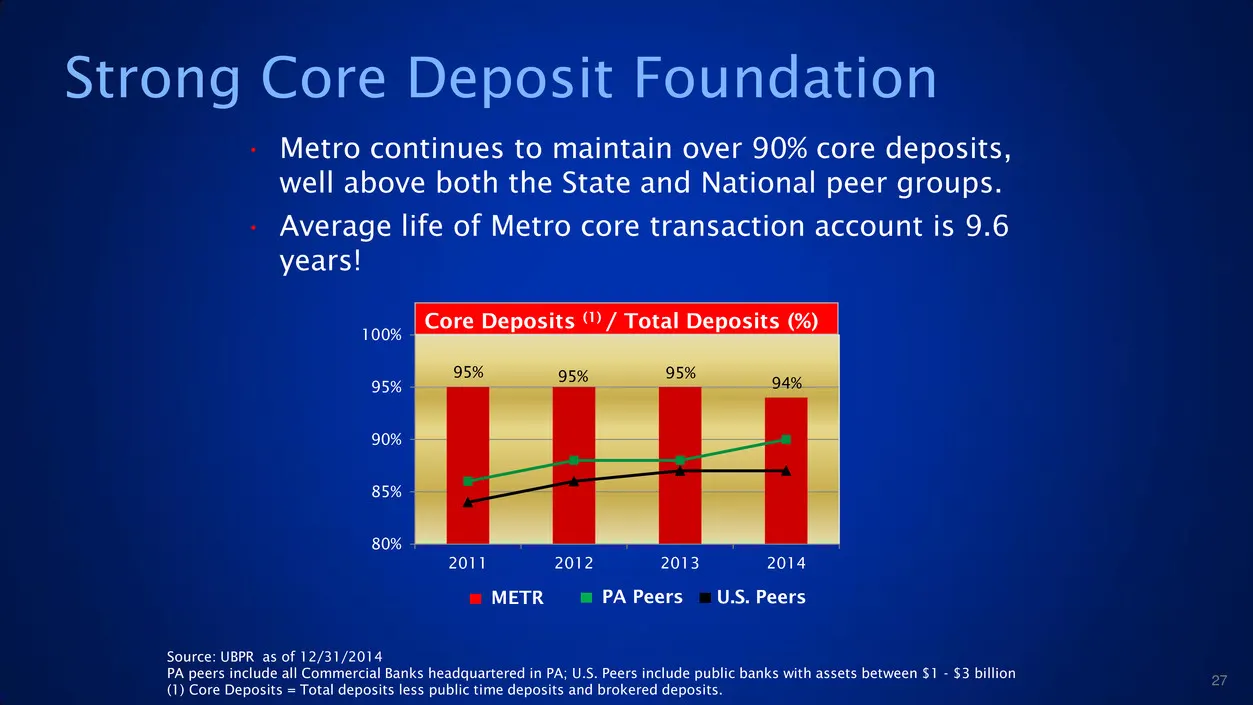
Strong Core Deposit Foundation 95% 95% 95% 94% 80% 85% 90% 95% 100% 2011 2012 2013 2014 Source: UBPR as of 12/31/2014 PA peers include all Commercial Banks headquartered in PA; U.S. Peers include public banks with assets between $1 - $3 billion (1) Core Deposits = Total deposits less public time dep
Slide 28: Total Assets
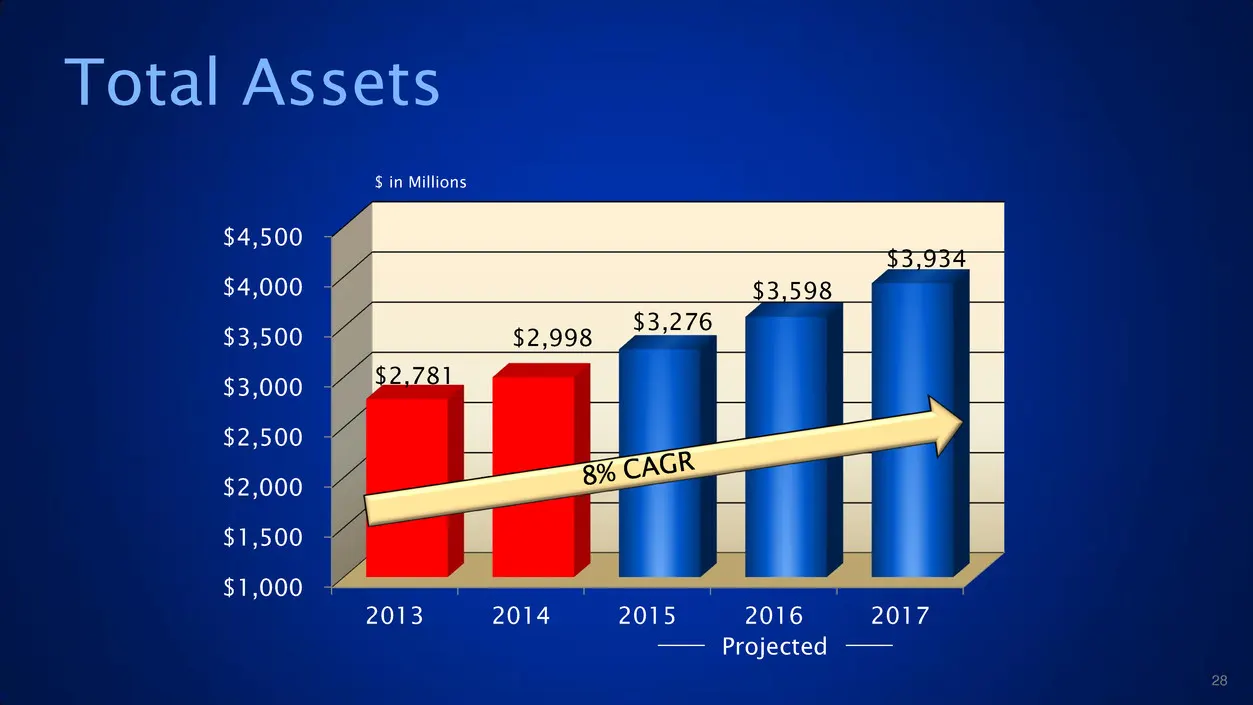
Total Assets $1,000 $1,500 $2,000 $2,500 $3,000 $3,500 $4,000 $4,500 2013 2014 2015 2016 2017 $2,781 $2,998 $3,276 $3,598 $3,934 $ in Millions Projected 28
Slide 29: Total Loans (net)
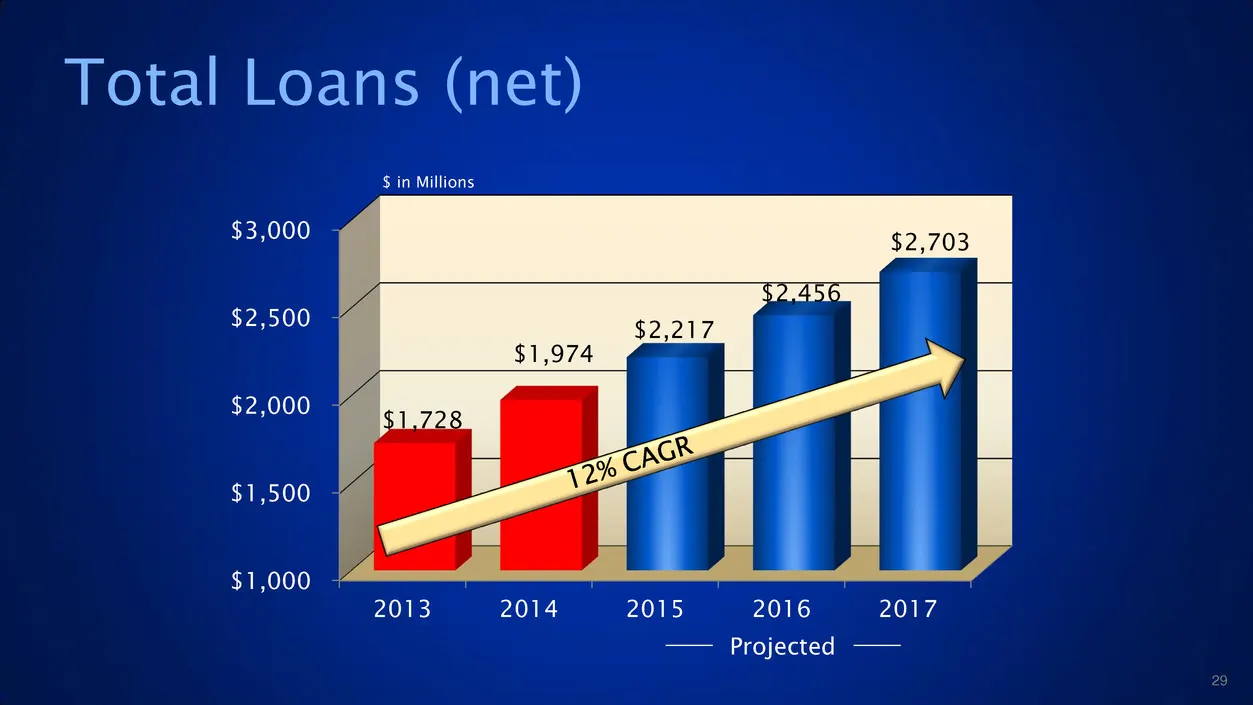
Total Loans (net) $1,000 $1,500 $2,000 $2,500 $3,000 2013 2014 2015 2016 2017 $1,728 $1,974 $2,217 $2,456 $2,703 $ in Millions Projected 29
Slide 30: Total Deposits
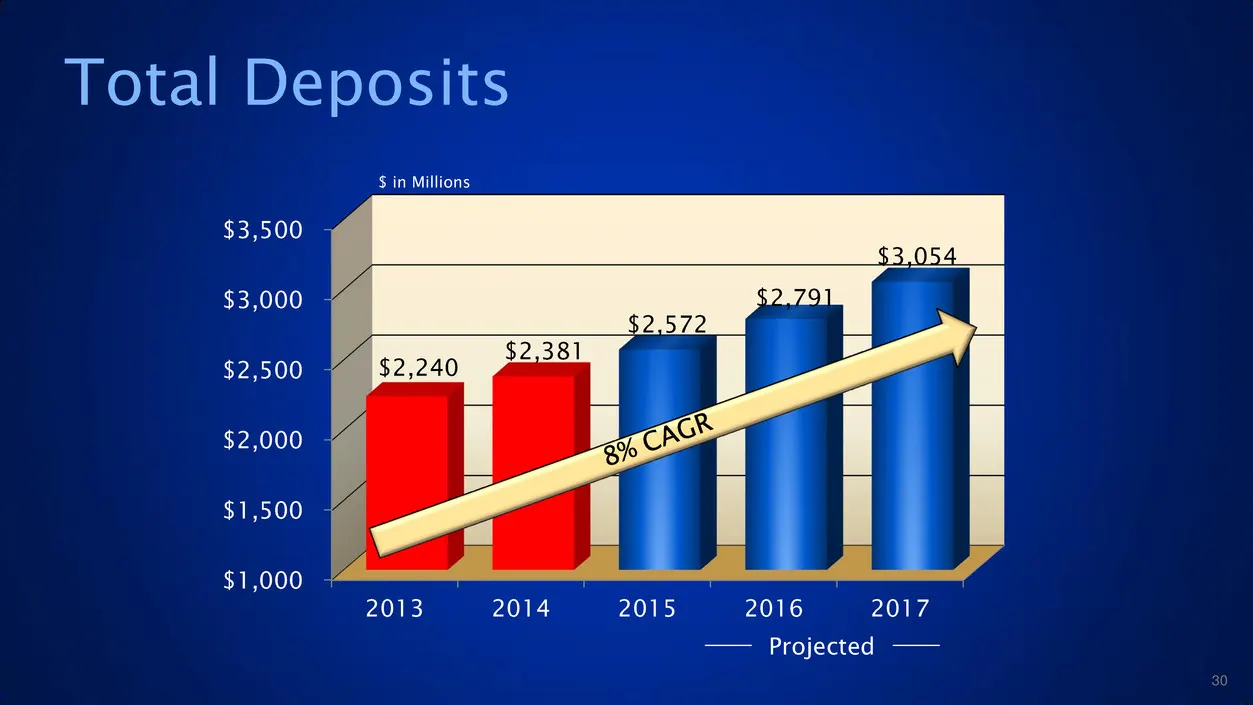
Total Deposits $1,000 $1,500 $2,000 $2,500 $3,000 $3,500 2013 2014 2015 2016 2017 $2,240 $2,381 $2,572 $2,791 $3,054 $ in Millions Projected 30
Slide 31: Strong Capital Position
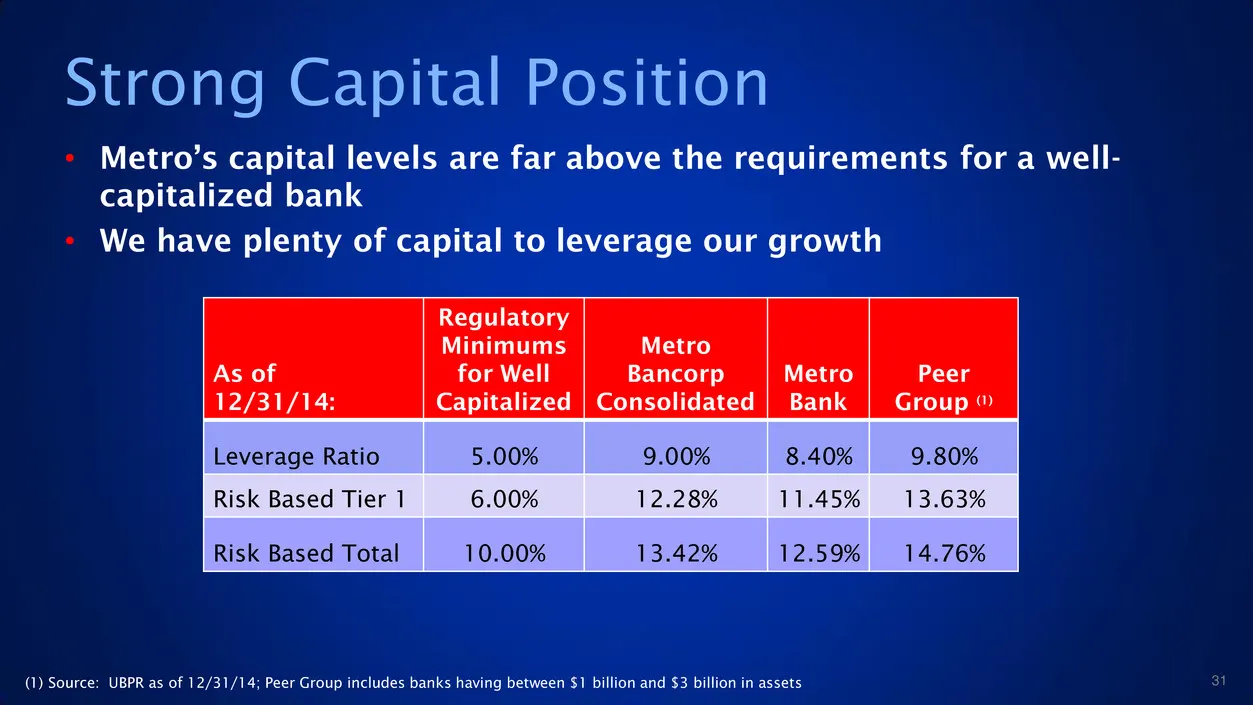
Strong Capital Position • Metro’s capital levels are far above the requirements for a well- capitalized bank • We have plenty of capital to leverage our growth As of 12/31/14: Regulatory Minimums for Well Capitalized Metro Bancorp Consolidated Metro Bank Peer Group (1) Leverage Ratio 5.00% 9.00% 8.4
Slide 32: Common Stock
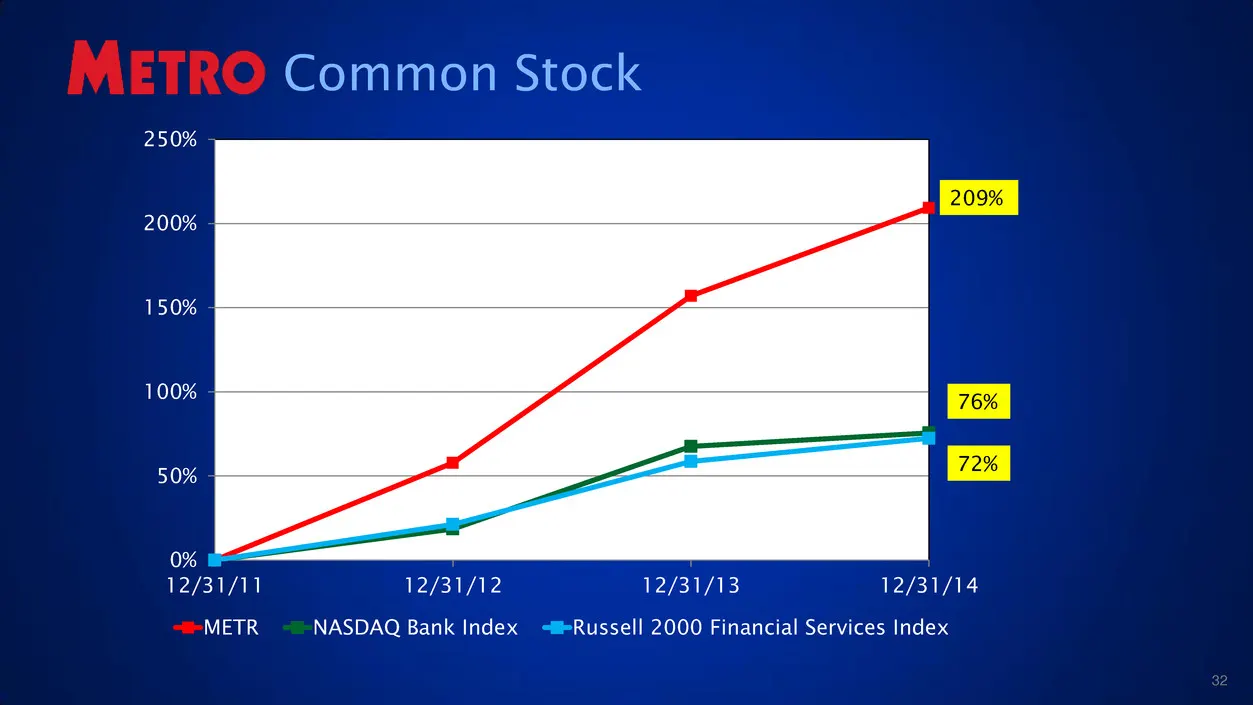
Common Stock 0% 50% 100% 150% 200% 250% 12/31/11 12/31/12 12/31/13 12/31/14 METR NASDAQ Bank Index Russell 2000 Financial Services Index 209% 76% 72% 32
Slide 33: First Quarter 2015 Highlights
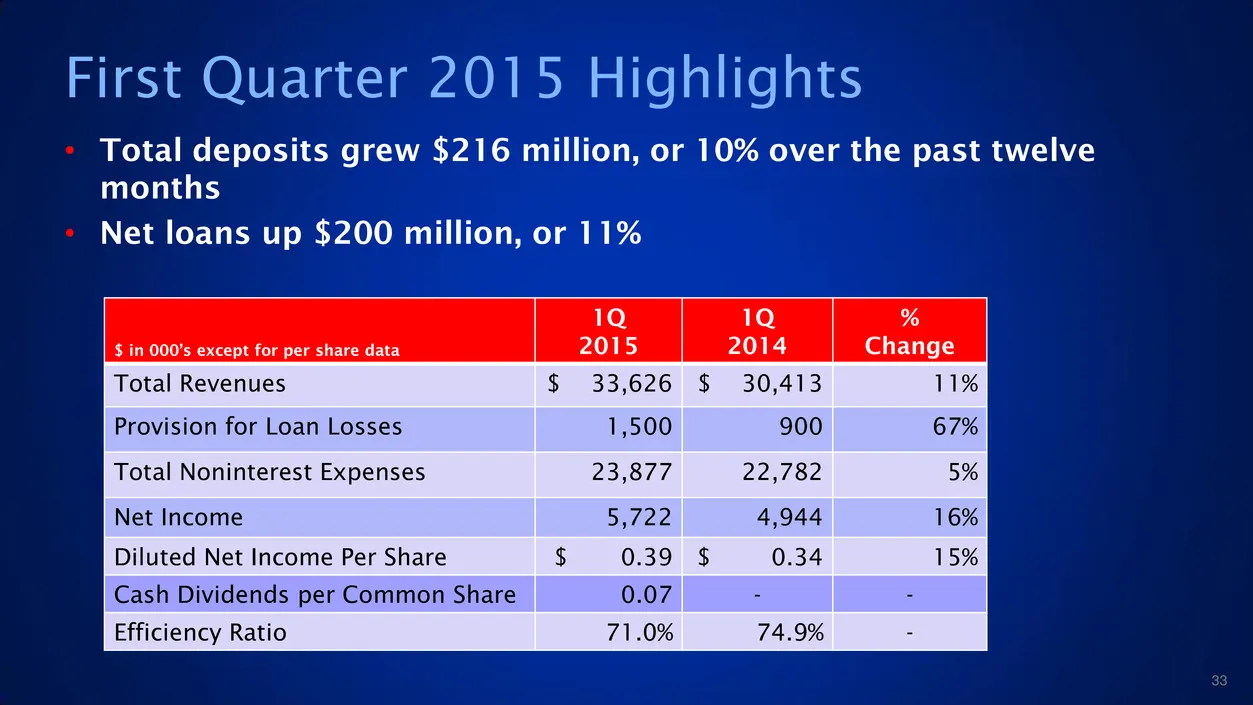
First Quarter 2015 Highlights • Total deposits grew $216 million, or 10% over the past twelve months • Net loans up $200 million, or 11% $ in 000’s except for per share data 1Q 2015 1Q 2014 % Change Total Revenues $ 33,626 $ 30,413 11% Provision for Loan Losses 1,500 900 67% Total Noninterest Expens
Slide 34: Quarterly Net Income and Earnings Per Share
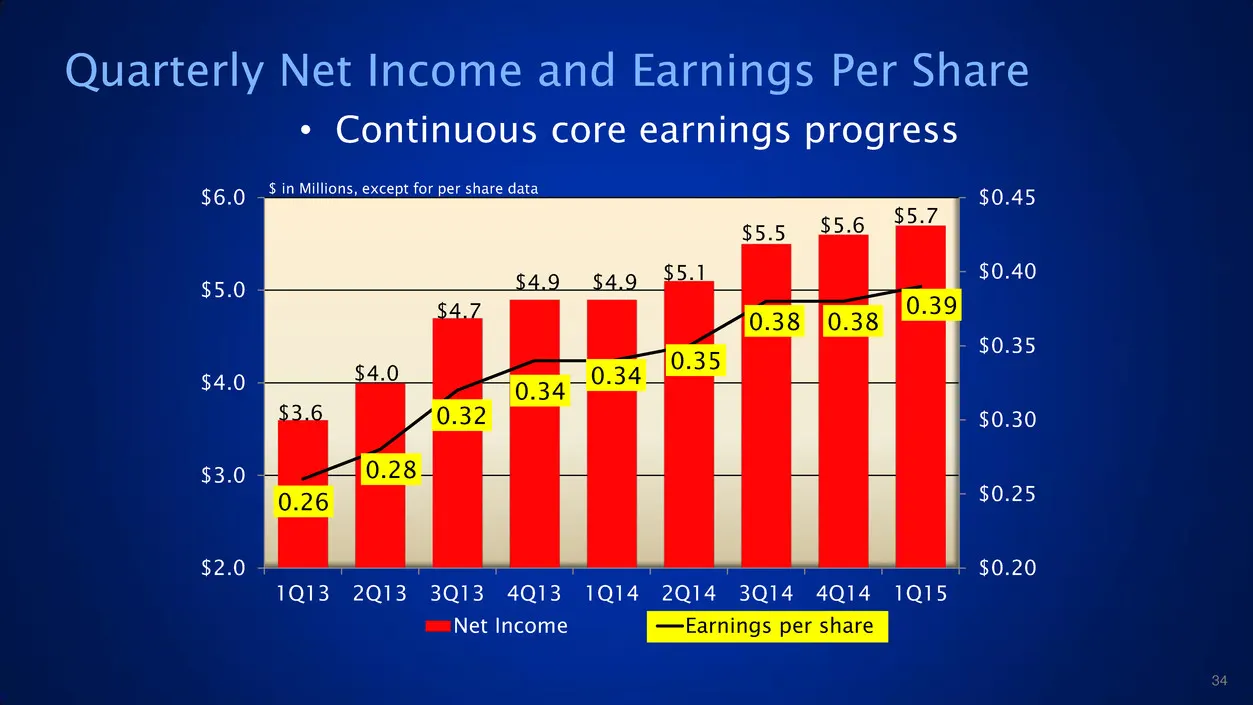
Quarterly Net Income and Earnings Per Share $ in Millions, except for per share data • Continuous core earnings progress 34 $3.6 $4.0 $4.7 $4.9 $4.9 $5.1 $5.5 $5.6 $5.7 0.26 0.28 0.32 0.34 0.34 0.35 0.38 0.38 0.39 $0.20 $0.25 $0.30 $0.35 $0.40 $0.45 $2.0 $3.0 $4.0 $5.0 $6.0 1Q13 2Q13 3Q13 4Q13 1Q14
Slide 35: Annual Shareholders' Meeting June 19, 2015
Annual Shareholders’ Meeting June 19, 2015
Source: SEC EDGAR · 8-K filed Jun 19, 2015
More decks from Metro Bancorp Inc
 Merger or Acquisition (August 2015)15 slides · Aug 4, 2015
 Shareholder Meeting (May 2014)35 slides · May 22, 2014
 Sandler O'Neill & Partners 2013 East Coast Financial Services Conference46 slides · Nov 13, 2013
 Investor Presentation (August 2013)45 slides · Aug 15, 2013
 Shareholder Meeting (May 2013)37 slides · May 17, 2013
 Sterne Agee Financial Institutions Investor Conference February 201342 slides · Feb 11, 2013