Metro Bancorp — Sandler O'Neill & Partners 2013 East Coast Financial Services Conference
46 slides from Metro Bancorp's conference presentation, Nov 13, 2013

Slide 1: Sandler O'Neill 2013 East Coast Financial Services Conference
Sandler O’Neill & Partners, L.P. 2013 East Coast Financial Services Conference November 13 – 15, 2013
Slide 2: Forward-Looking Statements
Forward-Looking Statements This presentation contains projections and other forward- looking statements regarding future events, strategic corporate objectives or the future financial performance of Metro. We wish to caution you that these forward-looking statements may differ materially from actual
Slide 3: Overview
Overview • Headquartered in Harrisburg • Total Assets: $2.8 billion • Total Deposits: $2.2 billion • Total Loans: $1.7 billion • Stores: 33 • Team Members: 980 • NASDAQ Traded, Ticker : METR • Shares Outstanding: 14.2 million • Market Capitalization: $302.1 mm (as of 10/31/13) 3
Slide 4: History of Growth
History of Growth • Began Operations in June 1985 • Reached $500 million in Assets – 2001 • Reached $1 billion in Assets – 2003 • Completed $19.6 million Public Stock Offering – 2004* • Reached $2 billion in Assets – 2008 • Completed $82.5 million Public Stock Offering – 2009* 4 * 2004 and 2009 stoc
Slide 5: Experienced Management Team
Experienced Management Team Gary L. Nalbandian- Chairman/President/CEO Founding Chairman/Director: Since 1985 Mark A. Zody, CPA – Chief Financial Officer Since1988; 25 Years of Banking Experience Percival B. Moser – Chief Operating Officer Since 2011; 32 Years of Banking Experience 5
Slide 6: Experienced Management Team
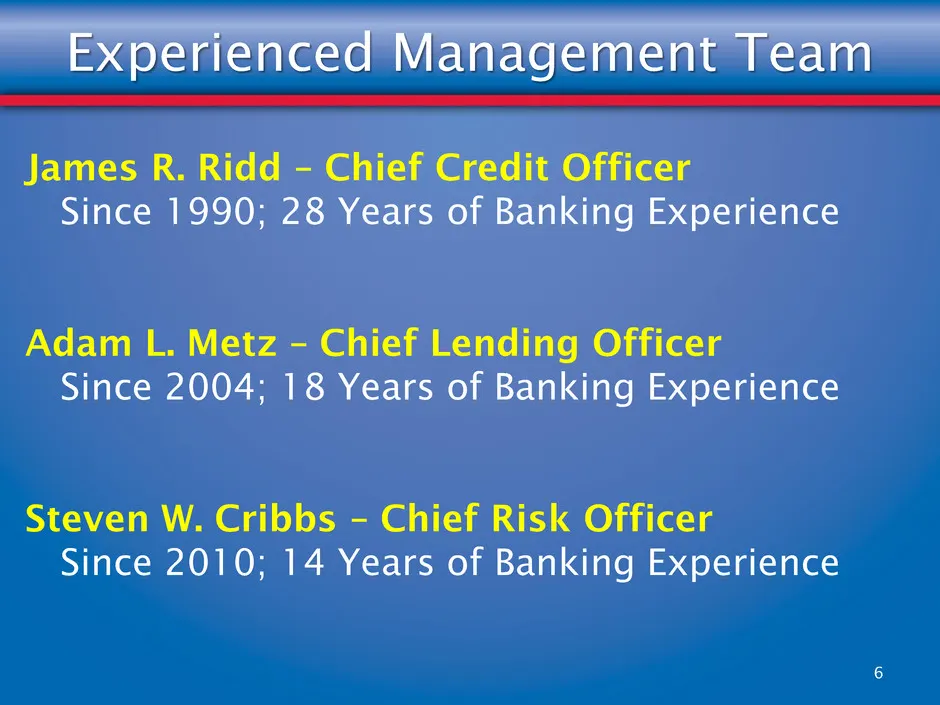
Experienced Management Team James R. Ridd – Chief Credit Officer Since 1990; 28 Years of Banking Experience Adam L. Metz – Chief Lending Officer Since 2004; 18 Years of Banking Experience Steven W. Cribbs – Chief Risk Officer Since 2010; 14 Years of Banking Experience 6
Slide 7: #3 in Market Share – Harrisburg Metro Area
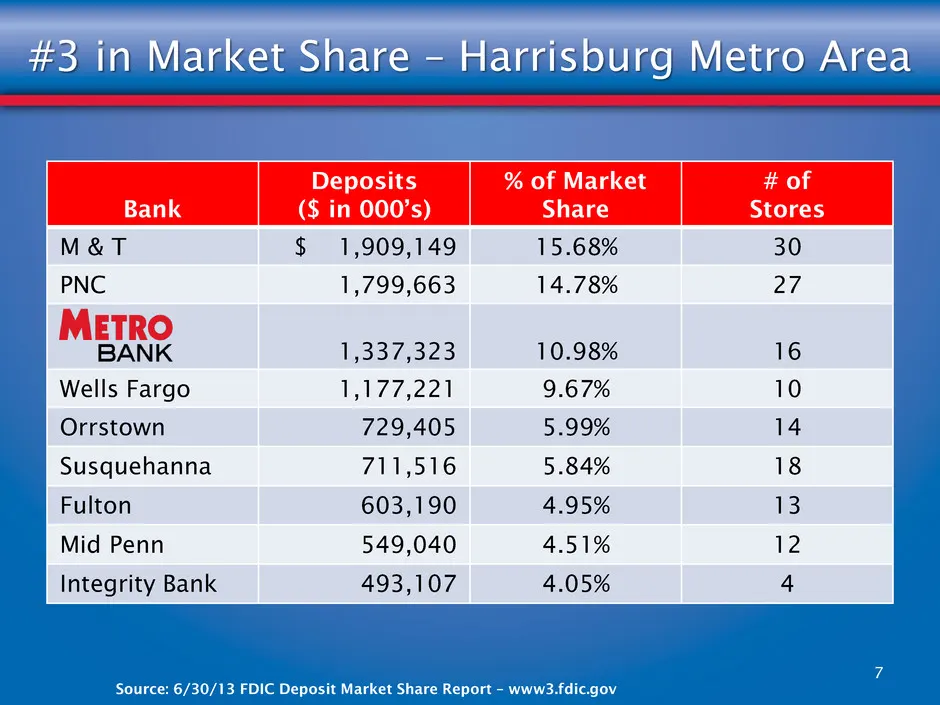
#3 in Market Share – Harrisburg Metro Area Bank Deposits ($ in 000’s) % of Market Share # of Stores M & T $ 1,909,149 15.68% 30 PNC 1,799,663 14.78% 27 1,337,323 10.98% 16 Wells Fargo 1,177,221 9.67% 10 Orrstown 729,405 5.99% 14 Susquehanna 711,516 5.84% 18 Fulton 603,190 4.95% 13 Mid Penn 549,040 4
Slide 8: Market Potential
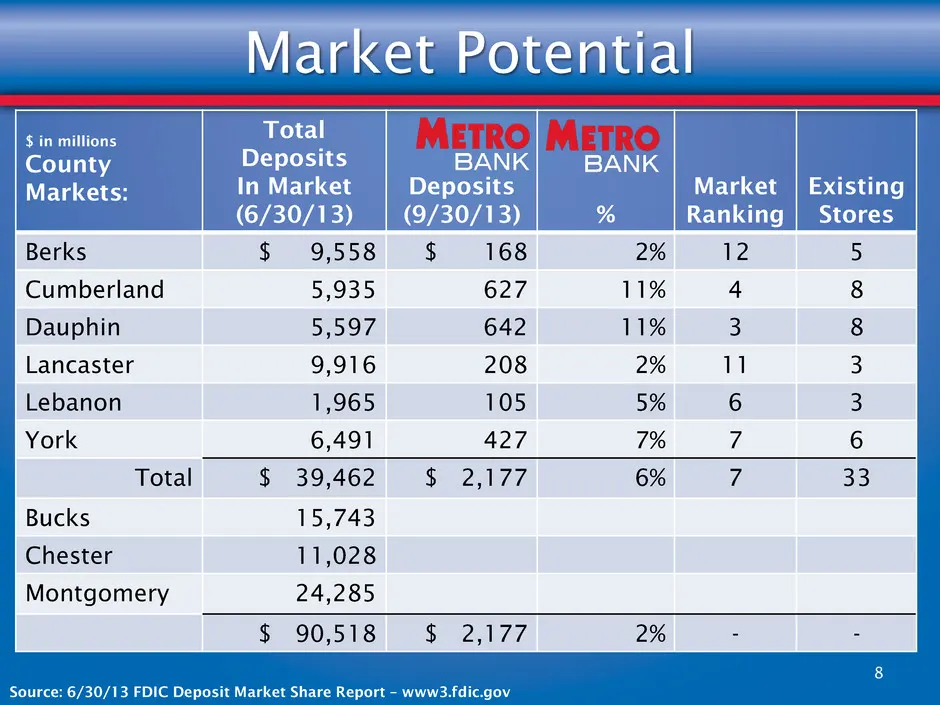
Market Potential 8 $ in millions County Markets: Total Deposits In Market (6/30/13) Deposits (9/30/13) % Market Ranking Existing Stores Berks $ 9,558 $ 168 2% 12 5 Cumberland 5,935 627 11% 4 8 Dauphin 5,597 642 11% 3 8 Lancaster 9,916 208 2% 11 3 Lebanon 1,965 105 5% 6 3 York 6,491 427 7% 7 6 Total
Slide 9: The Model
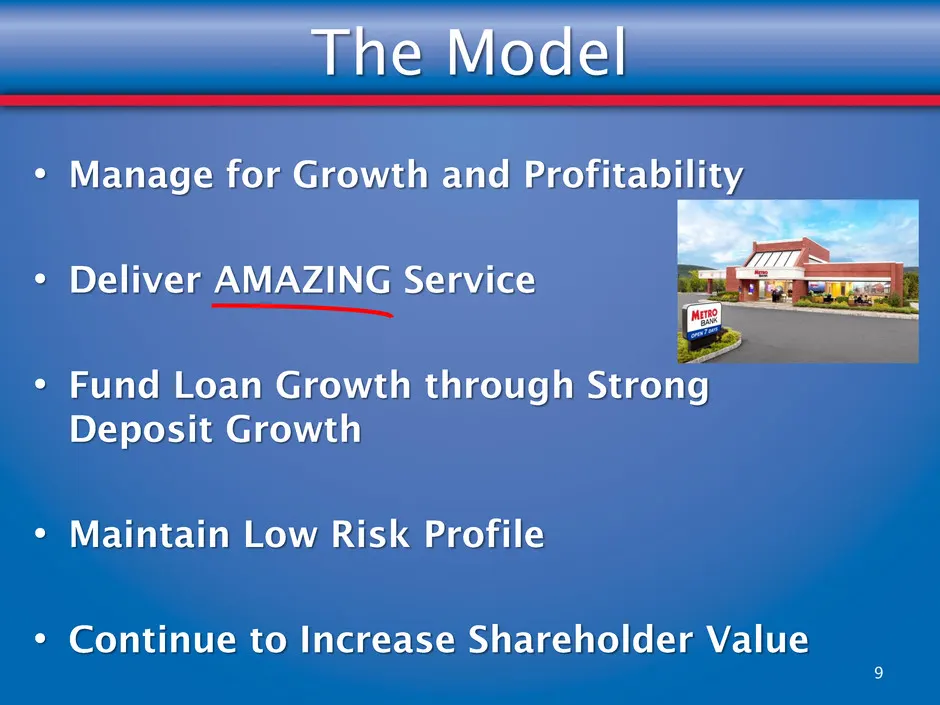
The Model • Manage for Growth and Profitability • Deliver AMAZING Service • Fund Loan Growth through Strong Deposit Growth • Maintain Low Risk Profile • Continue to Increase Shareholder Value 9

Slide 10: The Culture
The Culture • Culture Matches the Model • Clear and Pervasive • Hire for Attitude and Train for Skills • Consistently Reinforce 10

Slide 11: The Training
The Training • Unique Structure: Metro University • Forty-Five in House Courses and E-Learning • Oversee Talent Development • Individual Curriculums for Management, Lending and Professional Development 11
Slide 12: The Execution
The Execution • Believe in The Model • Invest in Facilities and People • 100% Execution • Quality Control • Work Together to Say YES to the Customer 12
Slide 13: The Brand
The Brand MODEL (value differentiating) + CULTURE (unique) + EXECUTION (fanatical) = THE DIFFERENCE 13

Slide 14: Financial Review
FINANCIAL REVIEW METRO BANK
Slide 15: Third Quarter 2013 Highlights
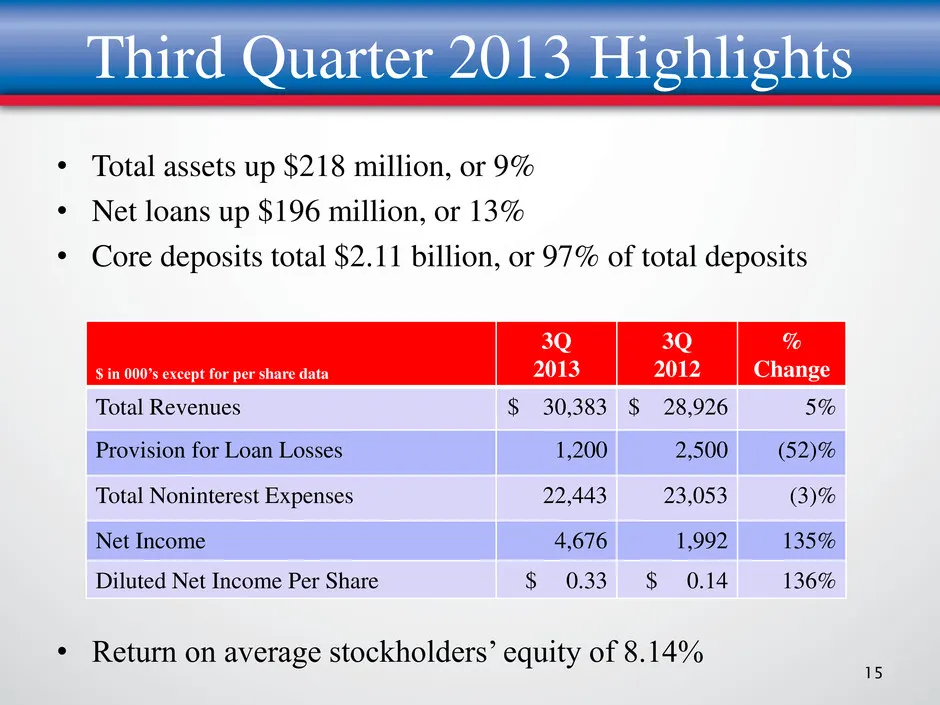
Third Quarter 2013 Highlights • Total assets up $218 million, or 9% • Net loans up $196 million, or 13% • Core deposits total $2.11 billion, or 97% of total deposits 15 $ in 000’s except for per share data 3Q 2013 3Q 2012 % Change Total Revenues $ 30,383 $ 28,926 5% Provision for Loan Losses 1,200 2
Slide 16: First Nine Months of 2013 Highlights
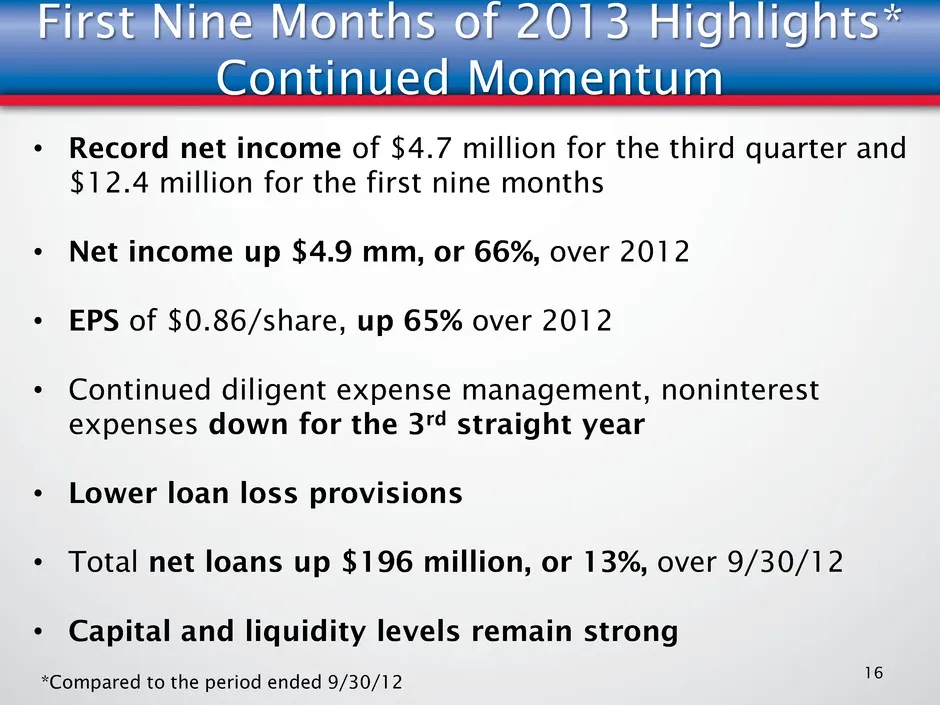
First Nine Months of 2013 Highlights* Continued Momentum 16 • Record net income of $4.7 million for the third quarter and $12.4 million for the first nine months • Net income up $4.9 mm, or 66%, over 2012 • EPS of $0.86/share, up 65% over 2012 • Continued diligent expense management, noninterest exp
Slide 17: Total Assets
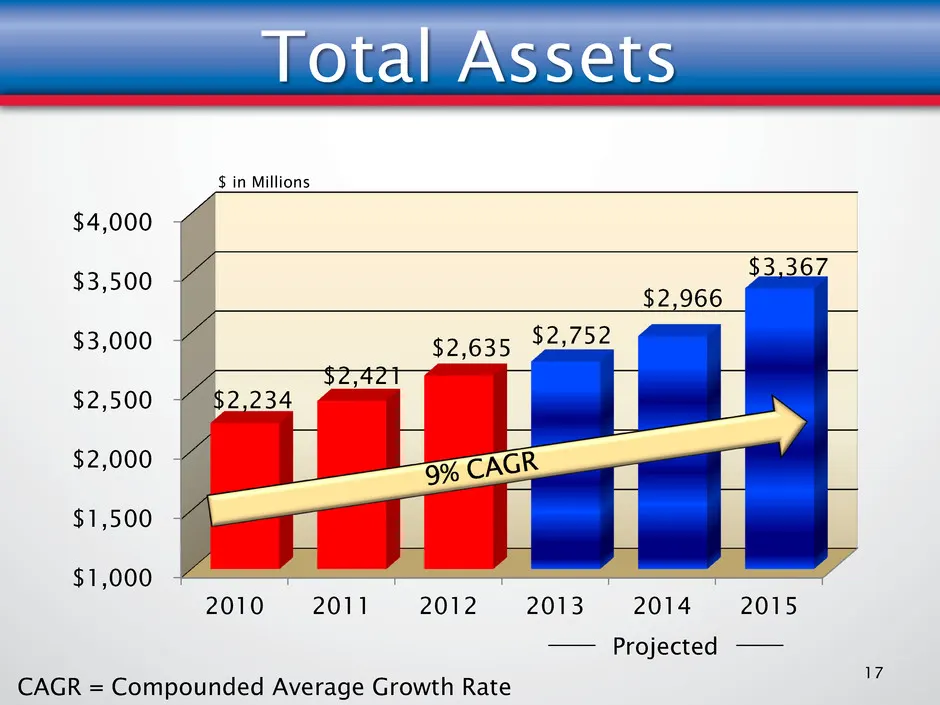
Total Assets $1,000 $1,500 $2,000 $2,500 $3,000 $3,500 $4,000 2010 2011 2012 2013 2014 2015 $2,234 $2,421 $2,635 $2,752 $2,966 $3,367 17 $ in Millions CAGR = Compounded Average Growth Rate Projected
Slide 18: Total Loans (net)
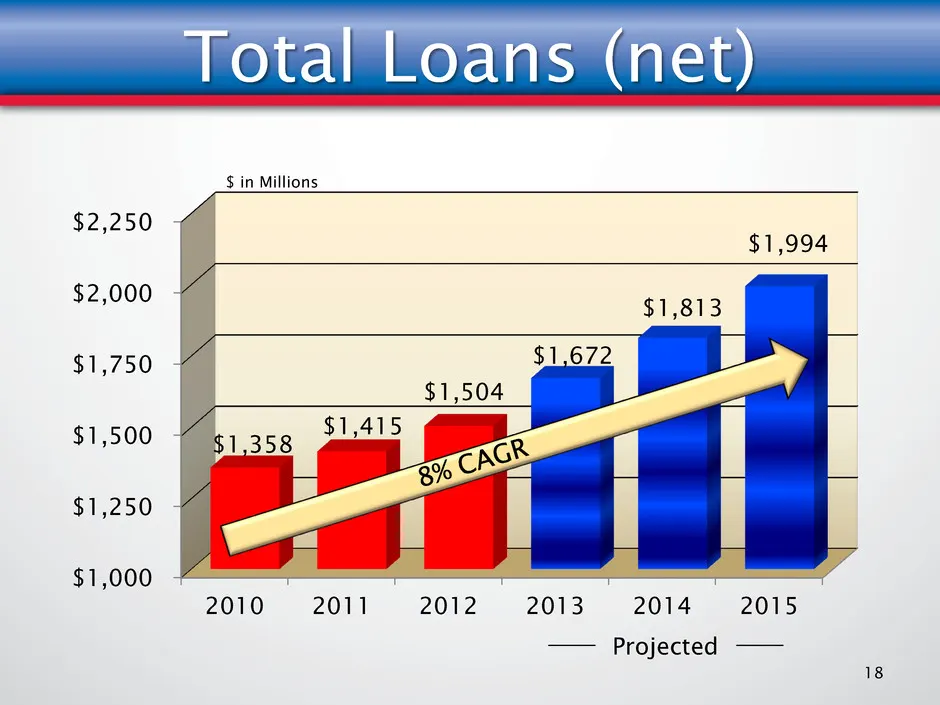
Total Loans (net) $1,000 $1,250 $1,500 $1,750 $2,000 $2,250 2010 2011 2012 2013 2014 2015 $1,358 $1,415 $1,504 $1,672 $1,813 $1,994 18 $ in Millions Projected
Slide 19: Total Deposits
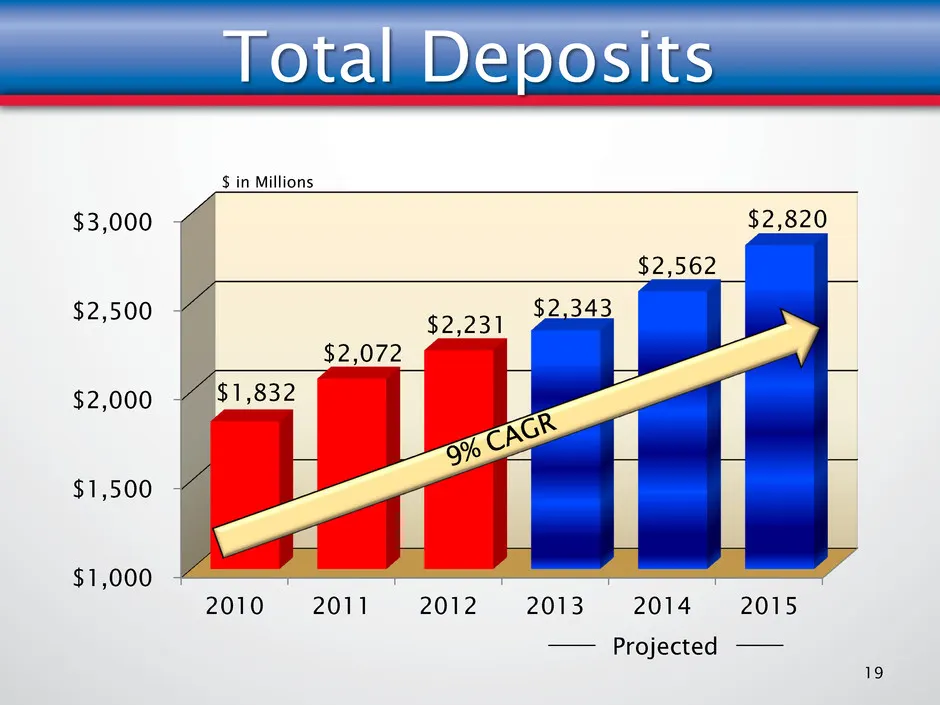
Total Deposits $1,000 $1,500 $2,000 $2,500 $3,000 2010 2011 2012 2013 2014 2015 $1,832 $2,072 $2,231 $2,343 $2,562 $2,820 19 $ in Millions Projected
Slide 20: Strong Core Deposit Foundation
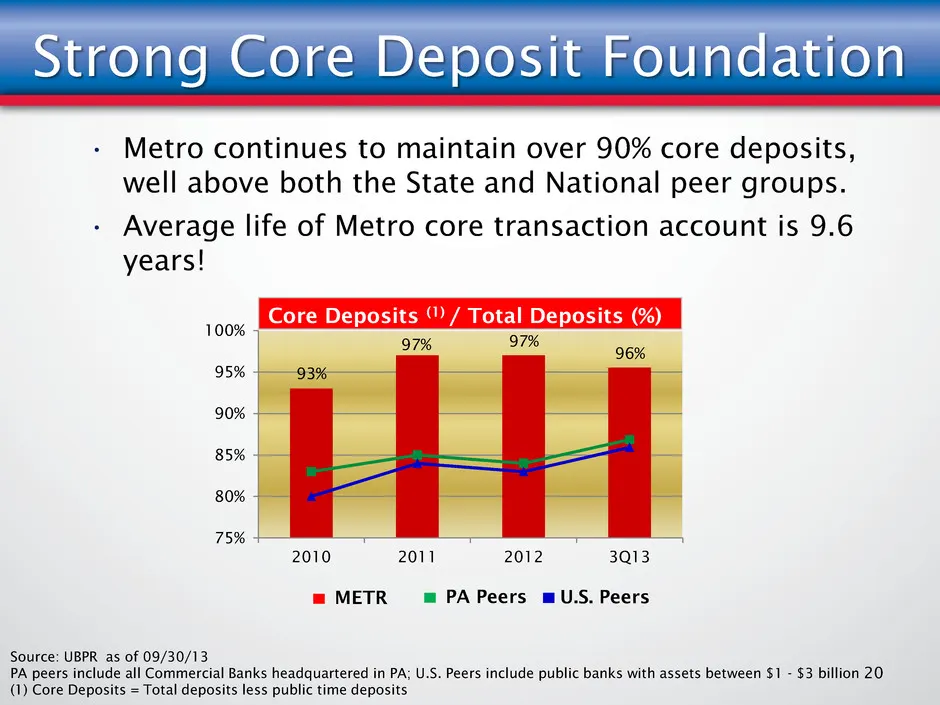
Strong Core Deposit Foundation 20 93% 97% 97% 96% 75% 80% 85% 90% 95% 100% 2010 2011 2012 3Q13 Source: UBPR as of 09/30/13 PA peers include all Commercial Banks headquartered in PA; U.S. Peers include public banks with assets between $1 - $3 billion (1) Core Deposits = Total deposits less public tim
Slide 21: Deposit Mix
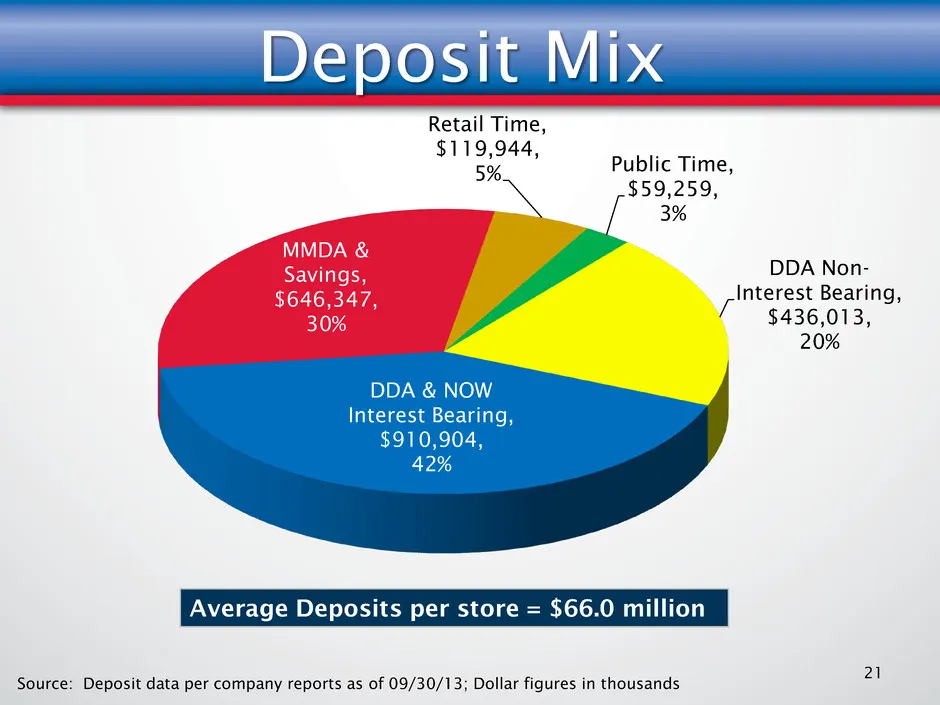
DDA Non- Interest Bearing, $436,013, 20% DDA & NOW Interest Bearing, $910,904, 42% MMDA & Savings, $646,347, 30% Retail Time, $119,944, 5% Public Time, $59,259, 3% Average Deposits per store = $66.0 million Source: Deposit data per company reports as of 09/30/13; Dollar figures in thousands Deposit
Slide 22: Net Interest Margin: A Key Source of Franchise Strength
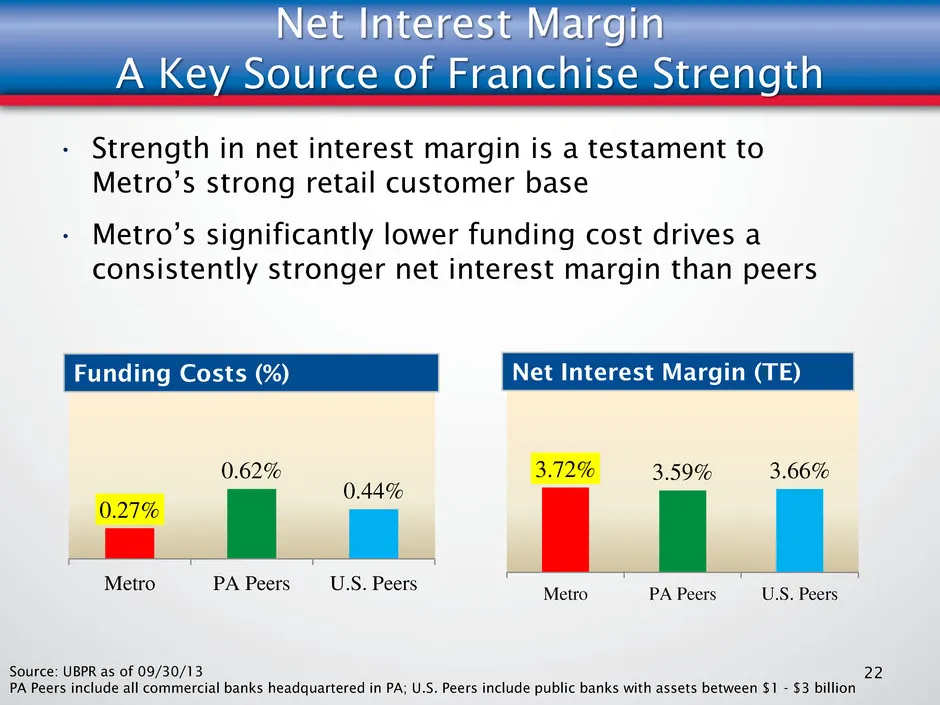
3.72% 3.59% 3.66% Metro PA Peers U.S. Peers Net Interest Margin A Key Source of Franchise Strength 22 • Strength in net interest margin is a testament to Metro’s strong retail customer base • Metro’s significantly lower funding cost drives a consistently stronger net interest margin than peers Sourc
Slide 23: Net Interest Income Growth
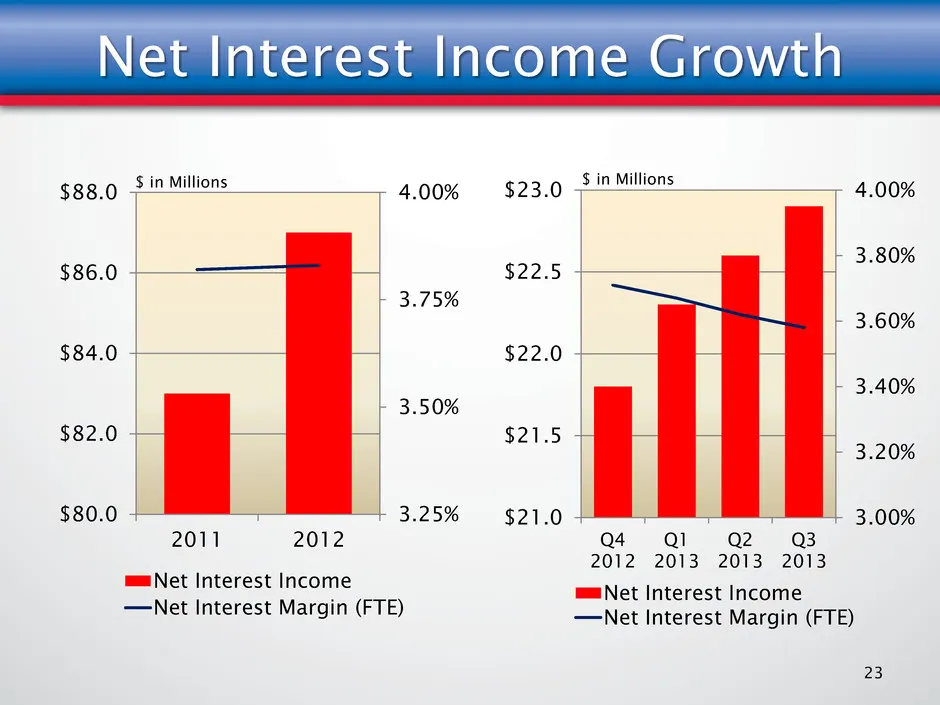
Net Interest Income Growth 3.00% 3.20% 3.40% 3.60% 3.80% 4.00% $21.0 $21.5 $22.0 $22.5 $23.0 Q4 2012 Q1 2013 Q2 2013 Q3 2013 Net Interest Income Net Interest Margin (FTE) 3.25% 3.50% 3.75% 4.00% $80.0 $82.0 $84.0 $86.0 $88.0 2011 2012 Net Interest Income Net Interest Margin (FTE) 23 $ in Millions $
Slide 24: Revenue Growth
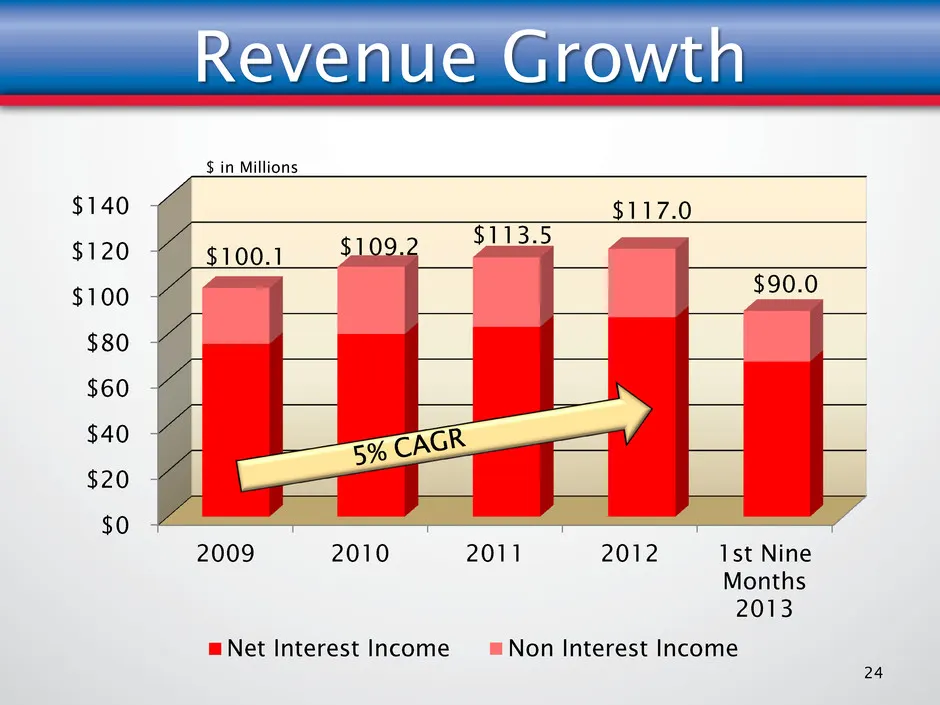
Revenue Growth $0 $20 $40 $60 $80 $100 $120 $140 2009 2010 2011 2012 1st Nine Months 2013 Net Interest Income Non Interest Income 24 $ in Millions $100.1 $109.2 $113.5 $117.0 $90.0
Slide 25: Prudent Expense Management
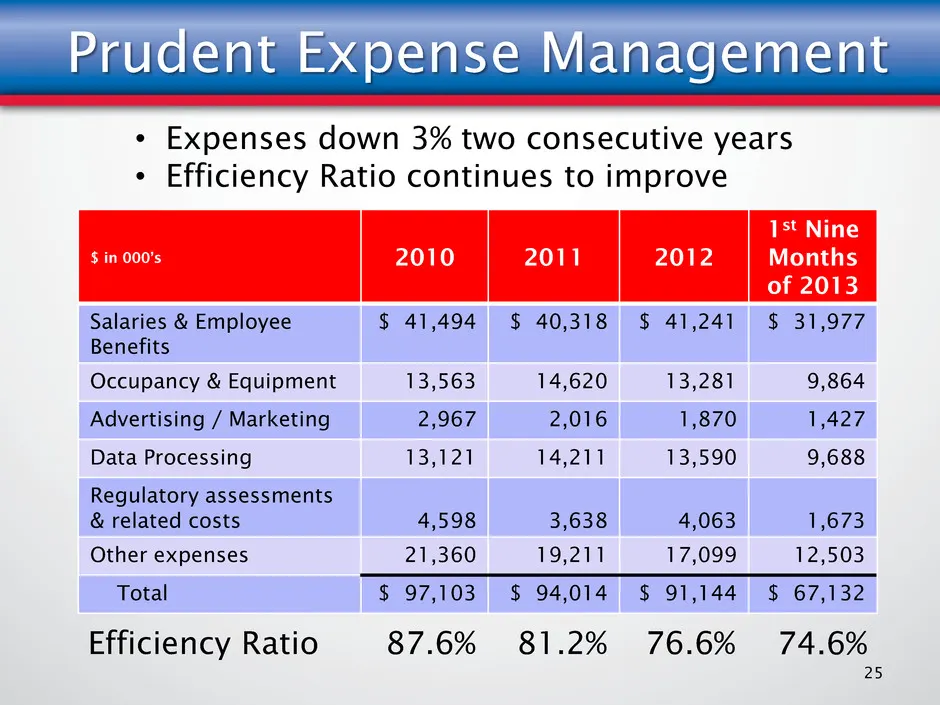
Prudent Expense Management $ in 000’s 2010 2011 2012 1st Nine Months of 2013 Salaries & Employee Benefits $ 41,494 $ 40,318 $ 41,241 $ 31,977 Occupancy & Equipment 13,563 14,620 13,281 9,864 Advertising / Marketing 2,967 2,016 1,870 1,427 Data Processing 13,121 14,211 13,590 9,688 Regulatory assessm
Slide 26: Growth Without Increasing Expenses
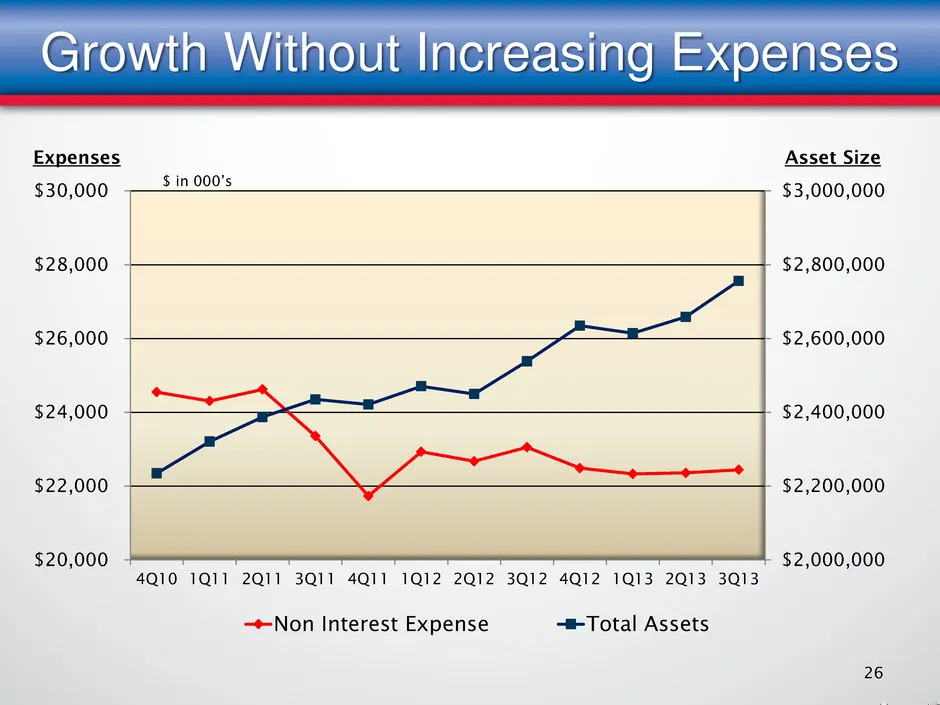
$2,000,000 $2,200,000 $2,400,000 $2,600,000 $2,800,000 $3,000,000 $20,000 $22,000 $24,000 $26,000 $28,000 $30,000 4Q10 1Q11 2Q11 3Q11 4Q11 1Q12 2Q12 3Q12 4Q12 1Q13 2Q13 3Q13 Non Interest Expense Total Assets 26 $ in 000’s Growth Without Increasing Expenses Expenses Asset Size
Slide 27: Improved Profitability
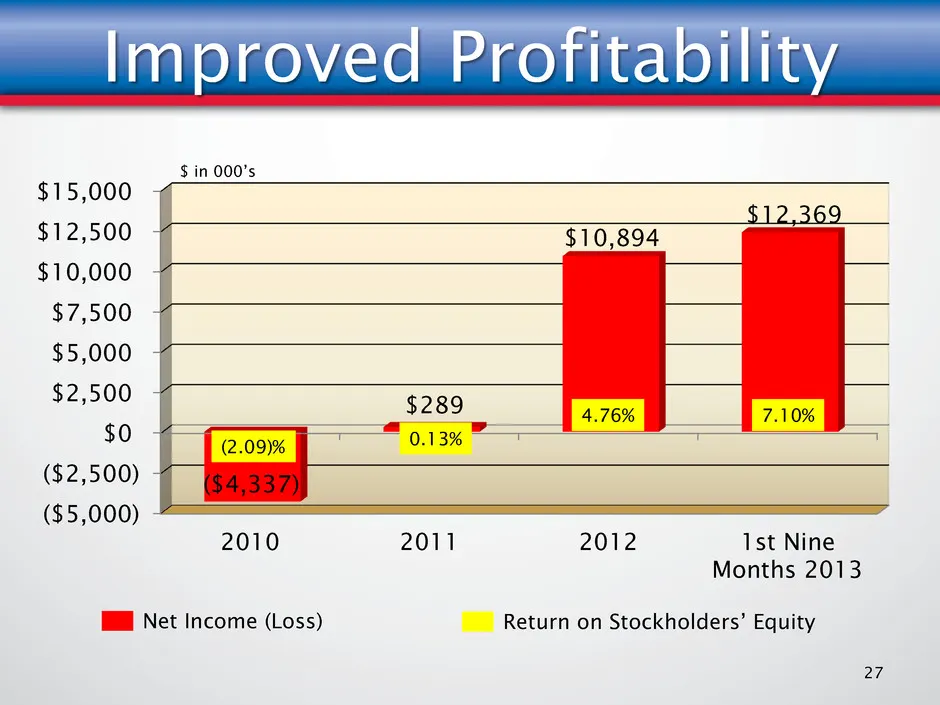
Improved Profitability ($5,000) ($2,500) $0 $2,500 $5,000 $7,500 $10,000 $12,500 $15,000 2010 2011 2012 1st Nine Months 2013 ($4,337) $289 $10,894 $12,369 27 Net Income (Loss) (2.09)% 0.13% 4.76% $ in 000’s Return on Stockholders’ Equity 7.10%
Slide 28: Quarterly Net Income and Earnings Per Share
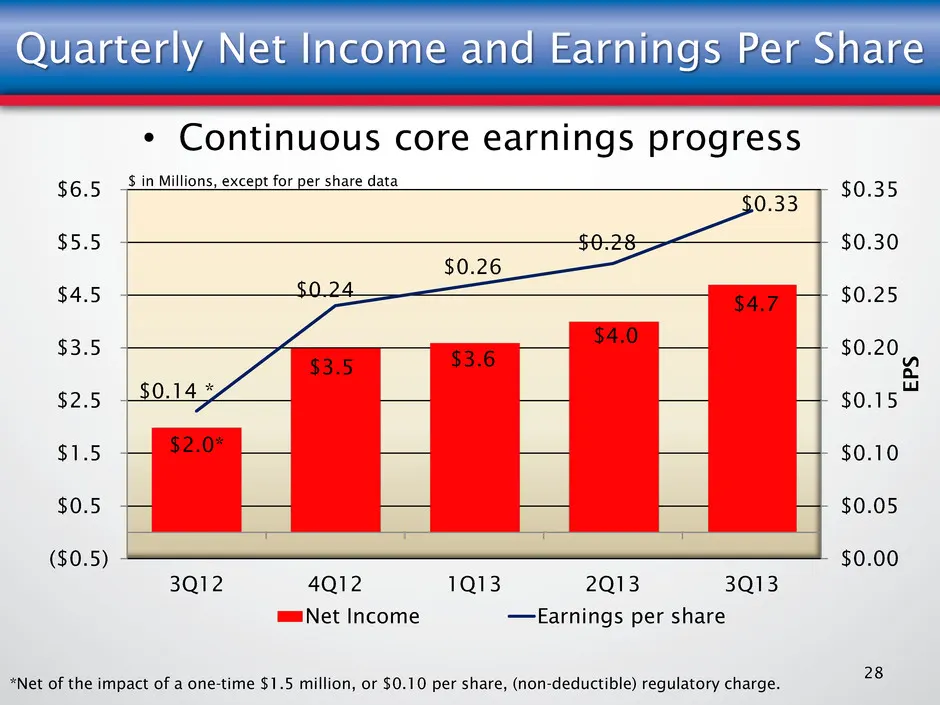
$2.0* $3.5 $3.6 $4.0 $4.7 $0.14 * $0.24 $0.26 $0.28 $0.33 $0.00 $0.05 $0.10 $0.15 $0.20 $0.25 $0.30 $0.35 ($0.5) $0.5 $1.5 $2.5 $3.5 $4.5 $5.5 $6.5 3Q12 4Q12 1Q13 2Q13 3Q13 E P S Net Income Earnings per share Quarterly Net Income and Earnings Per Share 28 $ in Millions, except for per share data *Ne
Slide 29: Investment Portfolio
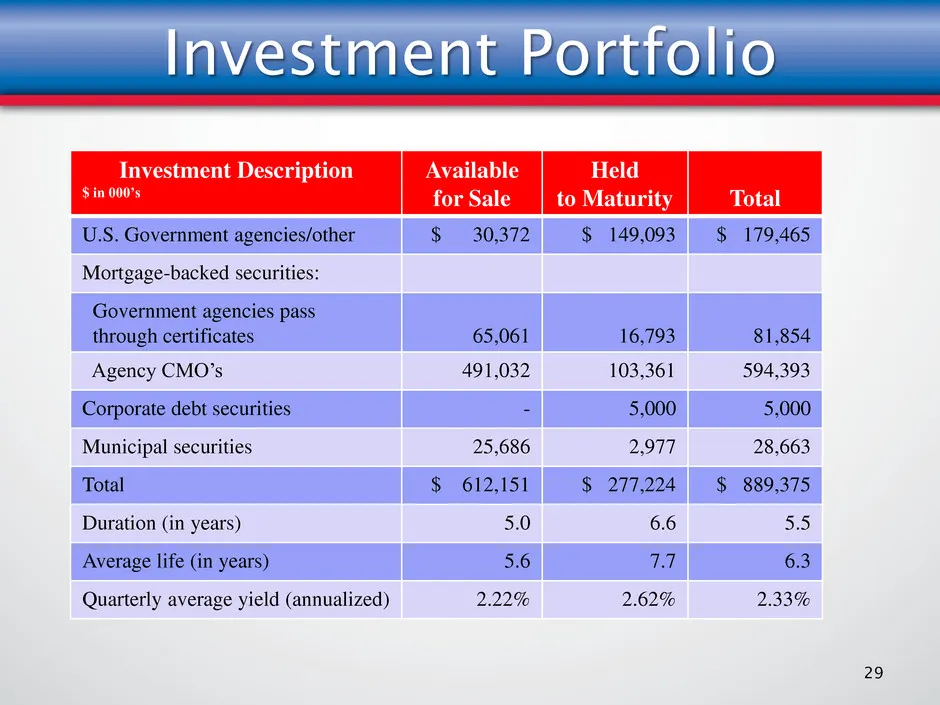
Investment Portfolio Investment Description $ in 000’s Available for Sale Held to Maturity Total U.S. Government agencies/other $ 30,372 $ 149,093 $ 179,465 Mortgage-backed securities: Government agencies pass through certificates 65,061 16,793 81,854 Agency CMO’s 491,032 103,361 594,393 Corporate d
Slide 30: Strong Capital Position
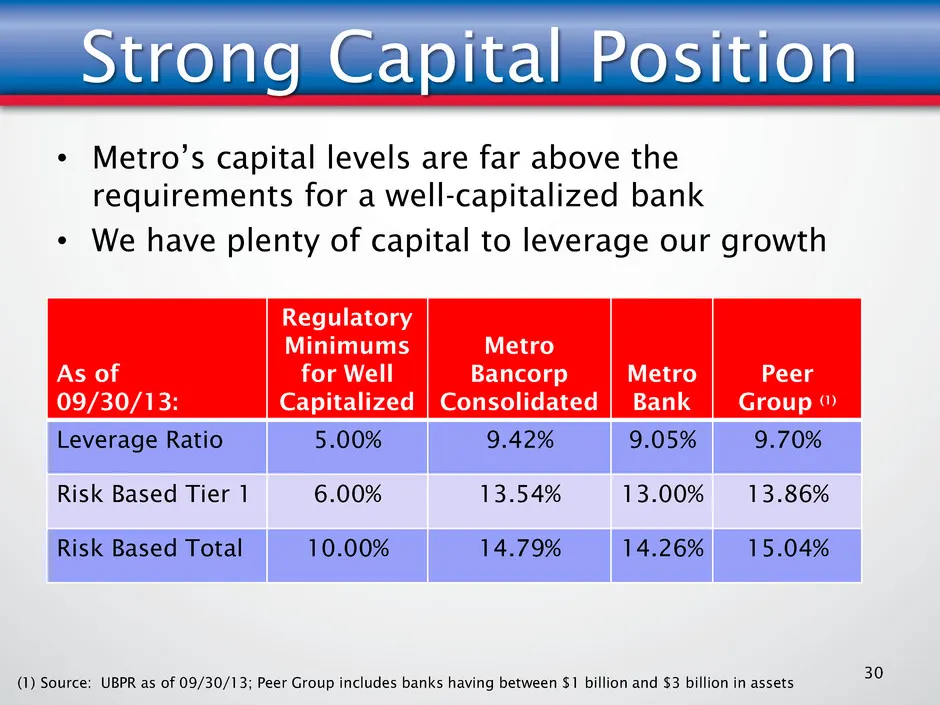
Strong Capital Position • Metro’s capital levels are far above the requirements for a well-capitalized bank • We have plenty of capital to leverage our growth 30 As of 09/30/13: Regulatory Minimums for Well Capitalized Metro Bancorp Consolidated Metro Bank Peer Group (1) Leverage Ratio 5.00% 9.42% 9
Slide 31: Capital Trends
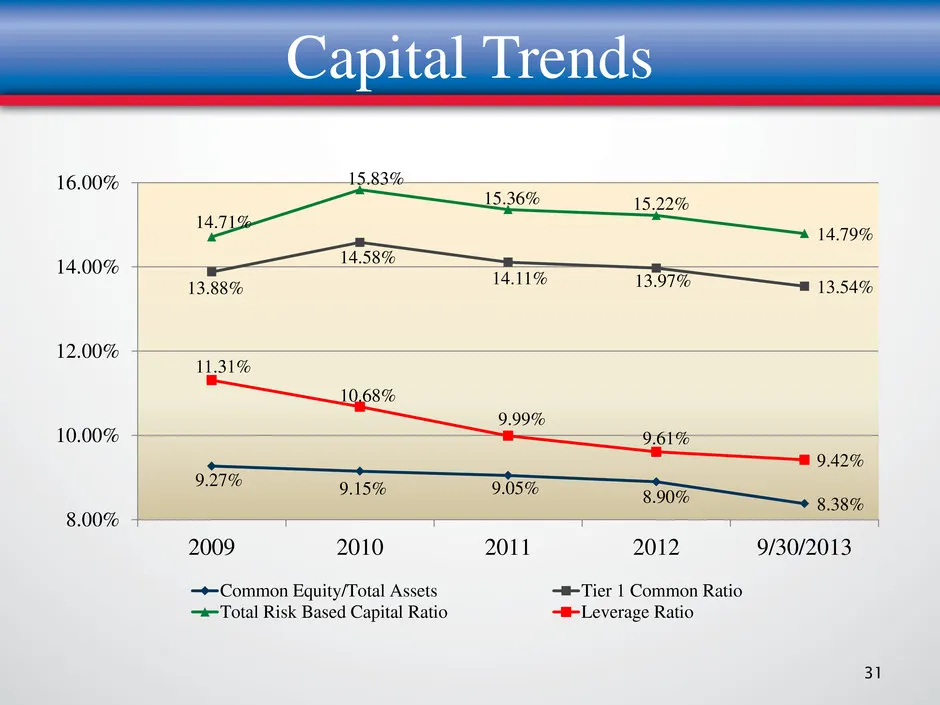
Capital Trends 9.27% 9.15% 9.05% 8.90% 8.38% 13.88% 14.58% 14.11% 13.97% 13.54% 14.71% 15.83% 15.36% 15.22% 14.79% 11.31% 10.68% 9.99% 9.61% 9.42% 8.00% 10.00% 12.00% 14.00% 16.00% 2009 2010 2011 2012 9/30/2013 Common Equity/Total Assets Tier 1 Common Ratio Total Risk Based Capital Ratio Leverage Ra
Slide 32: Common Stock
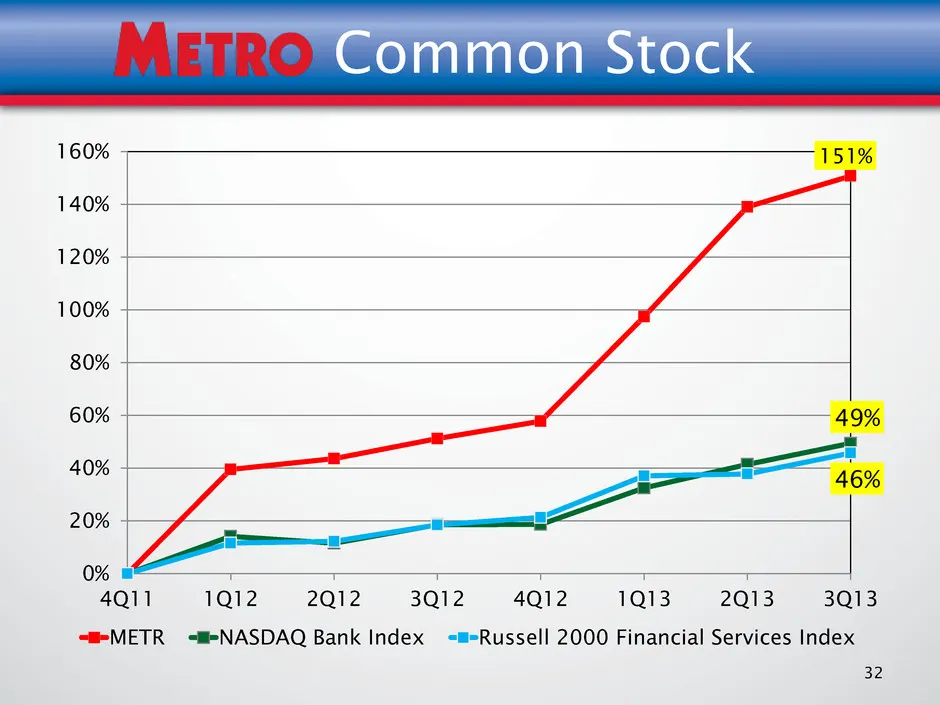
32 Common Stock 151% 49% 46% 0% 20% 40% 60% 80% 100% 120% 140% 160% 4Q11 1Q12 2Q12 3Q12 4Q12 1Q13 2Q13 3Q13 METR NASDAQ Bank Index Russell 2000 Financial Services Index

Slide 33: Lending & Asset Quality
LENDING & ASSET QUALITY imETRO BANK
Slide 34: Consistent, Quality Loan Growth
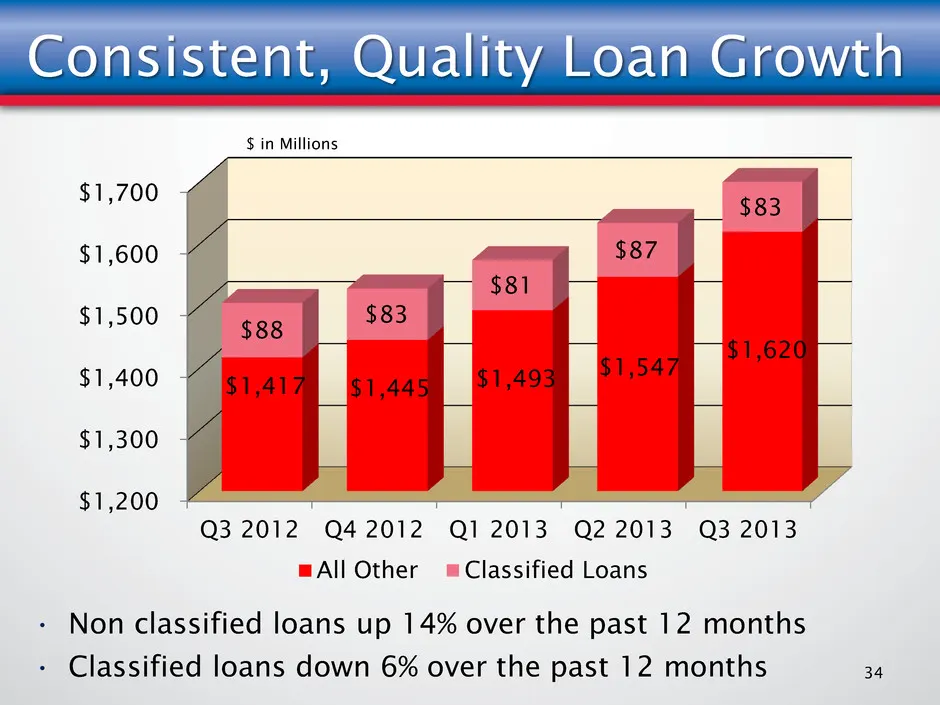
Consistent, Quality Loan Growth $1,200 $1,300 $1,400 $1,500 $1,600 $1,700 Q3 2012 Q4 2012 Q1 2013 Q2 2013 Q3 2013 $1,417 $1,445 $1,493 $1,547 $1,620 $88 $83 $81 $87 $83 All Other Classified Loans 34 $ in Millions • Non classified loans up 14% over the past 12 months • Classified loans down 6% over t
Slide 35: Loan Portfolio Mix
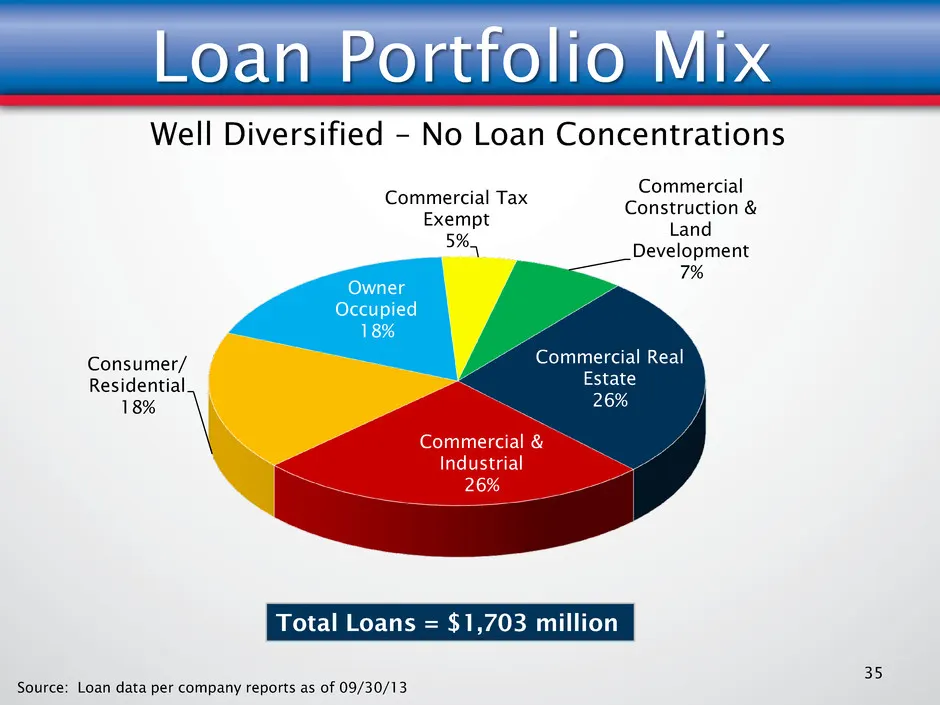
Commercial Real Estate 26% Commercial & Industrial 26% Consumer/ Residential 18% Owner Occupied 18% Commercial Tax Exempt 5% Commercial Construction & Land Development 7% Total Loans = $1,703 million Source: Loan data per company reports as of 09/30/13 Loan Portfolio Mix 35 Well Diversified – No Loa
Slide 36: Real Estate & Construction Loans
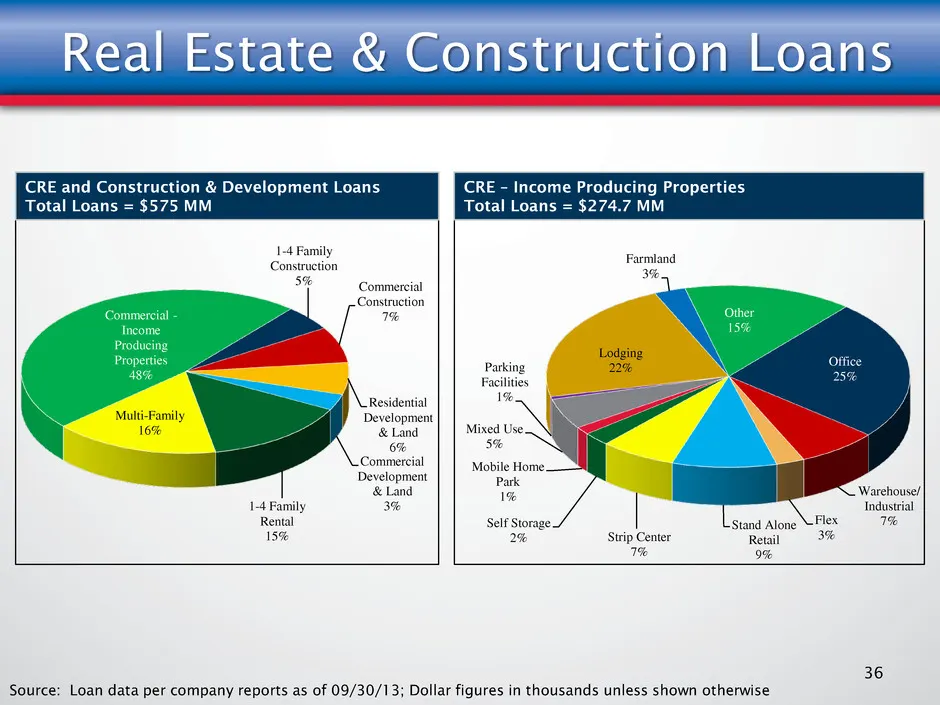
1-4 Family Construction 5% Commercial Construction 7% Residential Development & Land 6% Commercial Development & Land 3% 1-4 Family Rental 15% Multi-Family 16% Commercial - Income Producing Properties 48% Source: Loan data per company reports as of 09/30/13; Dollar figures in thousands unless shown
Slide 37: Stress Test/Capital Ratio Impact
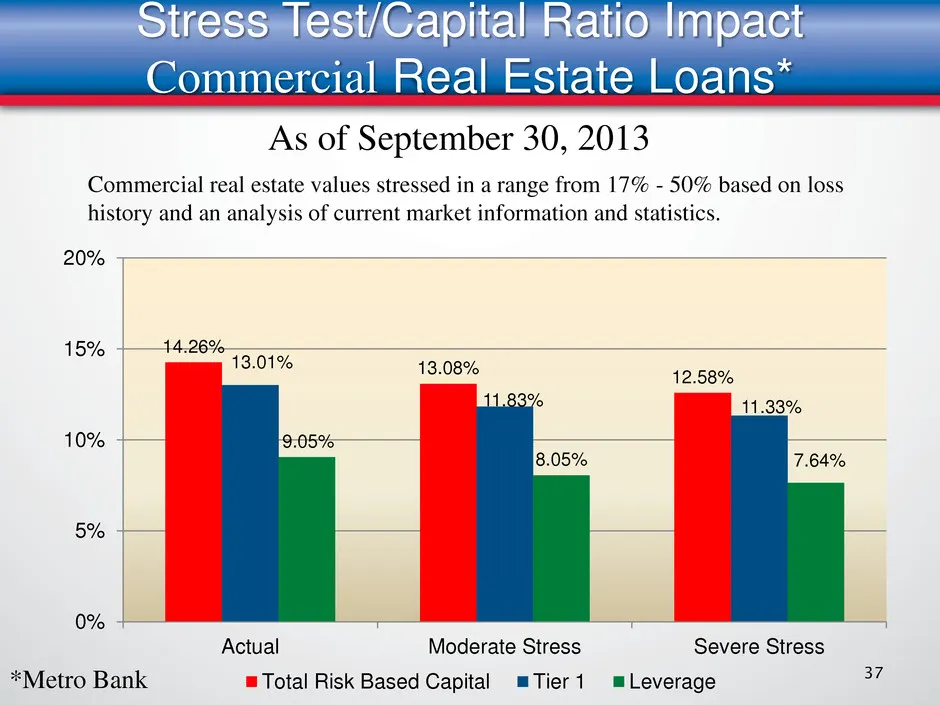
Stress Test/Capital Ratio Impact Commercial Real Estate Loans* 14.26% 13.08% 12.58% 13.01% 11.83% 11.33% 9.05% 8.05% 7.64% 0% 5% 10% 15% 20% Actual Moderate Stress Severe Stress Total Risk Based Capital Tier 1 Leverage 37 Commercial real estate values stressed in a range from 17% - 50% based on loss
Slide 38: Large Loan Relationships
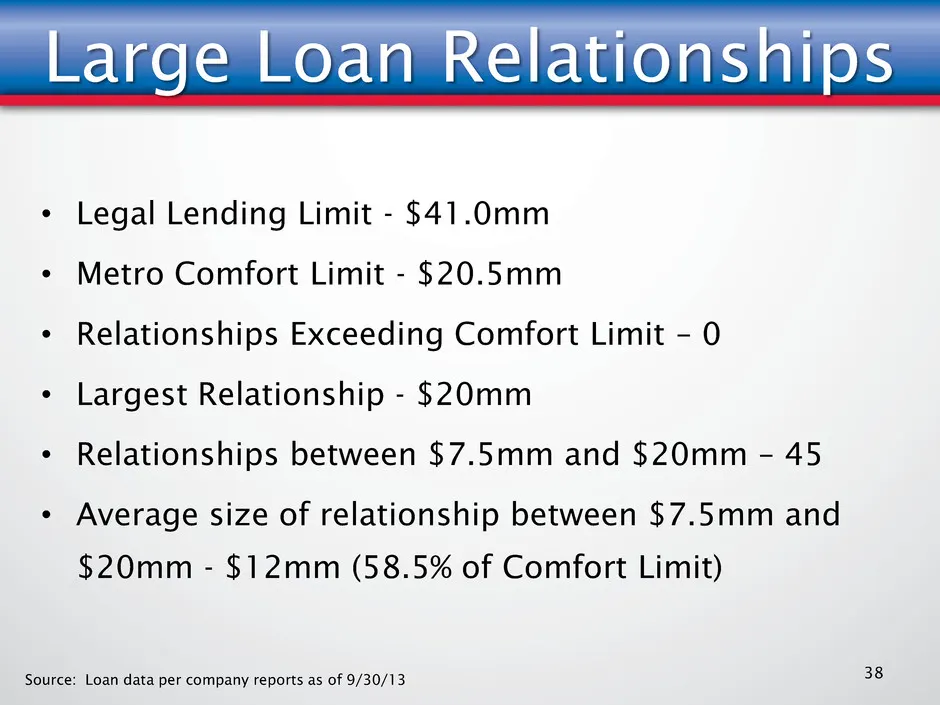
Large Loan Relationships • Legal Lending Limit - $41.0mm • Metro Comfort Limit - $20.5mm • Relationships Exceeding Comfort Limit – 0 • Largest Relationship - $20mm • Relationships between $7.5mm and $20mm – 45 • Average size of relationship between $7.5mm and $20mm - $12mm (58.5% of Comfort Limit) 3
Slide 39: Loan Performance
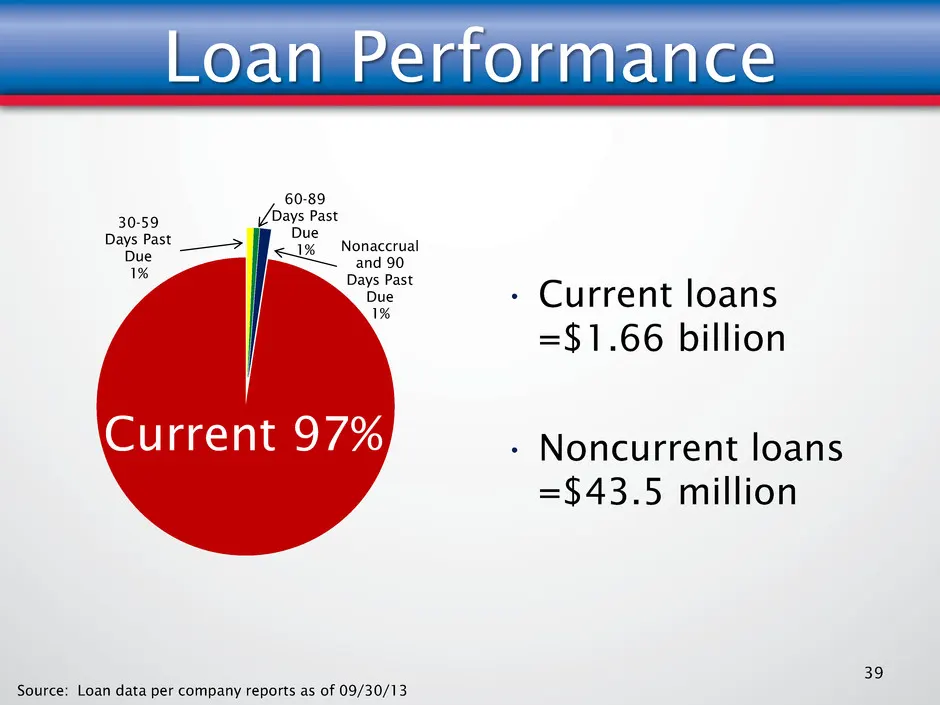
Source: Loan data per company reports as of 09/30/13 Loan Performance 39 30-59 Days Past Due 1% 60-89 Days Past Due 1% Nonaccrual and 90 Days Past Due 1% Current 97% • Current loans =$1.66 billion • Noncurrent loans =$43.5 million
Slide 40: Asset Quality and Loan Loss Reserve Trends
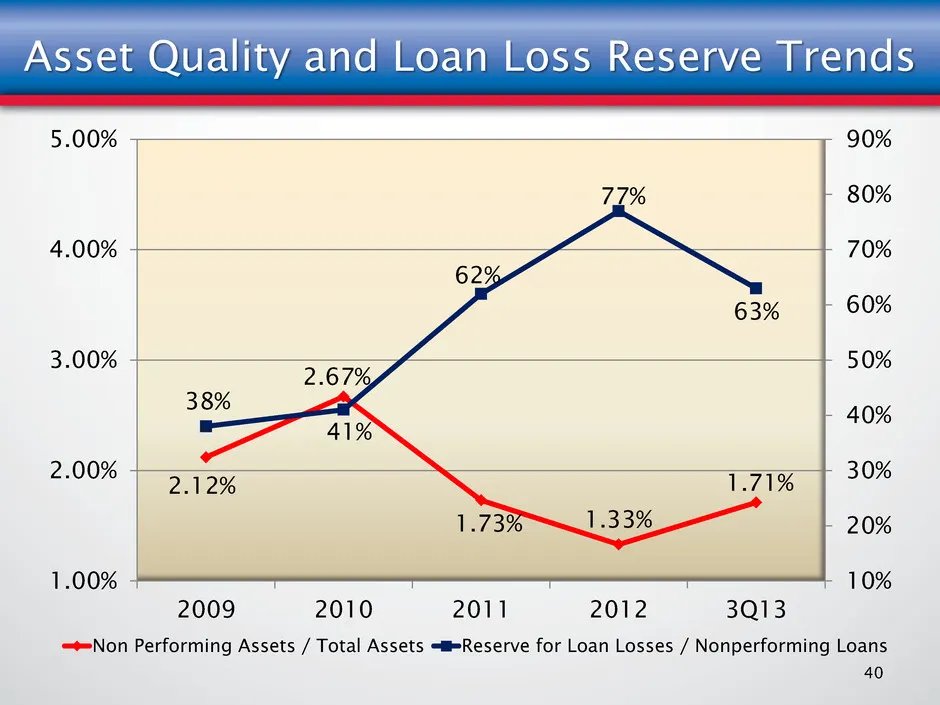
Asset Quality and Loan Loss Reserve Trends 40 2.12% 2.67% 1.73% 1.33% 1.71% 38% 41% 62% 77% 63% 10% 20% 30% 40% 50% 60% 70% 80% 90% 1.00% 2.00% 3.00% 4.00% 5.00% 2009 2010 2011 2012 3Q13 Non Performing Assets / Total Assets Reserve for Loan Losses / Nonperforming Loans
Slide 41: Net Loan Charge-Offs/Avg. Loans
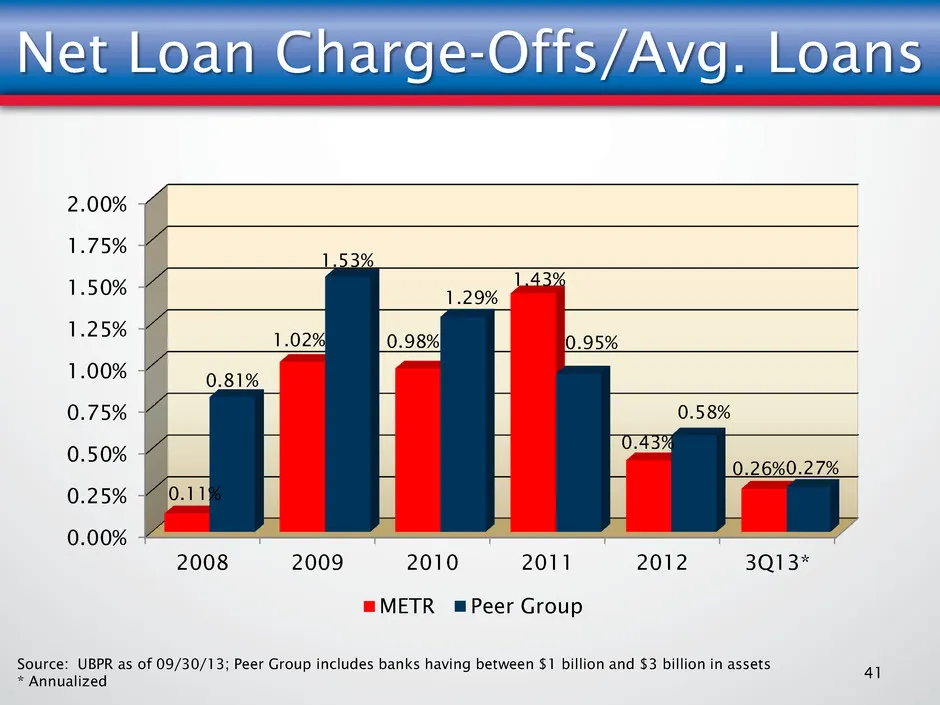
Net Loan Charge-Offs/Avg. Loans 0.00% 0.25% 0.50% 0.75% 1.00% 1.25% 1.50% 1.75% 2.00% 2008 2009 2010 2011 2012 3Q13* 0.11% 1.02% 0.98% 1.43% 0.43% 0.26% 0.81% 1.53% 1.29% 0.95% 0.58% 0.27% METR Peer Group 41 Source: UBPR as of 09/30/13; Peer Group includes banks having between $1 billion and $3 bill
Slide 42: Criticized & Classified Loan Vintage Analysis
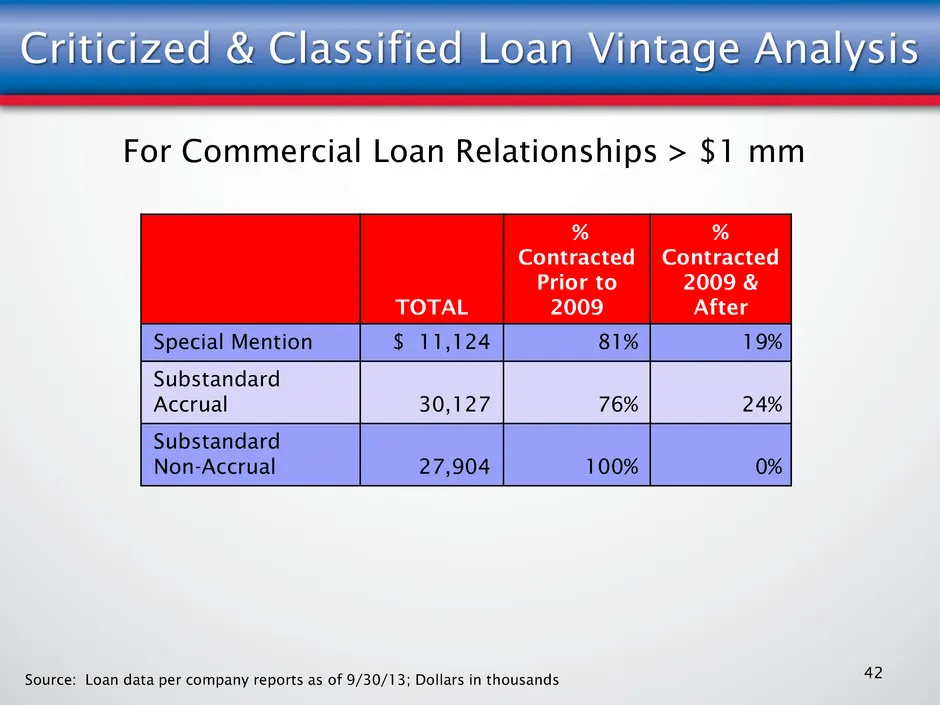
Criticized & Classified Loan Vintage Analysis TOTAL % Contracted Prior to 2009 % Contracted 2009 & After Special Mention $ 11,124 81% 19% Substandard Accrual 30,127 76% 24% Substandard Non-Accrual 27,904 100% 0% 42 Source: Loan data per company reports as of 9/30/13; Dollars in thousands For Commerc

Slide 43: The Future
THE FUTURE imETRO BANK
Slide 44: 2014 Key Priorities
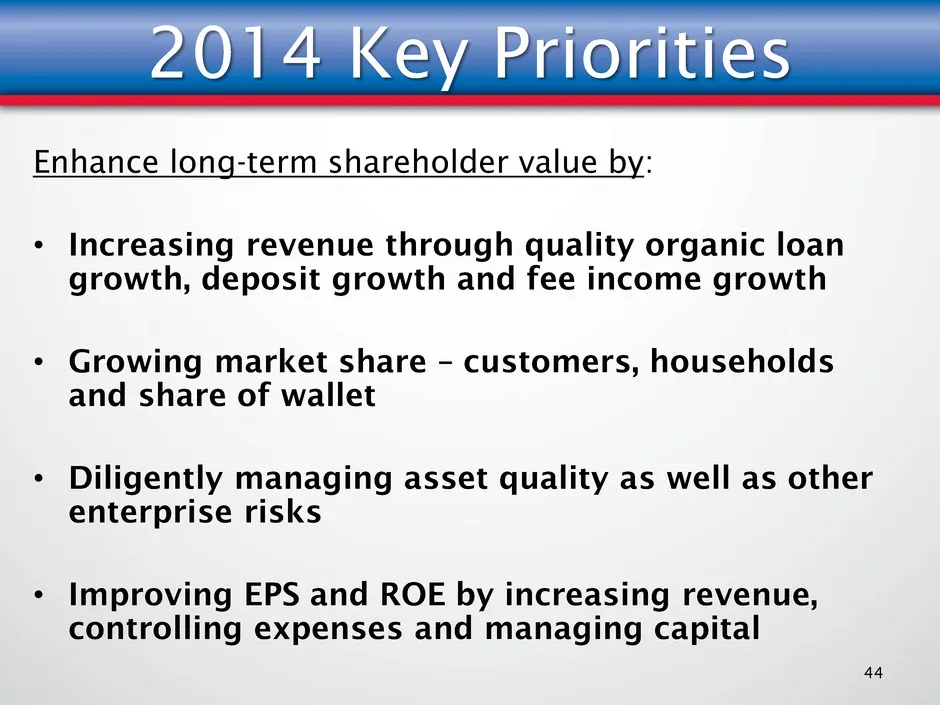
2014 Key Priorities Enhance long-term shareholder value by: • Increasing revenue through quality organic loan growth, deposit growth and fee income growth • Growing market share – customers, households and share of wallet • Diligently managing asset quality as well as other enterprise risks • Improv
Slide 45: Five Year Growth
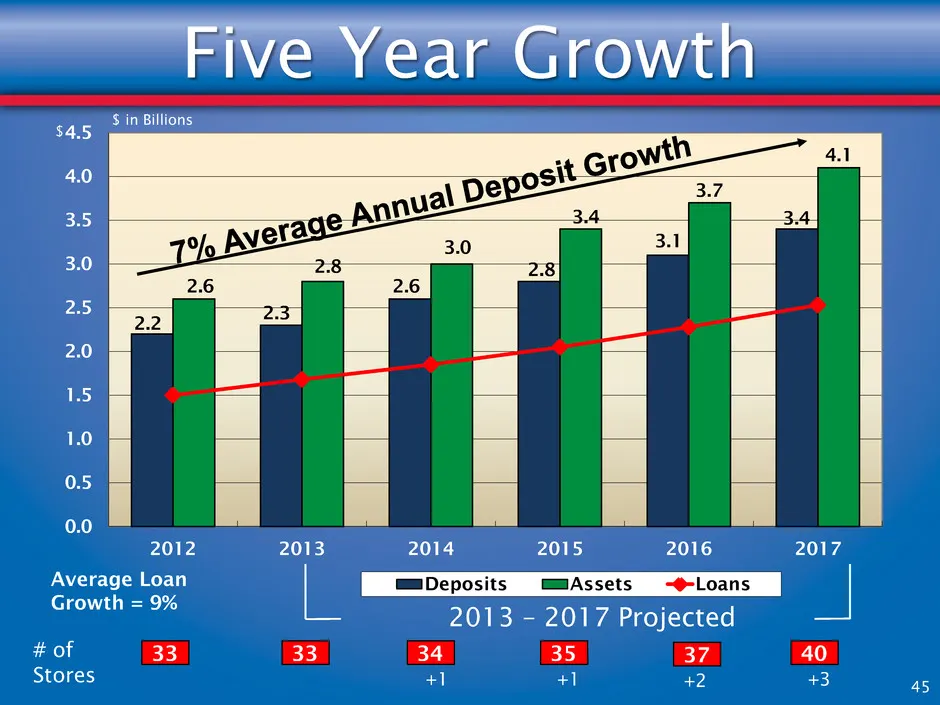
2.2 2.3 2.6 2.8 3.1 3.4 2.6 2.8 3.0 3.4 3.7 4.1 0.0 0.5 1.0 1.5 2.0 2.5 3.0 3.5 4.0 4.5 2012 2013 2014 2015 2016 2017 Deposits Assets Loans # of Stores 33 33 34 35 $ 2013 – 2017 Projected +1 +1 $ in Billions 40 +3 37 +2 Five Year Growth 45 Average Loan Growth = 9%
Slide 46: Expand the Footprint
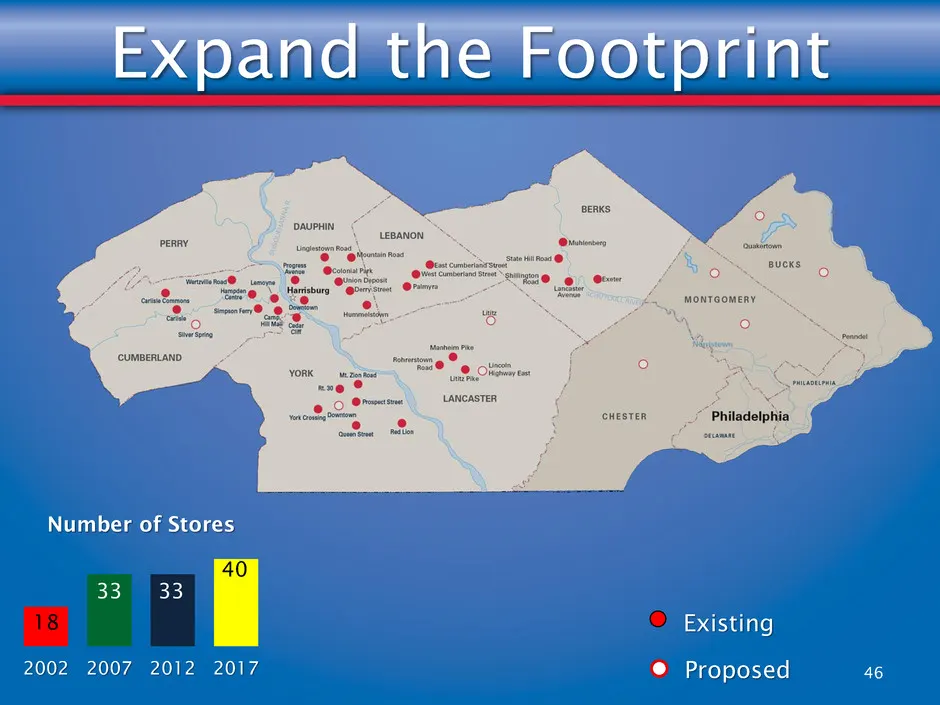
Existing Proposed Expand the Footprint 46 18 33 33 40 2002 2007 2012 2017 Number of Stores
Source: SEC EDGAR · 8-K filed Nov 13, 2013
More decks from Metro Bancorp Inc
 Merger or Acquisition (August 2015)15 slides · Aug 4, 2015
 Shareholder Meeting (June 2015)35 slides · Jun 19, 2015
 Shareholder Meeting (May 2014)35 slides · May 22, 2014
 Investor Presentation (August 2013)45 slides · Aug 15, 2013
 Shareholder Meeting (May 2013)37 slides · May 17, 2013
 Sterne Agee Financial Institutions Investor Conference February 201342 slides · Feb 11, 2013