Metro Bancorp — Merger or Acquisition (August 2015)
15 slides from Metro Bancorp's merger presentation, Aug 4, 2015
Slide 1: F.N.B. Corporation Announces Agreement to Acquire Metro Bancorp, Inc.
Exhibit 99.2 F.N.B. Corporation Announces Agreement to Acquire Metro Bancorp, Inc. August 4, 2015
Slide 2: Cautionary Statement Regarding Forward-Looking Information and Non-GAAP Financial Information
Cautionary Statement Regarding Forward-Looking Information and Non-GAAP Financial Information This presentation contains "forward-looking statements" within the meaning of the Private Securities Litigation Reform Act, relating to present or future trends or factors affecting the banking industry and
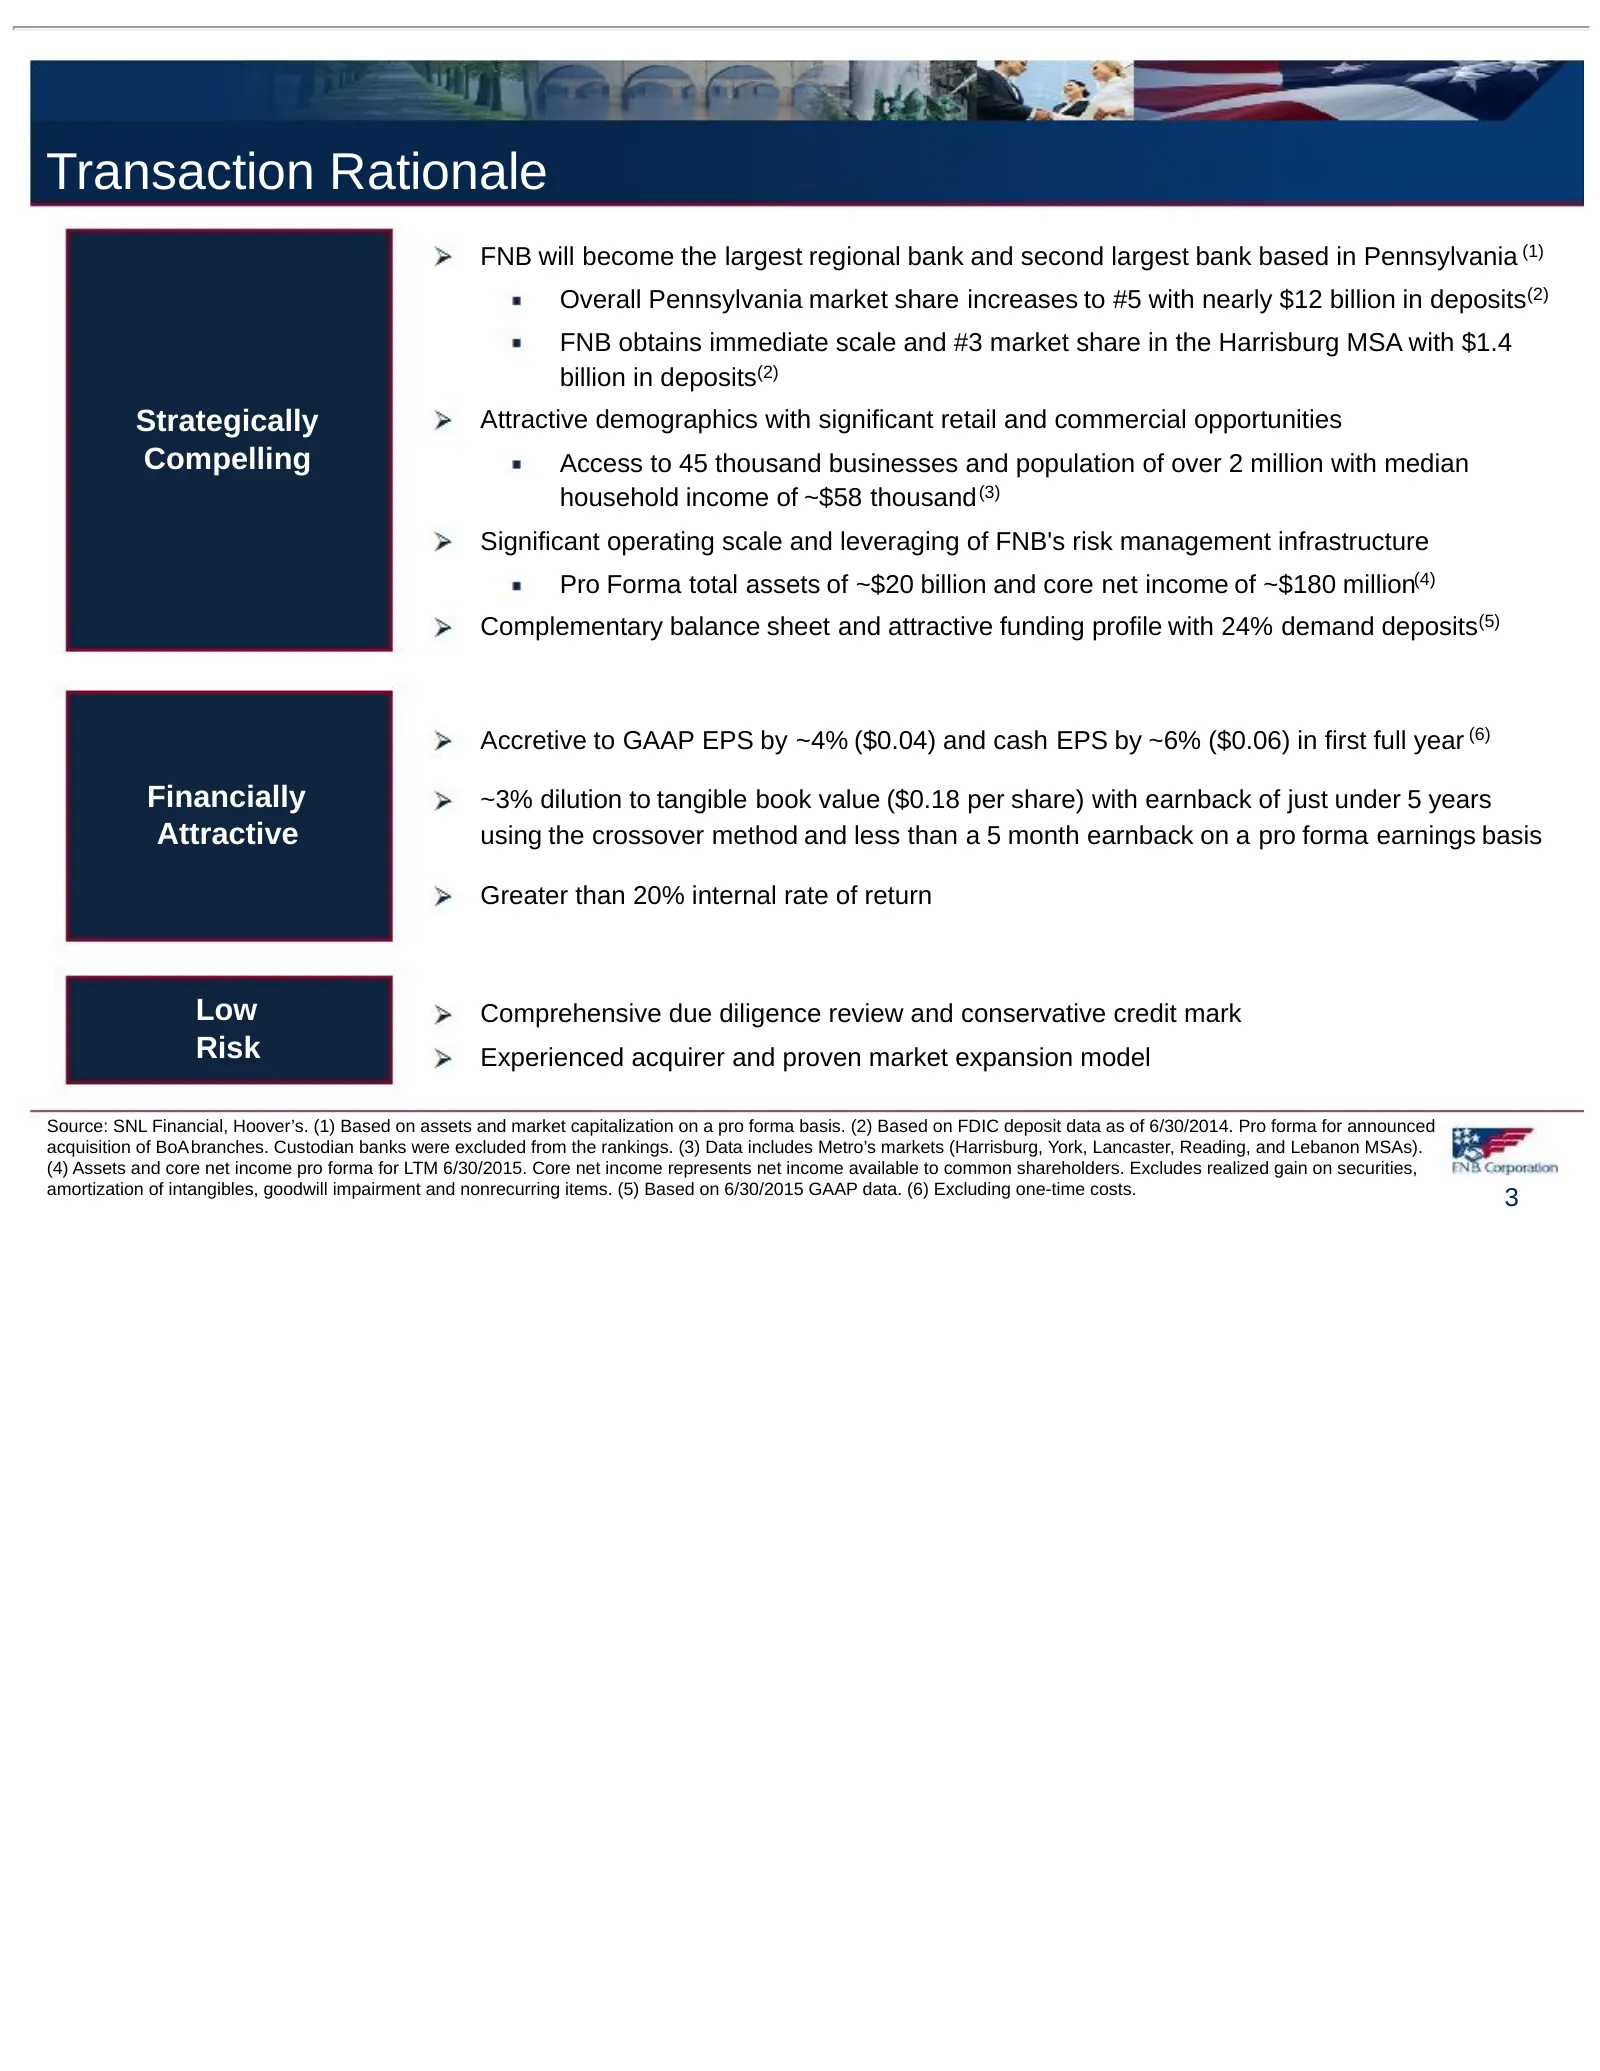
Slide 3: Transaction Rationale
Transaction Rationale FNB will become the largest regional bank and second largest bank based in Pennsylvania (1) Overall Pennsylvania market share increases to #5 with nearly $12 billion in deposits(2) FNB obtains immediate scale and #3 market share in the Harrisburg MSA with $1.4 billion in deposi
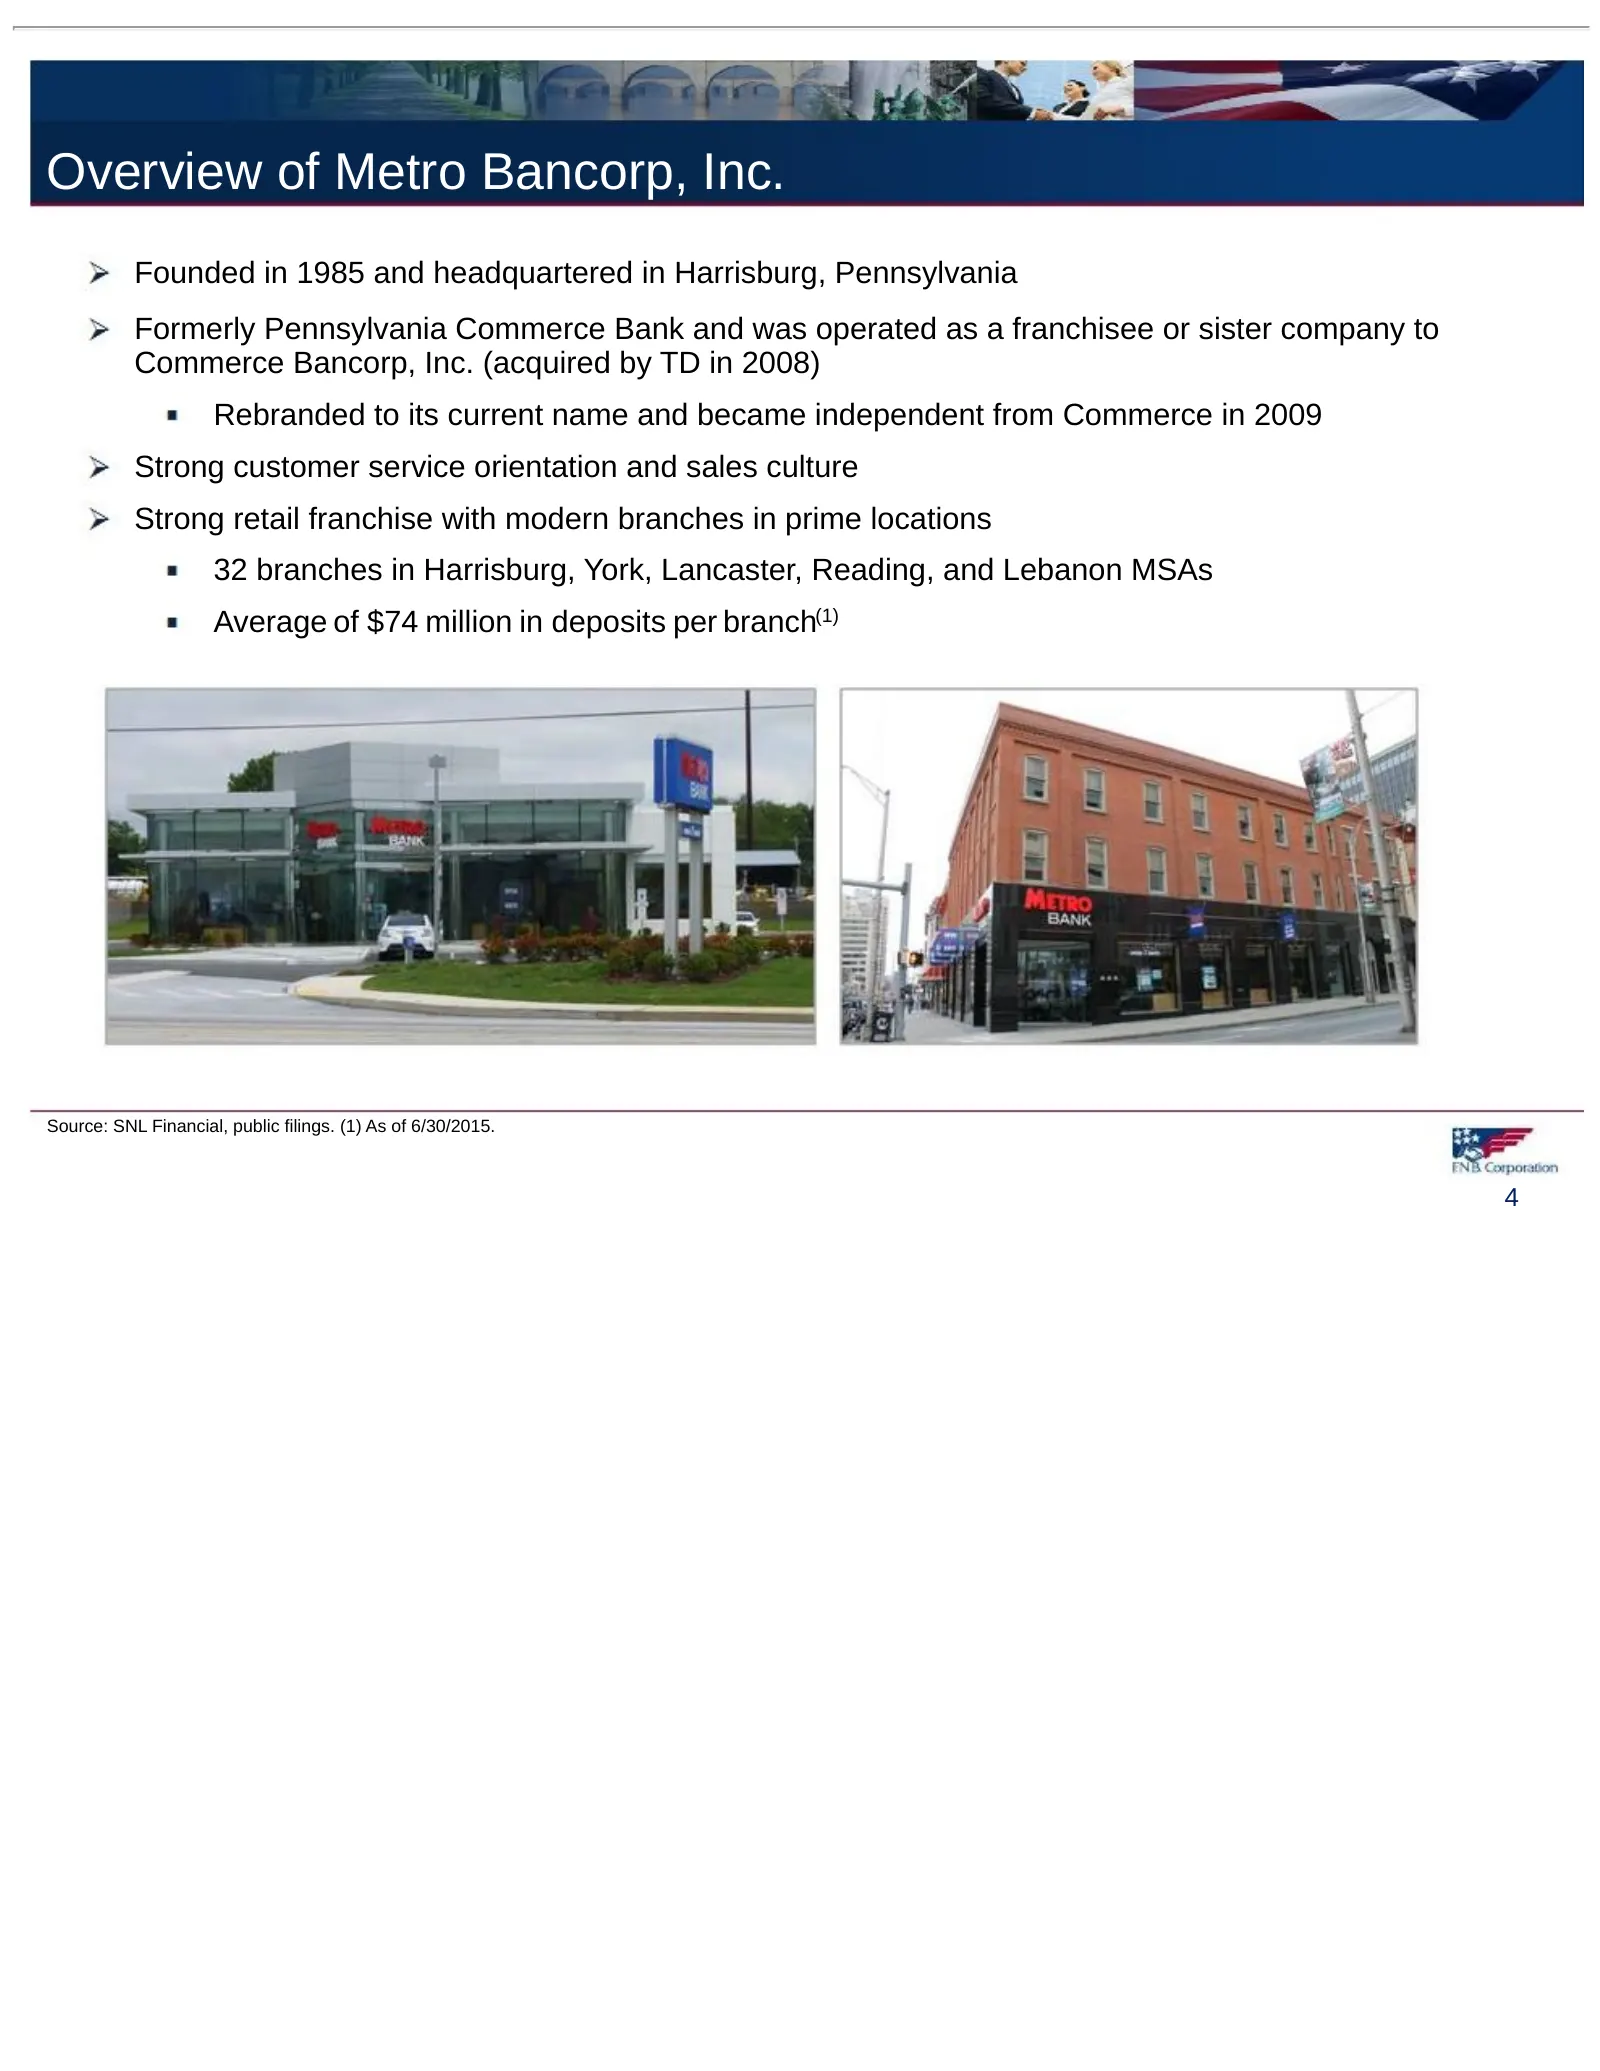
Slide 4: Overview of Metro Bancorp, Inc.
Overview of Metro Bancorp, Inc. Founded in 1985 and headquartered in Harrisburg, Pennsylvania Formerly Pennsylvania Commerce Bank and was operated as a franchisee or sister company to Commerce Bancorp, Inc. (acquired by TD in 2008) Rebranded to its current name and became independent from Commerce i
Slide 5: Overview of Metro Bancorp, Inc. (cont.)
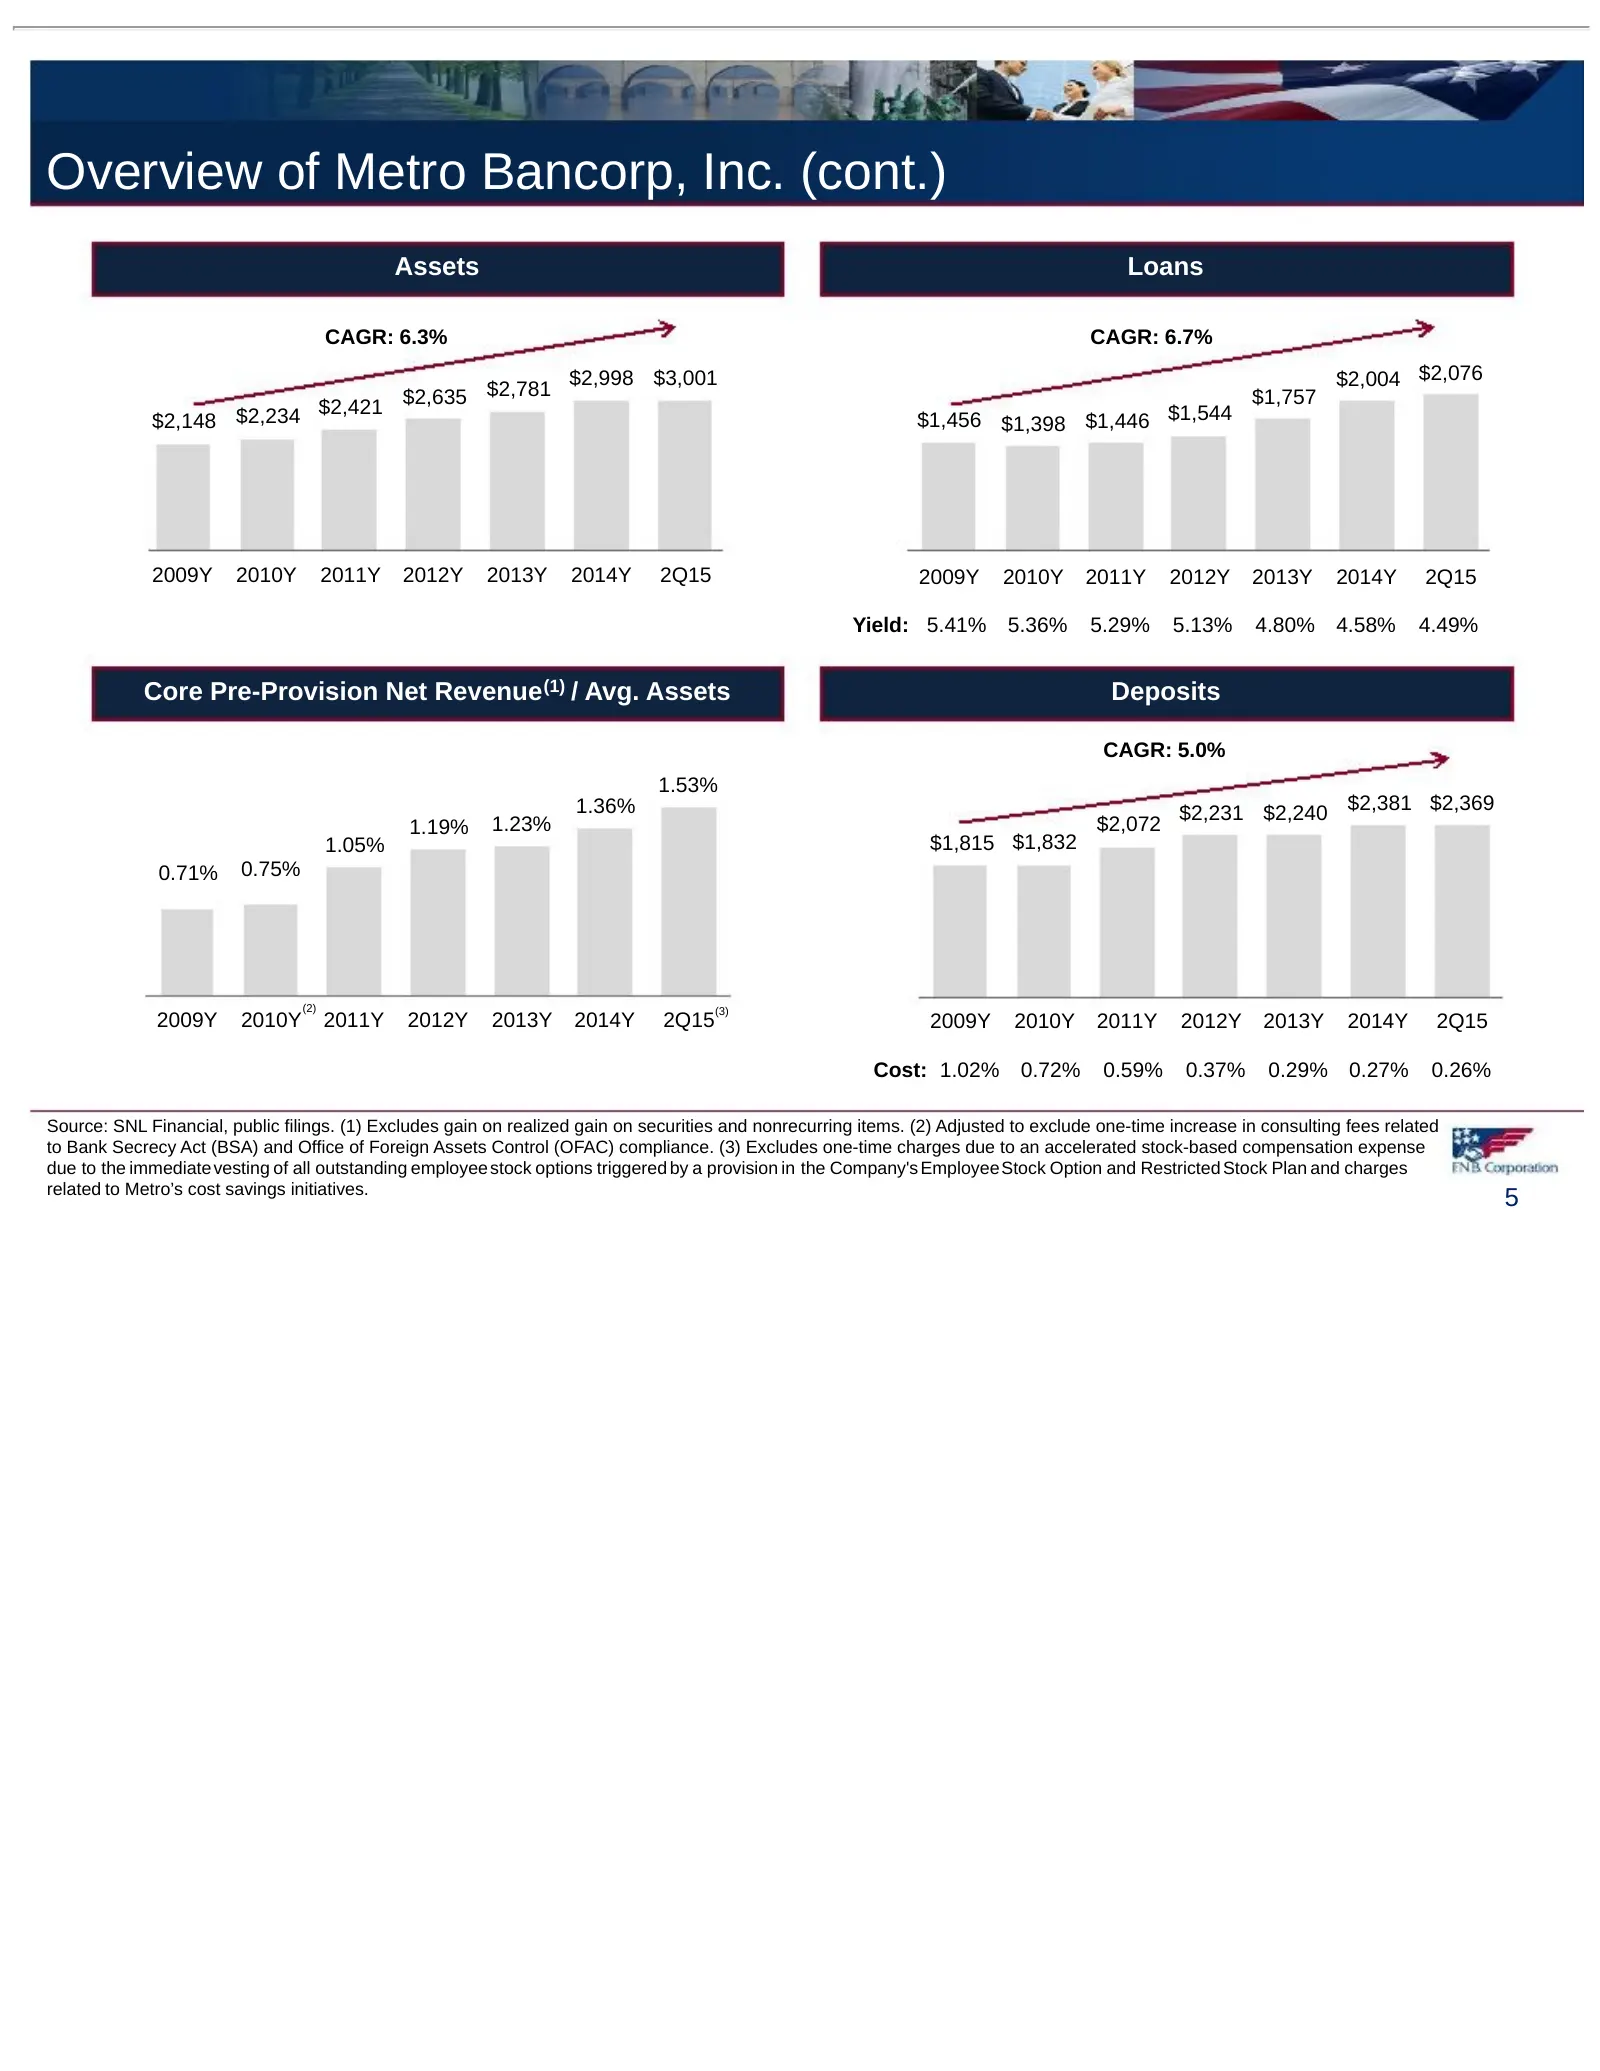
Overview of Metro Bancorp, Inc. (cont.) Assets Loans CAGR: 6.3% CAGR: 6.7% $2,781 $2,998 $3,001 $2,004 $2,076 $2,421 $2,635 $1,757 $2,148 $2,234 $1,456 $1,398 $1,446 $1,544 2009Y 2010Y 2011Y 2012Y 2013Y 2014Y 2Q15 2009Y 2010Y 2011Y 2012Y 2013Y 2014Y 2Q15 Yield: 5.41% 5.36% 5.29% 5.13% 4.80% 4.58% 4.
Slide 6: Pro Forma Franchise
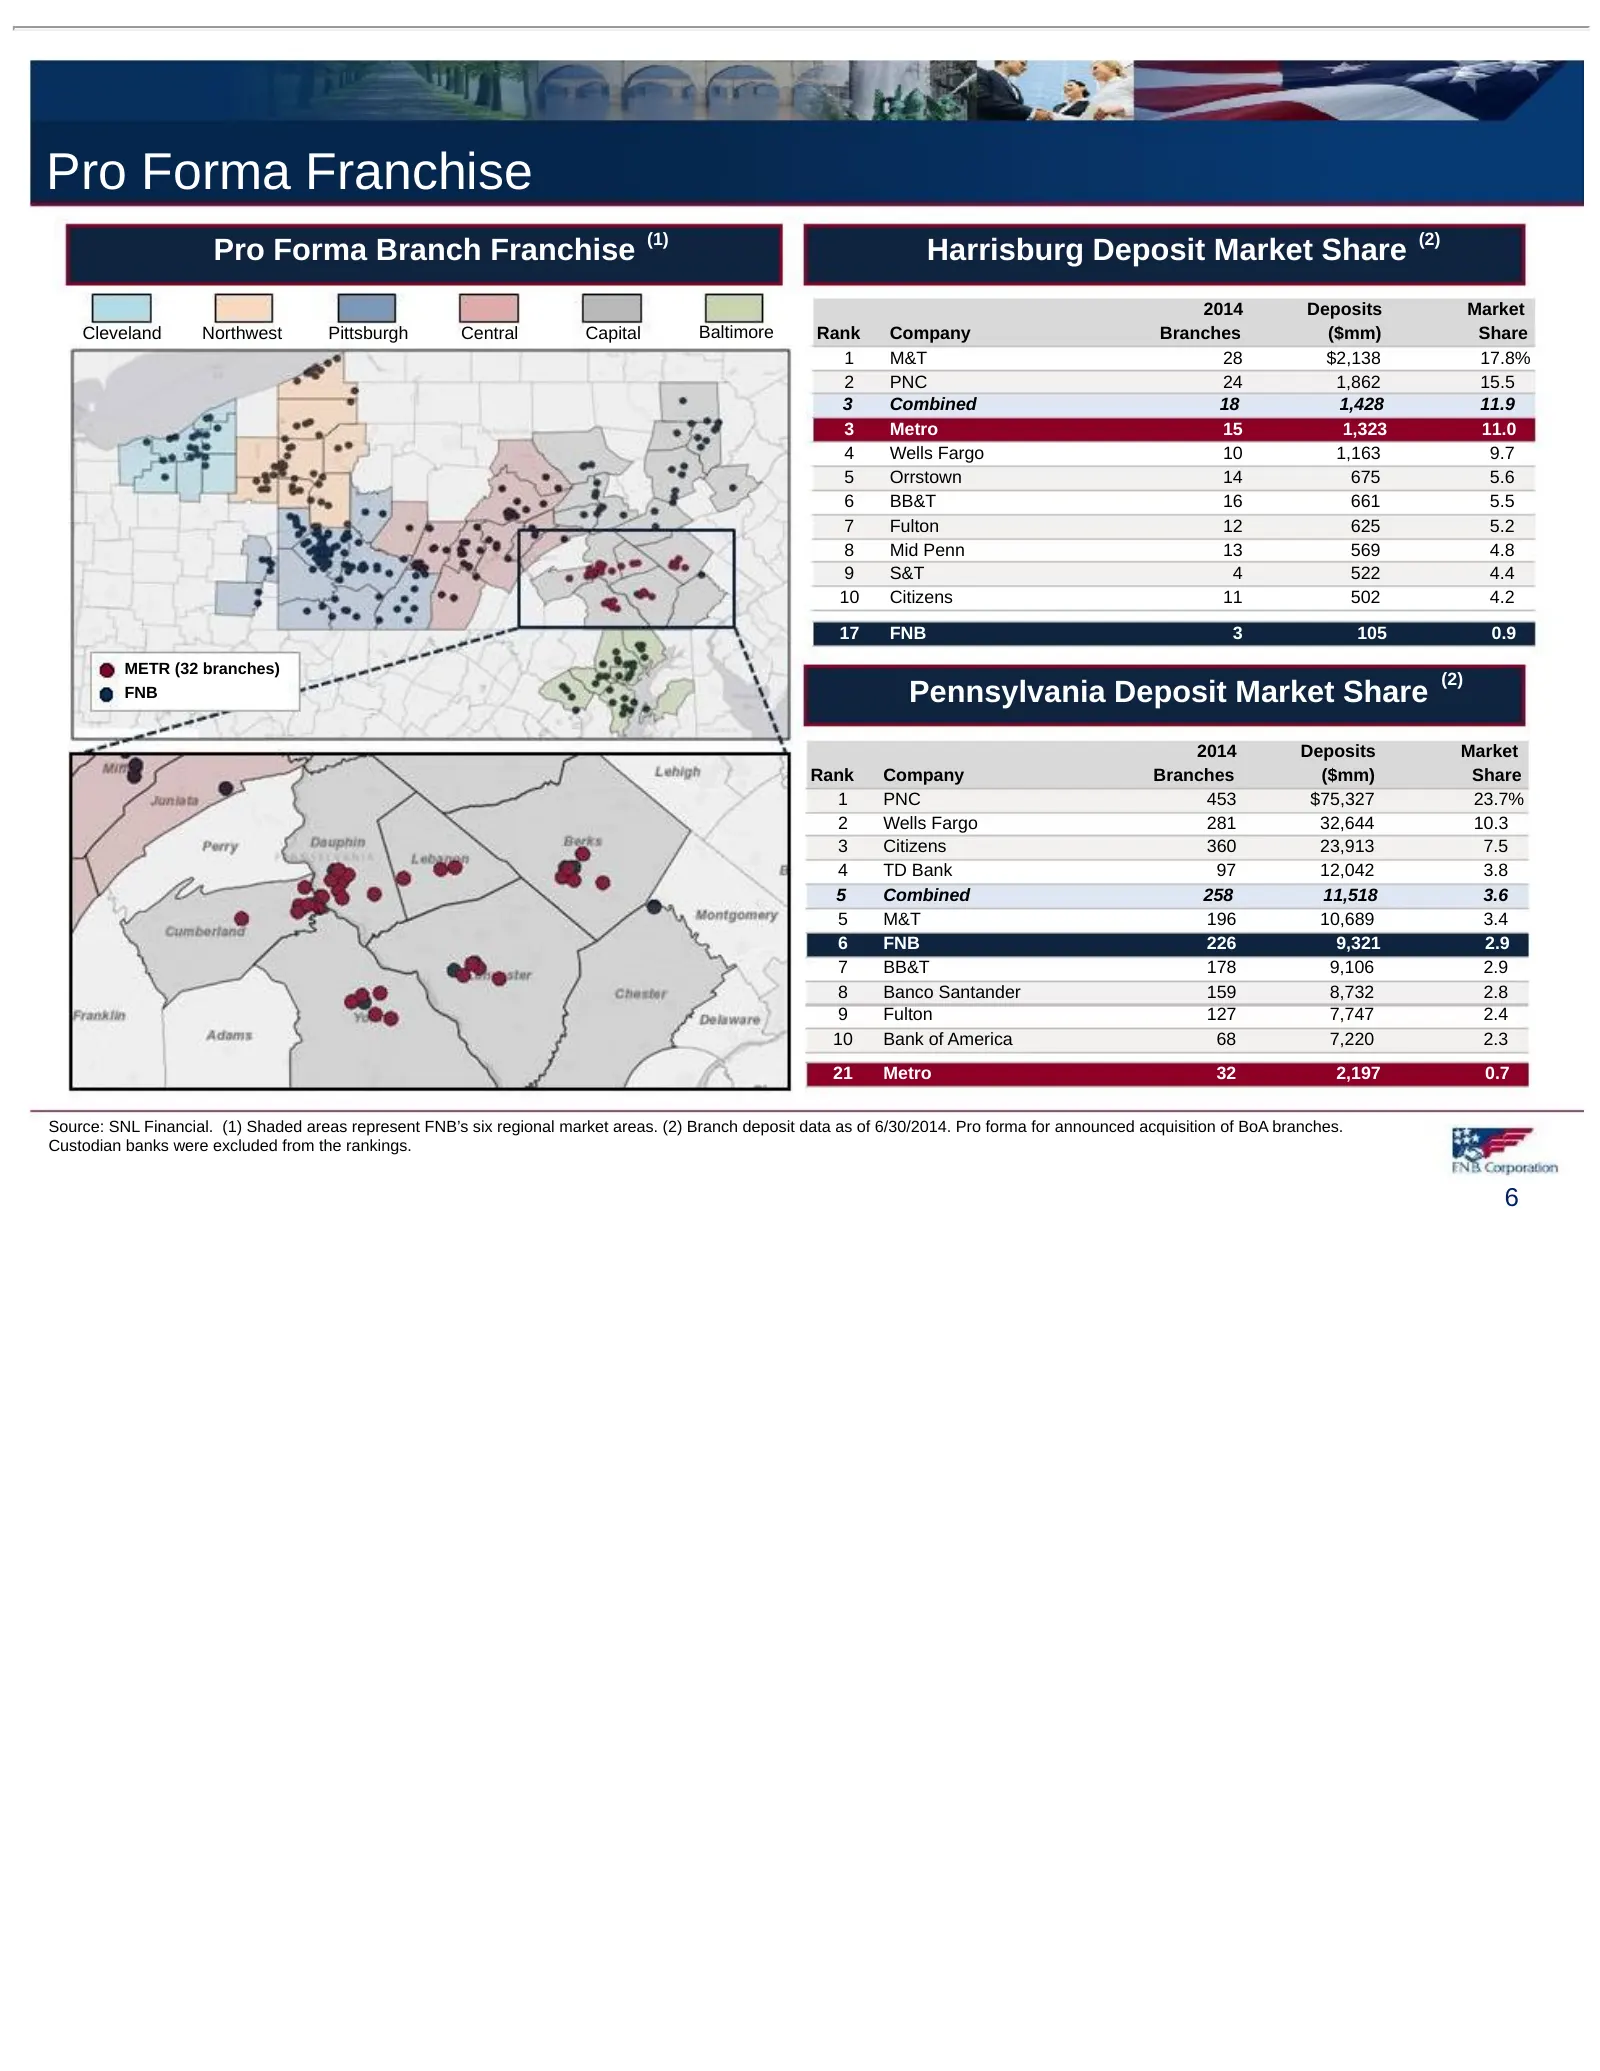
Pro Forma Franchise Pro Forma Branch Franchise (1) Harrisburg Deposit Market Share (2) 2014 Deposits Market Cleveland Northwest Pittsburgh Central Capital Baltimore Rank Company Branches ($mm) Share 1 M&T 28 $2,138 17.8% 2 PNC 24 1,862 15.5 3 Combined 18 1,428 11.9 3 Metro 15 1,323 11.0 4 Wells Farg
Slide 7: Central Pennsylvania Opportunity
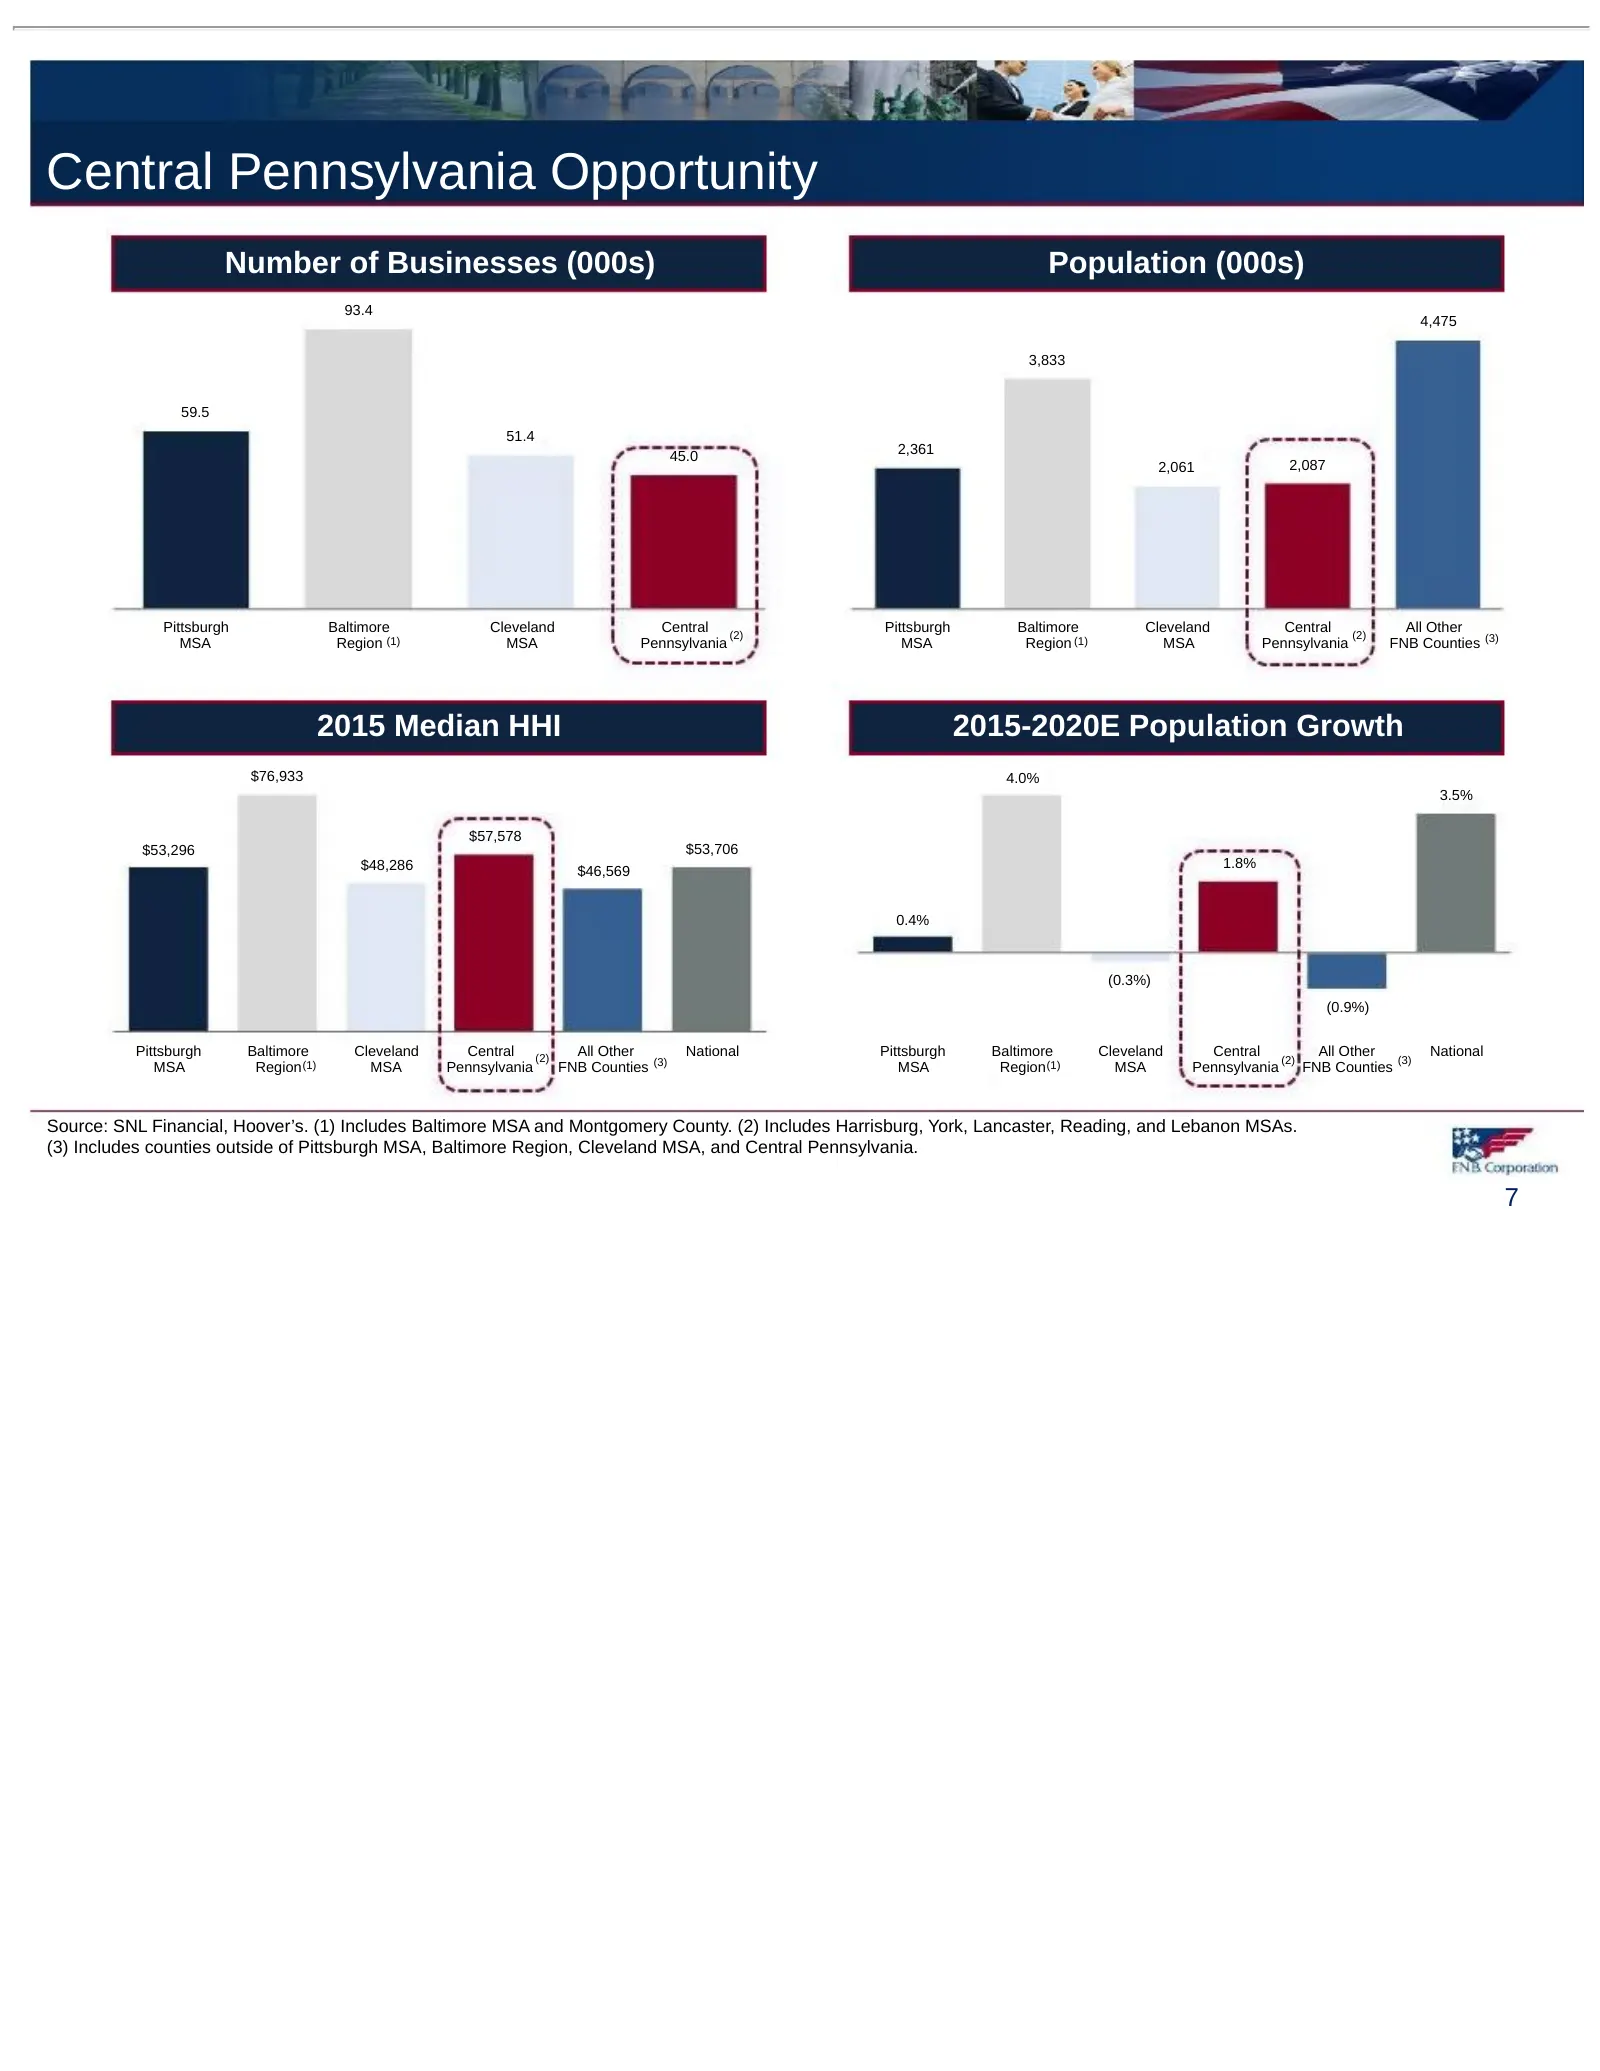
Central Pennsylvania Opportunity Number of Businesses (000s) Population (000s) 93.4 4,475 3,833 59.5 51.4 45.0 2,361 2,061 2,087 Pittsburgh Baltimore Cleveland Central (2) Pittsburgh Baltimore Cleveland Central (2) All Other MSA Region (1) MSA Pennsylvania MSA Region (1) MSA Pennsylvania FNB Countie
Slide 8: Complementary Balance Sheet
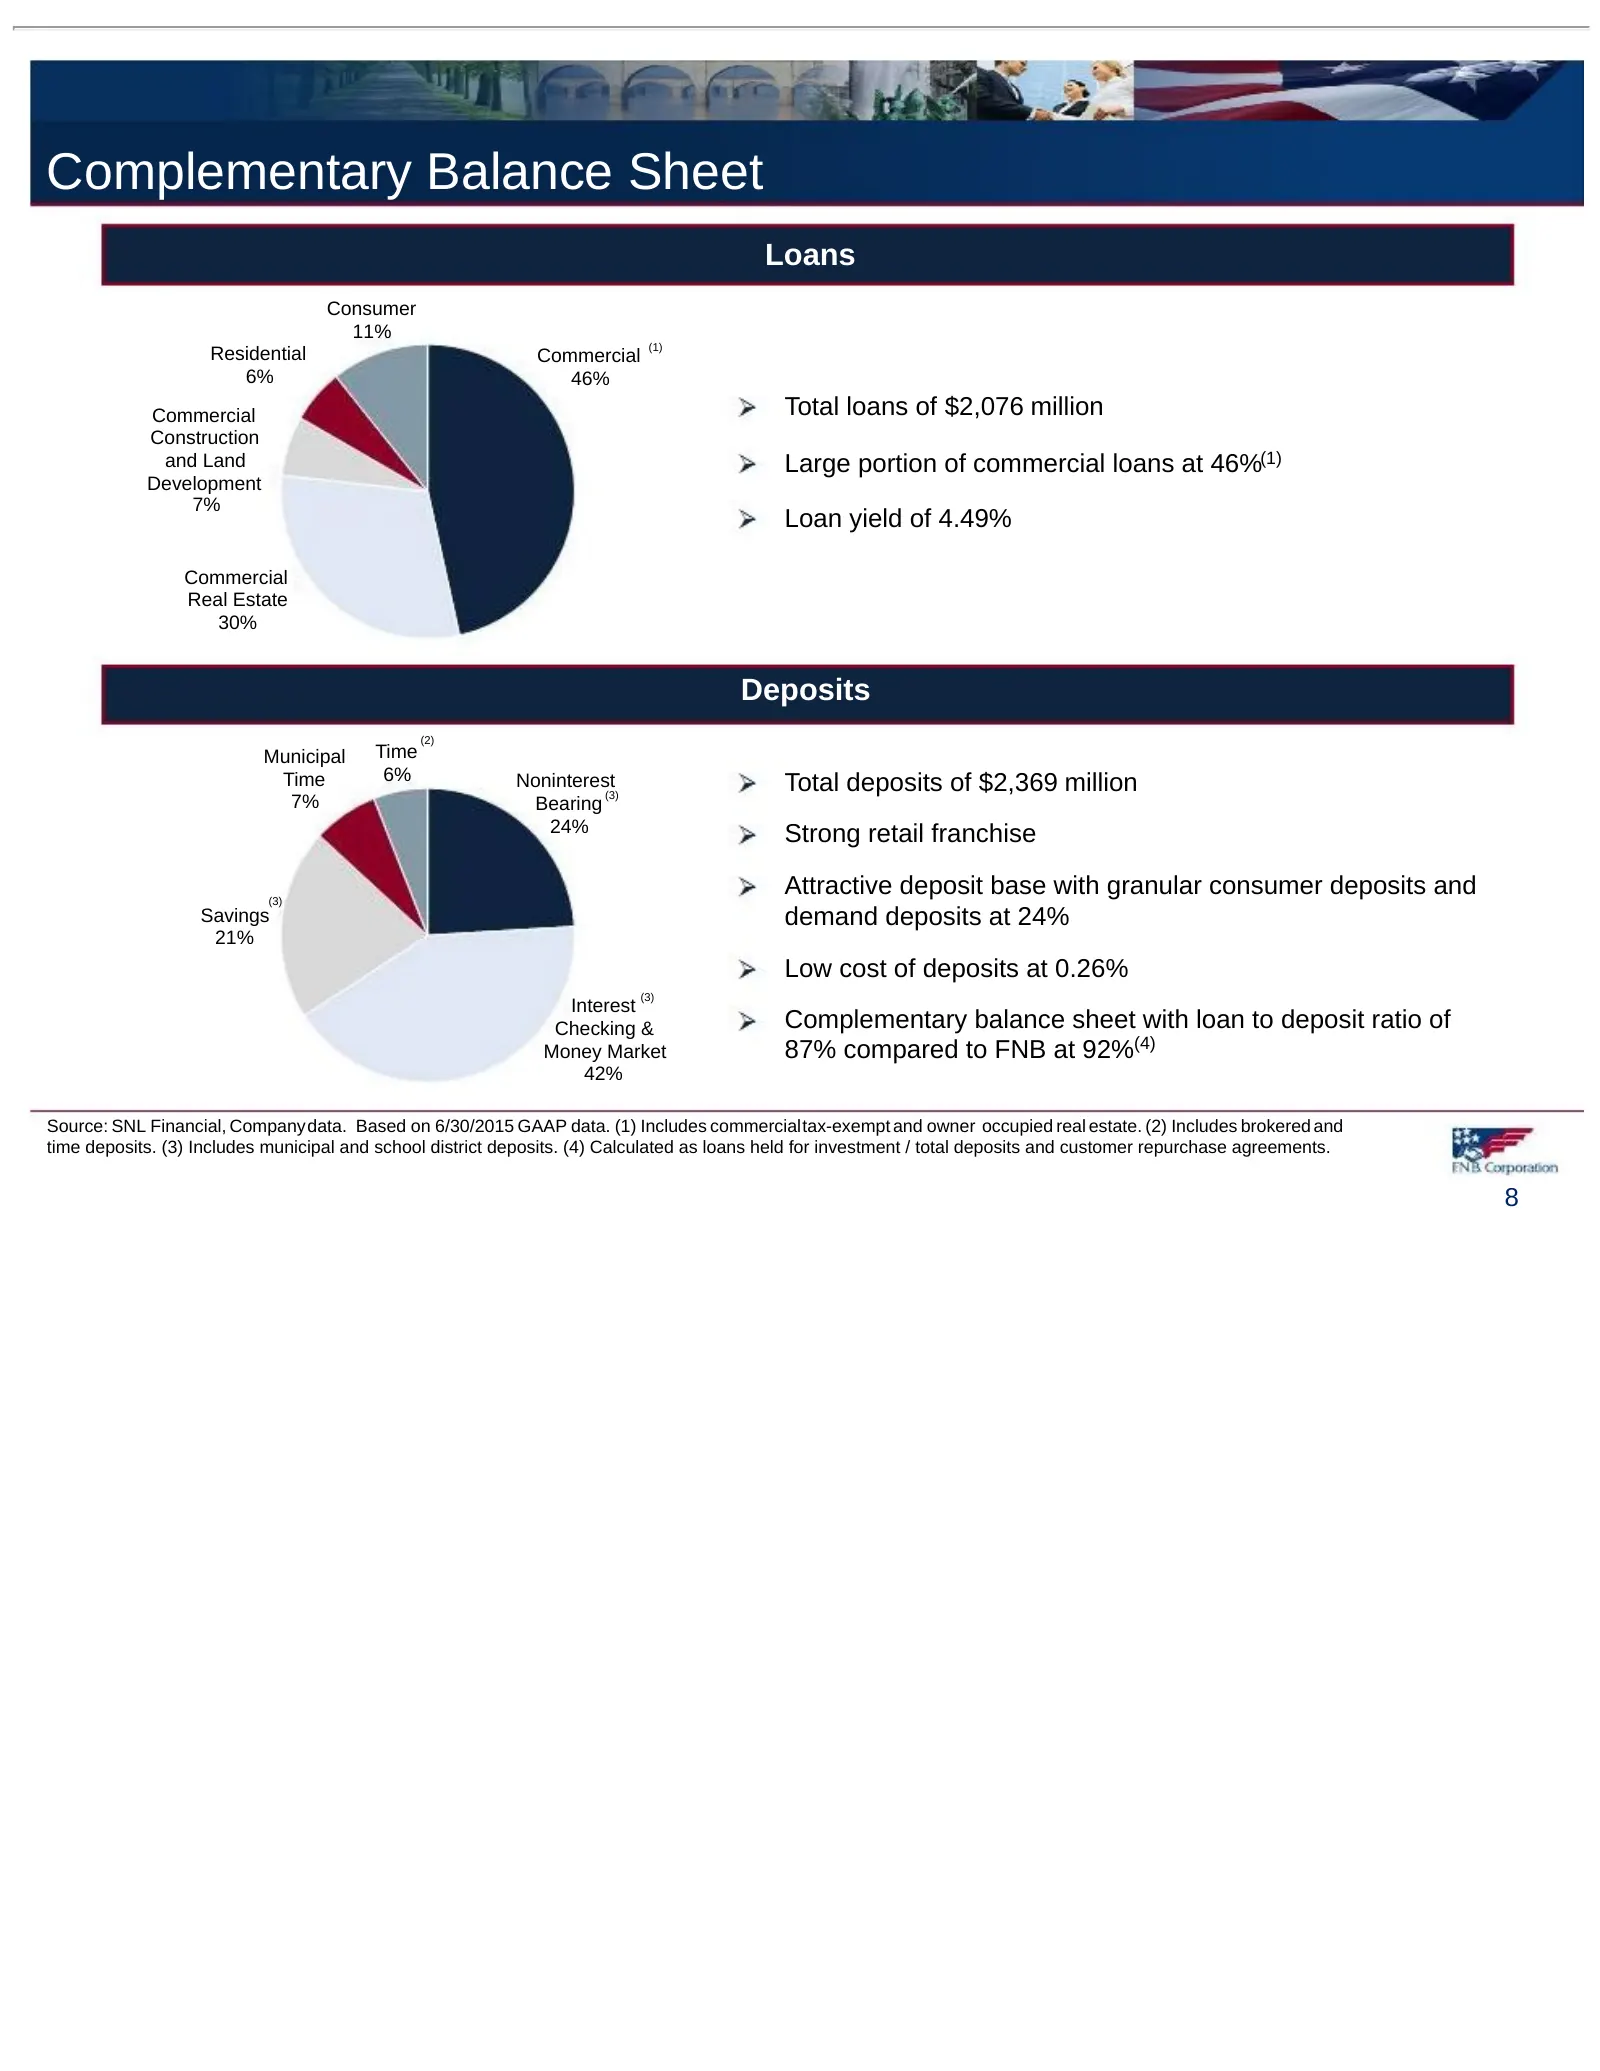
Complementary Balance Sheet Loans Consumer 11% (1) Residential Commercial 6% 46% Commercial Total loans of $2,076 million Construction and Land Large portion of commercial loans at 46%(1) Development 7% Loan yield of 4.49% Commercial Real Estate 30% Deposits (2) Municipal Time Time 6% Noninterest To
Slide 9: FNB Acquisitions Position the Company for Long-term Sustainable Organic Growth
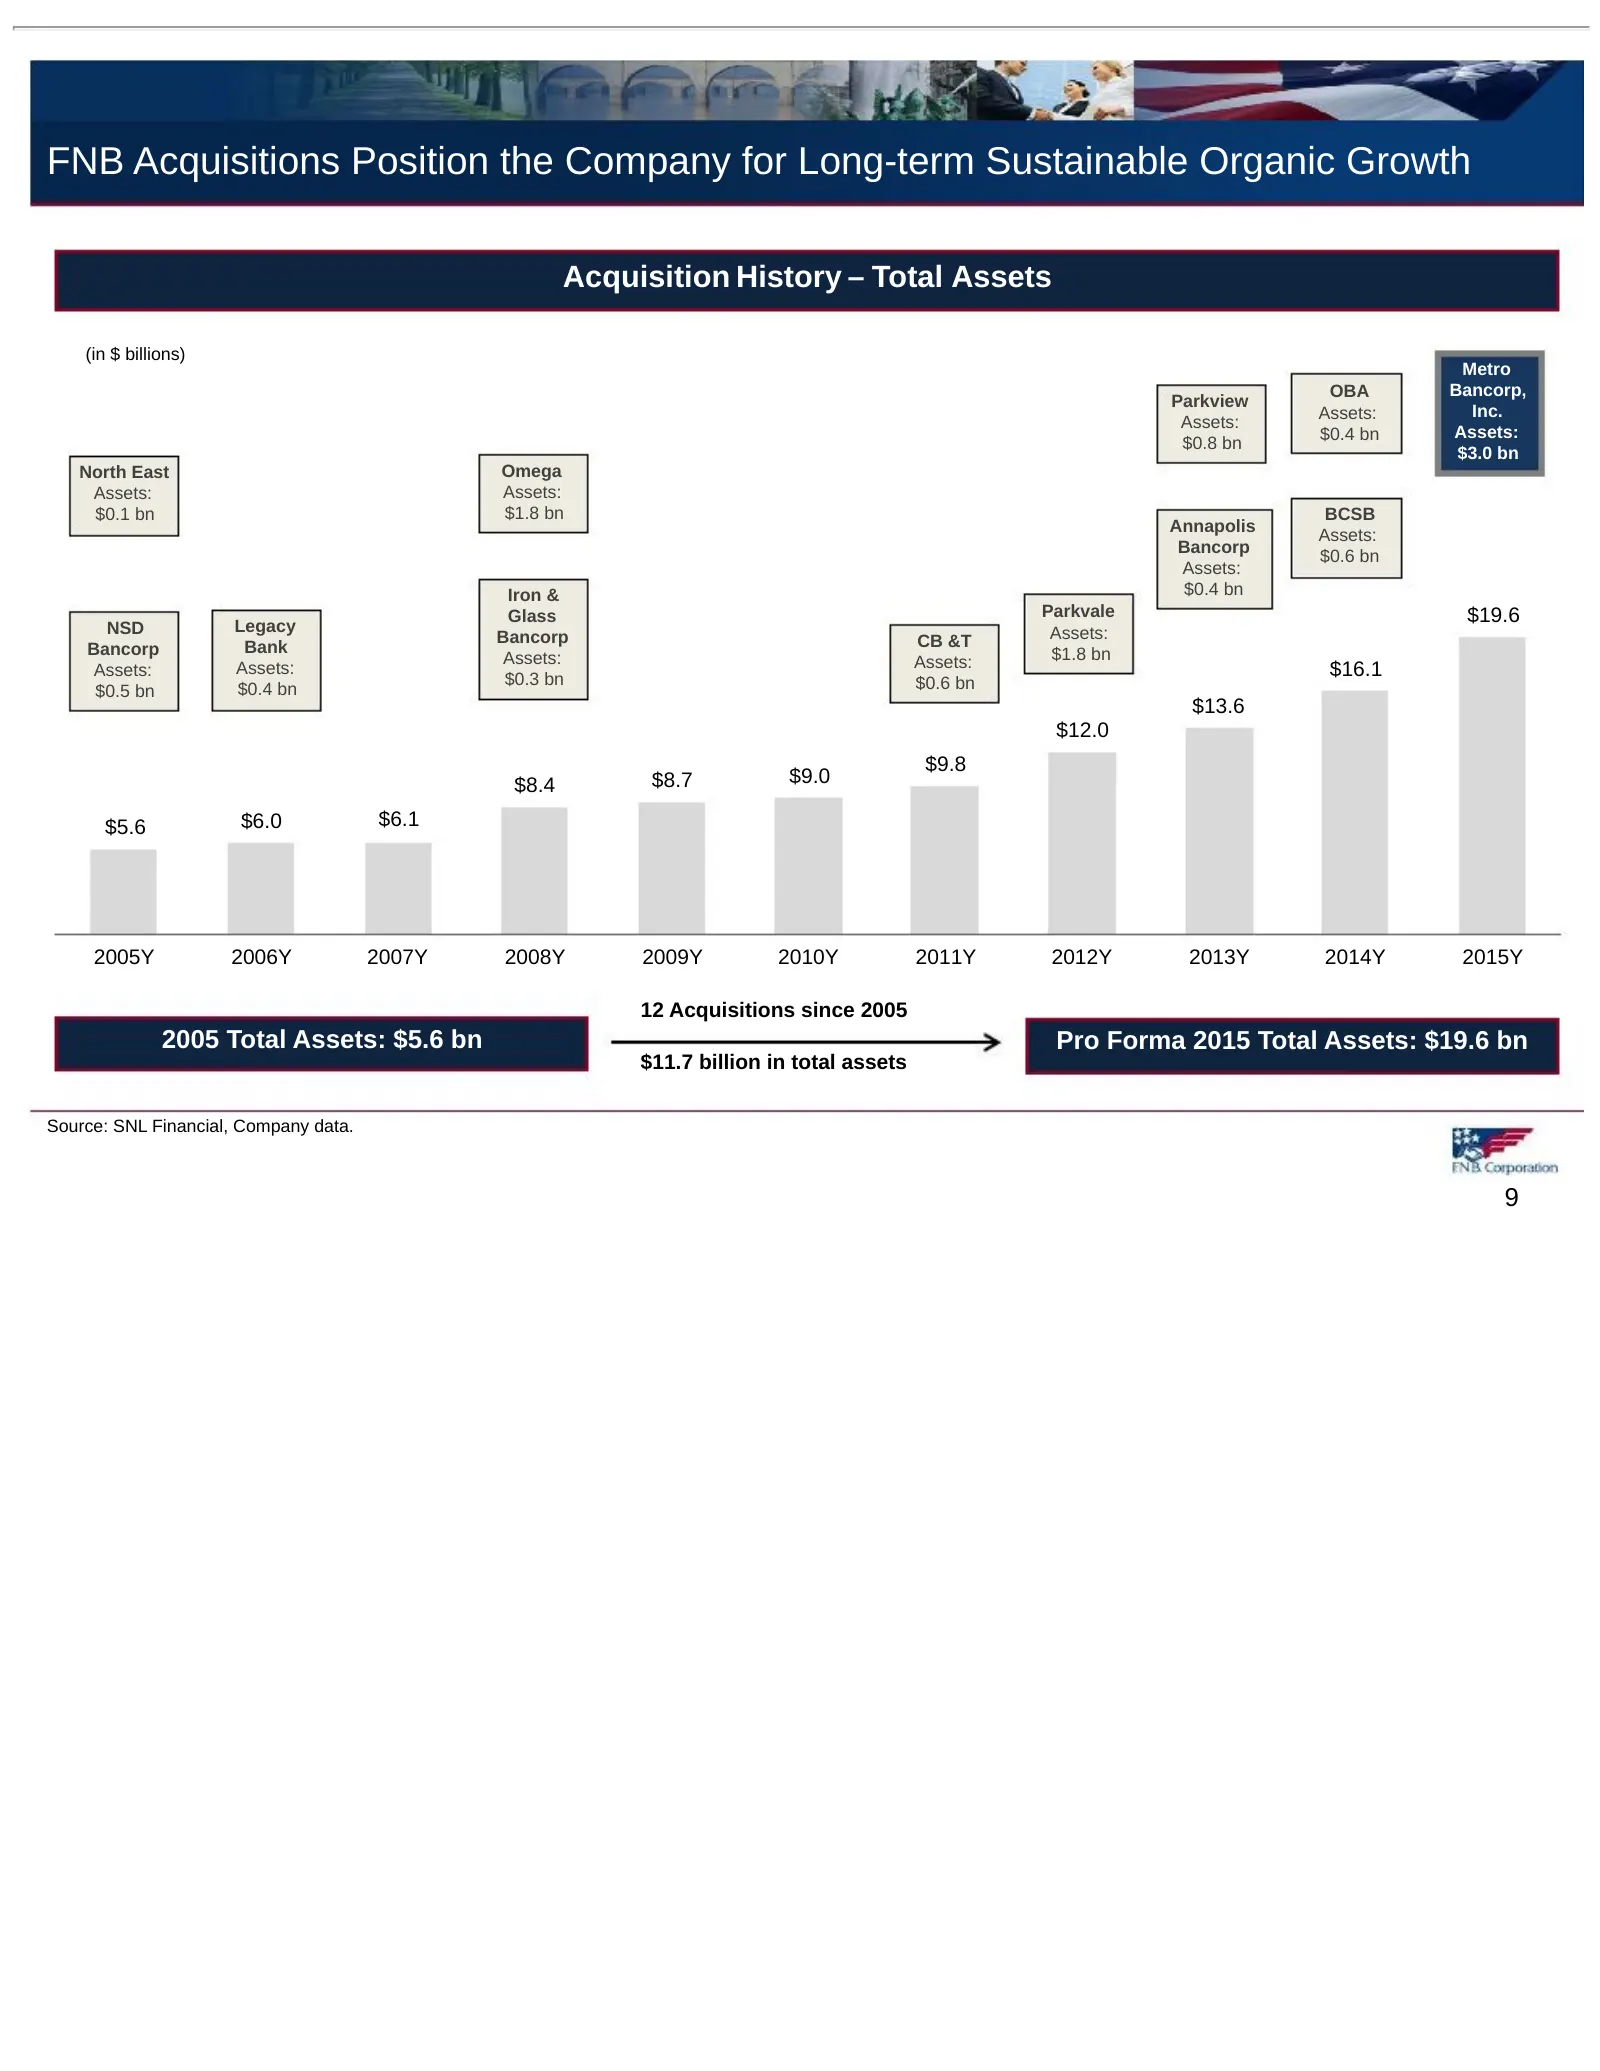
FNB Acquisitions Position the Company for Long-term Sustainable Organic Growth Acquisition History – Total Assets (in $ billions) Metro OBA Bancorp, Parkview Assets: Inc. Assets: $0.4 bn Assets: $0.8 bn $3.0 bn North East Omega Assets: Assets: $0.1 bn $1.8 bn BCSB Annapolis Assets: Bancorp $0.6 bn A
Slide 10: Transaction Overview
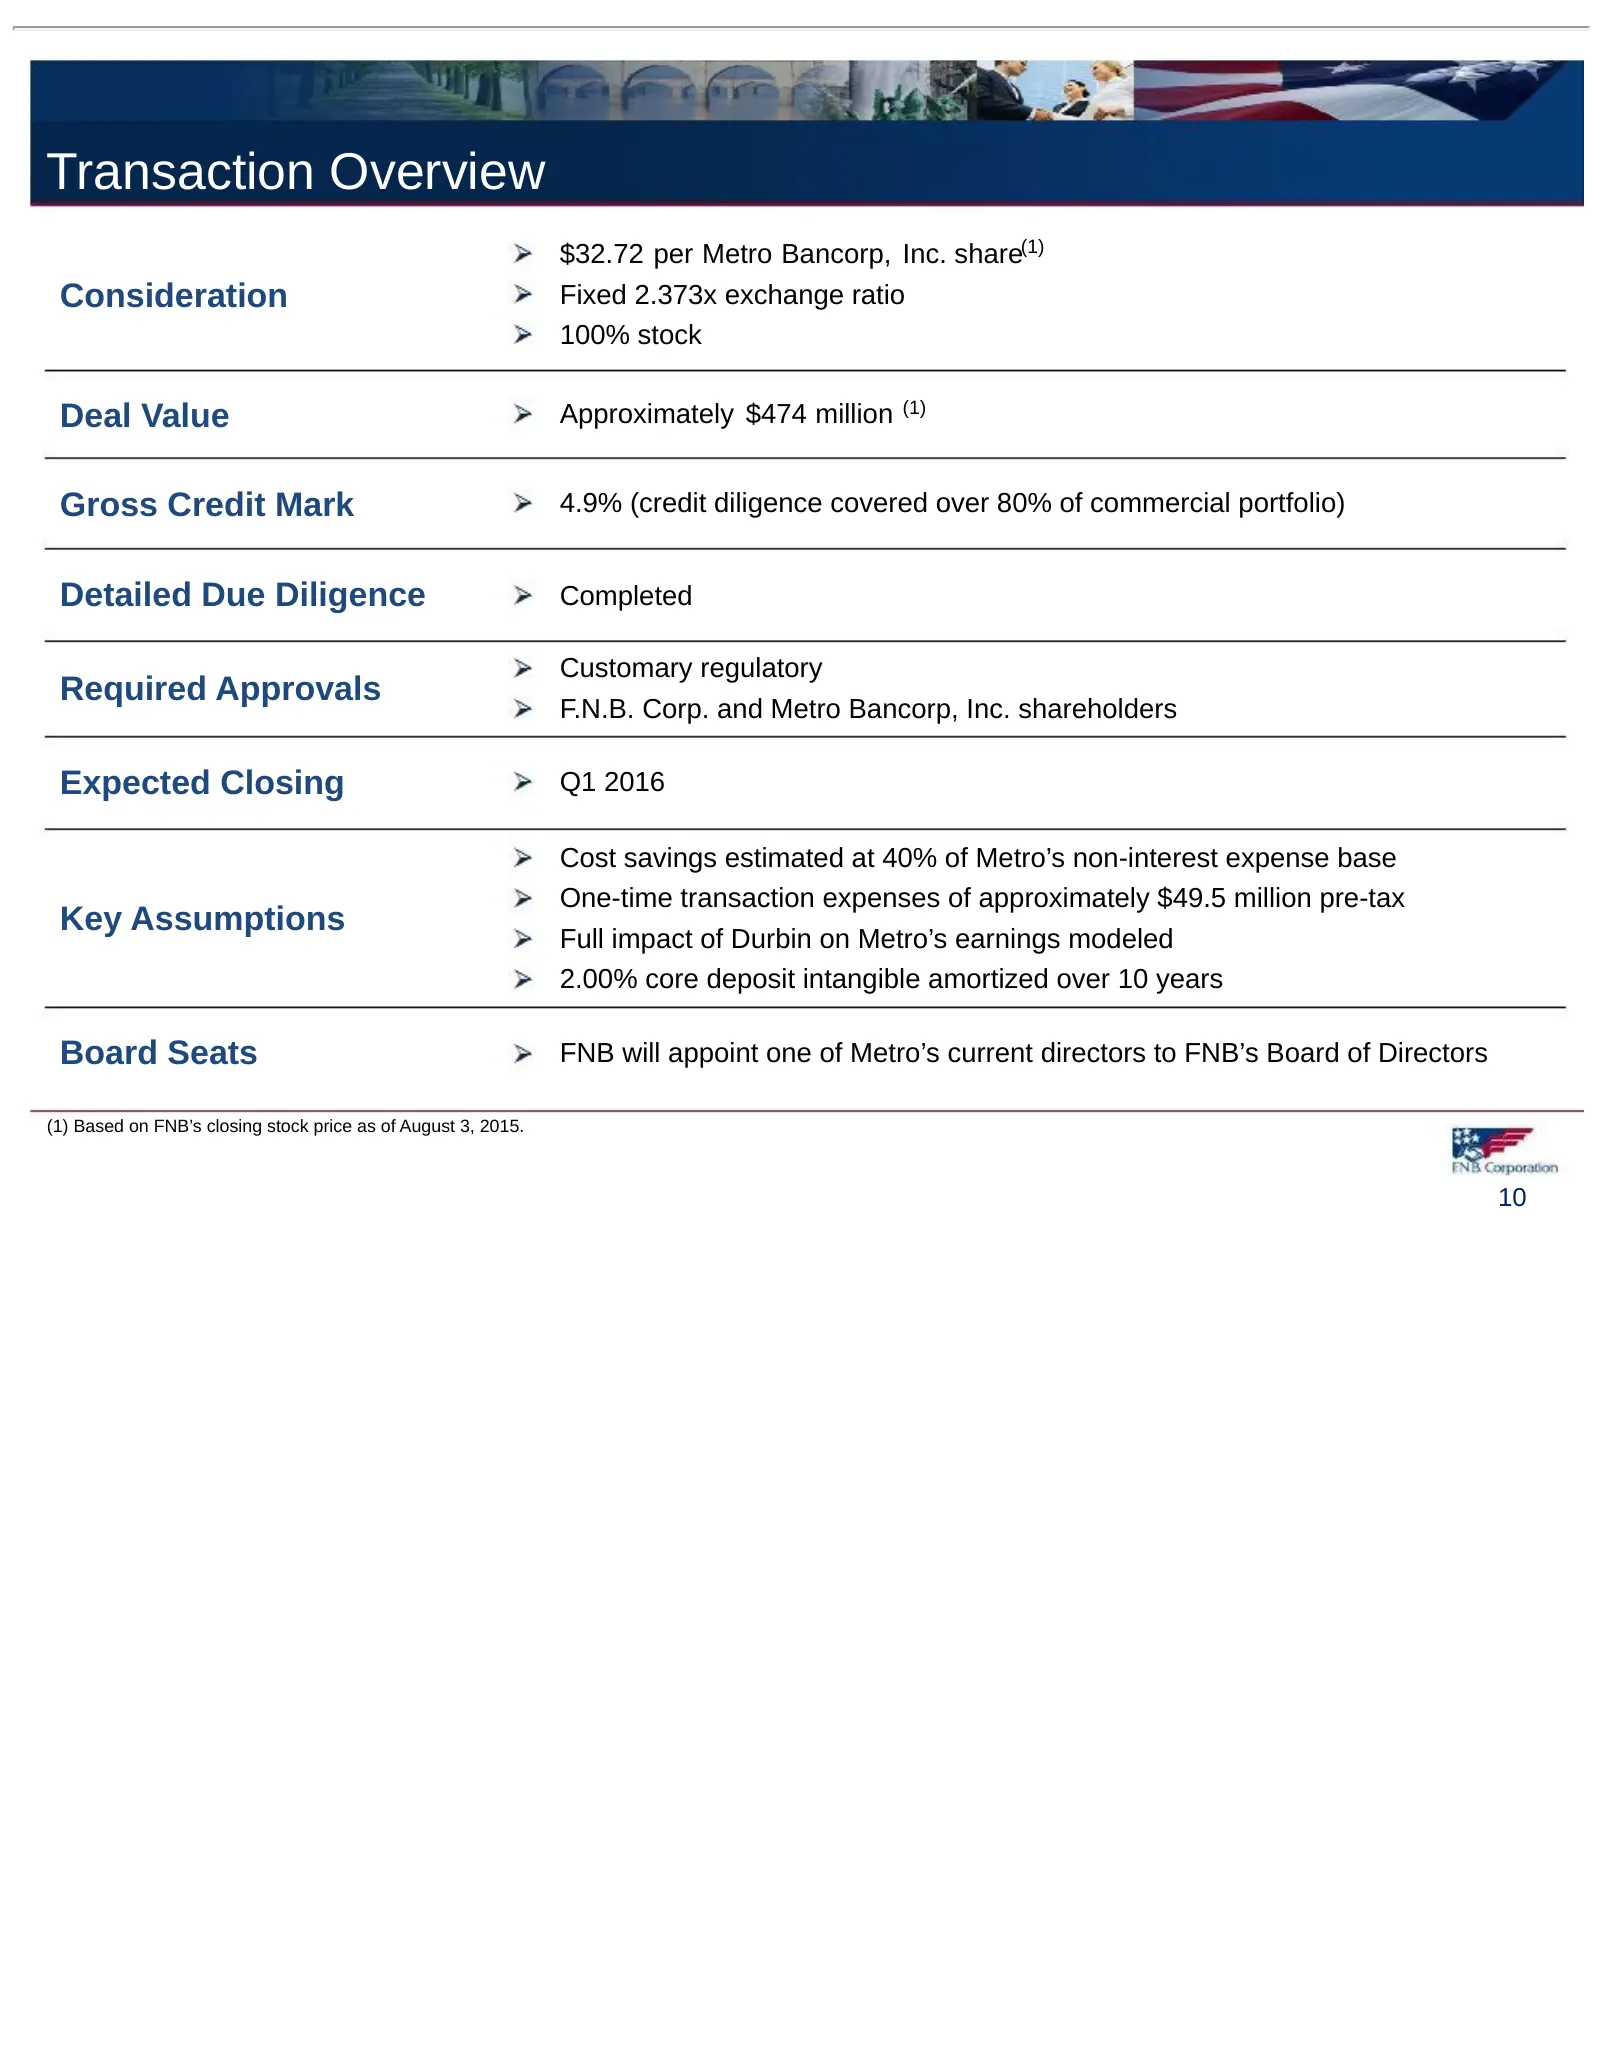
Transaction Overview $32.72 per Metro Bancorp, Inc. share(1) Consideration Fixed 2.373x exchange ratio 100% stock Deal Value Approximately $474 million (1) Gross Credit Mark 4.9% (credit diligence covered over 80% of commercial portfolio) Detailed Due Diligence Completed Customary regulatory Require
Slide 11: Comprehensive Due Diligence
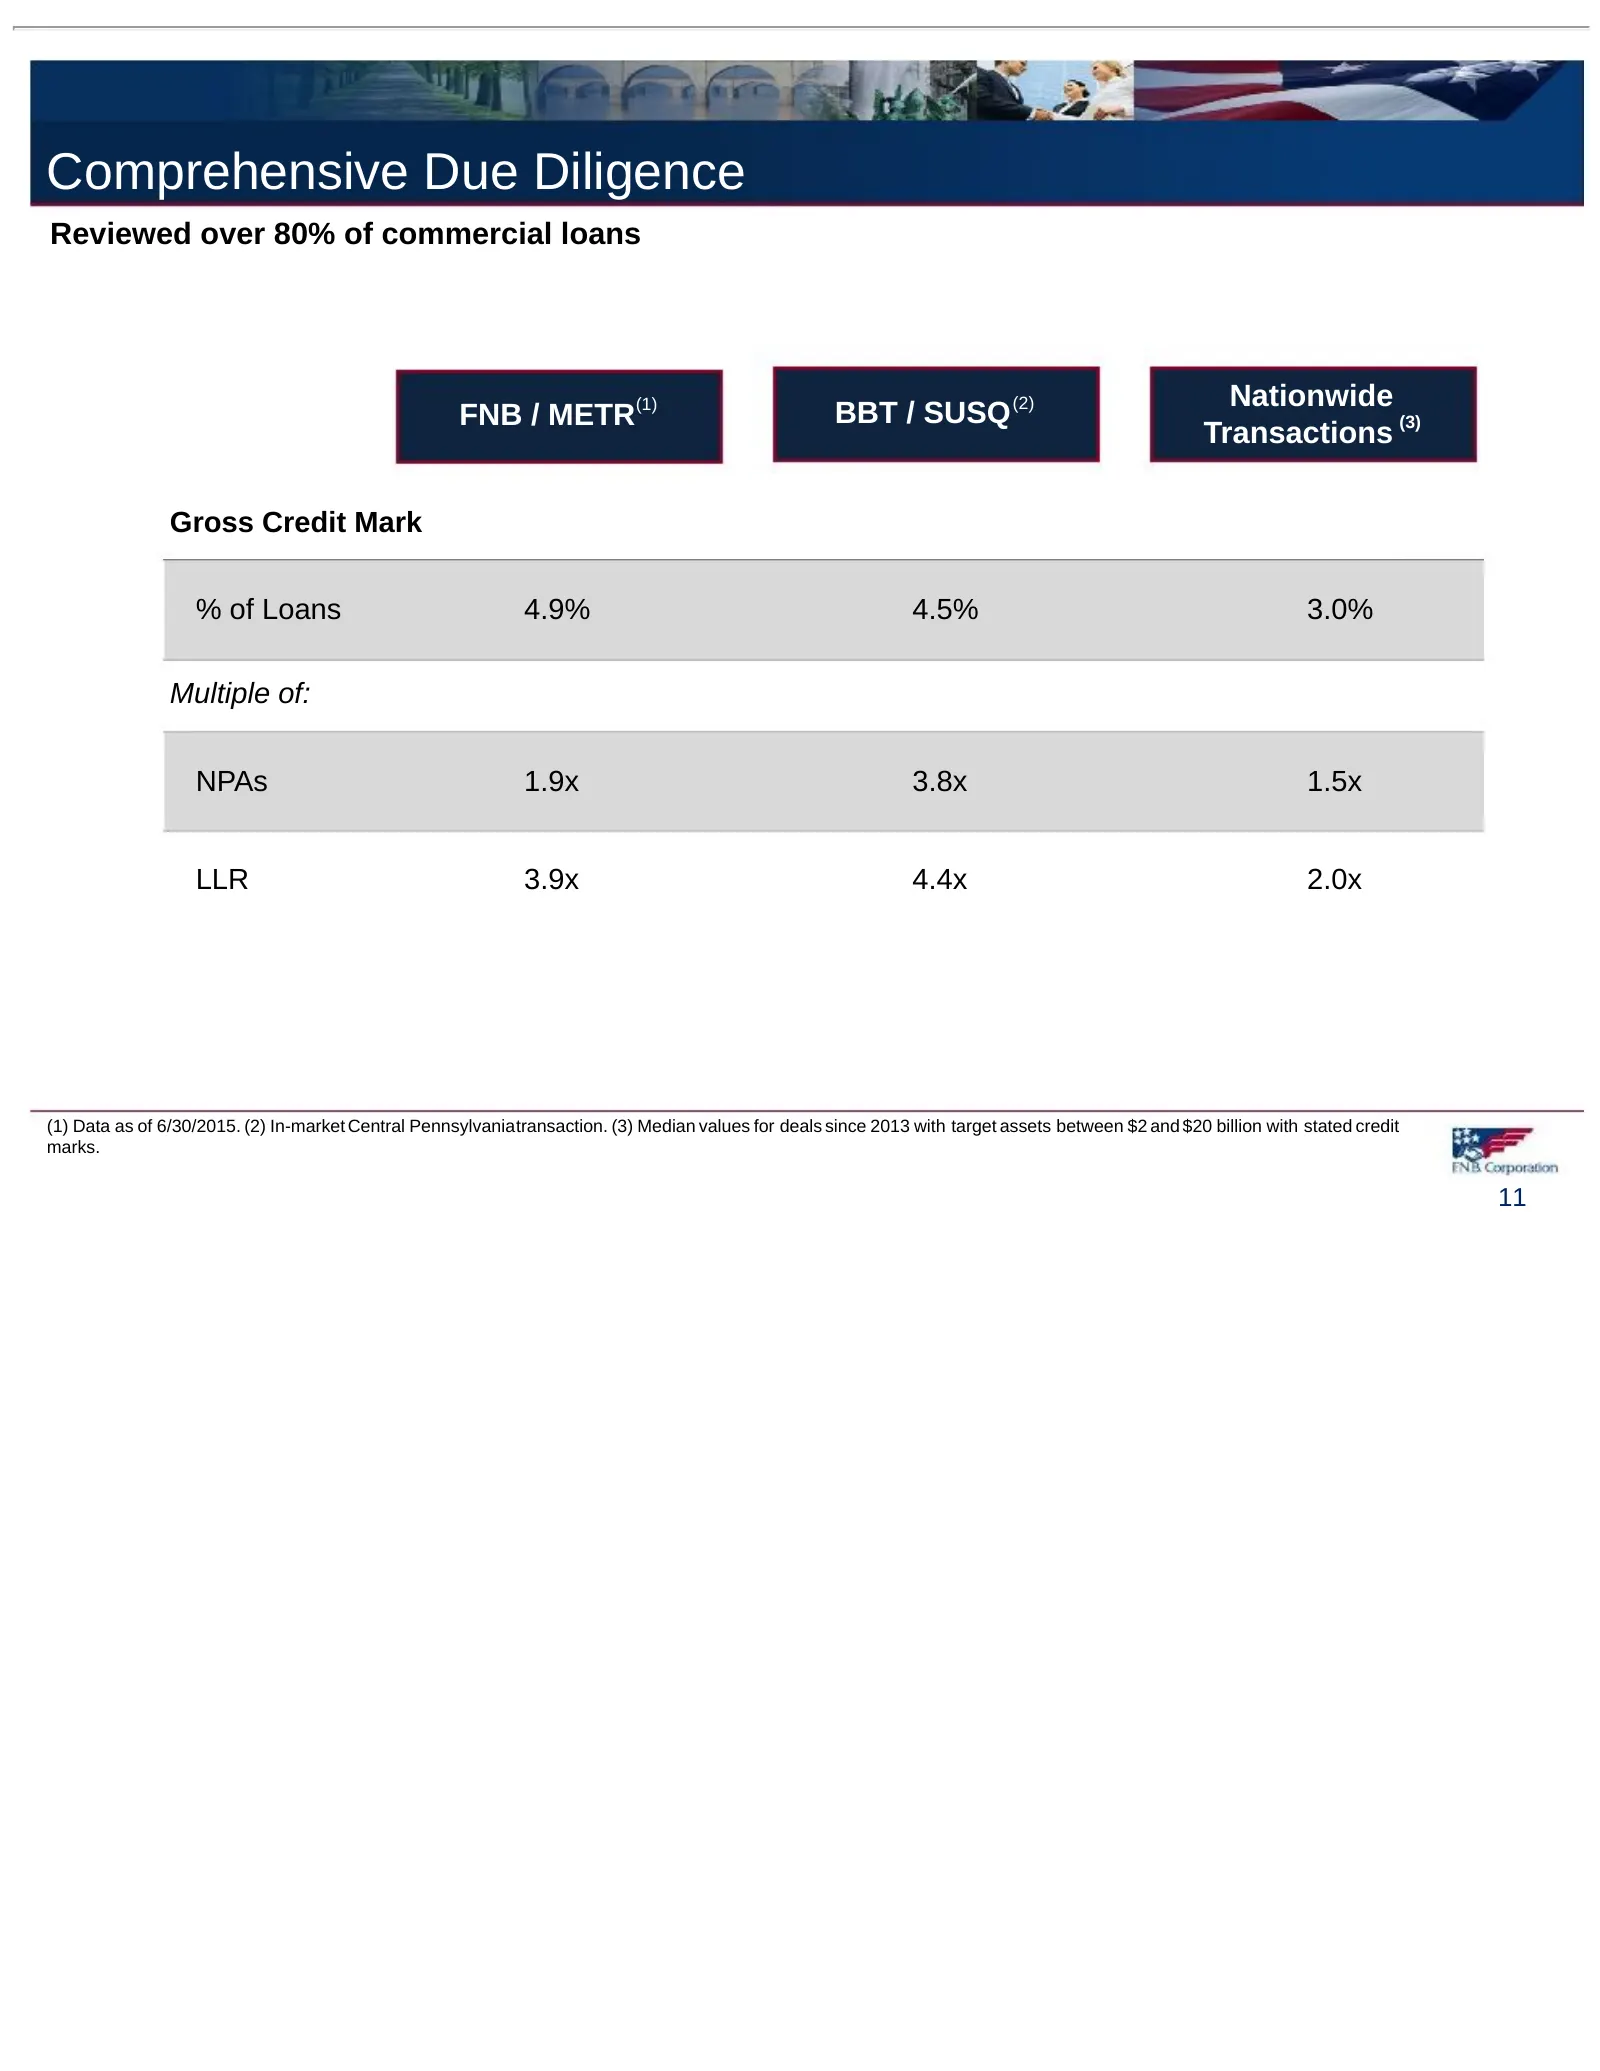
Comprehensive Due Diligence Reviewed over 80% of commercial loans Nationwide FNB / METR(1) BBT / SUSQ (2) Transactions (3) Gross Credit Mark % of Loans 4.9% 4.5% 3.0% Multiple of: NPAs 1.9x 3.8x 1.5x LLR 3.9x 4.4x 2.0x (1) Data as of 6/30/2015. (2) In-market Central Pennsylvaniatransaction. (3) Medi
Slide 12: Financial and Capital Impact
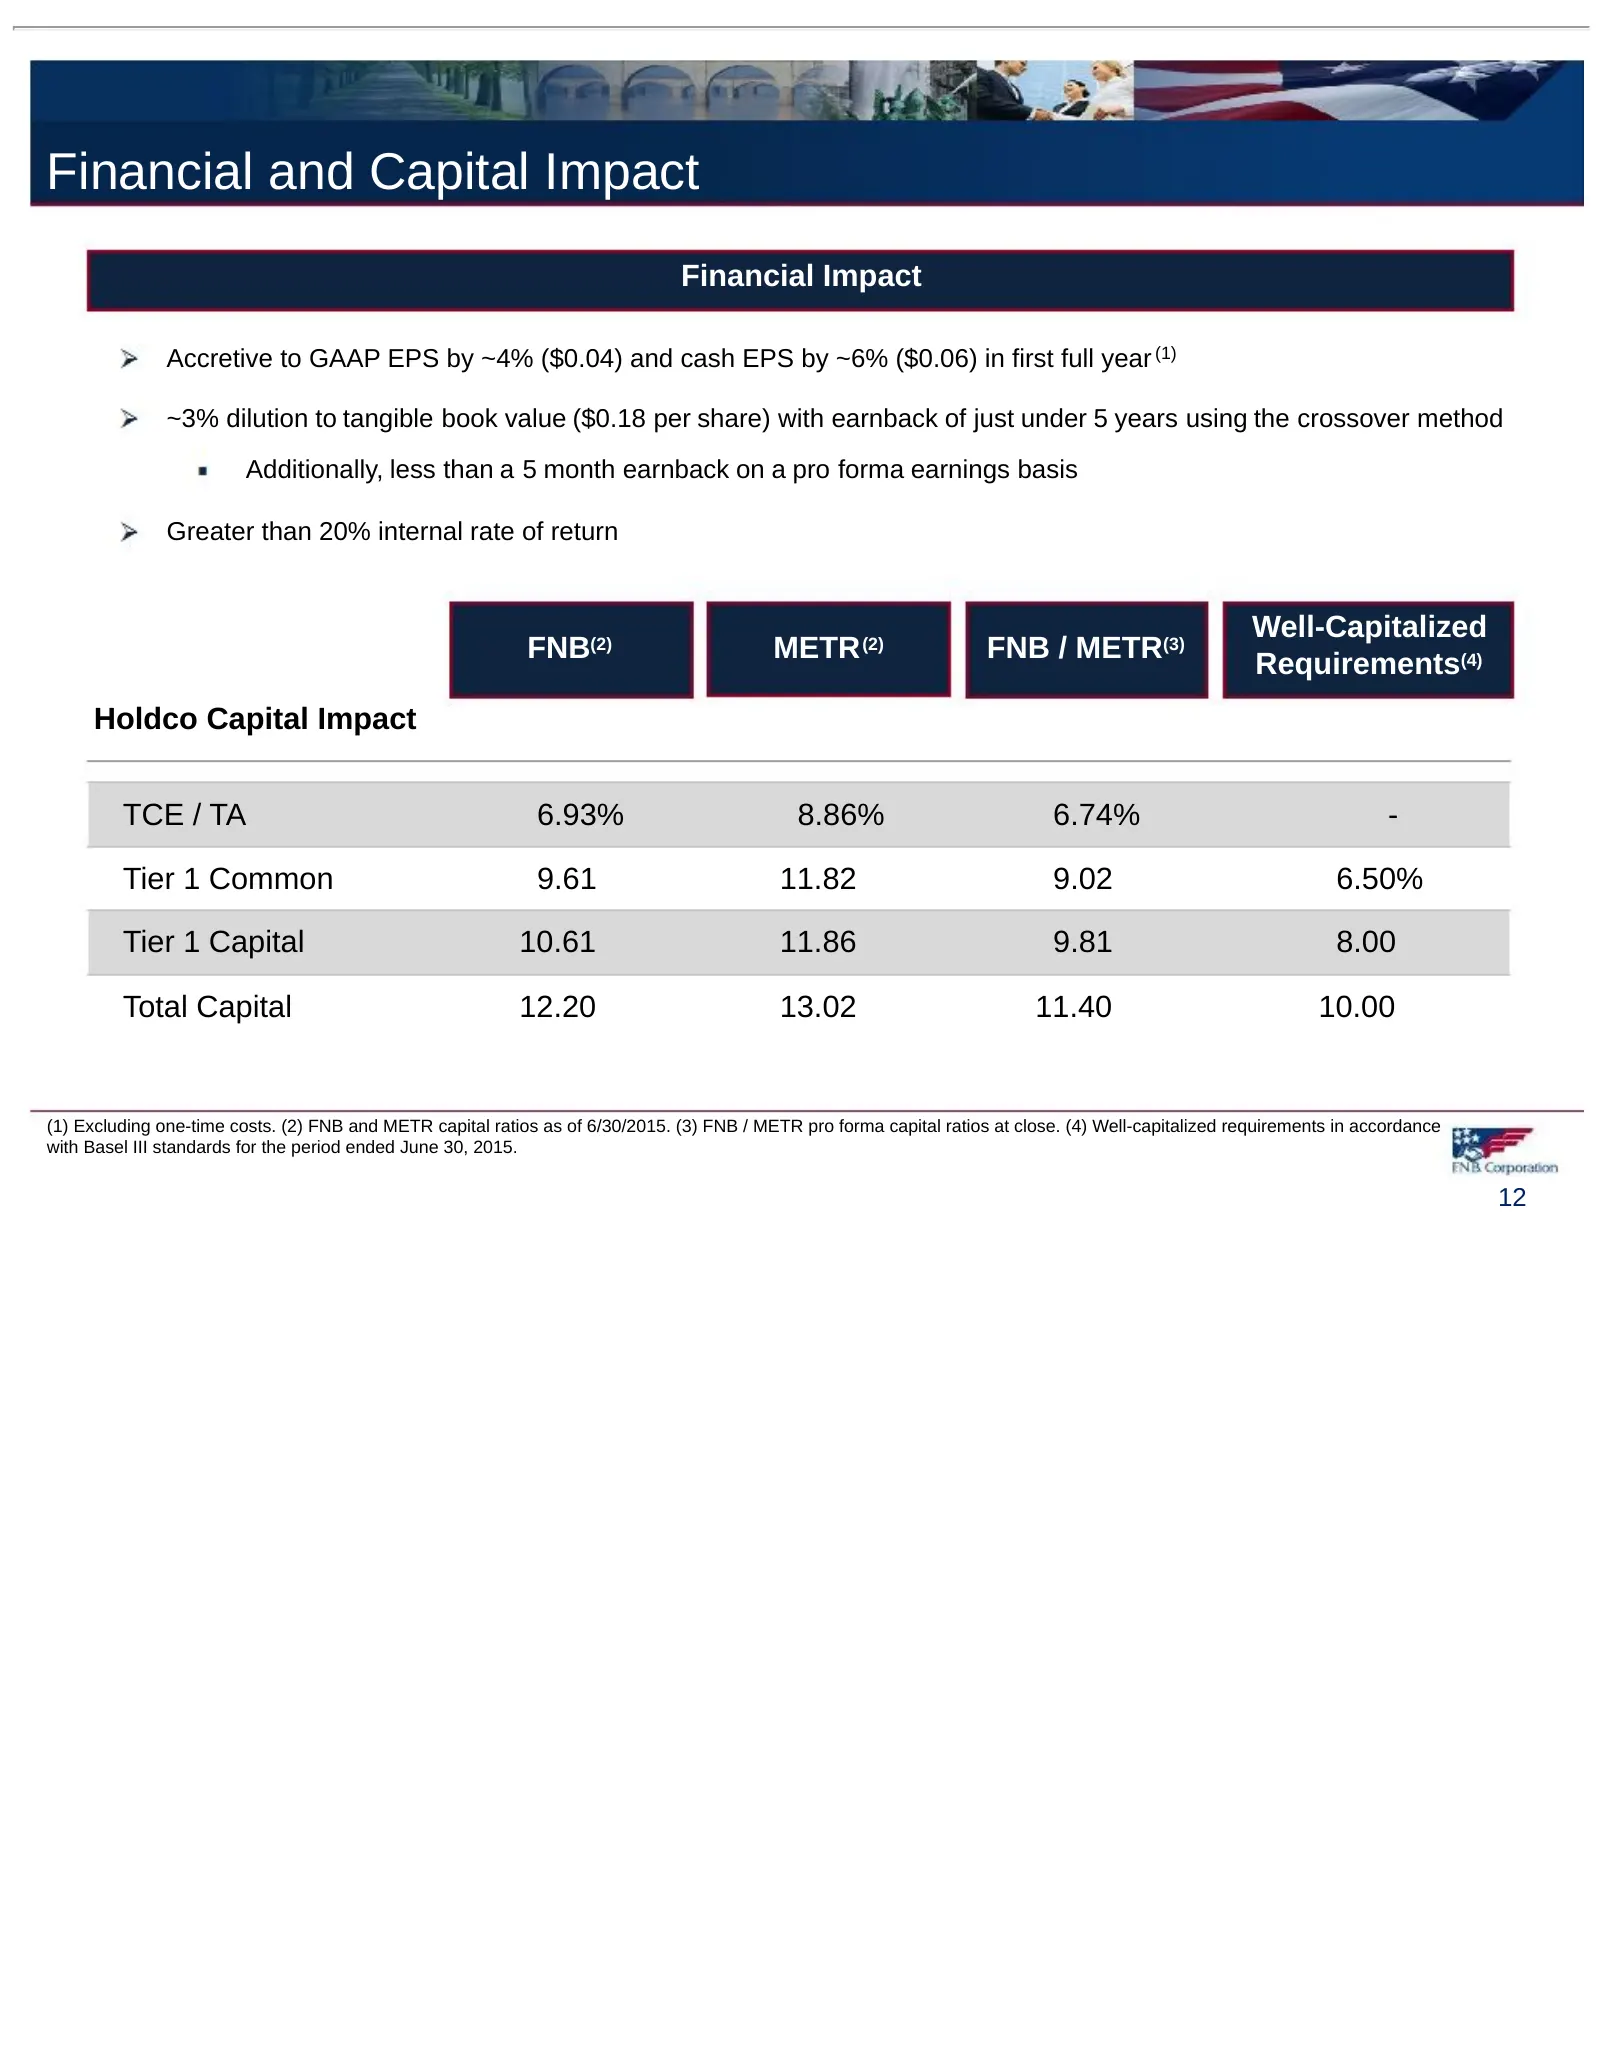
Financial and Capital Impact Financial Impact Accretive to GAAP EPS by ~4% ($0.04) and cash EPS by ~6% ($0.06) in first full year (1) ~3% dilution to tangible book value ($0.18 per share) with earnback of just under 5 years using the crossover method Additionally, less than a 5 month earnback on a p
Slide 13: Transaction Pricing
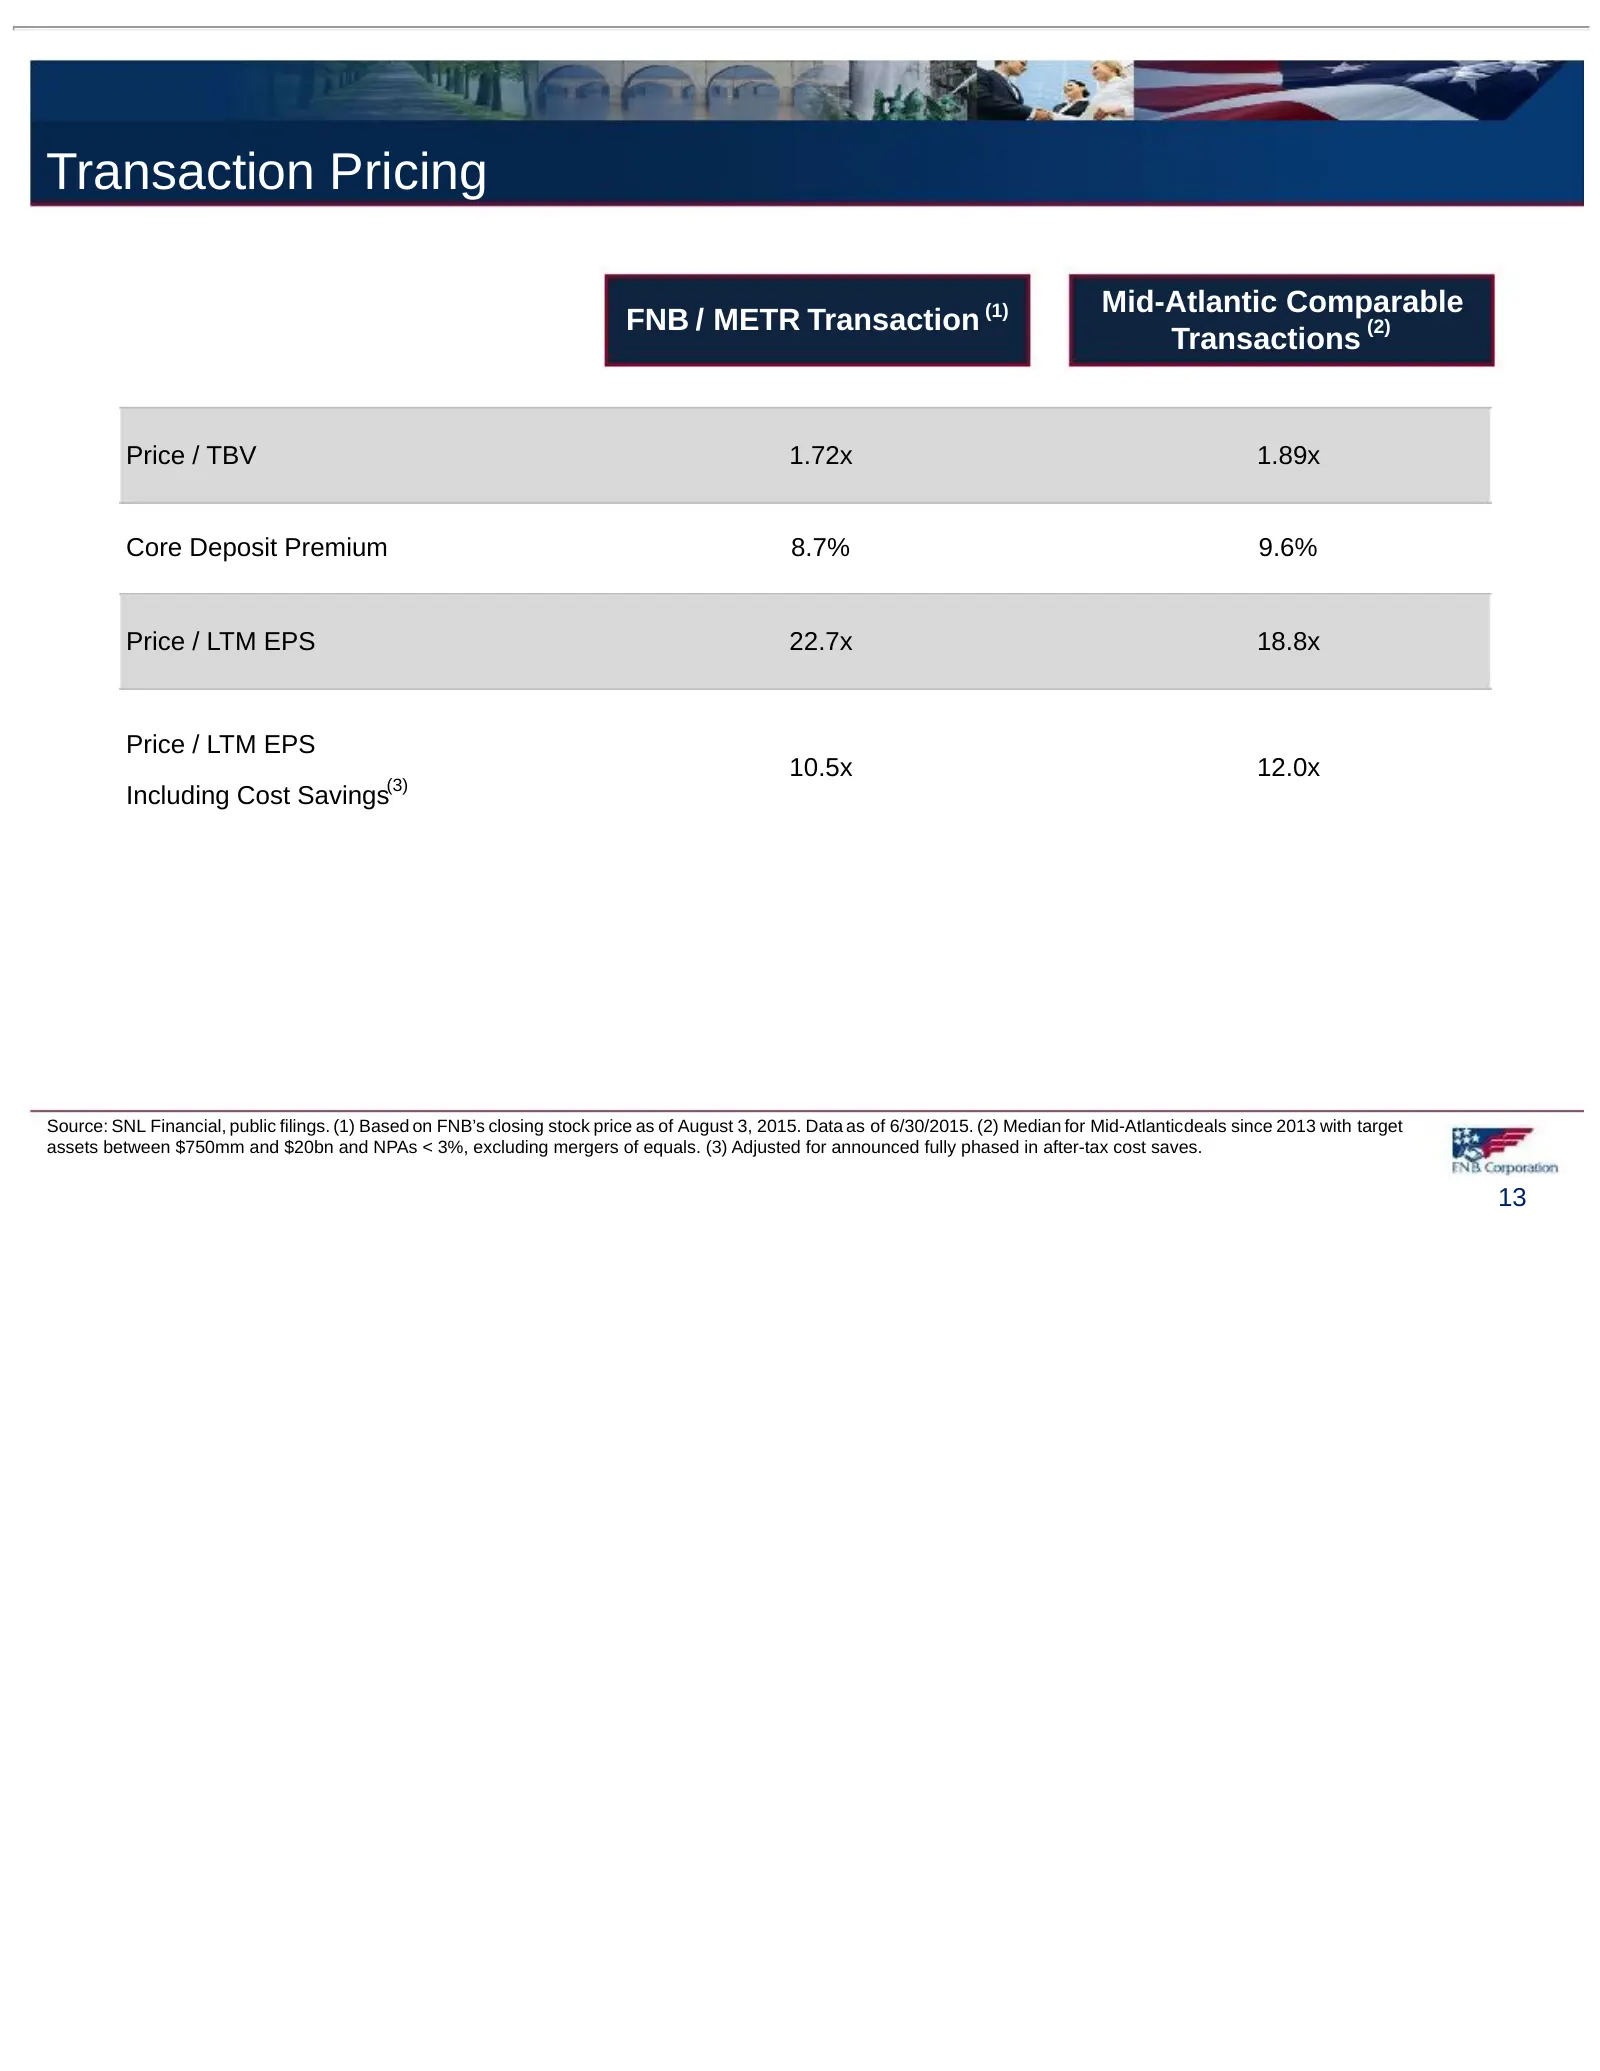
Transaction Pricing Mid-Atlantic Comparable FNB / METR Transaction (1) (2) Transactions Price / TBV 1.72x 1.89x Core Deposit Premium 8.7% 9.6% Price / LTM EPS 22.7x 18.8x Price / LTM EPS 10.5x 12.0x Including Cost Savings(3) Source: SNL Financial, public filings. (1) Based on FNB’s closing stock pri
Slide 14: Appendix
Appendix 14
Slide 15: Metro Bancorp, Inc. Financial Highlights
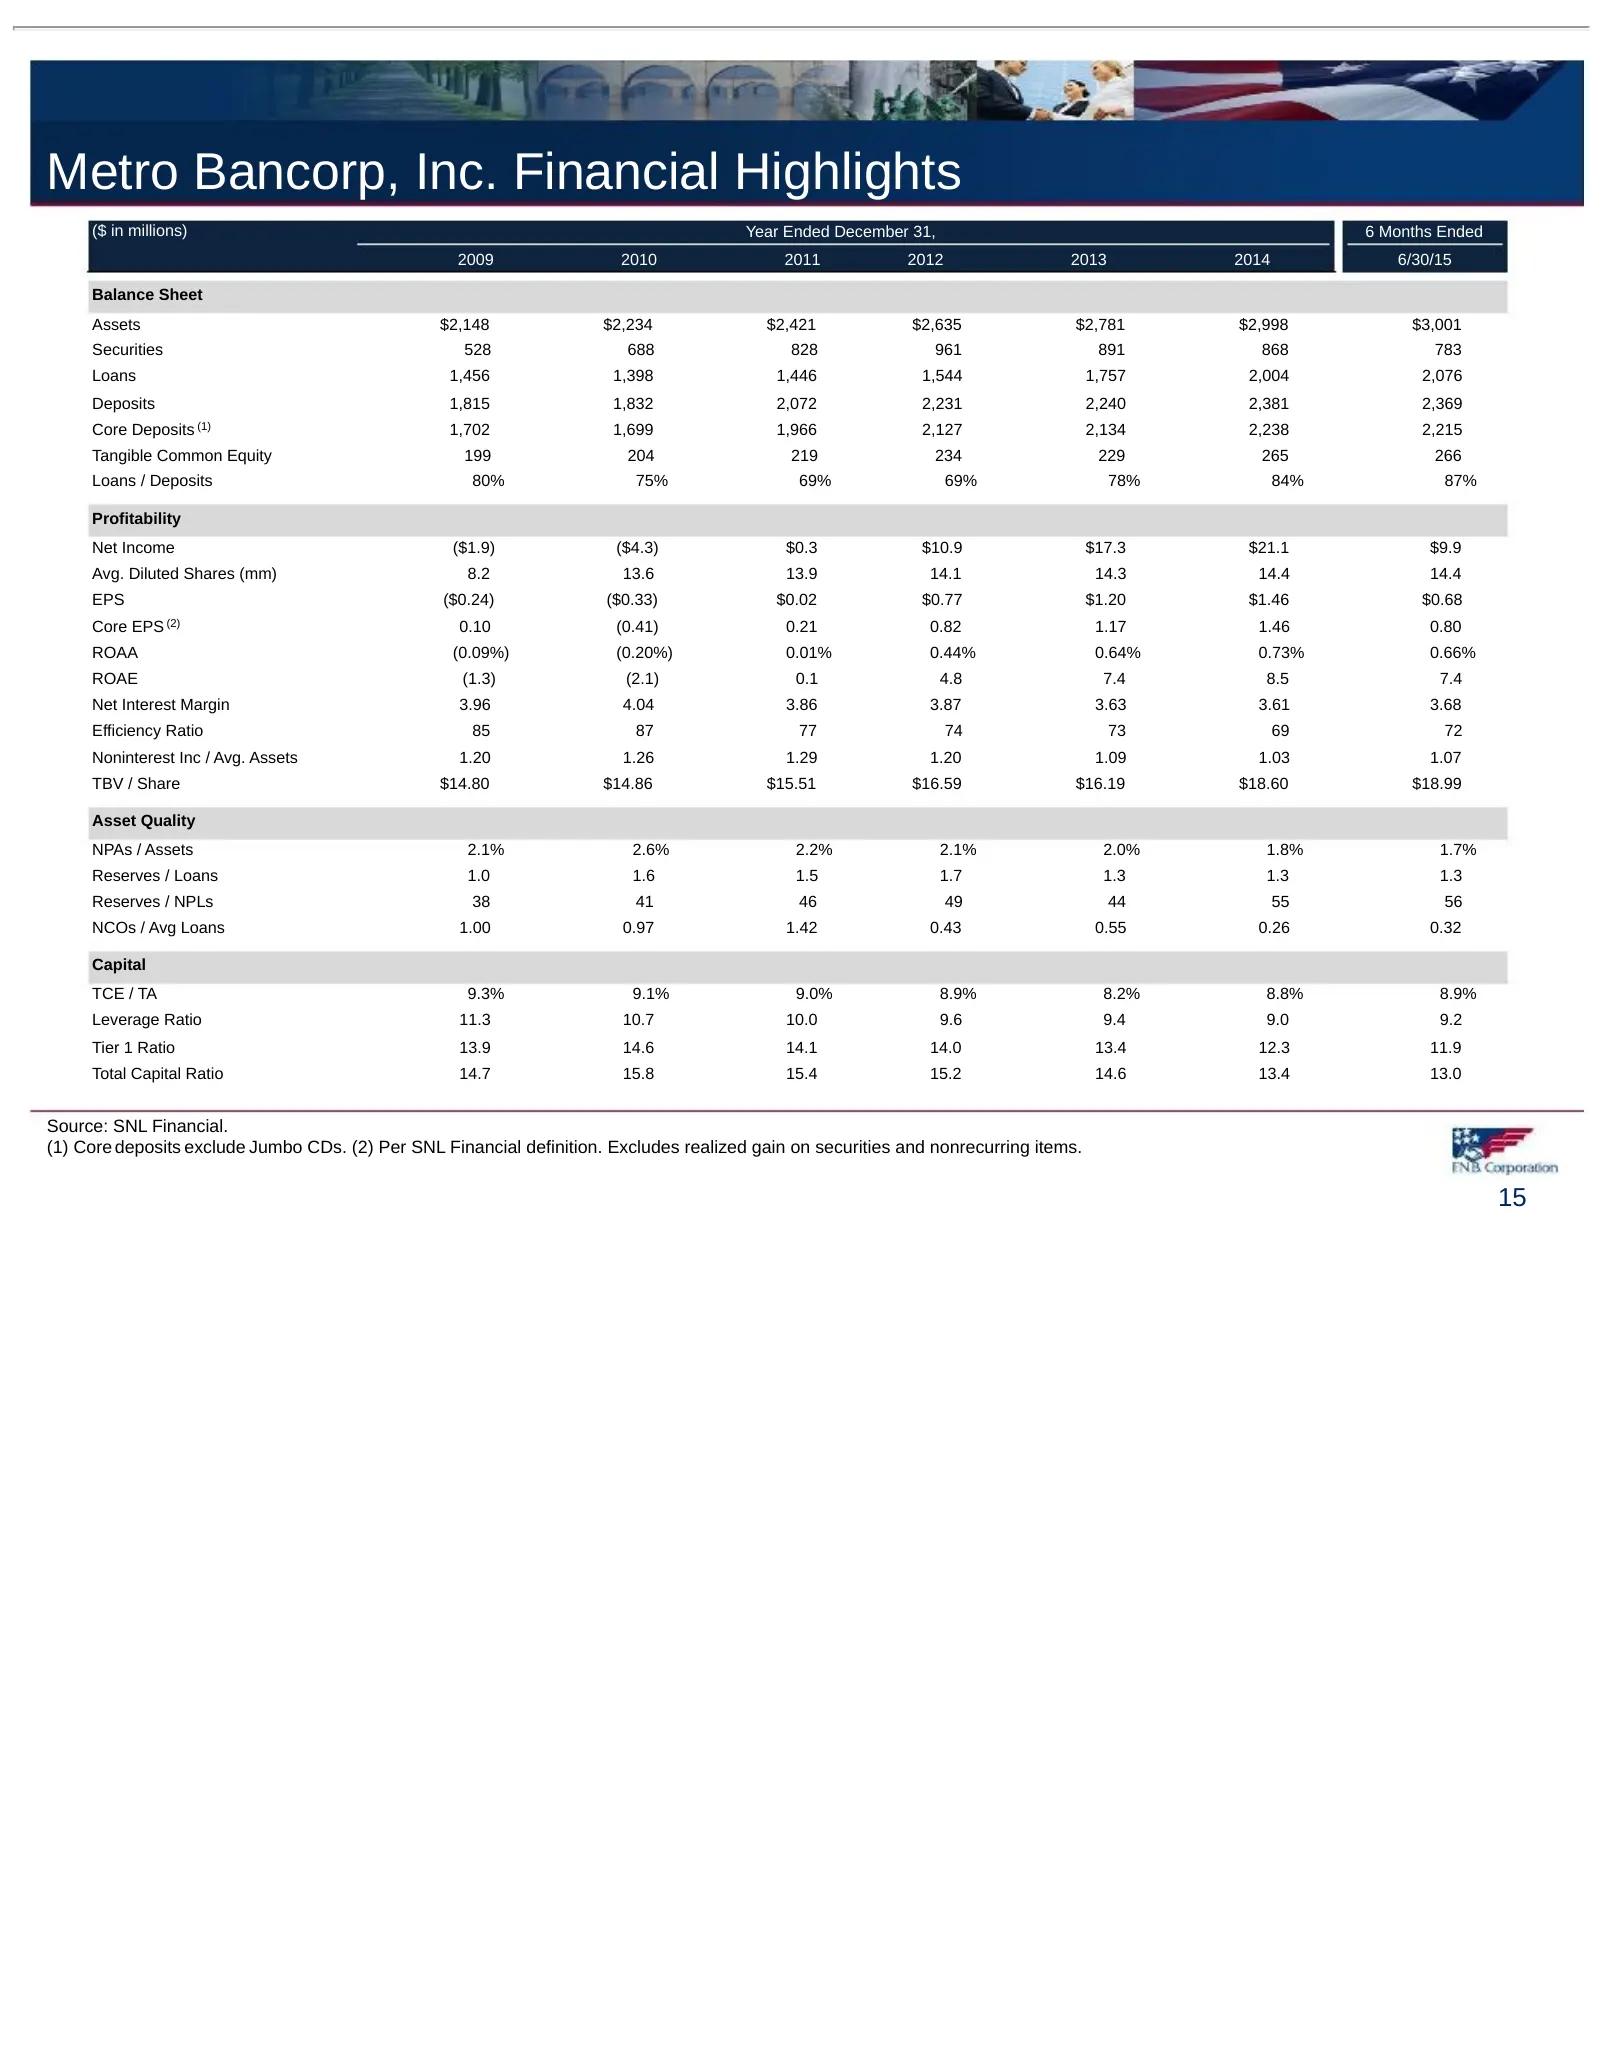
Metro Bancorp, Inc. Financial Highlights ($ in millions) Year Ended December 31, 6 Months Ended 2009 2010 2011 2012 2013 2014 6/30/15 Balance Sheet Assets $2,148 $2,234 $2,421 $2,635 $2,781 $2,998 $3,001 Securities 528 688 828 961 891 868 783 Loans 1,456 1,398 1,446 1,544 1,757 2,004 2,076 Deposits
Source: SEC EDGAR · 425 filed Aug 4, 2015
More decks from Metro Bancorp Inc
 Shareholder Meeting (June 2015)35 slides · Jun 19, 2015
 Shareholder Meeting (May 2014)35 slides · May 22, 2014
 Sandler O'Neill & Partners 2013 East Coast Financial Services Conference46 slides · Nov 13, 2013
 Investor Presentation (August 2013)45 slides · Aug 15, 2013
 Shareholder Meeting (May 2013)37 slides · May 17, 2013
 Sterne Agee Financial Institutions Investor Conference February 201342 slides · Feb 11, 2013