National Penn Bancshares — Investor Presentation (May 2009)
25 slides from National Penn Bancshares's investor presentation, May 19, 2009

Slide 1: National Penn Bancshares, Inc. Engineered for Success
National Penn Bancshares, Inc. Engineered for Success

Slide 2: Investor Relations Information
A Investor Relations Information l The following information can be found on our Investor Relations Web site at www.nationalpennbancshares.com l SEC Filings l Corporate News l Analyst Estimates ● and much more l Contact information – Michael R. Reinhard, Chief Financial Officer 610.369.6342 | mike.r

Slide 3: Safe Harbor Regarding Forward Looking Statements
Safe Harbor Regarding Forward Looking Statements This presentation contains forward-looking information about National Penn Bancshares, Inc. that is intended to be covered by the safe harbor for forward-looking statements provided by the Private Securities Litigation Reform Act of 1995. Forward-look

Slide 4: The Right Focus in this Environment
The Right Focus in this Environment l Consistent business strategies l Building capital l Diversified sources of funding - focus on deposits l Credit quality better than peers l Diversifying sources of revenue l Effective cost control

Slide 5: Snapshot as of March 31, 2009
Snapshot as of March 31, 2009 l Founded 1874, headquartered in eastern PA l NASDAQ ticker: NPBC l $9.6 billion in total assets l 127 community offices l Part of S&P SmallCap 600 Index l Successful acquirer/integrator over the past 18 years: – 11 community banks and thrifts – 5 branch transactions –
Slide 6: Located in the Heart of the Vibrant Mid-Atlantic Region
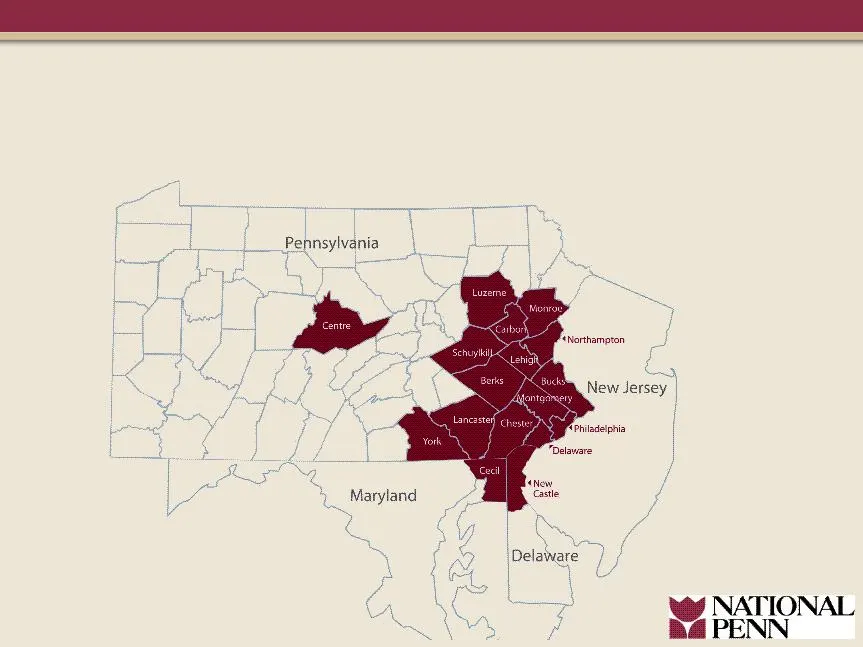
Located in the Heart of the Vibrant Mid-Atlantic Region

Slide 7: Relationship-based Business Model
Relationship-based Business Model l 5 geographic regions – each lead by a Regional President l Interaction between regions and business lines l Client contact is highly decentralized l Support activities are highly centralized l Relationship approach – client perceives bank as locally run – broad ar

Slide 8: Banking: Scope of Operations
BANKING Scope of Operations l Eastern/central PA and northern DE and MD l 127 Community offices l 141 ATMs Market Focus l Retail clients in footprint l Commercial clients in footprint l Government and not- for-profit clients Diversified Lines of Business - Banking, Insurance, Investments, Trust

Slide 9: Insurance: Scope of Operations
INSURANCE Scope of Operations l Primarily eastern PA, but licensed in 27 states l 35 th largest bank-owned agency in the U.S. l 8 locations and 83 agents l $300 million in annual premiums Market Focus l Personal lines products l Commercial lines products l Employer sponsored employee benefit program

Slide 10: Wealth: Scope of Operations
WEALTH Scope of Operations l Primarily national with a growing international business l Full array of wealth management products and services l Assets under management or administration = $7.9 billion Market Focus A collection of boutique wealth management companies who specialize in a specific segm
Slide 11: Solid Asset Growth Primarily Funded by Local Deposits
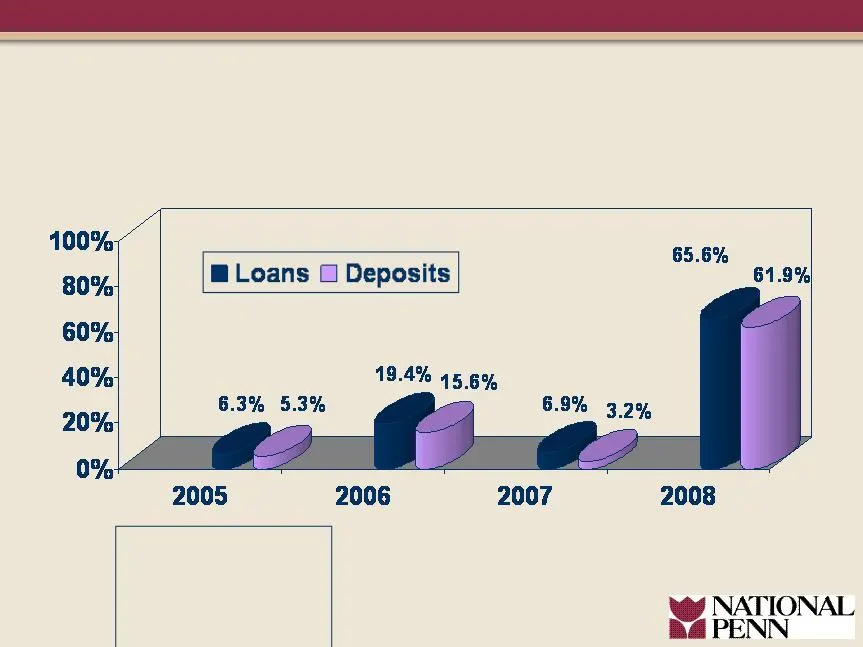
Growth in: Growth 1Q09 * Loans: .78% Deposits: 4.23% *non-annualized Solid Asset Growth Primarily Funded by Local Deposits

Slide 12: Strong Liquidity Position
Long-term Borrowed Funds $405 million Sold $150 million Purchased 6/30/2008 4/30/2009 $1.4 billion 6/30/2008 4/30/2009 Strong Liquidity Position Daily Funds Position

Slide 13: Strong Market Share in Core Counties
Northampton Lehigh Berks Centre Chester % of National Penn Deposits 17.7% 9.0% 20.4% 5.3% 14.1% Market Rank 1 2 2 2 3 Market Share 22.5% 9.4% 14.2% 16.5% 9.2% # Offices 23 16 20 5 19 As of 6.30.08 Strong Market Share in Core Counties
Slide 14: Diverse Sources of Revenue
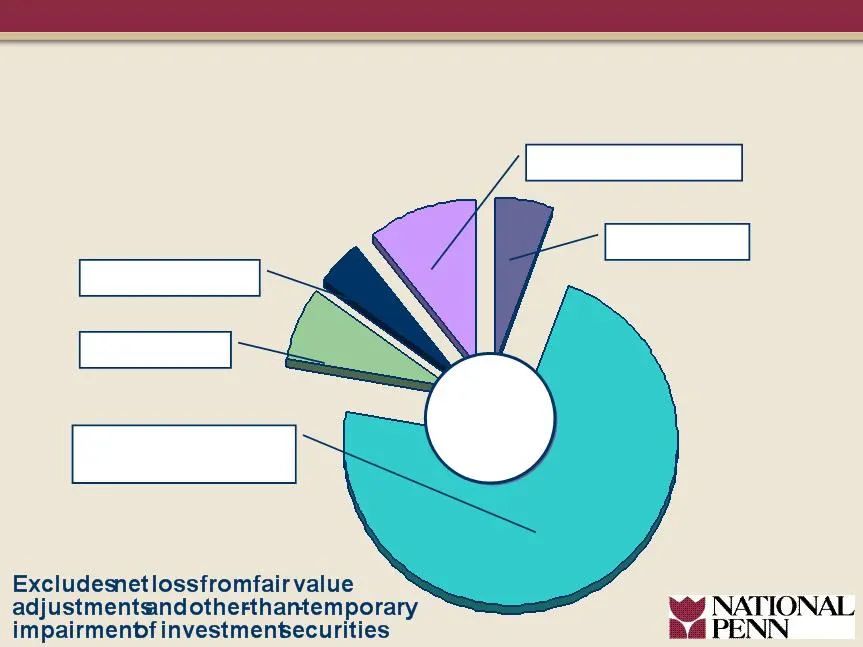
Total Revenues $89.3 Million Wealth 7.4% Insurance 4.4% Other 5.5% Deposit Fees 10.6% Months ending March 31, 2009 Net Interest Income (FTE) 72.1% Diverse Sources of Revenue
Slide 15: Effective Cost Control: Core Operating Expenses
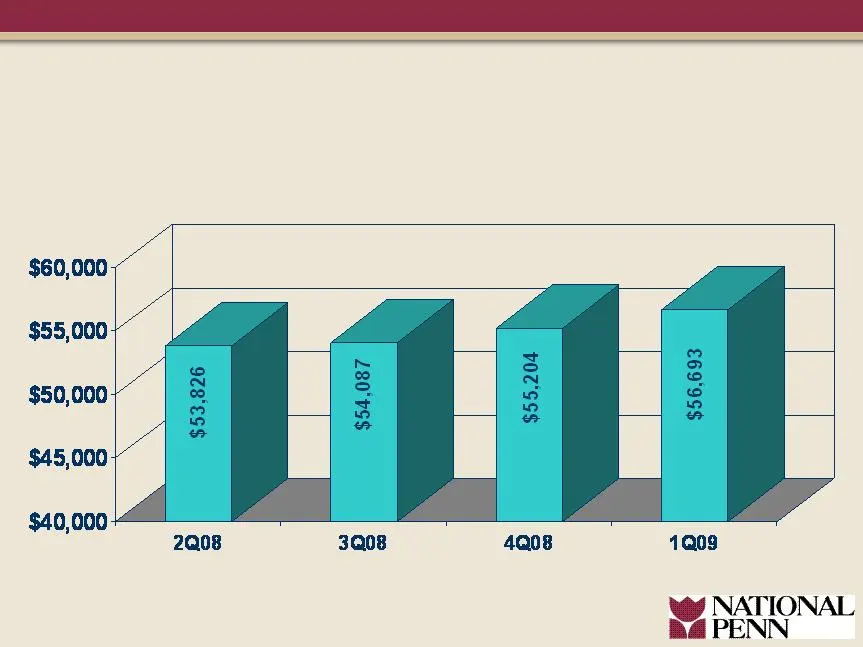
Core Operating Expenses Effective Cost Control

Slide 16: Consistent Business Strategies
Consistent Business Strategies l Balanced organic and acquisition growth l Solid credit quality and prudent risk management practices l Community banking market niche l Profitable relationship development l Diversified revenue streams l Focus on shareholder value
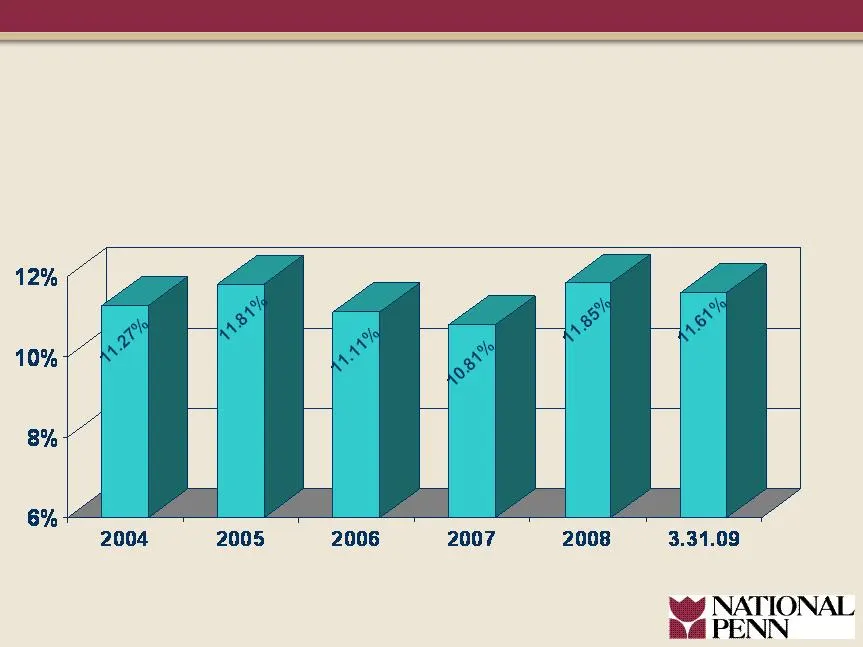
Slide 17: Focused on Building Capital
Total Risk Based Capital Ratio Focused on Building Capital
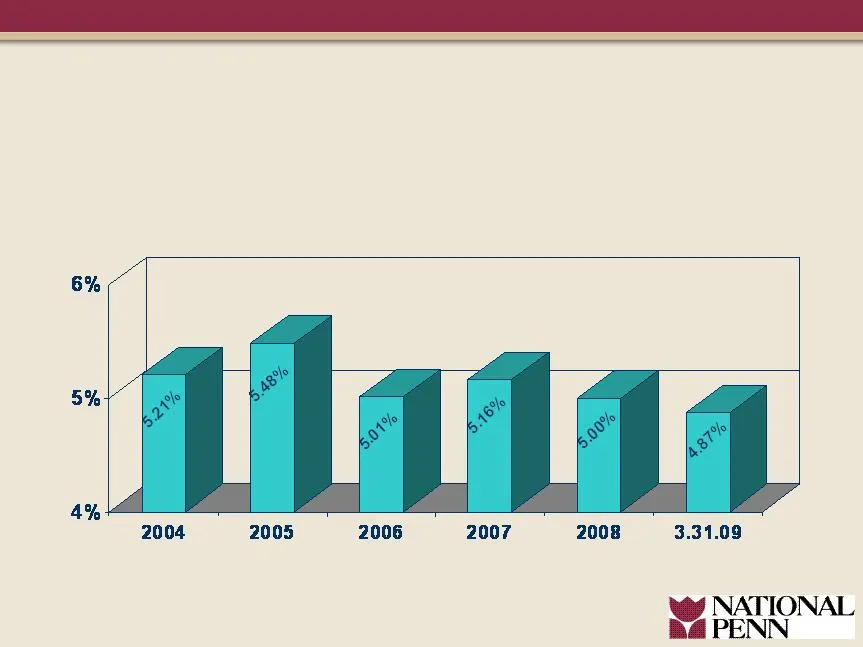
Slide 18: Focused on Building Tangible Common Equity
Tangible Common Equity to Tangible Asset Ratio Focused on Building Tangible Common Equity

Slide 19: Dividend Reinvestment and Stock Purchase Plan
l 10% discount on new share purchases and reinvested dividends until the earlier of: – Receipt of a total of $75 million in optional cash contributions, or – December 31, l Optional cash contributions recently increased to a maximum of $250,000 per month l Approximately $46.2 million in new common e
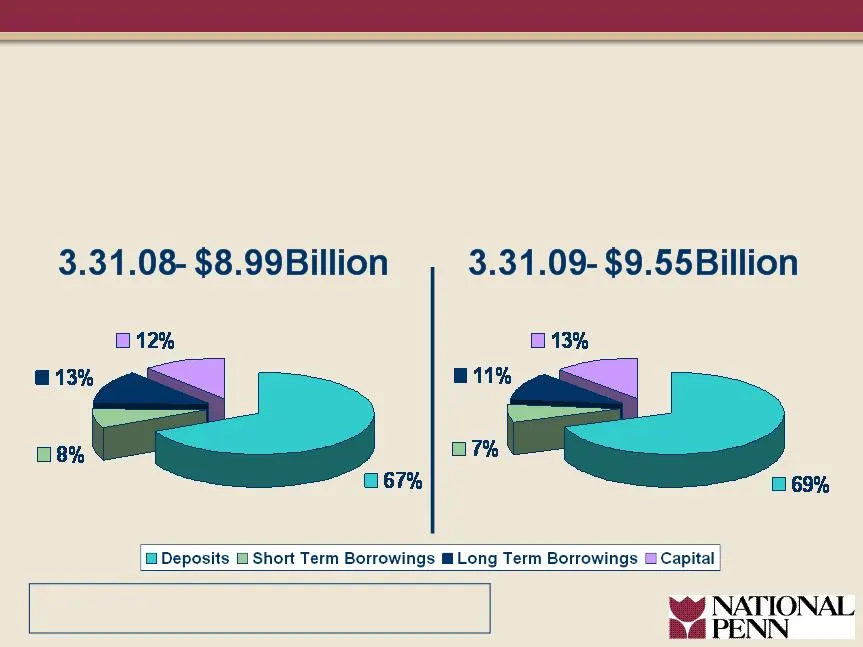
Slide 20: Improved Sources of Funding
NPBC Unused Borrowing Capacity in Excess of $ 1Billion Improved Sources of Funding

Slide 21: Prudent Risk Management
Prudent Risk Management l Conservative approach to risk management l Diversification by industry and customer segments l Adequate reserves - - strong coverage of non-performing assets relative to peers l Monitoring impact of economic downturn beginning to affect Mid-Atlantic region
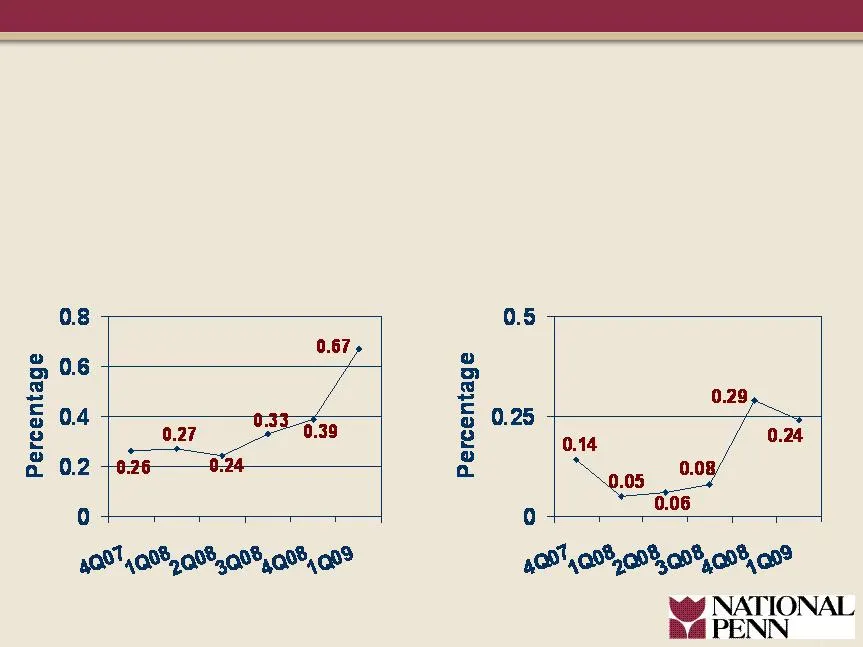
Slide 22: Credit Quality Consistent with Slowing Economy
Non-Performing Assets as a percentage of total assets Net Charge-offs to average loans (non- annualized) Credit Quality Consistent with Slowing Economy
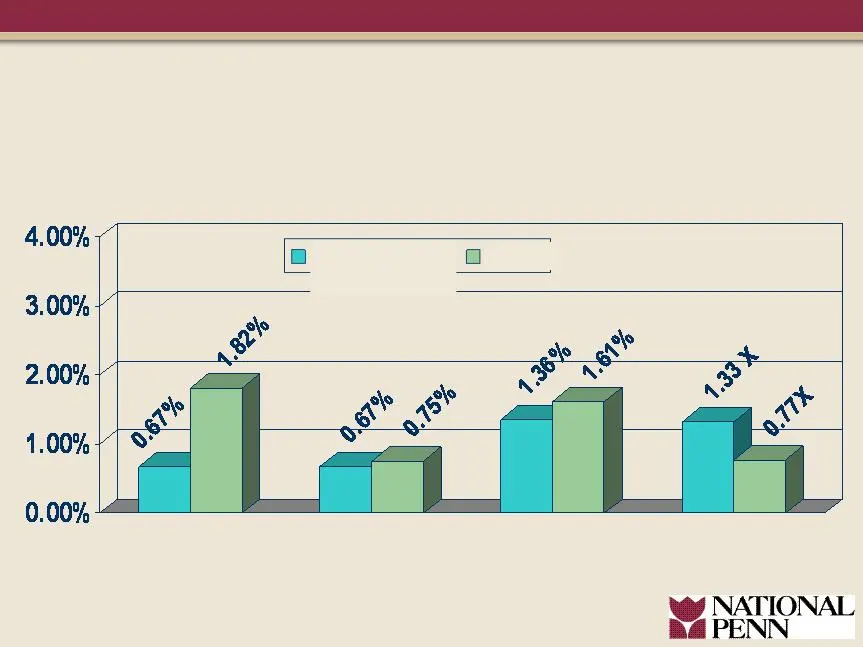
Slide 23: Strong Credit Quality Versus Peers
Source: Peer information from SNL as of/period ending 3.31.09 National Penn Peers Non-performing assets to total assets Net Charge-offs to average loans (last 12 months) Allowance for loan loss to loans Allowance for loan loss to non-performing assets Strong Credit Quality Versus Peers As of / Perio
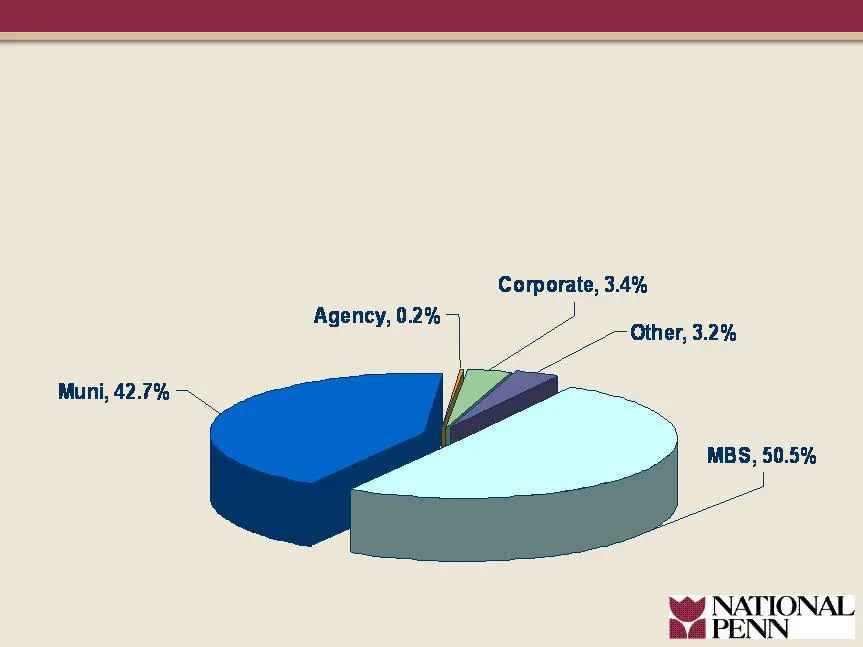
Slide 24: Investment Portfolio
Total Investments $1.91 Billion Investment Portfolio as of March 31,

Slide 25: Compelling Investment Considerations
Compelling Investment Considerations l Mid-Atlantic location of franchise l Knowledgeable and experienced management team l Prudent risk management practices l Strong credit quality relative to peers l Current focus on capital management, liquidity and overall asset quality l Leveraging of customer
Source: SEC EDGAR · 8-K filed May 19, 2009
More decks from National Penn Bancshares
 BB&T Global Financial Services Conference (September 2015)33 slides · Sep 16, 2015
 Merger or Acquisition (August 2015)13 slides · Aug 18, 2015
 Q2 2015 Earnings Presentation17 slides · Jul 23, 2015
 Q1 2015 Earnings Presentation18 slides · Apr 24, 2015
 Investor Presentation (February 2015)36 slides · Feb 11, 2015
 Q4 2014 Earnings Presentation16 slides · Jan 22, 2015