National City Corporation
National City — Fidelity Bankshares — Merger or Acquisition (July 2006)
21 slides from National City's merger presentation, Jul 27, 2006
Slide 1: Acquisition of Fidelity Bankshares, Inc.
Acquisition of Fidelity Bankshares, Inc. Investor Presentation July 27, 2006
Slide 2: Regulation MA Disclosure
Regulation MA Disclosure This investor presentation contains forward-looking statements within the meaning of the Private Securities Litigation Reform Act of 1995. Such statements include, but are not limited to, statements about the benefits of the merger between National City Corporation and Fidel
Slide 3: Fidelity Bankshares, Inc. (Nasdaq: FFFL)
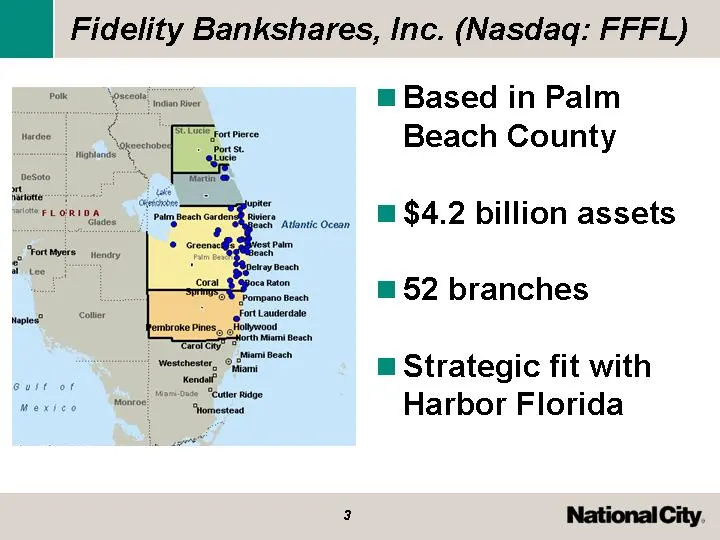
Fidelity Bankshares, Inc. (Nasdaq: FFFL) Based in Palm Beach County $4.2 billion assets 52 branches Strategic fit with Harbor Florida
Slide 4: Fidelity is a Well-Run Franchise
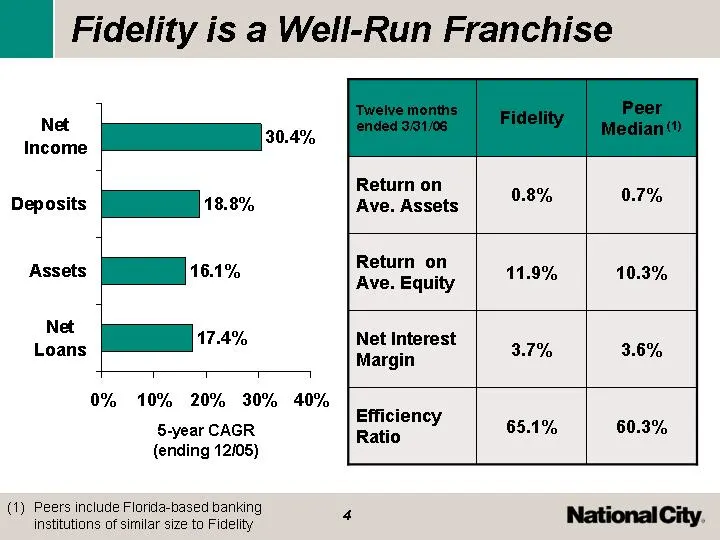
Fidelity is a Well-Run Franchise Net Loans Assets Deposits Net Income East 0.174 0.161 0.188 0.304 Twelve months ended 3/31/06 Fidelity Peer Median (1) Return on Ave. Assets 0.8% 0.7% Return on Ave. Equity 11.9% 10.3% Net Interest Margin 3.7% 3.6% Efficiency Ratio 65.1% 60.3% Peers include Florida-b
Slide 5: Strong Market Position: Palm Beach County
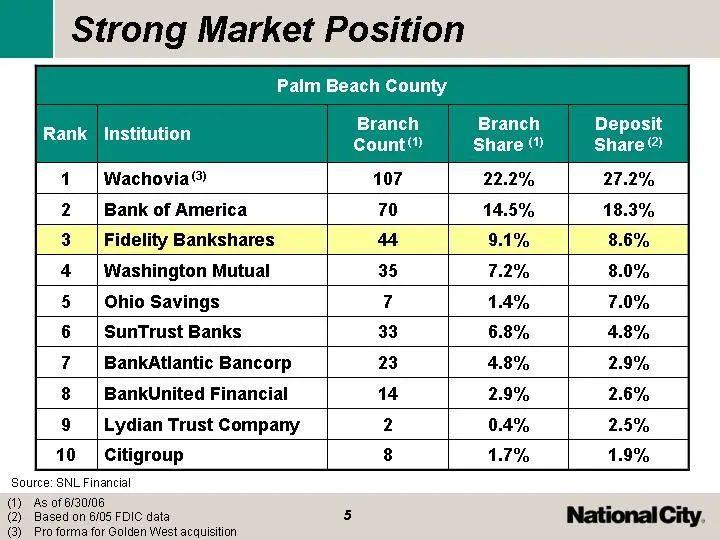
Strong Market Position Palm Beach County Palm Beach County Palm Beach County Palm Beach County Palm Beach County Rank Institution Branch Count (1) Branch Share (1) Deposit Share (2) 1 Wachovia (3) 107 22.2% 27.2% 2 Bank of America 70 14.5% 18.3% 3 Fidelity Bankshares 44 9.1% 8.6% 4 Washington Mutual
Slide 6: Strong Market Position: Combined Fidelity/Harbor Footprint
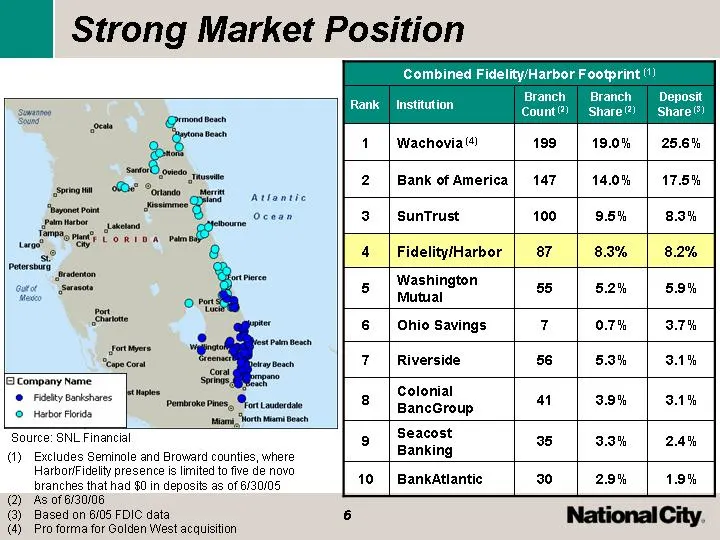
Strong Market Position Combined Fidelity/Harbor Footprint (1) Combined Fidelity/Harbor Footprint (1) Combined Fidelity/Harbor Footprint (1) Combined Fidelity/Harbor Footprint (1) Combined Fidelity/Harbor Footprint (1) Rank Institution Branch Count (2) Branch Share (2) Deposit Share (3) 1 Wachovia (4
Slide 7: Increased Focus on Direct Banking Businesses
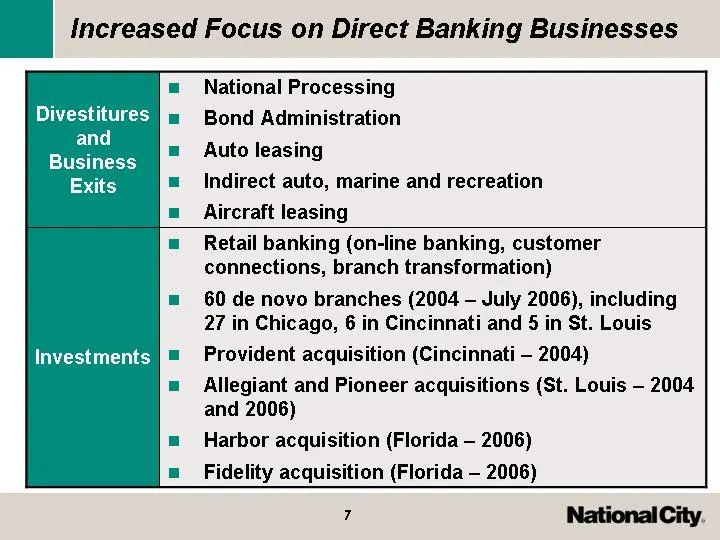
Increased Focus on Direct Banking Businesses Divestitures and Business Exits National Processing Bond Administration Auto leasing Indirect auto, marine and recreation Aircraft leasing Investments Retail banking (on-line banking, customer connections, branch transformation) 60 de novo branches (2004
Slide 8: Expanding into High-Growth Markets
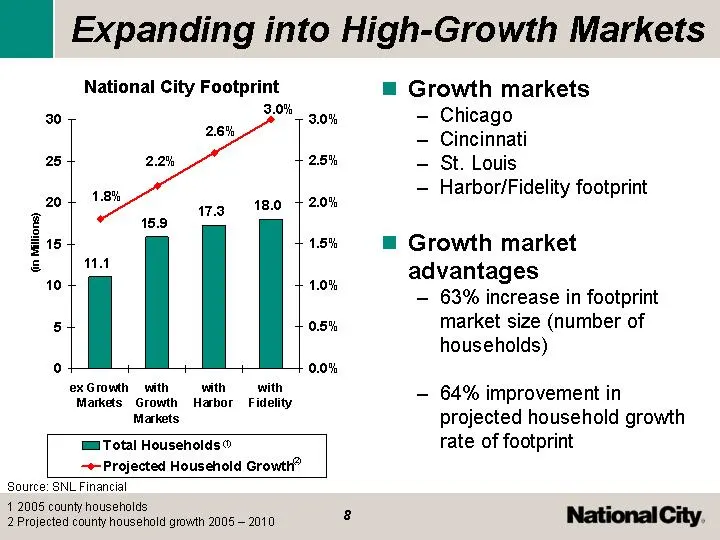
Expanding into High-Growth Markets ex Growth Markets with Growth Markets with Harbor with Fidelity Projected Household Growth 0.018 0.022 0.026 0.03 Total Households 11.1 15.9 17.3 18 Growth markets Chicago Cincinnati St. Louis Harbor/Fidelity footprint Growth market advantages 63% increase in footp
Slide 9: Summary Terms
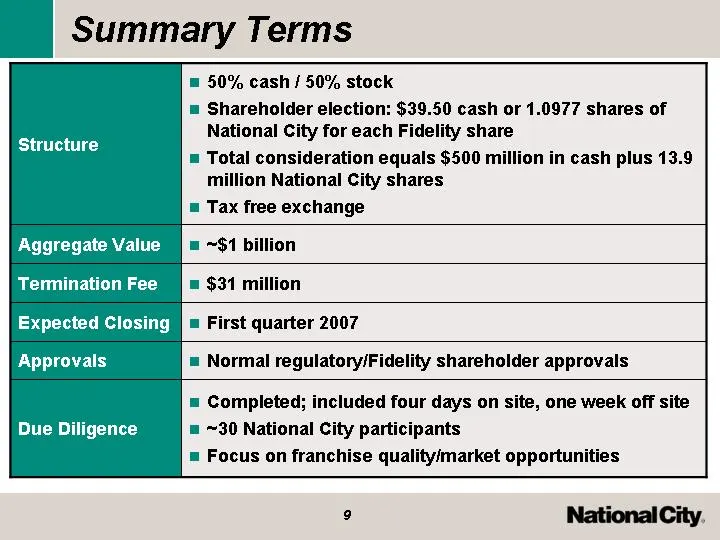
Summary Terms Structure 50% cash / 50% stock Shareholder election: $39.50 cash or 1.0977 shares of National City for each Fidelity share Total consideration equals $500 million in cash plus 13.9 million National City shares Tax free exchange Aggregate Value ~$1 billion Termination Fee $31 million Ex
Slide 10: Transaction Multiples
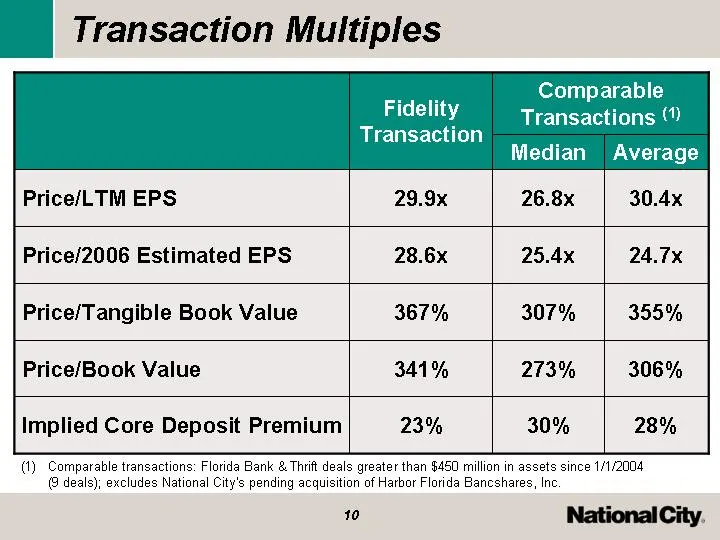
Transaction Multiples Fidelity Transaction Comparable Transactions (1) Comparable Transactions (1) Fidelity Transaction Median Average Price/LTM EPS 29.9x 26.8x 30.4x Price/2006 Estimated EPS 28.6x 25.4x 24.7x Price/Tangible Book Value 367% 307% 355% Price/Book Value 341% 273% 306% Implied Core Depo
Slide 11: Expected Timeline
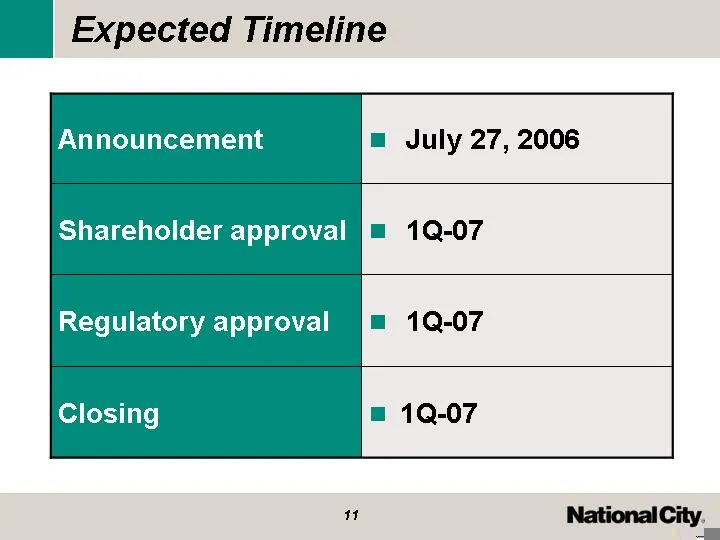
Expected Timeline Announcement July 27, 2006 Shareholder approval 1Q-07 Regulatory approval 1Q-07 Closing 1Q-07
Slide 12: Internal Rate of Return
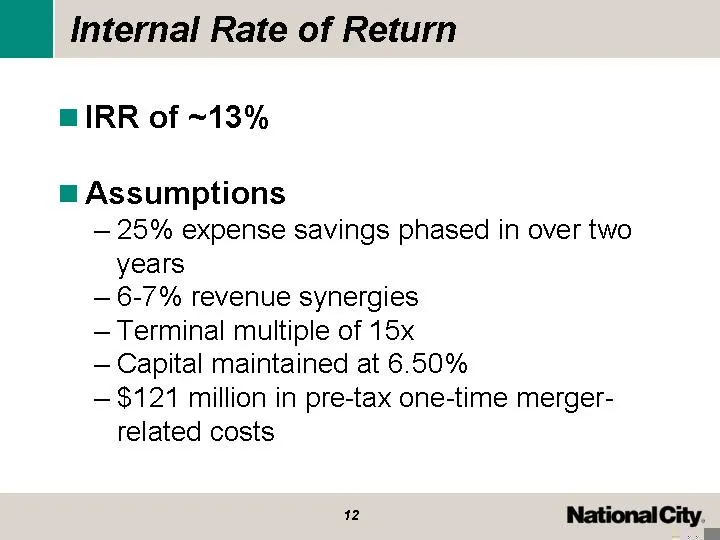
Internal Rate of Return IRR of ~13% Assumptions 25% expense savings phased in over two years 6-7% revenue synergies Terminal multiple of 15x Capital maintained at 6.50% $121 million in pre-tax one-time merger- related costs
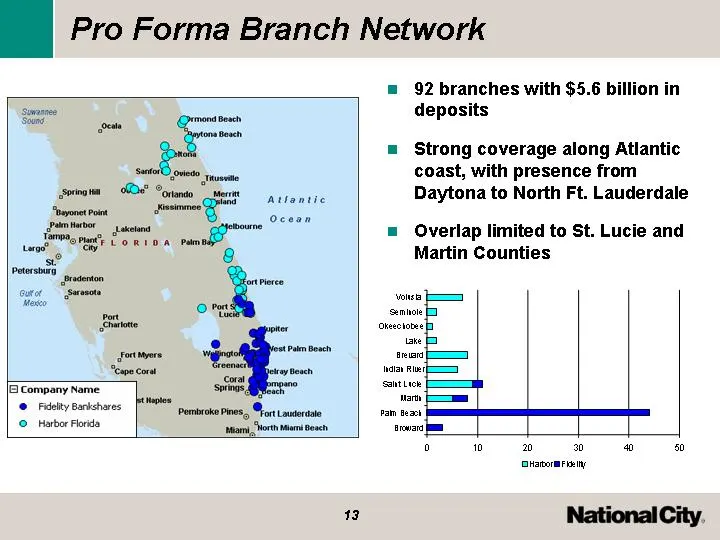
Slide 13: Pro Forma Branch Network
Pro Forma Branch Network 92 branches with $5.6 billion in deposits Strong coverage along Atlantic coast, with presence from Daytona to North Ft. Lauderdale Overlap limited to St. Lucie and Martin Counties 0 10 20 30 40 50 Broward Palm Beach Martin Saint Lucie Indian River Brevard Lake Okeechobee Sem
Slide 14: Integration Strategy
Integration Strategy Fidelity and Harbor will follow parallel paths toward integration Existing management remains in place National City additions in integration management, credit, and retail banking Emphasis on seamless transition from the customer's perspective
Slide 15: Areas of Focus and Opportunity
Areas of Focus and Opportunity Launch aggressive brand building campaign Execute customer-focused integration strategy Leverage Fidelity's ongoing transition to a more bank-like model Build on loyal customer relationships with broader product set and aggressive sales force
Slide 16: Consumer & Small Business Banking Opportunity
Consumer & Small Business Banking Opportunity Focus on household acquisition, expansion and retention Enhanced product set Leverage Points from National City and bank at work programs
Slide 17: Wealth Management Opportunity
Wealth Management Opportunity Enhanced investment management and trust offerings In-house investment research and recommendations Proprietary products and open architecture, including alternative investment options Customized credit products Comprehensive financial planning solutions Full brokerage
Slide 18: Commercial Banking Opportunity
Commercial Banking Opportunity Commercial real estate Middle market lending Treasury management and ancillary product offerings Trade finance
Slide 19: Summary of Transaction Rationale
Summary of Transaction Rationale Well-run franchise with attractive branch network Pro forma 92 branch network Well situated and in good condition Favorable branch density Opportunity to leverage National City's capital base, technology and products Consistent with corporate strategy Focus on direct
Slide 20: Appendix
Appendix
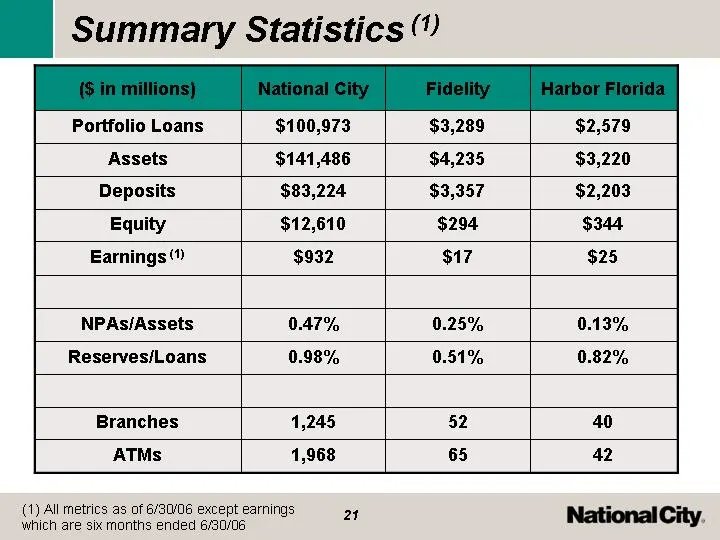
Slide 21: Summary Statistics
Summary Statistics (1) ($ in millions) National City Fidelity Harbor Florida Portfolio Loans $100,973 $3,289 $2,579 Assets $141,486 $4,235 $3,220 Deposits $83,224 $3,357 $2,203 Equity $12,610 $294 $344 Earnings (1) $932 $17 $25 NPAs/Assets 0.47% 0.25% 0.13% Reserves/Loans 0.98% 0.51% 0.82% Branches
Source: SEC EDGAR · 425 filed Jul 27, 2006
More decks from National City Corporation
 Q3 2008 Earnings Presentation38 slides · Oct 21, 2008
 Q2 2008 Earnings Presentation32 slides · Jul 24, 2008
 Q1 2008 Earnings Presentation16 slides · Apr 21, 2008
 Q1 2008 Earnings Presentation30 slides · Apr 21, 2008
 Q4 2007 Earnings Presentation23 slides · Jan 22, 2008
 MAF Bancorp — Merger or Acquisition (May 2007)17 slides · May 1, 2007