National City Corporation
National City — Q2 2008 Earnings Presentation
32 slides from National City's earnings presentation, Jul 24, 2008
Slide 1: Supplemental Data for Earnings Conference Call July 24, 2008
Supplemental Data for Earnings Conference Call July 24, 2008
Slide 2: List of Participants
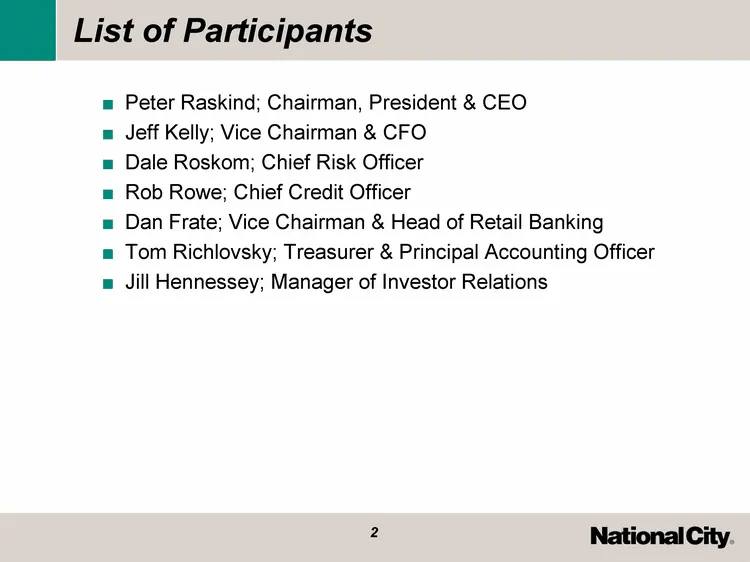
List of Participants Peter Raskind; Chairman, President & CEO Jeff Kelly; Vice Chairman & CFO Dale Roskom; Chief Risk Officer Rob Rowe; Chief Credit Officer Dan Frate; Vice Chairman & Head of Retail Banking Tom Richlovsky; Treasurer & Principal Accounting Officer Jill Hennessey; Manager of Investor
Slide 3: 2Q08 Quarterly Highlights
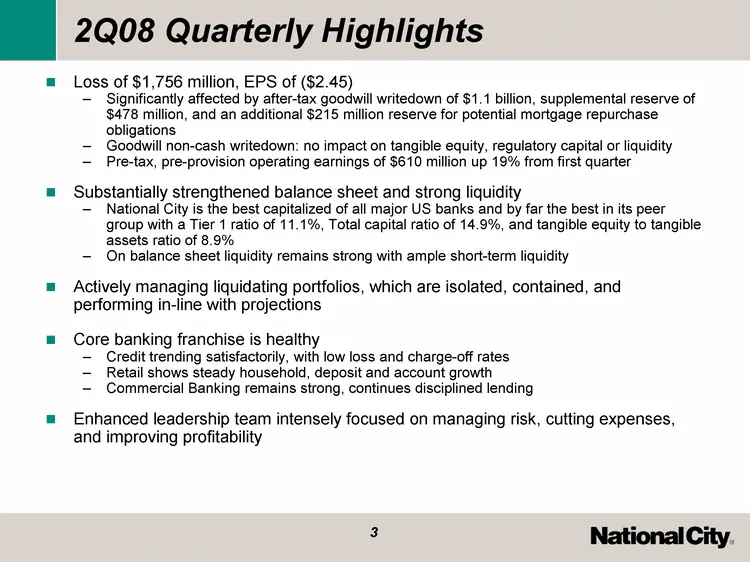
2Q08 Quarterly Highlights Loss of $1,756 million, EPS of ($2.45) Significantly affected by after-tax goodwill writedown of $1.1 billion, supplemental reserve of $478 million, and an additional $215 million reserve for potential mortgage repurchase obligations Goodwill non-cash writedown: no impact o
Slide 4: Pre-tax, Pre-provision Operating Earnings
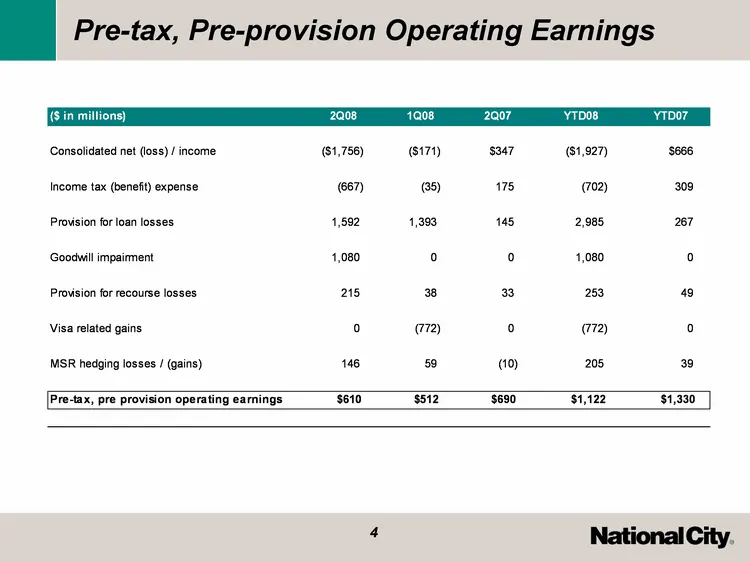
Pre-tax, Pre-provision Operating Earnings
Slide 5: Credit and Capital
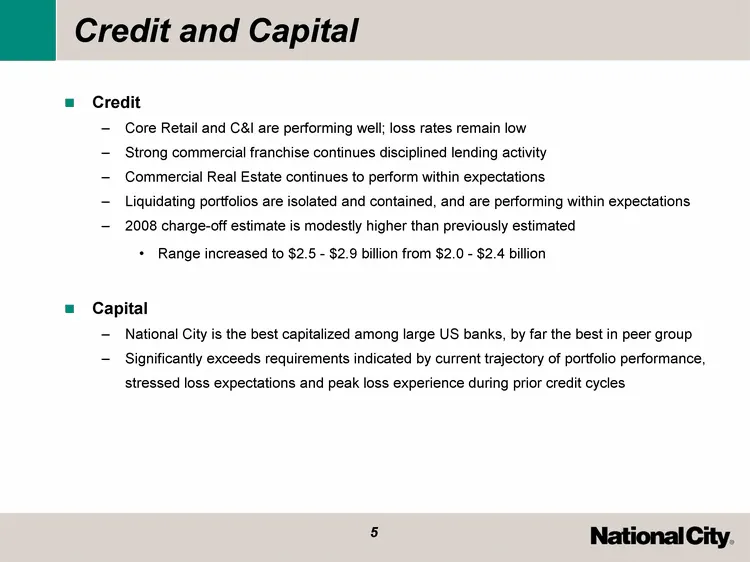
Credit and Capital Credit Core Retail and C&I are performing well; loss rates remain low Strong commercial franchise continues disciplined lending activity Commercial Real Estate continues to perform within expectations Liquidating portfolios are isolated and contained, and are performing within exp
Slide 6: National City Operates from a Strong Capital Position
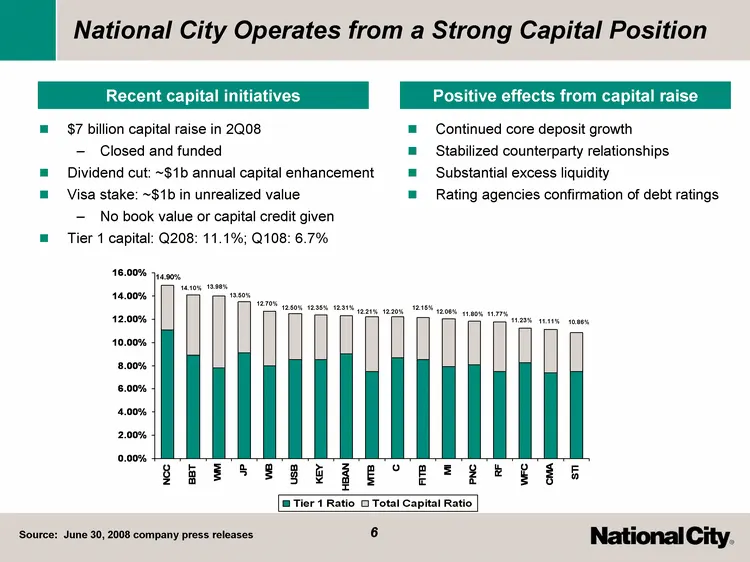
National City Operates from a Strong Capital Position $7 billion capital raise in 2Q08 Closed and funded Dividend cut: ~$1b annual capital enhancement Visa stake: ~$1b in unrealized value No book value or capital credit given Tier 1 capital: Q208: 11.1%; Q108: 6.7% Continued core deposit growth Stab
Slide 7: Strong Funding Position
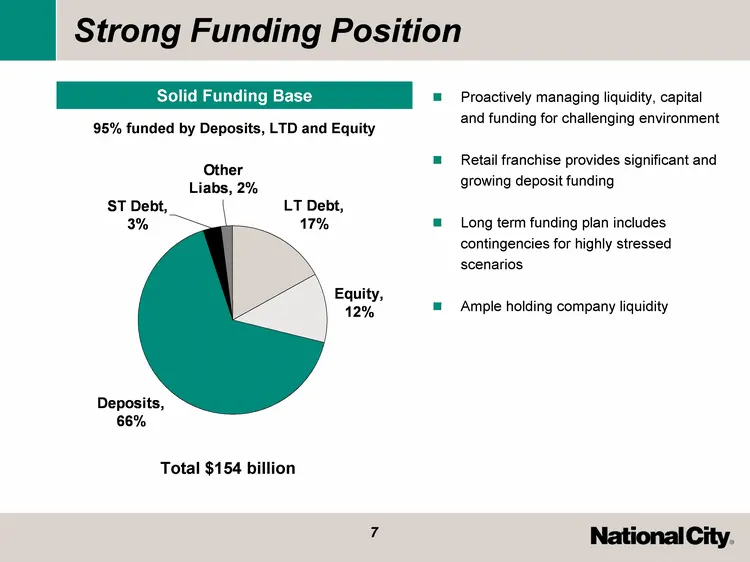
Strong Funding Position LT Debt Equity Deposits ST Debt Other Liabs Liquidity Funding 0.17 0.12 0.66 0.03 0.02 West 30.6 38.6 34.6 31.6 North 45.9 46.9 45 43.9 Proactively managing liquidity, capital and funding for challenging environment Retail franchise provides significant and growing deposit fu
Slide 8: Solid Deposit Growth Trend
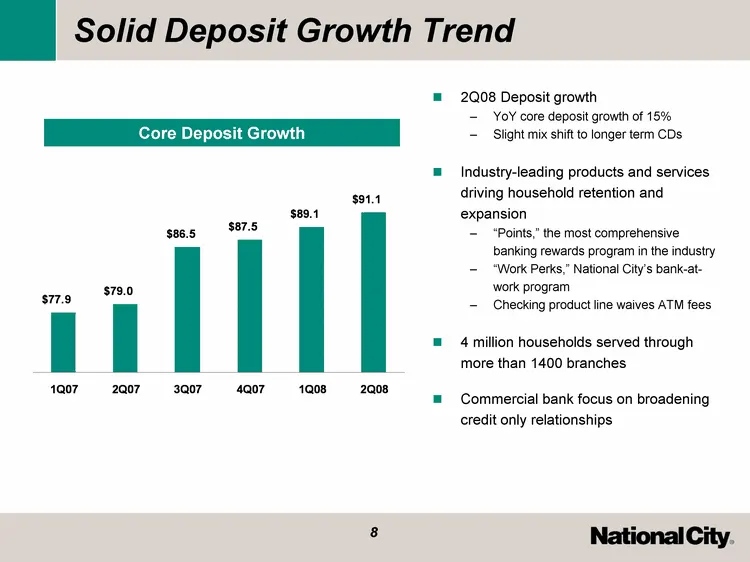
Solid Deposit Growth Trend 2Q08 Deposit growth YoY core deposit growth of 15% Slight mix shift to longer term CDs Industry-leading products and services driving household retention and expansion "Points," the most comprehensive banking rewards program in the industry "Work Perks," National City's ba
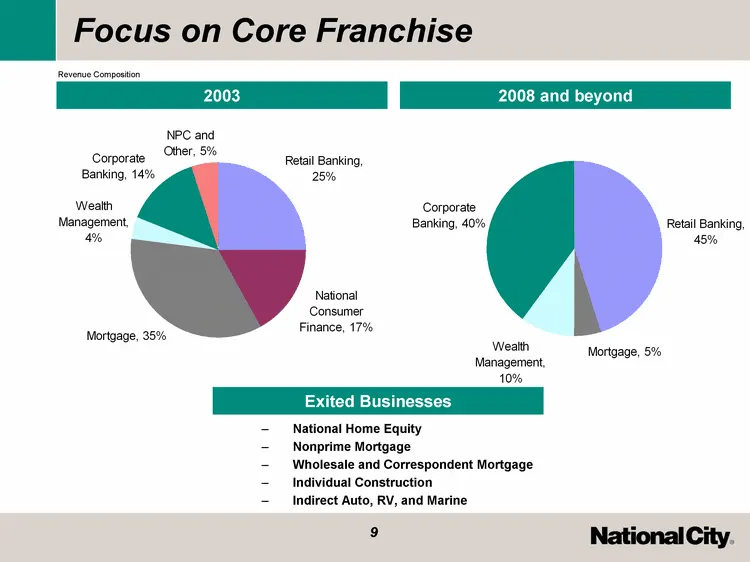
Slide 9: Focus on Core Franchise
Focus on Core Franchise Revenue Composition 2003 2008 and beyond National Home Equity Nonprime Mortgage Wholesale and Correspondent Mortgage Individual Construction Indirect Auto, RV, and Marine Exited Businesses
Slide 10: Credit Performance
Credit Performance
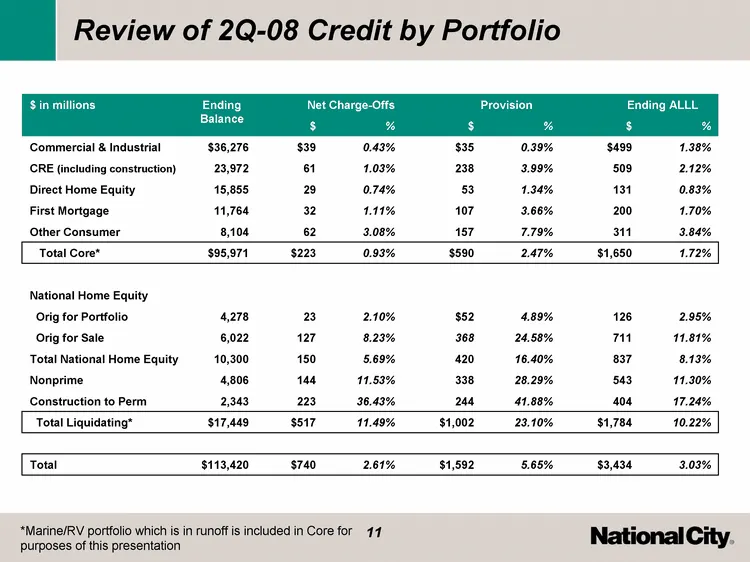
Slide 11: Review of 2Q-08 Credit by Portfolio
Review of 2Q-08 Credit by Portfolio $ in millions Ending Balance Net Charge-Offs Net Charge-Offs Provision Provision Ending ALLL Ending ALLL $ in millions Ending Balance $ % $ % $ % Commercial & Industrial $36,276 $39 0.43% $35 0.39% $499 1.38% CRE (including construction) 23,972 61 1.03% 238 3.99%
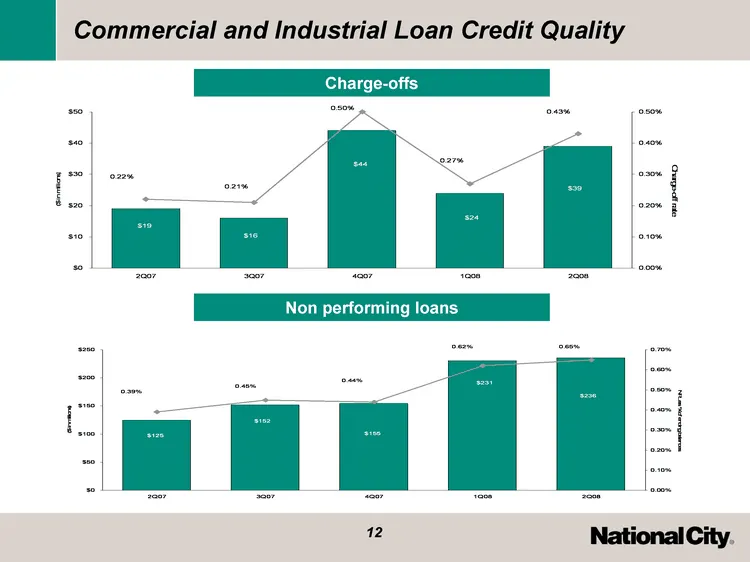
Slide 12: Commercial and Industrial Loan Credit Quality
Commercial and Industrial Loan Credit Quality 2Q07 3Q07 4Q07 1Q08 2Q08 Charge-off $ 19 16 44 24 39 Charge-off % 0.0022 0.0021 0.005 0.0027 0.0043 2Q07 3Q07 4Q07 1Q08 2Q08 NPL 125 152 155 231 236 NPL % 0.0039 0.0045 0.0044 0.0062 0.0065 Non performing loans Charge-offs
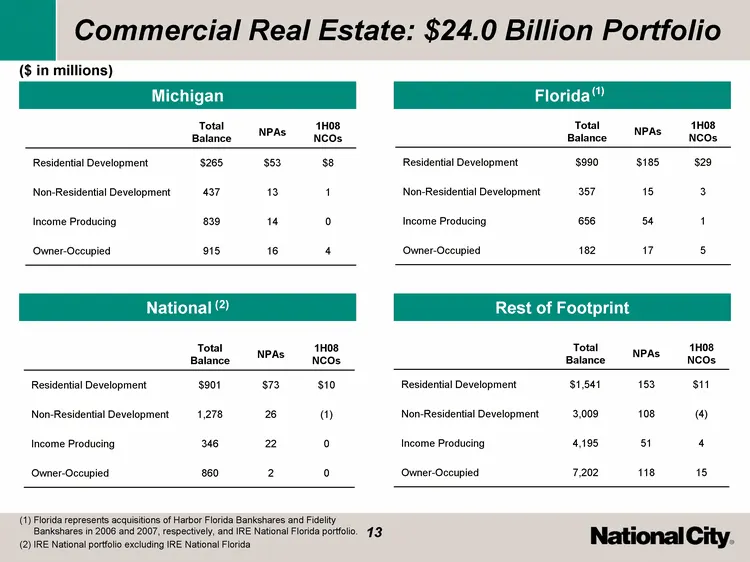
Slide 13: Commercial Real Estate: $24.0 Billion Portfolio
Commercial Real Estate: $24.0 Billion Portfolio Michigan Florida National (2) Rest of Footprint (1) Florida represents acquisitions of Harbor Florida Bankshares and Fidelity Bankshares in 2006 and 2007, respectively, and IRE National Florida portfolio. IRE National portfolio excluding IRE National F
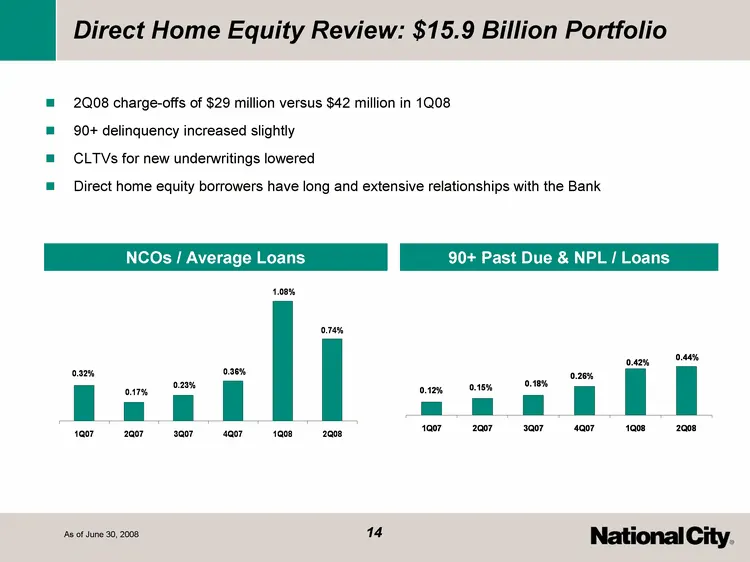
Slide 14: Direct Home Equity Review: $15.9 Billion Portfolio
4Q06 1Q07 2Q07 3Q07 4Q07 1Q08 2Q08 Branch and Direct 0.32 0.32 0.17 0.23 0.36 1.08 0.74 NHE for Portfolio 0.95 0.65 0.57 0.63 1 2.06 3.82 NHE for Sale 1.23 2.79 6.32 7.14 Other Consumer 0.73 0.5 0.48 0.67 1.68 0.384 0.119 -0.021 National Processing 0.02 0 0 Direct Home Equity Review: $15.9 Billion P
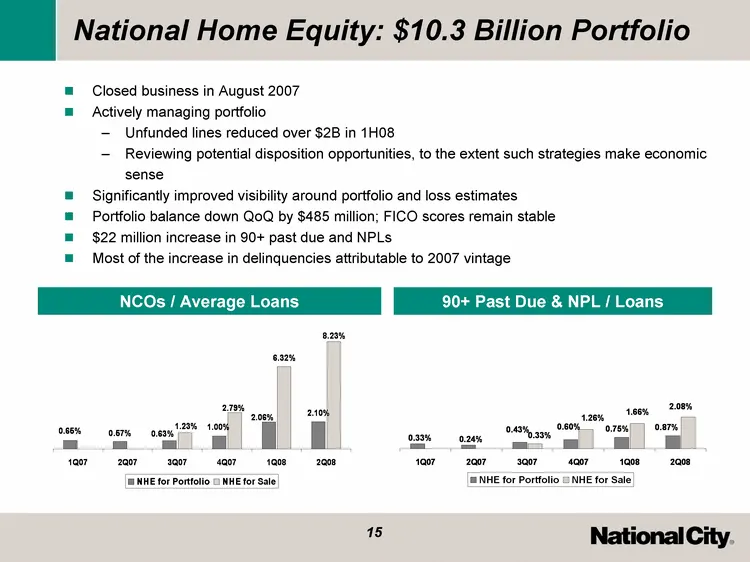
Slide 15: National Home Equity: $10.3 Billion Portfolio
National Home Equity: $10.3 Billion Portfolio Closed business in August 2007 Actively managing portfolio Unfunded lines reduced over $2B in 1H08 Reviewing potential disposition opportunities, to the extent such strategies make economic sense Significantly improved visibility around portfolio and los
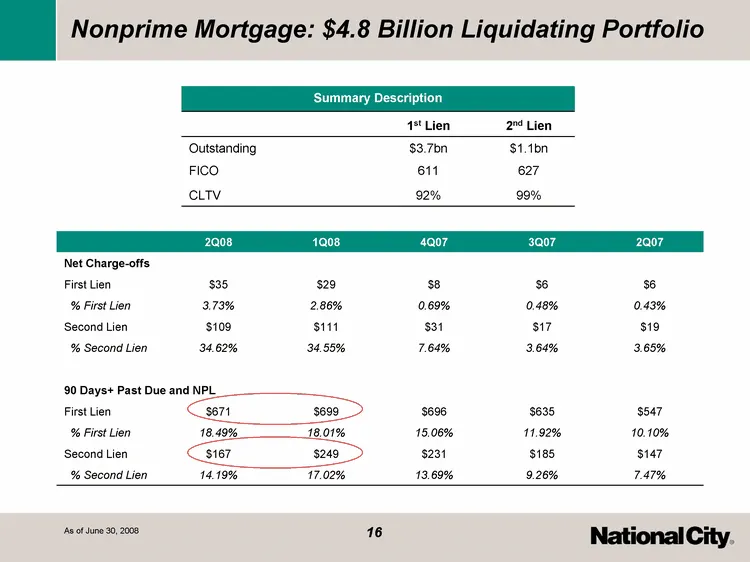
Slide 16: Nonprime Mortgage: $4.8 Billion Liquidating Portfolio
2Q08 1Q08 4Q07 3Q07 2Q07 Net Charge-offs First Lien $35 $29 $8 $6 $6 % First Lien 3.73% 2.86% 0.69% 0.48% 0.43% Second Lien $109 $111 $31 $17 $19 % Second Lien 34.62% 34.55% 7.64% 3.64% 3.65% 90 Days+ Past Due and NPL 90 Days+ Past Due and NPL First Lien $671 $699 $696 $635 $547 % First Lien 18.49%
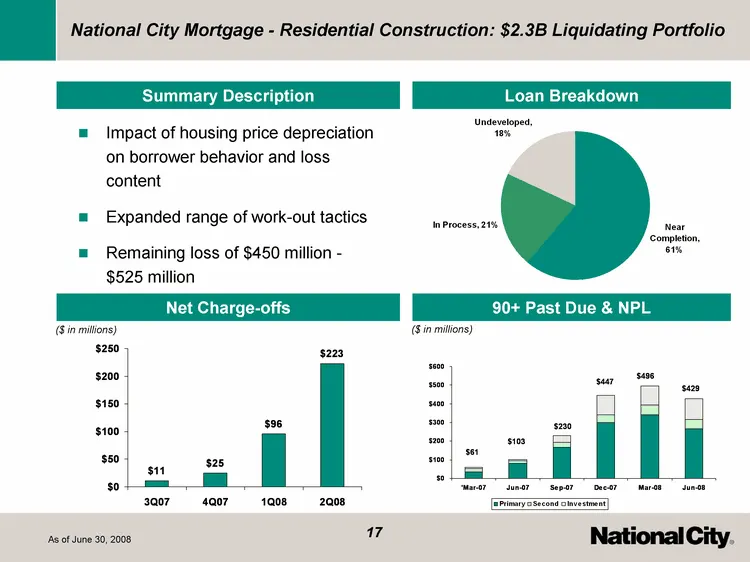
Slide 17: Residential Construction: $2.3B Liquidating Portfolio
National City Mortgage - Residential Construction: $2.3B Liquidating Portfolio Impact of housing price depreciation on borrower behavior and loss content Expanded range of work-out tactics Remaining loss of $450 million - $525 million 'Dec-06 'Mar-07 6/1/2007 9/1/2007 12/1/2007 3/1/2008 6/1/2008 Pri
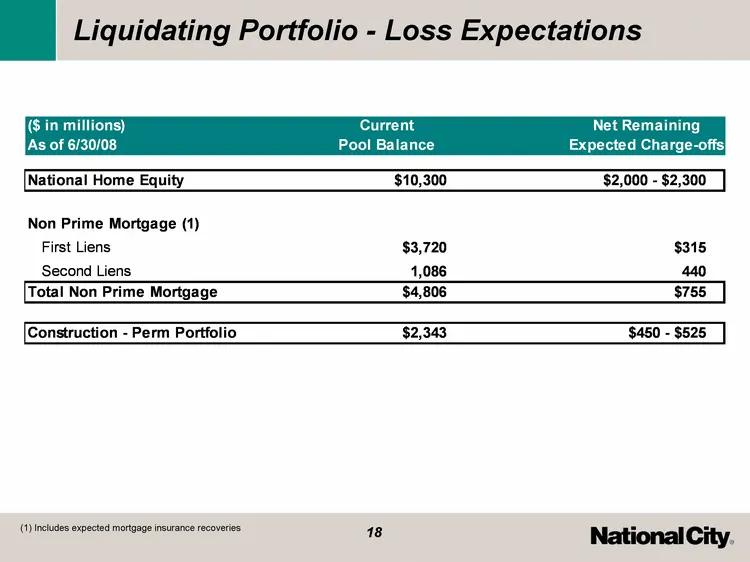
Slide 18: Liquidating Portfolio - Loss Expectations
Liquidating Portfolio - Loss Expectations (1) Includes expected mortgage insurance recoveries
Slide 19: Investor Takeaways
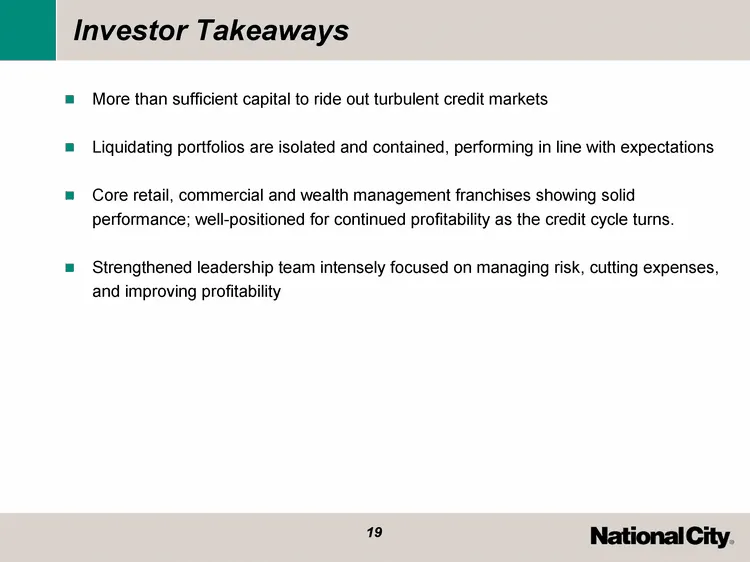
Investor Takeaways More than sufficient capital to ride out turbulent credit markets Liquidating portfolios are isolated and contained, performing in line with expectations Core retail, commercial and wealth management franchises showing solid performance; well-positioned for continued profitability
Slide 20: Appendix
Appendix
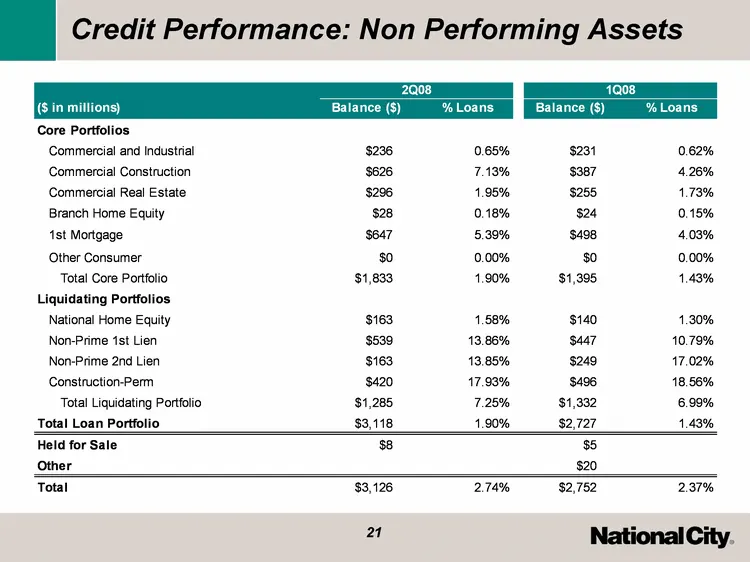
Slide 21: Credit Performance: Non Performing Assets
Credit Performance: Non Performing Assets
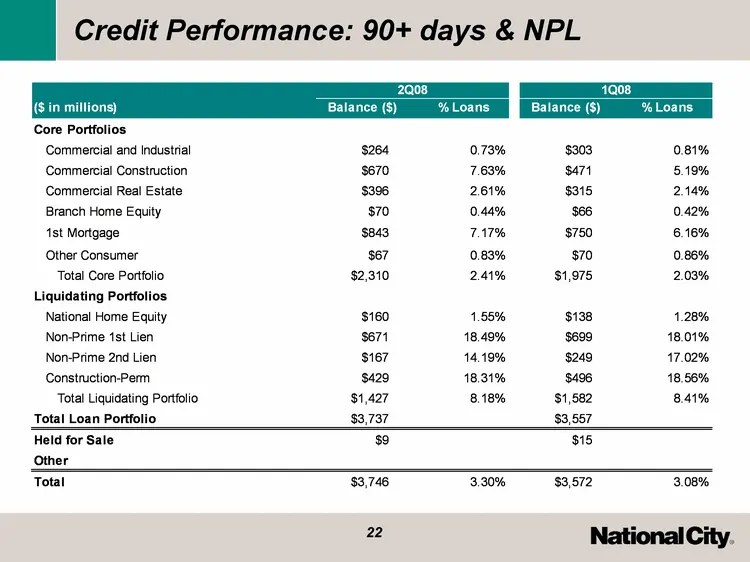
Slide 22: Credit Performance: 90+ days & NPL
Credit Performance: 90+ days & NPL
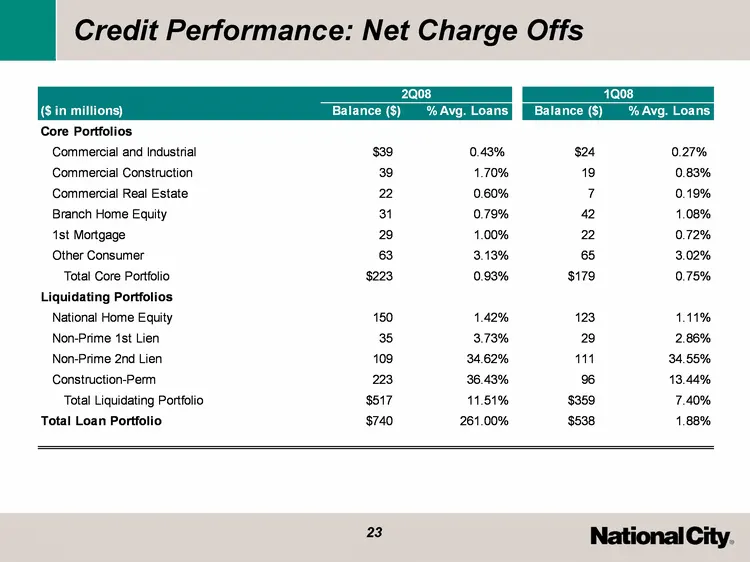
Slide 23: Credit Performance: Net Charge Offs
Credit Performance: Net Charge Offs
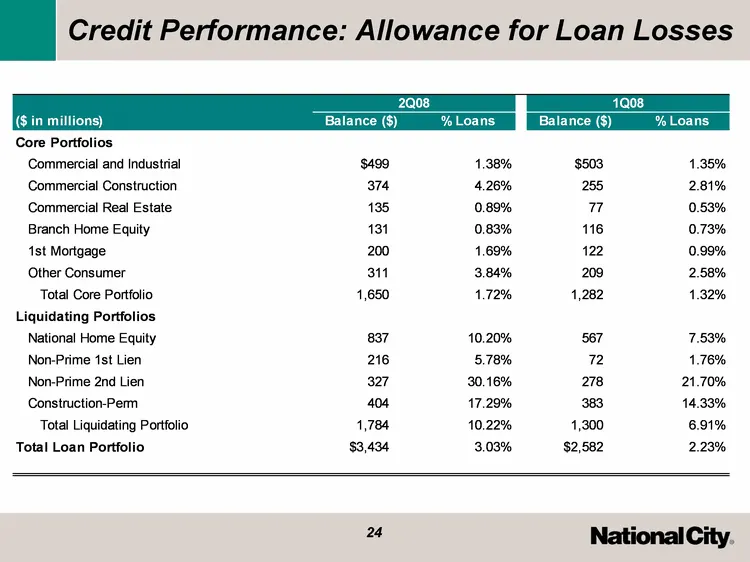
Slide 24: Credit Performance: Allowance for Loan Losses
Credit Performance: Allowance for Loan Losses
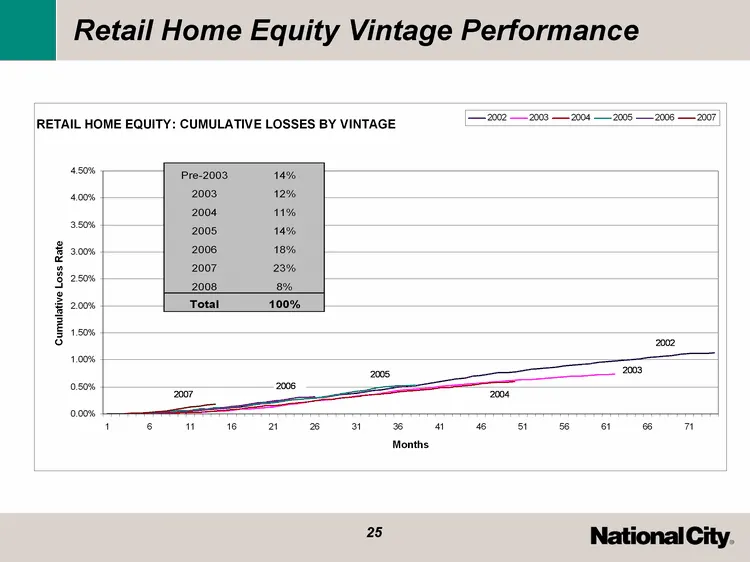
Slide 25: Retail Home Equity Vintage Performance
Retail Home Equity Vintage Performance
Slide 26: Residential Mortgage Portfolio
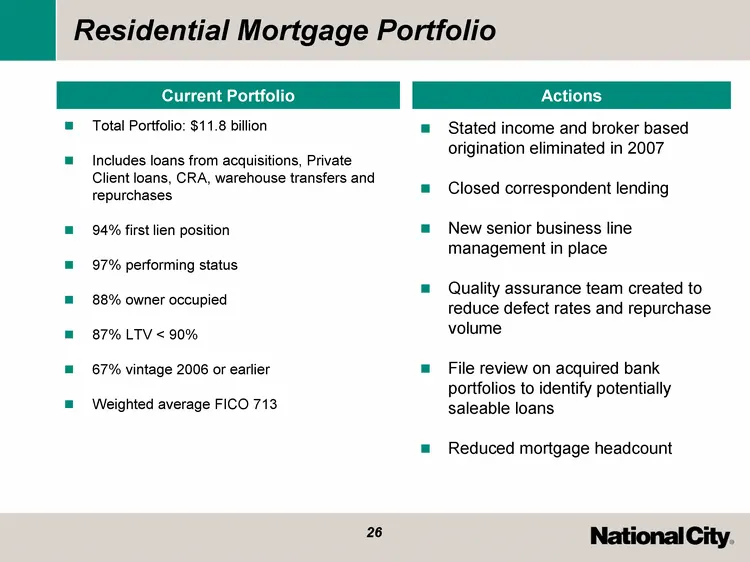
Residential Mortgage Portfolio Total Portfolio: $11.8 billion Includes loans from acquisitions, Private Client loans, CRA, warehouse transfers and repurchases 94% first lien position 97% performing status 88% owner occupied 87% LTV < 90% 67% vintage 2006 or earlier Weighted average FICO 713 Stated i
Slide 27: Credit Card
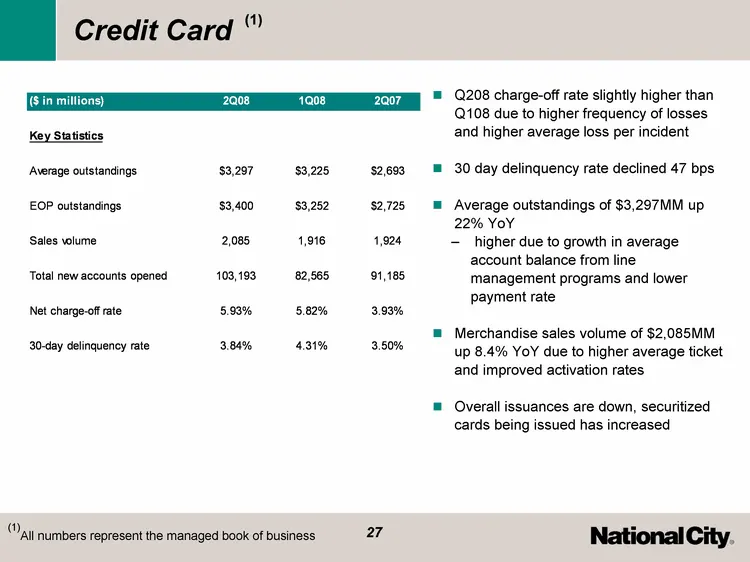
Credit Card Q208 charge-off rate slightly higher than Q108 due to higher frequency of losses and higher average loss per incident 30 day delinquency rate declined 47 bps Average outstandings of $3,297MM up 22% YoY higher due to growth in average account balance from line management programs and lowe
Slide 28: Commercial and Industrial Portfolio: $36.3 billion
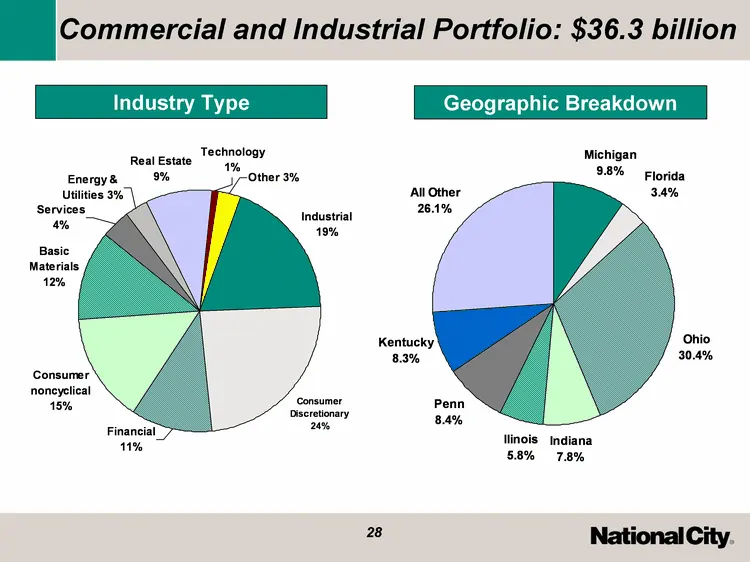
Commercial and Industrial Portfolio: $36.3 billion Industry Type Michigan Florida Ohio Indiana Ilinois Penn Kentucky All Other 0.098 0.034 0.304 0.078 0.058 0.084 0.083 0.261 Geographic Breakdown Industrial Consumer Discretionary Financial Consumer noncyclical Basic Materials Services Energy & Utili
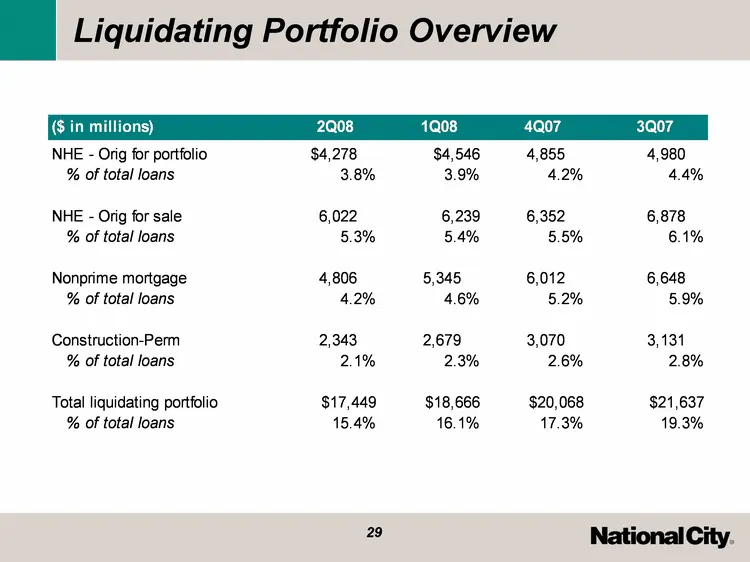
Slide 29: Liquidating Portfolio Overview
Liquidating Portfolio Overview
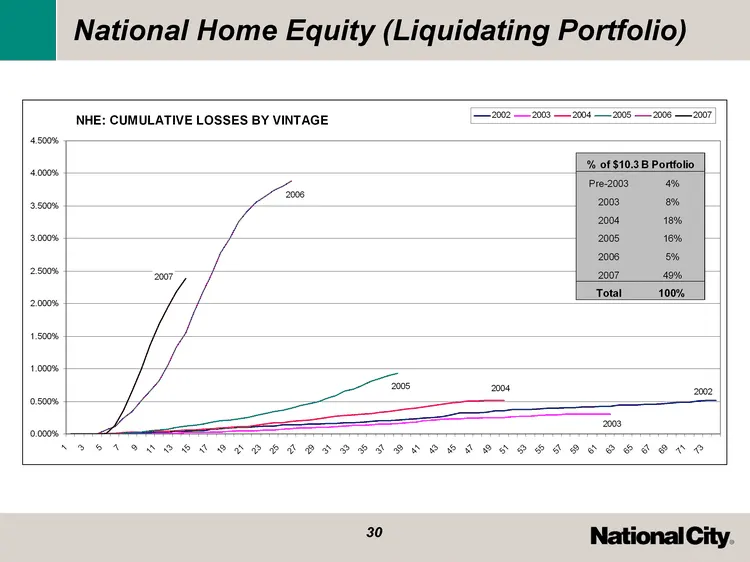
Slide 30: National Home Equity (Liquidating Portfolio)
National Home Equity (Liquidating Portfolio) (1)
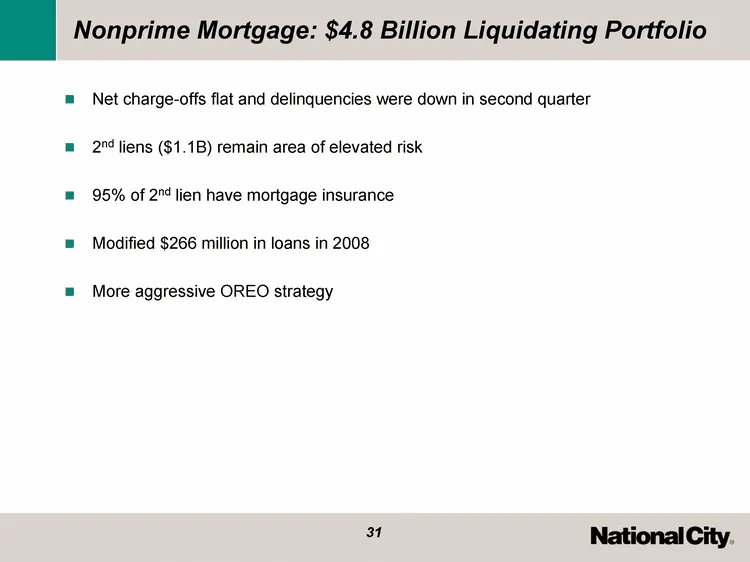
Slide 31: Nonprime Mortgage: $4.8 Billion Liquidating Portfolio
Nonprime Mortgage: $4.8 Billion Liquidating Portfolio Net charge-offs flat and delinquencies were down in second quarter 2nd liens ($1.1B) remain area of elevated risk 95% of 2nd lien have mortgage insurance Modified $266 million in loans in 2008 More aggressive OREO strategy

Slide 32
Source: SEC EDGAR · 8-K filed Jul 24, 2008
More decks from National City Corporation
 Q3 2008 Earnings Presentation38 slides · Oct 21, 2008
 Q1 2008 Earnings Presentation16 slides · Apr 21, 2008
 Q1 2008 Earnings Presentation30 slides · Apr 21, 2008
 Q4 2007 Earnings Presentation23 slides · Jan 22, 2008
 MAF Bancorp — Merger or Acquisition (May 2007)17 slides · May 1, 2007
 Fidelity Bankshares — Merger or Acquisition (July 2006)21 slides · Jul 27, 2006