National City Corporation
National City — Q1 2008 Earnings Presentation
30 slides from National City's earnings presentation, Apr 21, 2008
Slide 1: Investor Presentation April 2008
Investor Presentation April 2008
Slide 2: Forward-Looking Statements
This presentation contains forward-looking statements. Forward looking statements, written or oral, provide current expectations or forecasts of future events and are not guarantees of future performance, nor should they be relied upon as representing management's views as of any subsequent date. Th
Slide 3: Today's Discussion
Today's Discussion Overview of 1Q08 Results Credit Performance and Trends Overview of Initiatives for 2008 Appendix: Franchise Overview
Slide 4: I. Financial Review
I. Financial Review
Slide 5: 1Q08 Summary Income Statement
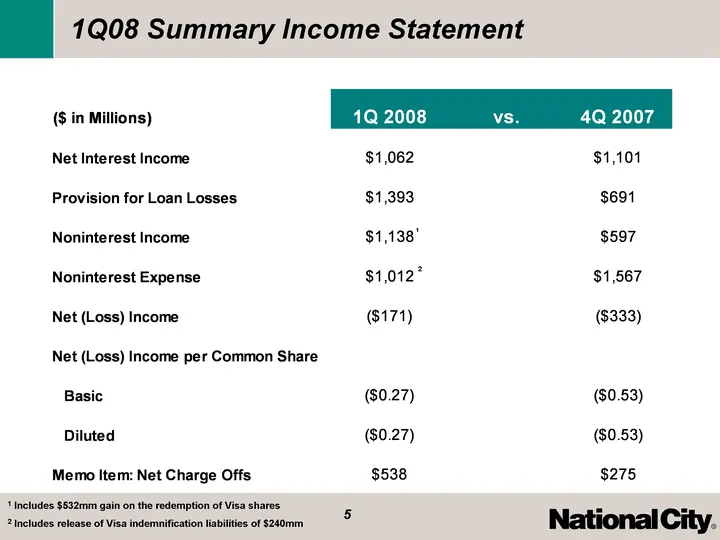
1Q08 Summary Income Statement 1 Includes $532mm gain on the redemption of Visa shares 2 Includes release of Visa indemnification liabilities of $240mm 1 2
Slide 6: Revenue by Line of Business
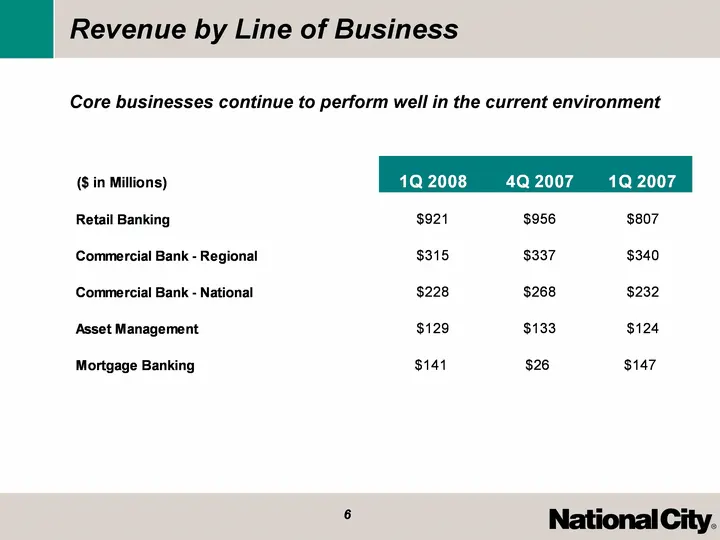
Revenue by Line of Business Core businesses continue to perform well in the current environment
Slide 7: Strengthening Capital and Liquidity
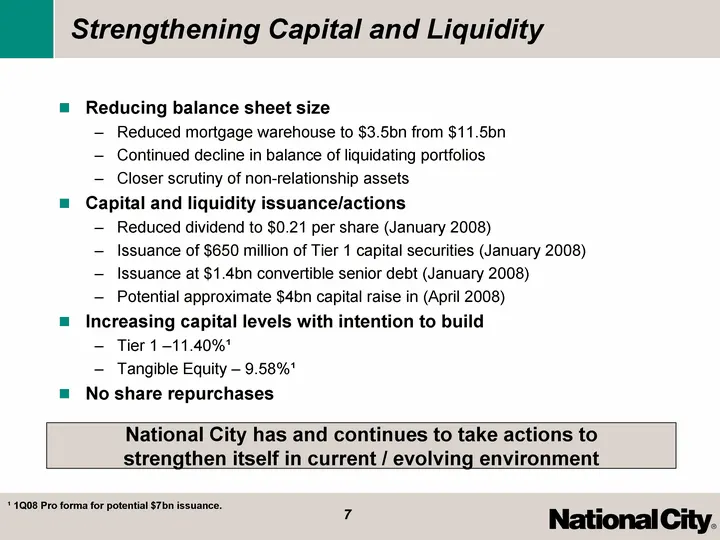
Strengthening Capital and Liquidity Reducing balance sheet size Reduced mortgage warehouse to $3.5bn from $11.5bn Continued decline in balance of liquidating portfolios Closer scrutiny of non-relationship assets Capital and liquidity issuance/actions Reduced dividend to $0.21 per share (January 2008
Slide 8: Capital Ratios
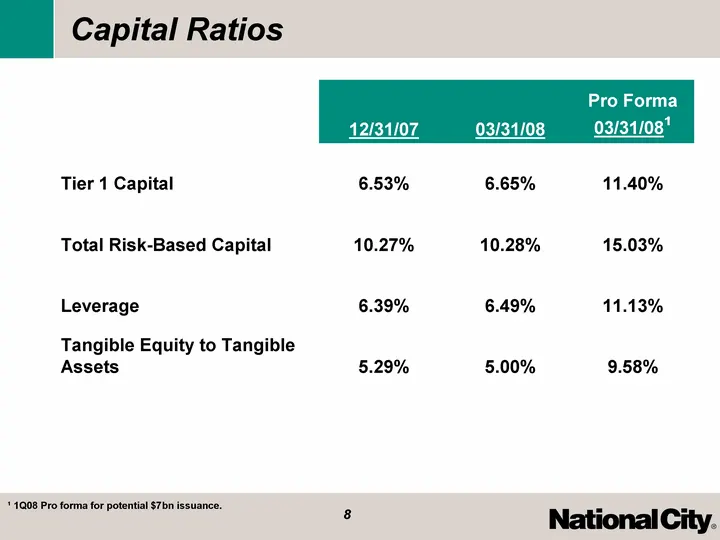
Capital Ratios 12/31/07 03/31/08 Pro Forma 03/31/081 Tier 1 Capital 6.53% 6.65% 11.40% Total Risk-Based Capital 10.27% 10.28% 15.03% Leverage 6.39% 6.49% 11.13% Tangible Equity to Tangible Assets 5.29% 5.00% 9.58% 1 1Q08 Pro forma for potential $7bn issuance.
Slide 9: II. Credit Performance and Trends
II. Credit Performance and Trends
Slide 10: Overview - Credit Performance and Trends
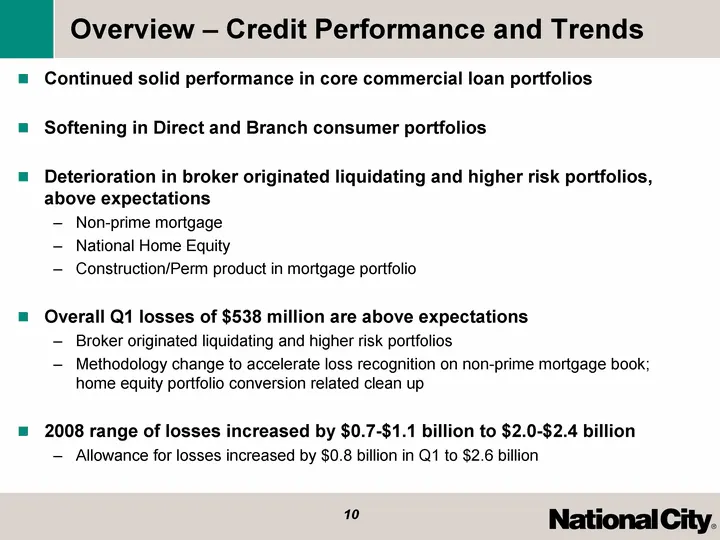
Overview - Credit Performance and Trends Continued solid performance in core commercial loan portfolios Softening in Direct and Branch consumer portfolios Deterioration in broker originated liquidating and higher risk portfolios, above expectations Non-prime mortgage National Home Equity Constructio
Slide 11: Review of 1Q08 Credit by Portfolio
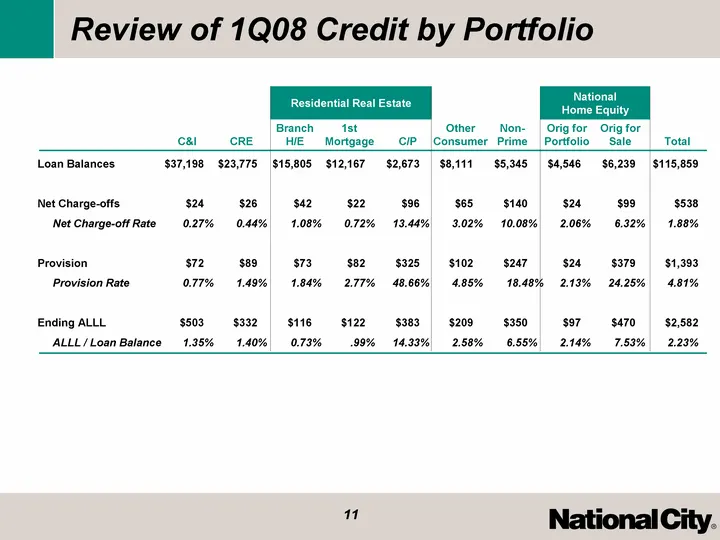
Review of 1Q08 Credit by Portfolio Loan Balances $37,198 $23,775 $15,805 $12,167 $2,673 $8,111 $5,345 $4,546 $6,239 $115,859 Net Charge-offs $24 $26 $42 $22 $96 $65 $140 $24 $99 $538 Net Charge-off Rate 0.27 % 0.44 % 1.08 % 0.72 % 13.44 % 3.02 % 10.08 % 2.06 % 6.32 % 1.88% Provision $72 $89 $73 $82
Slide 12: Consolidated Loan Portfolio ($116B) Metrics
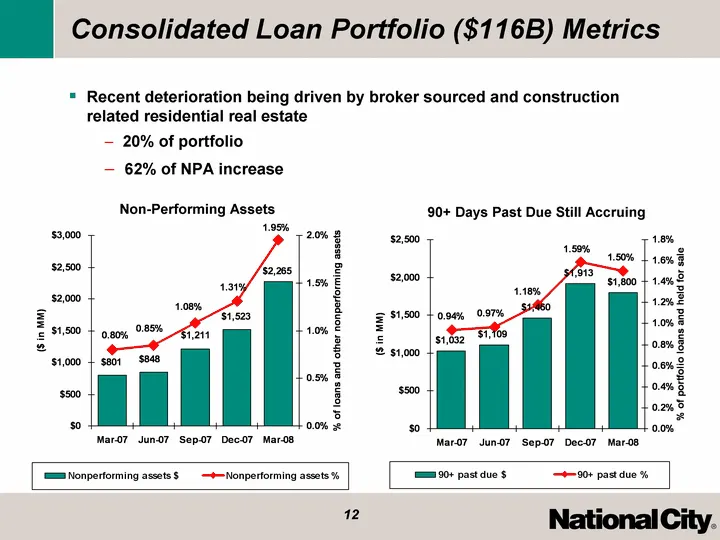
Consolidated Loan Portfolio ($116B) Metrics 3/1/2007 6/1/2007 9/1/2007 12/1/2007 3/1/2008 Nonperforming assets % 0.008 0.0085 0.0108 0.0131 0.0195 Nonperforming assets $ 801 848 1211 1523 2265 3/1/2007 6/1/2007 9/1/2007 12/1/2007 3/1/2008 90+ past due % 0.0094 0.0097 0.0118 0.0159 0.015 90+ past due
Slide 13: Commercial Real Estate
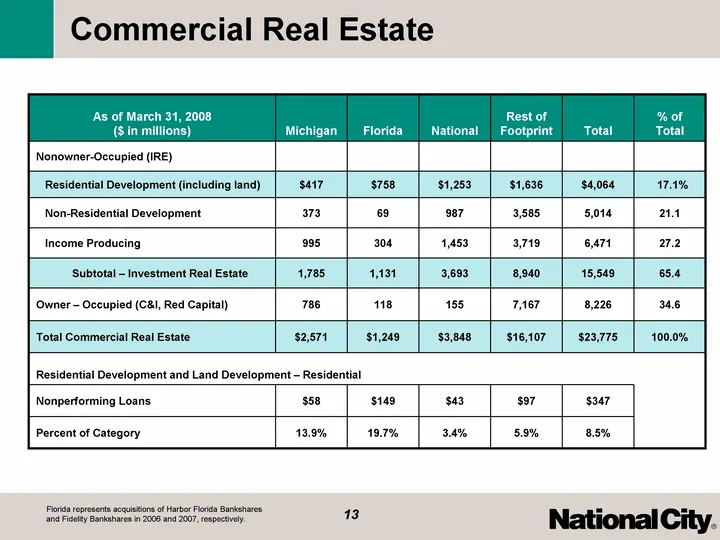
Commercial Real Estate As of March 31, 2008 ($ in millions) Michigan Florida National Rest of Footprint Total % of Total Nonowner-Occupied (IRE) Residential Development (including land) $417 $758 $1,253 $1,636 $4,064 17.1% Non-Residential Development 373 69 987 3,585 5,014 21.1 Income Producing 995
Slide 14: Home Equity Overview
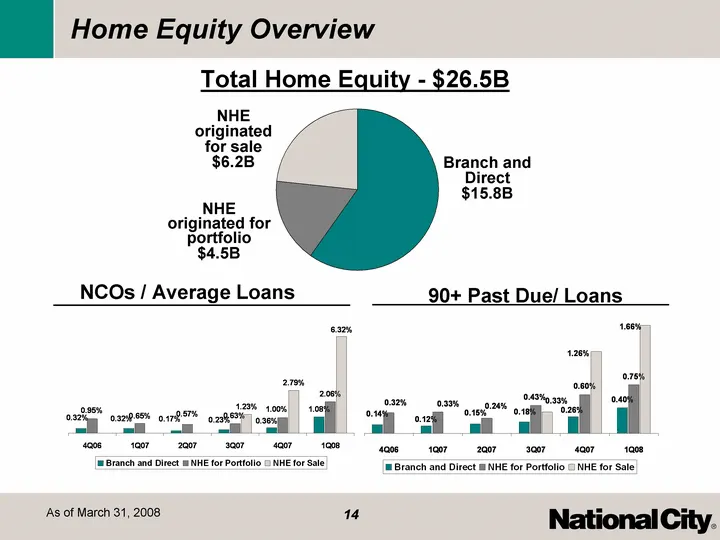
4Q06 1Q07 2Q07 3Q07 4Q07 1Q08 Branch and Direct 0.32 0.32 0.17 0.23 0.36 1.08 NHE for Portfolio 0.95 0.65 0.57 0.63 1 2.06 NHE for Sale 1.23 2.79 6.32 Other Consumer 0.73 0.5 0.48 0.67 1.68 0.384 0.119 -0.021 National Processing 0.02 0 0 Home Equity Overview 4Q06 1Q07 2Q07 3Q07 4Q07 1Q08 Branch and
Slide 15: National City Mortgage - Residential Construction
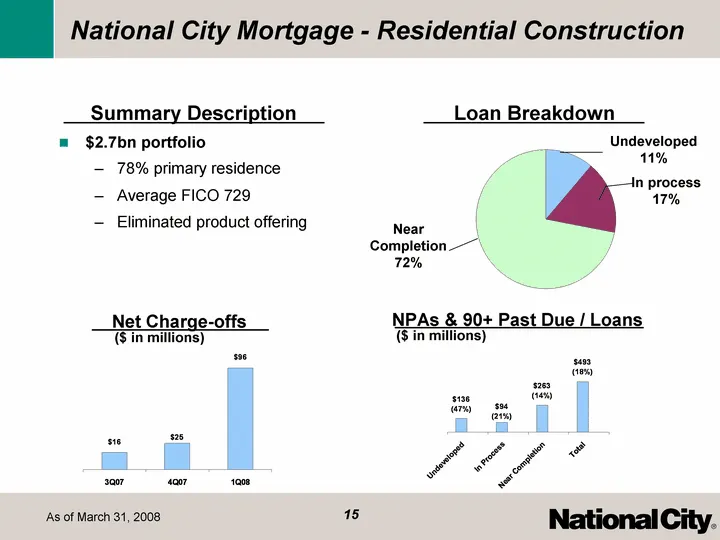
Undeveloped 331 2.19 3.47 4.29 In Process 510 1.35 1.67 1.61 Near Completion 2171 0.033 0.07 First Mortgage 27 0.234 0 Non-Prime 11 0.119 -0.021 NHE 20 0 0 Comm'l 2 Other 16 National City Mortgage - Residential Construction $2.7bn portfolio 78% primary residence Average FICO 729 Eliminated product o
Slide 16: Non-Prime Liquidating Portfolio
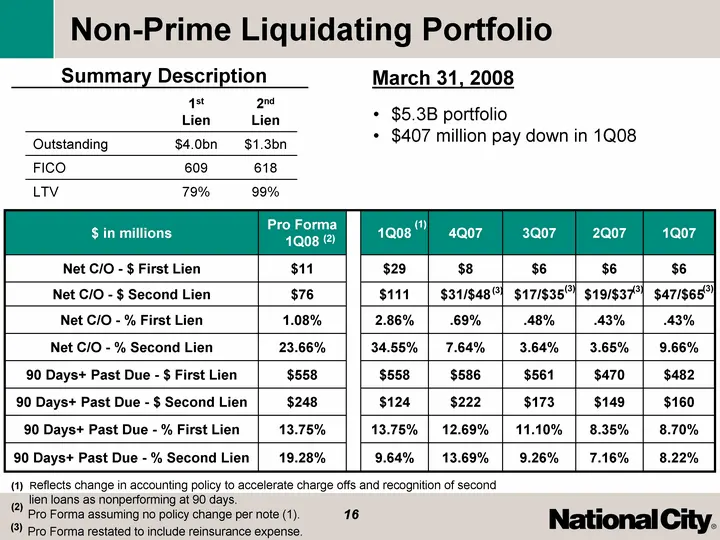
Non-Prime Liquidating Portfolio $ in millions Pro Forma 1Q08 1Q08 4Q07 3Q07 2Q07 1Q07 Net C/O - $ First Lien $11 $29 $8 $6 $6 $6 Net C/O - $ Second Lien $76 $111 $31/$48 $17/$35 $19/$37 $47/$65 Net C/O - % First Lien 1.08% 2.86% .69% .48% .43% .43% Net C/O - % Second Lien 23.66% 34.55% 7.64% 3.64% 3
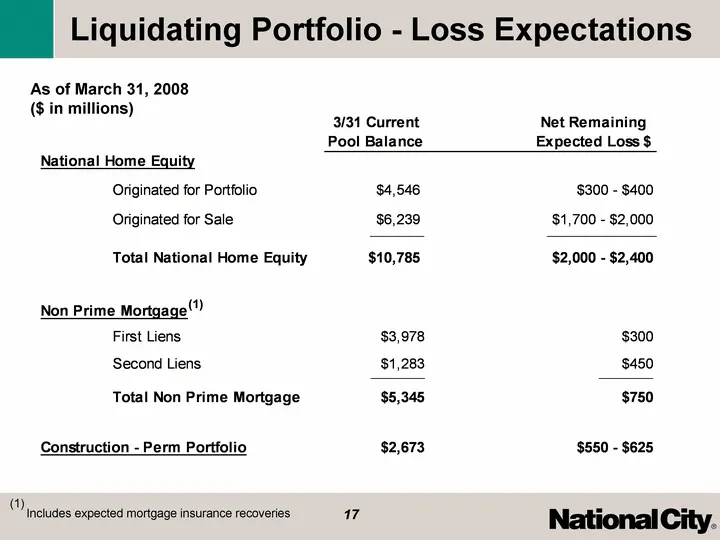
Slide 17: Liquidating Portfolio - Loss Expectations
Liquidating Portfolio - Loss Expectations As of March 31, 2008 ($ in millions) (1) Includes expected mortgage insurance recoveries (1)
Slide 18: III. Overview of Initiatives for 2008
III. Overview of Initiatives for 2008
Slide 19: Overview of Initiatives for 2008
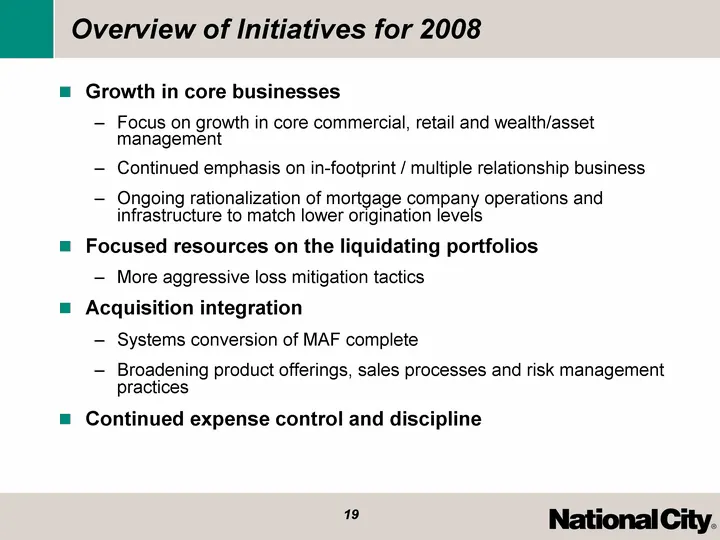
Overview of Initiatives for 2008 Growth in core businesses Focus on growth in core commercial, retail and wealth/asset management Continued emphasis on in-footprint / multiple relationship business Ongoing rationalization of mortgage company operations and infrastructure to match lower origination l
Slide 20: Appendix: Franchise Overview
Appendix: Franchise Overview
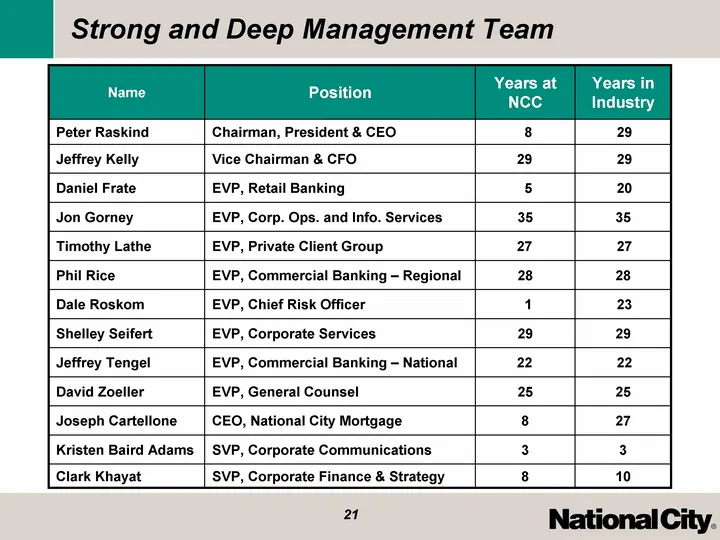
Slide 21: Strong and Deep Management Team
Strong and Deep Management Team Name Position Years at NCC Years in Industry Peter Raskind Chairman, President & CEO 8 29 Jeffrey Kelly Vice Chairman & CFO 29 29 Daniel Frate EVP, Retail Banking 5 20 Jon Gorney EVP, Corp. Ops. and Info. Services 35 35 Timothy Lathe EVP, Private Client Group 27 27 Ph
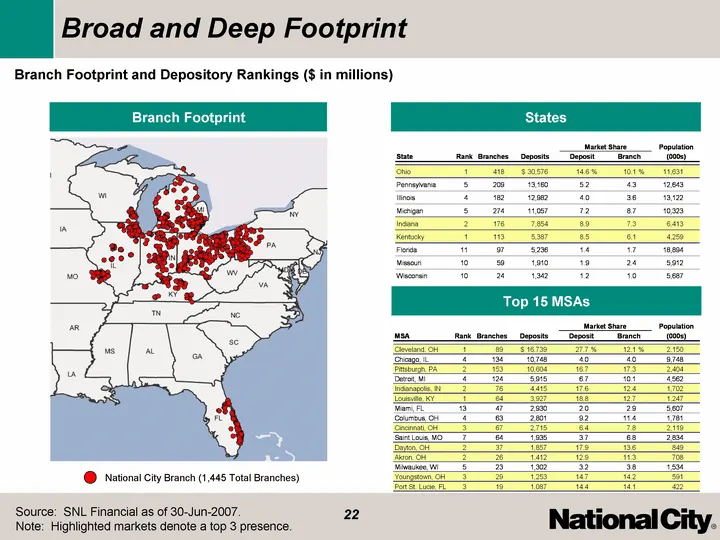
Slide 22: Broad and Deep Footprint
Top 15 MSAs States Broad and Deep Footprint Branch Footprint and Depository Rankings ($ in millions) Source: SNL Financial as of 30-Jun-2007. Note: Highlighted markets denote a top 3 presence. EXCEL SOURCE range $L$40:$M$40 copied at 03-Mar-2008 17:44:35 : NCCCS\February 2008_Strategy\Overview Mater
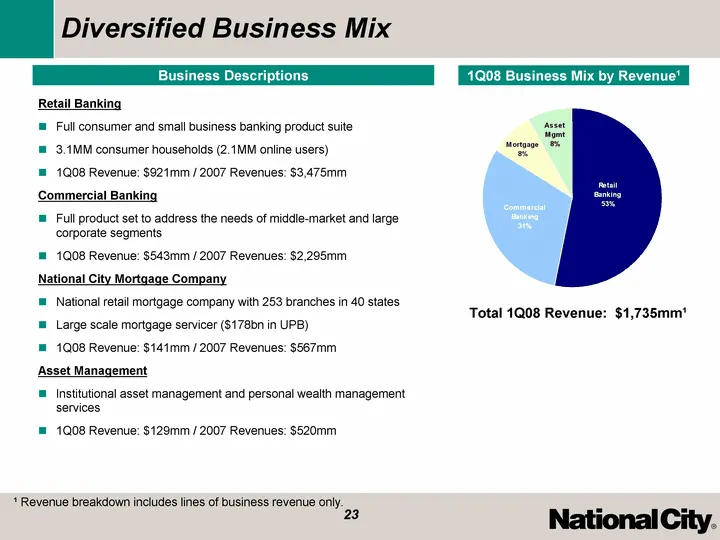
Slide 23: Diversified Business Mix
Diversified Business Mix 1 Revenue breakdown includes lines of business revenue only. Retail Banking Full consumer and small business banking product suite 3.1MM consumer households (2.1MM online users) 1Q08 Revenue: $921mm / 2007 Revenues: $3,475mm Commercial Banking Full product set to address the
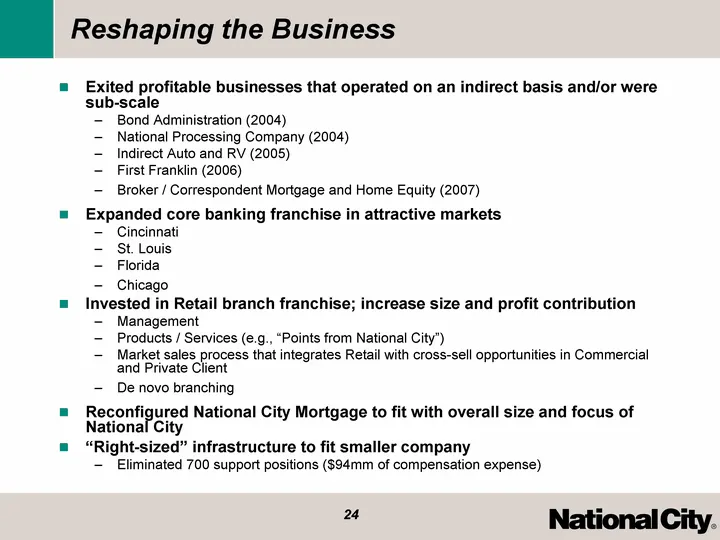
Slide 24: Reshaping the Business
Reshaping the Business Exited profitable businesses that operated on an indirect basis and/or were sub-scale Bond Administration (2004) National Processing Company (2004) Indirect Auto and RV (2005) First Franklin (2006) Broker / Correspondent Mortgage and Home Equity (2007) Expanded core banking fr
Slide 25: Retail Bank Overview
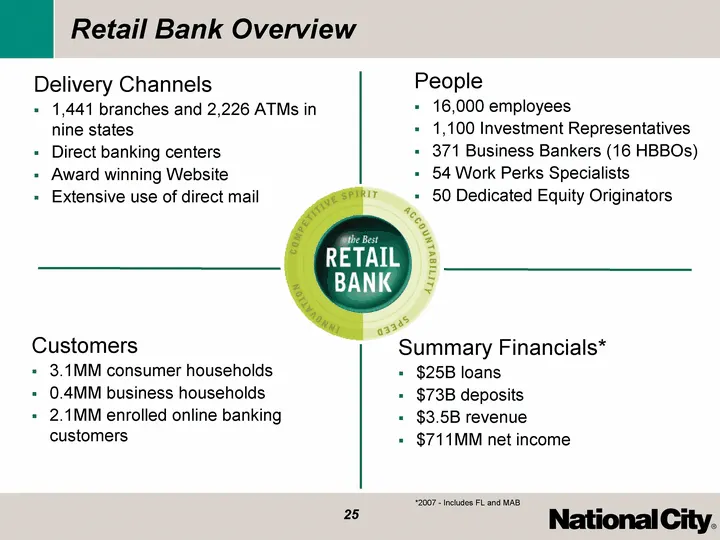
Customers 3.1MM consumer households 0.4MM business households 2.1MM enrolled online banking customers Summary Financials* $25B loans $73B deposits $3.5B revenue $711MM net income Retail Bank Overview People 16,000 employees 1,100 Investment Representatives 371 Business Bankers (16 HBBOs) 54 Work Per
Slide 26: Commercial Bank Overview
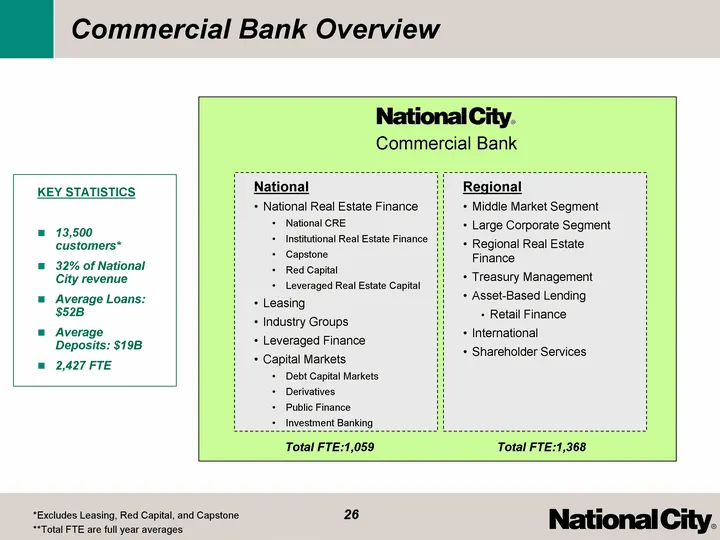
Regional Middle Market Segment Large Corporate Segment Regional Real Estate Finance Treasury Management Asset-Based Lending Retail Finance International Shareholder Services National National Real Estate Finance National CRE Institutional Real Estate Finance Capstone Red Capital Leveraged Real Estat
Slide 27: Private Client Group Overview
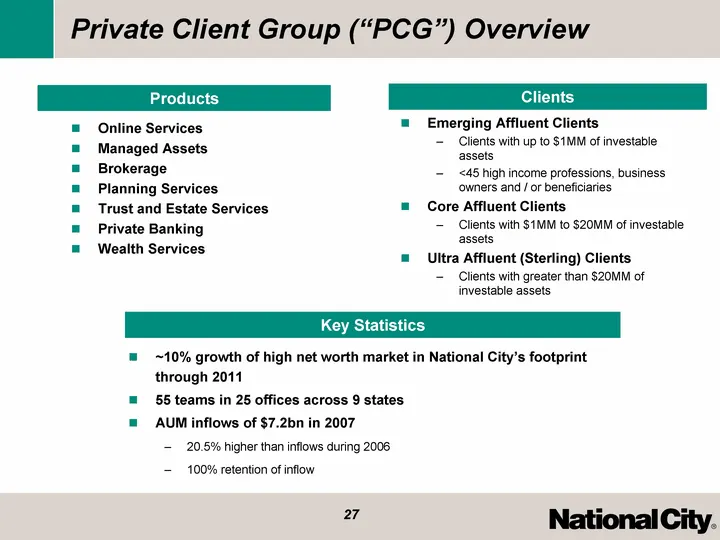
Private Client Group ("PCG") Overview Online Services Managed Assets Brokerage Planning Services Trust and Estate Services Private Banking Wealth Services Emerging Affluent Clients Clients with up to $1MM of investable assets <45 high income professions, business owners and / or beneficiaries Core A
Slide 28: Allegiant Asset Management Overview
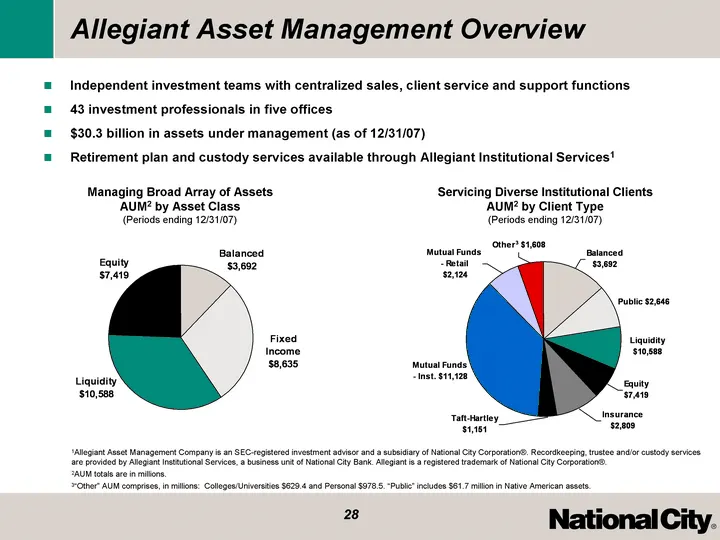
Allegiant Asset Management Overview Independent investment teams with centralized sales, client service and support functions 43 investment professionals in five offices $30.3 billion in assets under management (as of 12/31/07) Retirement plan and custody services available through Allegiant Institu
Slide 29: National City Mortgage Overview
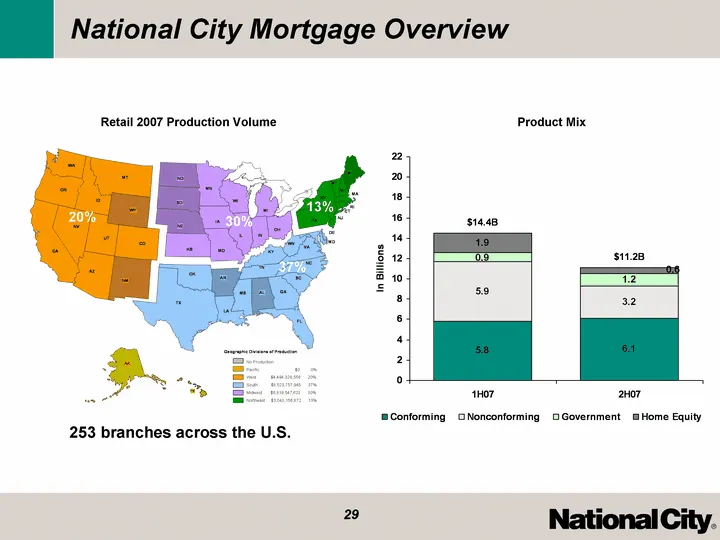
National City Mortgage Overview Product Mix Retail 2007 Production Volume 20% 30% 37% 13% 253 branches across the U.S. Conforming Nonconforming Government Home Equity Total 1H07 5.8 5.9 0.9 1.9 14.4 2H07 6.1 3.2 1.2 0.6 11.2
Slide 30: Reaction to the Mortgage Meltdown
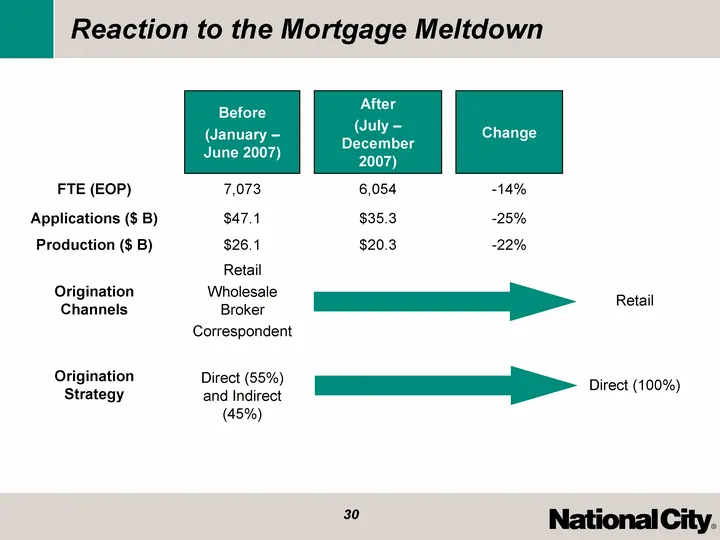
Reaction to the Mortgage Meltdown Before (January - June 2007) After (July - December 2007) After (July - December 2007) Change FTE (EOP) 7,073 6,054 6,054 -14% Applications ($ B) $47.1 $35.3 $35.3 -25% Production ($ B) $26.1 $20.3 $20.3 -22% Origination Channels Retail Wholesale Broker Corresponden
Source: SEC EDGAR · 8-K filed Apr 21, 2008
More decks from National City Corporation
 Q3 2008 Earnings Presentation38 slides · Oct 21, 2008
 Q2 2008 Earnings Presentation32 slides · Jul 24, 2008
 Q1 2008 Earnings Presentation16 slides · Apr 21, 2008
 Q4 2007 Earnings Presentation23 slides · Jan 22, 2008
 MAF Bancorp — Merger or Acquisition (May 2007)17 slides · May 1, 2007
 Fidelity Bankshares — Merger or Acquisition (July 2006)21 slides · Jul 27, 2006