National City Corporation
National City — Q4 2007 Earnings Presentation
23 slides from National City's earnings presentation, Jan 22, 2008
Slide 1: Supplemental Data for Earnings Conference Call January 22, 2008
Supplemental Data for Earnings Conference Call January 22, 2008

Slide 2: Forward-Looking Statements
This presentation contains forward-looking statements. Forward looking statements, written or oral, provide current expectations or forecasts of future events and are not guarantees of future performance, nor should they be relied upon as representing management's views as of any subsequent date. Th
Slide 3: Today's Discussion
Today's Discussion 4Q07 Results Credit Performance and Trends Capital Perspectives on 2008
Slide 4: Review of 4th Quarter Significant Charges
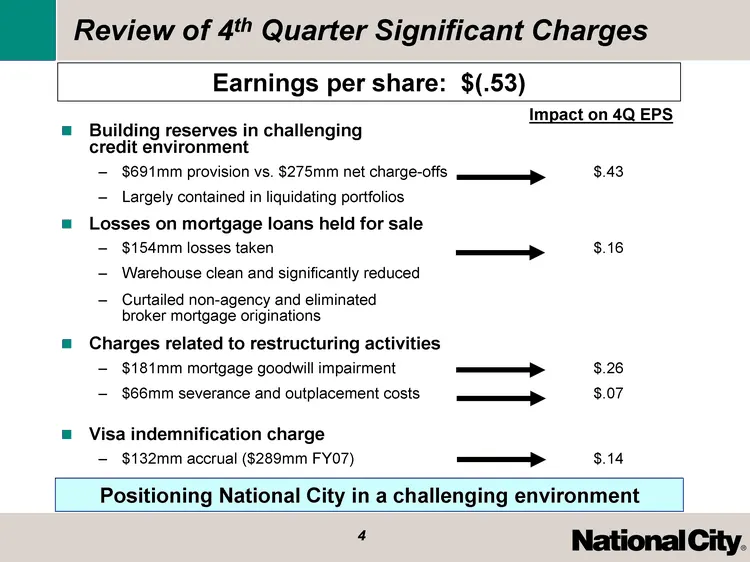
Review of 4th Quarter Significant Charges Building reserves in challenging credit environment $691mm provision vs. $275mm net charge-offs $.43 Largely contained in liquidating portfolios Losses on mortgage loans held for sale $154mm losses taken $.16 Warehouse clean and significantly reduced Curtail
Slide 5: Held for Sale Residential Real Estate and Home Equity Loan
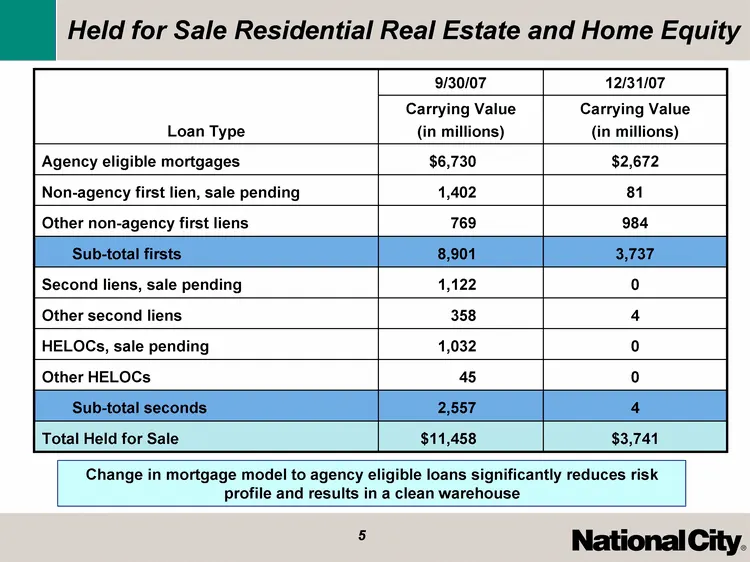
Held for Sale Residential Real Estate and Home Equity Loan Type 9/30/07 12/31/07 Loan Type Carrying Value (in millions) Carrying Value (in millions) Agency eligible mortgages $6,730 $2,672 Non-agency first lien, sale pending 1,402 81 Other non-agency first liens 769 984 Sub-total firsts 8,901 3,737
Slide 6: Review of Recent Developments
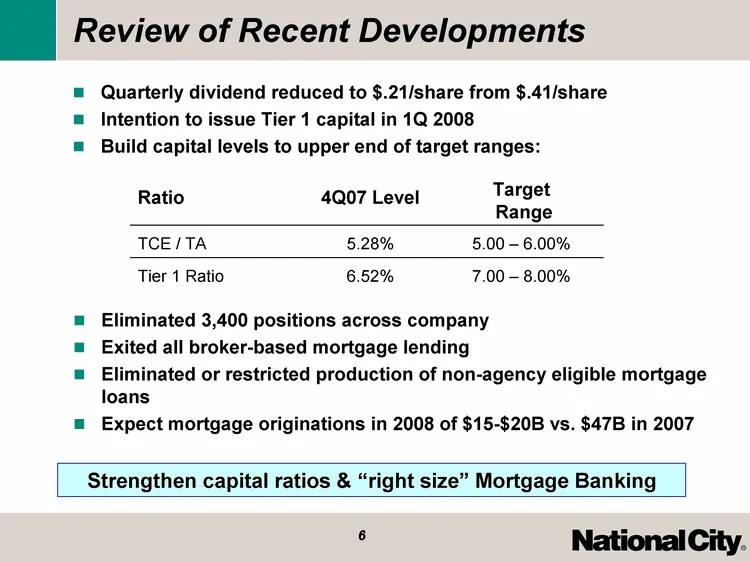
Review of Recent Developments Ratio 4Q07 Level Target Range TCE / TA 5.28% 5.00 - 6.00% Tier 1 Ratio 6.52% 7.00 - 8.00% Strengthen capital ratios & "right size" Mortgage Banking Quarterly dividend reduced to $.21/share from $.41/share Intention to issue Tier 1 capital in 1Q 2008 Build capital levels
Slide 7: Credit Performance and Trends
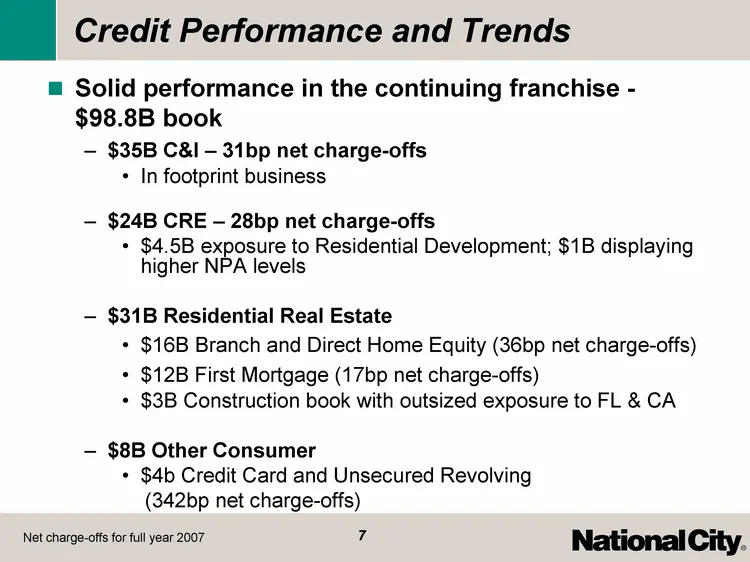
Credit Performance and Trends Solid performance in the continuing franchise - $98.8B book $35B C&I - 31bp net charge-offs In footprint business $24B CRE - 28bp net charge-offs $4.5B exposure to Residential Development; $1B displaying higher NPA levels $31B Residential Real Estate $16B Branch and Dir
Slide 8: Credit Performance and Trends - cont'd
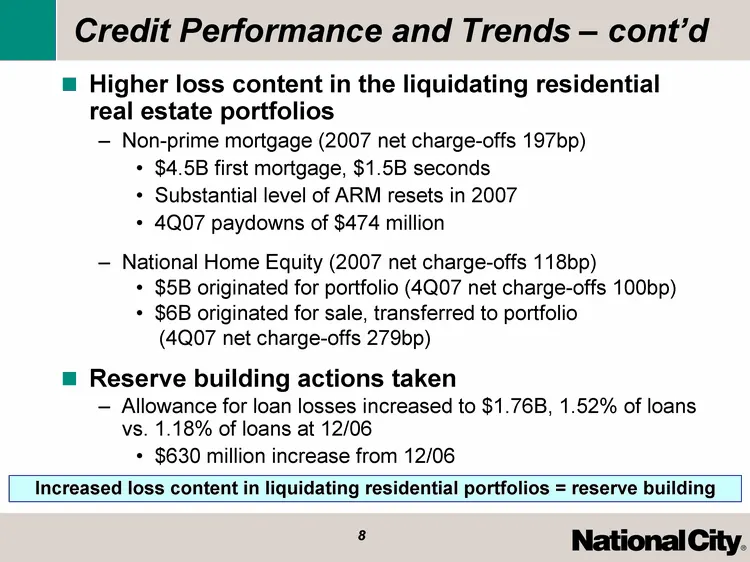
Credit Performance and Trends - cont'd Higher loss content in the liquidating residential real estate portfolios Non-prime mortgage (2007 net charge-offs 197bp) $4.5B first mortgage, $1.5B seconds Substantial level of ARM resets in 2007 4Q07 paydowns of $474 million National Home Equity (2007 net ch
Slide 9: 2007 Credit Performance
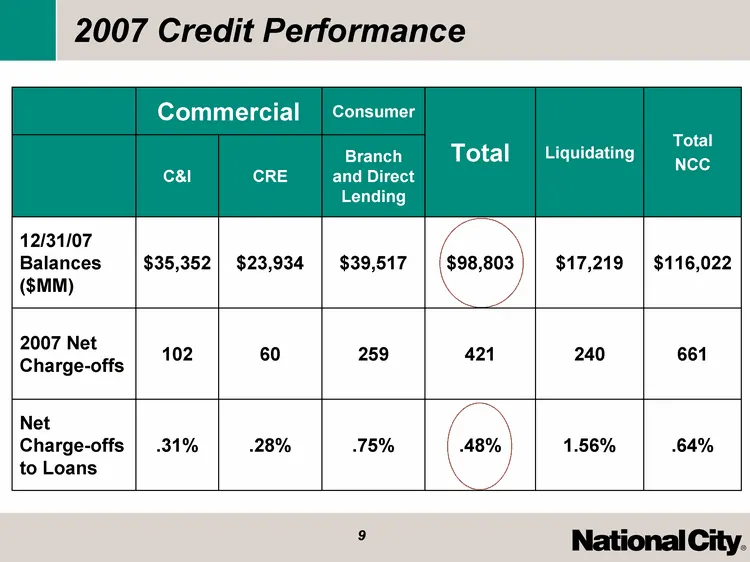
2007 Credit Performance Commercial Commercial Consumer Total Liquidating Total NCC C&I CRE Branch and Direct Lending Total Liquidating Total NCC 12/31/07 Balances ($MM) $35,352 $23,934 $39,517 $98,803 $17,219 $116,022 2007 Net Charge-offs 102 60 259 421 240 661 Net Charge-offs to Loans .31% .28% .75
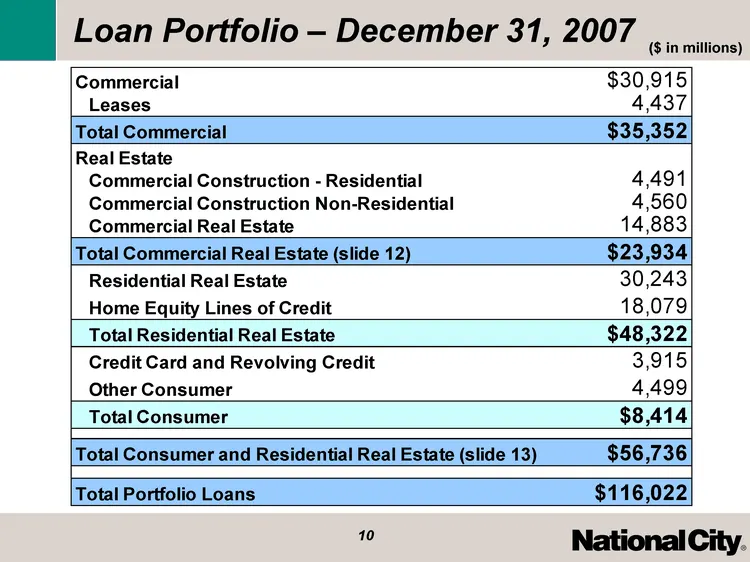
Slide 10: Loan Portfolio - December 31, 2007
Loan Portfolio - December 31, 2007 ($ in millions)
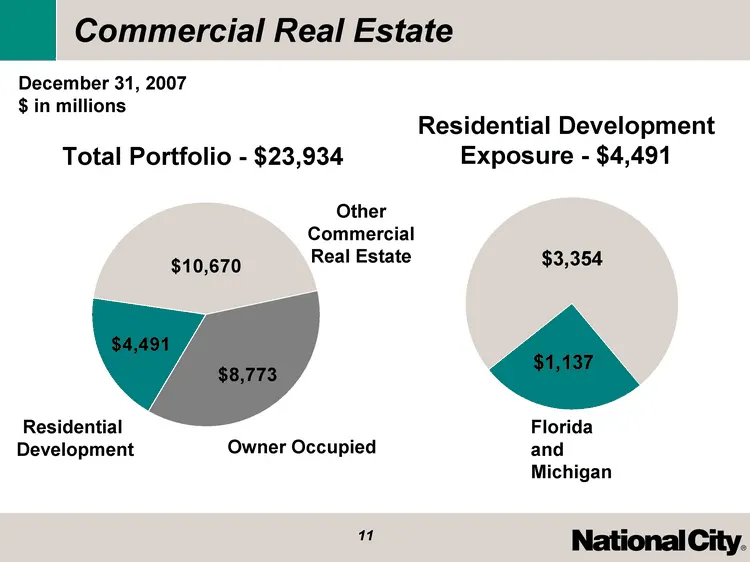
Slide 11: Commercial Real Estate Residential Development
Commercial Real Estate Residential Development Residential Dev 4491 Other CRE 10670 Owner Occupied 8773 Other Commercial Real Estate FL+MI 1137 Rest 3354 Florida and Michigan Residential Development Exposure - $4,491 Total Portfolio - $23,934 Owner Occupied December 31, 2007 $ in millions
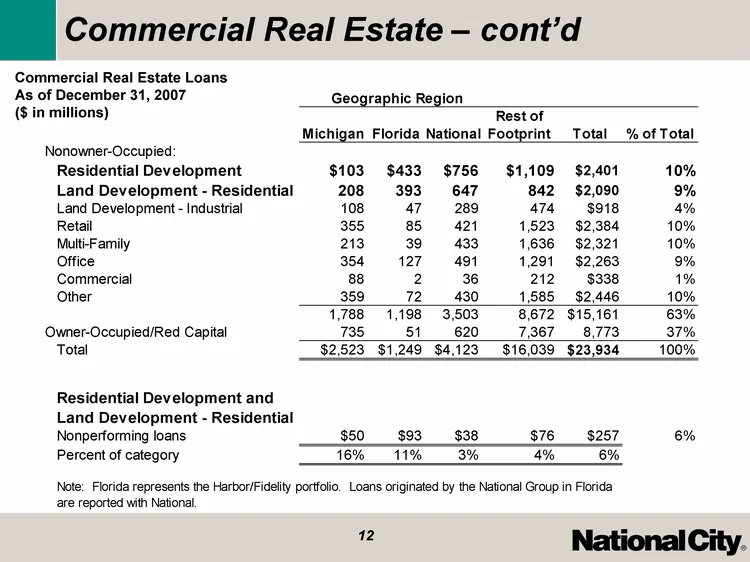
Slide 12: Commercial Real Estate - cont'd
Commercial Real Estate - cont'd Commercial Real Estate Loans As of December 31, 2007 ($ in millions)
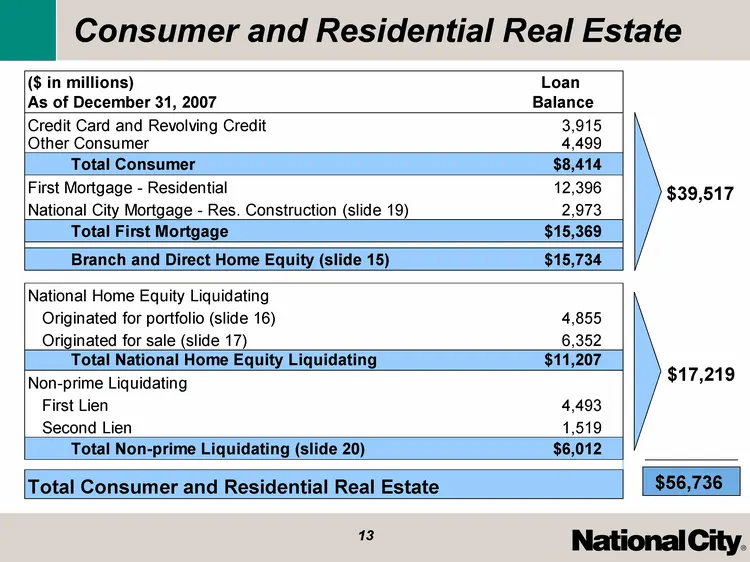
Slide 13: Consumer and Residential Real Estate
Consumer and Residential Real Estate $39,517 $17,219 $56,736
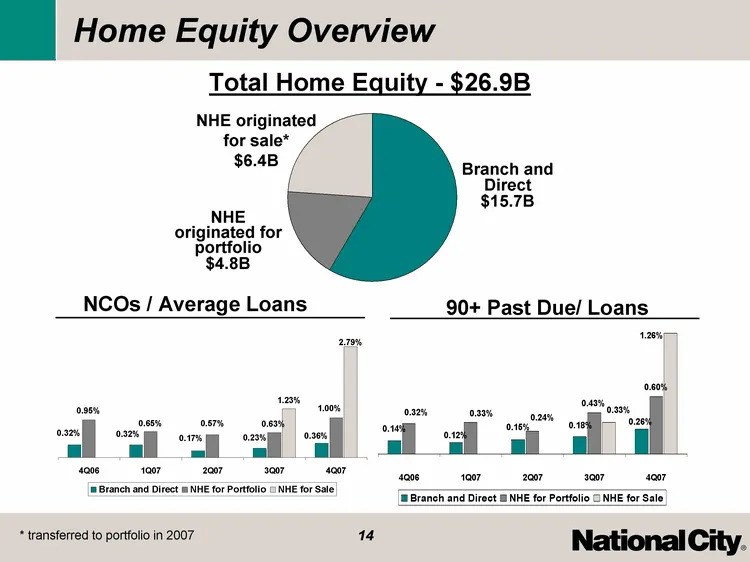
Slide 14: Home Equity Overview
4Q06 1Q07 2Q07 3Q07 4Q07 Branch and Direct 0.32 0.32 0.17 0.23 0.36 NHE for Portfolio 0.95 0.65 0.57 0.63 1 NHE for Sale 1.23 2.79 Other Consumer 0.73 0.5 0.48 0.67 1.68 0.384 0.119 -0.021 National Processing 0.02 0 0 Home Equity Overview 4Q06 1Q07 2Q07 3Q07 4Q07 Branch and Direct 0.14 0.12 0.15 0.1
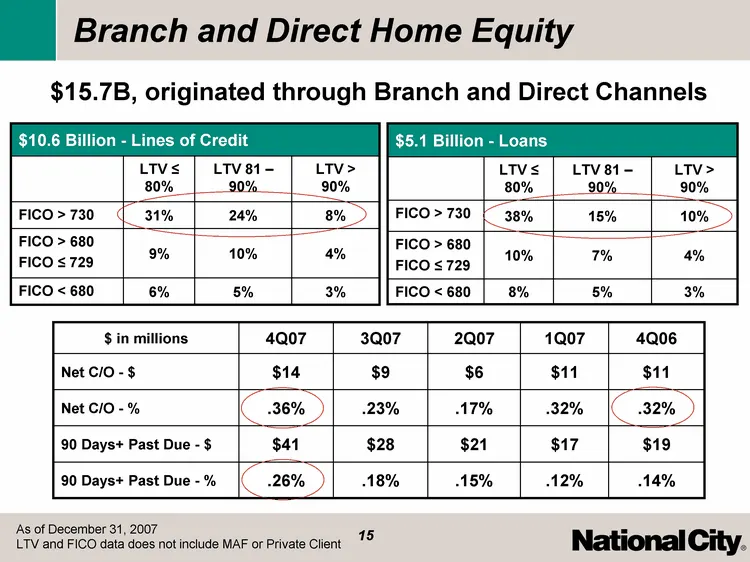
Slide 15: Branch and Direct Home Equity
Branch and Direct Home Equity $10.6 Billion - Lines of Credit $10.6 Billion - Lines of Credit $10.6 Billion - Lines of Credit $10.6 Billion - Lines of Credit LTV ^ 80% LTV 81 - 90% LTV > 90% FICO > 730 31% 24% 8% FICO > 680 FICO ^ 729 9% 10% 4% FICO < 680 6% 5% 3% $5.1 Billion - Loans $5.1 Billion -
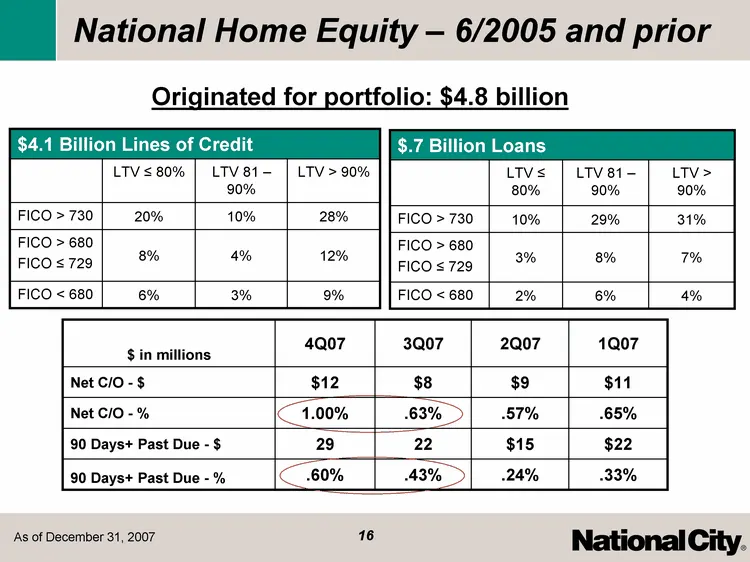
Slide 16: National Home Equity - 6/2005 and prior
National Home Equity - 6/2005 and prior $4.1 Billion Lines of Credit $4.1 Billion Lines of Credit $4.1 Billion Lines of Credit $4.1 Billion Lines of Credit LTV ^ 80% LTV 81 - 90% LTV > 90% FICO > 730 20% 10% 28% FICO > 680 FICO ^ 729 8% 4% 12% FICO < 680 6% 3% 9% $.7 Billion Loans $.7 Billion Loans
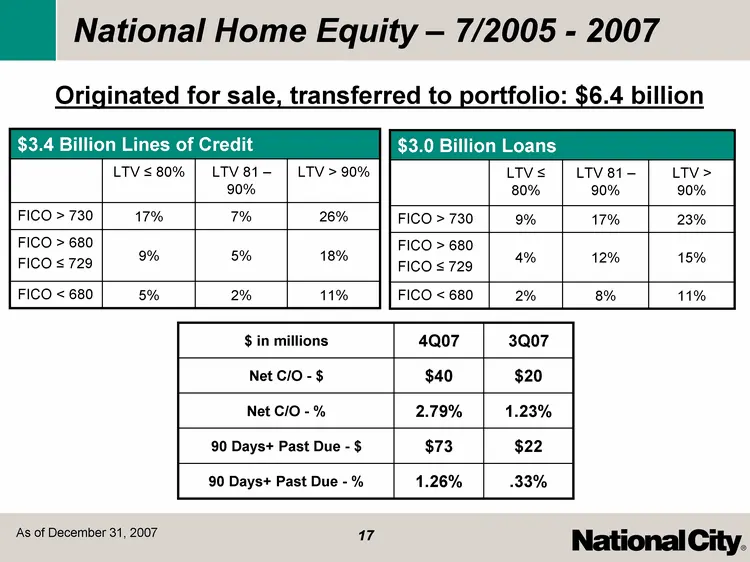
Slide 17: National Home Equity - 7/2005 - 2007
National Home Equity - 7/2005 - 2007 $3.4 Billion Lines of Credit $3.4 Billion Lines of Credit $3.4 Billion Lines of Credit $3.4 Billion Lines of Credit LTV ^ 80% LTV 81 - 90% LTV > 90% FICO > 730 17% 7% 26% FICO > 680 FICO ^ 729 9% 5% 18% FICO < 680 5% 2% 11% $3.0 Billion Loans $3.0 Billion Loans $
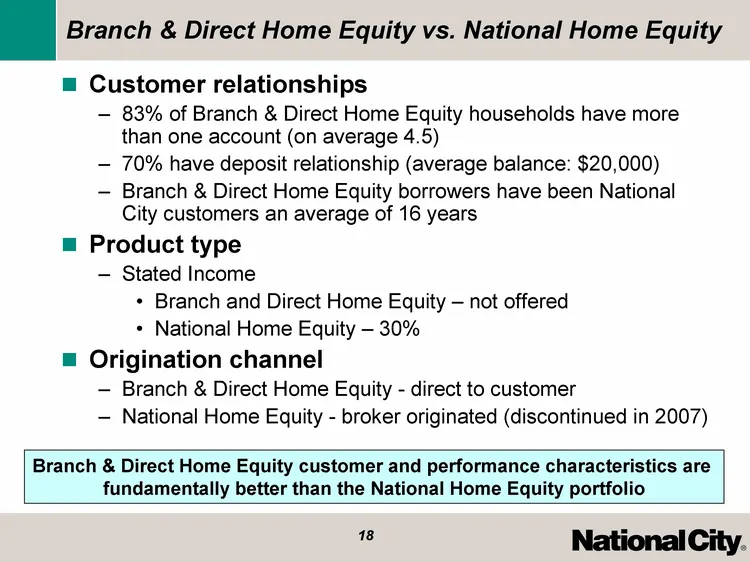
Slide 18: Branch & Direct Home Equity vs. National Home Equity
Branch & Direct Home Equity vs. National Home Equity Customer relationships 83% of Branch & Direct Home Equity households have more than one account (on average 4.5) 70% have deposit relationship (average balance: $20,000) Branch & Direct Home Equity borrowers have been National City customers an av
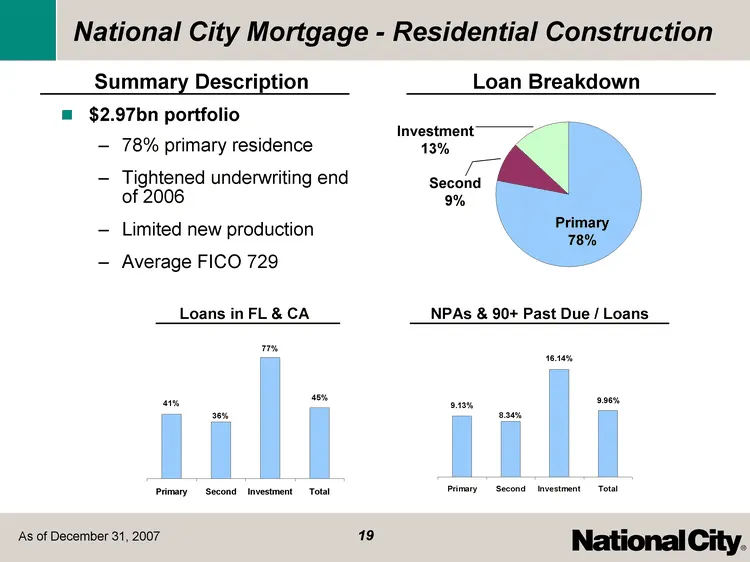
Slide 19: National City Mortgage - Residential Construction
Primary 78 2.19 3.47 4.29 Second 9 1.35 1.67 1.61 Investment 13 0.033 0.07 First Mortgage 27 0.234 0 Non-Prime 11 0.119 -0.021 NHE 20 0 0 Comm'l 2 Other 16 National City Mortgage - Residential Construction $2.97bn portfolio 78% primary residence Tightened underwriting end of 2006 Limited new product
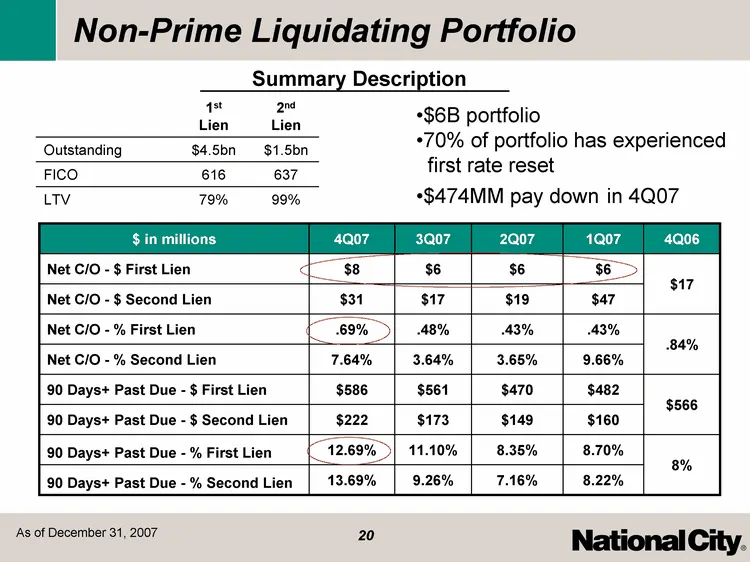
Slide 20: Non-Prime Liquidating Portfolio
Non-Prime Liquidating Portfolio $ in millions 4Q07 3Q07 2Q07 1Q07 4Q06 Net C/O - $ First Lien $8 $6 $6 $6 $17 Net C/O - $ Second Lien $31 $17 $19 $47 $17 Net C/O - % First Lien .69% .48% .43% .43% .84% Net C/O - % Second Lien 7.64% 3.64% 3.65% 9.66% .84% 90 Days+ Past Due - $ First Lien $586 $561 $4
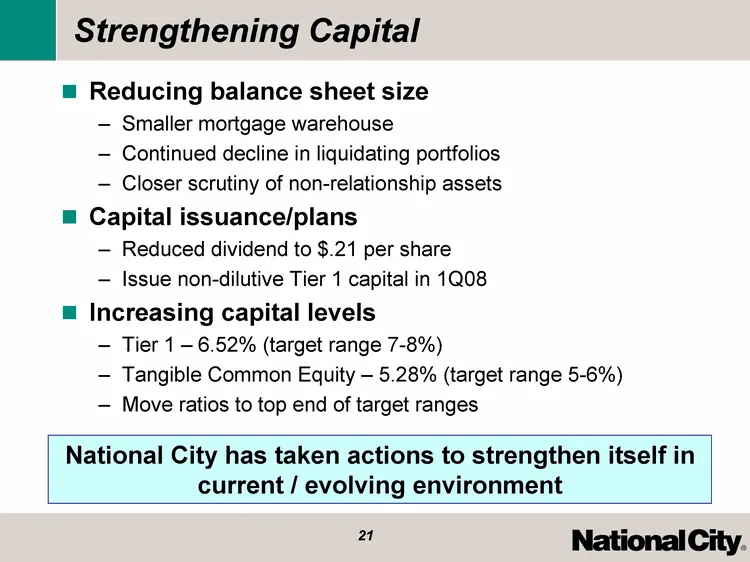
Slide 21: Strengthening Capital
Strengthening Capital Reducing balance sheet size Smaller mortgage warehouse Continued decline in liquidating portfolios Closer scrutiny of non-relationship assets Capital issuance/plans Reduced dividend to $.21 per share Issue non-dilutive Tier 1 capital in 1Q08 Increasing capital levels Tier 1 - 6
Slide 22: Overview of Initiatives for 2008
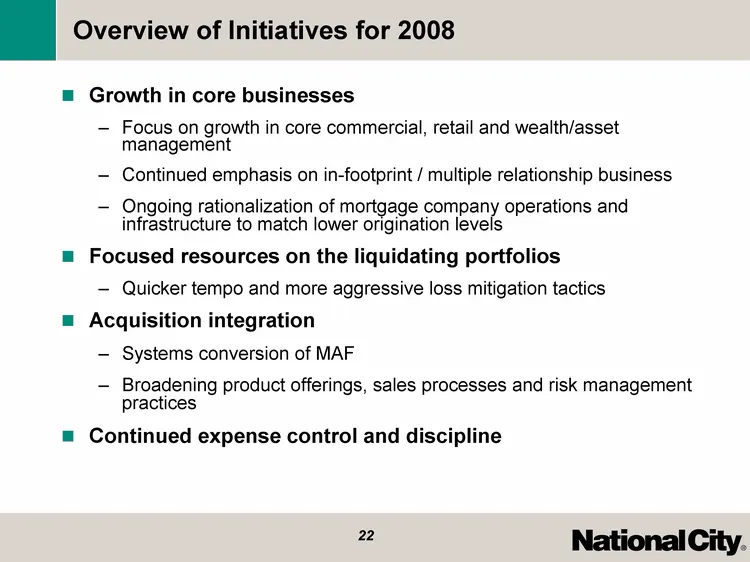
Overview of Initiatives for 2008 Growth in core businesses Focus on growth in core commercial, retail and wealth/asset management Continued emphasis on in-footprint / multiple relationship business Ongoing rationalization of mortgage company operations and infrastructure to match lower origination l

Slide 23
Source: SEC EDGAR · 8-K filed Jan 22, 2008
More decks from National City Corporation
 Q3 2008 Earnings Presentation38 slides · Oct 21, 2008
 Q2 2008 Earnings Presentation32 slides · Jul 24, 2008
 Q1 2008 Earnings Presentation16 slides · Apr 21, 2008
 Q1 2008 Earnings Presentation30 slides · Apr 21, 2008
 MAF Bancorp — Merger or Acquisition (May 2007)17 slides · May 1, 2007
 Fidelity Bankshares — Merger or Acquisition (July 2006)21 slides · Jul 27, 2006