Dennys — Investor Presentation (March 2015)
26 slides from Dennys's investor presentation, Mar 10, 2015
Slide 1: Welcome to America's Diner Investor Presentation March 2015
WELCOME TO AMERICA’S DINER® Investor Presentation March 2015
Slide 2: Forward-looking statements and non-GAAP disclosure
2 Denny’s Corporation urges caution in considering its current trends and any outlook on earnings disclosed in this presentation. In addition, certain matters discussed may constitute forward-looking statements. These forward-looking statements, which reflect the Company’s best judgment based on fac
Slide 3: Denny's Overview
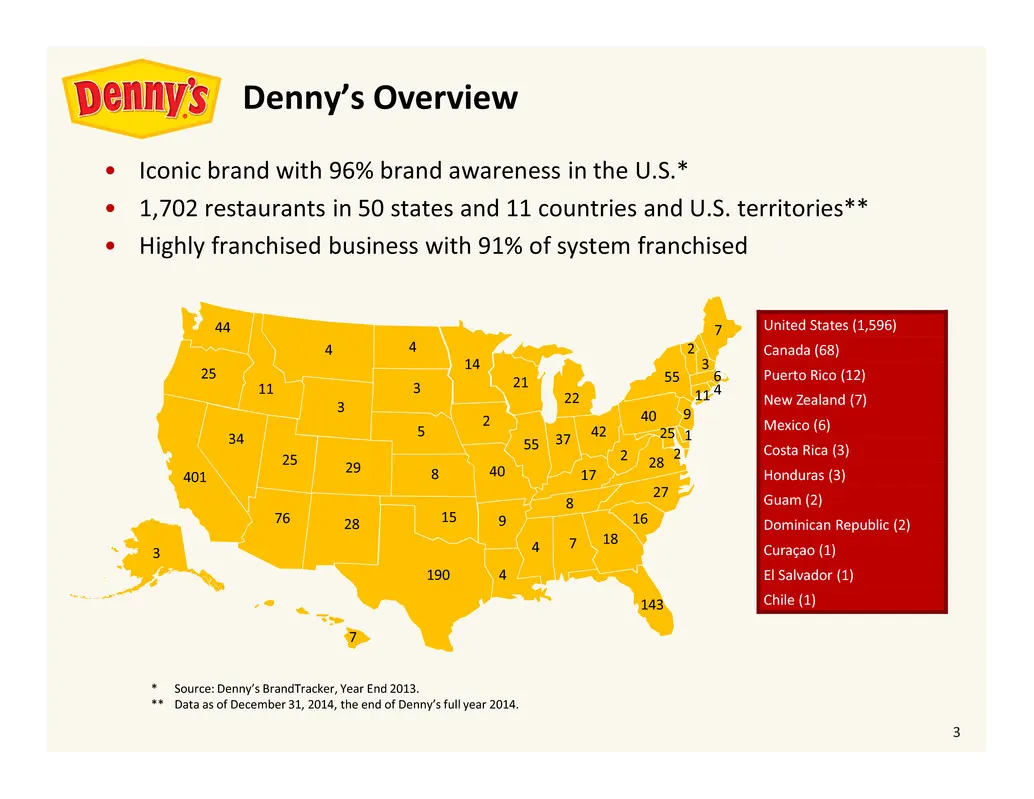
3 United States (1,596) Canada (68) Puerto Rico (12) New Zealand (7) Mexico (6) Costa Rica (3) Honduras (3) Guam (2) Dominican Republic (2) Curaçao (1) El Salvador (1) Chile (1) Denny’s Overview • Iconic brand with 96% brand awareness in the U.S.* • 1,702 restaurants in 50 states and 11 countries an
Slide 4: Denny's Investment Highlights
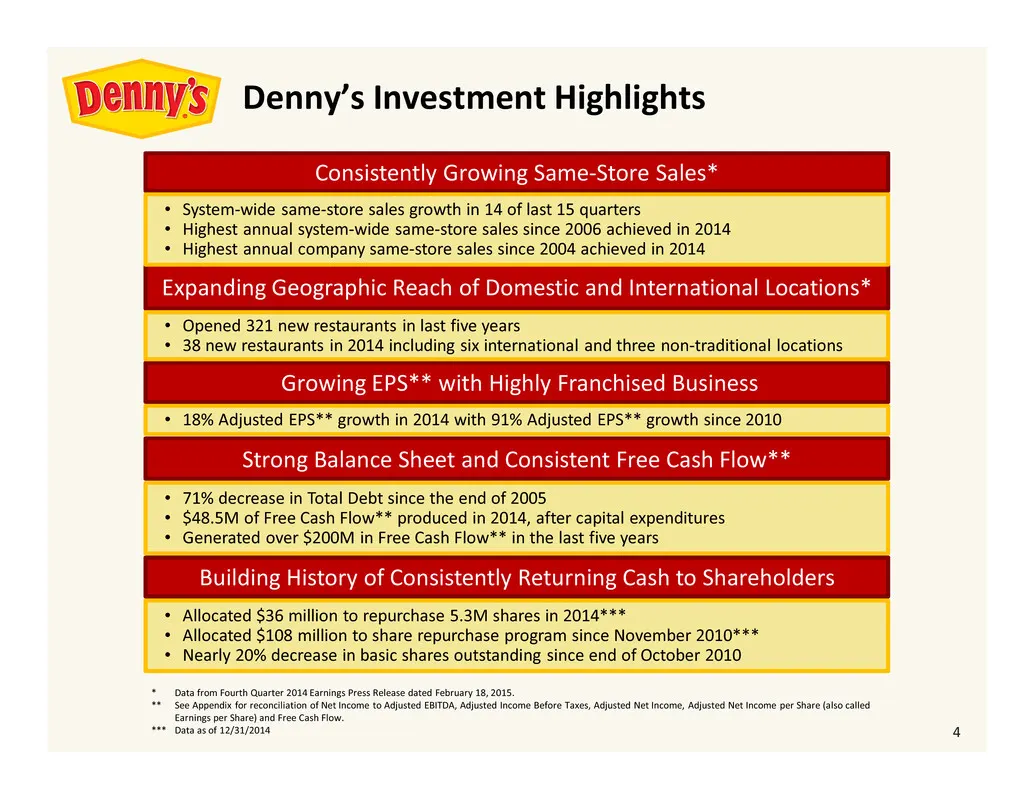
4 Denny’s Investment Highlights Consistently Growing Same-Store Sales* Expanding Geographic Reach of Domestic and International Locations* Growing EPS** with Highly Franchised Business Strong Balance Sheet and Consistent Free Cash Flow** Building History of Consistently Returning Cash to Shareholder
Slide 5: Brand Revitalization Plan Driving Results
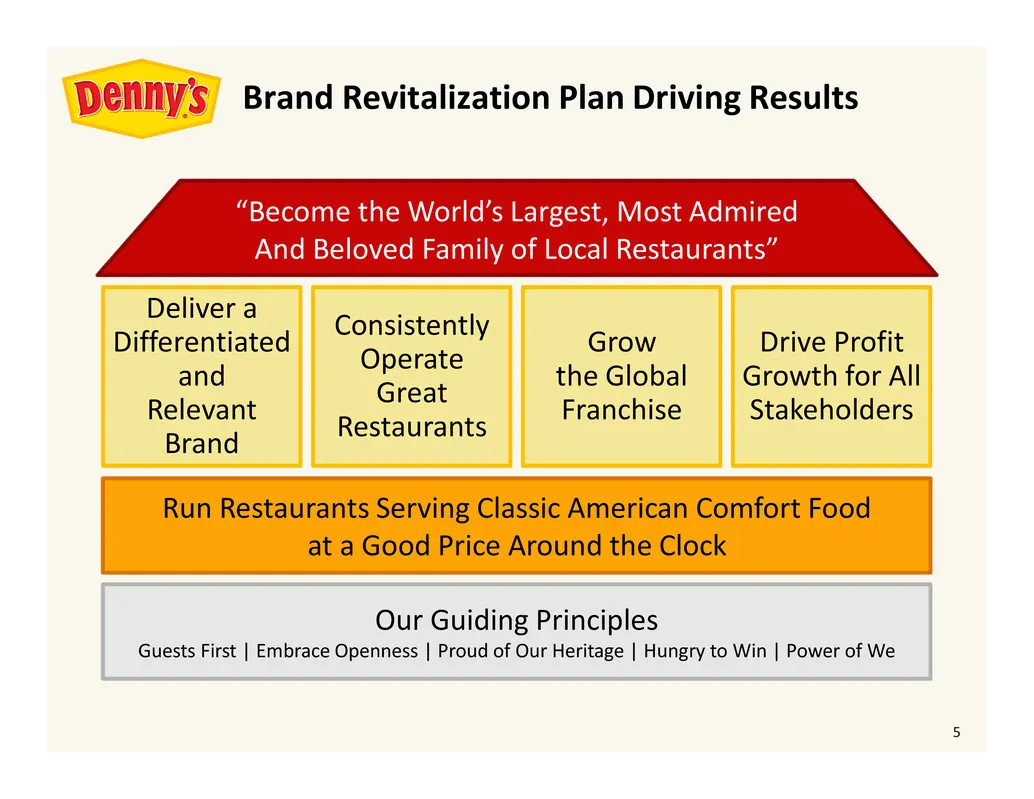
5 Brand Revitalization Plan Driving Results Drive Profit Growth for All Stakeholders Grow the Global Franchise Consistently Operate Great Restaurants Deliver a Differentiated and Relevant Brand “Become the World’s Largest, Most Admired And Beloved Family of Local Restaurants” Run Restaurants Serving
Slide 6: Delivering a Differentiated and Relevant Brand
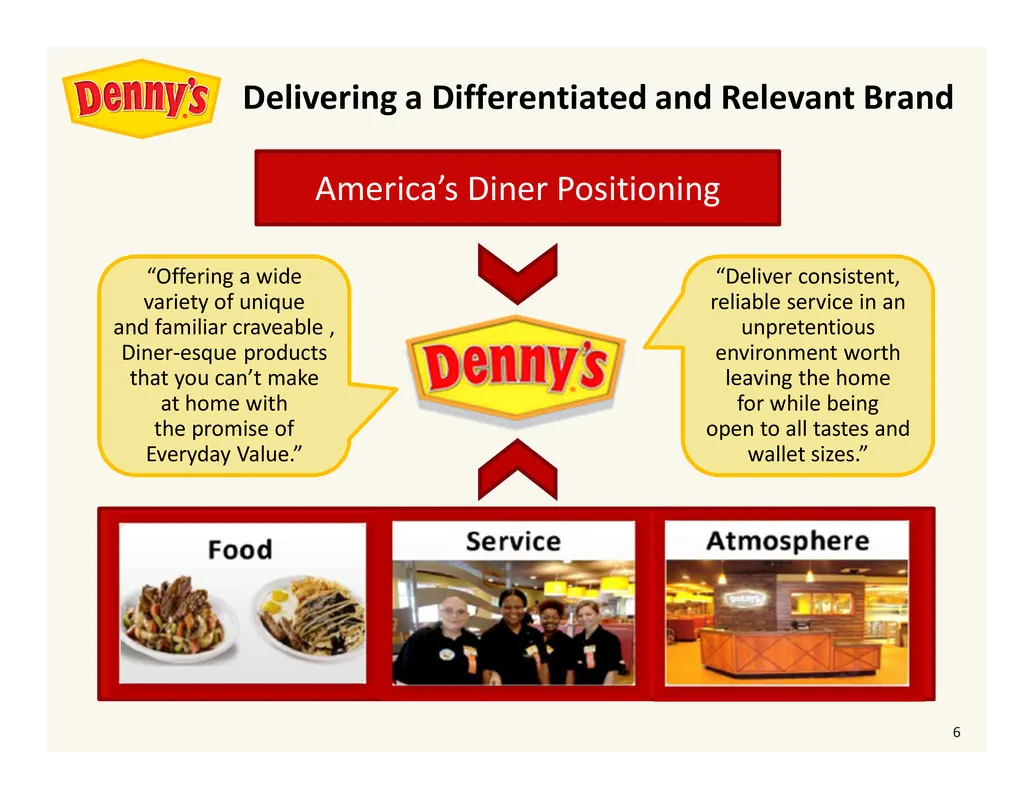
6 “Offering a wide variety of unique and familiar craveable , Diner-esque products that you can’t make at home with the promise of Everyday Value.” America’s Diner Positioning “Deliver consistent, reliable service in an unpretentious environment worth leaving the home for while being open to all tas
Slide 7: Focus on Four Key Customer Segments Driving Improvements
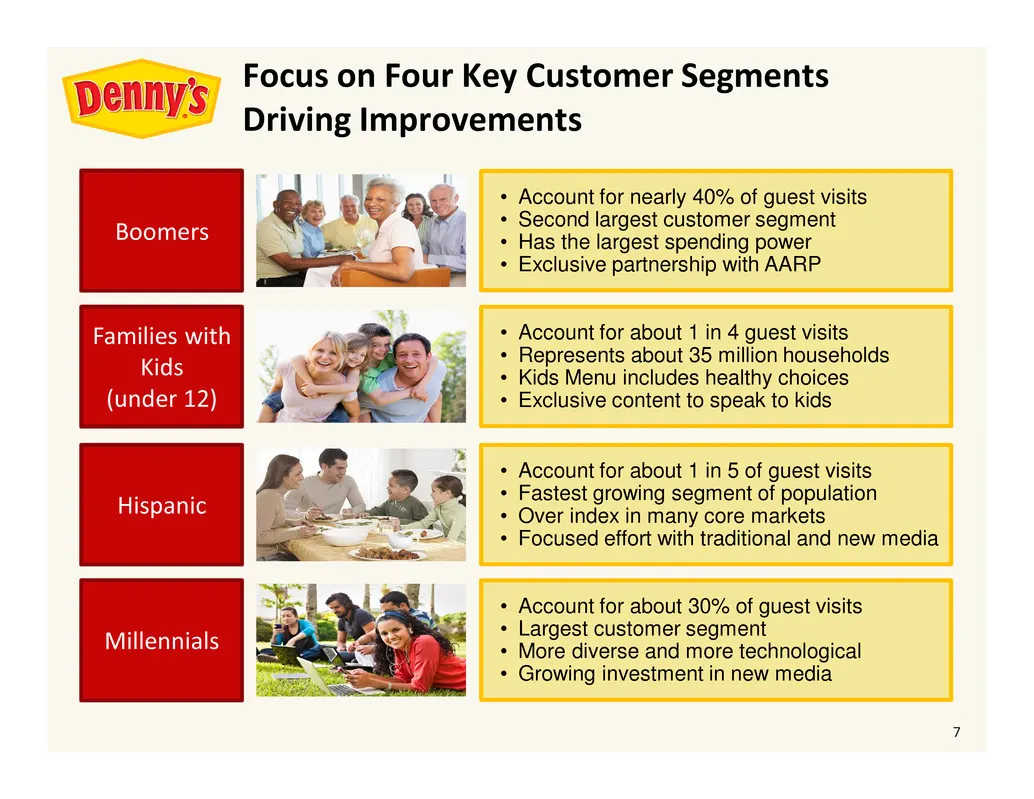
7 Hispanic Focus on Four Key Customer Segments Driving Improvements Families with Kids (under 12) Boomers Millennials • Account for about 1 in 5 of guest visits • Fastest growing segment of population • Over index in many core markets • Focused effort with traditional and new media • Account for abo
Slide 8: Menu Evolution to Match Guests' Needs
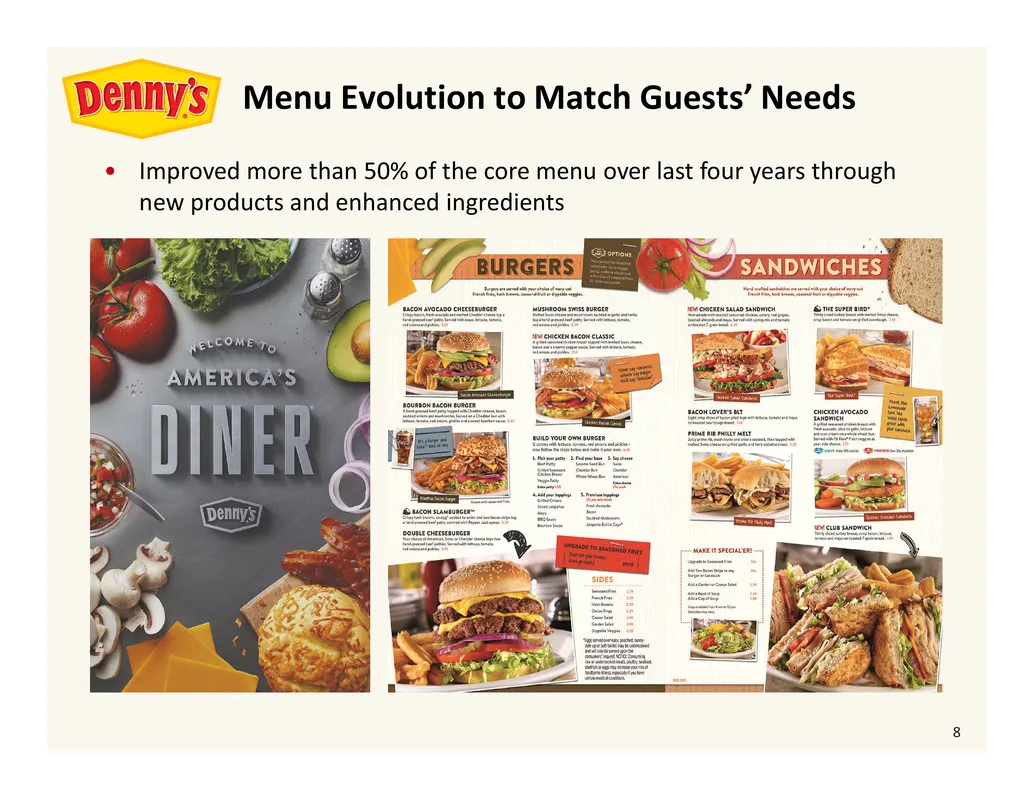
8 Menu Evolution to Match Guests’ Needs • Improved more than 50% of the core menu over last four years through new products and enhanced ingredients
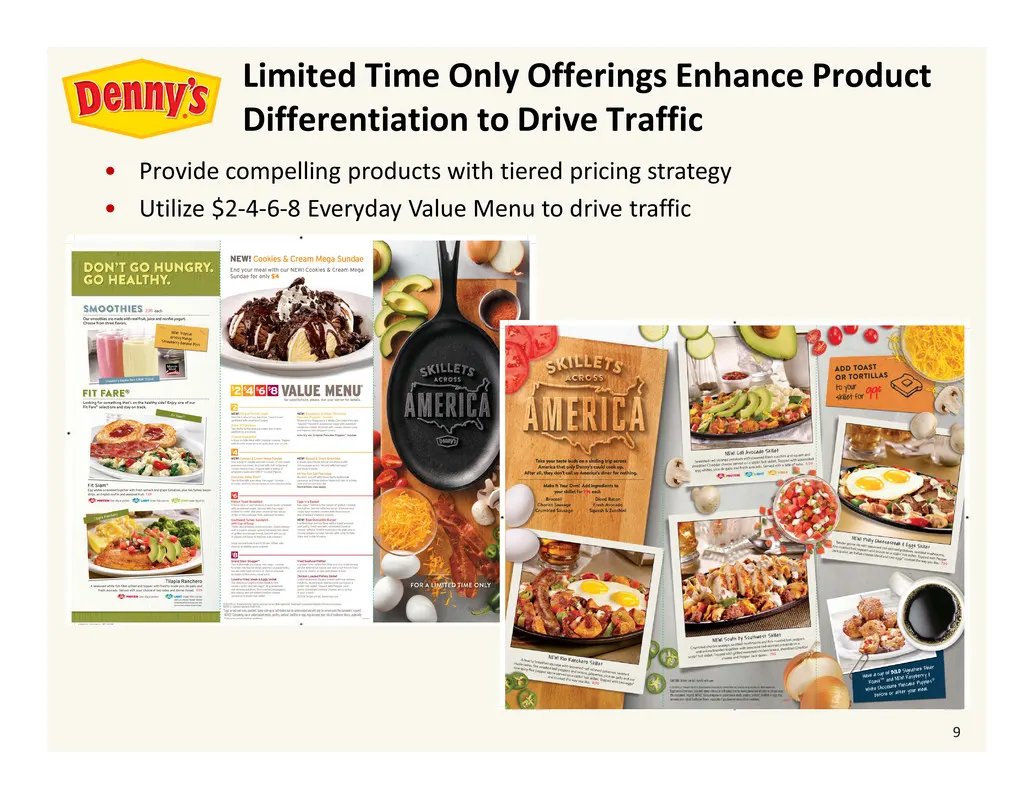
Slide 9: Limited Time Only Offerings Enhance Product Differentiation to Drive Traffic
9 • Provide compelling products with tiered pricing strategy • Utilize $2-4-6-8 Everyday Value Menu to drive traffic Limited Time Only Offerings Enhance Product Differentiation to Drive Traffic
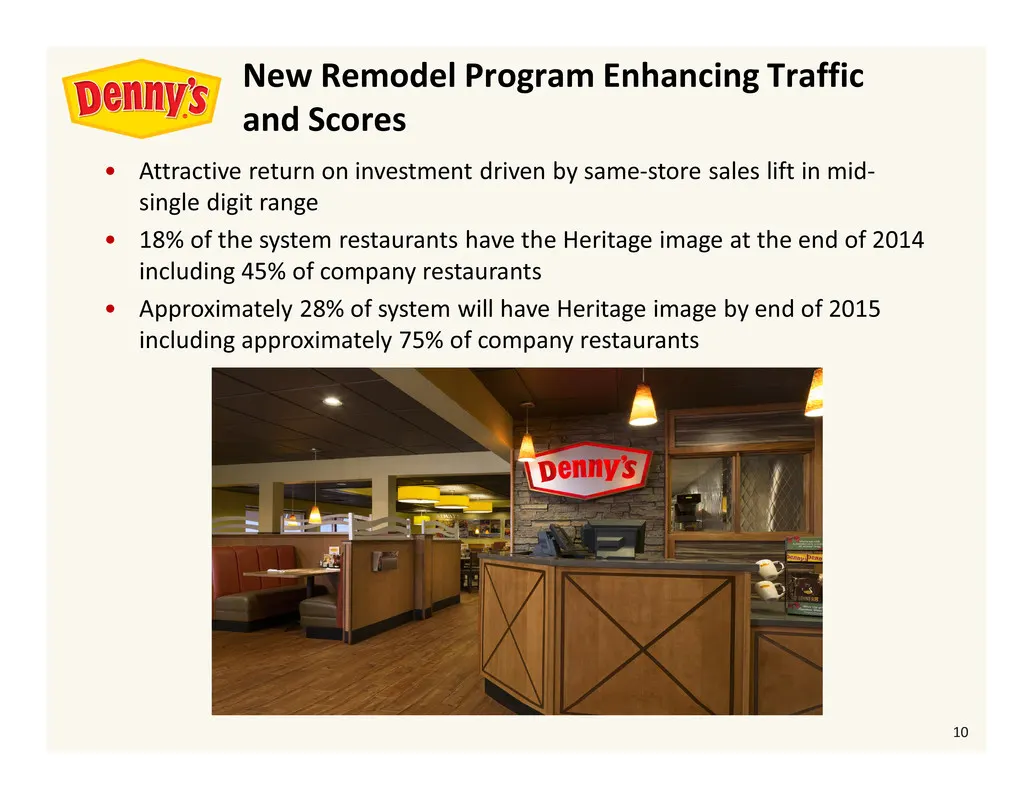
Slide 10: New Remodel Program Enhancing Traffic and Scores
10 • Attractive return on investment driven by same-store sales lift in mid- single digit range • 18% of the system restaurants have the Heritage image at the end of 2014 including 45% of company restaurants • Approximately 28% of system will have Heritage image by end of 2015 including approximatel
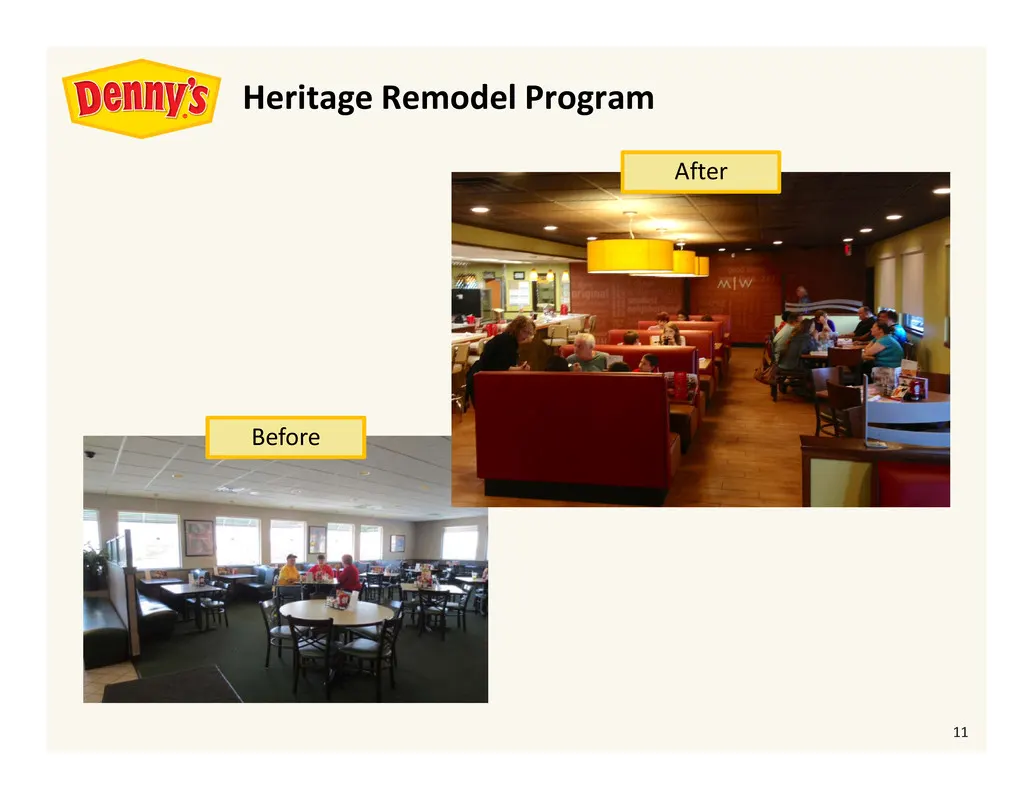
Slide 11: Heritage Remodel Program
11 Before After Heritage Remodel Program
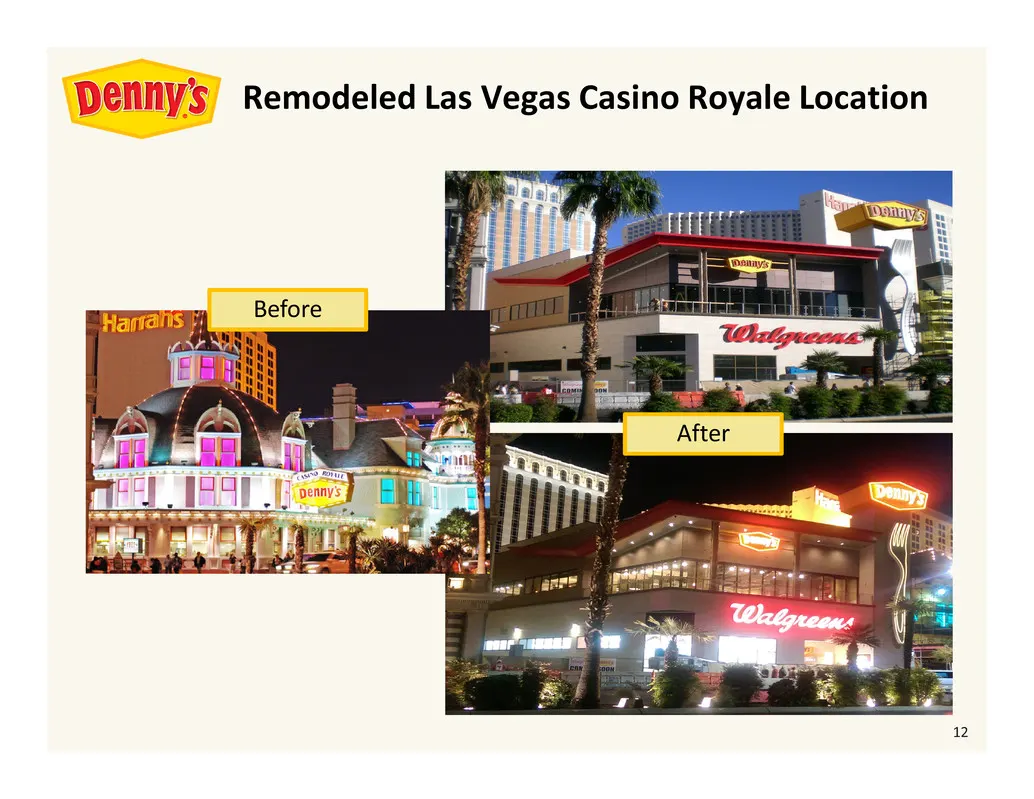
Slide 12: Remodeled Las Vegas Casino Royale Location
12 Remodeled Las Vegas Casino Royale Location Before After
Slide 13: Consistently Growing Same-Store Sales
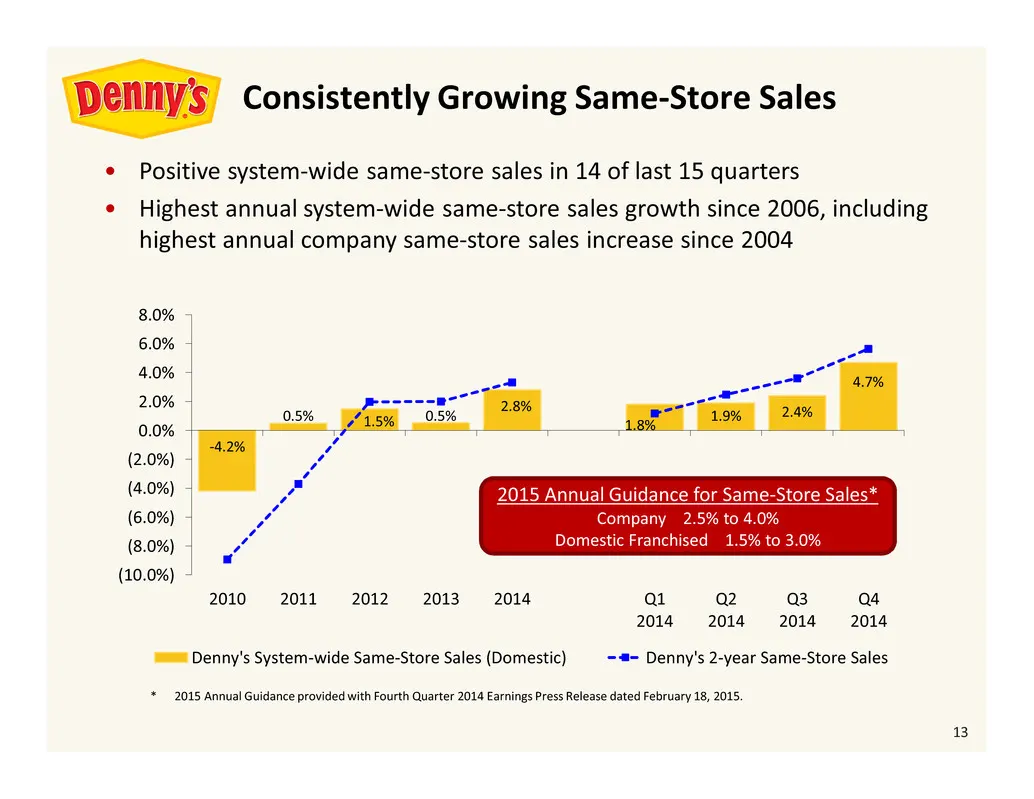
13 -4.2% 0.5% 1.5% 0.5% 2.8% 1.8% 1.9% 2.4% 4.7% (10.0%) (8.0%) (6.0%) (4.0%) (2.0%) 0.0% 2.0% 4.0% 6.0% 8.0% 2010 2011 2012 2013 2014 Q1 2014 Q2 2014 Q3 2014 Q4 2014 Denny's System-wide Same-Store Sales (Domestic) Denny's 2-year Same-Store Sales • Positive system-wide same-store sales in 14 of last
Slide 14: Focus on Operating Great Restaurants Leading to Sustained Improvement
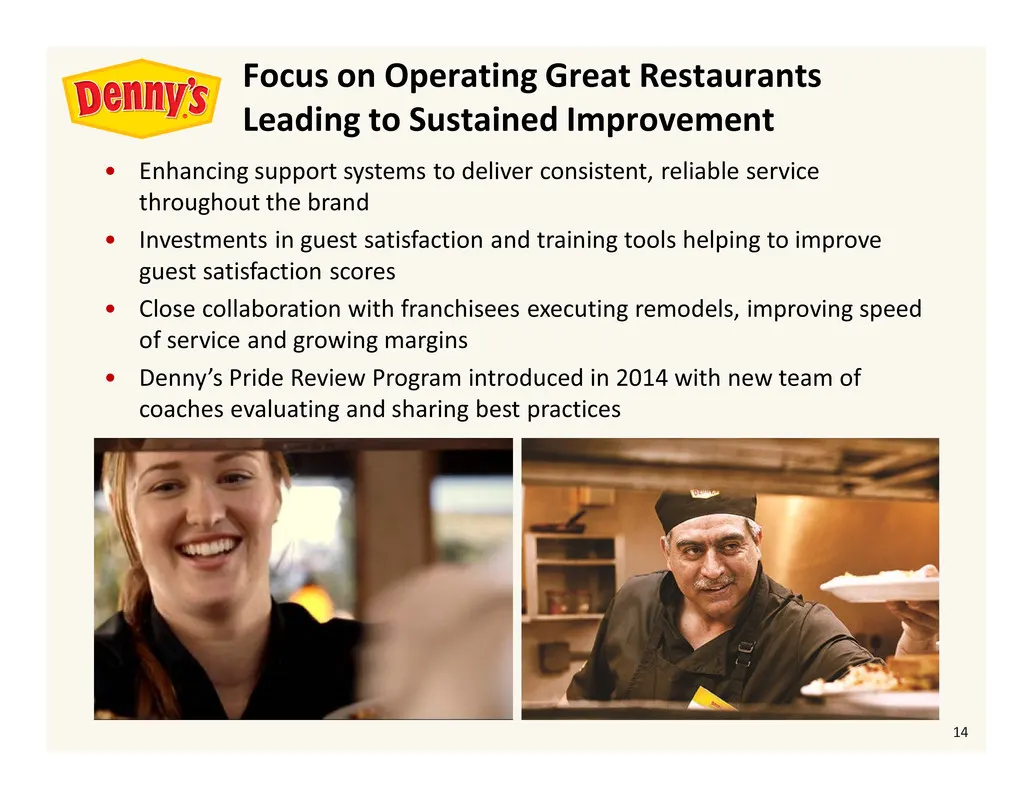
14 • Enhancing support systems to deliver consistent, reliable service throughout the brand • Investments in guest satisfaction and training tools helping to improve guest satisfaction scores • Close collaboration with franchisees executing remodels, improving speed of service and growing margins •
Slide 15: Expanding Geographic Reach of Domestic and International Locations
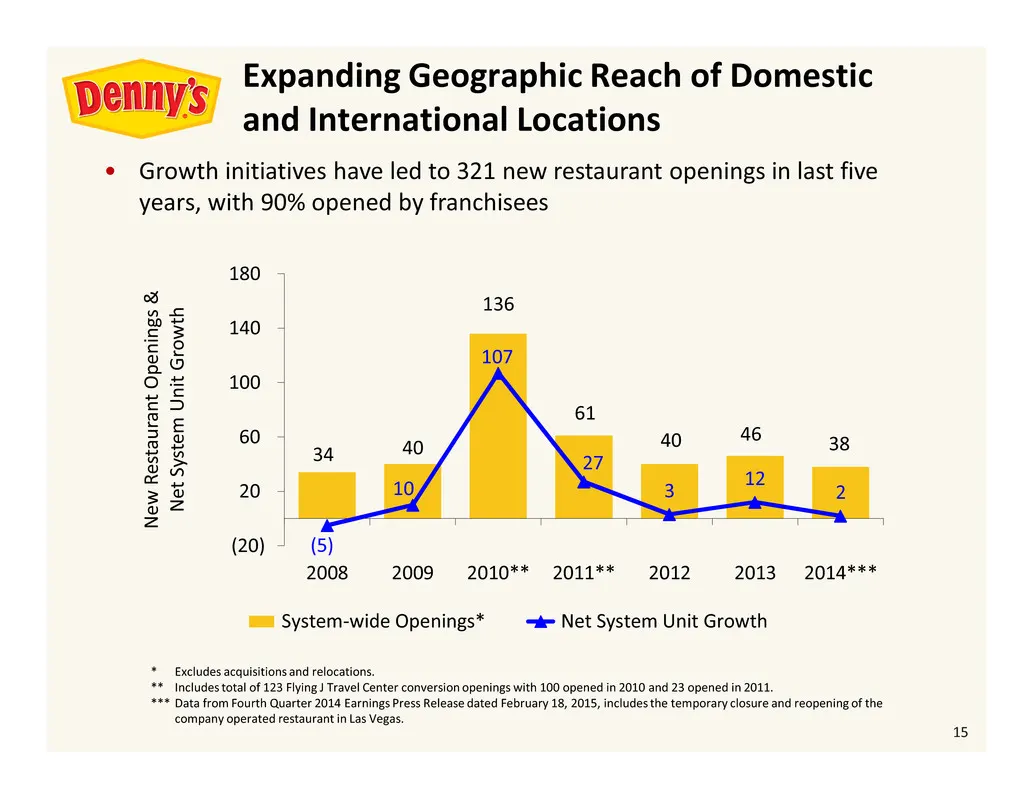
15 • Growth initiatives have led to 321 new restaurant openings in last five years, with 90% opened by franchisees 34 40 136 61 40 46 38 (5) 10 107 27 3 12 2 (20) 20 60 100 140 180 2008 2009 2010** 2011** 2012 2013 2014*** N e w R e s t a u r a n t O p e n i n g s & N e t S y s t e m U n i t G r o w
Slide 16: Domestic Growth Opportunity
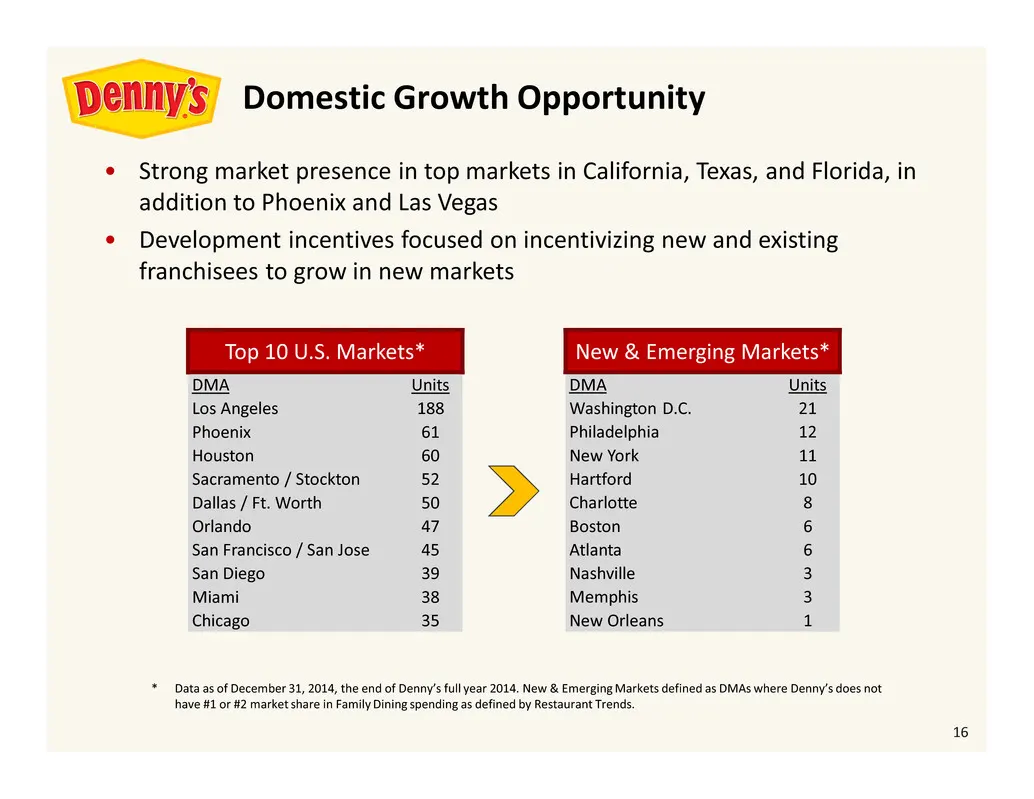
16 • Strong market presence in top markets in California, Texas, and Florida, in addition to Phoenix and Las Vegas • Development incentives focused on incentivizing new and existing franchisees to grow in new markets New & Emerging Markets* DMA Units Washington D.C. 21 Philadelphia 12 New York 11 Ha
Slide 17: International Growth Opportunity
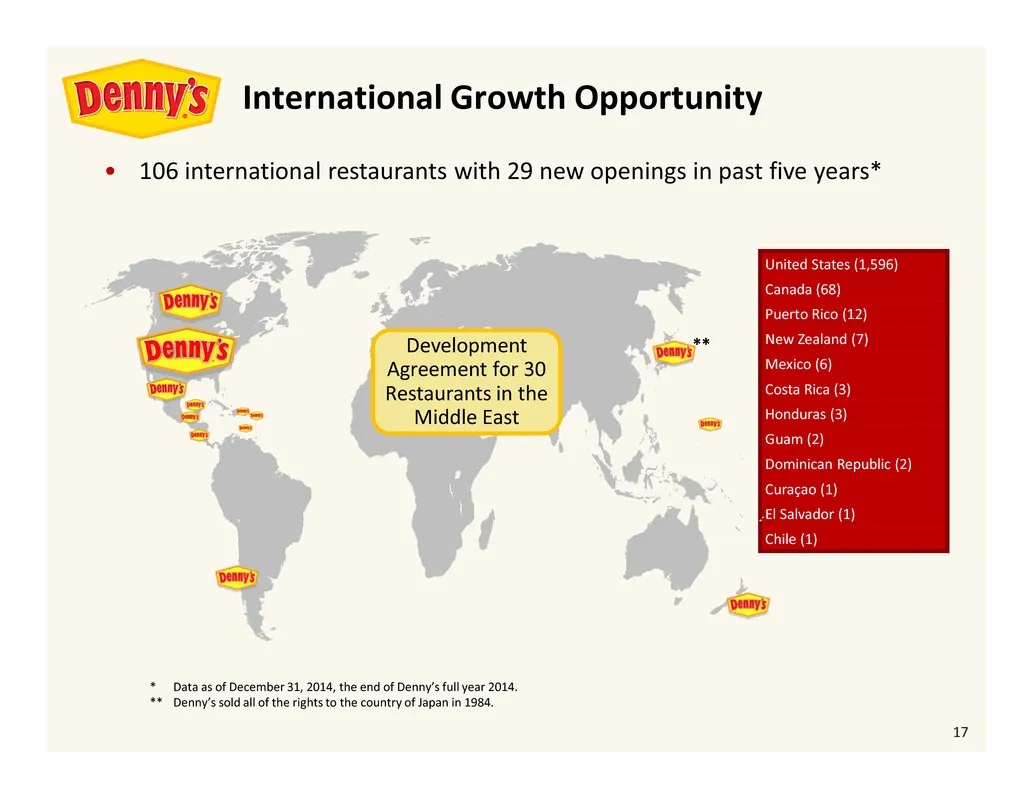
17 • 106 international restaurants with 29 new openings in past five years* United States (1,596) Canada (68) Puerto Rico (12) New Zealand (7) Mexico (6) Costa Rica (3) Honduras (3) Guam (2) Dominican Republic (2) Curaçao (1) El Salvador (1) Chile (1) * Data as of December 31, 2014, the end of Denny
Slide 18: Growing Base of Non-Traditional Locations
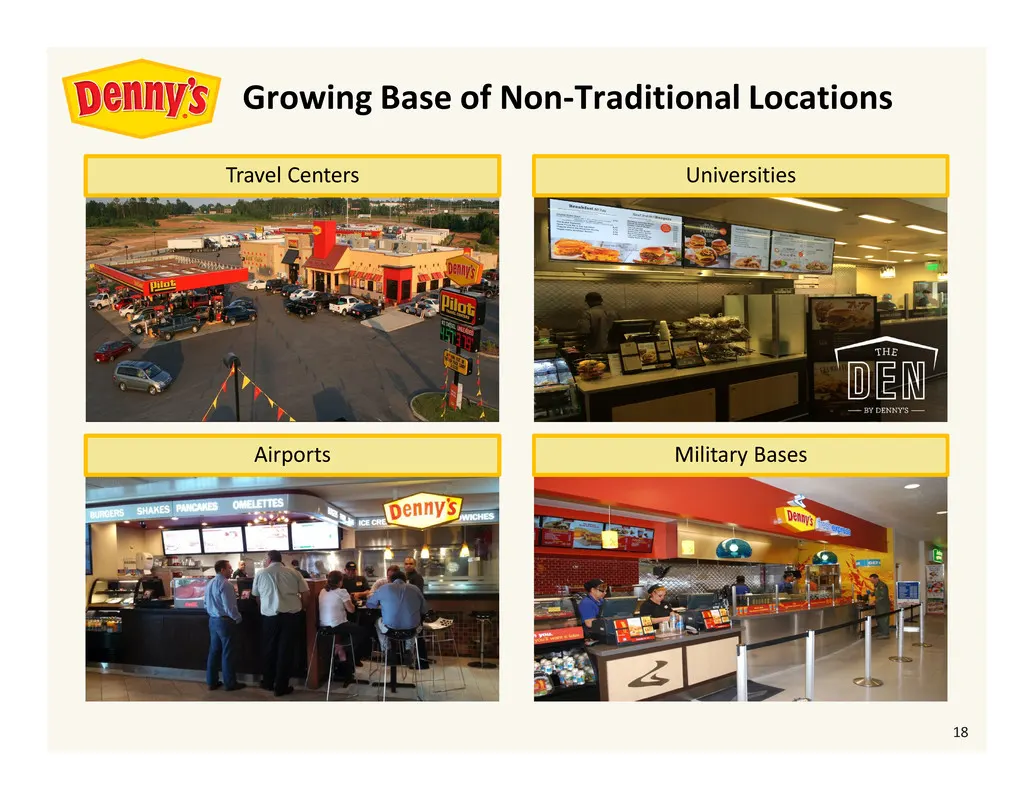
18 Travel Centers Airports Universities Military Bases Growing Base of Non-Traditional Locations
Slide 19: Growing Earnings per Share
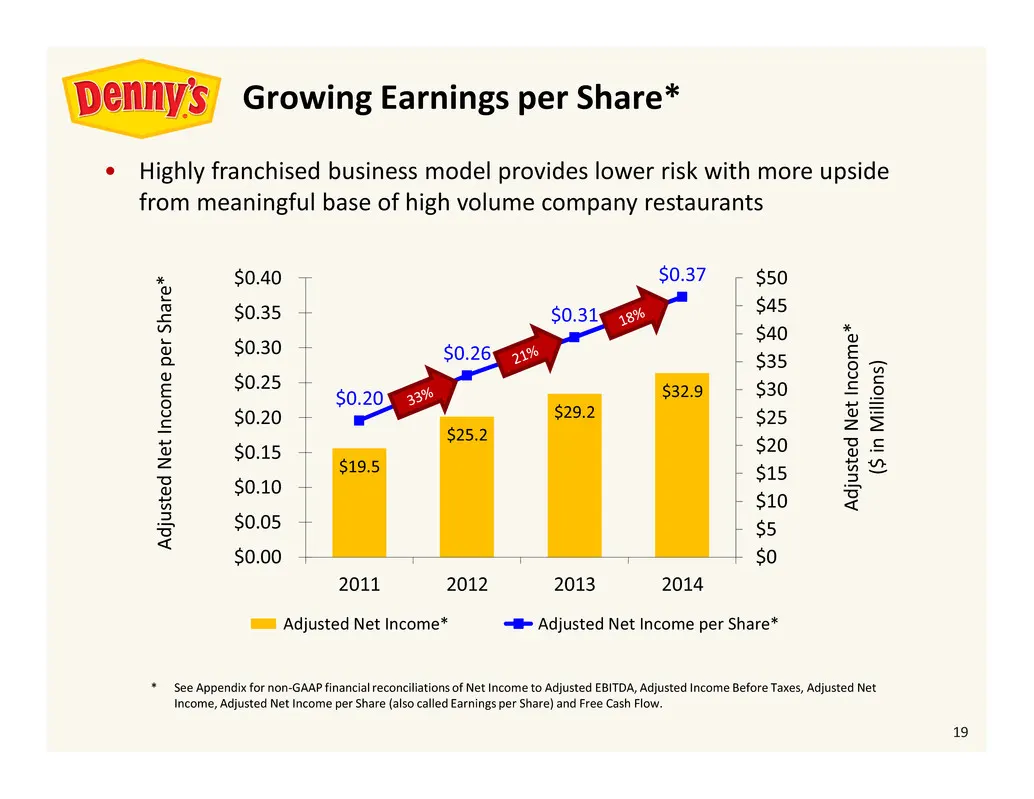
19 $19.5 $25.2 $29.2 $32.9 $0.20 $0.26 $0.31 $0.37 $0 $5 $10 $15 $20 $25 $30 $35 $40 $45 $50 $0.00 $0.05 $0.10 $0.15 $0.20 $0.25 $0.30 $0.35 $0.40 2011 2012 2013 2014 A d j u s t e d N e t I n c o m e * ( $ i n M i l l i o n s ) A d j u s t e d N e t I n c o m e p e r S h a r e * Adjusted Net Income
Slide 20: Free Cash Flow and 2015 Guidance
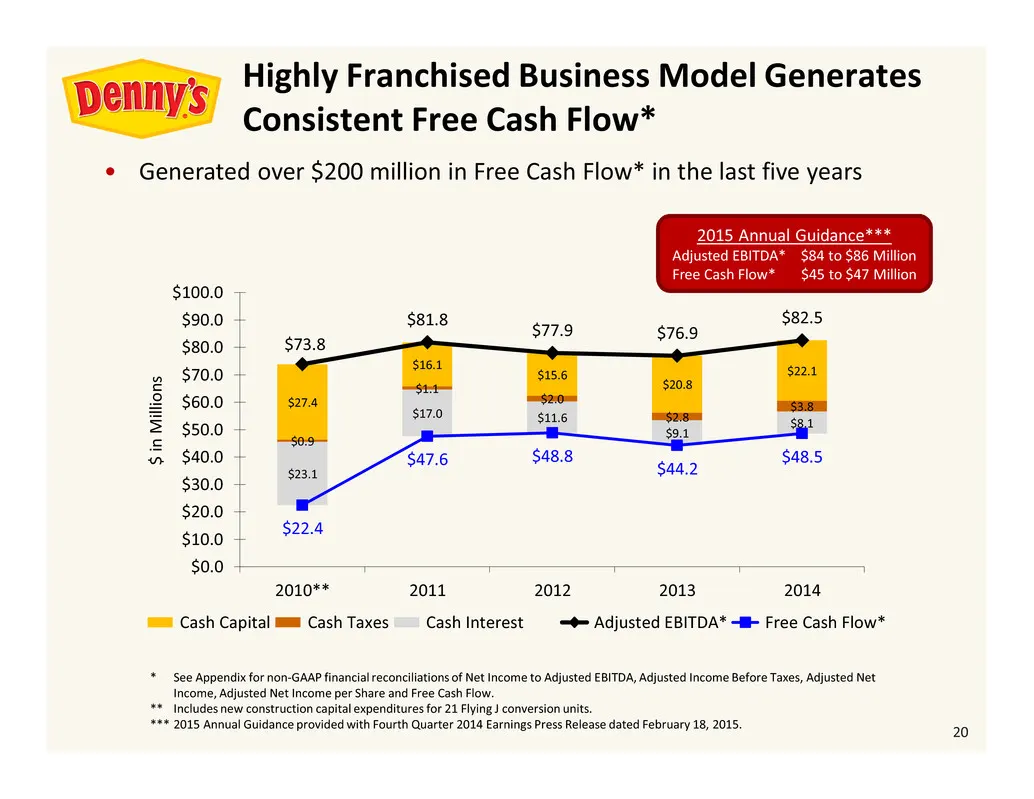
20 • Generated over $200 million in Free Cash Flow* in the last five years * See Appendix for non-GAAP financial reconciliations of Net Income to Adjusted EBITDA, Adjusted Income Before Taxes, Adjusted Net Income, Adjusted Net Income per Share and Free Cash Flow. ** Includes new construction capital
Slide 21: Strong Balance Sheet with Significant Flexibility
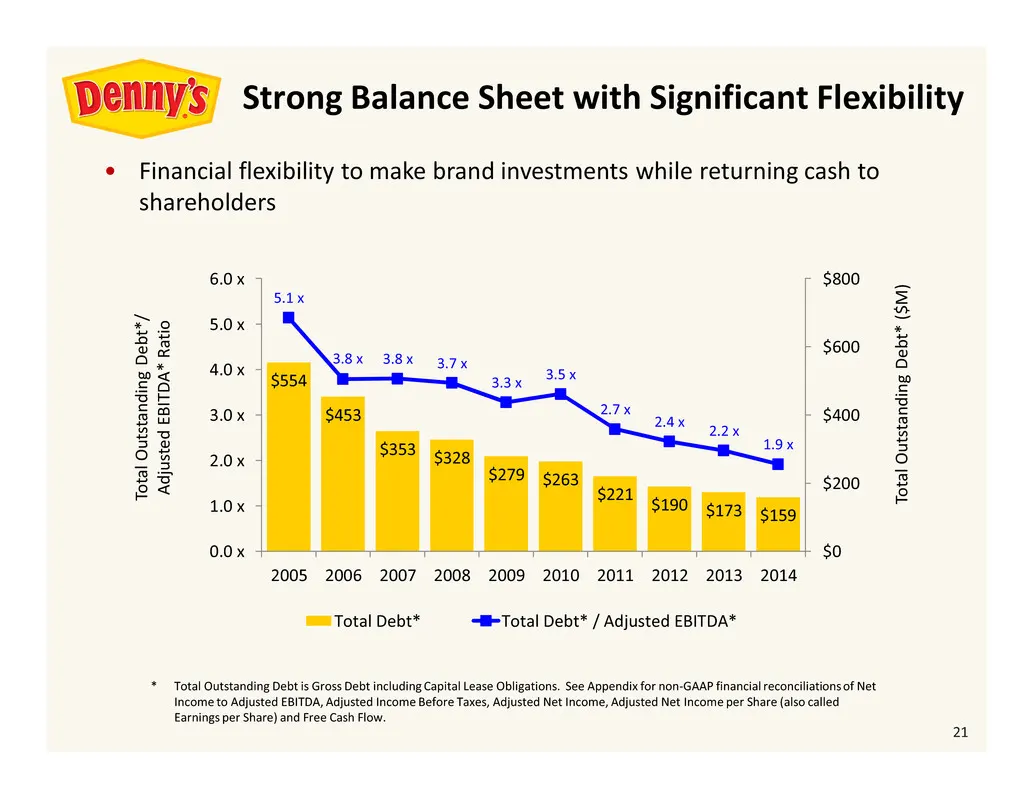
21 • Financial flexibility to make brand investments while returning cash to shareholders $554 $453 $353 $328 $279 $263 $221 $190 $173 $159 5.1 x 3.8 x 3.8 x 3.7 x 3.3 x 3.5 x 2.7 x 2.4 x 2.2 x 1.9 x 0.0 x 1.0 x 2.0 x 3.0 x 4.0 x 5.0 x 6.0 x 2005 2006 2007 2008 2009 2010 2011 2012 2013 2014 $0 $200
Slide 22: Returning Value to Shareholders
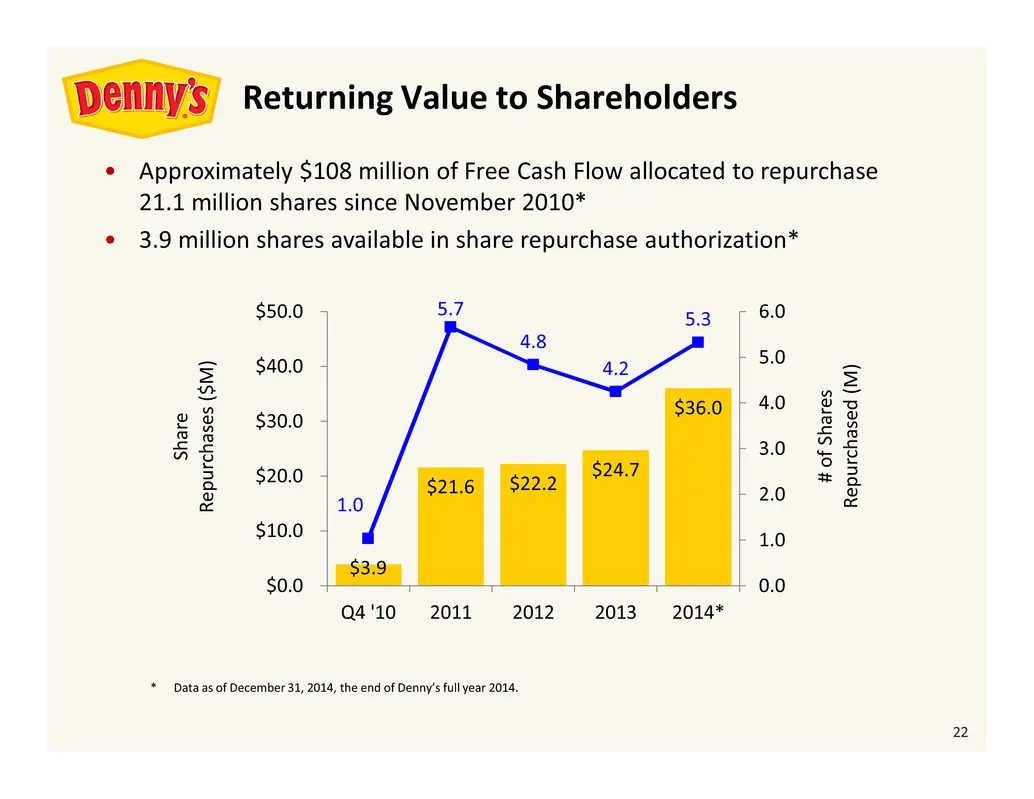
22 • Approximately $108 million of Free Cash Flow allocated to repurchase 21.1 million shares since November 2010* • 3.9 million shares available in share repurchase authorization* $3.9 $21.6 $22.2 $24.7 $36.0 1.0 5.7 4.8 4.2 5.3 0.0 1.0 2.0 3.0 4.0 5.0 6.0 Q4 '10 2011 2012 2013 2014* $0.0 $10.0 $20
Slide 23: Denny's Investment Highlights
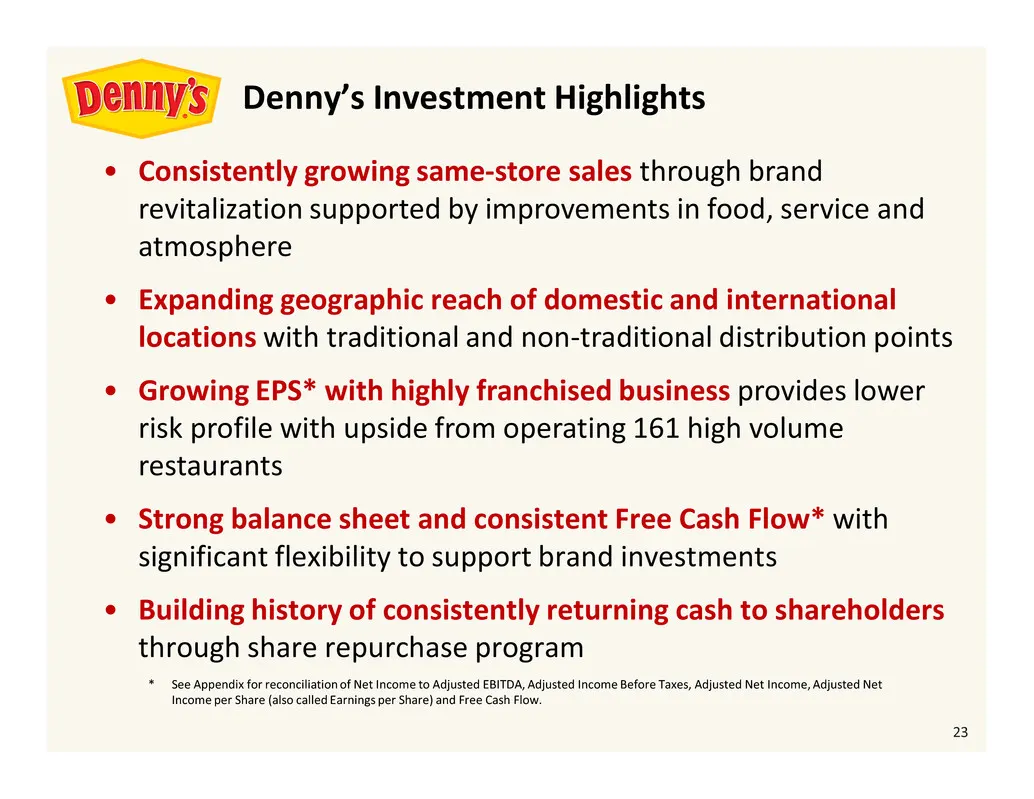
23 * See Appendix for reconciliation of Net Income to Adjusted EBITDA, Adjusted Income Before Taxes, Adjusted Net Income, Adjusted Net Income per Share (also called Earnings per Share) and Free Cash Flow. • Consistently growing same-store sales through brand revitalization supported by improvements
Slide 24: Appendix
WELCOME TO AMERICA’S DINER® APPENDIX
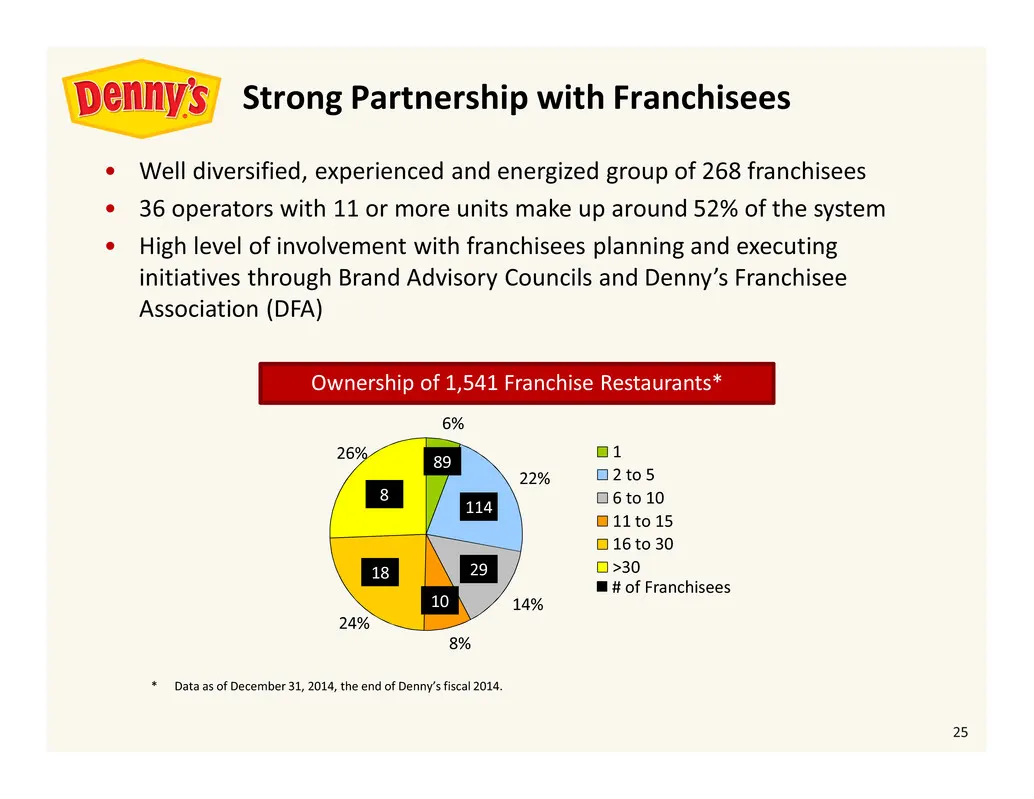
Slide 25: Strong Partnership with Franchisees
25 6% 22% 14% 8% 24% 26% 1 2 to 5 6 to 10 11 to 15 16 to 30 >3029 # of Franchisees 10 18 8 89 114 Ownership of 1,541 Franchise Restaurants* Strong Partnership with Franchisees • Well diversified, experienced and energized group of 268 franchisees • 36 operators with 11 or more units make up around 5
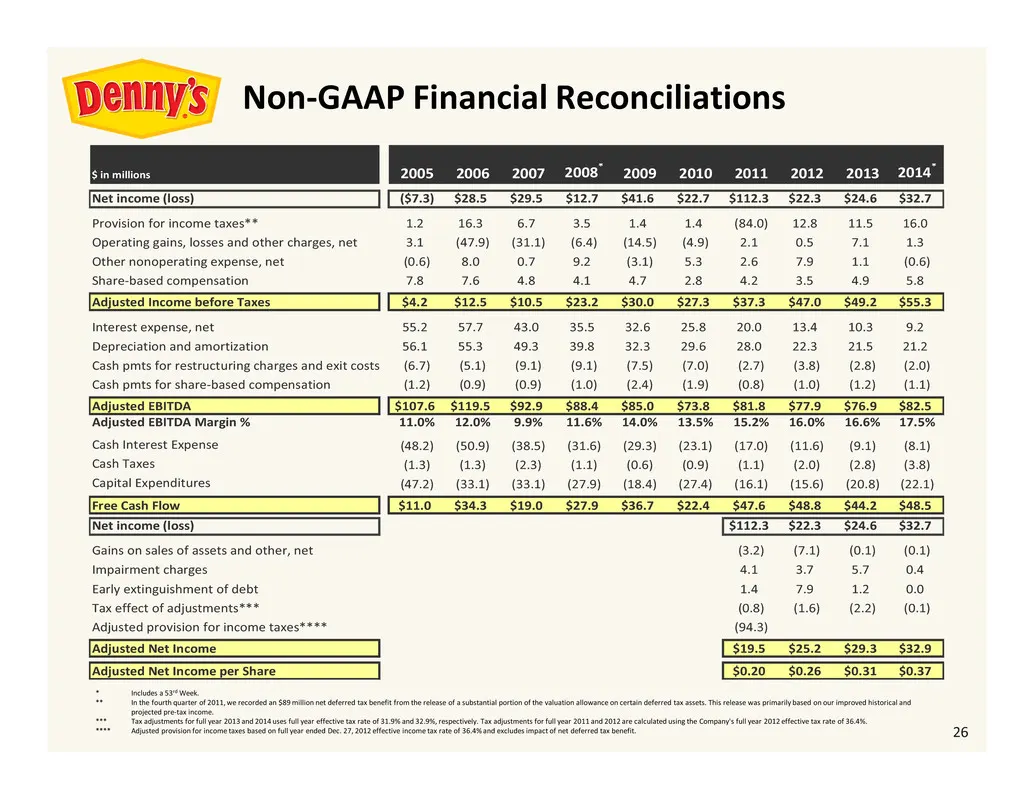
Slide 26: Non-GAAP Financial Reconciliations
26 * Includes a 53rdWeek. ** In the fourth quarter of 2011, we recorded an $89 million net deferred tax benefit from the release of a substantial portion of the valuation allowance on certain deferred tax assets. This release was primarily based on our improved historical and projected pre-tax incom
Source: SEC EDGAR · 8-K filed Mar 10, 2015
More decks from Dennys Corp
 Investor Presentation (August 2025)30 slides · Aug 4, 2025
 Investor Presentation (May 2025)32 slides · May 2025
 Investor Presentation (February 2025)32 slides · February 2025
 Investor Presentation (January 2025)32 slides · Jan 13, 2025
 Investor Day (October 2024)137 slides · Oct 22, 2024
 Q2 2024 Earnings Presentation22 slides · Jul 30, 2024