Dennys — 19th Annual ICR Conference 2017
28 slides from Dennys's conference presentation, Jan 9, 2017
Slide 1: Investor Presentation, 19th Annual ICR Conference January 2017
INVESTOR PRESENTATION 19th Annual ICR Conference January 2017
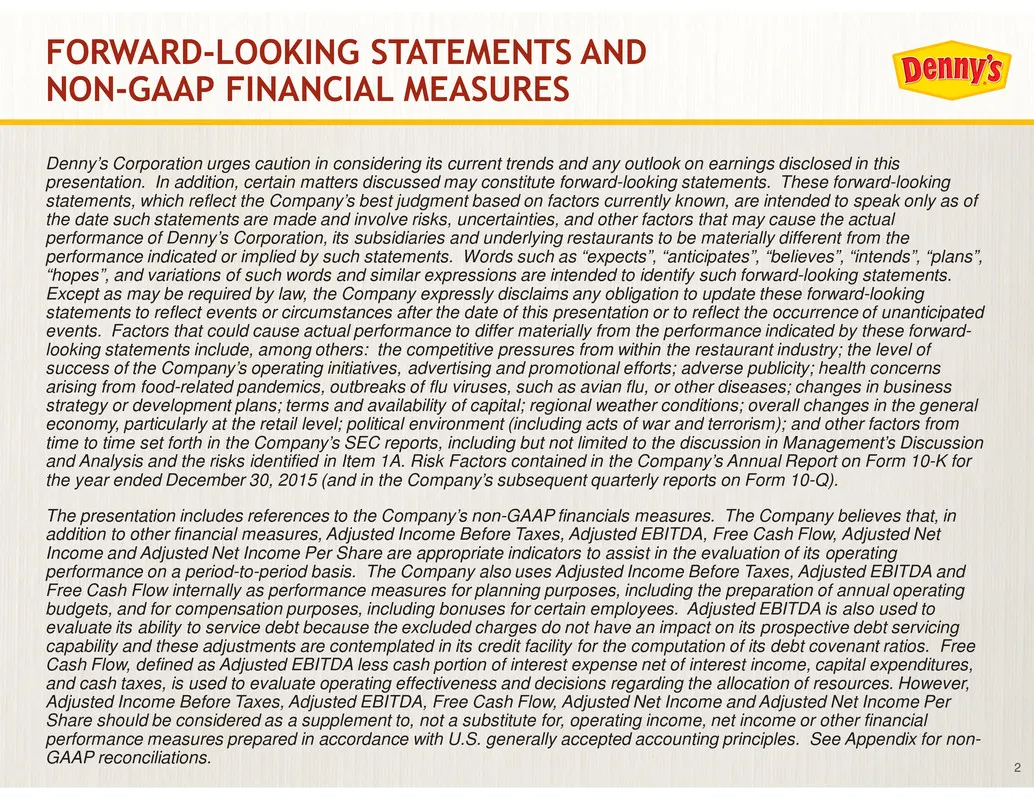
Slide 2: Forward-Looking Statements and Non-GAAP Financial Measures
2 FORWARD-LOOKING STATEMENTS AND NON-GAAP FINANCIAL MEASURES Denny’s Corporation urges caution in considering its current trends and any outlook on earnings disclosed in this presentation. In addition, certain matters discussed may constitute forward-looking statements. These forward-looking stateme
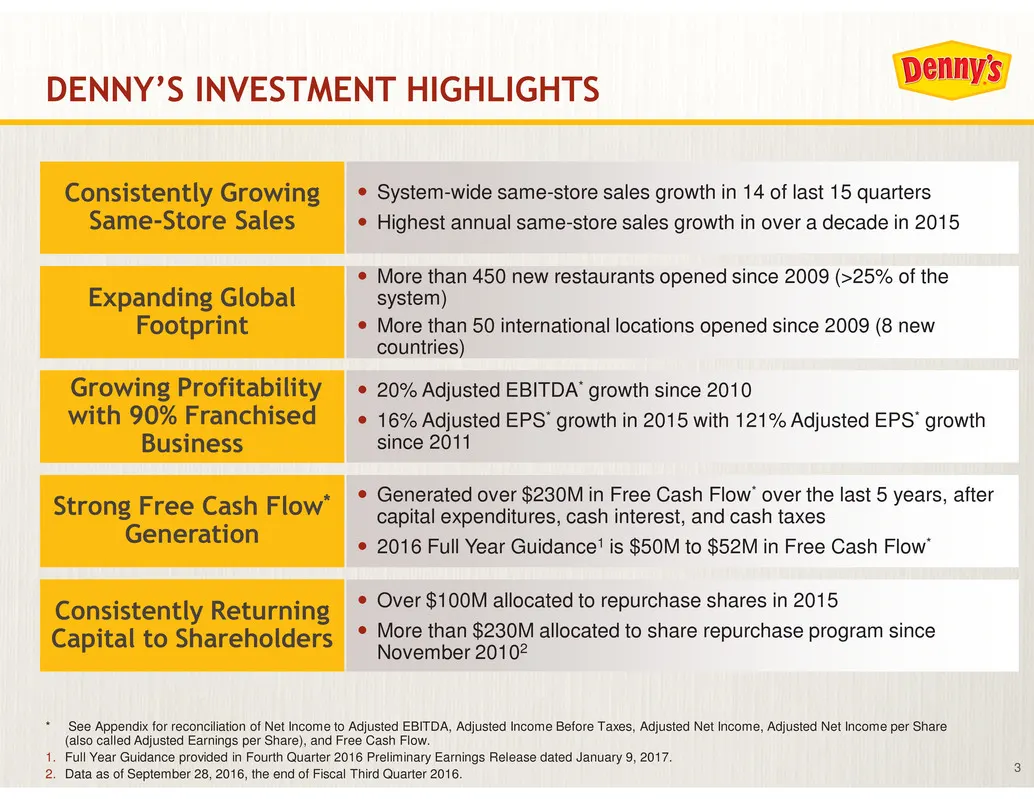
Slide 3: Denny's Investment Highlights
3 DENNY’S INVESTMENT HIGHLIGHTS * See Appendix for reconciliation of Net Income to Adjusted EBITDA, Adjusted Income Before Taxes, Adjusted Net Income, Adjusted Net Income per Share (also called Adjusted Earnings per Share), and Free Cash Flow. 1. Full Year Guidance provided in Fourth Quarter 2016 Pr
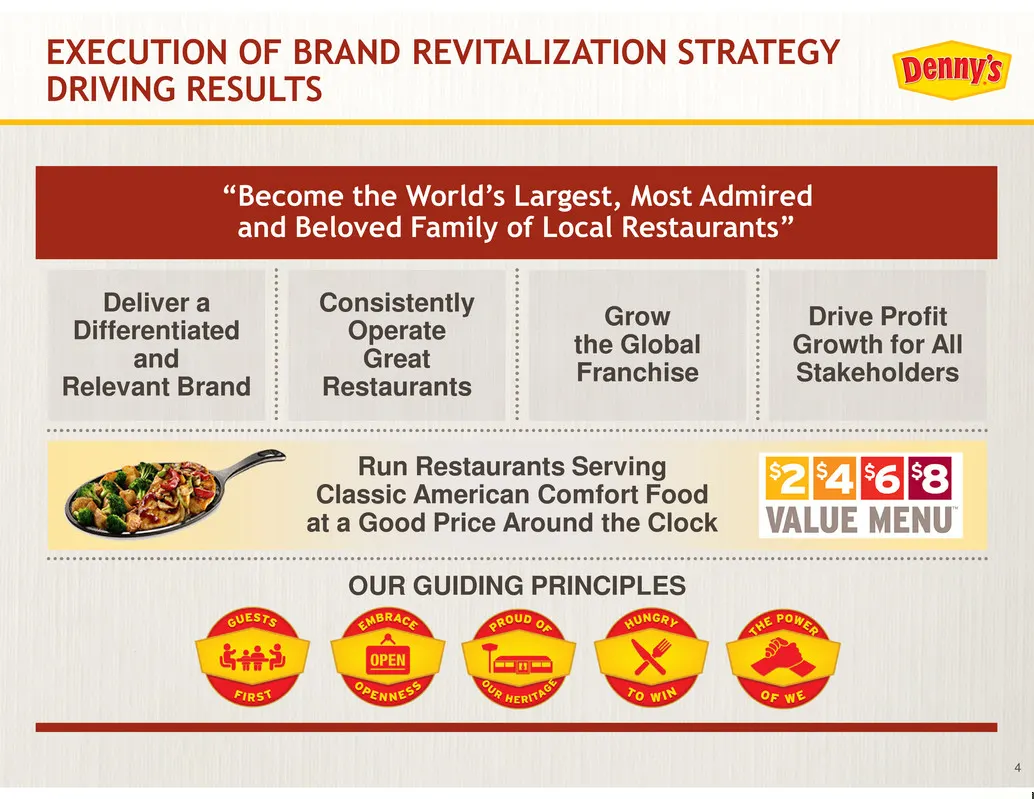
Slide 4: Execution of Brand Revitalization Strategy Driving Results
4 Run Restaurants Serving Classic American Comfort Food at a Good Price Around the Clock EXECUTION OF BRAND REVITALIZATION STRATEGY DRIVING RESULTS Drive Profit Growth for All Stakeholders Grow the Global Franchise Consistently Operate Great Restaurants Deliver a Differentiated and Relevant Brand “B
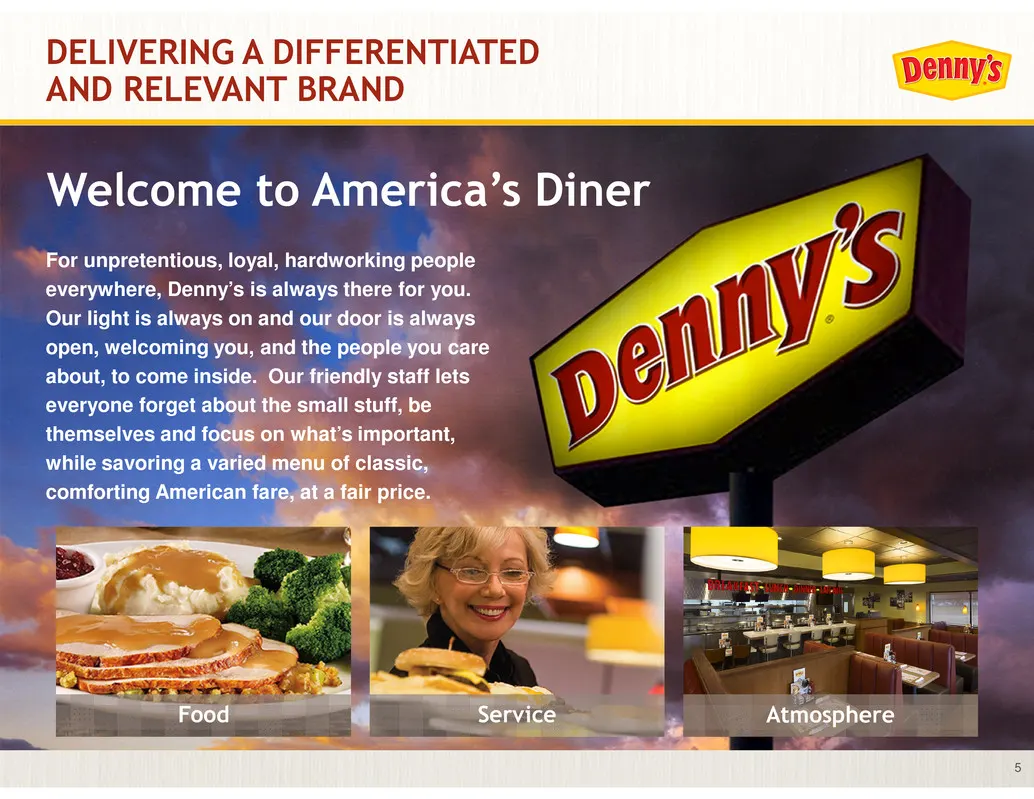
Slide 5: Delivering a Differentiated and Relevant Brand
5 For unpretentious, loyal, hardworking people everywhere, Denny’s is always there for you. Our light is always on and our door is always open, welcoming you, and the people you care about, to come inside. Our friendly staff lets everyone forget about the small stuff, be themselves and focus on what
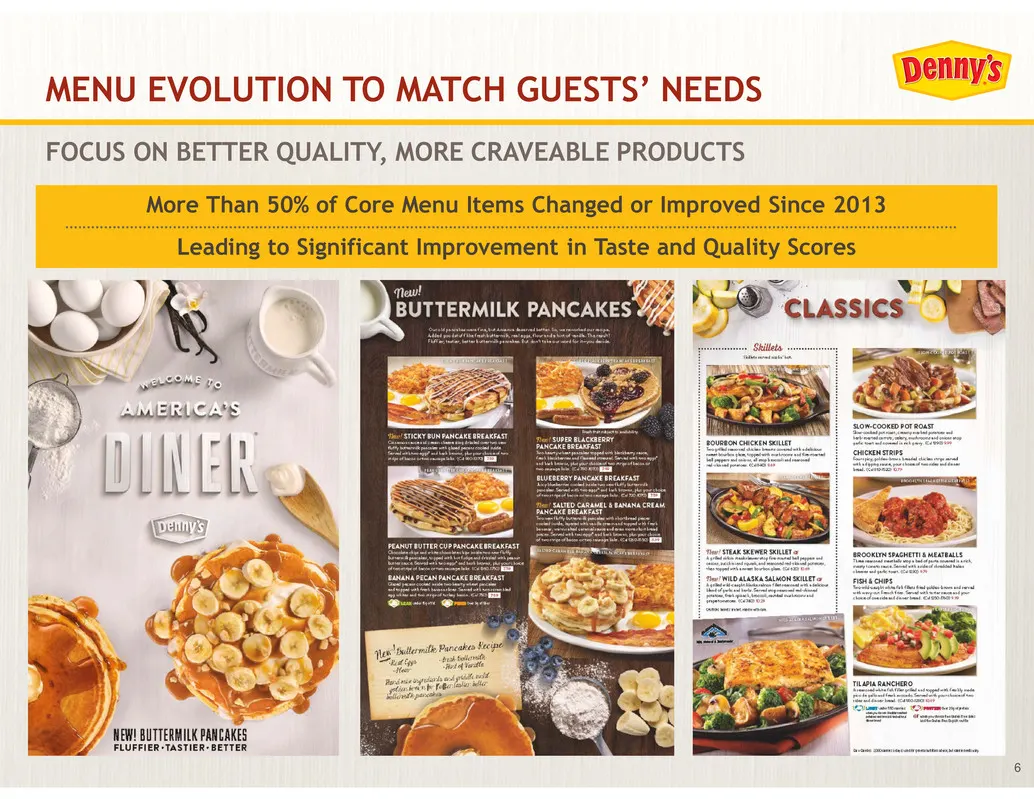
Slide 6: Menu Evolution to Match Guests' Needs
6 MENU EVOLUTION TO MATCH GUESTS’ NEEDS FOCUS ON BETTER QUALITY, MORE CRAVEABLE PRODUCTS More Than 50% of Core Menu Items Changed or Improved Since 2013 Leading to Significant Improvement in Taste and Quality Scores
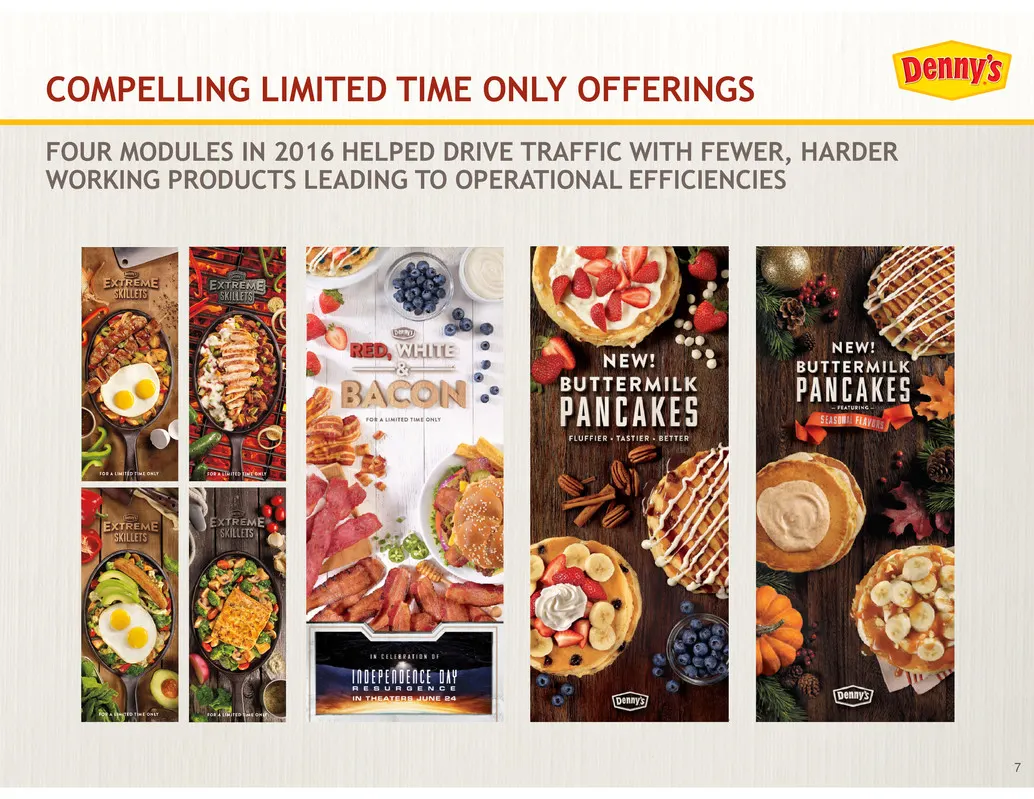
Slide 7: Compelling Limited Time Only Offerings
7 COMPELLING LIMITED TIME ONLY OFFERINGS FOUR MODULES IN 2016 HELPED DRIVE TRAFFIC WITH FEWER, HARDER WORKING PRODUCTS LEADING TO OPERATIONAL EFFICIENCIES
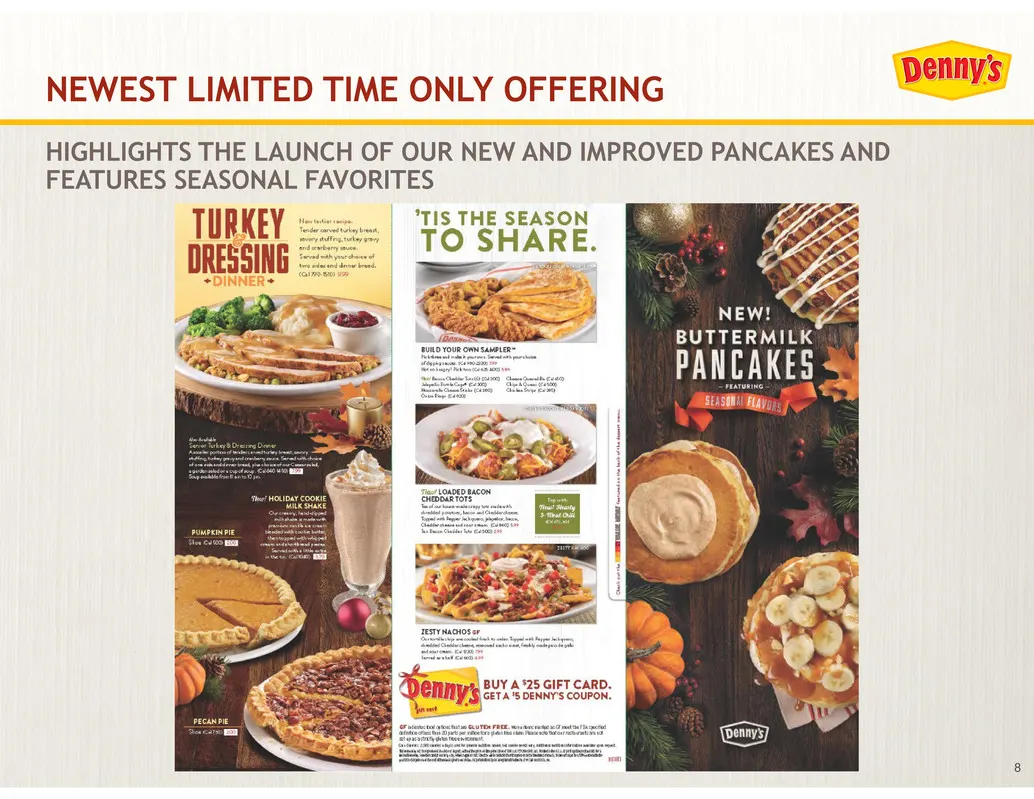
Slide 8: Newest Limited Time Only Offering Highlights New Pancakes
8 NEWEST LIMITED TIME ONLY OFFERING HIGHLIGHTS THE LAUNCH OF OUR NEW AND IMPROVED PANCAKES AND FEATURES SEASONAL FAVORITES

Slide 9: "Super Blackberry Pancake Breakfast" Commercial
9 “SUPER BLACKBERRY PANCAKE BREAKFAST” COMMERCIAL
Slide 10: "$4 Value Menu" Commercial
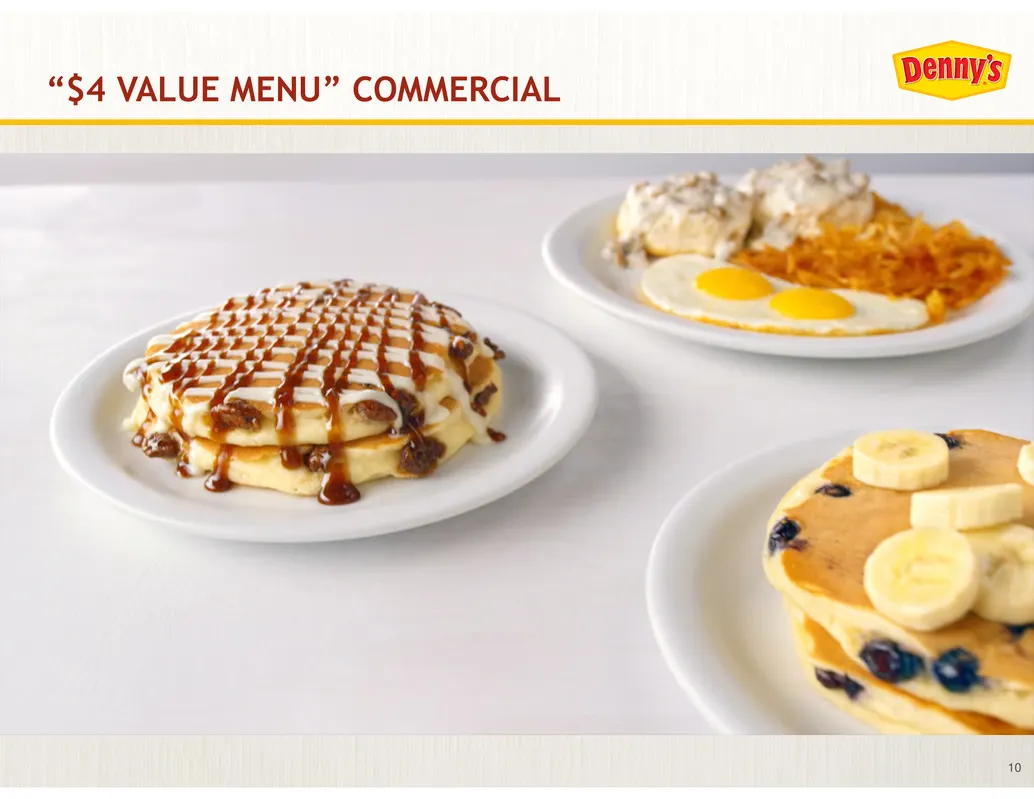
10 “$4 VALUE MENU” COMMERCIAL
Slide 11: Everyday Value Menu Helping to Drive Traffic
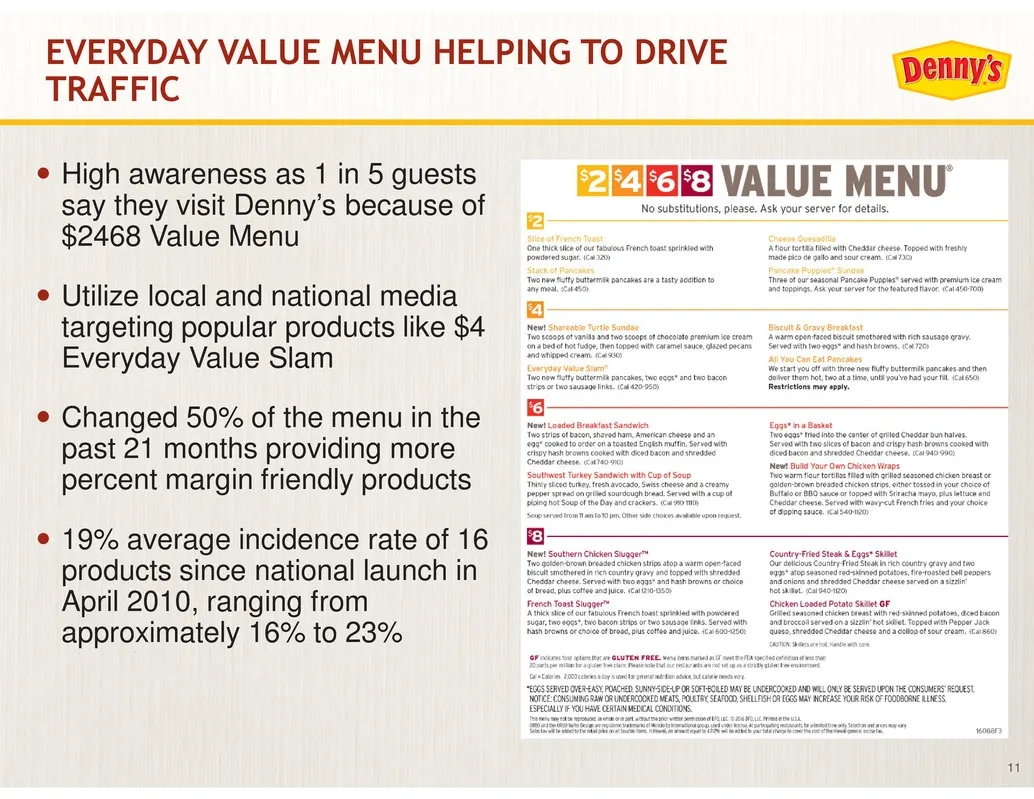
11 EVERYDAY VALUE MENU HELPING TO DRIVE TRAFFIC circle5 High awareness as 1 in 5 guests say they visit Denny’s because of $2468 Value Menu circle5 Utilize local and national media targeting popular products like $4 Everyday Value Slam circle5 Changed 50% of the menu in the past 21 months providing m
Slide 12: Engaging Key Customer Segments Through Traditional and New Media
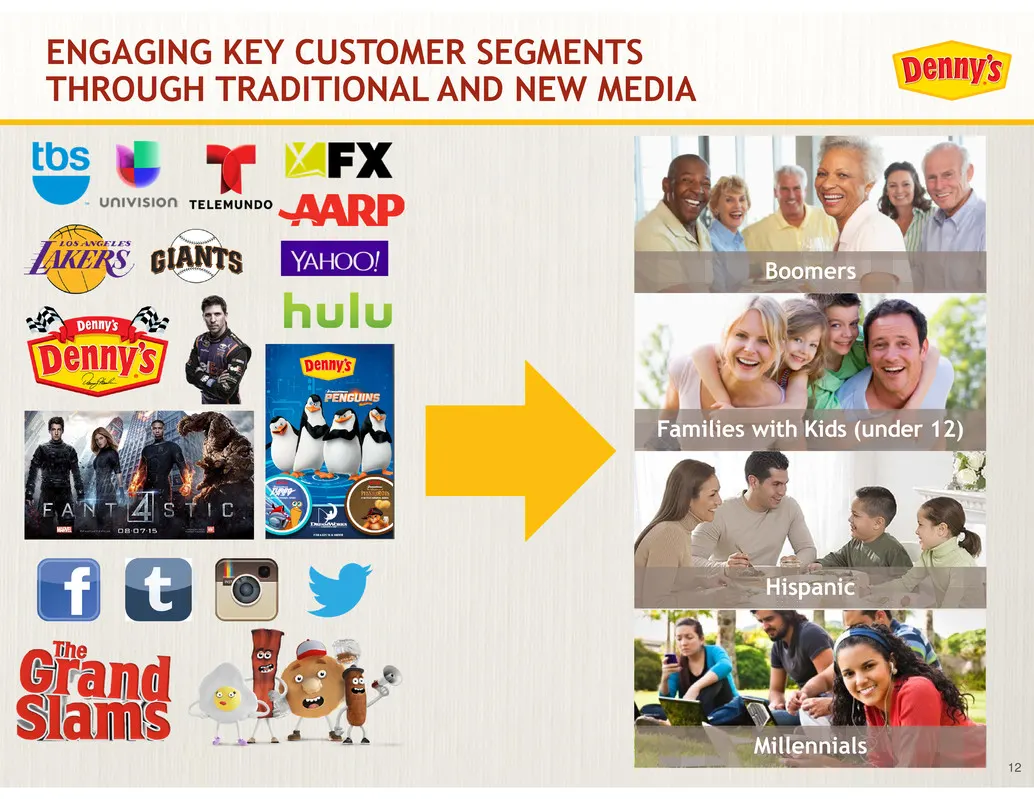
12 ENGAGING KEY CUSTOMER SEGMENTS THROUGH TRADITIONAL AND NEW MEDIA Boomers Families with Kids (under 12) Hispanic Millennials

Slide 13: The Grand Slams "Slammy Reunion" Video
13 THE GRAND SLAMS “SLAMMY REUNION” VIDEO
Slide 14: Remodel Program Enhancing Traffic and Scores
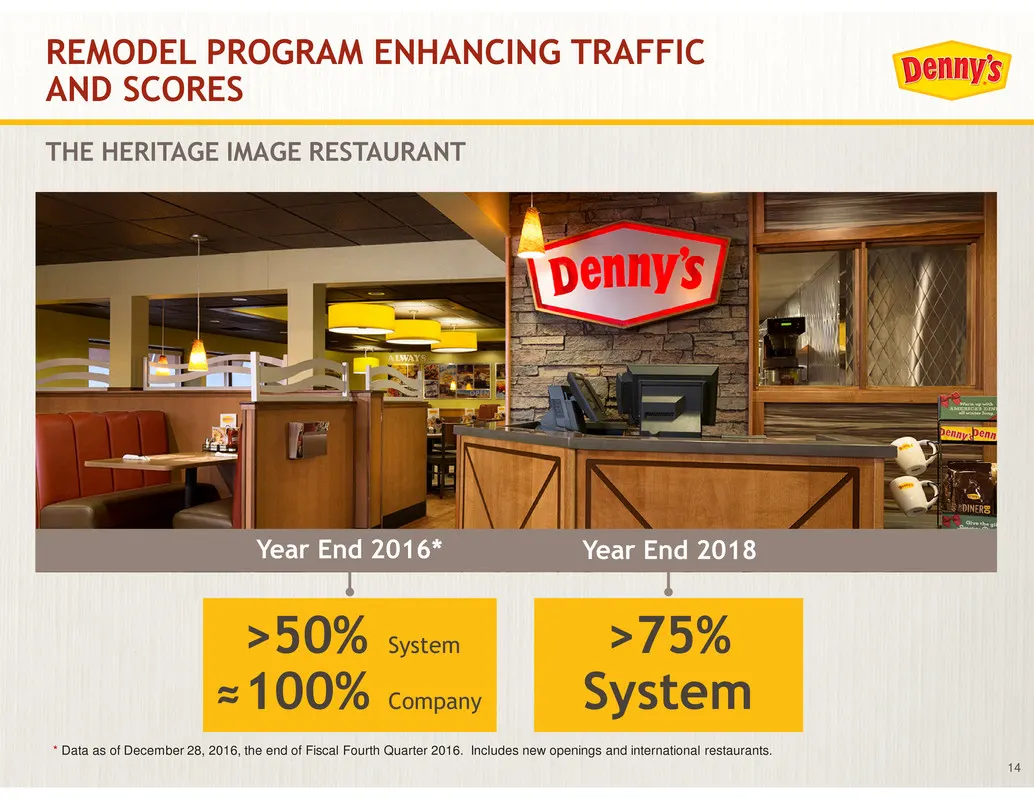
14 >75% System >50% System ≈100% Company REMODEL PROGRAM ENHANCING TRAFFIC AND SCORES THE HERITAGE IMAGE RESTAURANT * Data as of December 28, 2016, the end of Fiscal Fourth Quarter 2016. Includes new openings and international restaurants. Year End 2016* Year End 2018
Slide 15: Heritage Image Key to Revitalizing Legacy Brand
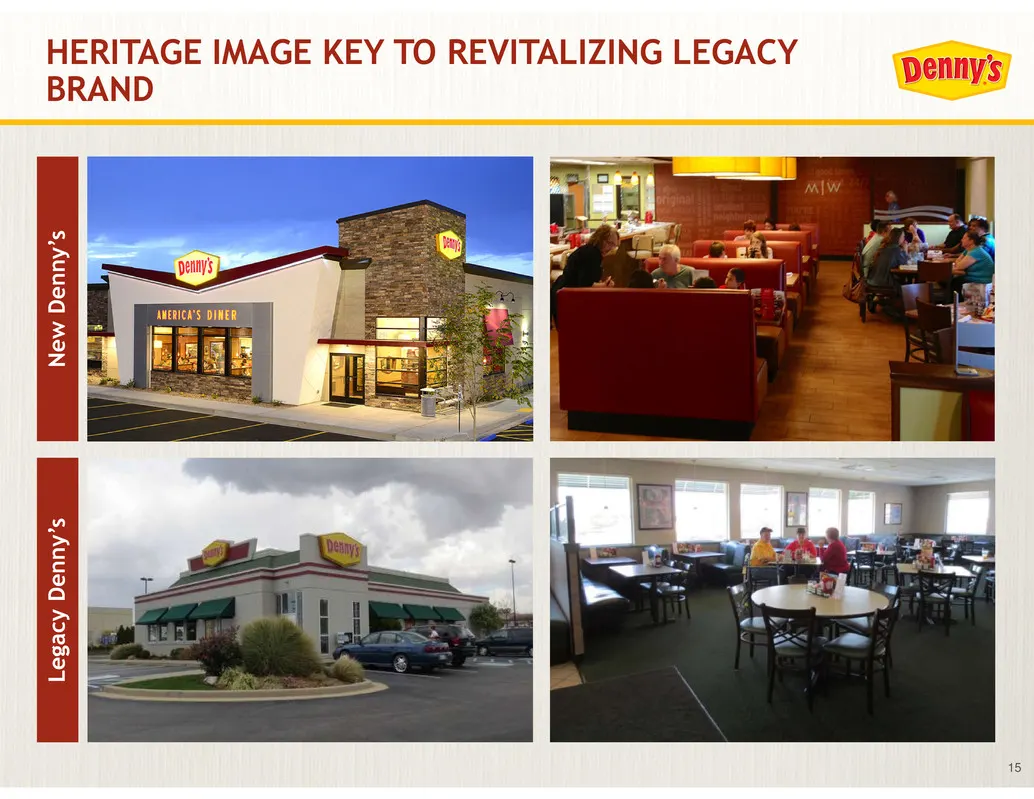
15 HERITAGE IMAGE KEY TO REVITALIZING LEGACY BRAND L e g a c y D e n n y ’ s N e w D e n n y ’ s
Slide 16: Focus on Operating Great Restaurants
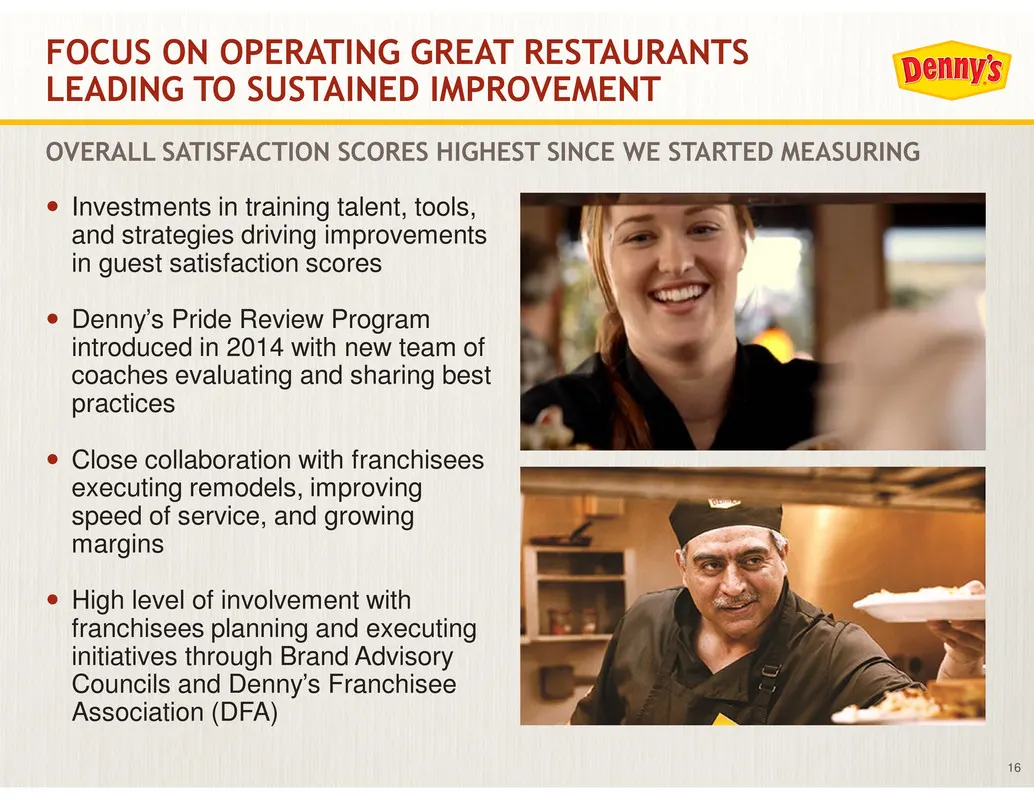
16 circle5 Investments in training talent, tools, and strategies driving improvements in guest satisfaction scores circle5 Denny’s Pride Review Program introduced in 2014 with new team of coaches evaluating and sharing best practices circle5 Close collaboration with franchisees executing remodels, i
Slide 17: Expanding Global Footprint
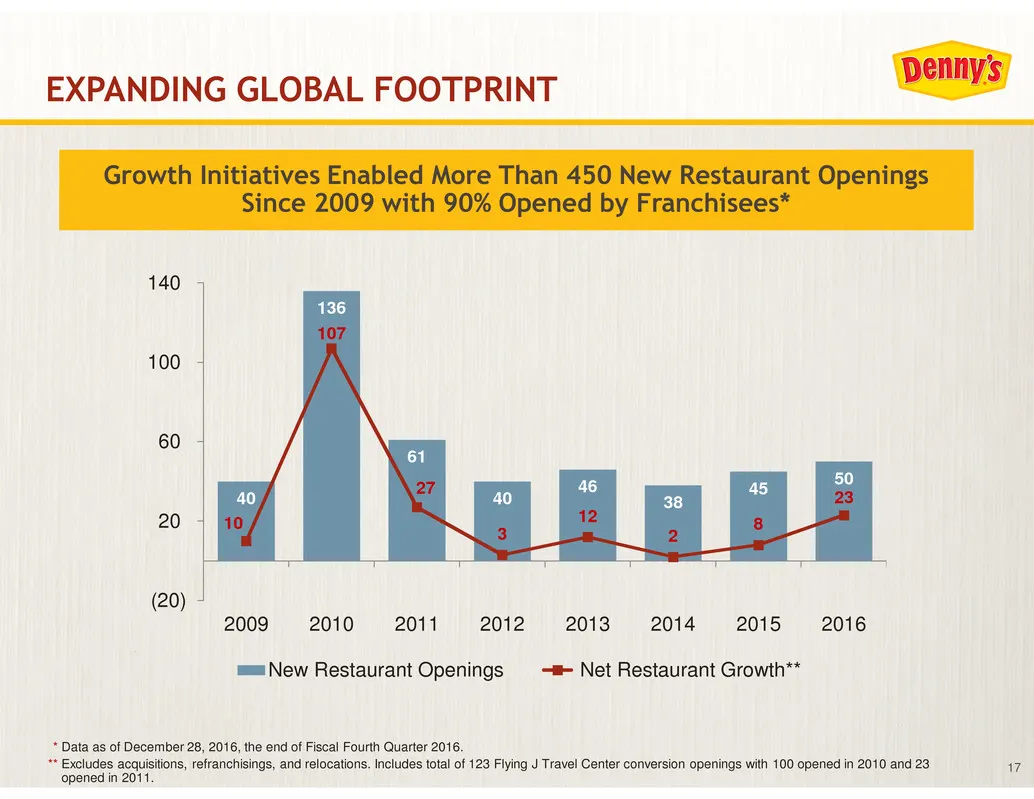
17 EXPANDING GLOBAL FOOTPRINT Growth Initiatives Enabled More Than 450 New Restaurant Openings Since 2009 with 90% Opened by Franchisees* 40 136 61 40 46 38 45 50 10 107 27 3 12 2 8 23 (20) 20 60 100 140 2009 2010 2011 2012 2013 2014 2015 2016 New Restaurant Openings Net Restaurant Growth** * Data a
Slide 18: Domestic Expansion Opportunity: Top 10 U.S. Markets
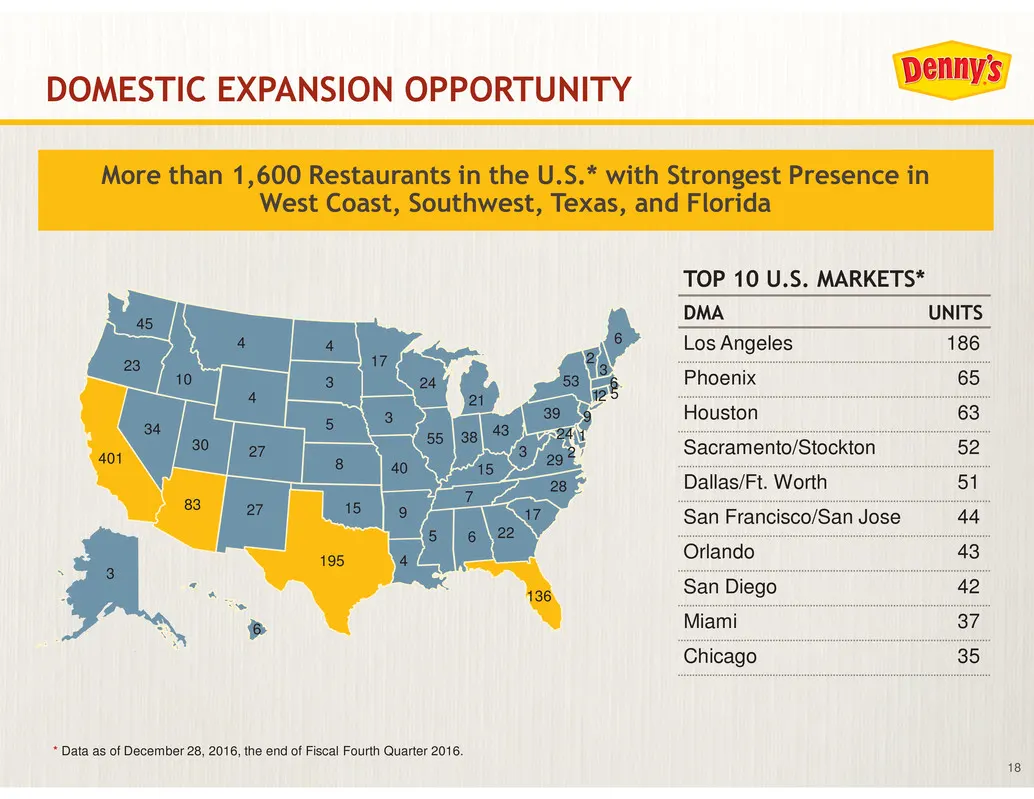
18 401 3 6 23 45 195 2783 34 10 4 4 2730 15 8 5 3 4 17 3 40 9 4 5 6 22 136 17 287 24 55 15 21 38 43 39 3 29 53 6 9 24 1 2 3 12 5 6 2 DOMESTIC EXPANSION OPPORTUNITY TOP 10 U.S. MARKETS* DMA UNITS Los Angeles 186 Phoenix 65 Houston 63 Sacramento/Stockton 52 Dallas/Ft. Worth 51 San Francisco/San Jose 4
Slide 19: Growing Number of International Locations
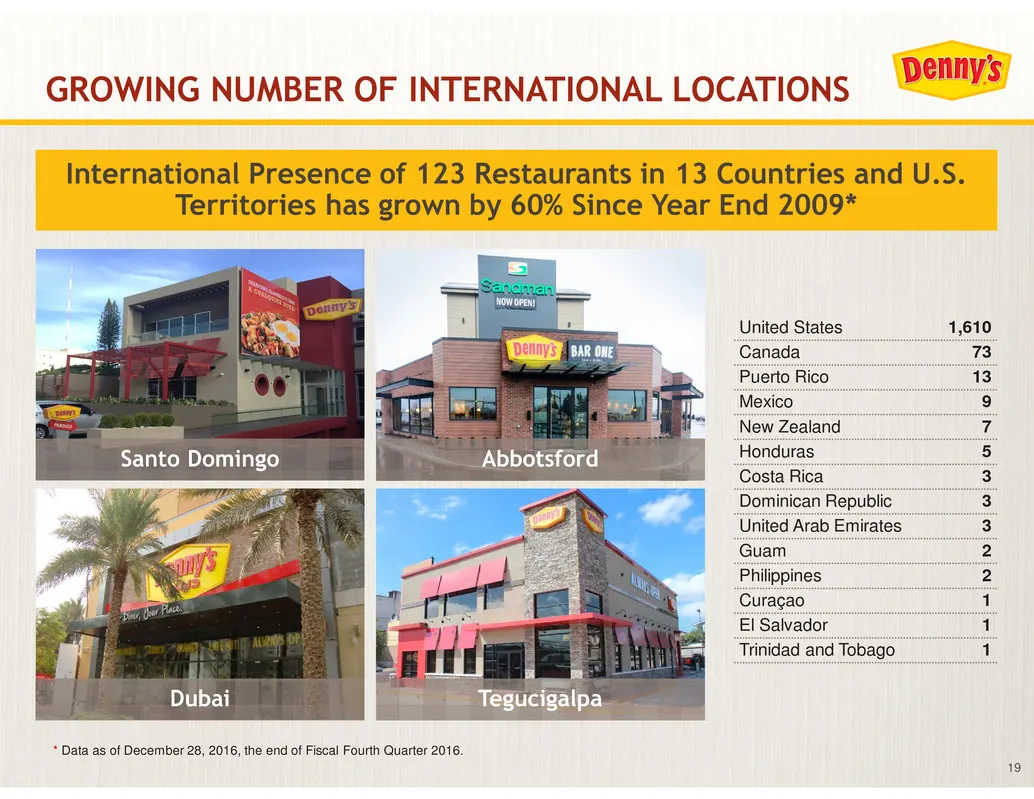
19 GROWING NUMBER OF INTERNATIONAL LOCATIONS United States 1,610 Canada 73 Puerto Rico 13 Mexico 9 New Zealand 7 Honduras 5 Costa Rica 3 Dominican Republic 3 United Arab Emirates 3 Guam 2 Philippines 2 Curaçao 1 El Salvador 1 Trinidad and Tobago 1 International Presence of 123 Restaurants in 13 Coun
Slide 20: Growing Base of Non-Traditional Locations
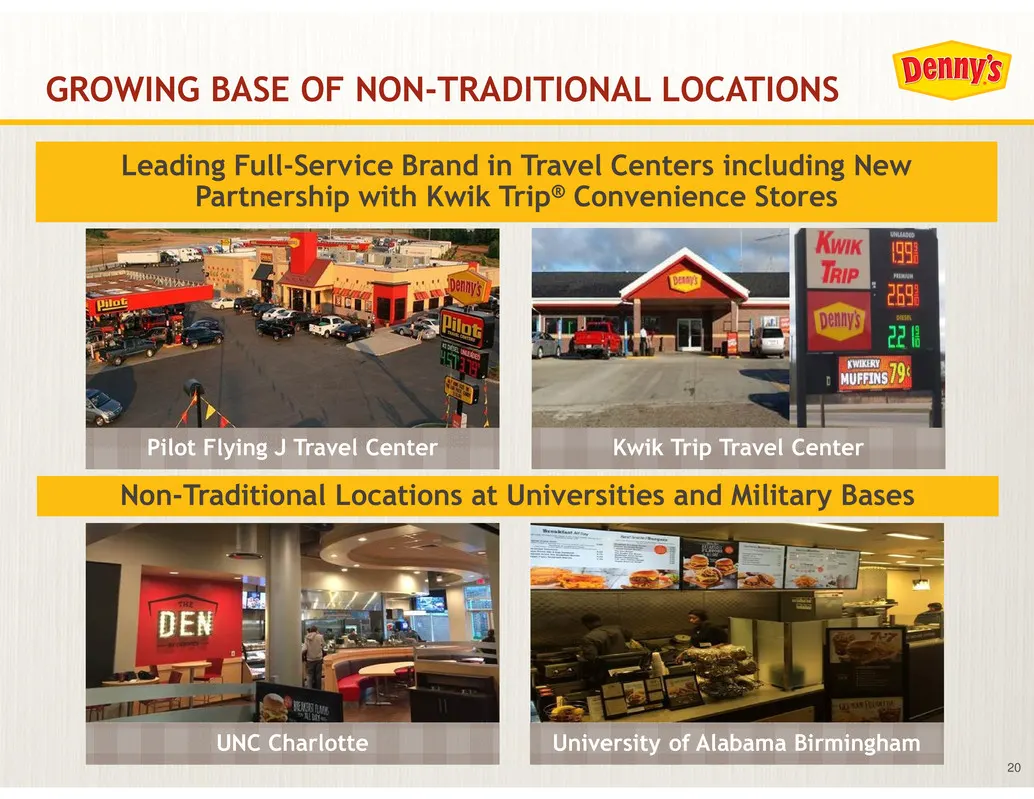
20 GROWING BASE OF NON-TRADITIONAL LOCATIONS Pilot Flying J Travel Center UNC Charlotte Leading Full-Service Brand in Travel Centers including New Partnership with Kwik Trip® Convenience Stores Non-Traditional Locations at Universities and Military Bases Kwik Trip Travel Center University of Alabama
Slide 21: Consistently Growing Same-Store Sales
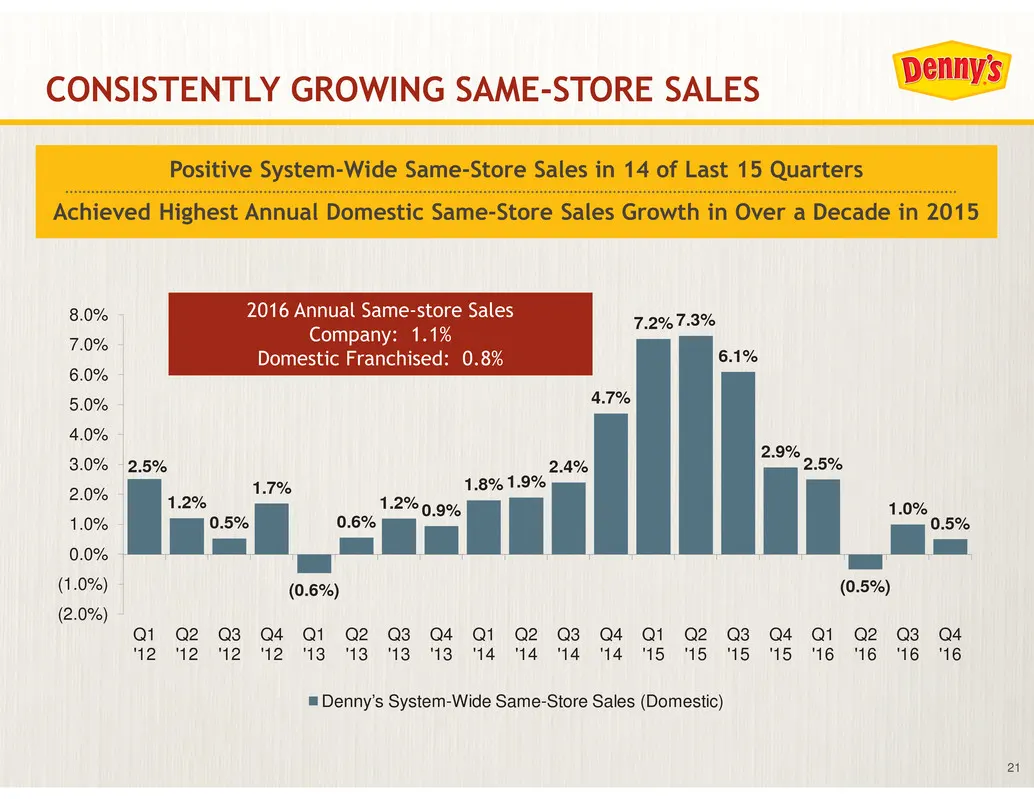
21 CONSISTENTLY GROWING SAME-STORE SALES 2.5% 1.2% 0.5% 1.7% (0.6%) 0.6% 1.2% 0.9% 1.8% 1.9% 2.4% 4.7% 7.2% 7.3% 6.1% 2.9% 2.5% (0.5%) 1.0% 0.5% (2.0%) (1.0%) 0.0% 1.0% 2.0% 3.0% 4.0% 5.0% 6.0% 7.0% 8.0% Q1 '12 Q2 '12 Q3 '12 Q4 '12 Q1 '13 Q2 '13 Q3 '13 Q4 '13 Q1 '14 Q2 '14 Q3 '14 Q4 '14 Q1 '15 Q2 '1
Slide 22: Growing Earnings Per Share
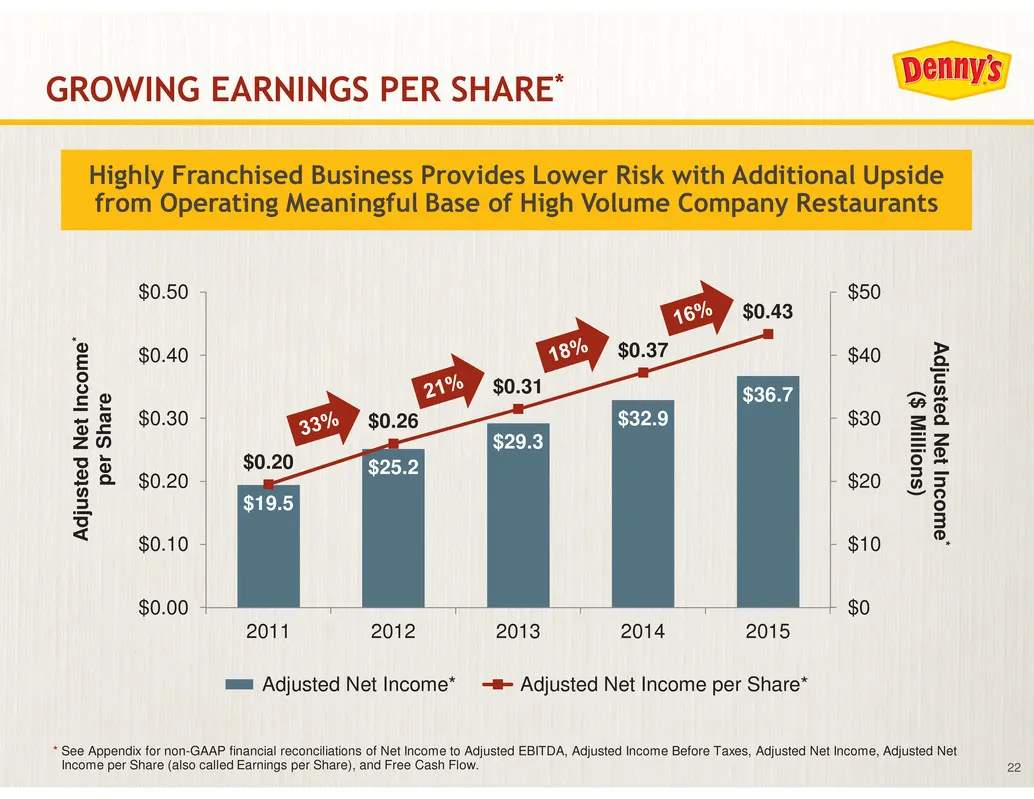
22 GROWING EARNINGS PER SHARE* Highly Franchised Business Provides Lower Risk with Additional Upside from Operating Meaningful Base of High Volume Company Restaurants $19.5 $25.2 $29.3 $32.9 $36.7 $0.20 $0.26 $0.31 $0.37 $0.43 $0 $10 $20 $30 $40 $50 $0.00 $0.10 $0.20 $0.30 $0.40 $0.50 2011 2012 2013
Slide 23: Strong Free Cash Flow Generation
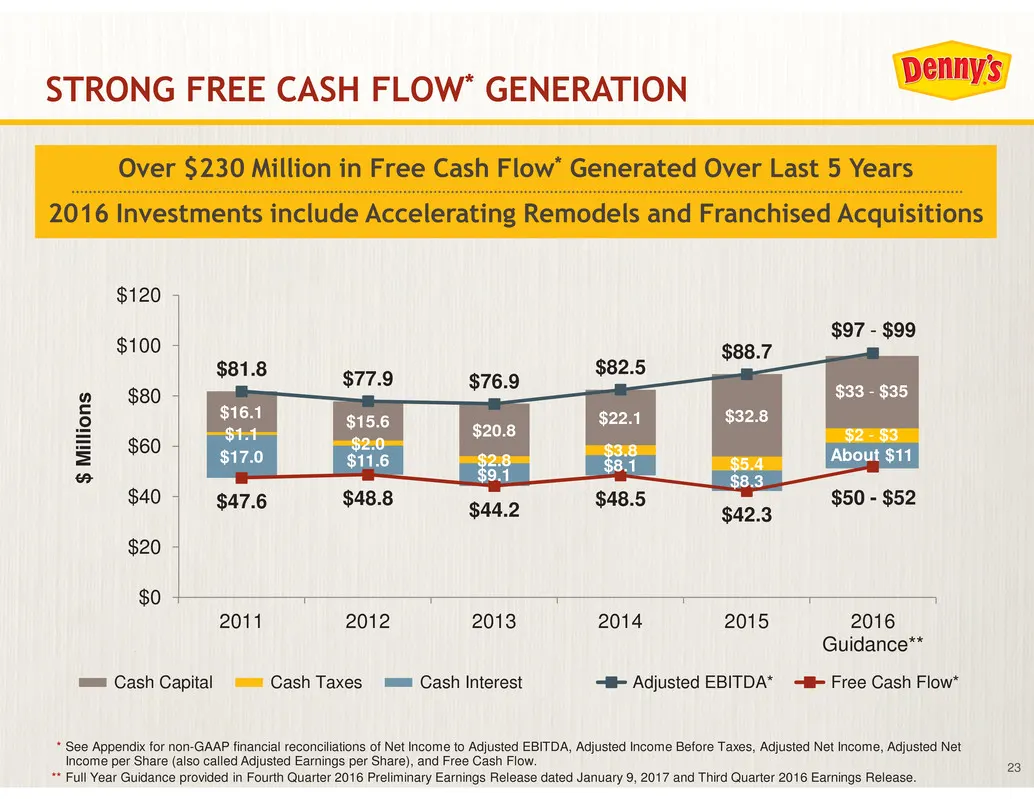
23 $2 - $3 About $11 $33 - $35 STRONG FREE CASH FLOW* GENERATION * See Appendix for non-GAAP financial reconciliations of Net Income to Adjusted EBITDA, Adjusted Income Before Taxes, Adjusted Net Income, Adjusted Net Income per Share (also called Adjusted Earnings per Share), and Free Cash Flow. **
Slide 24: Solid Balance Sheet with Flexibility
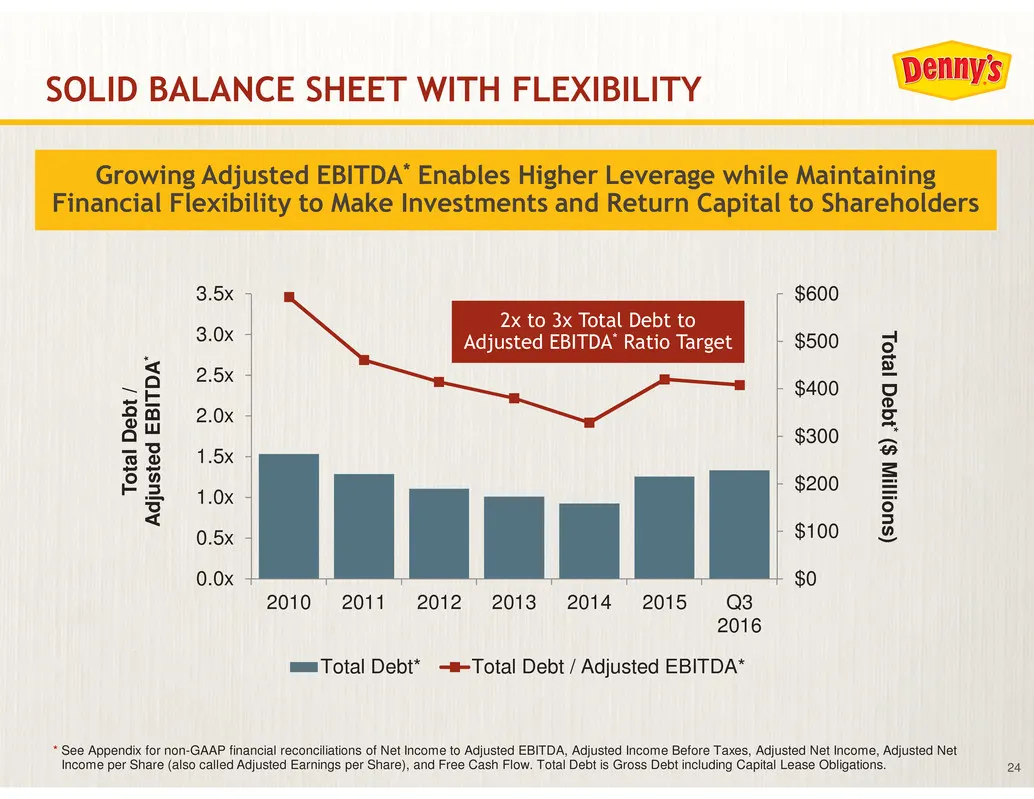
24 SOLID BALANCE SHEET WITH FLEXIBILITY Growing Adjusted EBITDA* Enables Higher Leverage while Maintaining Financial Flexibility to Make Investments and Return Capital to Shareholders 0.0x 0.5x 1.0x 1.5x 2.0x 2.5x 3.0x 3.5x 2010 2011 2012 2013 2014 2015 Q3 2016 $0 $100 $200 $300 $400 $500 $600 T o t
Slide 25: Consistently Returning Excess Capital to Shareholders
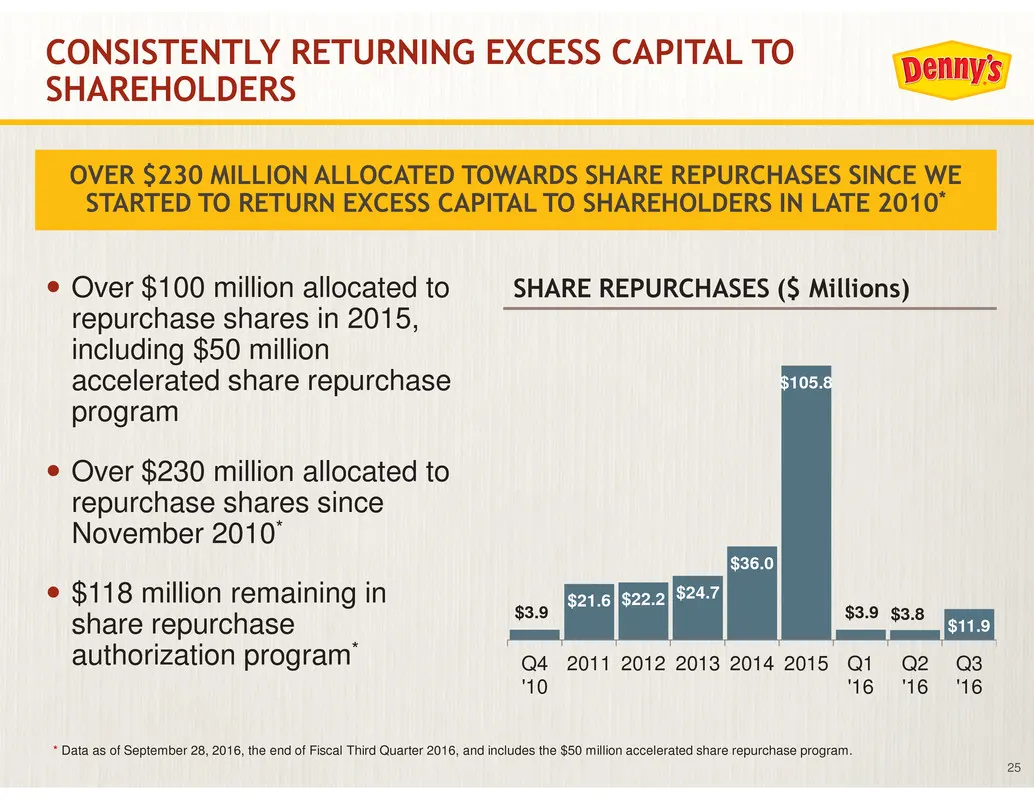
25 circle5 Over $100 million allocated to repurchase shares in 2015, including $50 million accelerated share repurchase program circle5 Over $230 million allocated to repurchase shares since November 2010* circle5 $118 million remaining in share repurchase authorization program* CONSISTENTLY RETURNI
Slide 26: Denny's Investment Highlights
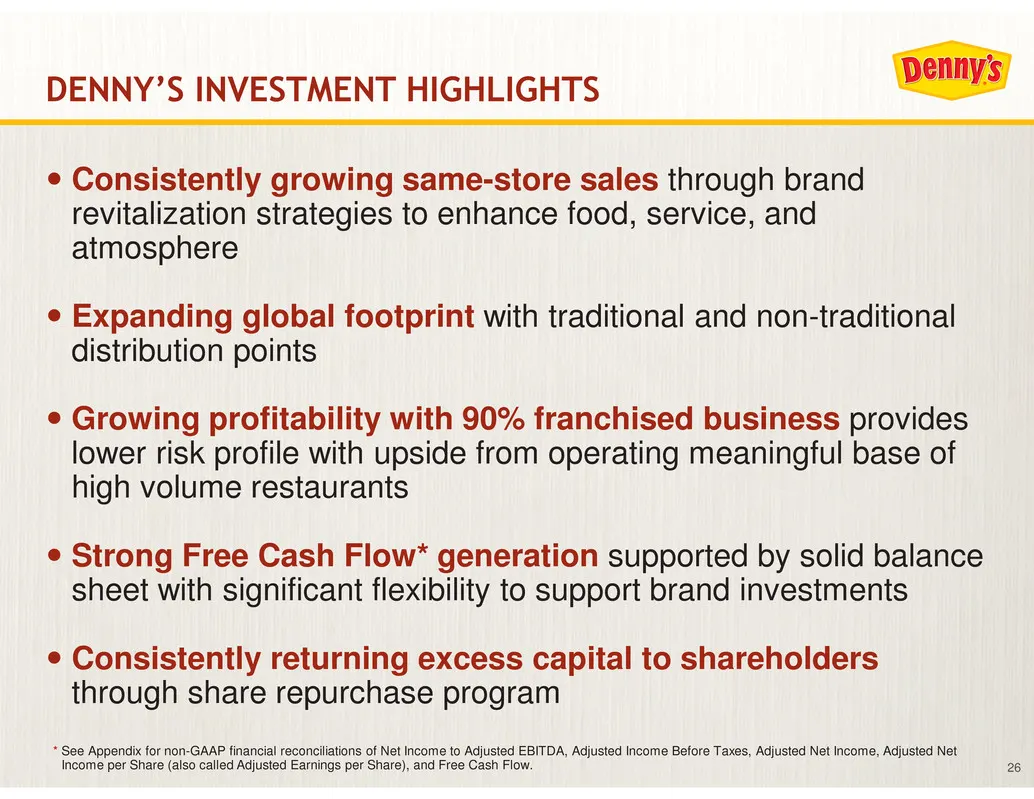
26 circle5 Consistently growing same-store sales through brand revitalization strategies to enhance food, service, and atmosphere circle5 Expanding global footprint with traditional and non-traditional distribution points circle5 Growing profitability with 90% franchised business provides lower risk
Slide 27: Appendix
APPENDIX
Slide 28: Non-GAAP Financial Reconciliations
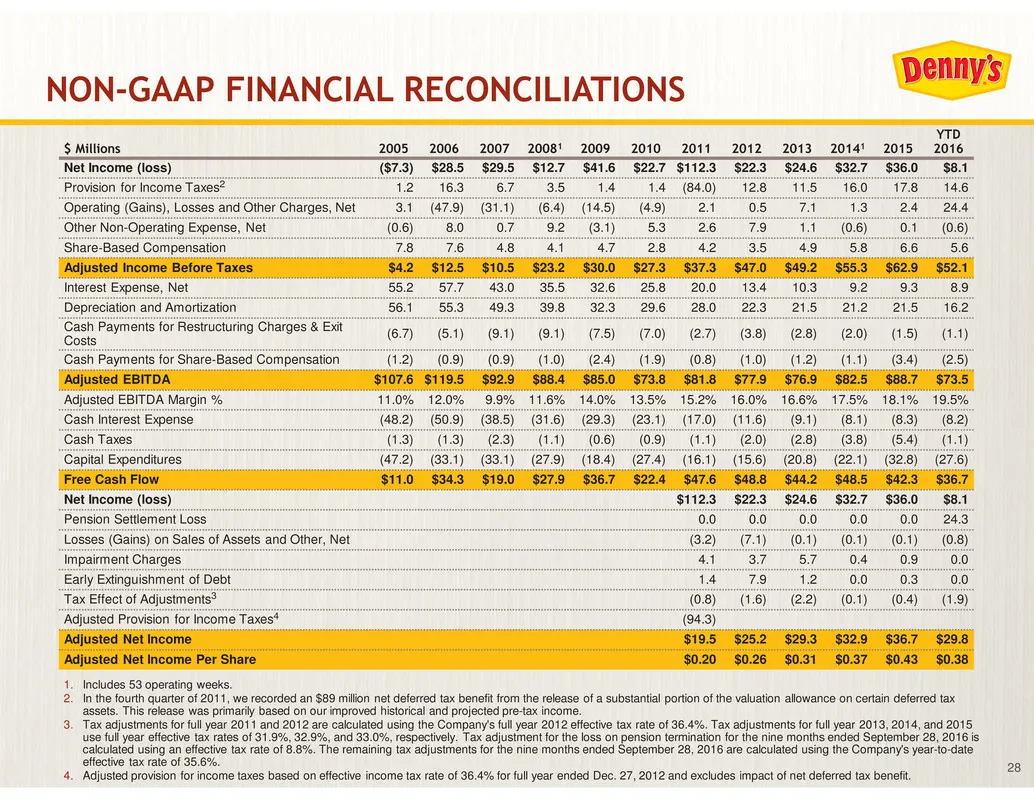
28 NON-GAAP FINANCIAL RECONCILIATIONS 1. Includes 53 operating weeks. 2. In the fourth quarter of 2011, we recorded an $89 million net deferred tax benefit from the release of a substantial portion of the valuation allowance on certain deferred tax assets. This release was primarily based on our imp
Source: SEC EDGAR · 8-K filed Jan 9, 2017
More decks from Dennys Corp
 Investor Presentation (August 2025)30 slides · Aug 4, 2025
 Investor Presentation (May 2025)32 slides · May 2025
 Investor Presentation (February 2025)32 slides · February 2025
 Investor Presentation (January 2025)32 slides · Jan 13, 2025
 Investor Day (October 2024)137 slides · Oct 22, 2024
 Q2 2024 Earnings Presentation22 slides · Jul 30, 2024