Amsouth Bancorporation — Investor Day (May 2004)
110 slides from Amsouth Bancorporation's investor day presentation, May 4, 2004

Slide 1: May Analysts' Meeting: Welcome
MAY ANALYSTS’ MEETING WELCOME! May 4, 2004
Slide 2: Safe Harbor
Safe Harbor Statements made in this document which are not purely historical are forward-looking statements as defined in the “Private Securities Litigation Reform Act of 1995,” including any statements regarding descriptions of management’s plans, objectives or goals for future operations, products

Slide 3: May Analysts' Meeting: Welcome
MAY ANALYSTS’ MEETING WELCOME! May 4, 2004
Slide 4: Strategic Direction 2001-2003
2001 – 2003 Strategic Direction • Focus on execution of a small number of powerful initiatives with high confidence of success • Earnings growth internally generated from revenue growth in core customer businesses • Target high quality earnings with low volatility
Slide 5: Challenging Environment
2001 – 2003 Challenging Environment • Recession and prolonged economic weakness • September 11 • Corporate scandals • Regulatory and legislative changes • Record bankruptcies • Bear market conditions • Rapid decline in interest rates
Slide 6: Performance reflects focused execution of a solid plan
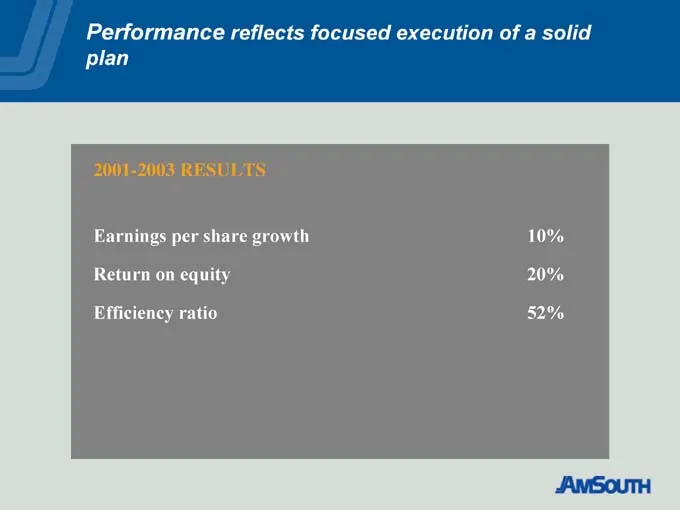
Performance reflects focused execution of a solid plan 2001-2003 RESULTS Earnings per share growth 10% Return on equity 20% Efficiency ratio 52%
Slide 7: Our strategic plan has delivered sustained results
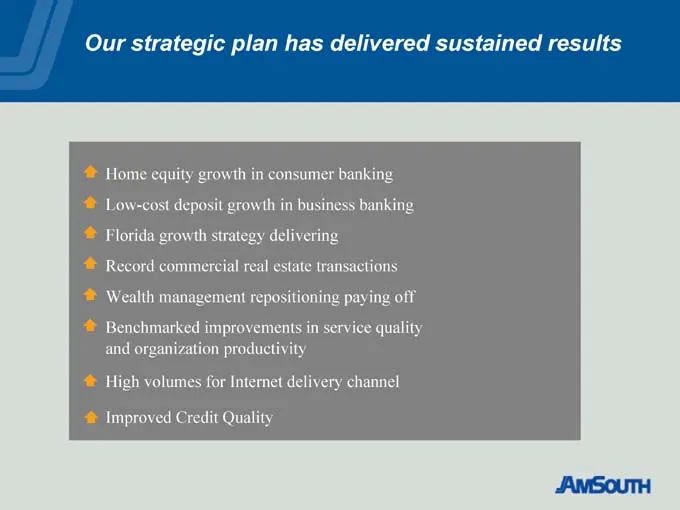
Our strategic plan has delivered sustained results Home equity growth in consumer banking Low-cost deposit growth in business banking Florida growth strategy delivering Record commercial real estate transactions Wealth management repositioning paying off Benchmarked improvements in service quality a
Slide 8: AmSouth outperforms broader markets
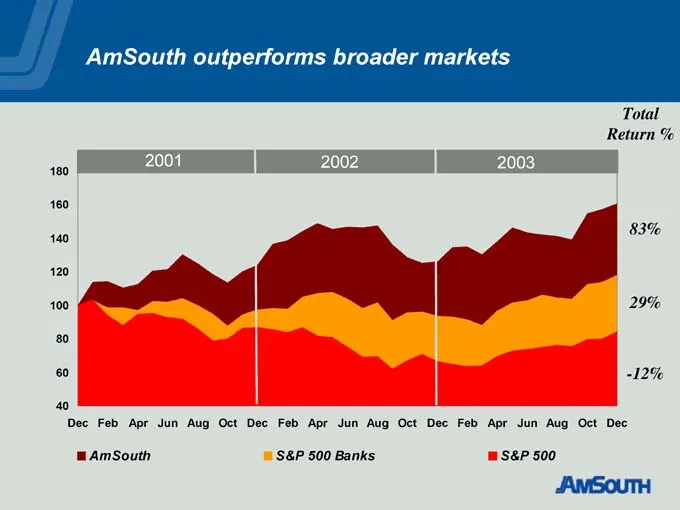
AmSouth outperforms broader markets Total Return % 83% 29% -12% AmSouth S&P 500 Banks S&P 500
Slide 9: Enhancing shareholder wealth
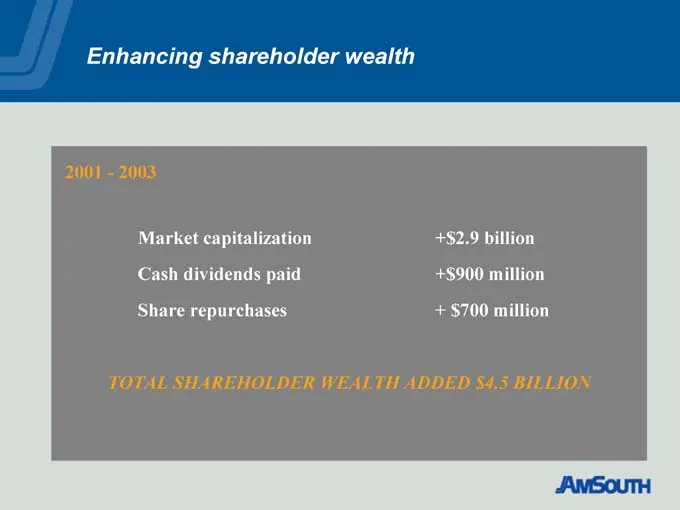
Enhancing shareholder wealth 2001—2003 Market capitalization +$2.9 billion Cash dividends paid +$900 million Share repurchases + $700 million TOTAL SHAREHOLDER WEALTH ADDED $4.5 BILLION
Slide 10: Strategic Initiatives
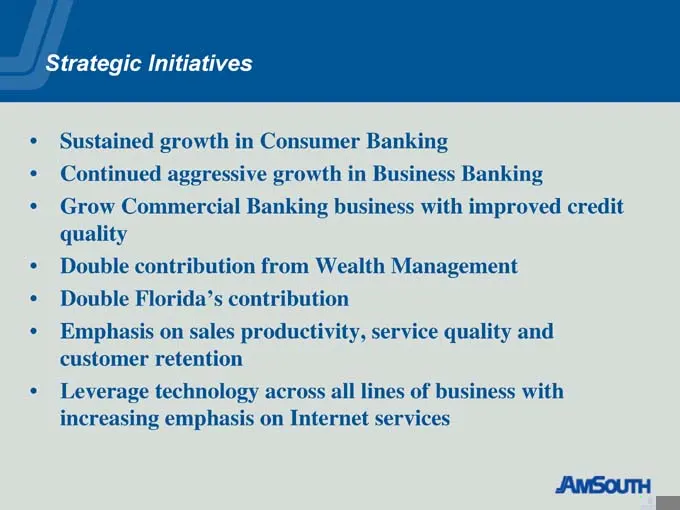
Strategic Initiatives • Sustained growth in Consumer Banking • Continued aggressive growth in Business Banking • Grow Commercial Banking business with improved credit quality • Double contribution from Wealth Management • Double Florida’s contribution • Emphasis on sales productivity, service qualit
Slide 11: Consumer Banking
Consumer Banking Candice Bagby
Slide 12: Current Profile
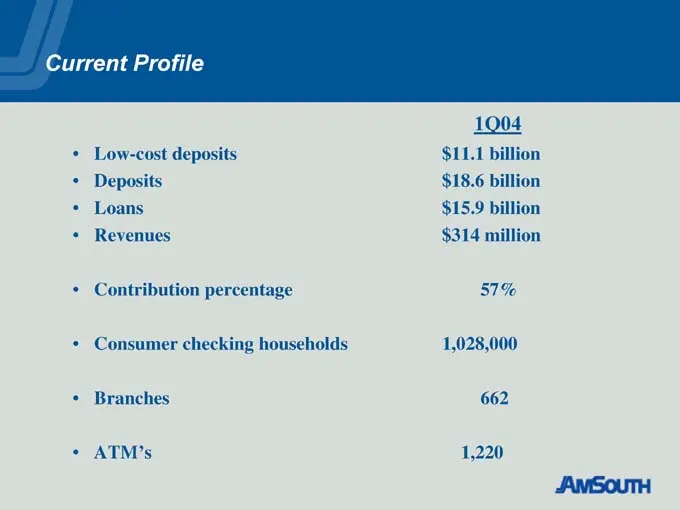
Current Profile 1Q04 • Low-cost deposits $11.1 billion • Deposits $18.6 billion • Loans $15.9 billion • Revenues $314 million • Contribution percentage 57% • Consumer checking households 1,028,000 • Branches 662 • ATM’s 1,220
Slide 13: Strategic Initiative
Strategic Initiative • Sustain Consumer Banking growth and revenue contribution
Slide 14: Major Objectives 2004-2006
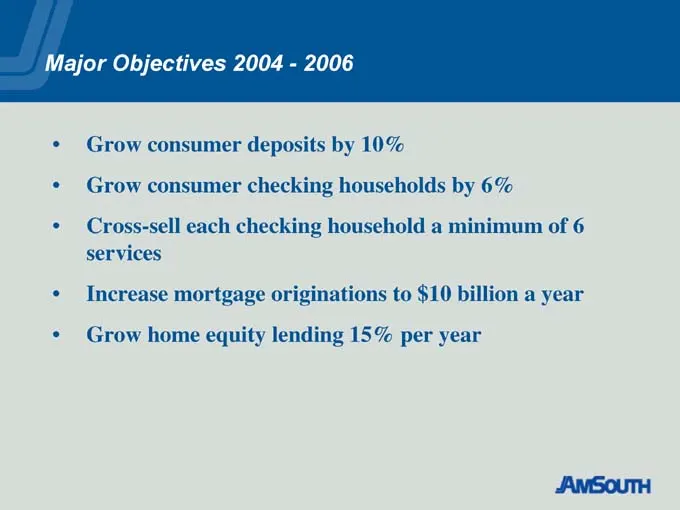
Major Objectives 2004—2006 • Grow consumer deposits by 10% • Grow consumer checking households by 6% • Cross-sell each checking household a minimum of 6 services • Increase mortgage originations to $10 billion a year • Grow home equity lending 15% per year
Slide 15: Why Grow Deposits?
Why Grow Deposits? • There are over $300 billion in deposits in our footprint • We have $19 billion or roughly 6% • Consumers are a great deposit provider – 65% of the bank’s deposits • Cost of consumer deposits is 1.36%
Slide 16: Deposit Growth Tactics
Deposit Growth Tactics • Focus on new customer growth • Focus on expanding existing customer relationships • Expand the branch network • Focus on retention
Slide 17: Why Grow Checking Households?
Why Grow Checking Households? Consumer • There are over 8.5 million households in our footprint • We bank about one million households or 12% of the potential • The average household deposit balance is $14,000 • For every 10,000 customers we grow, we gain $140 million in deposits and significant cro
Slide 18: Checking Household Growth Tactics
Checking Household Growth Tactics • Bank as many people as possible – no turndowns • Advertise our free checking products • Emphasize AmSouth at Work • Cross-sell loan-only customers
Slide 19: Why Cross Sell is Important?
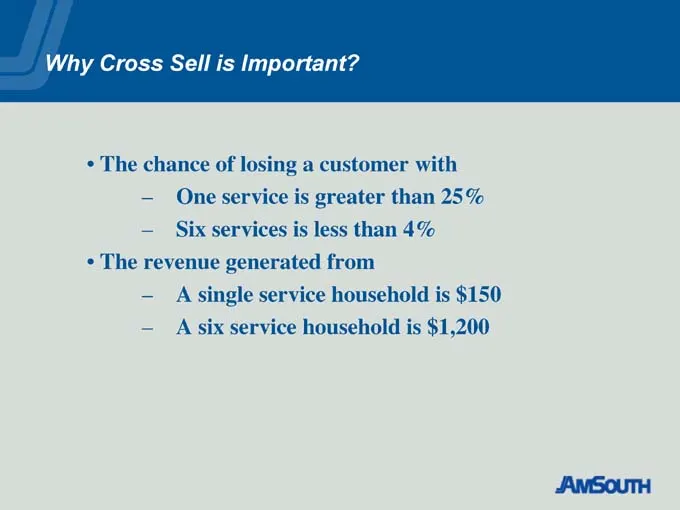
Why Cross Sell is Important? • The chance of losing a customer with – One service is greater than 25% – Six services is less than 4% • The revenue generated from – A single service household is $150 – A six service household is $1,200
Slide 20: Cross Sell Tactics
Cross Sell Tactics • Run cross-sell campaigns using e-mail, direct mail, and outbound telemarketing • Continue to use propensity-to-buy modeling to identify sales opportunities • Invest in next generation sales management and marketing database technology
Slide 21: Why Increase Mortgage Originations?
Why Increase Mortgage Originations? • There are over 5 million homeowners in our footprint • Household growth is projected to be 7.8% in our footprint • It is the consumer’s largest financial purchase • Cross-sell potential is great – our average mortgage customer has over 5 services • Mortgage loan
Slide 22: How Will We Ramp Up Mortgage?
How Will We Ramp Up Mortgage? • Increase originators • Sell mortgages in our branches • Re-engineer the mortgage backroom • Expand loan-by-phone and internet as mortgage distribution channels
Slide 23: Why Grow Home Equity?
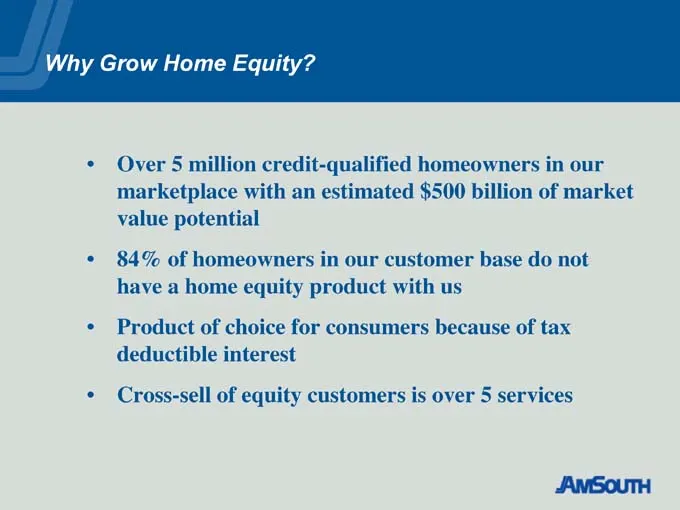
Why Grow Home Equity? • Over 5 million credit-qualified homeowners in our marketplace with an estimated $500 billion of market value potential • 84% of homeowners in our customer base do not have a home equity product with us • Product of choice for consumers because of tax deductible interest • Cro
Slide 24: How Will We Grow Home Equity?
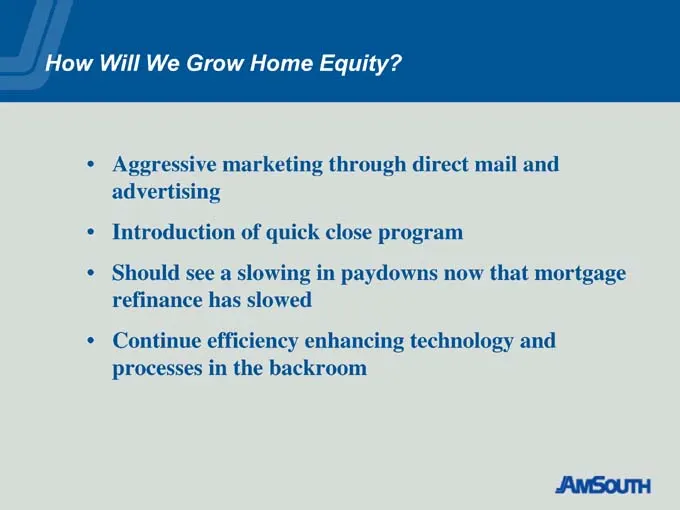
How Will We Grow Home Equity? • Aggressive marketing through direct mail and advertising • Introduction of quick close program • Should see a slowing in paydowns now that mortgage refinance has slowed • Continue efficiency enhancing technology and processes in the backroom
Slide 25: Distribution Channels
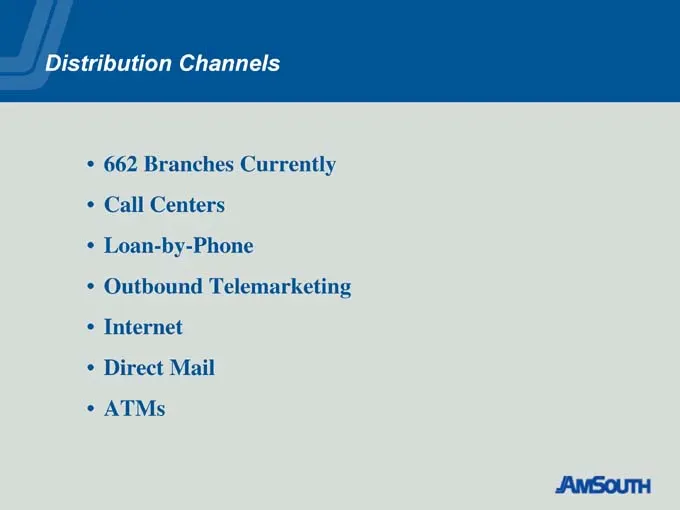
Distribution Channels • 662 Branches Currently • Call Centers • Loan-by-Phone • Outbound Telemarketing • Internet • Direct Mail • ATMs
Slide 26: Credit Quality Metrics
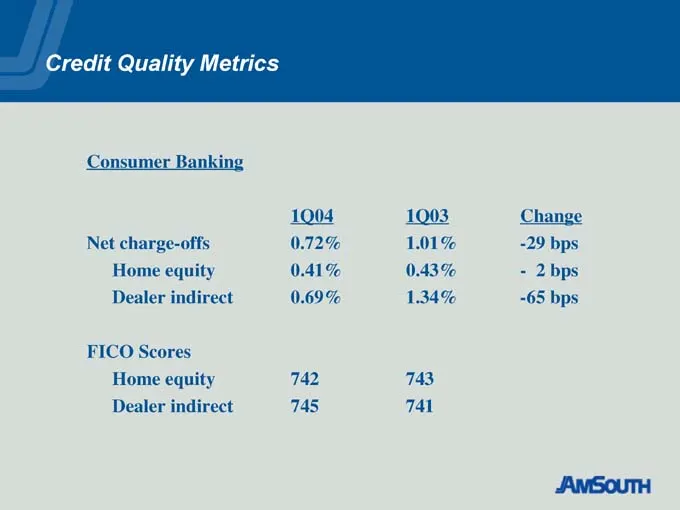
Credit Quality Metrics Consumer Banking 1Q04 1Q03 Change Net charge-offs 0.72% 1.01% -29 bps Home equity 0.41% 0.43% - 2 bps Dealer indirect 0.69% 1.34% -65 bps FICO Scores Home equity 742 743 Dealer indirect 745 741
Slide 27: 1Q04 Performance
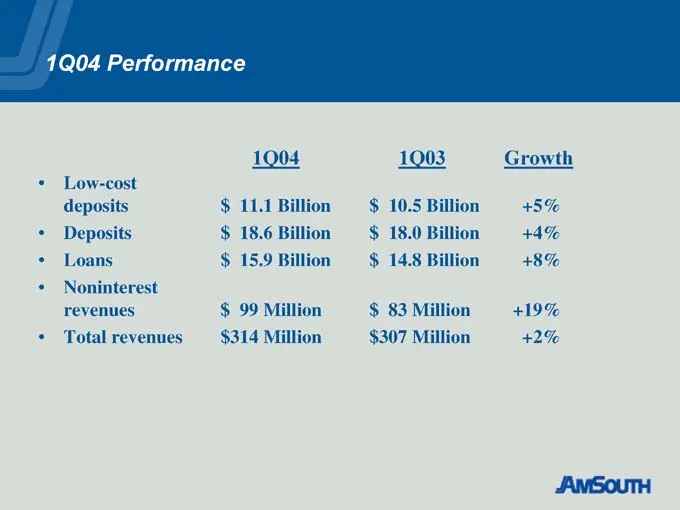
1Q04 Performance 1Q04 1Q03 Growth • Low-cost deposits $ 11.1 Billion $ 10.5 Billion +5% • Deposits $ 18.6 Billion $ 18.0 Billion +4% • Loans $ 15.9 Billion $ 14.8 Billion +8% • Noninterest revenues $ 99 Million $ 83 Million +19% • Total revenues $314 Million $307 Million +2%

Slide 28: Business Banking
Business Banking Candice Bagby
Slide 29: Current Profile
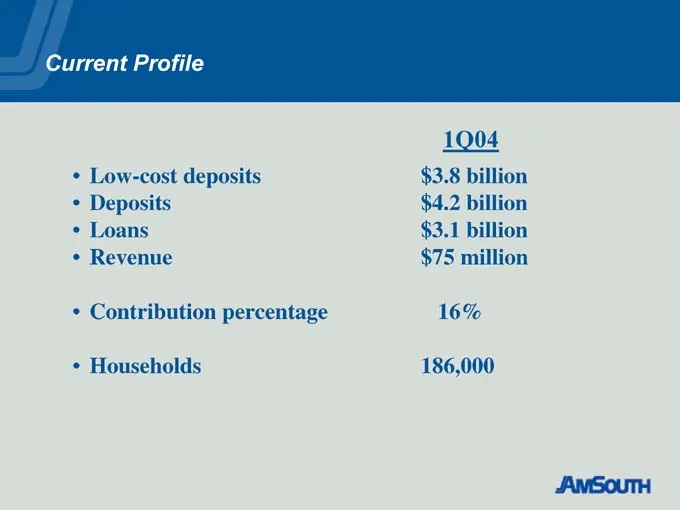
Current Profile 1Q04 • Low-cost deposits $3.8 billion • Deposits $4.2 billion • Loans $3.1 billion • Revenue $75 million • Contribution percentage 16% • Households 186,000
Slide 30: Strategic Initiative
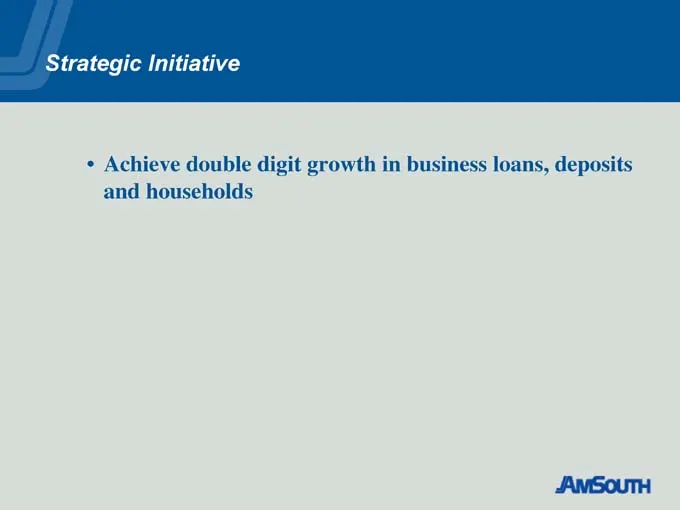
Strategic Initiative • Achieve double digit growth in business loans, deposits and households
Slide 31: Major Objectives 2004-2006
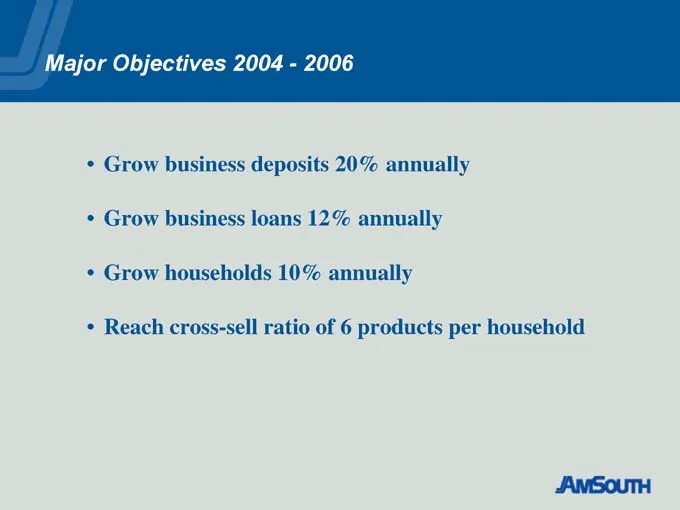
Major Objectives 2004—2006 • Grow business deposits 20% annually • Grow business loans 12% annually • Grow households 10% annually • Reach cross-sell ratio of 6 products per household
Slide 32: Why Grow Business Banking?
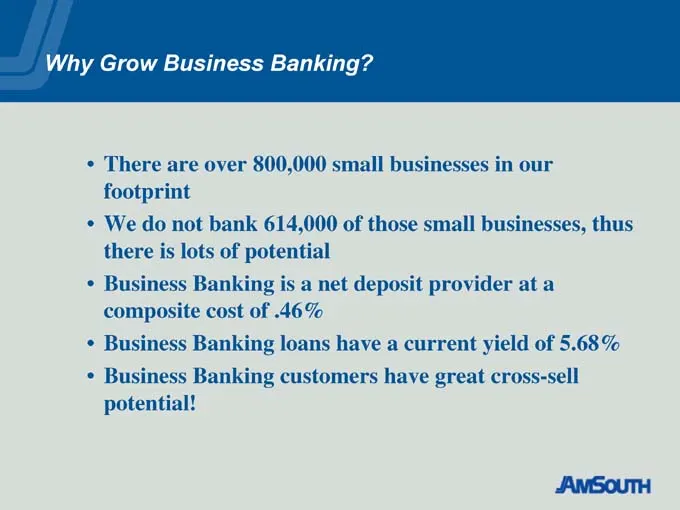
Why Grow Business Banking? • There are over 800,000 small businesses in our footprint • We do not bank 614,000 of those small businesses, thus there is lots of potential • Business Banking is a net deposit provider at a composite cost of .46% • Business Banking loans have a current yield of 5.68% •
Slide 33: Business Banking Growth Strategies
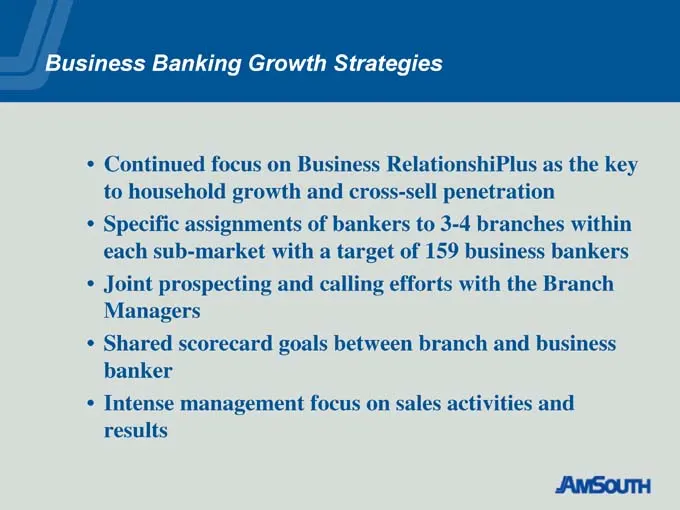
Business Banking Growth Strategies • Continued focus on Business RelationshiPlus as the key to household growth and cross-sell penetration • Specific assignments of bankers to 3-4 branches within each sub-market with a target of 159 business bankers • Joint prospecting and calling efforts with the B
Slide 34: 1Q04 Performance
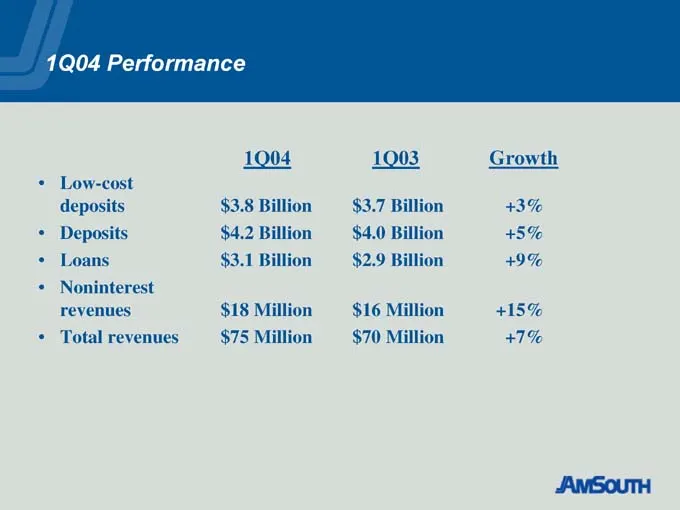
1Q04 Performance 1Q04 1Q03 Growth • Low-cost deposits $3.8 Billion $3.7 Billion +3% • Deposits $4.2 Billion $4.0 Billion +5% • Loans $3.1 Billion $2.9 Billion +9% • Noninterest revenues $18 Million $16 Million +15% • Total revenues $75 Million $70 Million +7%

Slide 35: Commercial Banking
Commercial Banking John Gaffney
Slide 36: Current Profile: Commercial Banking
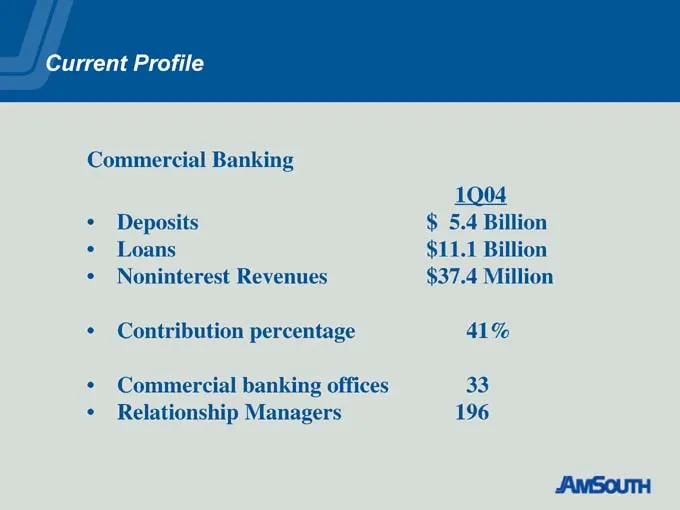
Current Profile Commercial Banking 1Q04 • Deposits $ 5.4 Billion • Loans $11.1 Billion • Noninterest Revenues $37.4 Million • Contribution percentage 41% • Commercial banking offices 33 • Relationship Managers 196
Slide 37: Strategic Initiative
Strategic Initiative “Grow Commercial Banking with Improved Credit Quality” Balanced Growth
Slide 38: Financial Drivers 2004-2006
Financial Drivers 2004—2006 • Consistent revenue growth of at least 10% annually • Maintain credit losses below .25% • Maintain operating leverage
Slide 39: Strategic Plan 2004-2006
Strategic Plan 2004-2006 Strengths / Opportunities – Proven Business Models – Infrastructure can support growth – Moderate to low market share – Florida Expansion – Good Credit Quality
Slide 40: Major Objectives 2004-2006
Major Objectives 2004—2006 • Expand the sales force and product line for Commercial Middle Market and Commercial Real Estate • Improve sales productivity in all segments • Improve the credit process and credit quality
Slide 41: Major Objectives: Expand Sales Force and Product Line
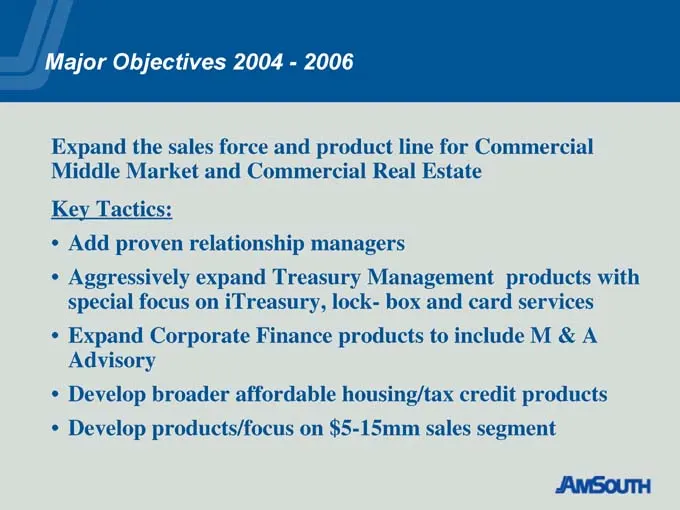
Major Objectives 2004—2006 Expand the sales force and product line for Commercial Middle Market and Commercial Real Estate Key Tactics: • Add proven relationship managers • Aggressively expand Treasury Management products with special focus on iTreasury, lock- box and card services • Expand Corporat
Slide 42: Major Objectives: Improve Sales Productivity
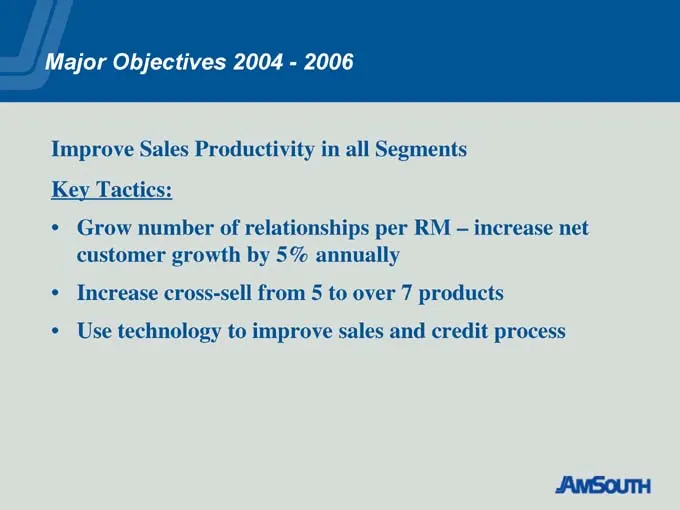
Major Objectives 2004—2006 Improve Sales Productivity in all Segments Key Tactics: • Grow number of relationships per RM – increase net customer growth by 5% annually • Increase cross-sell from 5 to over 7 products • Use technology to improve sales and credit process
Slide 43: Major Objectives: Improve Credit Process and Quality
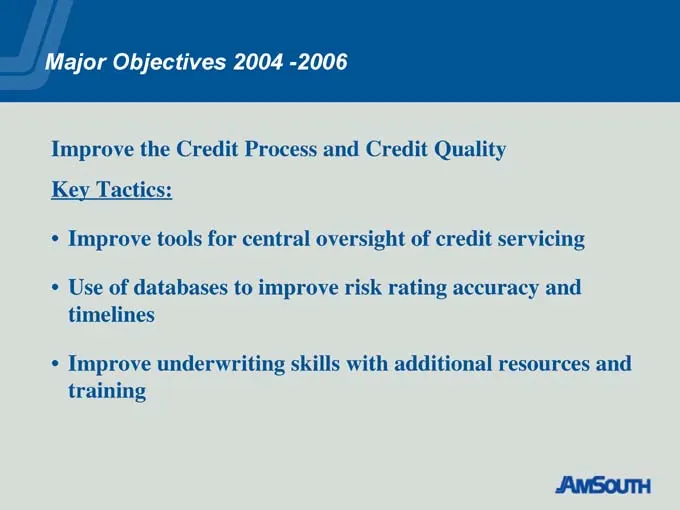
Major Objectives 2004 -2006 Improve the Credit Process and Credit Quality Key Tactics: • Improve tools for central oversight of credit servicing • Use of databases to improve risk rating accuracy and timelines • Improve underwriting skills with additional resources and training
Slide 44: 1Q04 Performance
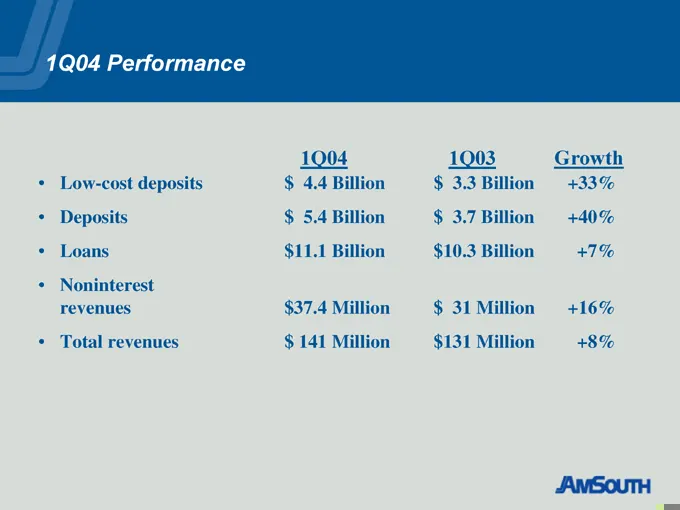
1Q04 Performance 1Q04 1Q03 Growth • Low-cost deposits $ 4.4 Billion $ 3.3 Billion +33% • Deposits $ 5.4 Billion $ 3.7 Billion +40% • Loans $11.1 Billion $10.3 Billion +7% • Noninterest revenues $ 37.4 Million $ 32.2 Million +17% • Total revenues $141 Million $131 Million +8%
Slide 45: Credit Quality Metrics
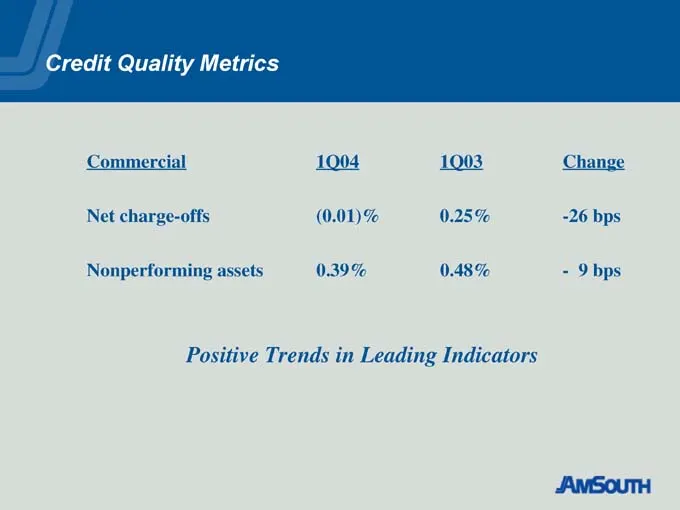
Credit Quality Metrics Commercial 1Q04 1Q03 Change Net charge-offs (0.01)% 0.25% -26 bps Nonperforming assets 0.39% 0.48% - 9 bps Positive Trends in Leading Indicators

Slide 46: Wealth Management
Wealth Management Geoff von Kuhn
Slide 47: Current Profile: Revenues
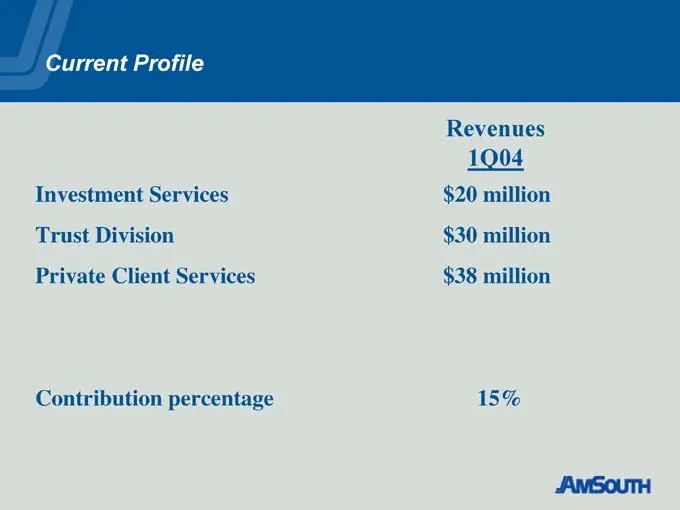
Current Profile Revenues 1Q04 Investment Services $20 million Trust Division $30 million Private Client Services $38 million Contribution percentage 15%
Slide 48: Current Profile: Assets, Households, Sales Force
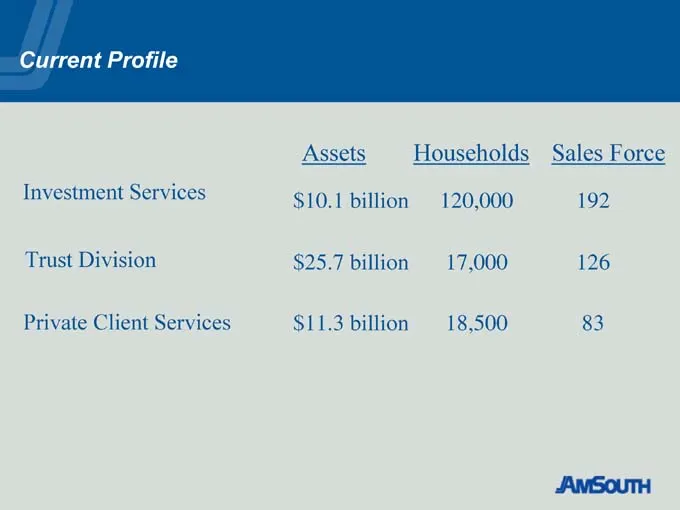
Current Profile Assets Households Sales Force Investment Services $10.1 billion 120,000 192 Trust Division $25.7 billion 17,000 126 Private Client Services $11.3 billion 18,500 83
Slide 49: Strategic Initiative
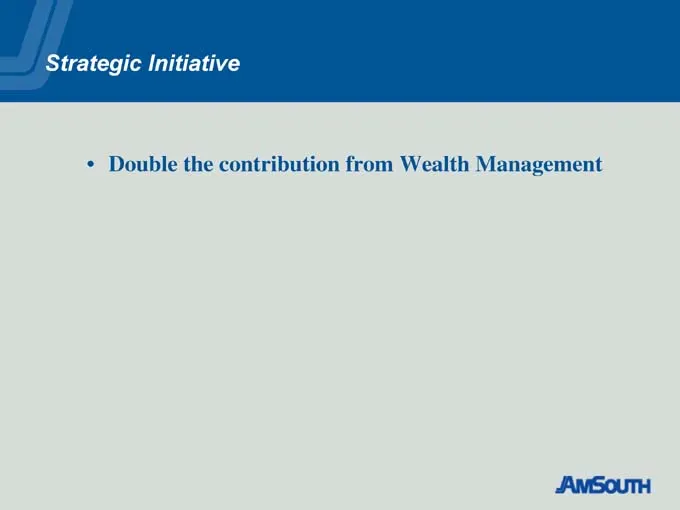
Strategic Initiative • Double the contribution from Wealth Management
Slide 50: Why Wealth Management: Household Growth Opportunity
“Why Wealth Management” Household Growth Opportunity ? Wealth Management Currently Has… – 18,500 Private Client Service households – 17,700 Trust accounts (includes 1200 Institutional accounts) – 120,000 AIS households ? AmSouth Currently Has… – 127,000 households with $125,000 in income or $500,000
Slide 51: Why Wealth Management
“Why Wealth Management” • Profitable business line with low capital requirements • Top ranked, nationally recognized Asset Management capabilities • Top reputation in long established Trust products and services • Rebuilt and expanded infrastructure
Slide 52: Major Objectives 2004-2006
Major Objectives 2004—2006 • Grow Private Client households a minimum of 25% per year • Grow Trust and Investment Management revenues at double digit rates each year • Over the next three years, produce an annual compounded growth rate of 23% in Investment Services revenues • Continue to grow other
Slide 53: Expand Private Client Households - Key Tactics
Expand Private Client Households – Key Tactics • Aggressively work existing AmSouth customers that meet the Private Client profile • Manage aggressive calling campaigns, internally & externally • Grow internal referrals and continue to improve the follow-up sales activity • Add Private Client Relati
Slide 54: Grow Trust and Investment Management - Key Tactics
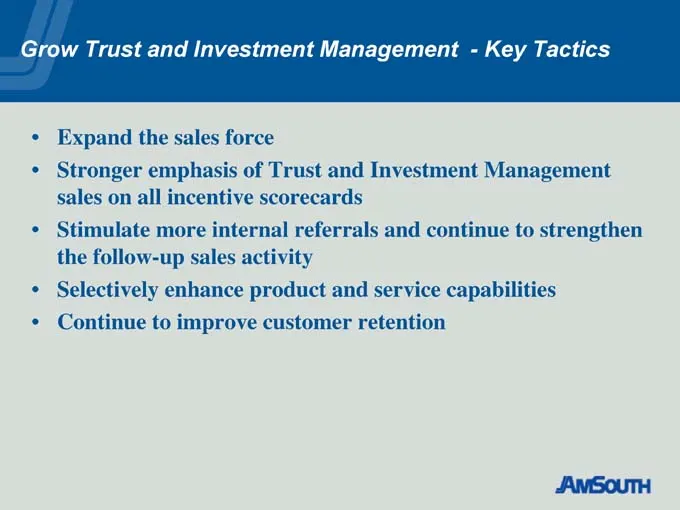
Grow Trust and Investment Management—Key Tactics • Expand the sales force • Stronger emphasis of Trust and Investment Management sales on all incentive scorecards • Stimulate more internal referrals and continue to strengthen the follow-up sales activity • Selectively enhance product and service cap
Slide 55: Grow Investment Services Revenues - Key Tactics
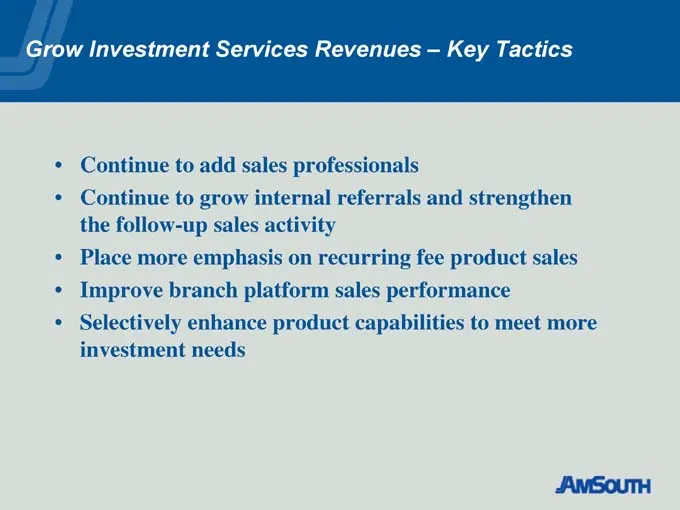
Grow Investment Services Revenues – Key Tactics • Continue to add sales professionals • Continue to grow internal referrals and strengthen the follow-up sales activity • Place more emphasis on recurring fee product sales • Improve branch platform sales performance • Selectively enhance product capab
Slide 56: 1Q04 Performance
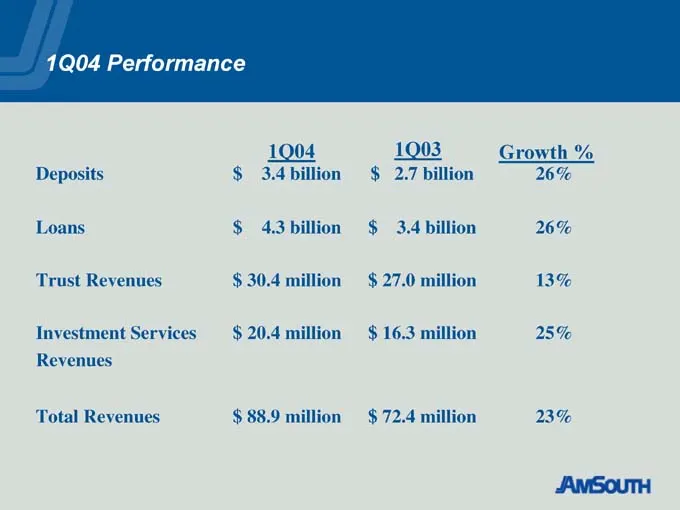
1Q04 Performance 1Q04 1Q03 Growth % Deposits $ 3.4 billion $ 2.7 billion 26% Loans $ 4.3 billion $ 3.4 billion 26% Trust Revenues $ 30.4 million $ 27.0 million 13% Investment Services $ 20.4 million $ 16.3 million 25% Revenues Total Revenues $ 88.9 million $ 72.4 million 23%

Slide 57: Florida
Florida Susan Martinez
Slide 58: Florida Strategic Initiative
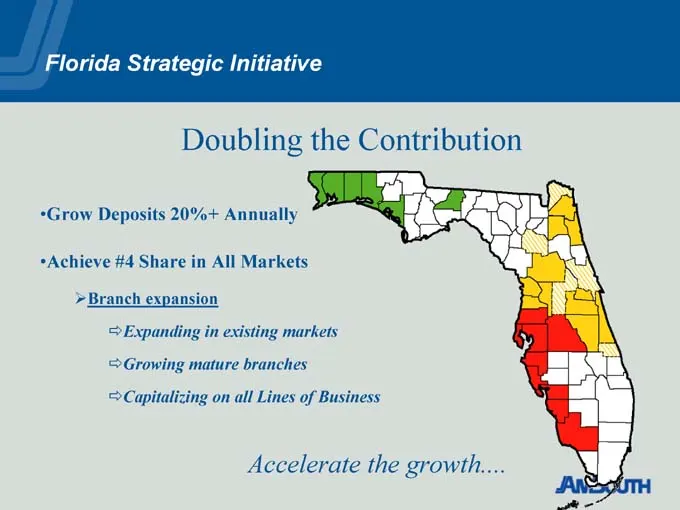
Florida Strategic Initiative Doubling the Contribution •Grow Deposits 20%+ Annually •Achieve #4 Share in All Markets Branch expansion OExpanding in existing markets OGrowing mature branches OCapitalizing on all Lines of Business Accelerate the growth
Slide 59: Florida Opportunity
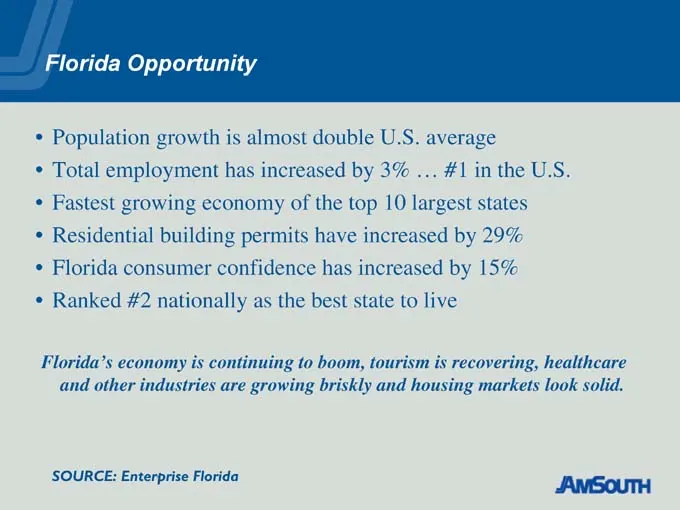
Florida Opportunity • Population growth is almost double U.S. average • Total employment has increased by 3% … #1 in the U.S. • Fastest growing economy of the top 10 largest states • Residential building permits have increased by 29% • Florida consumer confidence has increased by 15% • Ranked #2 nat
Slide 60: Florida Profile
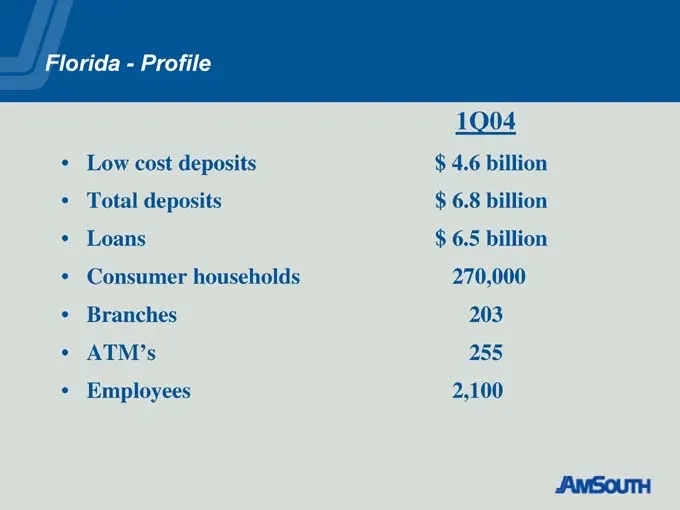
Florida—Profile 1Q04 • Low cost deposits $ 4.6 billion • Total deposits $ 6.8 billion • Loans $ 6.5 billion • Consumer households 270,000 • Branches 203 • ATM’s 255 • Employees 2,100
Slide 61: Florida Branch Network
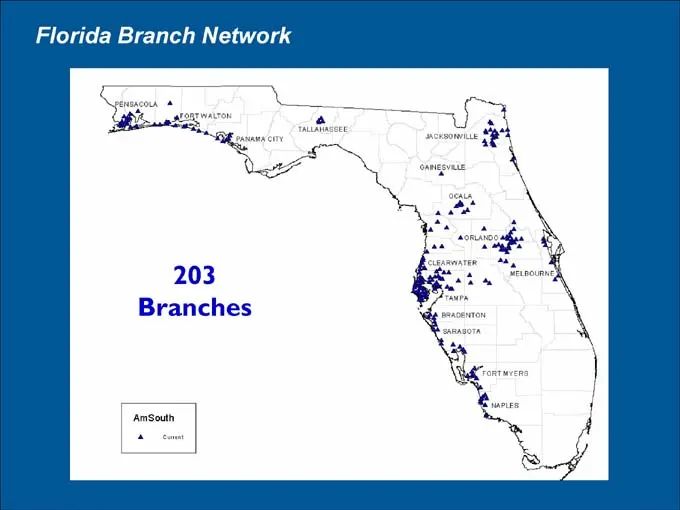
Florida Branch Network 203 Branches
Slide 62: Accelerate the Growth in Branches
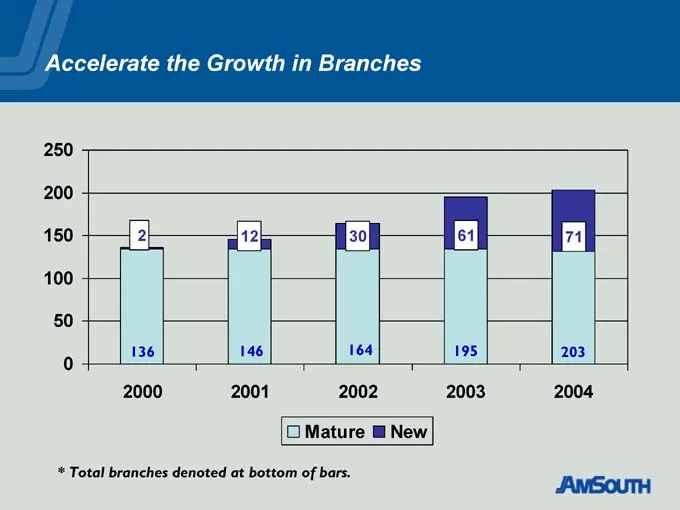
Accelerate the Growth in Branches 2 136 2000 12 146 2001 30 164 2002 61 195 2003 71 203 2004 Mature New * Total branches denoted at bottom of bars.
Slide 63: Accelerating Low Cost Deposit Growth
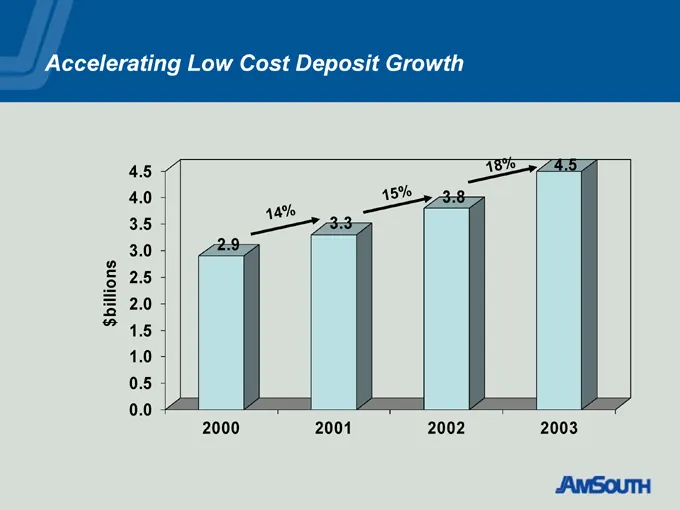
Accelerating Low Cost Deposit Growth 2000 2.9 14% 2001 3.3 15% 2002 3.8 18% 2003 4.5
Slide 64: Accelerating Growth in Loans
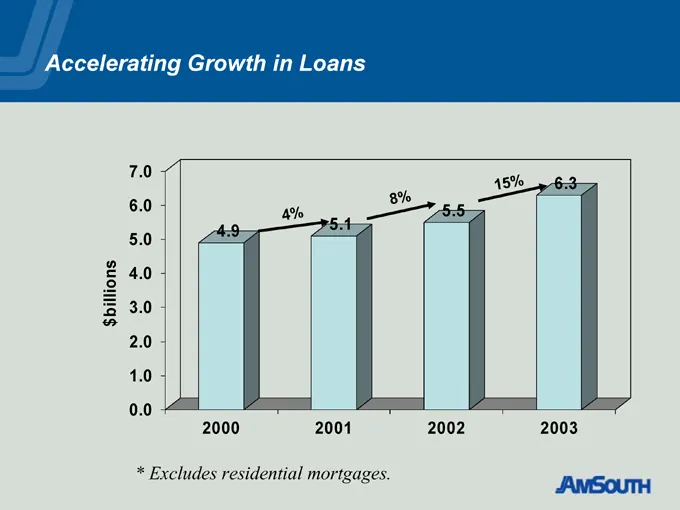
Accelerating Growth in Loans 2000 4.9 4% 2001 5.1 8% 2002 5.5 15% 2003 6.3 * Excludes residential mortgages.
Slide 65: Key Tactics 2004-2006
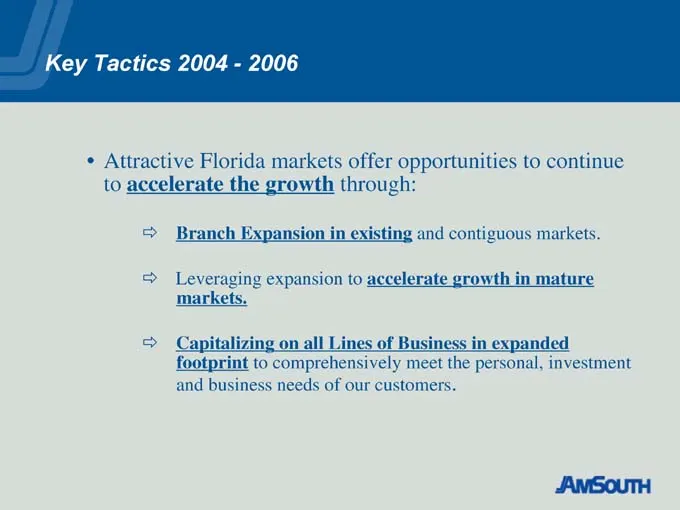
Key Tactics 2004—2006 • Attractive Florida markets offer opportunities to continue to accelerate the growth through: O Branch Expansion in existing and contiguous markets. O Leveraging expansion to accelerate growth in mature markets. O Capitalizing on all Lines of Business in expanded footprint to

Slide 66: Insert Video Here
INSERT VIDEO HERE “From the Ground Up” 3 minutes 45 seconds
Slide 67: Key Elements of Successful Branch Expansion
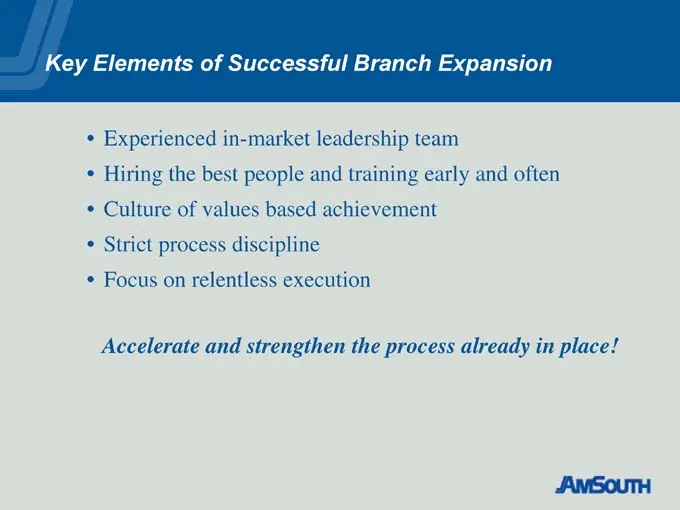
Key Elements of Successful Branch Expansion • Experienced in-market leadership team • Hiring the best people and training early and often • Culture of values based achievement • Strict process discipline • Focus on relentless execution Accelerate and strengthen the process already in place!
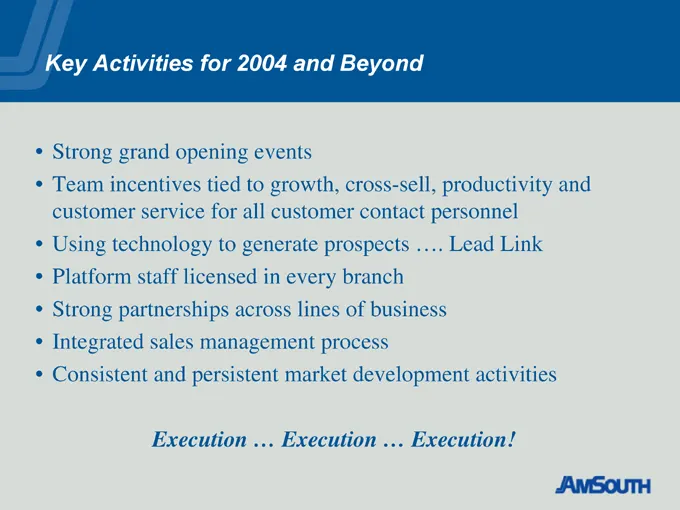
Slide 68: Key Activities for 2004 and Beyond
Key Activities for 2004 and Beyond • Strong grand opening events • Team incentives tied to growth, cross-sell, productivity and customer service for all customer contact personnel • Using technology to generate prospects Leak Link • Platform staff licensed in every branch • Strong partnerships acros
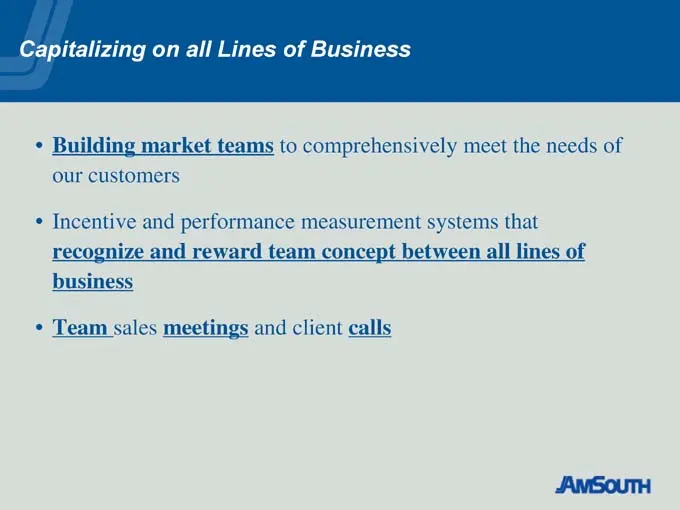
Slide 69: Capitalizing on all Lines of Business
Capitalizing on all Lines of Business • Building market teams to comprehensively meet the needs of our customers • Incentive and performance measurement systems that recognize and reward team concept between all lines of business • Team sales meetings and client calls
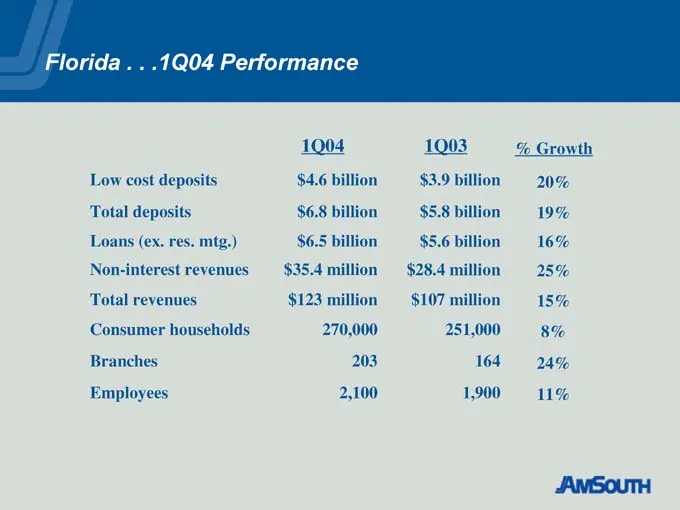
Slide 70: Florida 1Q04 Performance
Florida . . .1Q04 Performance 1Q04 1Q03 % Growth Low cost deposits $4.6 billion $3.9 billion 20% Total deposits $6.8 billion $5.8 billion 19% Loans (ex. res. mtg.) $6.5 billion $5.6 billion 16% Non-interest revenues $ 35.4 million $ 28.4 million 25% Total revenues $123 million $107 million 15% Consu
Slide 71: AmSouth Service Quality
AmSouth Service Quality Charles Mayer
Slide 72: Strategic Initiative
Strategic Initiative Emphasize sales productivity, service quality and customer retention.
Slide 73: Major Objectives 2004-2006
Major Objectives 2004—2006 Branch Service Quality • Improve service ratings to 4.9 on a 5-point scale Service Performance Standards • Meet or exceed standard on at least 95 percent of service performance standards Internal Service Quality • Maximize internal service quality as measured by surveys of
Slide 74: Key Tactics - Branch Service Quality
Key Tactics—Branch Service Quality • Surveys conducted by The Gallup Organization • Results reported monthly • Branch incentive program tied to results • Ability to compare AmSouth scores with industry norms • AmSouth currently ranks in top quartile of Gallup’s retail banking database
Slide 75: Branch Service Quality - Sample Questions
Branch Service Quality – Sample Questions • “How likely are you to recommend AmSouth to a friend or associate?” • Rate a series of statements, such as: “The Teller/Representative. . . – . . .communicated clearly with you.” – . . .was knowledgeable about the bank’s products and services” – . . .provi
Slide 76: Key Tactics - Service Performance Standards
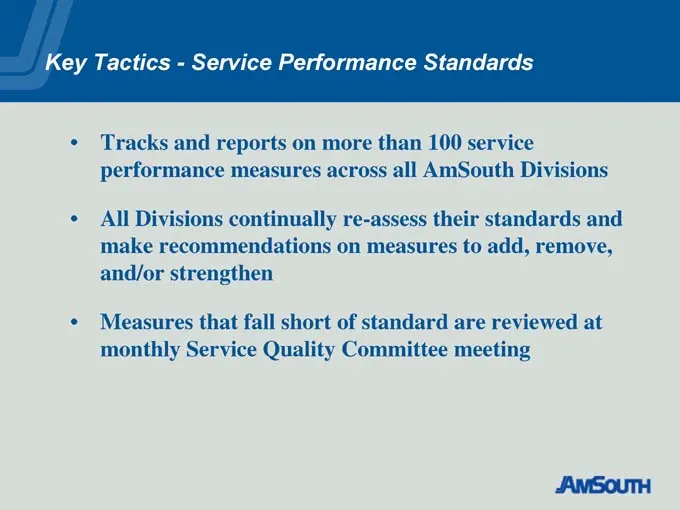
Key Tactics—Service Performance Standards • Tracks and reports on more than 100 service performance measures across all AmSouth Divisions • All Divisions continually re-assess their standards and make recommendations on measures to add, remove, and/or strengthen • Measures that fall short of standar
Slide 77: Service Performance Standards - Examples
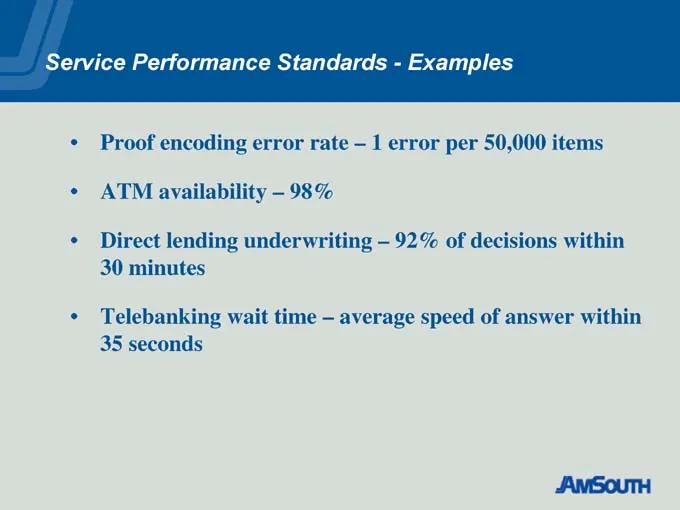
Service Performance Standards—Examples • Proof encoding error rate – 1 error per 50,000 items • ATM availability – 98% • Direct lending underwriting – 92% of decisions within 30 minutes • Telebanking wait time – average speed of answer within 35 seconds
Slide 78: Key Tactics - Internal Service Quality
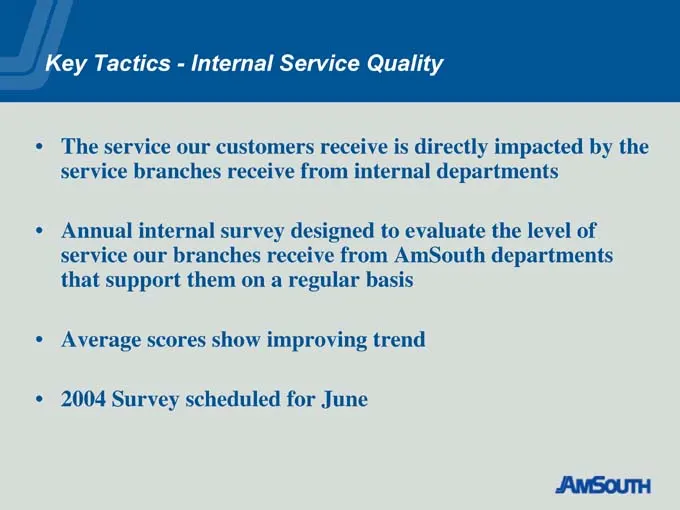
Key Tactics—Internal Service Quality • The service our customers receive is directly impacted by the service branches receive from internal departments • Annual internal survey designed to evaluate the level of service our branches receive from AmSouth departments that support them on a regular basi

Slide 79: Operations and Technology
Operations and Technology Grayson Hall
Slide 80: Current Profile
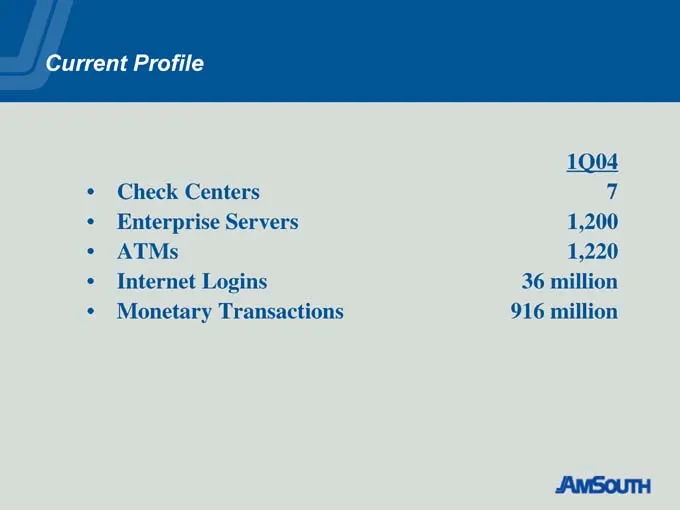
Current Profile 1Q04 • Check Centers 7 • Enterprise Servers 1,200 • ATMs 1,220 • Internet Logins 36 million • Monetary Transactions 916 million
Slide 81: Seconds at AmSouth
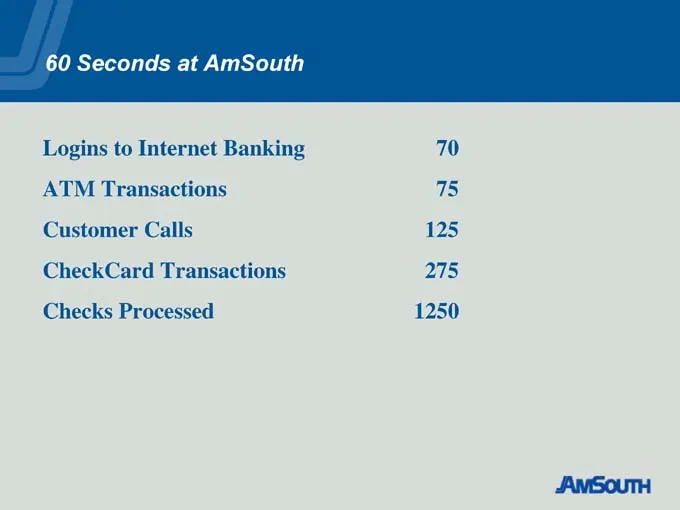
60 Seconds at AmSouth Logins to Internet Banking 70 ATM Transactions 75 Customer Calls 125 CheckCard Transactions 275 Checks Processed 1250
Slide 82: Strategic Initiative
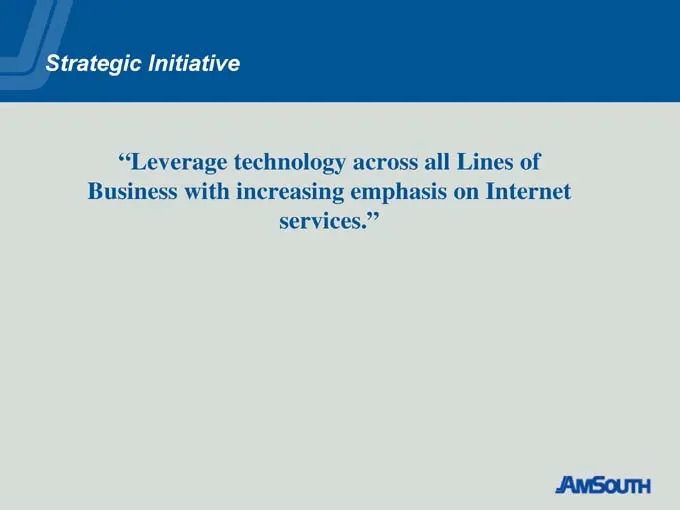
Strategic Initiative “Leverage technology across all Lines of Business with increasing emphasis on Internet services.”
Slide 83: Major Objectives 2004-2006
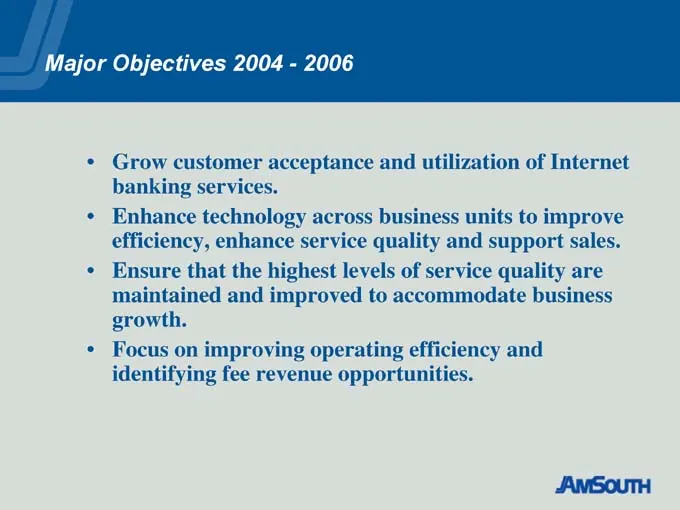
Major Objectives 2004—2006 • Grow customer acceptance and utilization of Internet banking services. • Enhance technology across business units to improve efficiency, enhance service quality and support sales. • Ensure that the highest levels of service quality are maintained and improved to accommod
Slide 84: Customer Convenience
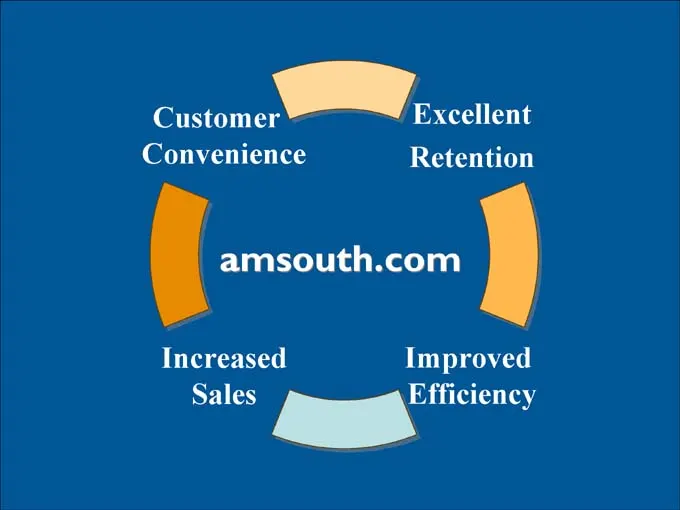
Customer Convenience Excellent Retention amsouth.com Increased Sales Improved Efficiency
Slide 85: amsouth.com Growth
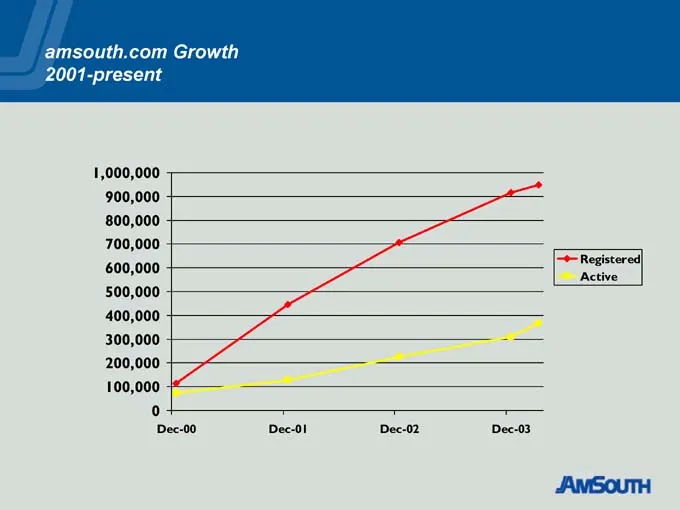
amsouth.com Growth 2001-present Registered Active
Slide 86: External Recognition
External Recognition • Recognized for Superior User Experience • Noted Leader in Usability • B to B Top 100 Websites (2nd year) • Rated #1 in Customer Service
Slide 87: Major Objectives - Internet Banking
Major Objectives – Internet Banking Key Tactics • Expand self service capabilities • Enhance business content • Drive customer activation • Increase email utilization and marketing
Slide 88: Operating Efficiency
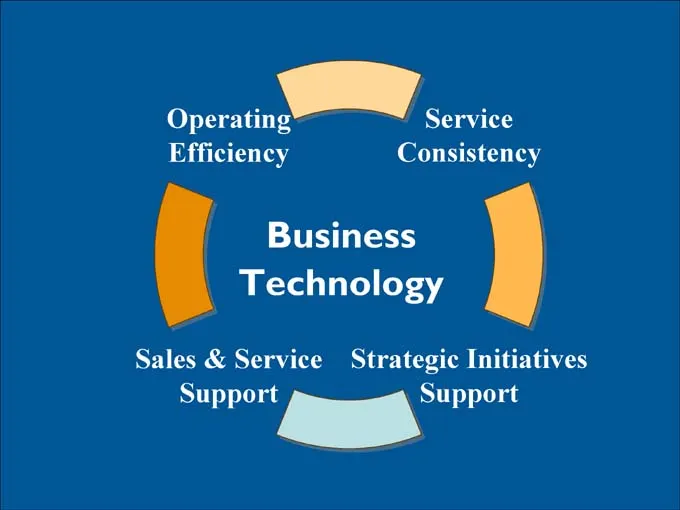
Operating Efficiency Service Consistency Business Technology Sales & Service Support Strategic Initiatives Support
Slide 89: Technology Investments
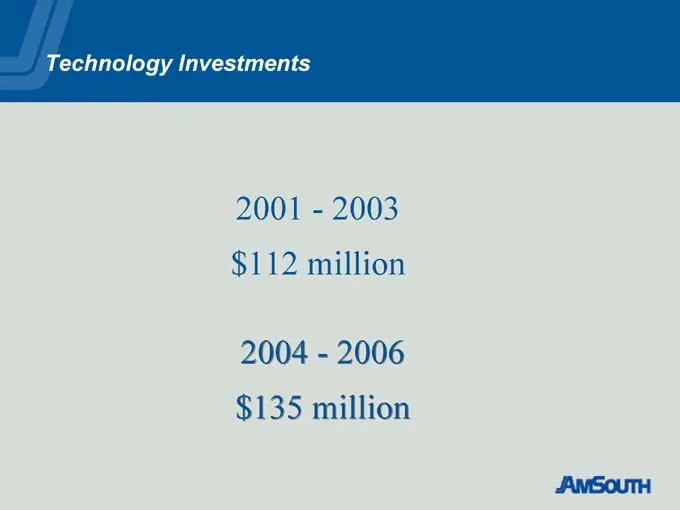
Technology Investments 2001—2003 $112 million 2004—2006 $135 million
Slide 90: Branch Technology
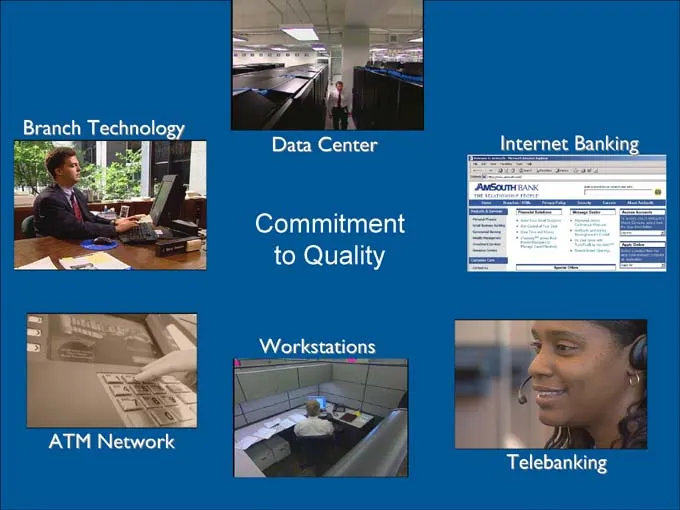
Branch Technology Data Center Internet Banking Commitment to Quality Workstations ATM Network Telebanking
Slide 91: Operational Service Quality
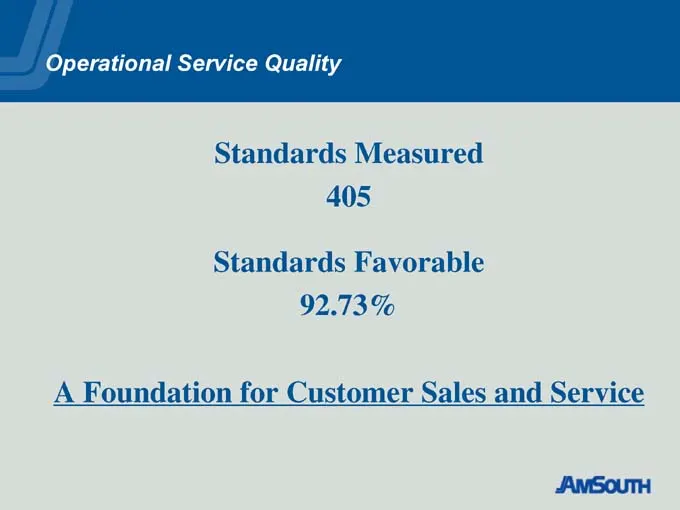
Operational Service Quality Standards Measured 405 Standards Favorable 92.73% A Foundation for Customer Sales and Service
Slide 92: Operational Efficiency
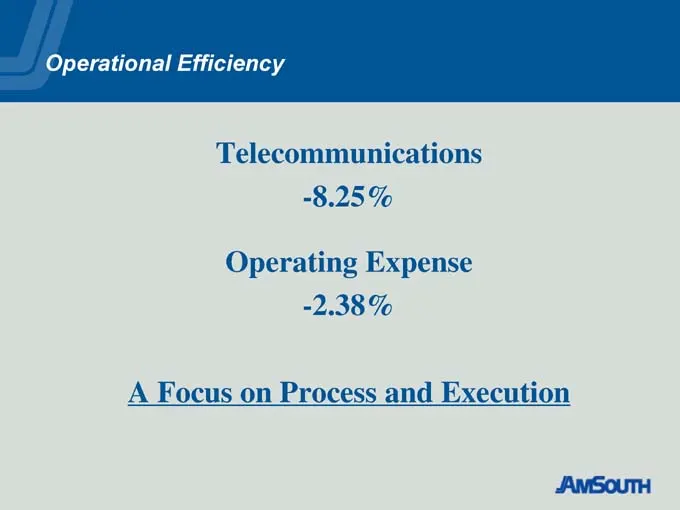
Operational Efficiency Telecommunications -8.25% Operating Expense -2.38% A Focus on Process and Execution
Slide 93: Operational Commitments
Operational Commitments Competitive and Proven Technology Available, Accurate, and Responsive Systems Operational Excellence in Service Quality, Efficiency, and Controls

Slide 94: Financial Overview
Financial Overview Beth Mooney
Slide 95: Overview: Key Assumptions
Overview Key Assumptions: • Current rate environment • Improving economy
Slide 96: Direction for 2004-2006
Direction for 2004—2006 • Investing for Growth • Balancing Growth • Maintaining Lower Risk Profile
Slide 97: Investing for growth
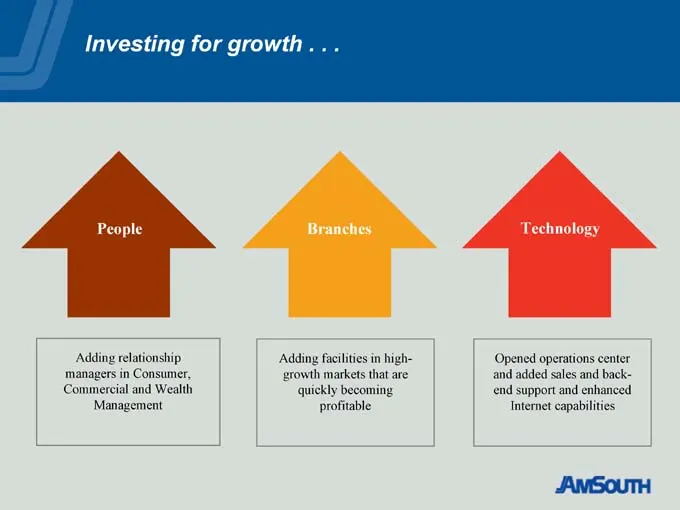
Investing for growth . . . People Adding relationship managers in Consumer, Commercial and Wealth Management Branches Adding facilities in high-growth markets that are quickly becoming profitable Technology Opened operations center and added sales and back-end support and enhanced Internet capabilit
Slide 98: Balanced Growth: Compound Annual Revenue Growth Rates
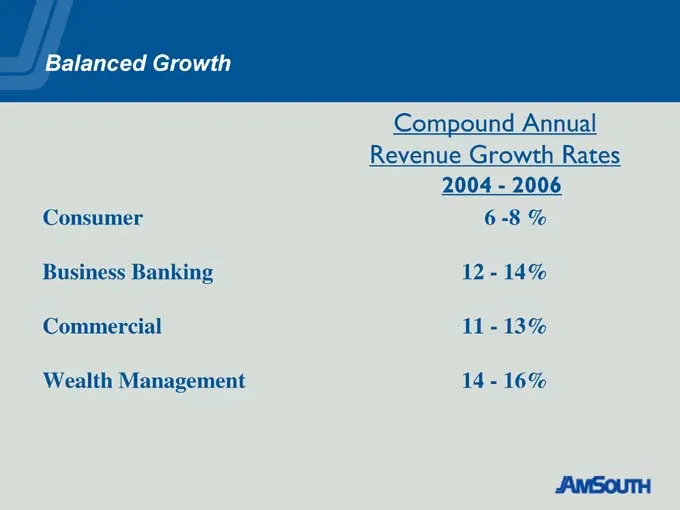
Balanced Growth Compound Annual Revenue Growth Rates 2004—2006 Consumer 6 -8 % Business Banking 12—14% Commercial 11—13% Wealth Management 14—16%
Slide 99: Improving Risk Profile: Net Charge-Off Trend
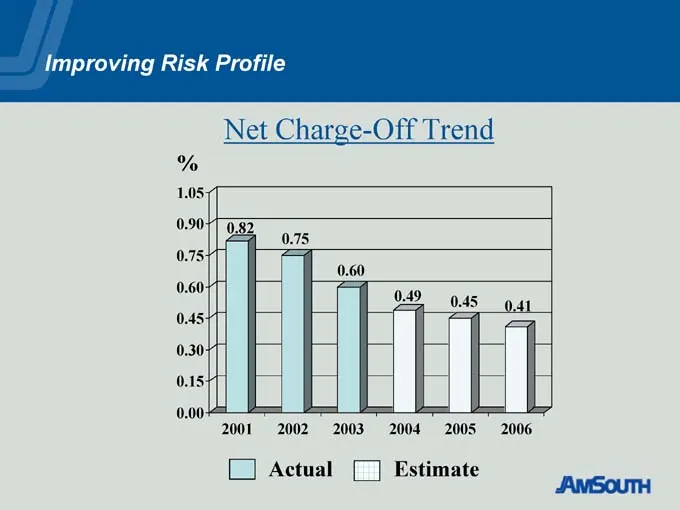
Improving Risk Profile Net Charge-Off Trend 0.82 2001 0.75 2002 0.60 2003 0.49 2004 0.45 2005 0.41 2006 Actual Estimate
Slide 100: Improving Risk Profile
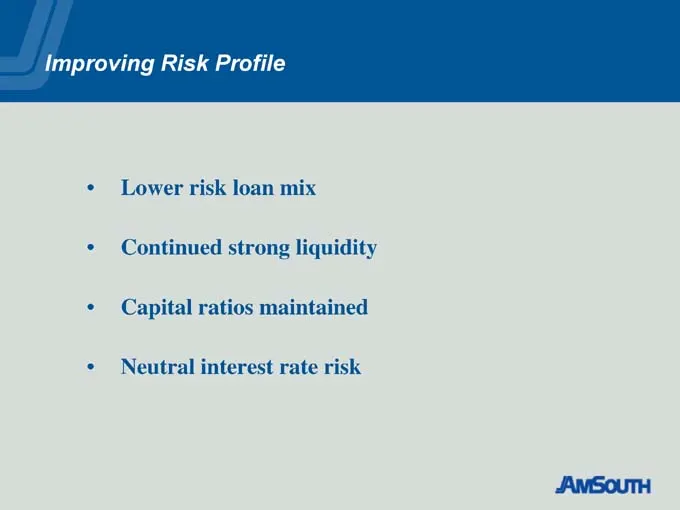
Improving Risk Profile • Lower risk loan mix • Continued strong liquidity • Capital ratios maintained • Neutral interest rate risk
Slide 101: 1st Quarter Performance
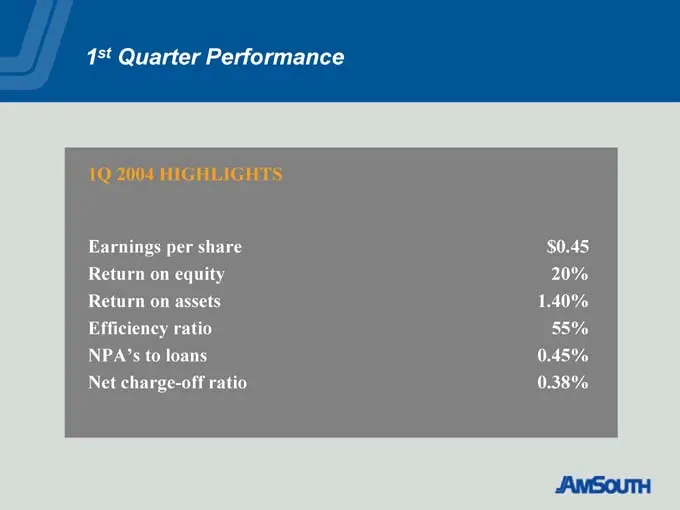
1st Quarter Performance 1Q 2004 HIGHLIGHTS Earnings per share $0.45 Return on equity 20% Return on assets 1.40% Efficiency ratio 55% NPA’s to loans 0.45% Net charge-off ratio 0.38%
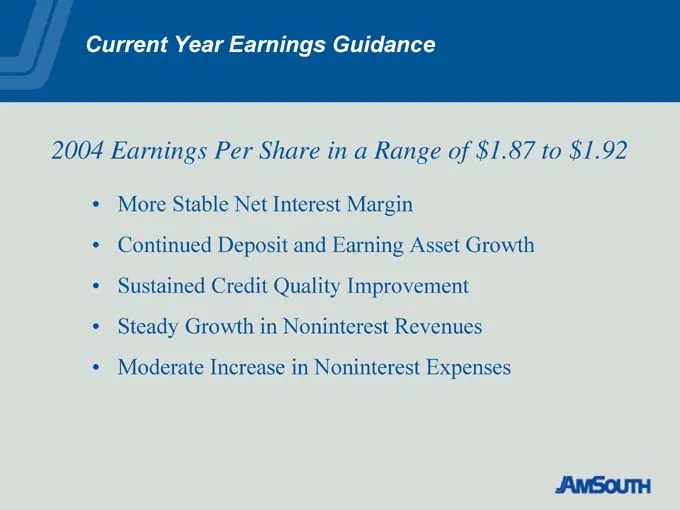
Slide 102: Current Year Earnings Guidance
Current Year Earnings Guidance 2004 Earnings Per Share in a Range of $1.87 to $1.92 • More Stable Net Interest Margin • Continued Deposit and Earning Asset Growth • Sustained Credit Quality Improvement • Steady Growth in Noninterest Revenues • Moderate Increase in Noninterest Expenses

Slide 103: Summary
Summary Dowd Ritter
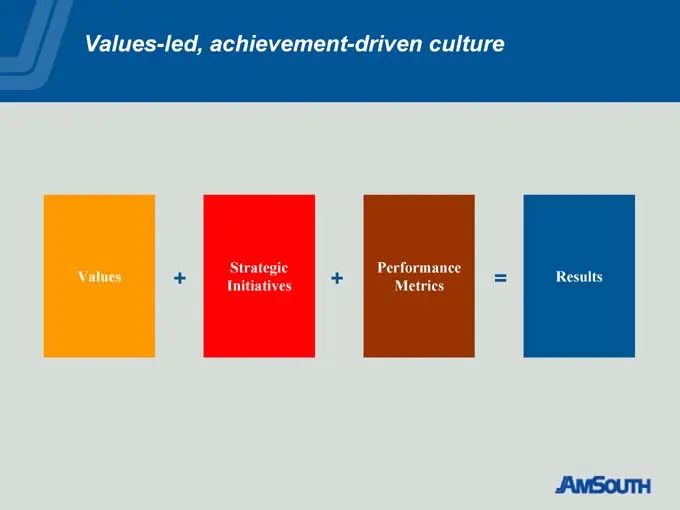
Slide 104: Values-led, achievement-driven culture
Values-led, achievement-driven culture Values + Strategic Initiatives + Performance Metrics = Results
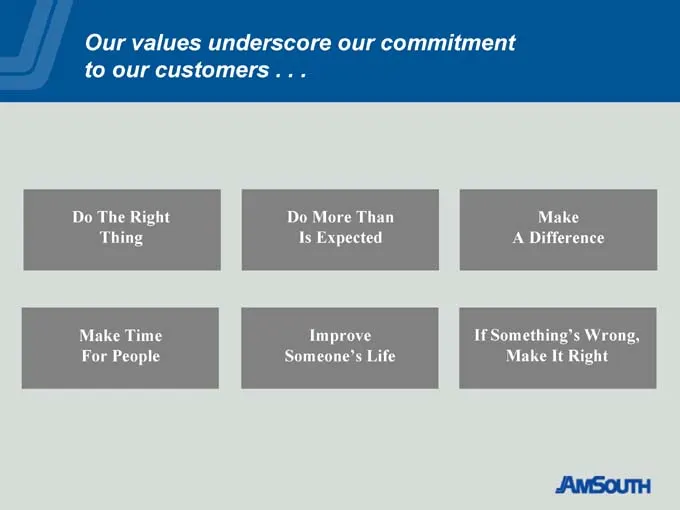
Slide 105: Our values underscore our commitment to our customers
Our values underscore our commitment to our customers . . . Do The Right Thing Do More Than Is Expected Make A Difference Make Time For People Improve Someone’s Life If Something’s Wrong, Make It Right
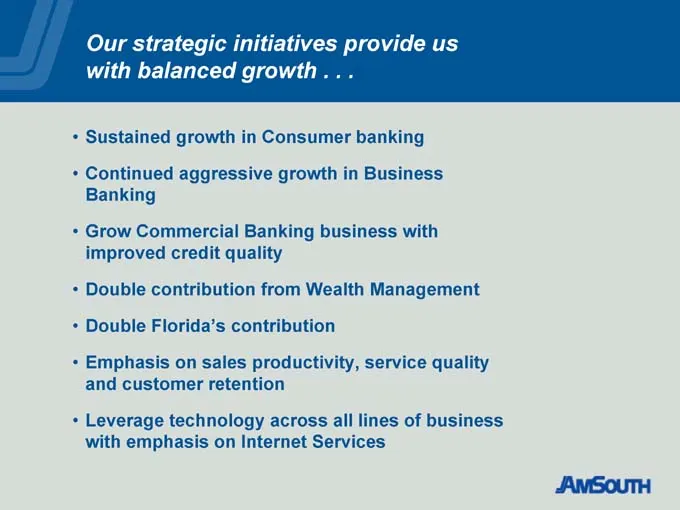
Slide 106: Our strategic initiatives provide us with balanced growth
Our strategic initiatives provide us with balanced growth . . . • Sustained growth in Consumer banking • Continued aggressive growth in Business Banking • Grow Commercial Banking business with improved credit quality • Double contribution from Wealth Management • Double Florida’s contribution • Emph
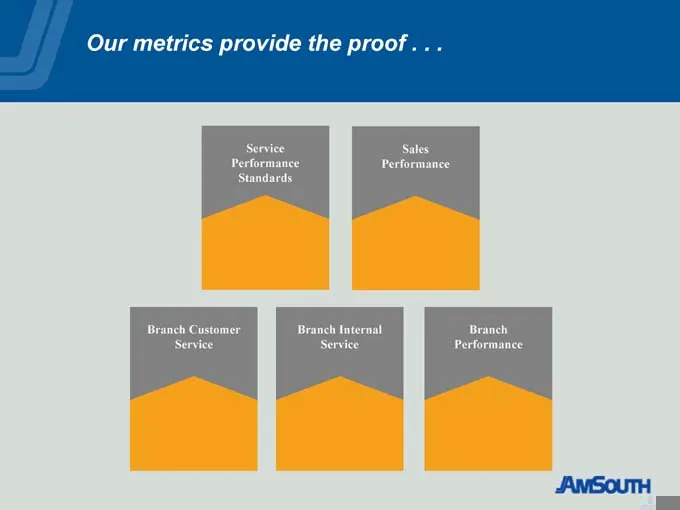
Slide 107: Our metrics provide the proof
Our metrics provide the proof . . . Service Performance Standards Sales Performance Branch Customer Service Branch Internal Service Branch Performance
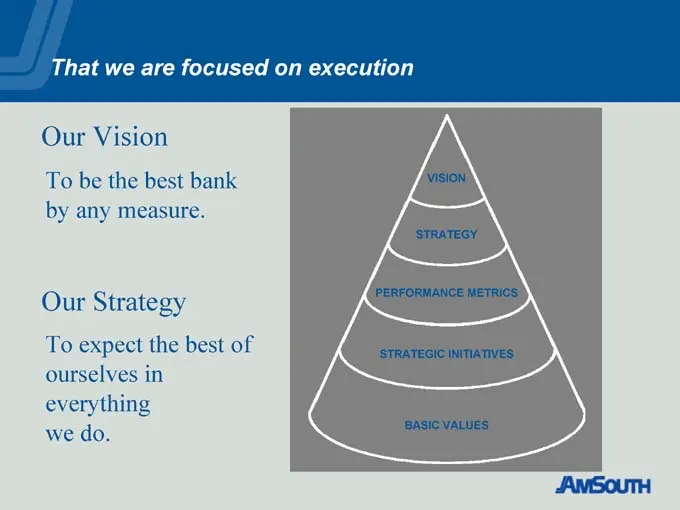
Slide 108: That we are focused on execution
That we are focused on execution Our Vision To be the best bank by any measure. Our Strategy To expect the best of ourselves in everything we do. VISION STRATEGY PERFORMANCE METRICS STRATEGIC INITIATIVES BASIC VALUES

Slide 109: Fulfilling our brand promise
Fulfilling our brand promise.

Slide 110: May Analysts' Meeting: Welcome
MAY ANALYSTS’ MEETING WELCOME! May 4, 2004
Source: SEC EDGAR · 8-K filed May 4, 2004
More decks from Amsouth Bancorporation
 Merger or Acquisition (October 2006)10 slides · Oct 3, 2006
 Merger or Acquisition (August 2006)41 slides · Aug 22, 2006
 Regions Financial — Merger or Acquisition (May 2006)28 slides · May 26, 2006
 Shareholder Meeting (April 2006)17 slides · Apr 20, 2006
 Citigroup Financial Services Conference 200631 slides · Feb 1, 2006
 Fox-Pitt, Kelton Global Financial Services Conference 200529 slides · Nov 8, 2005