National Penn Bancshares — Q4 2010 Earnings Presentation
15 slides from National Penn Bancshares's earnings presentation, Jan 27, 2011

Slide 1: 4th Quarter & Year End 2010 Earnings Webcast
National Penn Bancshares, Inc. 4th Quarter & Year End 2010 Earnings Webcast
Slide 2: Non-GAAP financial measures notice
This presentation, including the attached Financial Highlights and financial data tables, contains supplemental financial information determined by methods other than in accordance with Accounting Principles Generally Accepted in the United States of America (“GAAP”). National Penn’s management uses
Slide 3: Executing the Strategic Plan
Executing the Strategic Plan l Asset quality continues to improve l Fundamentals remain strong l Strong capital levels further enhanced l Strategic initiatives achieved – Divestiture of Christiana Bank & Trust Company - December 3, 2010 – Completion of Warburg Pincus LLC investment transaction - Jan
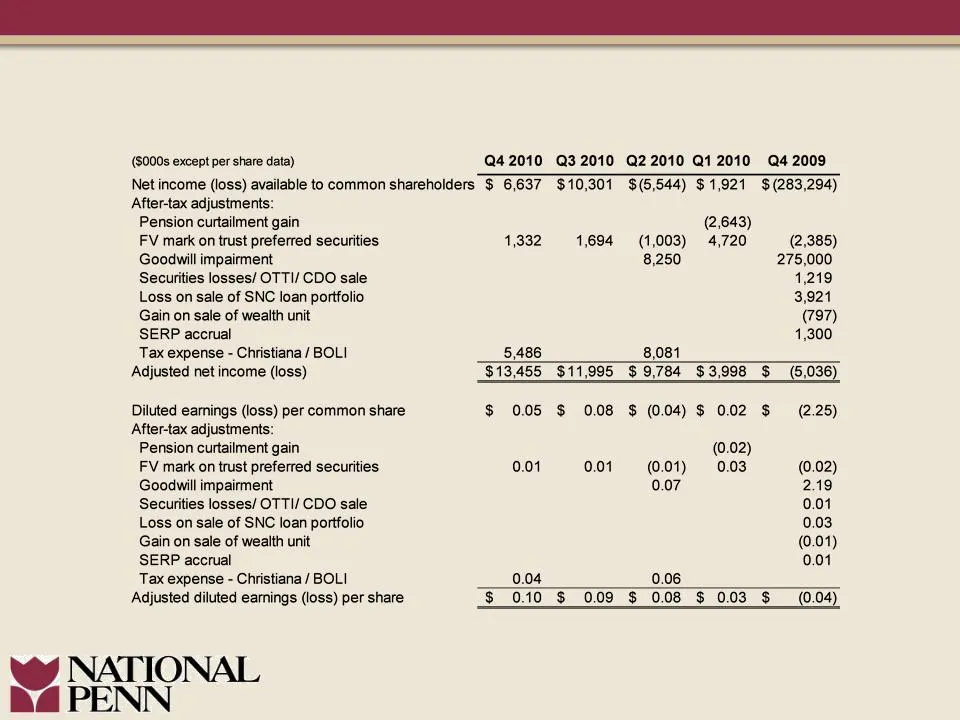
Slide 4: Quarterly Adjusted Earnings Analysis
Quarterly Adjusted Earnings Analysis
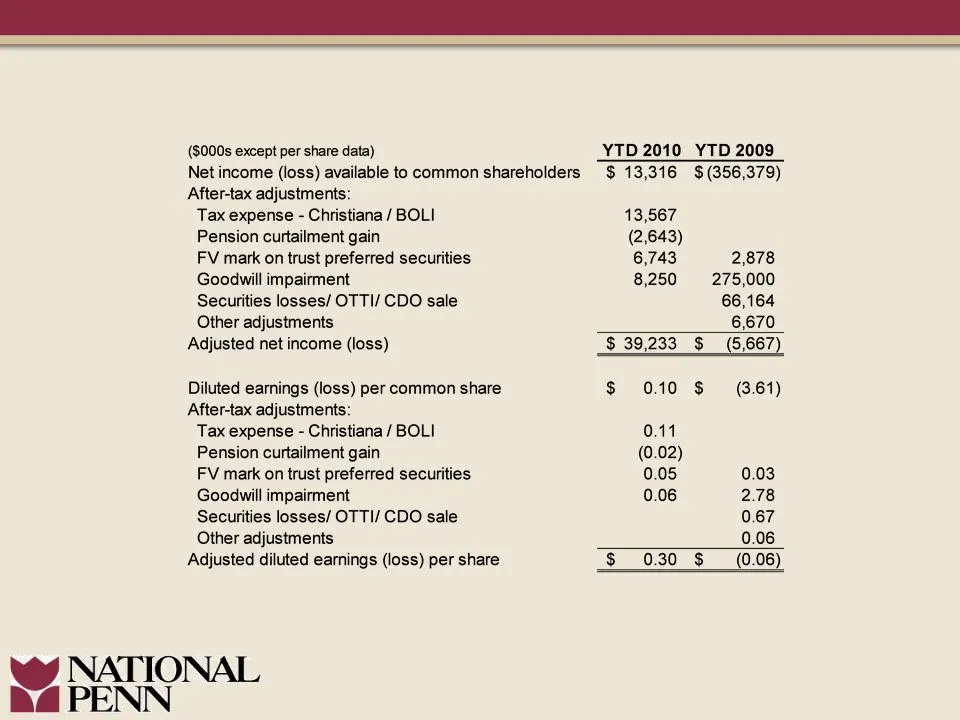
Slide 5: Full Year Adjusted Earnings Analysis
Full Year Adjusted Earnings Analysis
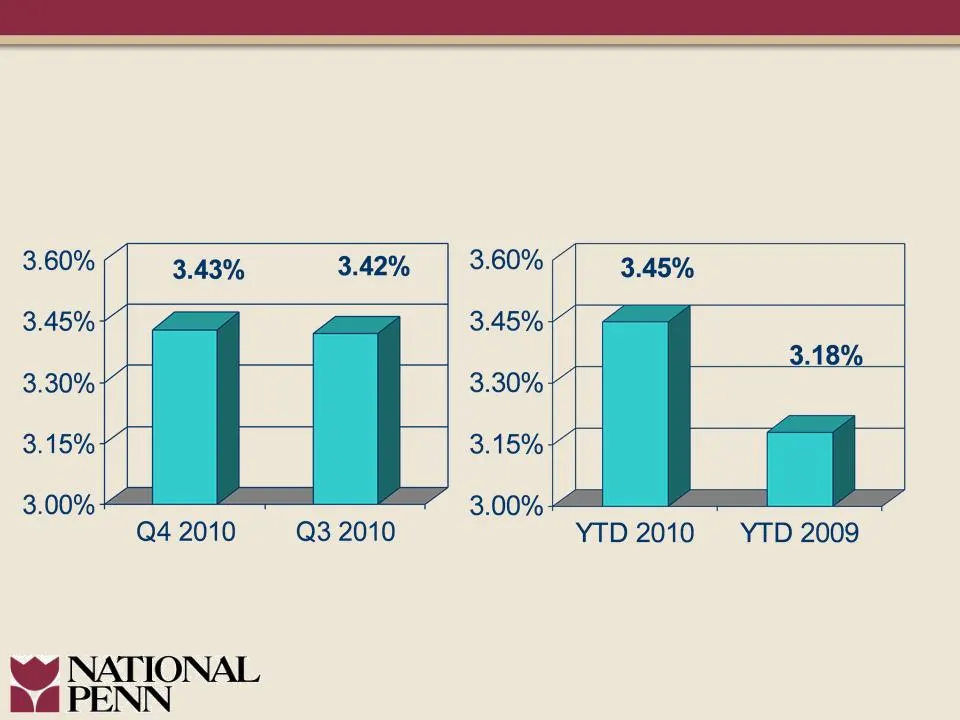
Slide 6: Net Interest Margin
Net Interest Margin (Taxable Equivalent)
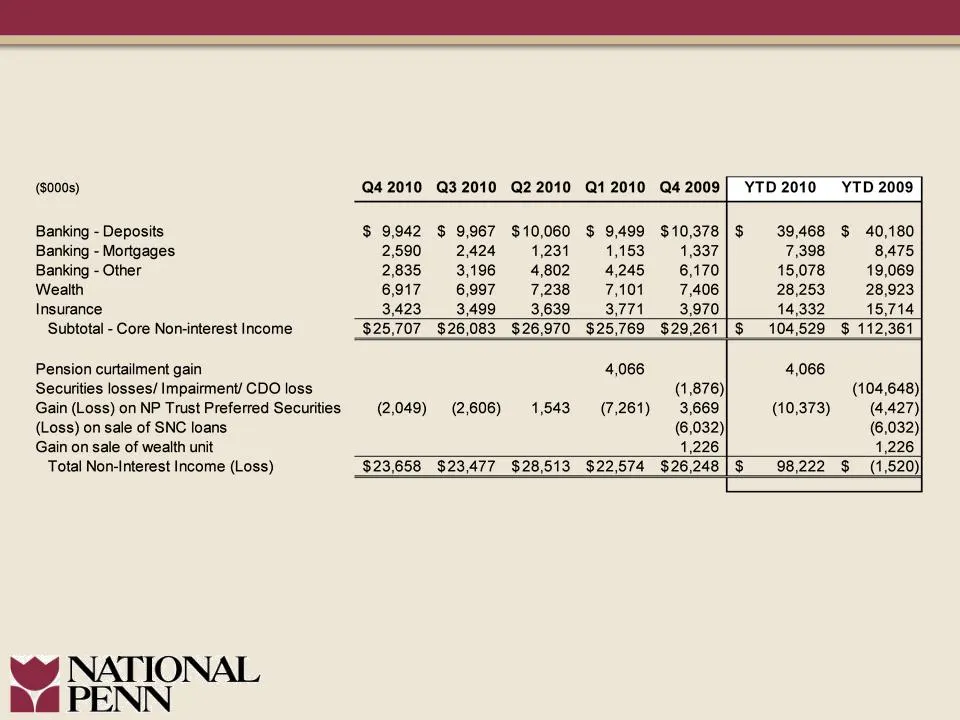
Slide 7: Non-Interest Income
(6000s) Banking - Deposits Banking - Mortgages Banking - Other Wealth Insurance Subtotal - Core Non-interest Income Pension curtailment gain Securities losses/ Impairment/ CDO loss Gain (Loss) on NP Trust Preferred Securities (Loss) on sale of SNC loans Gain on sale of wealth unit Total Non-Interest
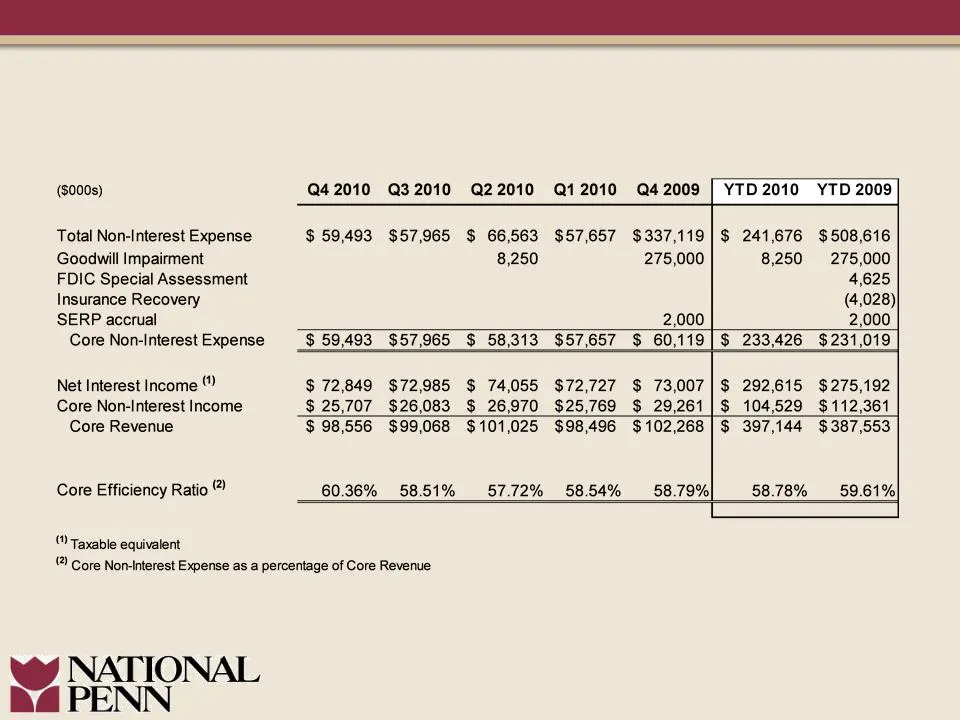
Slide 8: Non-Interest Expense and Core Efficiency Ratio
($000s) Q4 2010 Q32010 Q22010 Q12010 Q42009 | YTD 2010 YTD 2009 Total Non-Interest Expense $ 59,493 $57,965 $ 66,563 $57,657 $337,119]$ 241,676 $508,616 Goodwill Impairment 8,250 275,000 8,250 275,000 FDIC Special Assessment. 4,625 Insurance Recovery (4,028)} SERP accrual 2,000 2,000 Core Non-Intere
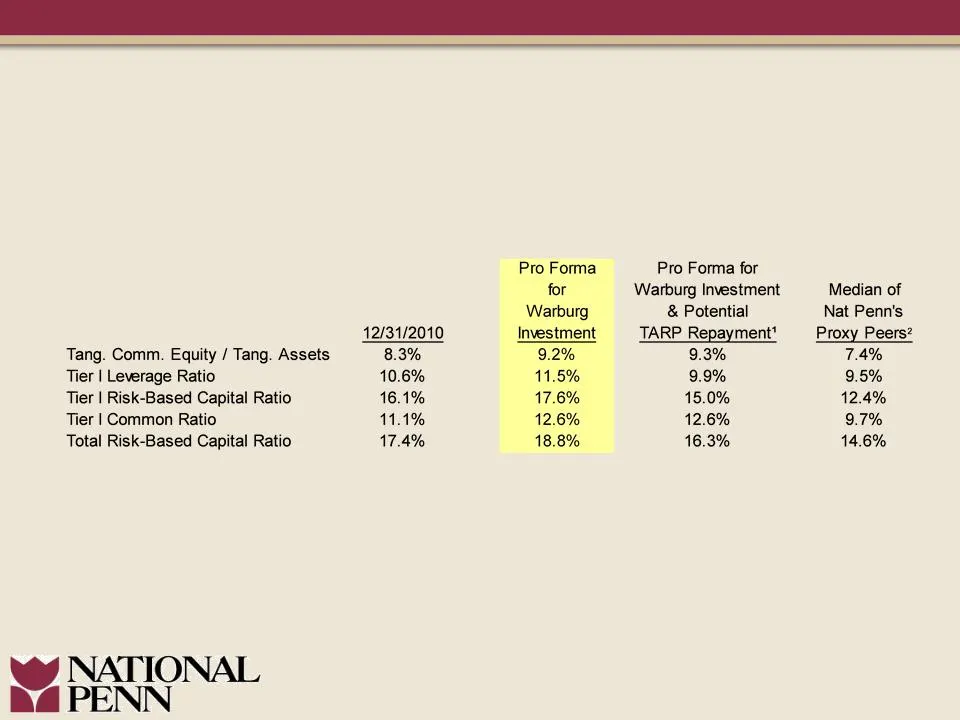
Slide 9: Pro Forma Capital Ratios
(1) Does not assume repurchase of the 735,294 outstanding warrants, valued at approximately $1.0 million based on a binomial valuation (2) Peer data as of 9/30/2010 Pro Forma Capital Ratios
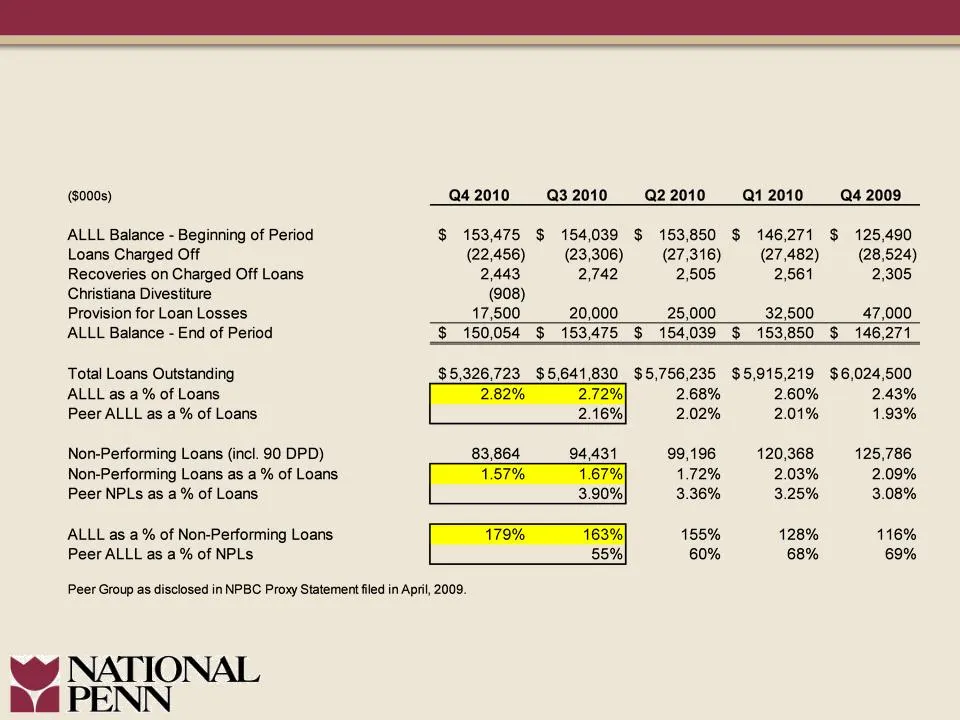
Slide 10: Allowance for Loan Losses
($000s) ALLL Balance - Beginning of Period Loans Charged Off Recoveries on Charged Off Loans Christiana Divestiture Provision for Loan Losses ALLL Balance - End of Period Total Loans Outstanding ALLL as a % of Loans Peer ALLL as a % of Loans Non-Performing Loans (incl. 90 DPD) Non-Performing Loans a
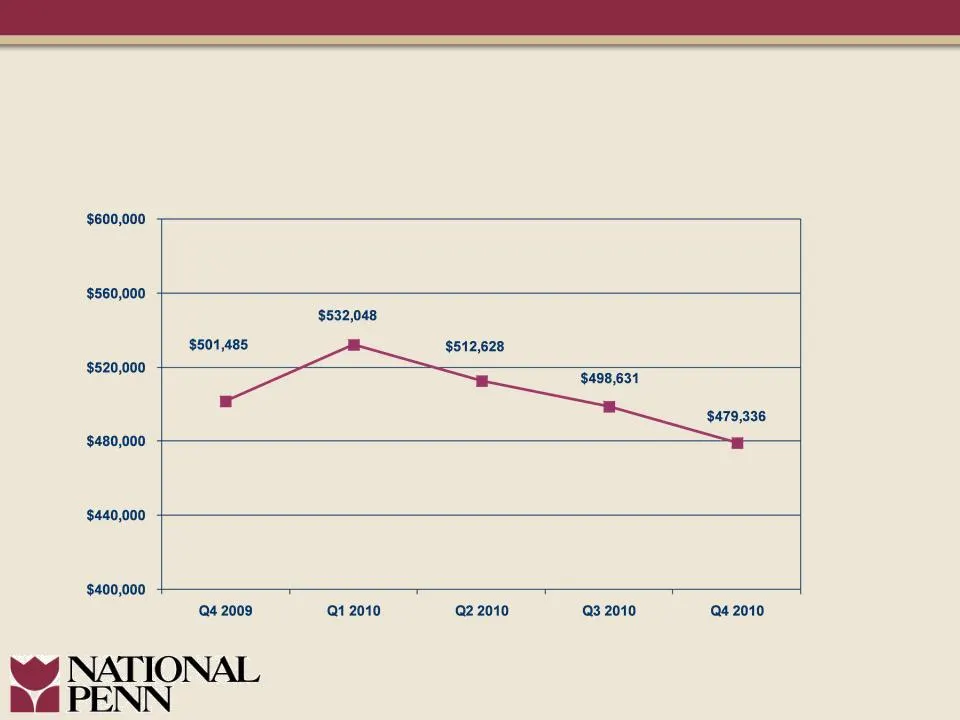
Slide 11: Classified Loans
Note: Classified loans consist of loans risk rated substandard, doubtful, or loss. As such classified loans include non-performing loans. Classified Loans ($000s)
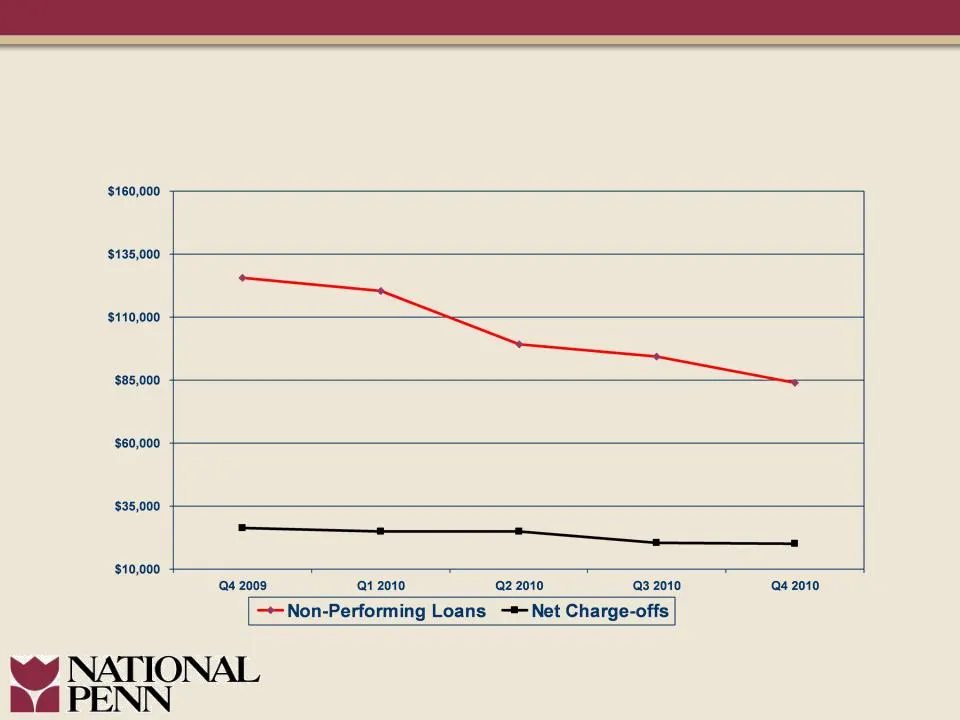
Slide 12: Non-Performing Loans and Charge-offs
Non-Performing Loans and Charge-offs ($000s)
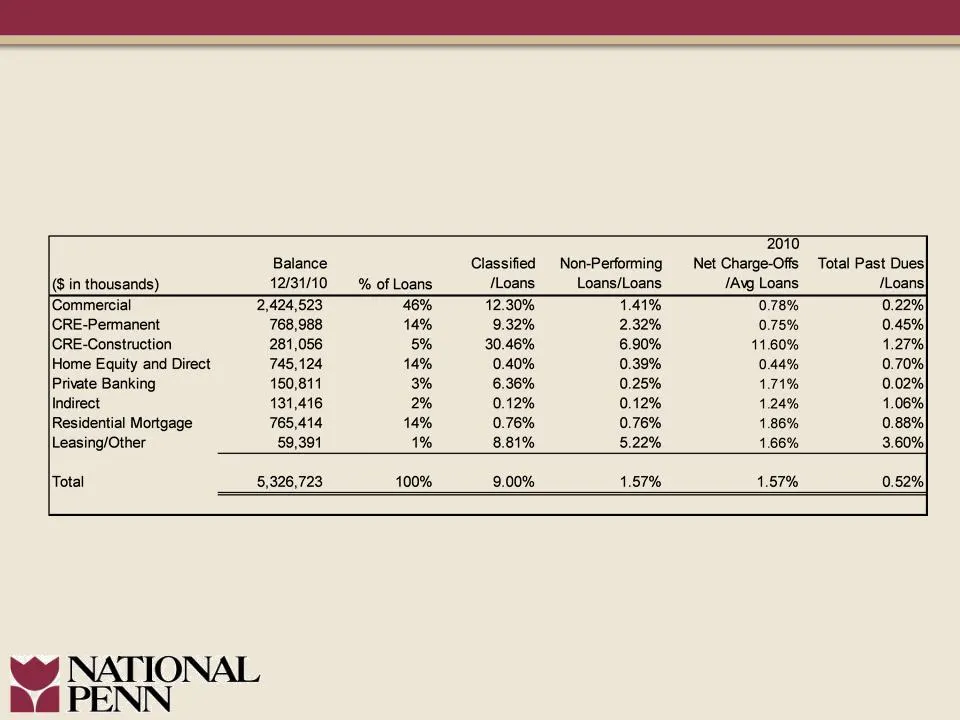
Slide 13: Loan Risk Profile
Loan Risk Profile December 31, 2010
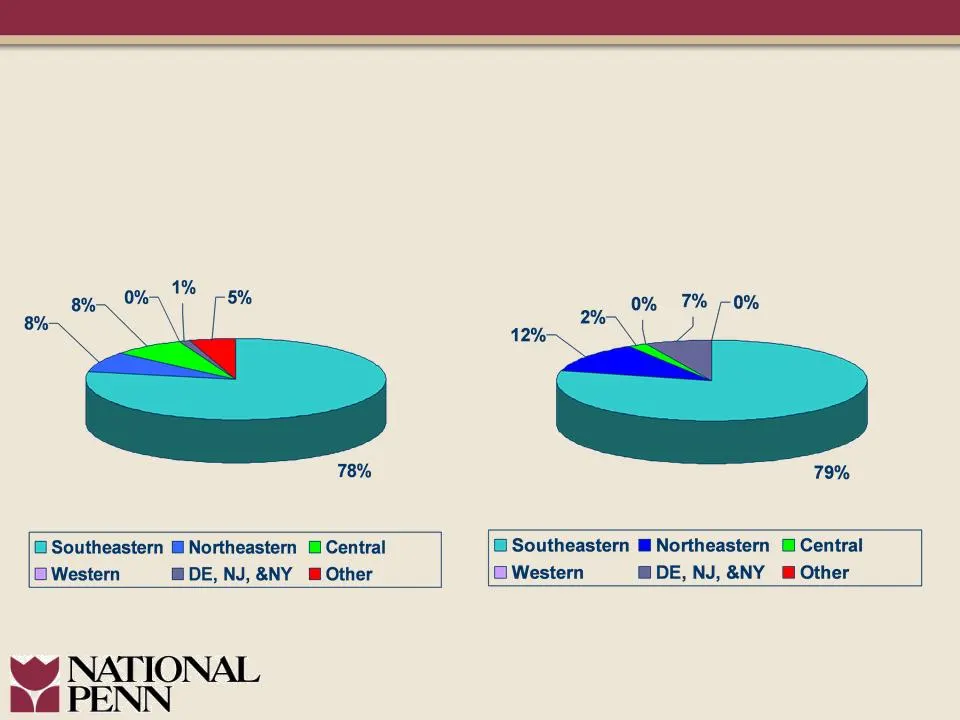
Slide 14: Non-Performing Assets and Gross Charge-offs by Geographic Region
Non-Performing Assets Gross Charge Offs Non-Performing Assets and Gross Charge-offs by Geographic Region December 31, 2010
Slide 15: Strategic Focuses
Strategic Focuses l Continued profitability improvement l Maintaining solid fundamental performance l Further improving asset quality l Accelerating TARP repayment l Strong balance sheet from which to grow
Source: SEC EDGAR · 8-K filed Jan 27, 2011
More decks from National Penn Bancshares
 BB&T Global Financial Services Conference (September 2015)33 slides · Sep 16, 2015
 Merger or Acquisition (August 2015)13 slides · Aug 18, 2015
 Q2 2015 Earnings Presentation17 slides · Jul 23, 2015
 Q1 2015 Earnings Presentation18 slides · Apr 24, 2015
 Investor Presentation (February 2015)36 slides · Feb 11, 2015
 Q4 2014 Earnings Presentation16 slides · Jan 22, 2015