Dennys — ICR 2023
26 slides from Dennys's conference presentation, Jan 9, 2023
Slide 1: Investor Presentation January 2023
INVESTOR PRESENTATION January 2023
Slide 2: Forward-looking statements
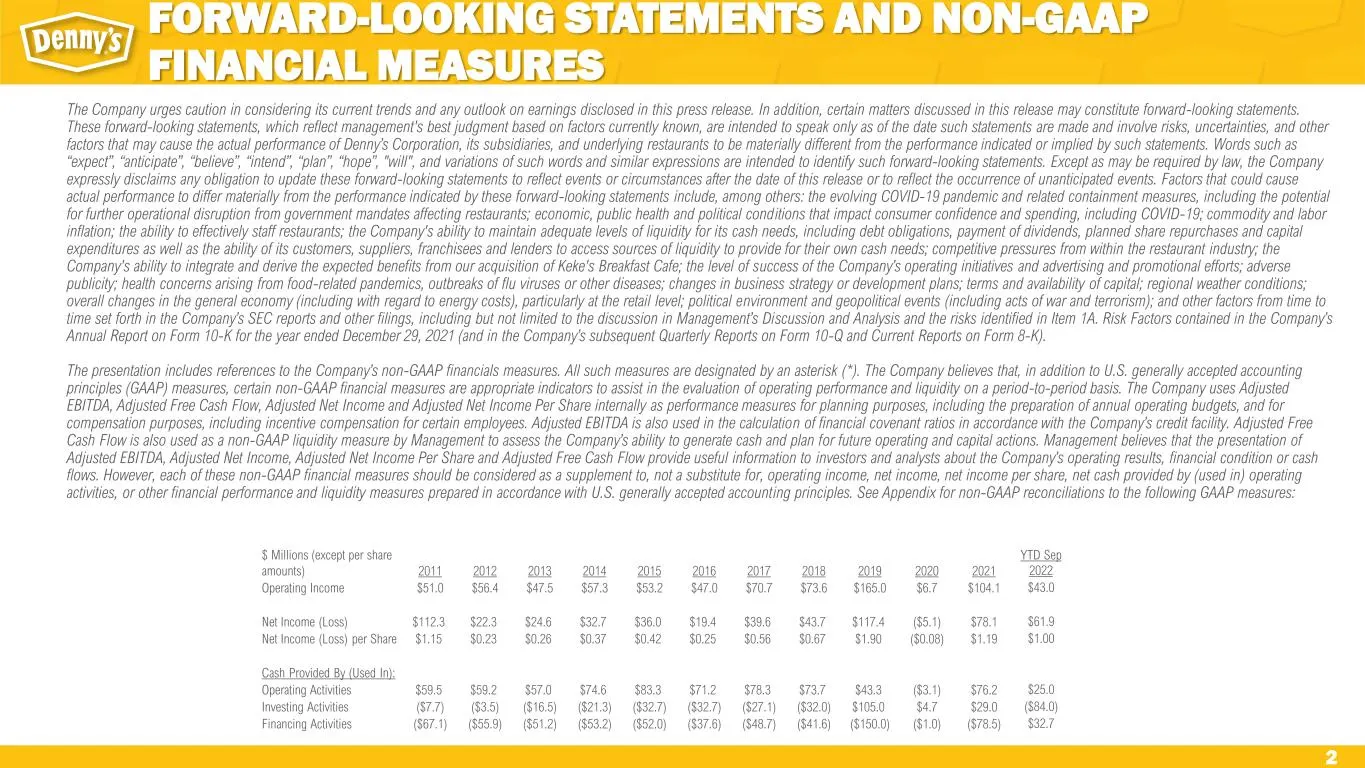
2 The Company urges caution in considering its current trends and any outlook on earnings disclosed in this press release. In addition, certain matters discussed in this release may constitute forward-looking statements. These forward-looking statements, which reflect management's best judgment base
Slide 3: It all started nearly 70 years ago
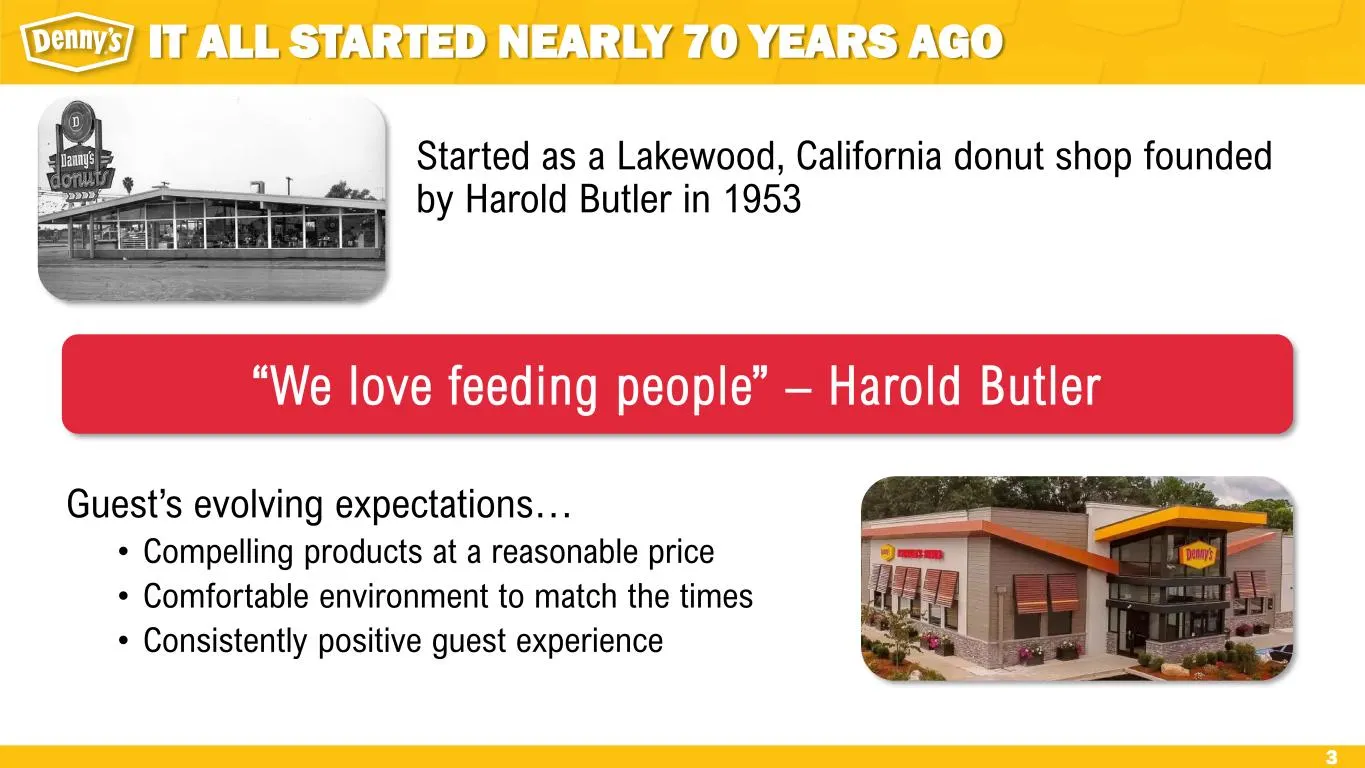
3 IT ALL STARTED NEARLY 70 YEARS AGO Started as a Lakewood, California donut shop founded by Harold Butler in 1953 “We love feeding people” – Harold Butler Guest’s evolving expectations… • Compelling products at a reasonable price • Comfortable environment to match the times • Consistently positive

Slide 4: Recent awards
bemys] RECENT A WAR aK * KK * oe AMERICA’S || MOST LOVED AMERICA’ GREATEST WORKPLACES FOR DIVERSITY WORKPLACES 2023 Newsweek | Bers ve |
Slide 5: We love feeding people - community giving
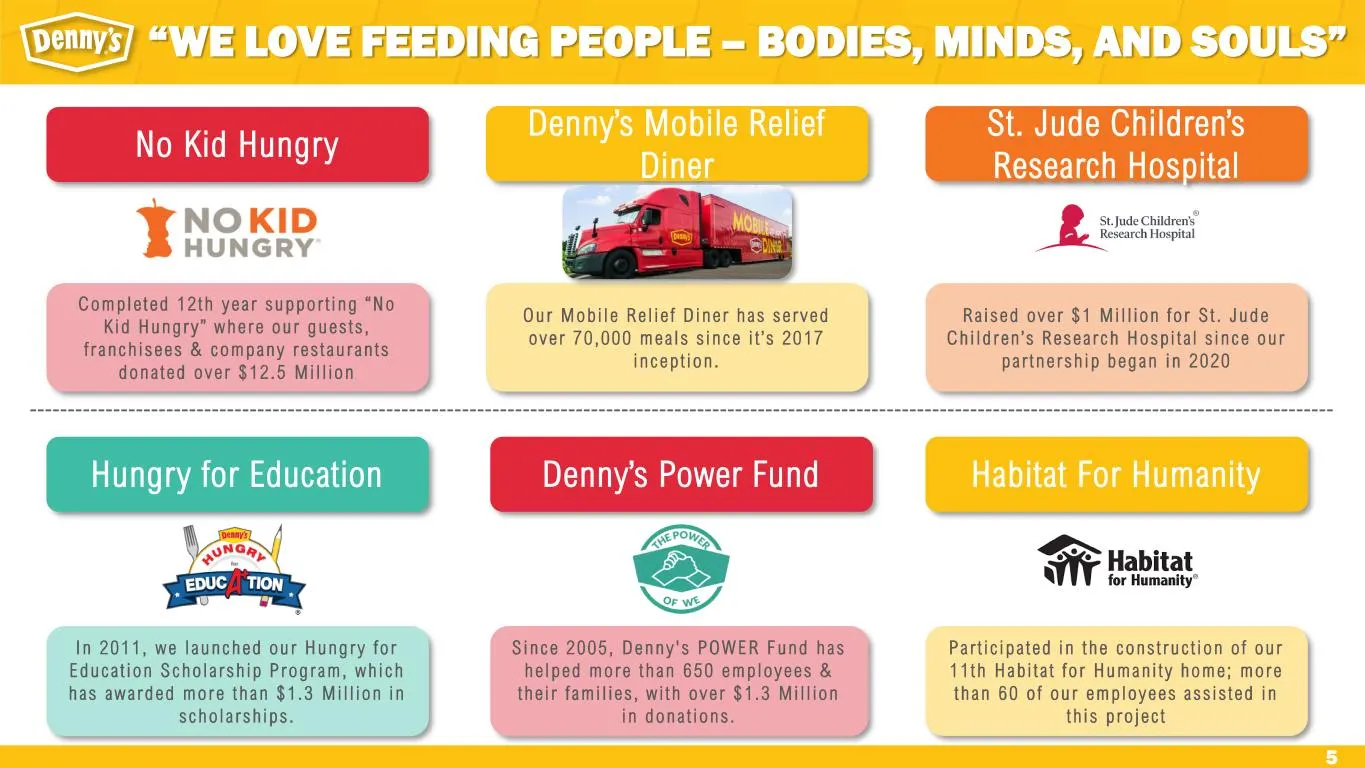
5 Ra i s ed o v e r $1 M i l l i on f o r S t . J ude Ch i l d r en ’ s Resea r ch Hosp i t a l s i n ce ou r pa r t ne r sh i p began i n 2020 “WE LOVE FEEDING PEOPLE – BODIES, MINDS, AND SOULS” No Kid Hungry Denny’s Mobile Relief Diner St. Jude Children’s Research Hospital Hungry for Education Den
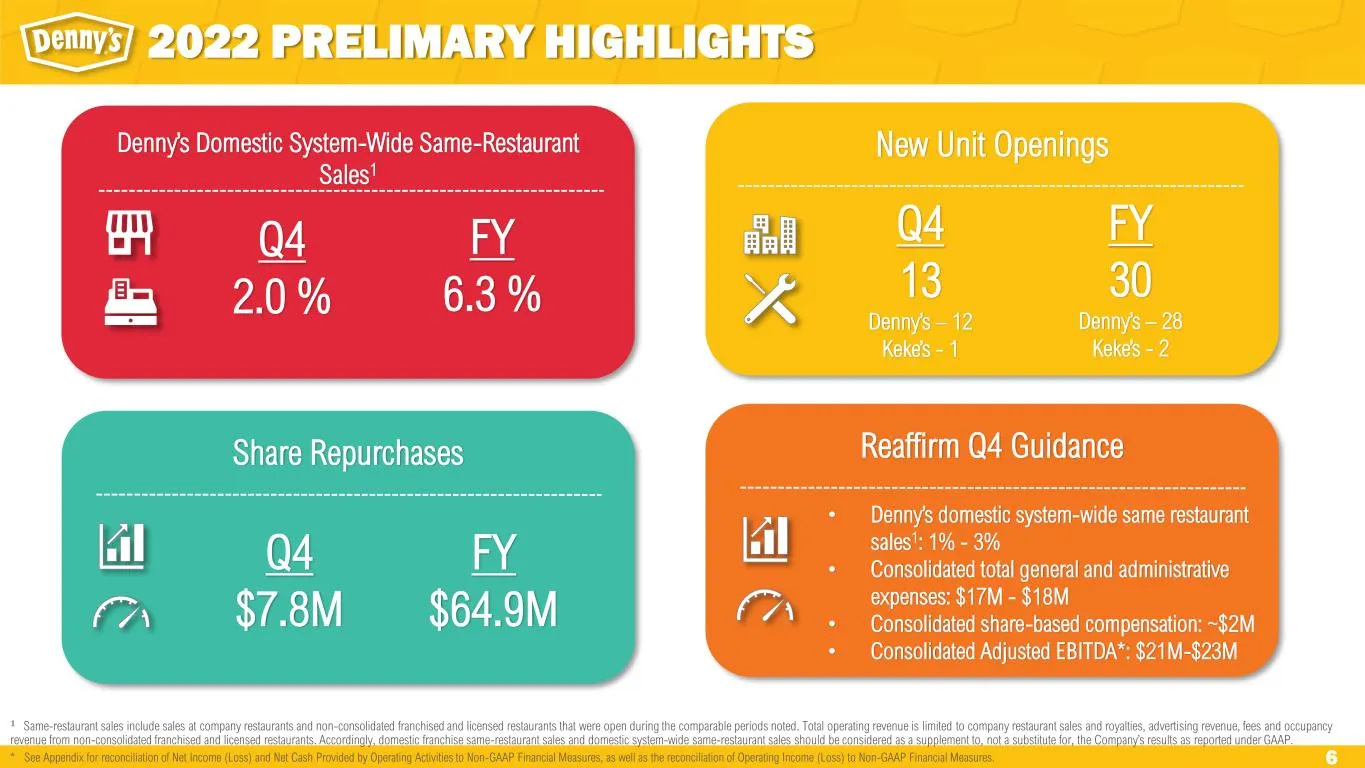
Slide 6: 2022 Preliminary Highlights
6 2022 PRELIMARY HIGHLIGHTS 𝟏 Same-restaurant sales include sales at company restaurants and non-consolidated franchised and licensed restaurants that were open during the comparable periods noted. Total operating revenue is limited to company restaurant sales and royalties, advertising revenue…
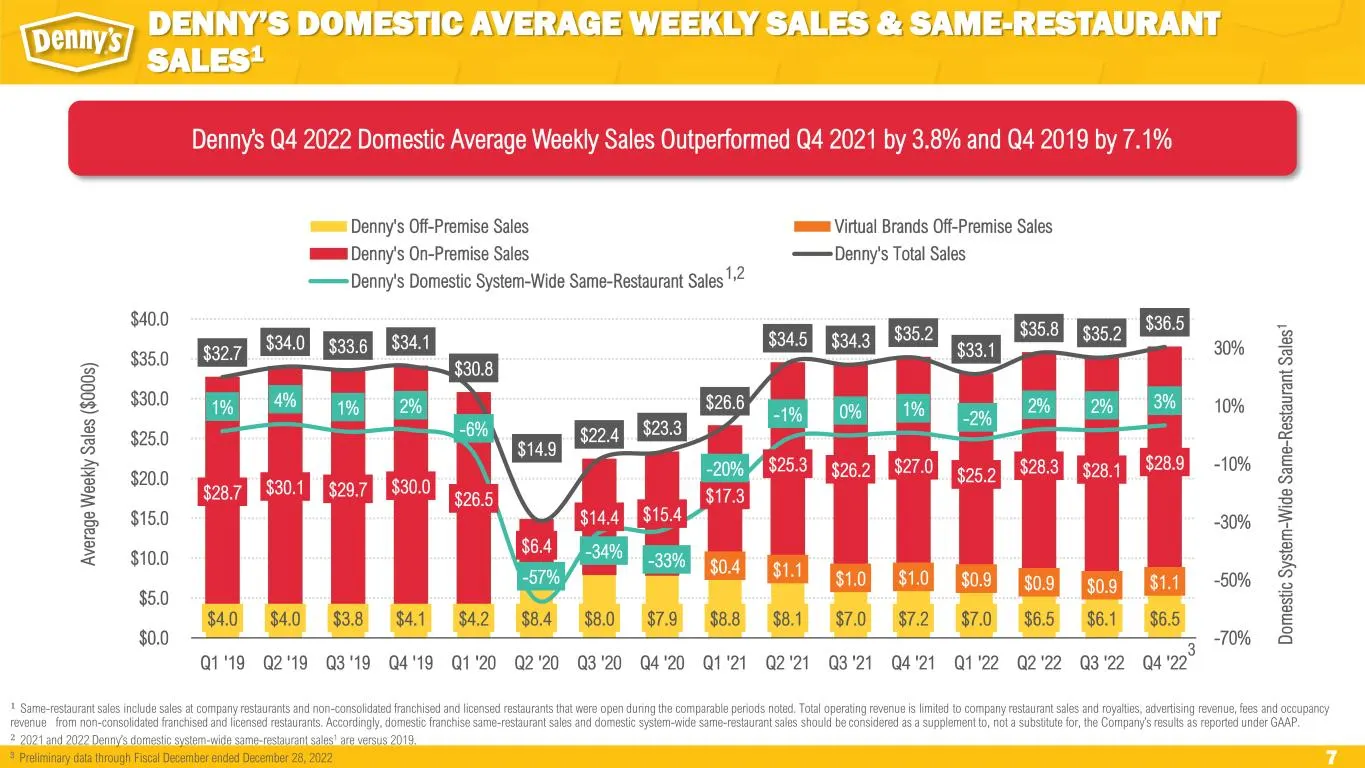
Slide 7: Denny's Domestic Average Weekly Sales & Same-Restaurant Sales
7 DENNY’S DOMESTIC AVERAGE WEEKLY SALES & SAME-RESTAURANT SALES1 $4.0 $4.0 $3.8 $4.1 $4.2 $8.4 $8.0 $7.9 $8.8 $8.1 $7.0 $7.2 $7.0 $6.5 $6.1 $6.5 $0.4 $1.1 $1.0 $1.0 $0.9 $0.9 $0.9 $1.1 $28.7 $30.1 $29.7 $30.0 $26.5 $6.4 $14.4 $15.4 $17.3 $25.3 $26.2 $27.0 $25.2 $28.3 $28.1 $28.9 $32.7 $34.0 $33.6 $3
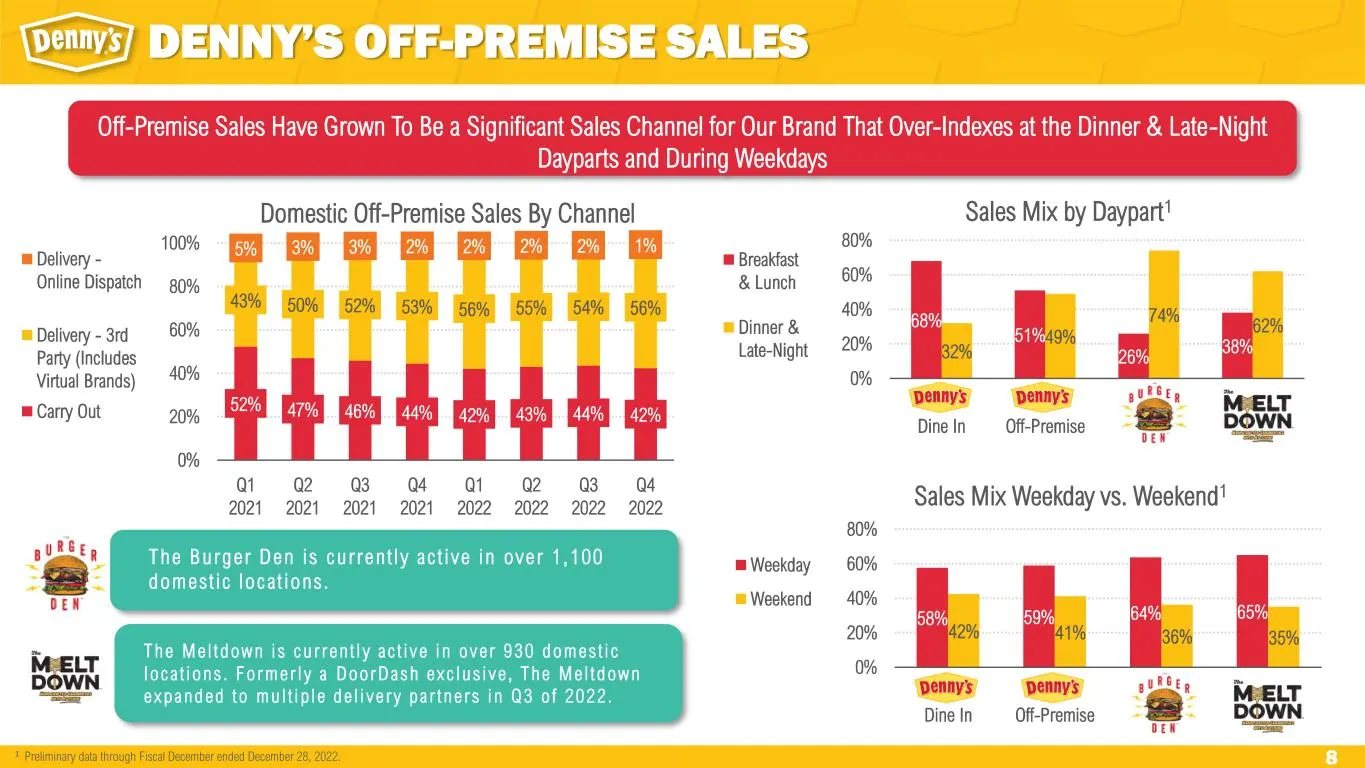
Slide 8: Denny's Off-Premise Sales
8 58% 59% 64% 65% 42% 41% 36% 35% 0% 20% 40% 60% 80% Dine In Off-Premise The Burger Den The Meltdown Sales Mix Weekday vs. Weekend1 Weekday Weekend 52% 47% 46% 44% 42% 43% 44% 42% 43% 50% 52% 53% 56% 55% 54% 56% 5% 3% 3% 2% 2% 2% 2% 1% 0% 20% 40% 60% 80% 100% Q1 2021 Q2 2021 Q3 2021 Q4 2021 Q1 2022
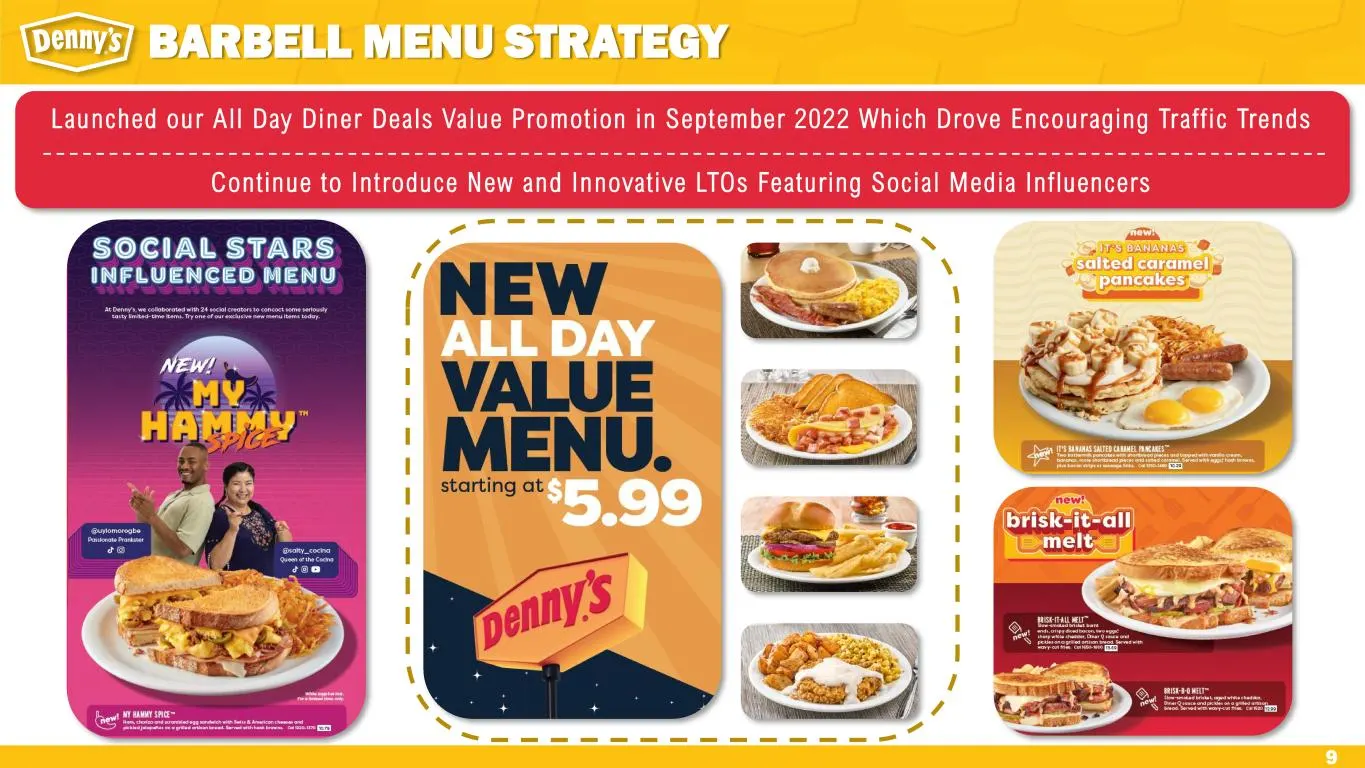
Slide 9: Barbell Menu Strategy
9 BARBELL MENU STRATEGY Launched our A l l Day Diner Deals Value Promot ion in September 2022 Which Drove Encouraging Traf f ic Trends Continue to In t roduce New and Innovat ive LTOs Featur ing Socia l Media In f luencers
Slide 10: Denny's Domestic Footprint
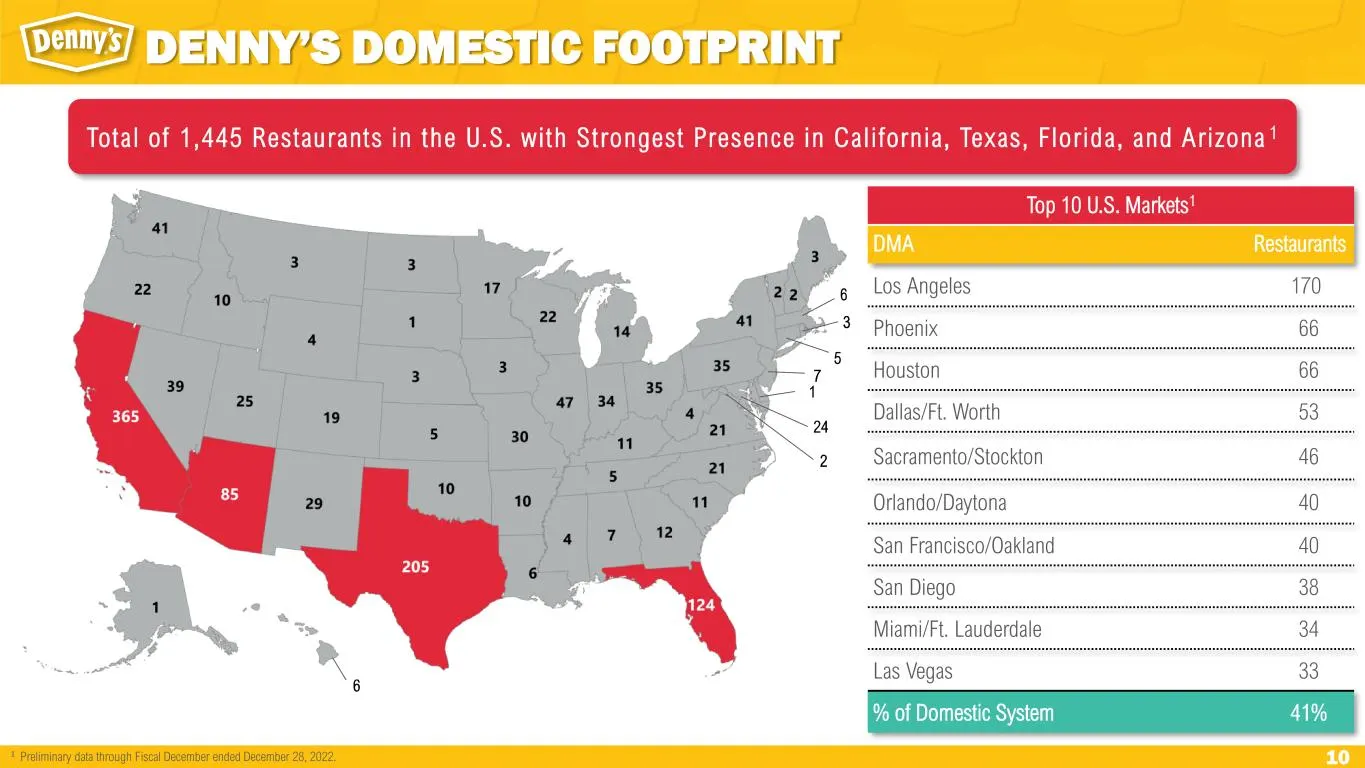
10 DENNY’S DOMESTIC FOOTPRINT Tota l of 1,445 Restaurants in the U.S. wi th Strongest Presence in Cal i fornia, Texas, Flor ida, and Ar izona 1 Top 10 U.S. Markets1 DMA Restaurants Los Angeles 170 Phoenix 66 Houston 66 Dallas/Ft. Worth 53 Sacramento/Stockton 46 Orlando/Daytona 40 San Francisco/Oakla
Slide 11: Denny's International Footprint
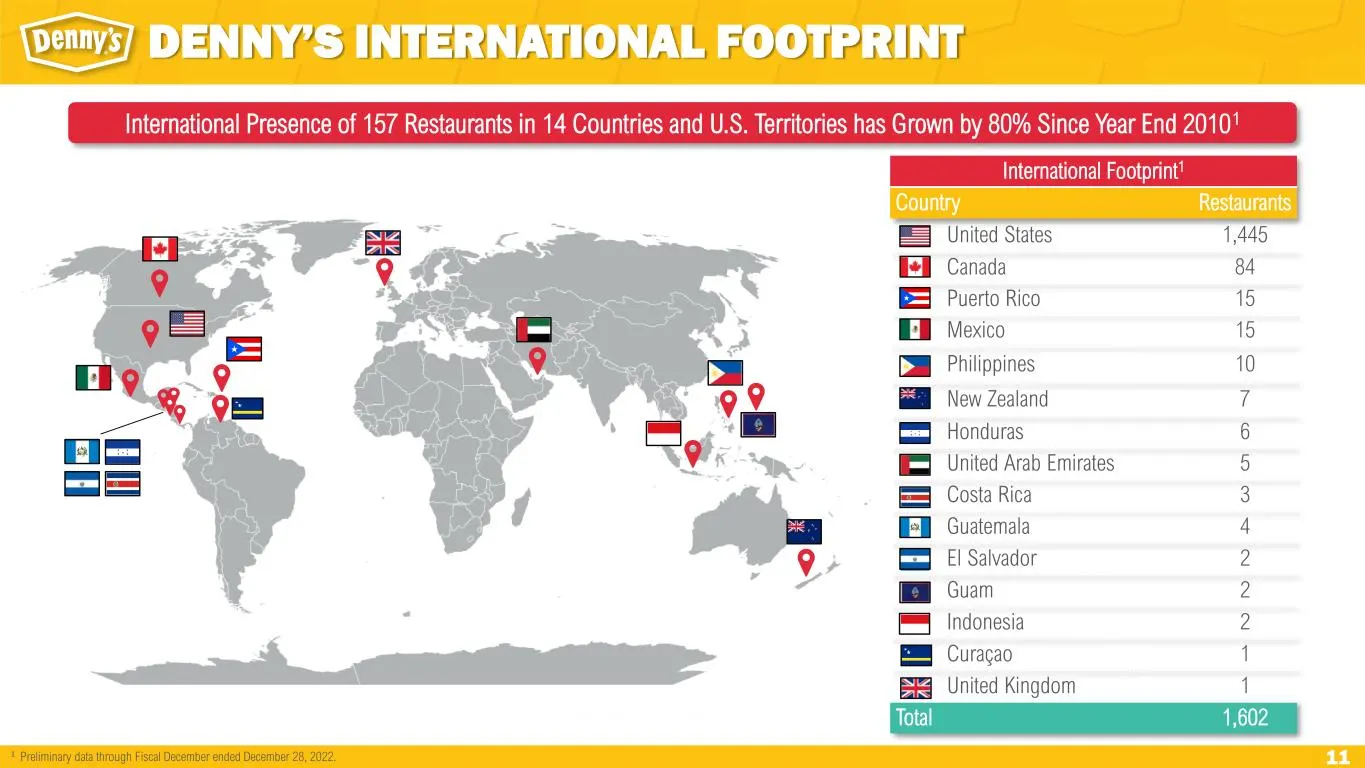
11 DENNY’S INTERNATIONAL FOOTPRINT International Presence of 157 Restaurants in 14 Countries and U.S. Territories has Grown by 80% Since Year End 20101 International Footprint1 Country Restaurants United States 1,445 Canada 84 Puerto Rico 15 Mexico 15 Philippines 10 New Zealand 7 Honduras 6 United A
Slide 12: Denny's Strong Partnership with Franchisees
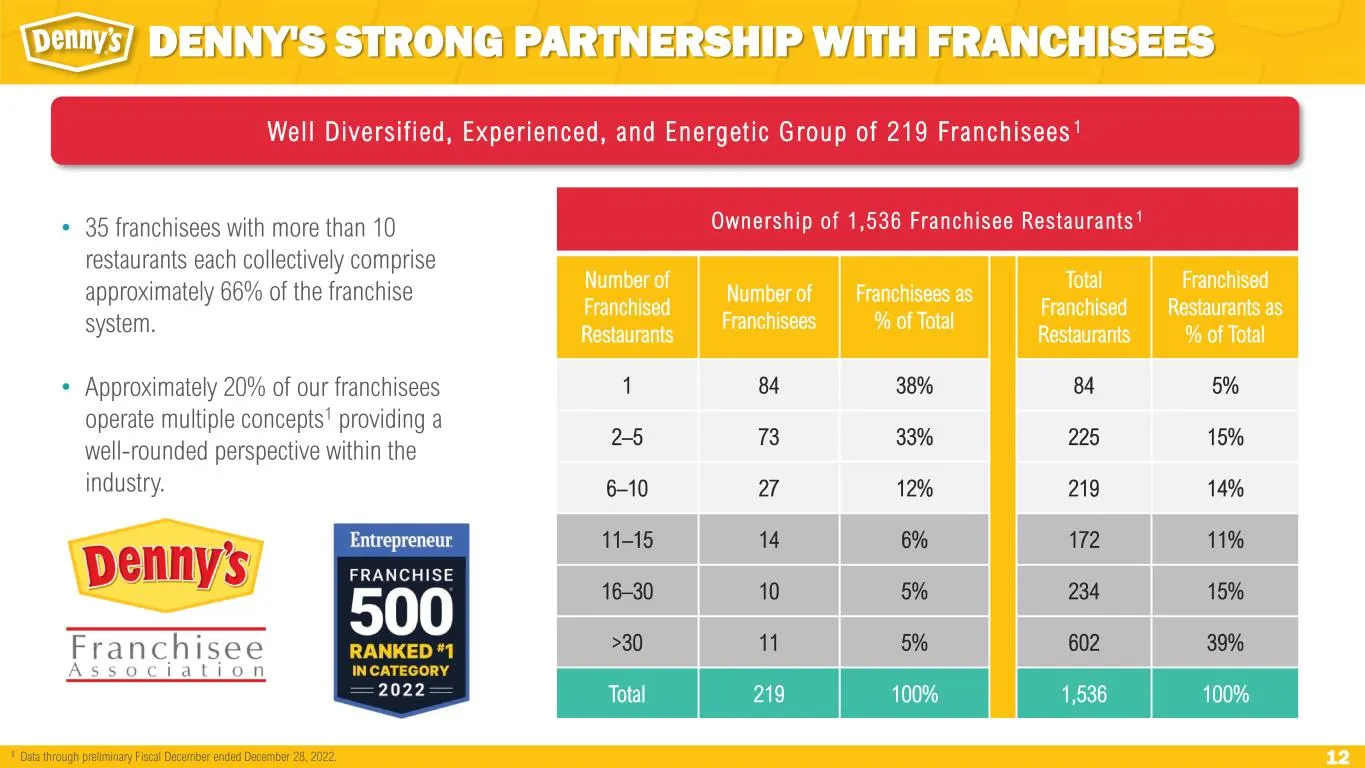
12 Well Diversi f ied, Exper ienced, and Energet ic Group of 219 Franchisees 1 • 35 franchisees with more than 10 restaurants each collectively comprise approximately 66% of the franchise system. • Approximately 20% of our franchisees operate multiple concepts1 providing a well-rounded perspective w
Slide 13: Keke's Footprint
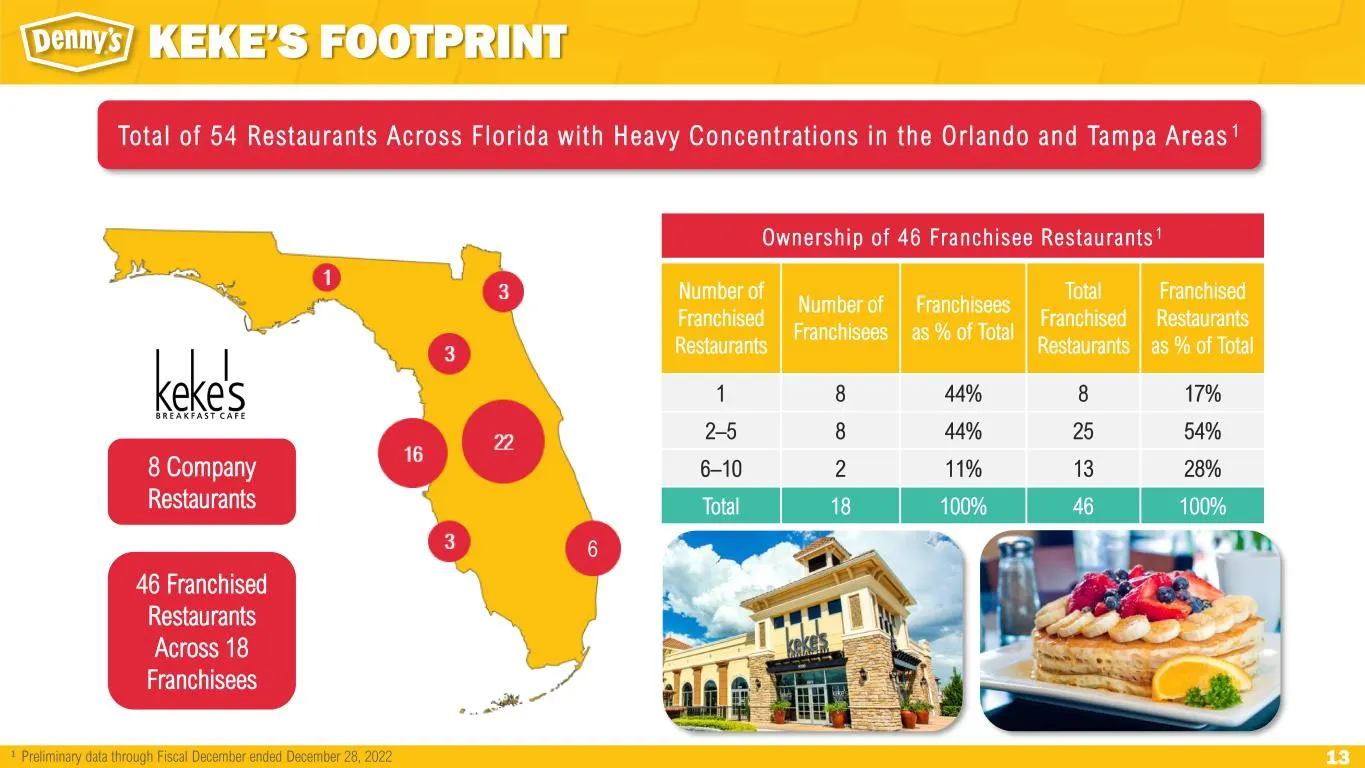
13 6 KEKE’S FOOTPRINT Tota l of 54 Restaurants Across Flor ida wi th Heavy Concentrat ions in the Orlando and Tampa Areas 1 8 Company Restaurants 46 Franchised Restaurants Across 18 Franchisees 𝟏 Preliminary data through Fiscal December ended December 28, 2022 Ownership o f 46 Franchisee…
Slide 14: Keke's Performance Comparison
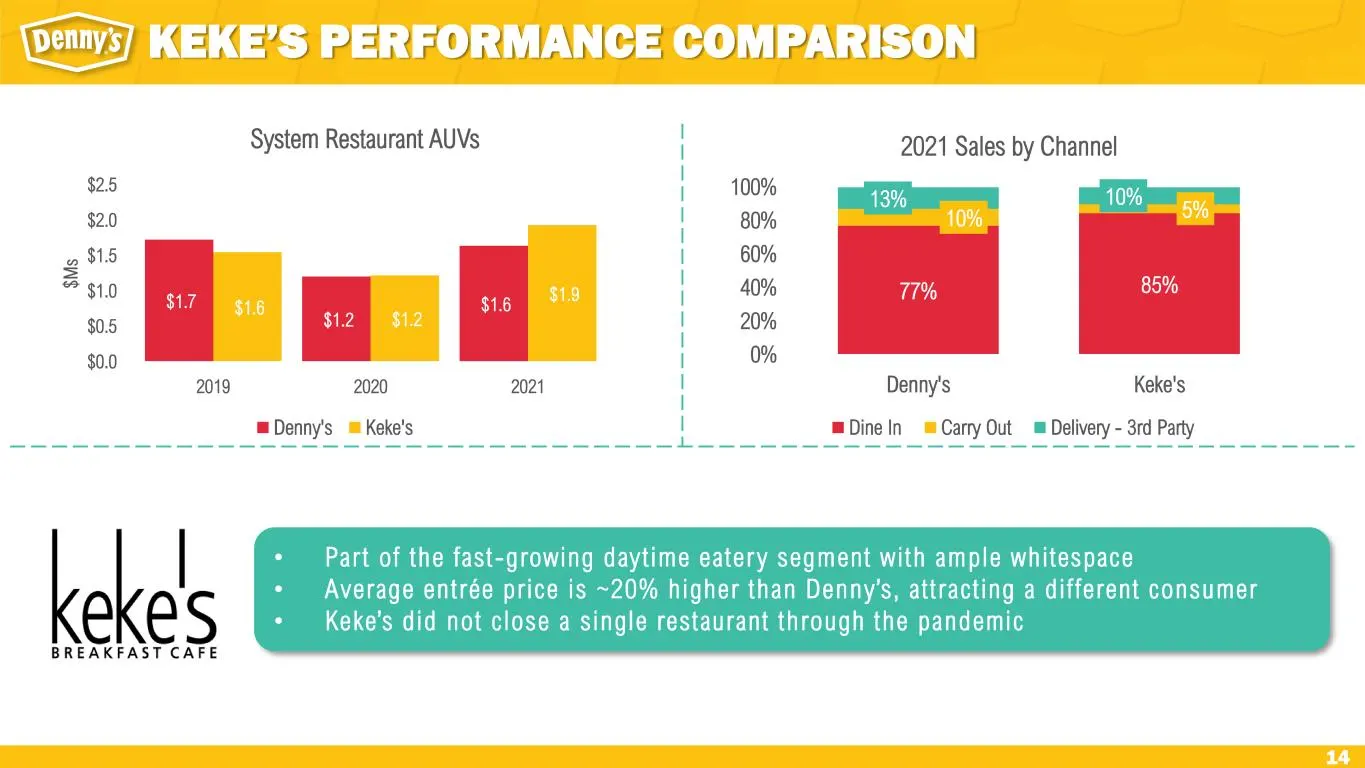
14 KEKE’S PERFORMANCE COMPARISON $1.7 $1.2 $1.6 $1.6 $1.2 $1.9 $0.0 $0.5 $1.0 $1.5 $2.0 $2.5 2019 2020 2021 $M s System Restaurant AUVs Denny's Keke's 77% 85% 10% 5% 13% 10% 0% 20% 40% 60% 80% 100% Denny's Keke's 2021 Sales by Channel Dine In Carry Out Delivery - 3rd Party • Par t of the fast -growi
Slide 15: History of Consistently Returning Capital to Shareholders
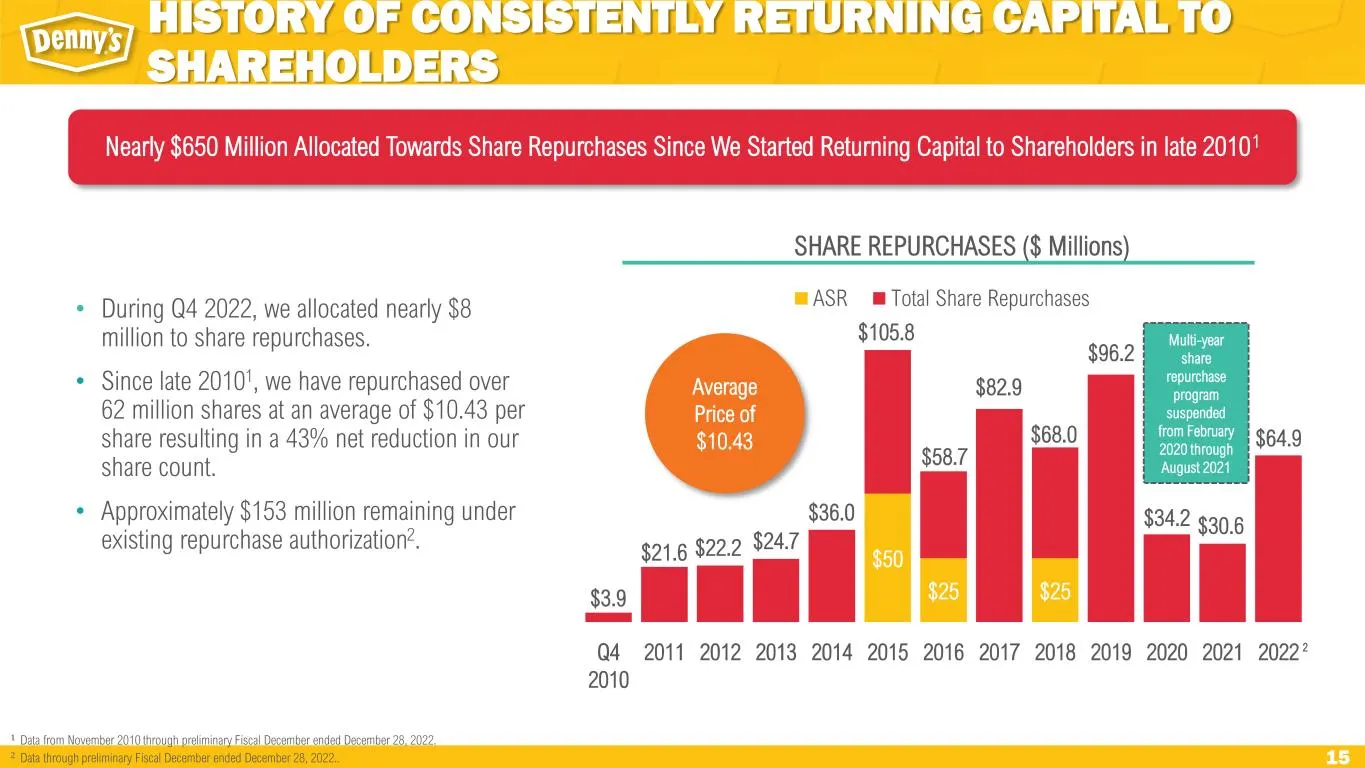
15 $50 $25 $25 $3.9 $21.6 $22.2 $24.7 $36.0 $82.9 $96.2 $34.2 $30.6 $64.9 Q4 2010 2011 2012 2013 2014 2015 2016 2017 2018 2019 2020 2021 2022 ASR Total Share Repurchases• During Q4 2022, we allocated nearly $8 million to share repurchases. • Since late 20101, we have repurchased over 62 million shar
Slide 16: Disciplined Focus on Debt Leverage
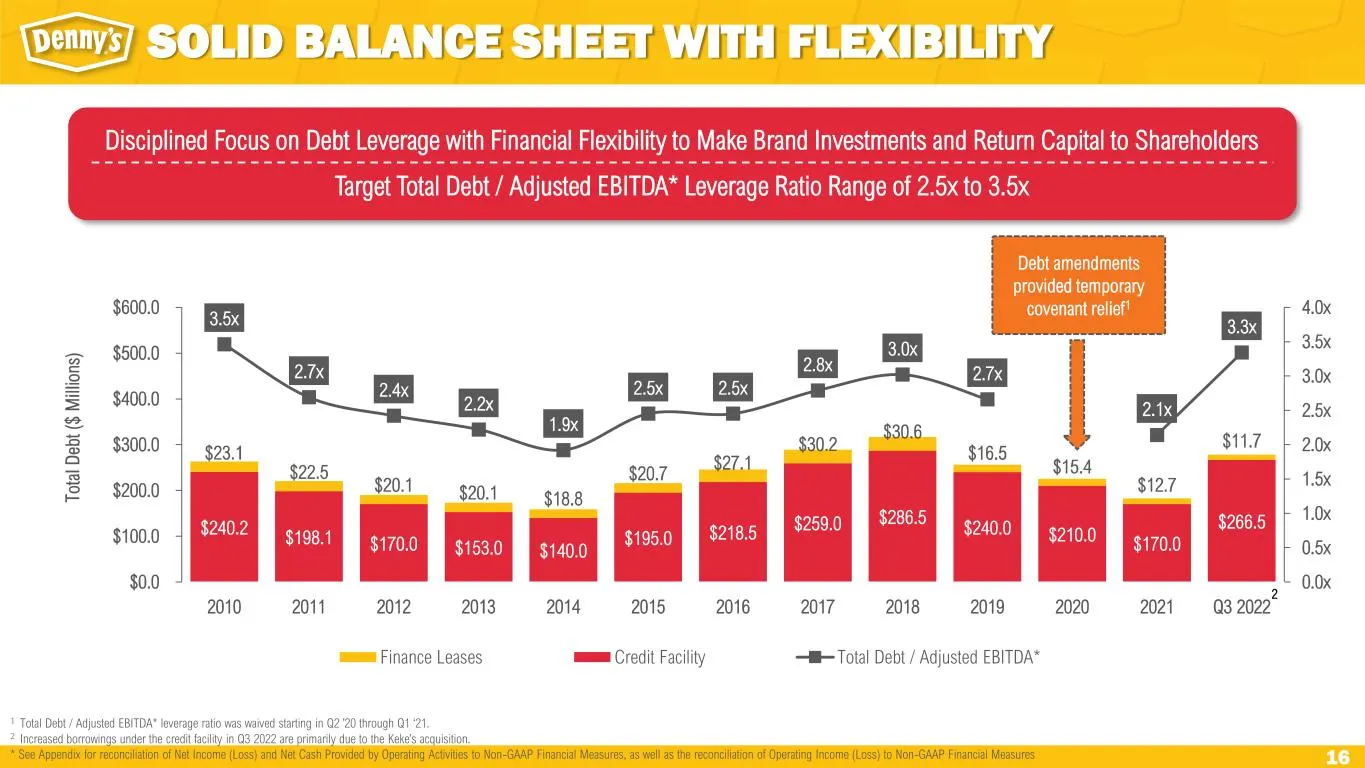
16 Disciplined Focus on Debt Leverage with Financial Flexibility to Make Brand Investments and Return Capital to Shareholders Target Total Debt / Adjusted EBITDA* Leverage Ratio Range of 2.5x to 3.5x 1 Total Debt / Adjusted EBITDA* leverage ratio was waived starting in Q2 ’20 through Q1 ‘21. 2 Incre
Slide 17: Near-Term Focus: The Big Three
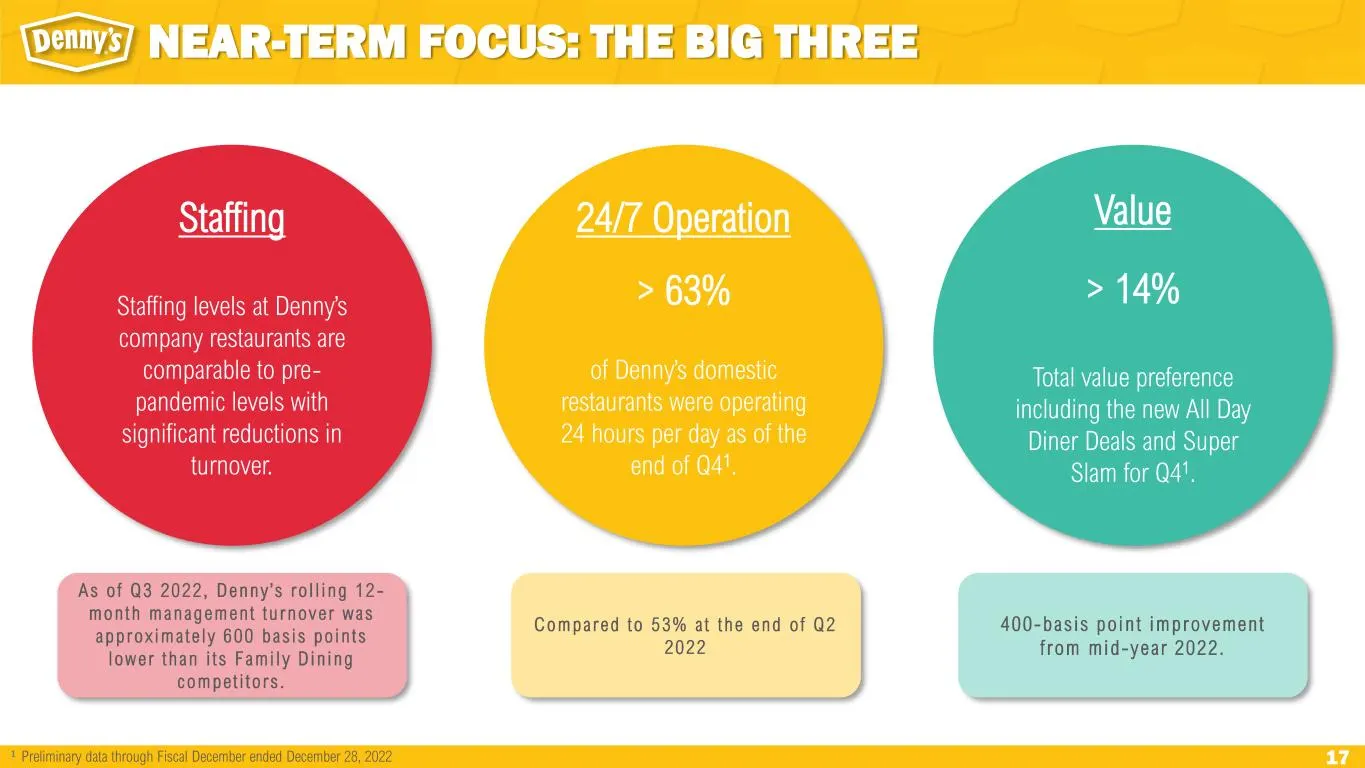
17 NEAR-TERM FOCUS: THE BIG THREE Staffing Staffing levels at Denny’s company restaurants are comparable to pre- pandemic levels with significant reductions in turnover. 24/7 Operation > 63% of Denny’s domestic restaurants were operating 24 hours per day as of the end of Q41. Value > 14% Total value
Slide 18: Strategic Priorities
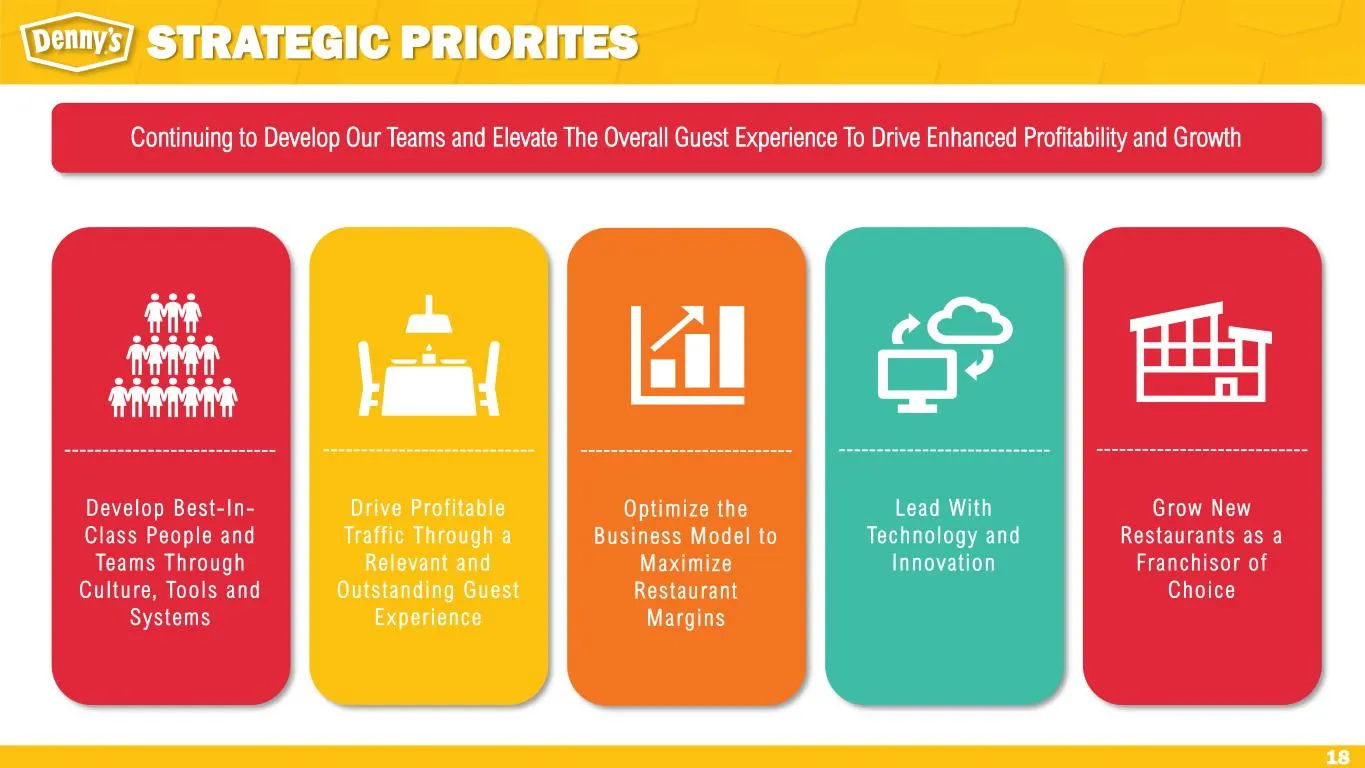
18 STRATEGIC PRIORITES Deve lop Bes t- In- Class Peop le and Teams Through Cu l tu re, Too ls and Sys tems Dr ive Pro f i tab le Tra f f ic Through a Re levant and Ou ts tanding Gues t Exper ience Opt imize the Bus iness Mode l to Max imize Res taurant Margins Lead Wi th Technology and Innova t ion

Slide 19: Appendix
APPENDIX
Slide 20: Franchised and Company Restaurant Sales
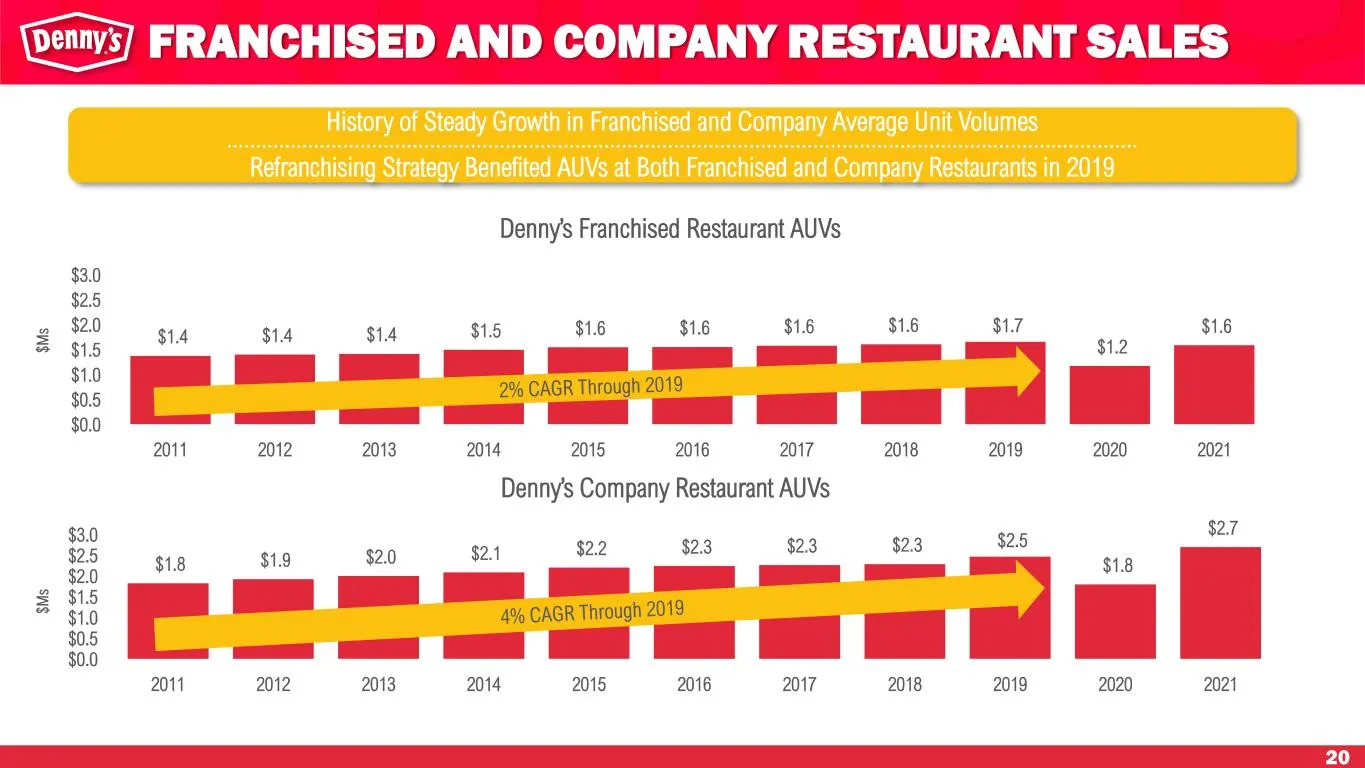
20 $1.8 $1.9 $2.0 $2.1 $2.2 $2.3 $2.3 $2.3 $2.5 $1.8 $2.7 $0.0 $0.5 $1.0 $1.5 $2.0 $2.5 $3.0 2011 2012 2013 2014 2015 2016 2017 2018 2019 2020 2021 Denny’s Company Restaurant AUVs History of Steady Growth in Franchised and Company Average Unit Volumes Refranchising Strategy Benefited AUVs at Both Fr
Slide 21: Adjusted Free Cash Flow
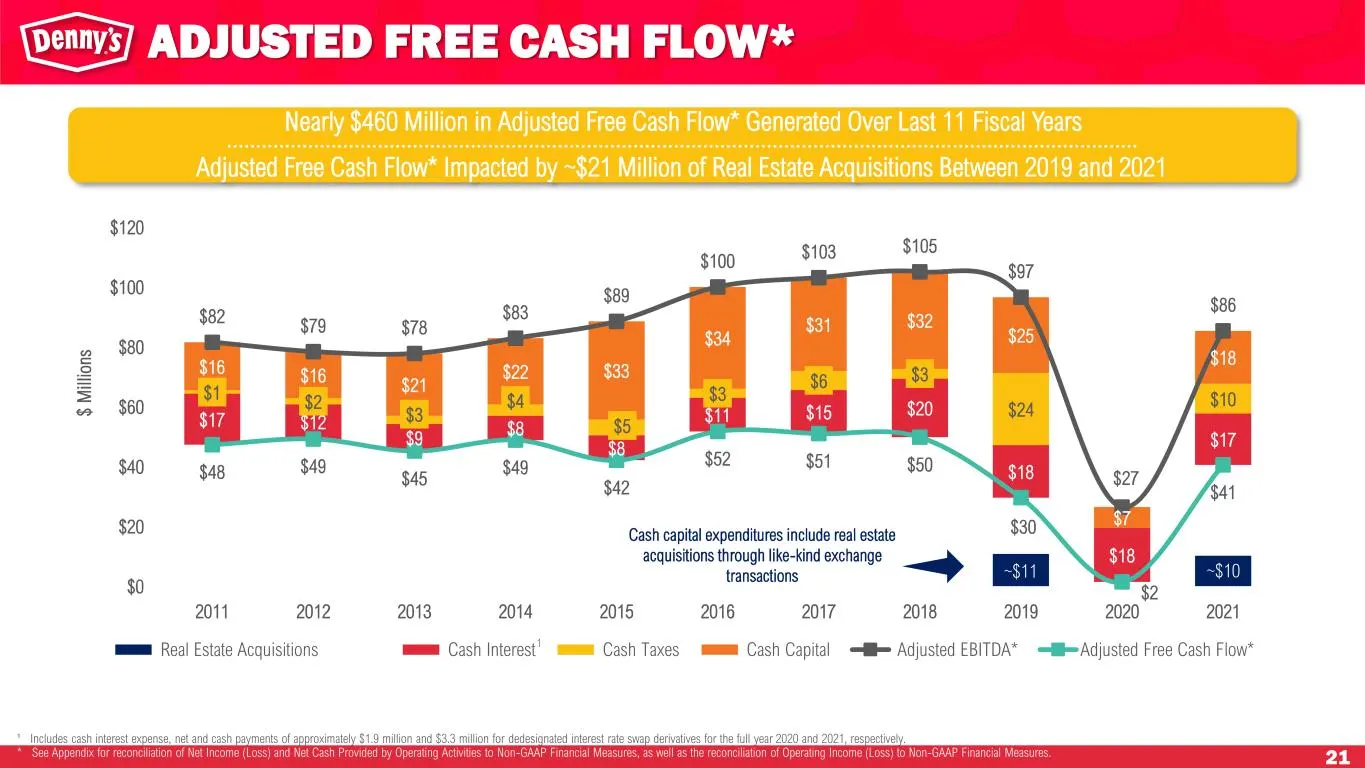
21 ~$11 ~$10 $17 $12 $9 $8 $8 $11 $15 $20 $18 $18 $17 $1 $2 $3 $4 $5 $3 $6 $3 $24 $10 $16 $16 $21 $22 $33 $34 $31 $32 $25 $7 $18 $82 $79 $78 $83 $89 $100 $103 $105 $97 $27 $86 $48 $49 $45 $49 $42 $52 $51 $50 $30 $2 $41 $0 $20 $40 $60 $80 $100 $120 2011 2012 2013 2014 2015 2016 2017 2018 2019 2020 20
Slide 22: Experienced and Committed Leadership Team
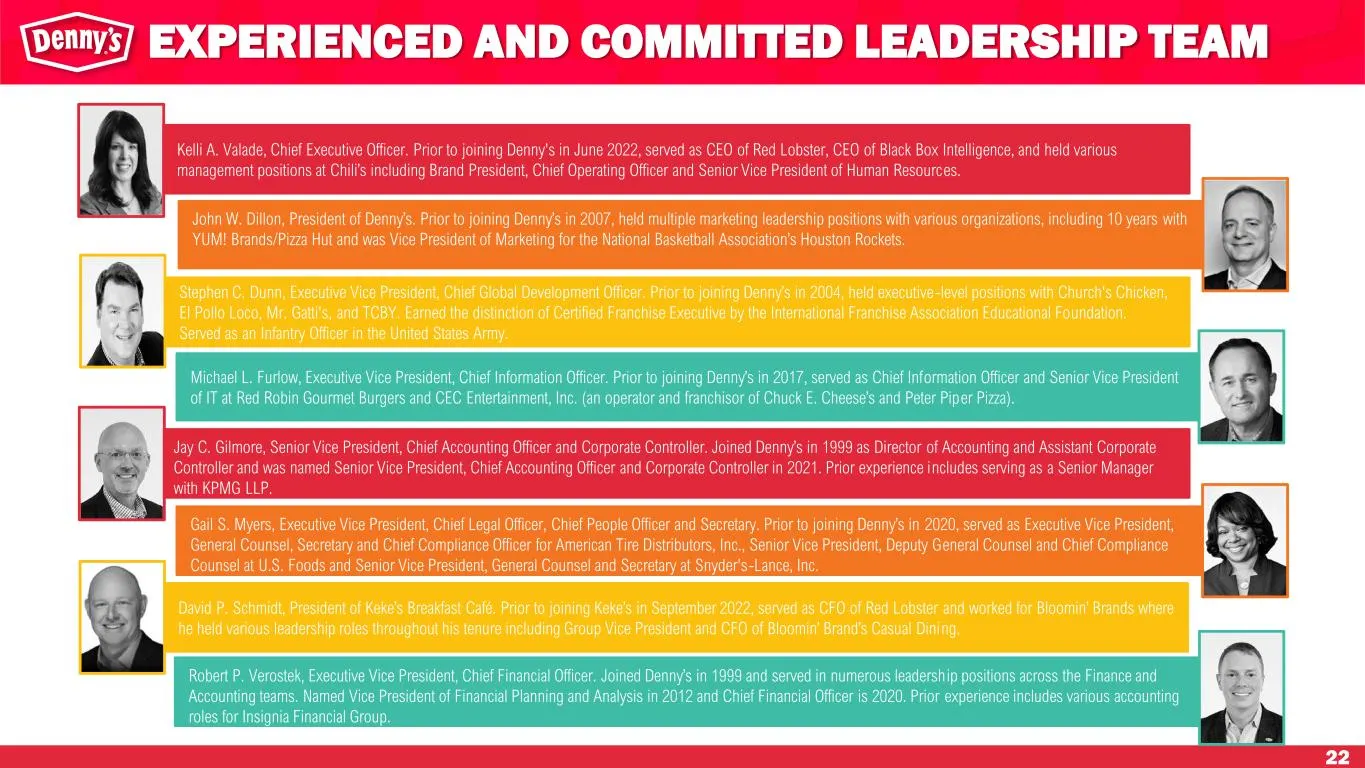
22 Michael L. Furlow, Executive Vice President, Chief Information Officer. Prior to joining Denny’s in 2017, served as Chief Information Officer and Senior Vice President of IT at Red Robin Gourmet Burgers and CEC Entertainment, Inc. (an operator and franchisor of Chuck E. Cheese’s and Peter Piper P
Slide 23: Reconciliation of Net Income (Loss) to Non-GAAP Financial Measures
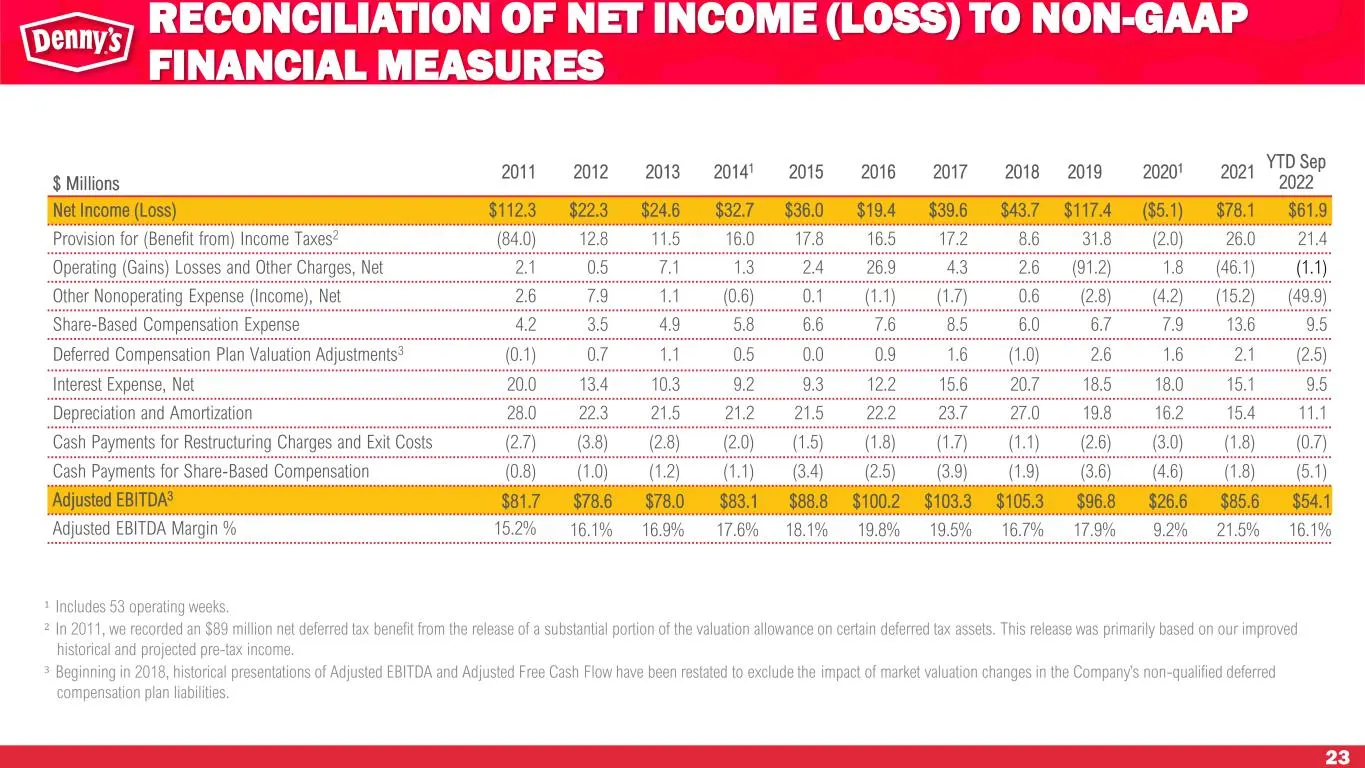
23 RECONCILIATION OF NET INCOME (LOSS) TO NON-GAAP FINANCIAL MEASURES $ Millions 2011 2012 2013 20141 2015 2016 2017 2018 2019 20201 2021 YTD Sep 2022 Net Income (Loss) $112.3 $22.3 $24.6 $32.7 $36.0 $19.4 $39.6 $43.7 $117.4 ($5.1) $78.1 $61.9 Provision for (Benefit from) Income Taxes2 (84.0) 12.8 1
Slide 24: Non-GAAP reconciliation footnotes
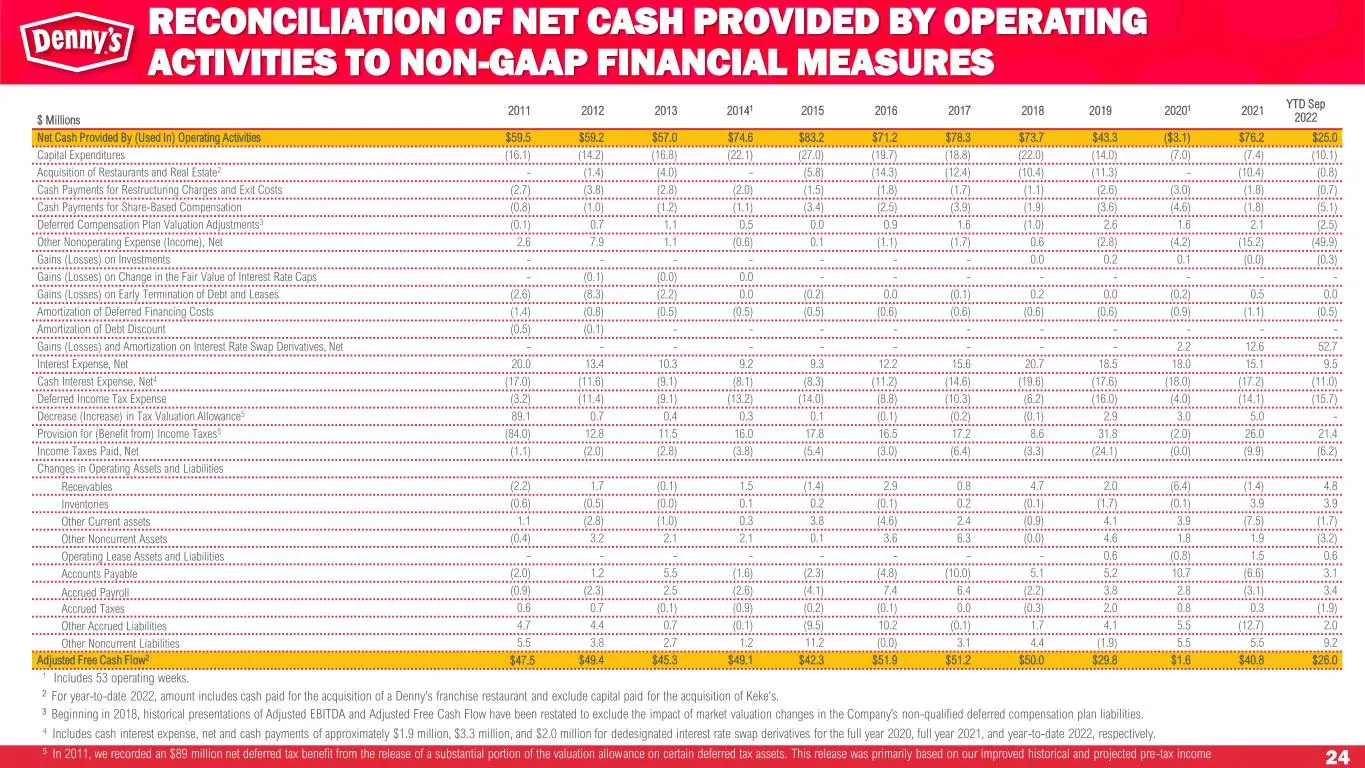
24 ¹ Includes 53 operating weeks. 2 For year-to-date 2022, amount includes cash paid for the acquisition of a Denny's franchise restaurant and exclude capital paid for the acquisition of Keke's. 3 Beginning in 2018, historical presentations of Adjusted EBITDA and Adjusted Free Cash Flow have been re
Slide 25: Non-GAAP reconciliation footnotes
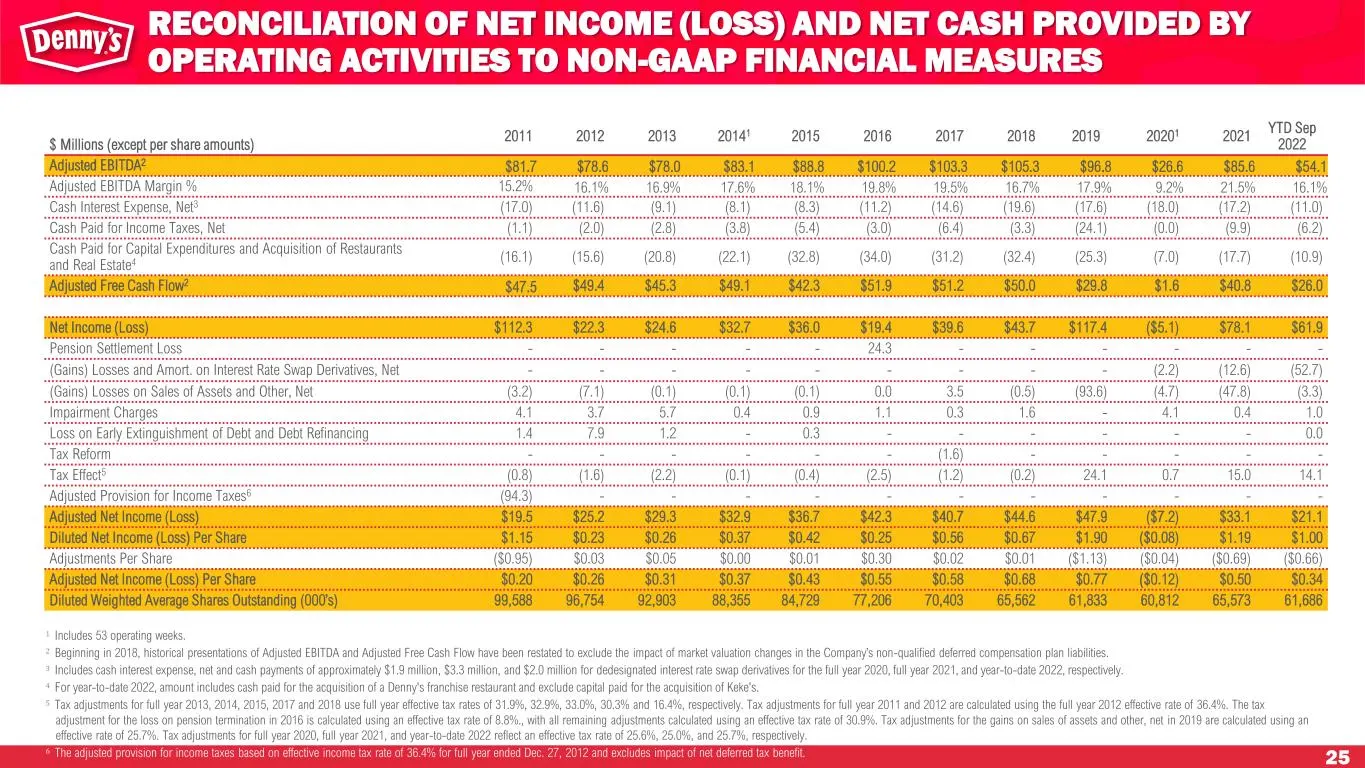
25 1 Includes 53 operating weeks. 2 Beginning in 2018, historical presentations of Adjusted EBITDA and Adjusted Free Cash Flow have been restated to exclude the impact of market valuation changes in the Company’s non-qualified deferred compensation plan liabilities. 3 Includes cash interest expense,
Slide 26: Reconciliation of Operating Income to Restaurant-Level Operating Margin
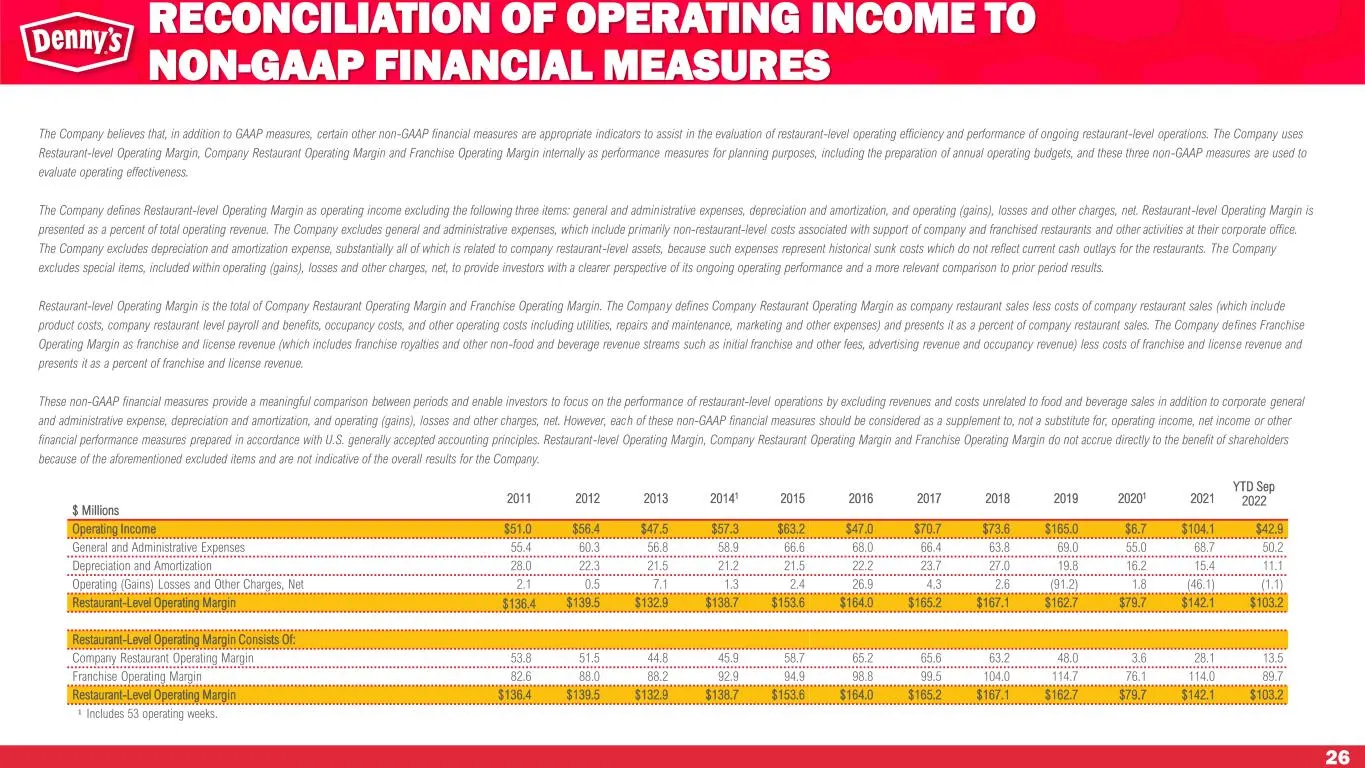
26 $ Millions 2011 2012 2013 20141 2015 2016 2017 2018 2019 20201 2021 YTD Sep 2022 Operating Income $51.0 $56.4 $47.5 $57.3 $63.2 $47.0 $70.7 $73.6 $165.0 $6.7 $104.1 $42.9 General and Administrative Expenses 55.4 60.3 56.8 58.9 66.6 68.0 66.4 63.8 69.0 55.0 68.7 50.2 Depreciation and Amortization
Source: SEC EDGAR · 8-K filed Jan 9, 2023
More decks from Dennys Corp
 Investor Presentation (August 2025)30 slides · Aug 4, 2025
 Investor Presentation (May 2025)32 slides · May 2025
 Investor Presentation (February 2025)32 slides · February 2025
 Investor Presentation (January 2025)32 slides · Jan 13, 2025
 Investor Day (October 2024)137 slides · Oct 22, 2024
 Q2 2024 Earnings Presentation22 slides · Jul 30, 2024