Dennys — Investor Presentation (May 2022)
41 slides from Dennys's investor presentation, May 3, 2022
Slide 1: Investor Presentation May through July 2022
INVESTOR PRESENTATION May through July 2022
Slide 2: Forward-looking statements
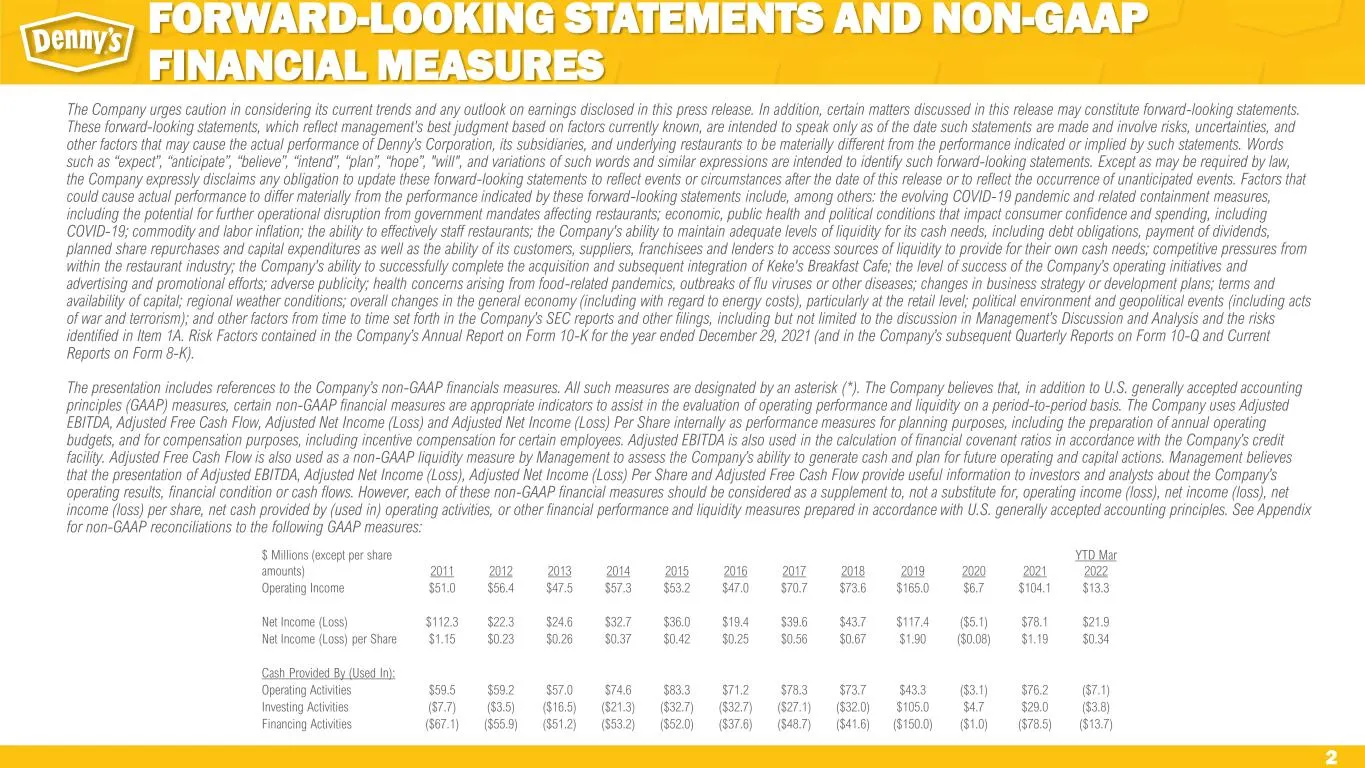
2 The Company urges caution in considering its current trends and any outlook on earnings disclosed in this press release. In addition, certain matters discussed in this release may constitute forward-looking statements. These forward-looking statements, which reflect management's best judgment base
Slide 3: Denny's Investment Highlights
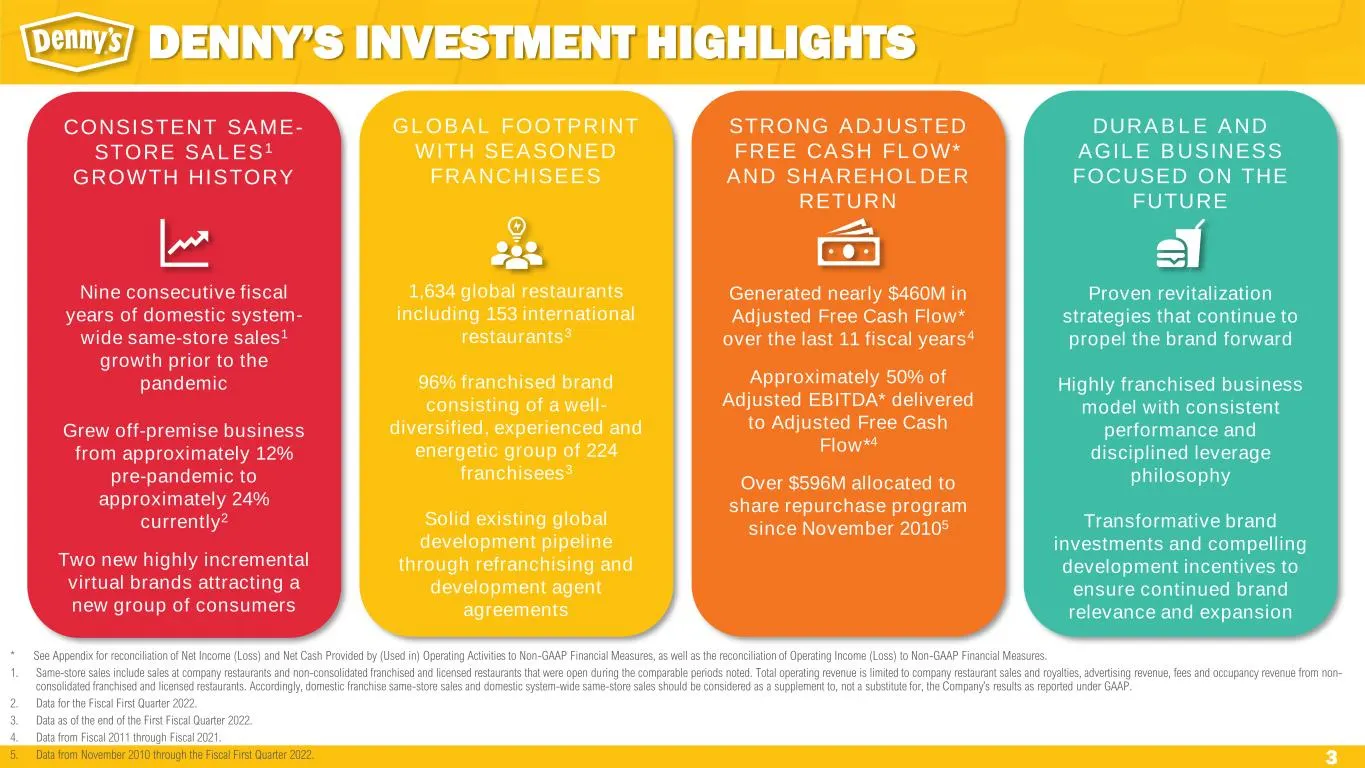
3 CONSISTENT SAME- STORE SALES1 GROWTH HISTORY Nine consecutive fiscal years of domestic system- wide same-store sales1 growth prior to the pandemic Grew off-premise business from approximately 12% pre-pandemic to approximately 24% currently2 Two new highly incremental virtual brands attracting a ne
Slide 4: Q1 2022 Results
4 Q1 2022 RESULTS
Slide 5: Q1 2022 Highlights
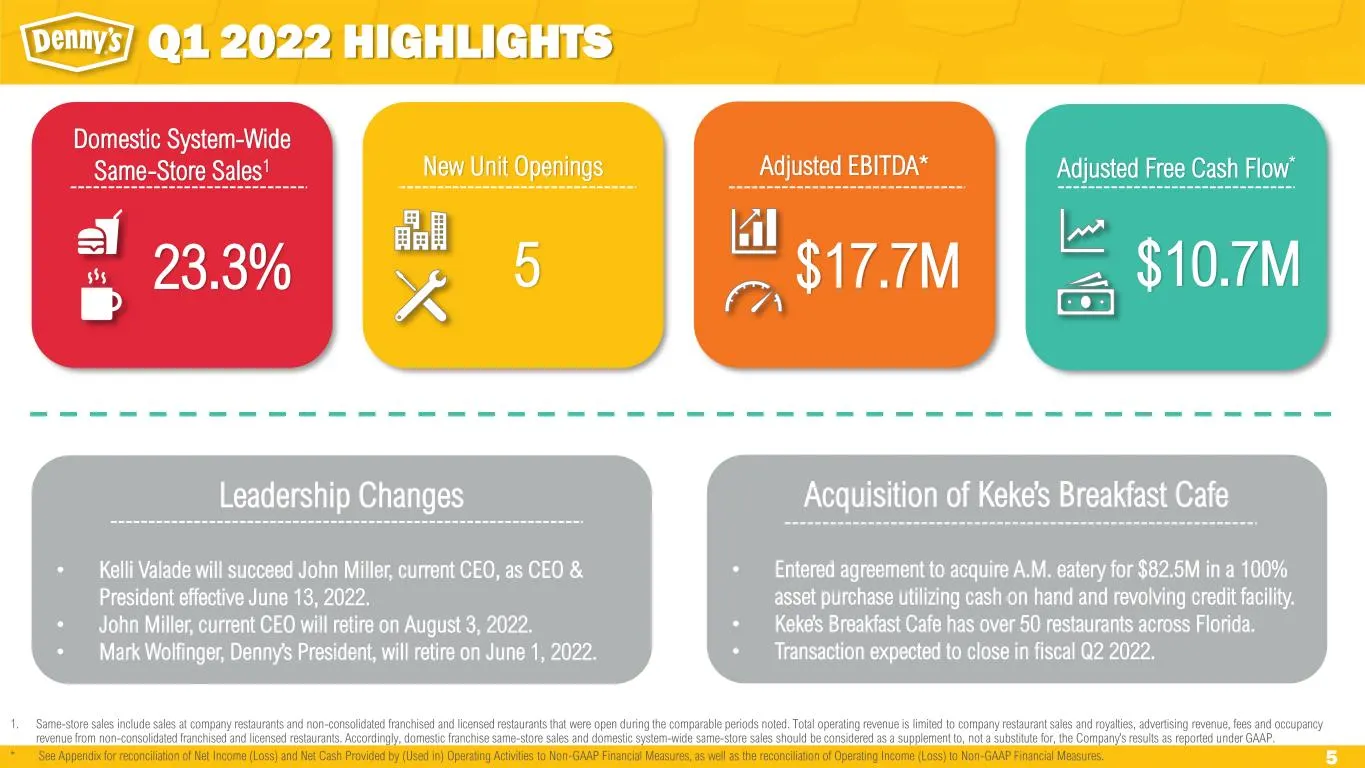
5 Domestic System-Wide Same-Store Sales1 Q1 2022 HIGHLIGHTS 1. Same-store sales include sales at company restaurants and non-consolidated franchised and licensed restaurants that were open during the comparable periods noted. Total operating revenue is limited to company restaurant sales and royalti
Slide 6: Sales & Hours of Operations
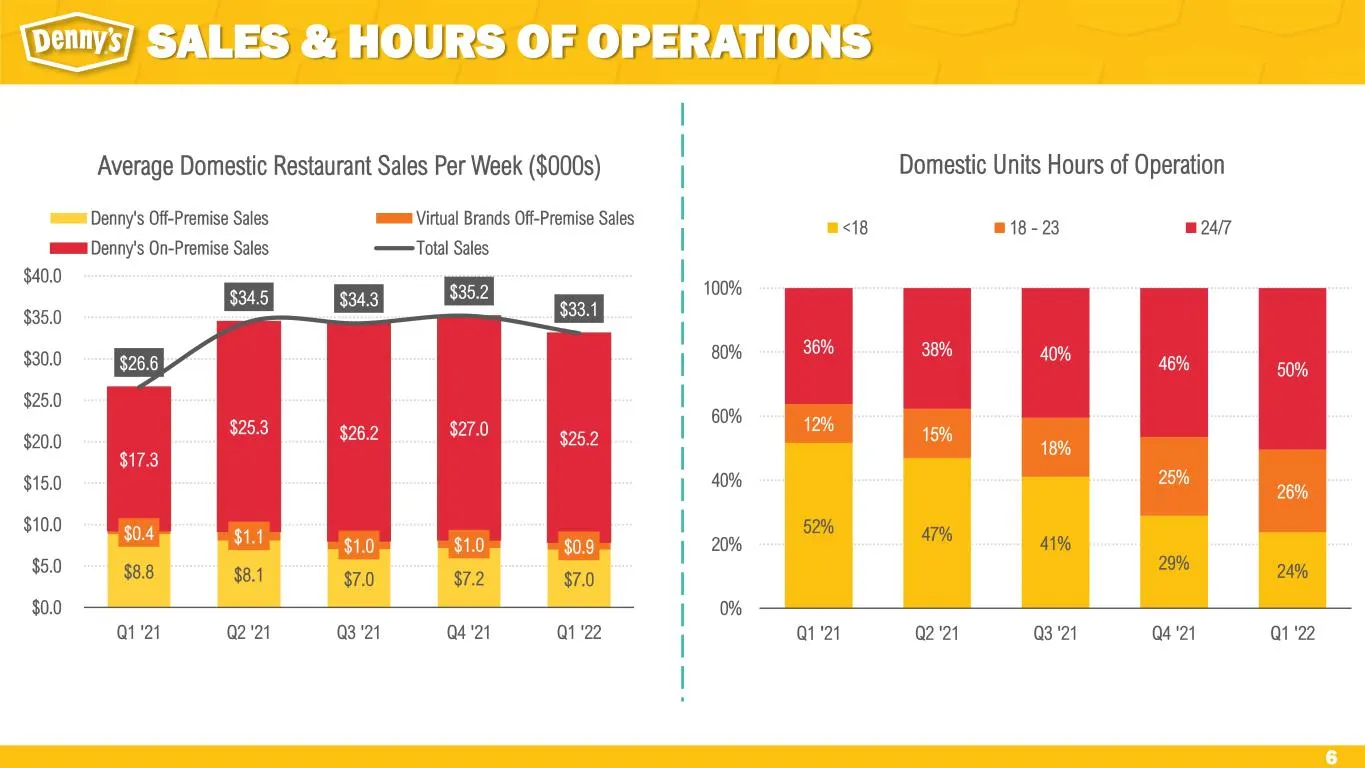
6 SALES & HOURS OF OPERATIONS $8.8 $8.1 $7.0 $7.2 $7.0 $0.4 $1.1 $1.0 $1.0 $0.9 $17.3 $25.3 $26.2 $27.0 $25.2 $26.6 $34.5 $34.3 $35.2 $33.1 $0.0 $5.0 $10.0 $15.0 $20.0 $25.0 $30.0 $35.0 $40.0 Q1 '21 Q2 '21 Q3 '21 Q4 '21 Q1 '22 Average Domestic Restaurant Sales Per Week ($000s) Denny's Off-Premise Sa
Slide 7: Staffing Retention Efforts
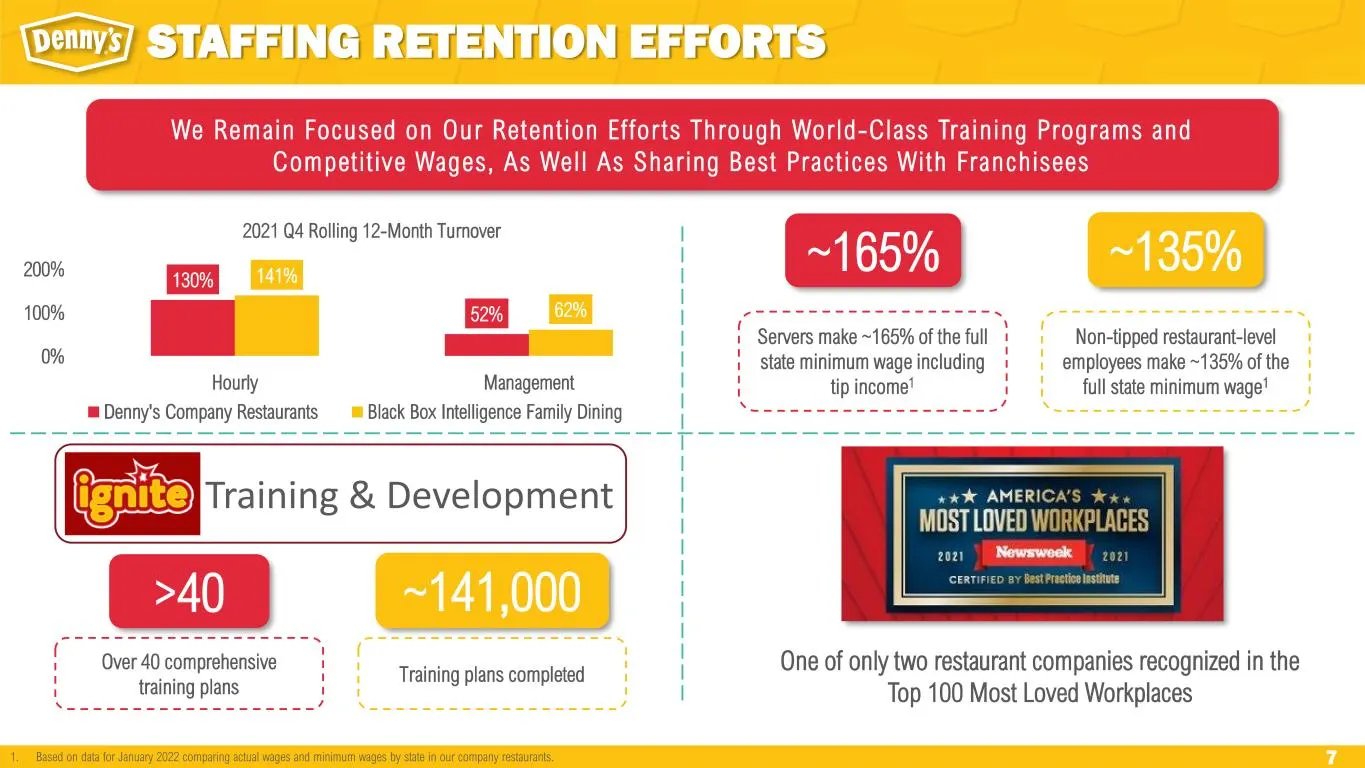
7 STAFFING RETENTION EFFORTS We Remain Focused on Our Retent ion Ef for ts Through World-Class Tra ining Programs and Competi t ive Wages, As Wel l As Shar ing Best Pract ices With Franchisees 130% 52% 141% 62% 0% 100% 200% Hourly Management 2021 Q4 Rolling 12-Month Turnover Denny's Company Restaura
Slide 8: Virtual Brands and Off-Premise Sales
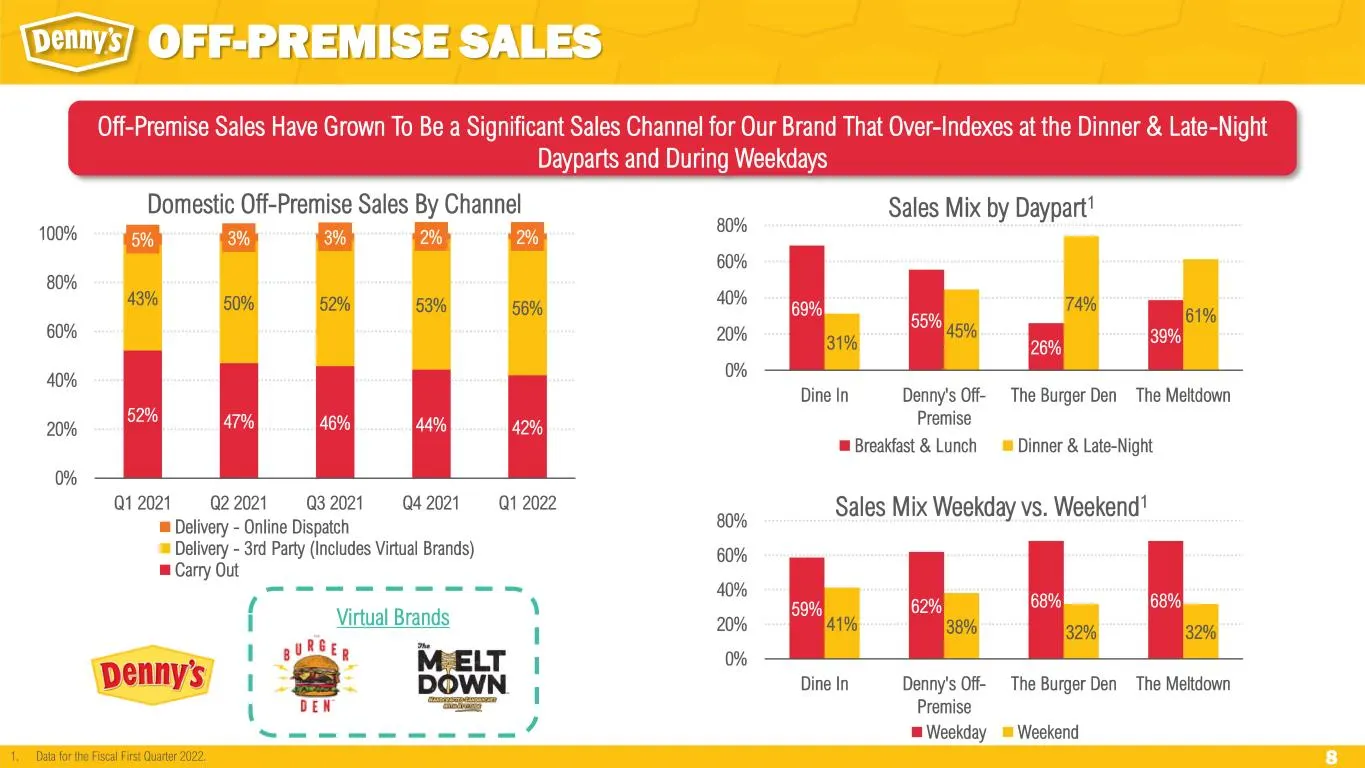
8 Virtual Brands 59% 62% 68% 68% 41% 38% 32% 32% 0% 20% 40% 60% 80% Dine In Denny's Off- Premise The Burger Den The Meltdown Sales Mix Weekday vs. Weekend1 Weekday Weekend 52% 47% 46% 44% 42% 43% 50% 52% 53% 56% 5% 3% 3% 2% 2% 0% 20% 40% 60% 80% 100% Q1 2021 Q2 2021 Q3 2021 Q4 2021 Q1 2022 Domestic
Slide 9: Core Menu
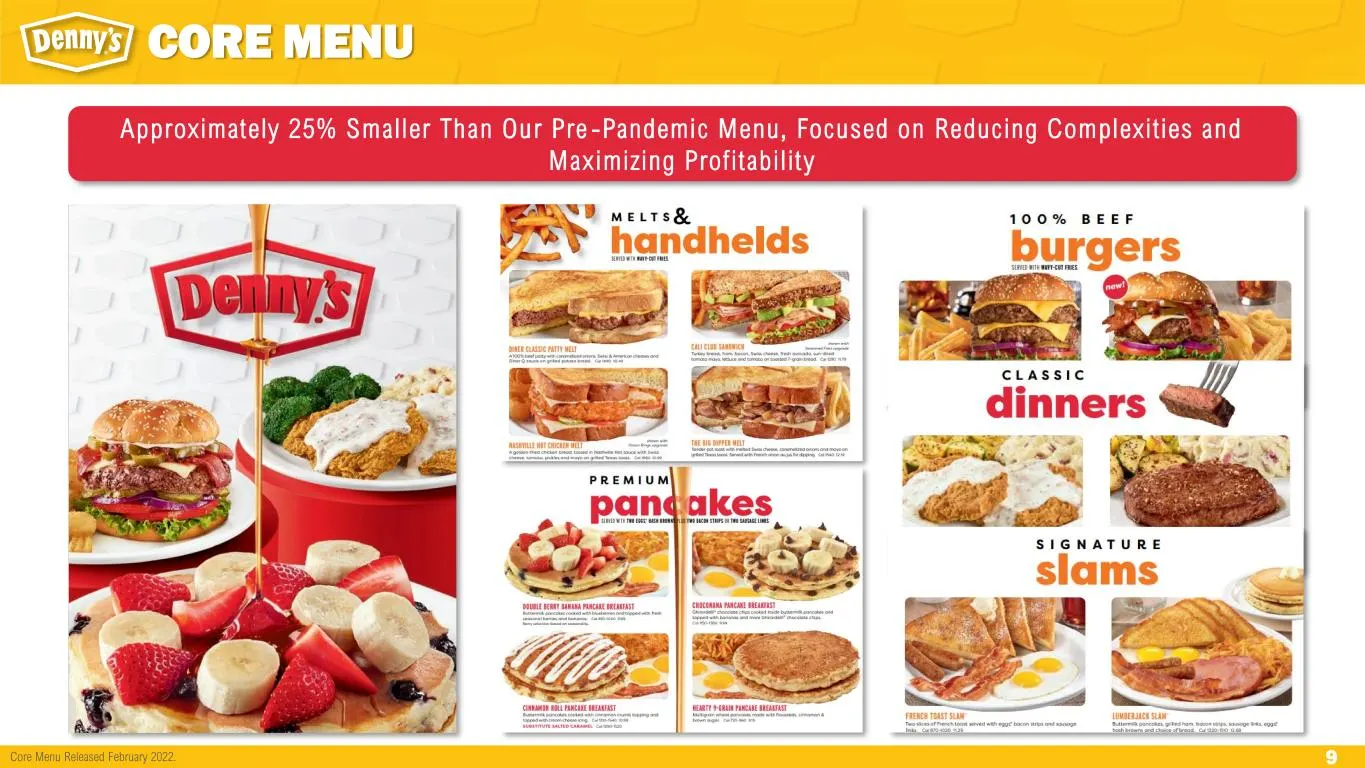
9 CORE MENU Approximately 25% Smaller Than Our Pre -Pandemic Menu, Focused on Reducing Complexi t ies and Maximizing Prof i tabil i t y Core Menu Released February 2022.
Slide 10: Denny's Domestic Footprint
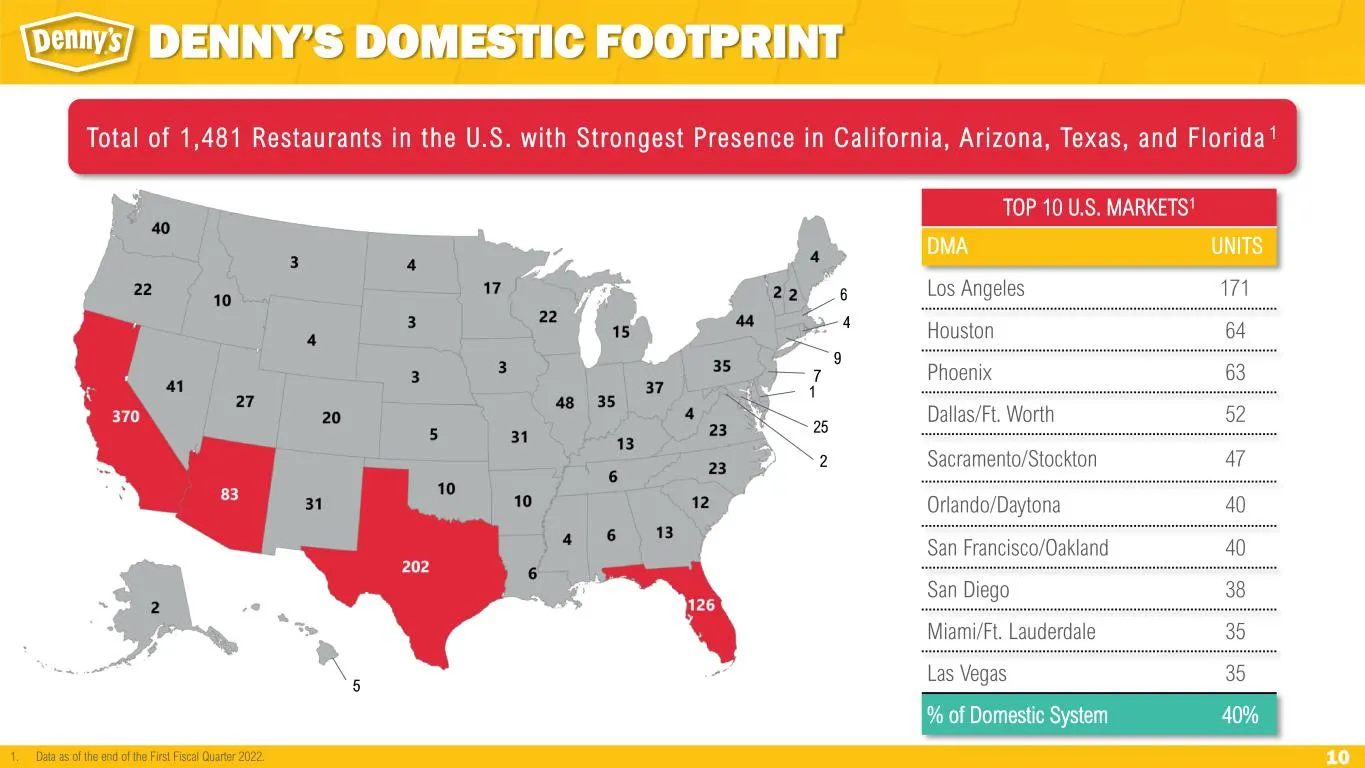
10 DENNY’S DOMESTIC FOOTPRINT Tota l of 1,481 Restaurants in the U.S. wi th Strongest Presence in Cal i fornia, Ar izona, Texas, and Flor ida 1 TOP 10 U.S. MARKETS1 DMA UNITS Los Angeles 171 Houston 64 Phoenix 63 Dallas/Ft. Worth 52 Sacramento/Stockton 47 Orlando/Daytona 40 San Francisco/Oakland 40
Slide 11: Denny's International Footprint
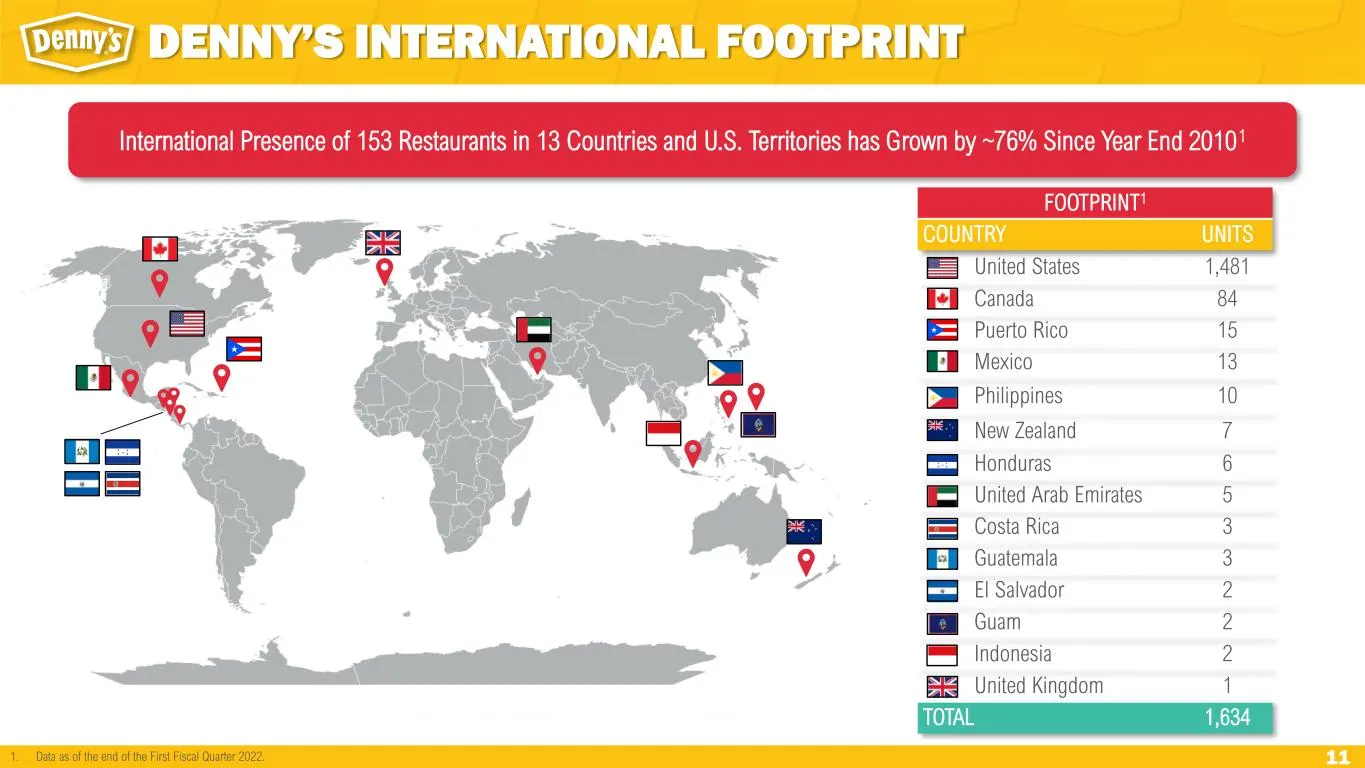
11 DENNY’S INTERNATIONAL FOOTPRINT International Presence of 153 Restaurants in 13 Countries and U.S. Territories has Grown by ~76% Since Year End 20101 FOOTPRINT1 COUNTRY UNITS United States 1,481 Canada 84 Puerto Rico 15 Mexico 13 Philippines 10 New Zealand 7 Honduras 6 United Arab Emirates 5 Cost
Slide 12: Group of 224 Franchisees
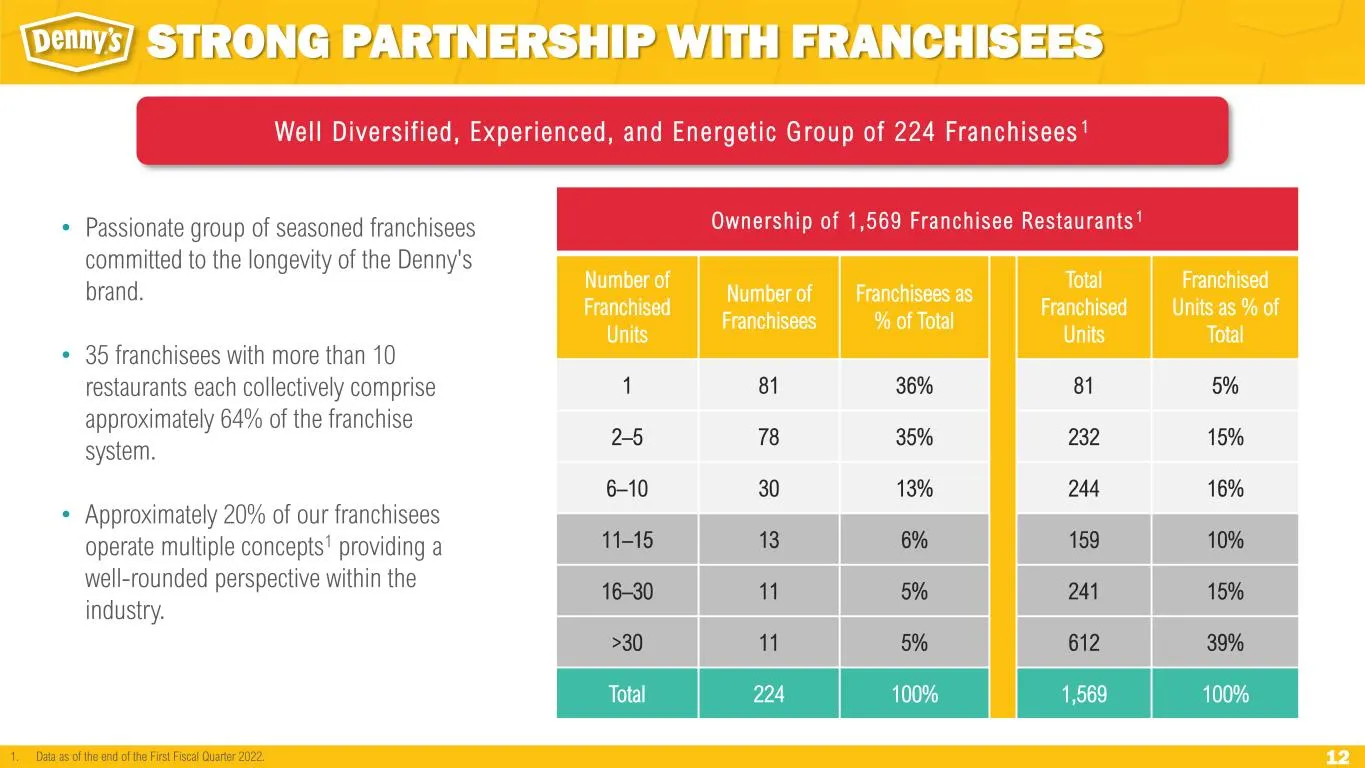
12 Well Diversi f ied, Exper ienced, and Energet ic Group of 224 Franchisees 1 • Passionate group of seasoned franchisees committed to the longevity of the Denny's brand. • 35 franchisees with more than 10 restaurants each collectively comprise approximately 64% of the franchise system. • Approximat

Slide 13: Durable and Agile Brand Focused on the Future
DURABLE AND AGILE BRAND FOCUSED ON THE FUTURE
Slide 14: Brand Revitalization Strategies
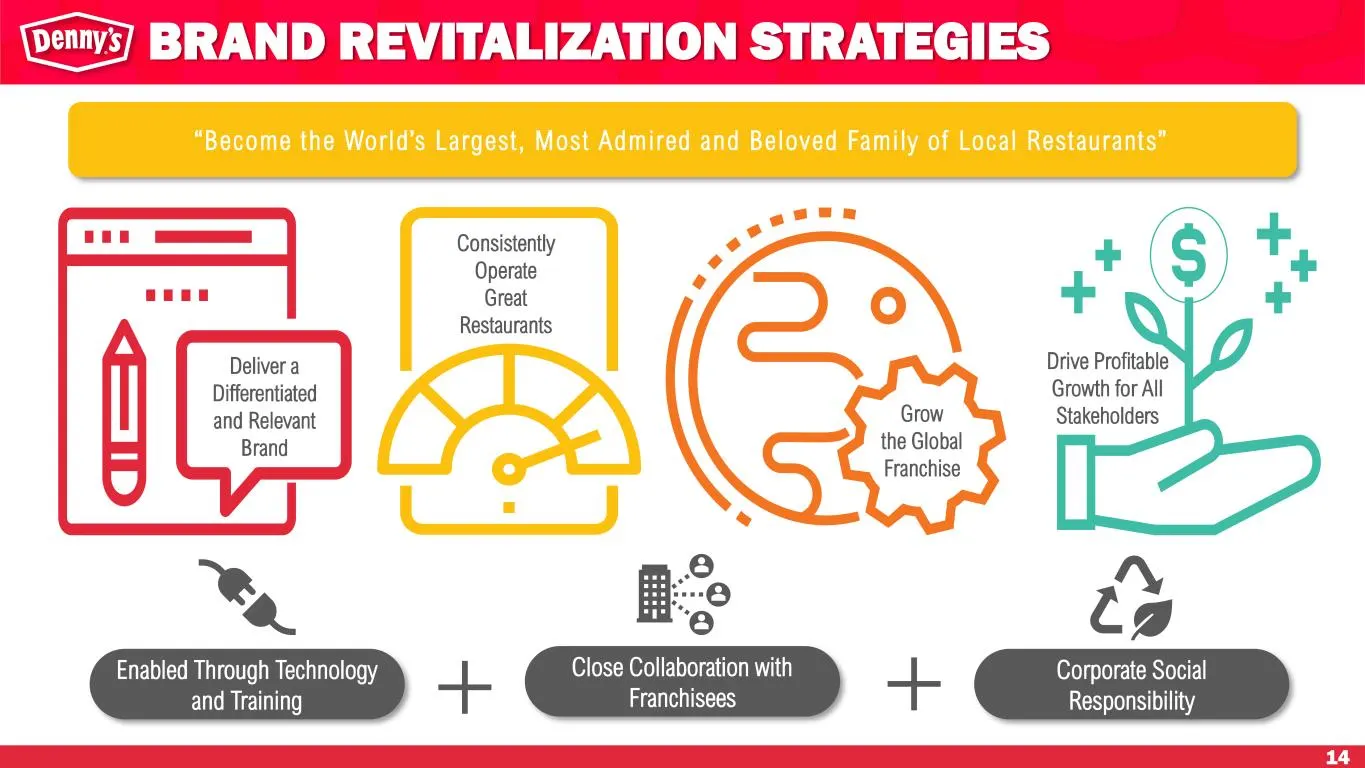
14 BRAND REVITALIZATION STRATEGIES Close Collaboration with Franchisees Consistently Operate Great Restaurants Drive Profitable Growth for All Stakeholders Enabled Through Technology and Training + Deliver a Differentiated and Relevant Brand Grow the Global Franchise “Become the World’s Largest , Mo
Slide 15: Deliver a Differentiated and Relevant Brand
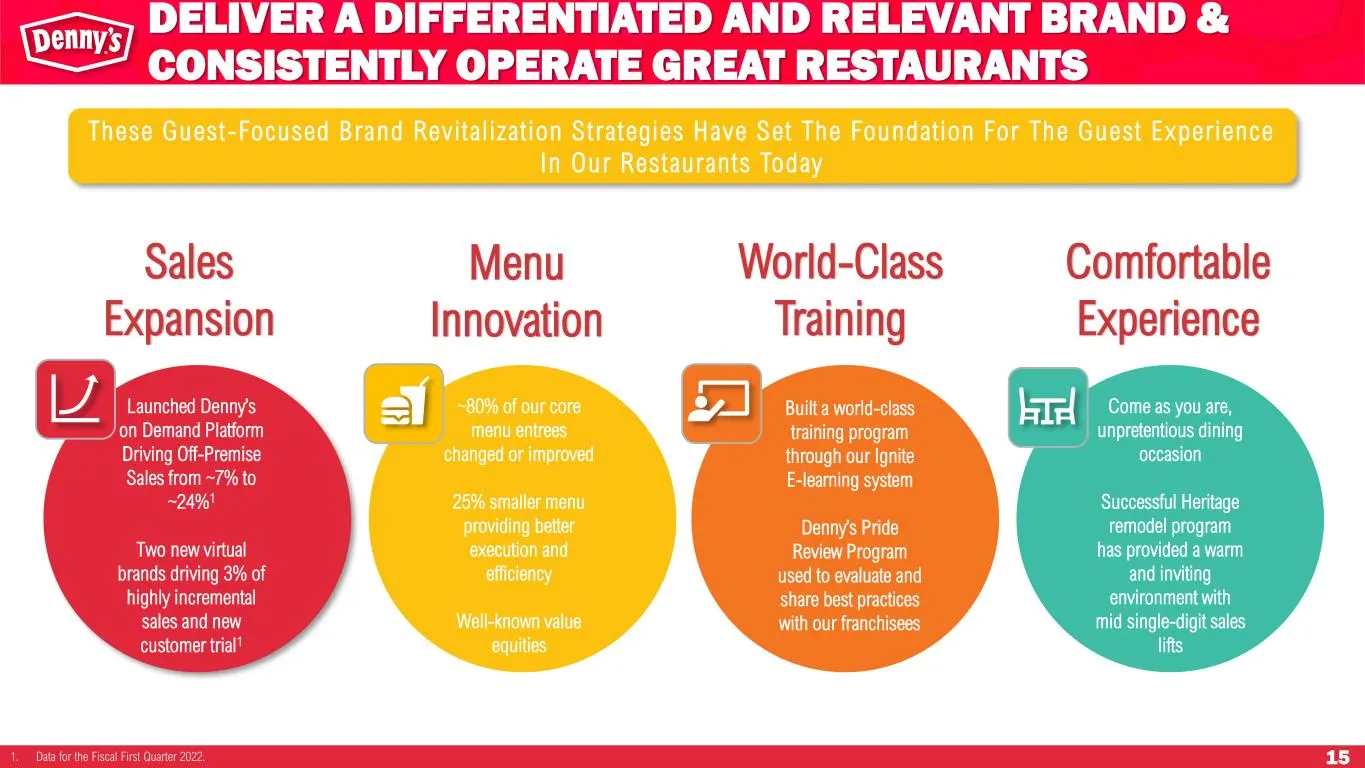
15 DELIVER A DIFFERENTIATED AND RELEVANT BRAND & CONSISTENTLY OPERATE GREAT RESTAURANTS These Guest-Focused Brand Revital izat ion Strategies Have Set The Foundat ion For The Guest Exper ience In Our Restaurants Today Sales Expansion Menu Innovation World-Class Training Comfortable Experience Launch
Slide 16: Grow the Global Franchise
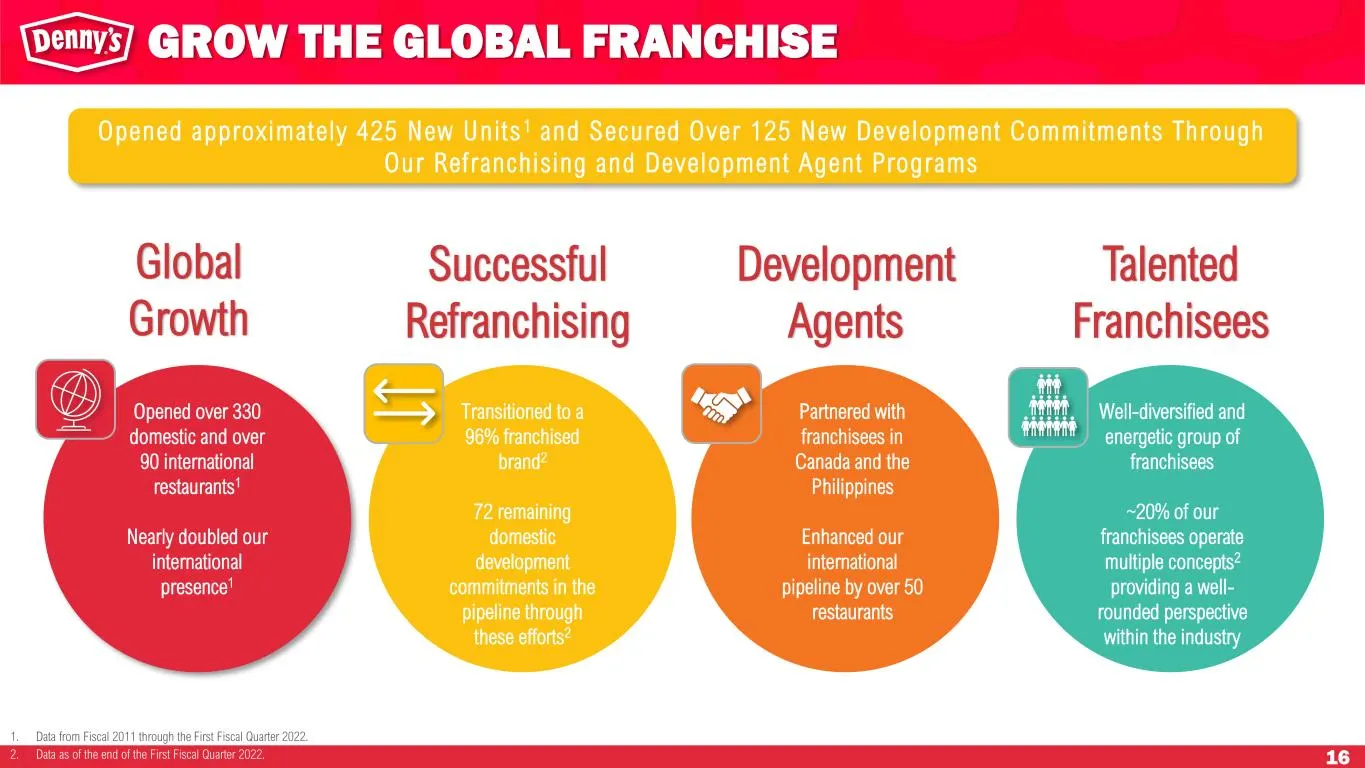
16 GROW THE GLOBAL FRANCHISE Opened approximately 425 New Units 1 and Secured Over 125 New Development Commitments Through Our Refranchising and Development Agent Programs Successful Refranchising Development Agents Talented Franchisees Opened over 330 domestic and over 90 international restaurants1
Slide 17: Drive Profitable Growth for All Stakeholders
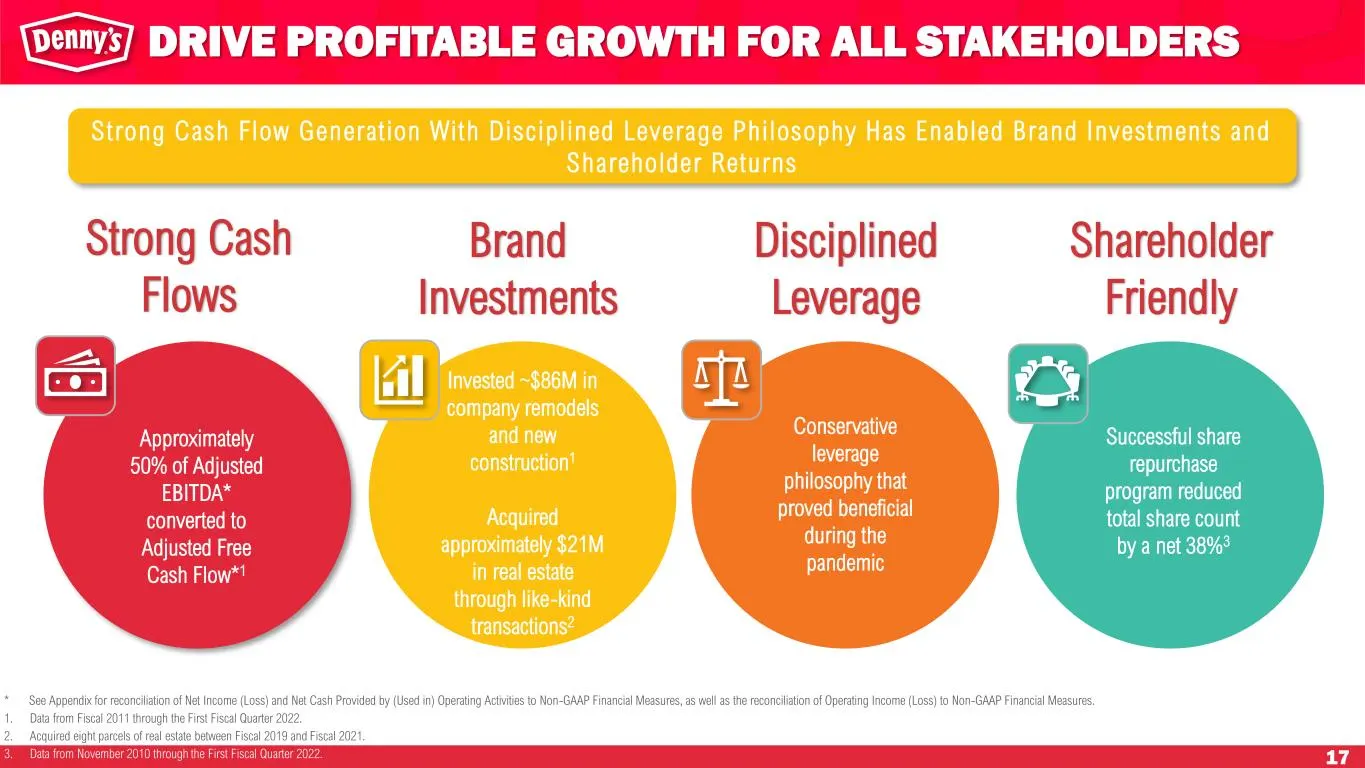
17 DRIVE PROFITABLE GROWTH FOR ALL STAKEHOLDERS Strong Cash Flow Generat ion With Discipl ined Leverage Phi losophy Has Enabled Brand Investments and Shareholder Returns Approximately 50% of Adjusted EBITDA* converted to Adjusted Free Cash Flow*1 Invested ~$86M in company remodels and new constructi
Slide 18: Transformative Brand Investments on the Horizon
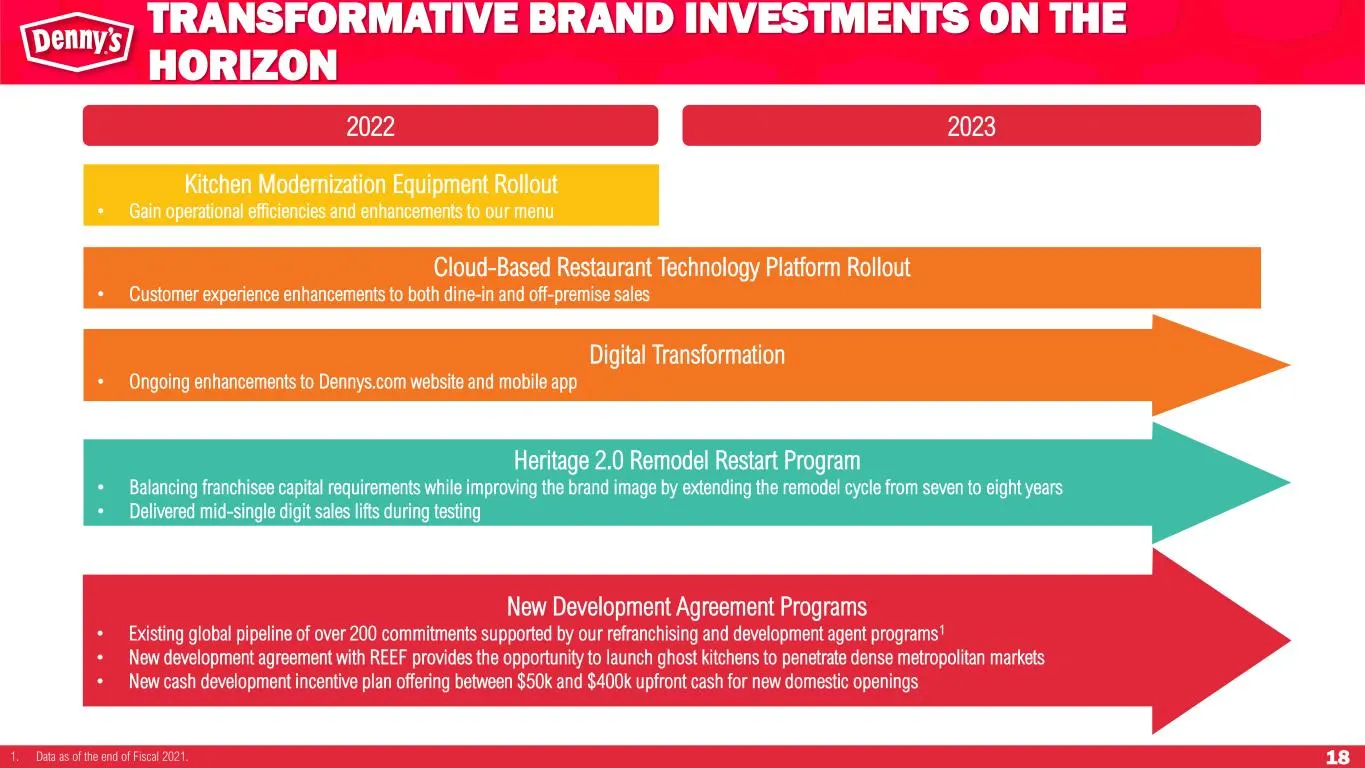
18 TRANSFORMATIVE BRAND INVESTMENTS ON THE HORIZON Cloud-Based Restaurant Technology Platform Rollout • Customer experience enhancements to both dine-in and off-premise sales Kitchen Modernization Equipment Rollout • Gain operational efficiencies and enhancements to our menu Heritage 2.0 Remodel Res
Slide 19: Kitchen Modernization & Technology Transformation Rollouts
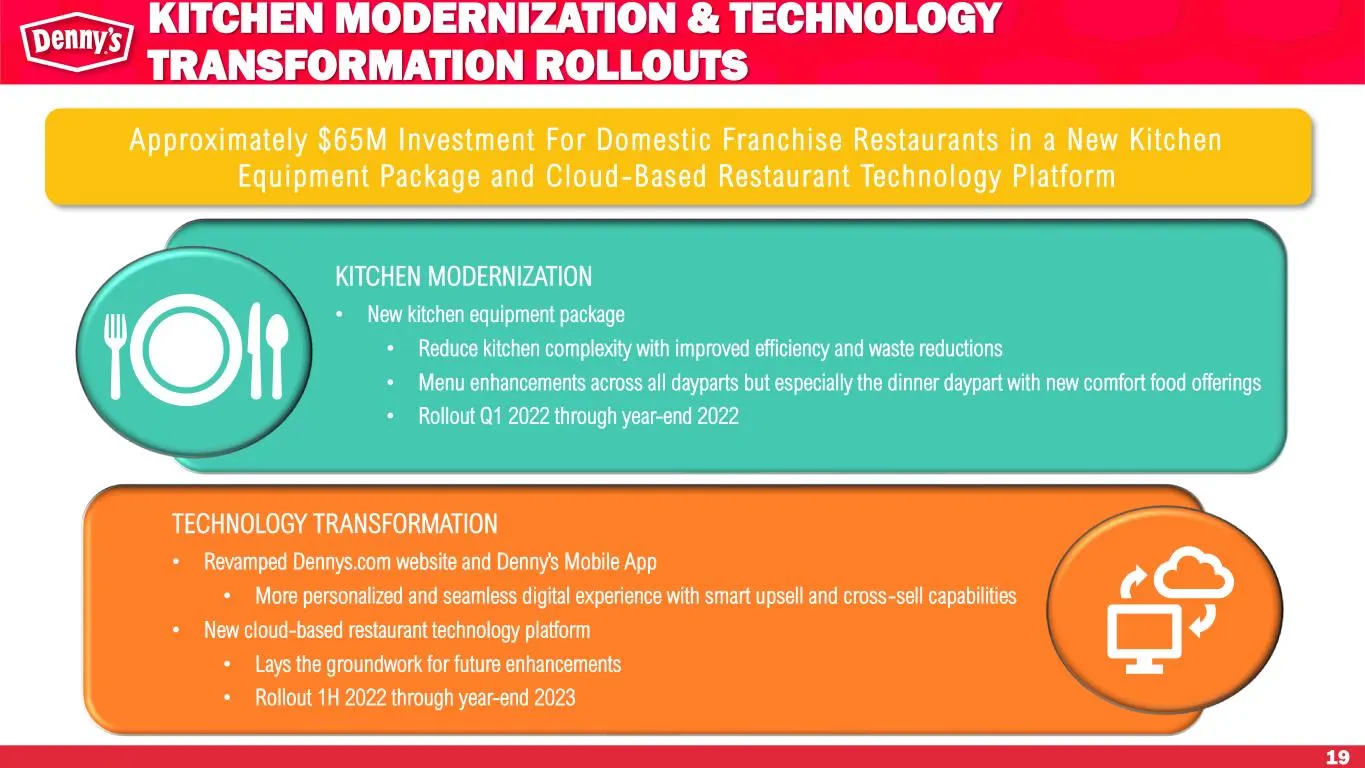
19 KITCHEN MODERNIZATION & TECHNOLOGY TRANSFORMATION ROLLOUTS Approximately $65M Investment For Domestic Franchise Restaurants in a New Kitchen Equipment Package and Cloud-Based Restaurant Technology Platform KITCHEN MODERNIZATION • New kitchen equipment package • Reduce kitchen complexity with impr
Slide 20: Heritage 2.0 Remodel Restart Program
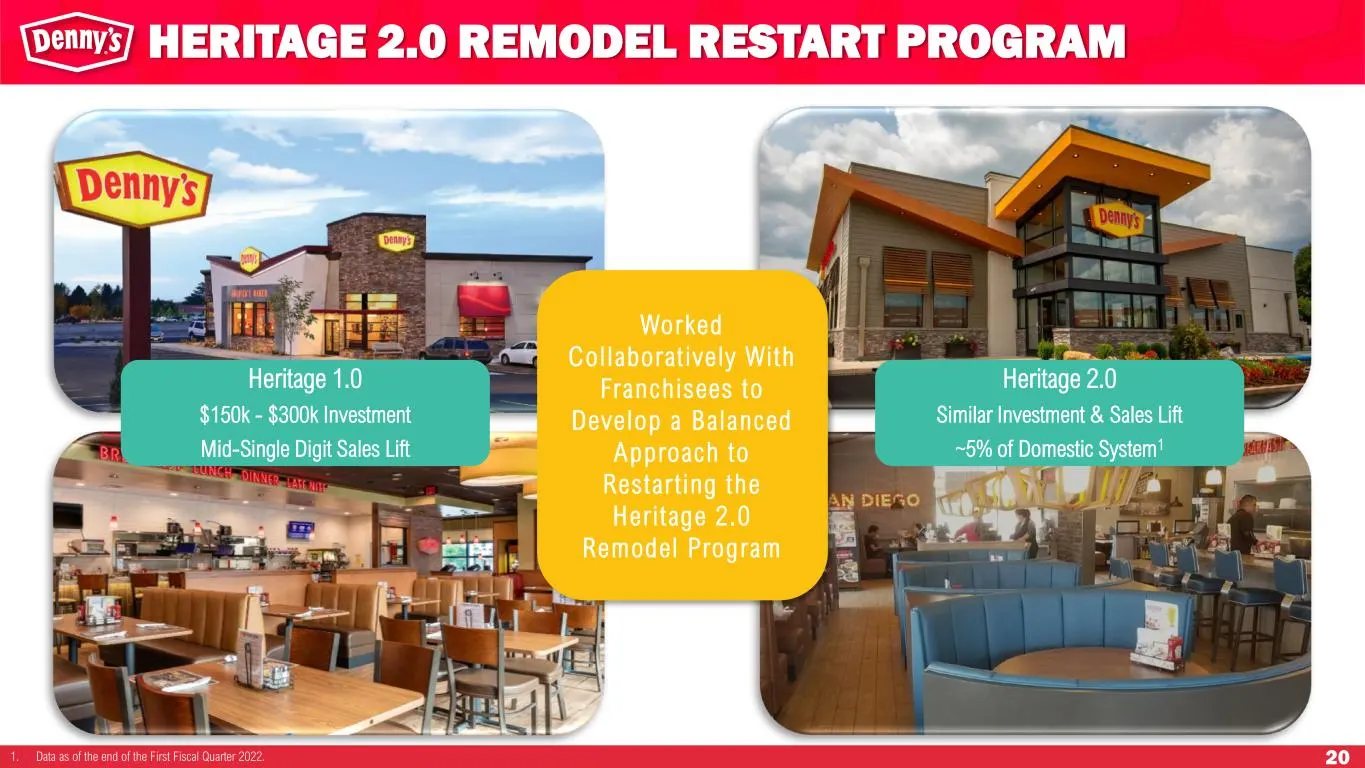
20 HERITAGE 2.0 REMODEL RESTART PROGRAM Heritage 1.0 $150k - $300k Investment Mid-Single Digit Sales Lift Heritage 2.0 Similar Investment & Sales Lift ~5% of Domestic System1 Worked Col laborat ive ly With Franchisees to Develop a Balanced Approach to Restar t ing the Heri tage 2.0 Remodel Program 1
Slide 21: New Development Agreement Programs
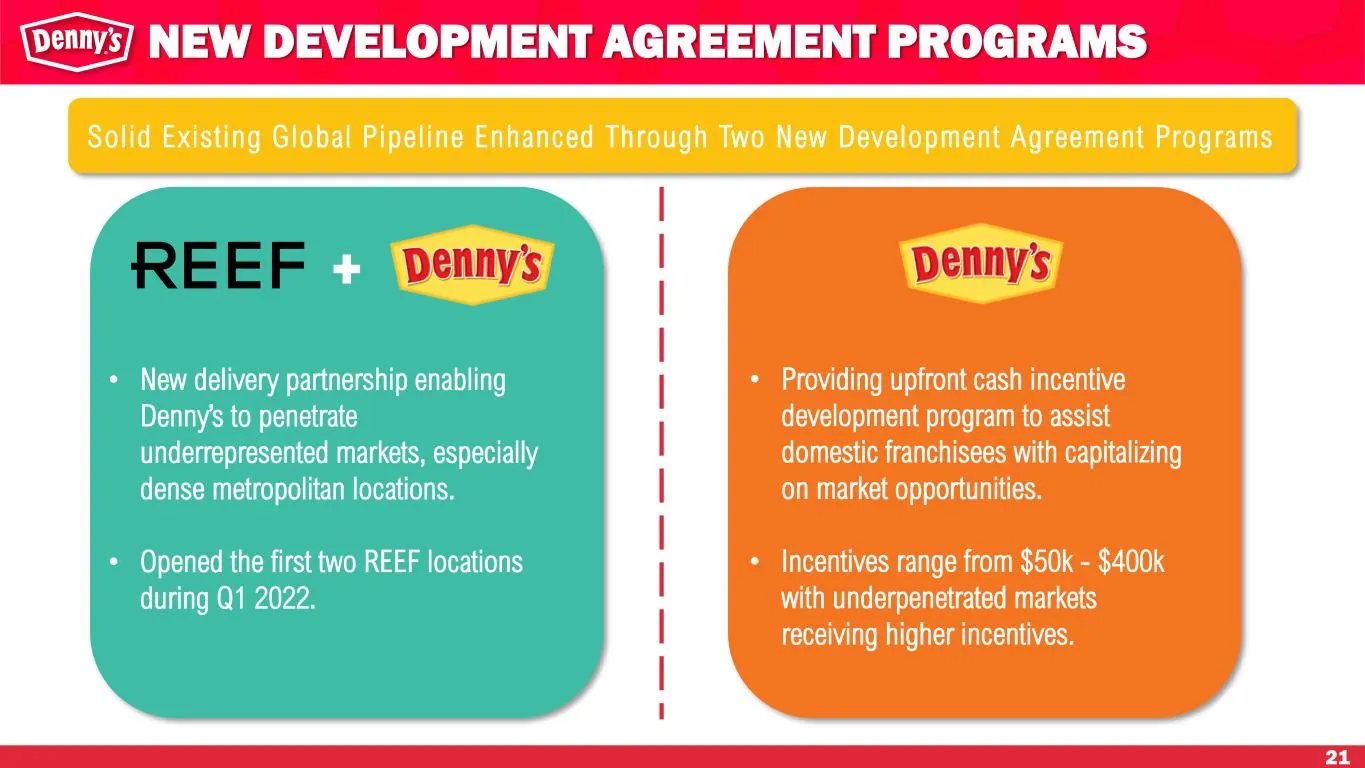
21 NEW DEVELOPMENT AGREEMENT PROGRAMS Solid Exist ing Global Pipel ine Enhanced Through Two New Development Agreement Programs 21 • New delivery partnership enabling Denny’s to penetrate underrepresented markets, especially dense metropolitan locations. • Opened the first two REEF locations during Q
Slide 22: Strong Collaboration with Franchisees
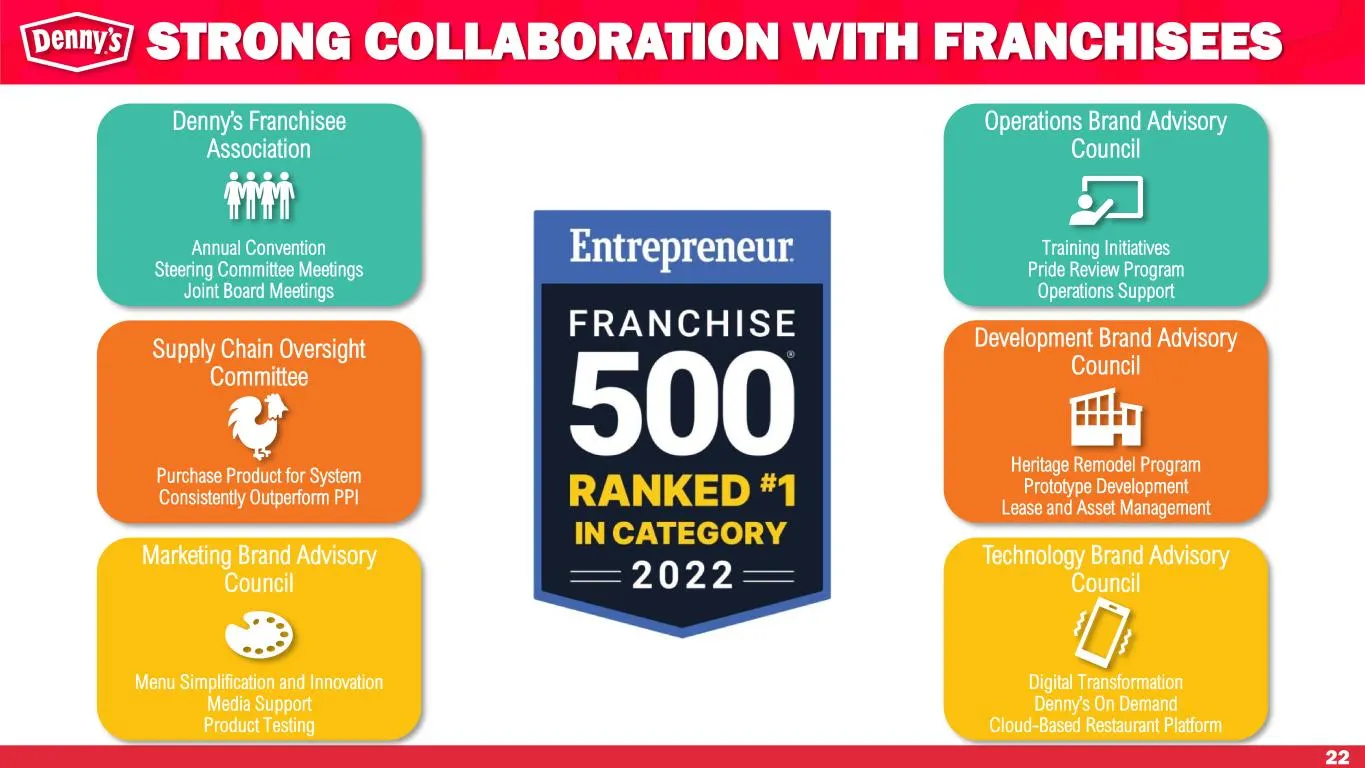
22 STRONG COLLABORATION WITH FRANCHISEES Denny’s Franchisee Association Annual Convention Steering Committee Meetings Joint Board Meetings Supply Chain Oversight Committee Purchase Product for System Consistently Outperform PPI Marketing Brand Advisory Council Menu Simplification and Innovation Medi
Slide 23: Keke's Breakfast Cafe Acquisition
23 KEKE’S BREAKFAST CAFE ACQUISITION
Slide 24: Bringing Together an Iconic Diner and an Emerging A.M. Eatery Leader
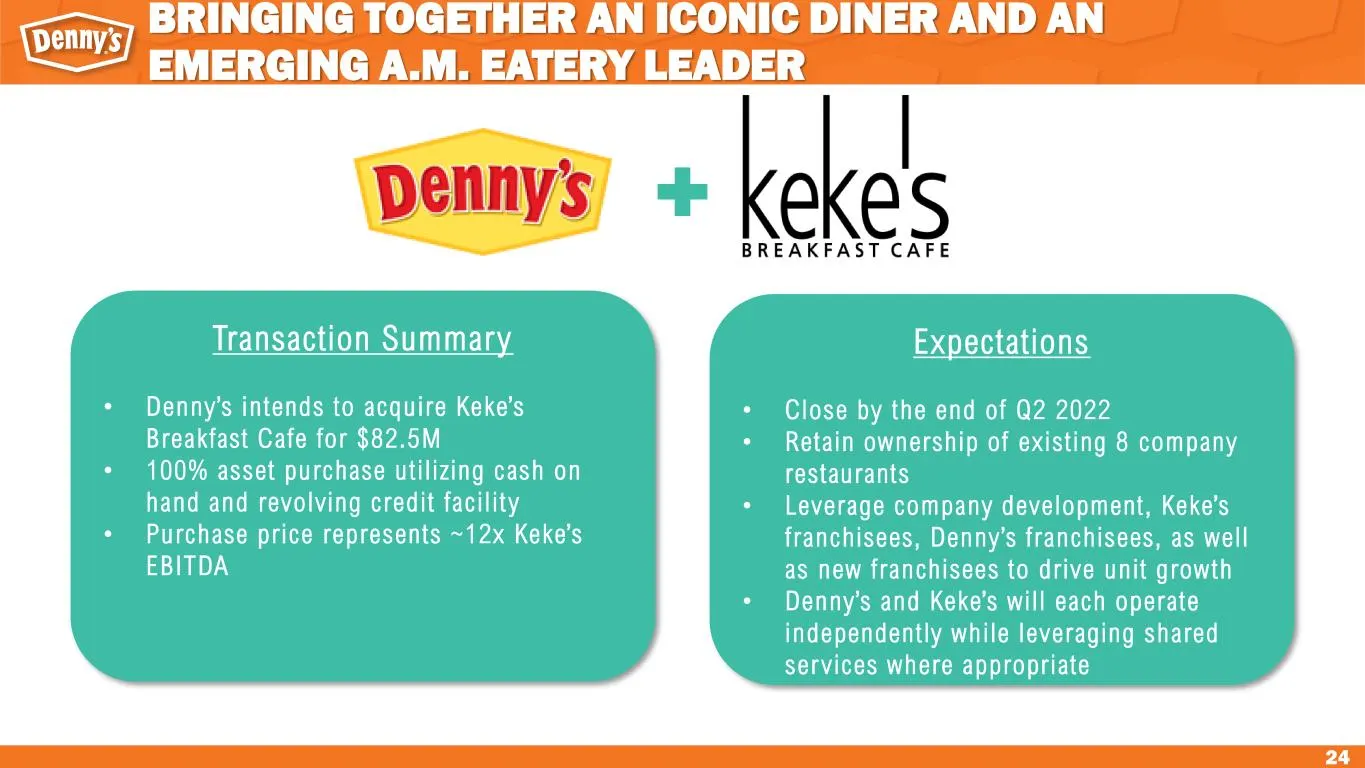
24 BRINGING TOGETHER AN ICONIC DINER AND AN EMERGING A.M. EATERY LEADER Transaction Summary • Denny’s in tends to acquire Keke’s Breakfast Cafe for $82.5M • 100% asset purchase ut i l iz ing cash on hand and revolving credi t fac i l i t y • Purchase pr ice represents ~12x Keke’s EBITDA Expectations
Slide 25: Keke's Overview
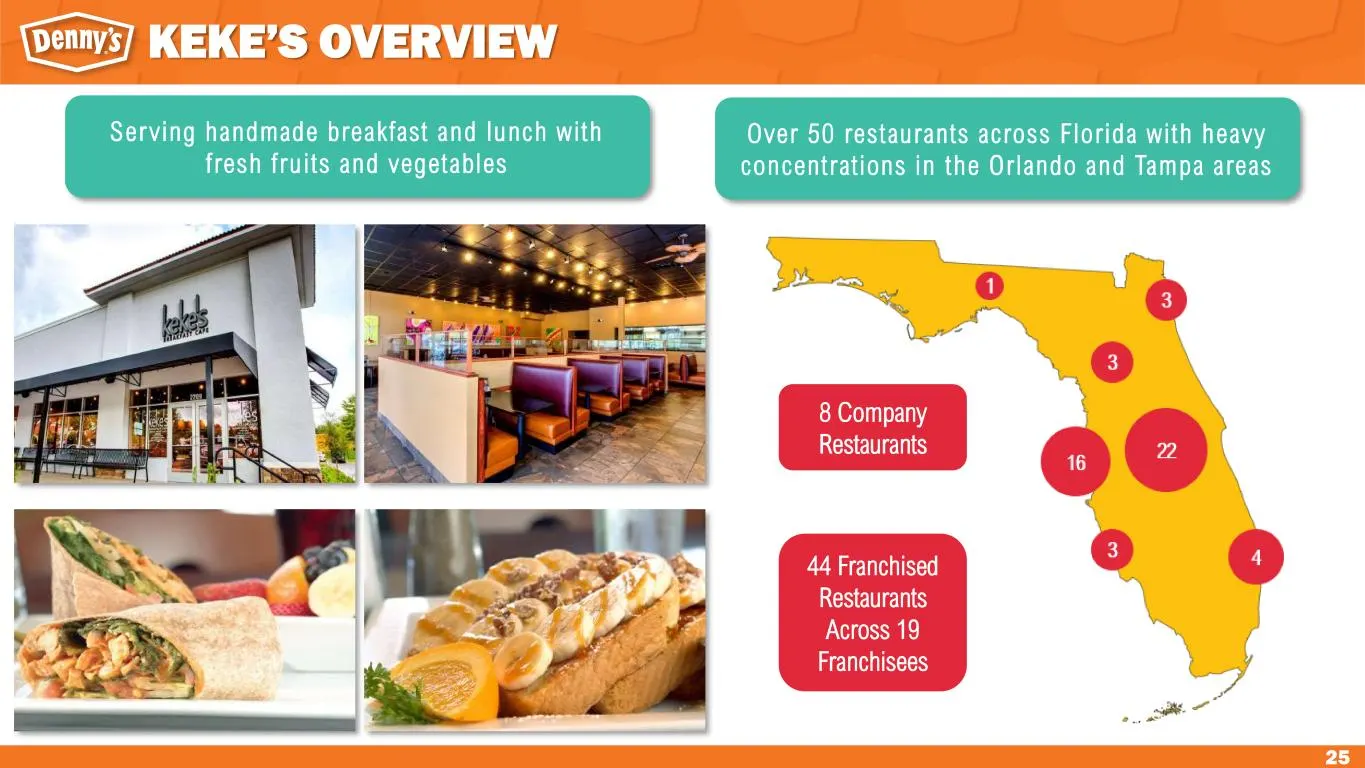
25 KEKE’S OVERVIEW Over 50 restaurants across Flor ida wi th heavy concentrat ions in the Orlando and Tampa areas Ser ving handmade breakfast and lunch with f resh f ru i ts and vegetables 8 Company Restaurants 44 Franchised Restaurants Across 19 Franchisees
Slide 26: Performance Comparison
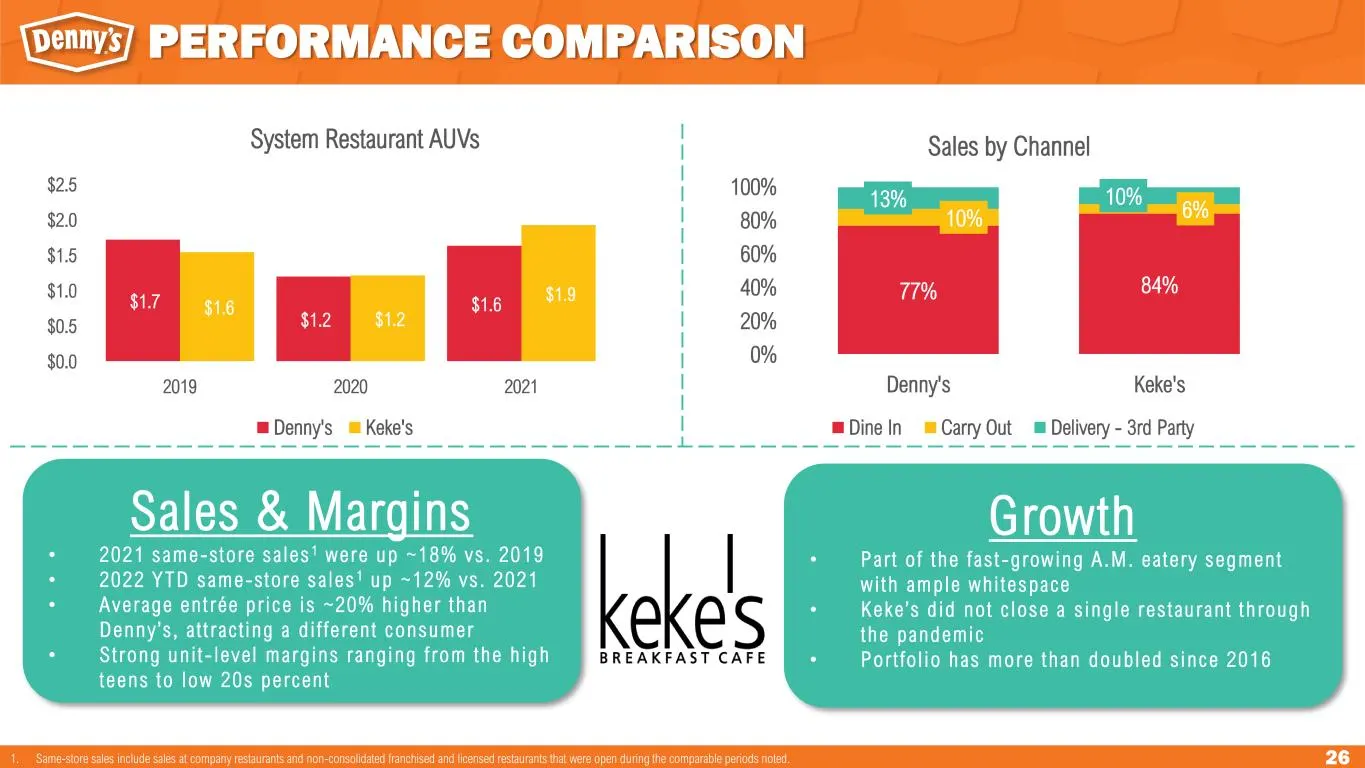
26 PERFORMANCE COMPARISON $1.7 $1.2 $1.6 $1.6 $1.2 $1.9 $0.0 $0.5 $1.0 $1.5 $2.0 $2.5 2019 2020 2021 System Restaurant AUVs Denny's Keke's 77% 84% 10% 6% 13% 10% 0% 20% 40% 60% 80% 100% Denny's Keke's Sales by Channel Dine In Carry Out Delivery - 3rd Party Sales & Margins • 2021 s ame -store s a le

Slide 27: Historical Performance
27 HISTORICAL PERFORMANCE
Slide 28: Franchised and Company Restaurant Sales
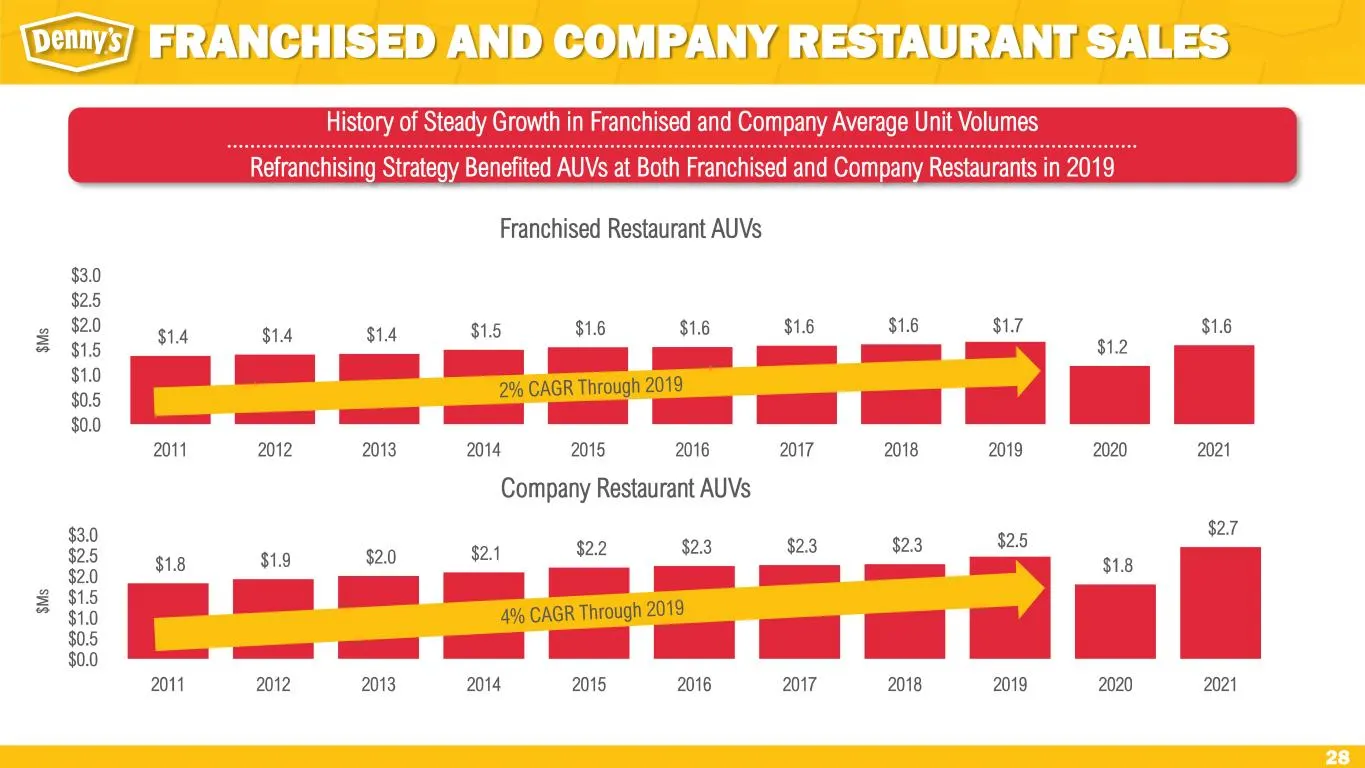
28 $1.8 $1.9 $2.0 $2.1 $2.2 $2.3 $2.3 $2.3 $2.5 $1.8 $2.7 $0.0 $0.5 $1.0 $1.5 $2.0 $2.5 $3.0 2011 2012 2013 2014 2015 2016 2017 2018 2019 2020 2021 Company Restaurant AUVs History of Steady Growth in Franchised and Company Average Unit Volumes Refranchising Strategy Benefited AUVs at Both Franchised
Slide 29: Franchise and Company Operating Margins
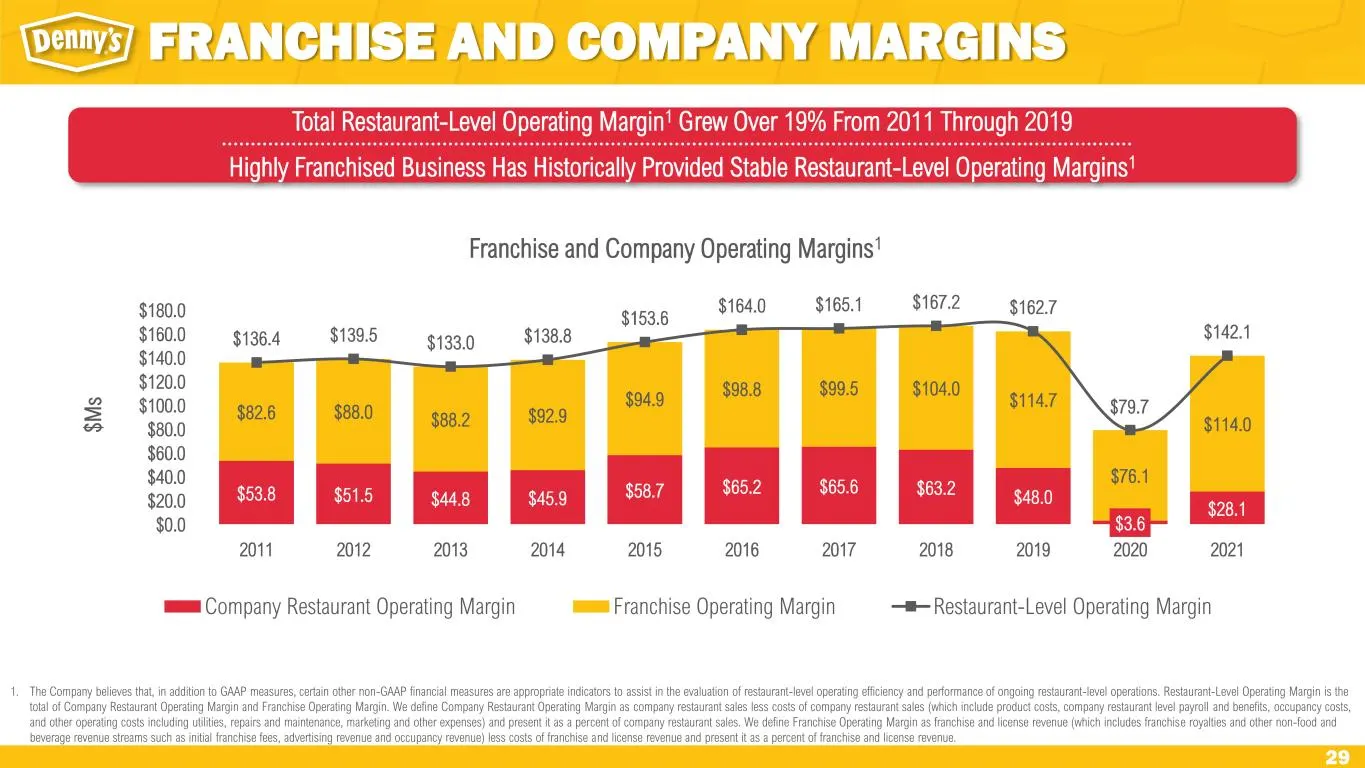
29 $53.8 $51.5 $44.8 $45.9 $58.7 $65.2 $65.6 $63.2 $48.0 $3.6 $28.1 $82.6 $88.0 $88.2 $92.9 $94.9 $98.8 $99.5 $104.0 $114.7 $76.1 $114.0 $136.4 $139.5 $133.0 $138.8 $153.6 $164.0 $165.1 $167.2 $162.7 $79.7 $142.1 $0.0 $20.0 $40.0 $60.0 $80.0 $100.0 $120.0 $140.0 $160.0 $180.0 2011 2012 2013 2014 201
Slide 30: Disciplined Focus on Costs
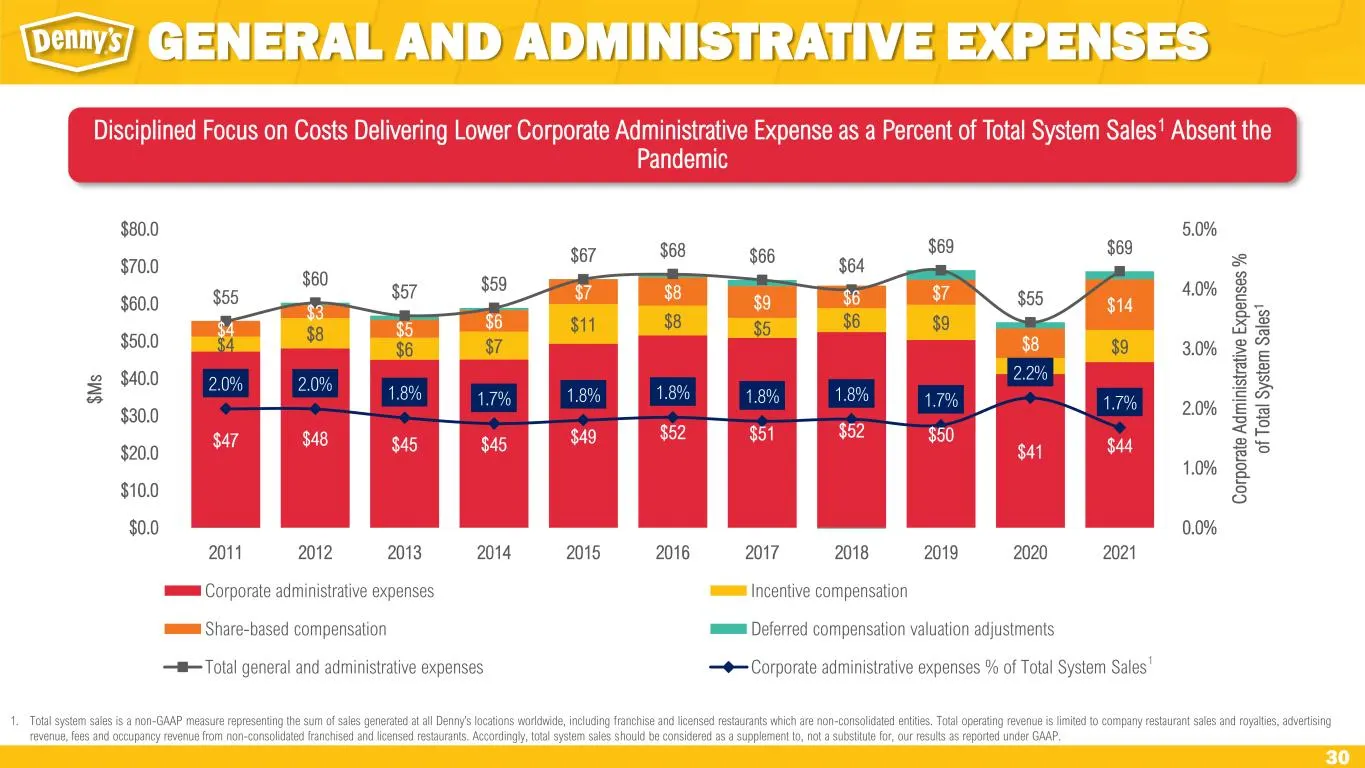
30 $47 $48 $45 $45 $49 $52 $51 $52 $50 $41 $44 $4 $8 $6 $7 $11 $8 $5 $6 $9 $4 $9 $4 $3 $5 $6 $7 $8 $9 $6 $7 $8 $14$55 $60 $57 $59 $67 $68 $66 $64 $69 $55 $69 2.0% 2.0% 1.8% 1.7% 1.8% 1.8% 1.8% 1.8% 1.7% 2.2% 1.7% 0.0% 1.0% 2.0% 3.0% 4.0% 5.0% $0.0 $10.0 $20.0 $30.0 $40.0 $50.0 $60.0 $70.0 $80.0 2011
Slide 31: Adjusted Free Cash Flow
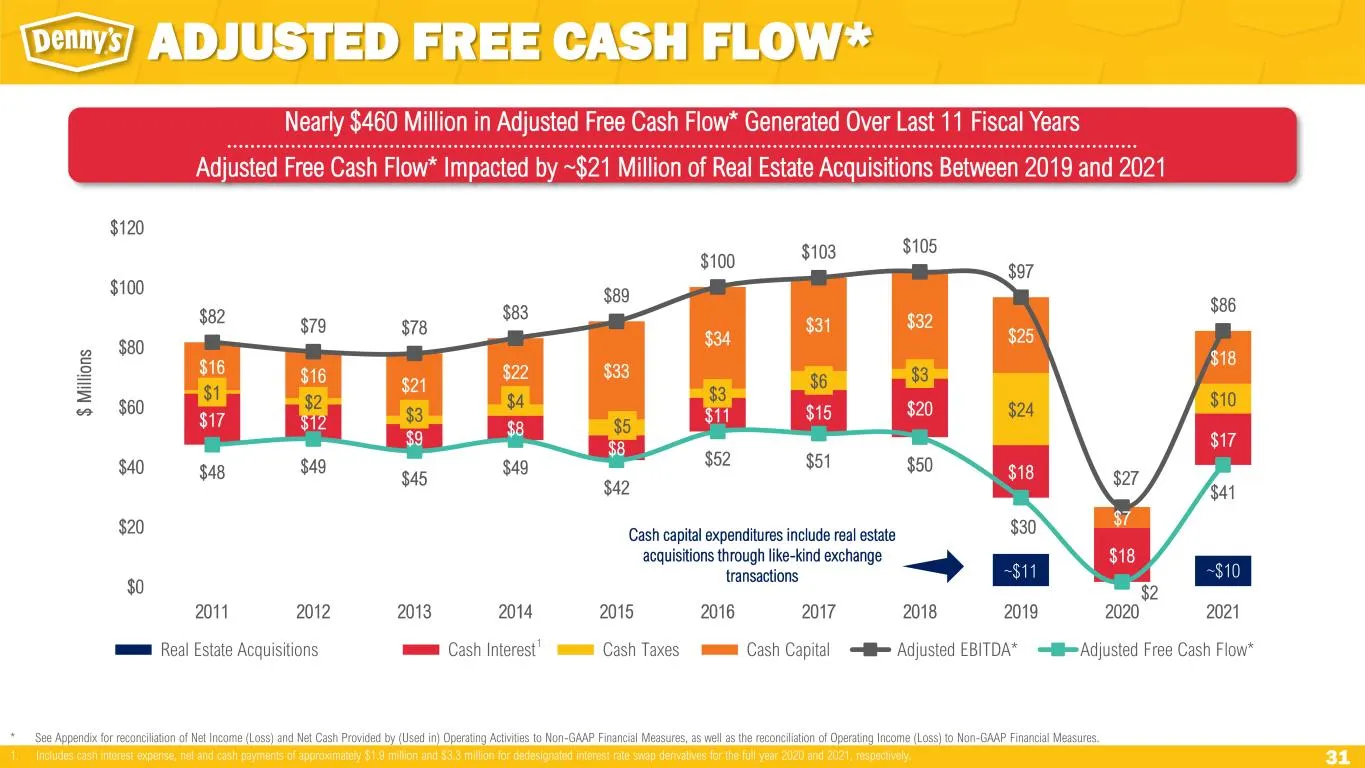
31 ~$11 ~$10 $17 $12 $9 $8 $8 $11 $15 $20 $18 $18 $17 $1 $2 $3 $4 $5 $3 $6 $3 $24 $10 $16 $16 $21 $22 $33 $34 $31 $32 $25 $7 $18 $82 $79 $78 $83 $89 $100 $103 $105 $97 $27 $86 $48 $49 $45 $49 $42 $52 $51 $50 $30 $2 $41 $0 $20 $40 $60 $80 $100 $120 2011 2012 2013 2014 2015 2016 2017 2018 2019 2020 20
Slide 32: Disciplined Focus on Debt Leverage
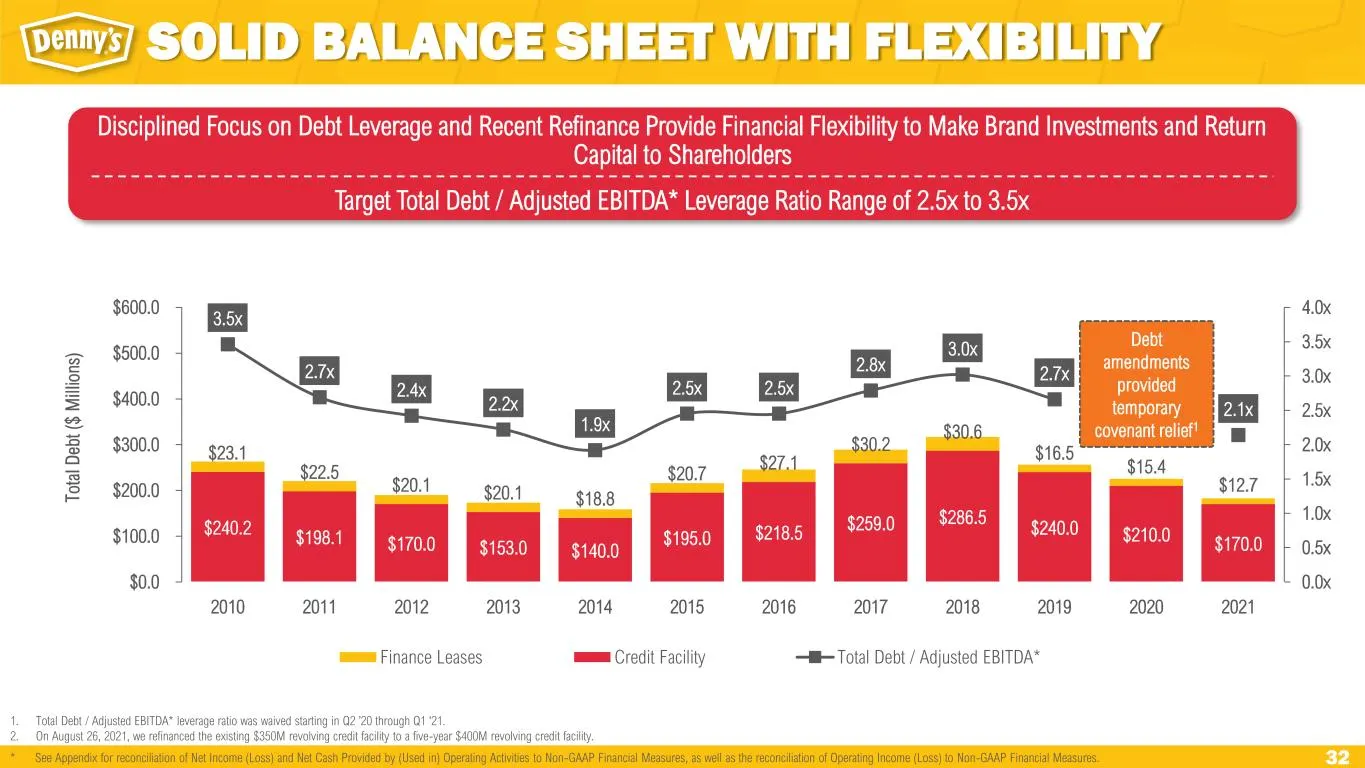
32 Disciplined Focus on Debt Leverage and Recent Refinance Provide Financial Flexibility to Make Brand Investments and Return Capital to Shareholders Target Total Debt / Adjusted EBITDA* Leverage Ratio Range of 2.5x to 3.5x 1. Total Debt / Adjusted EBITDA* leverage ratio was waived starting in Q2 ’2
Slide 33: Share Repurchases
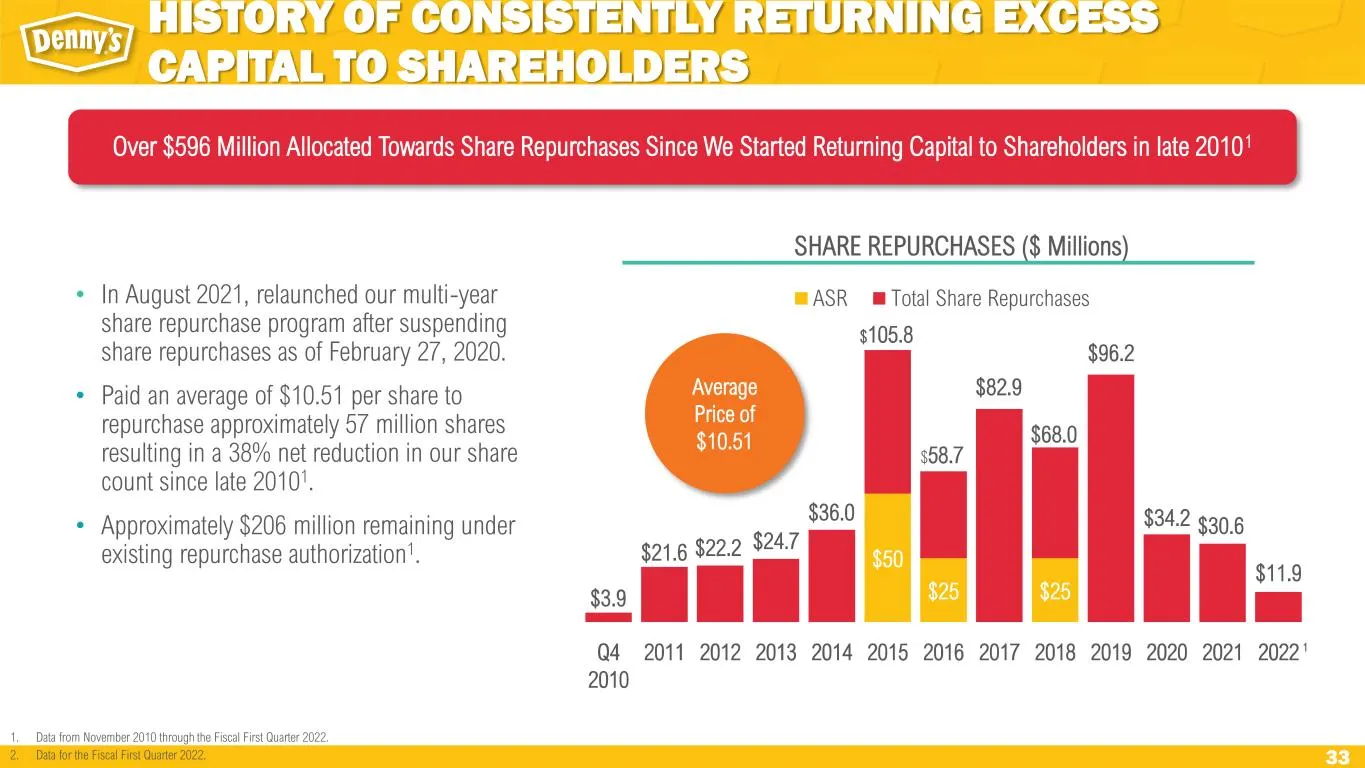
33 $50 $25 $25 $3.9 $21.6 $22.2 $24.7 $36.0 $82.9 $96.2 $34.2 $30.6 $11.9 Q4 2010 2011 2012 2013 2014 2015 2016 2017 2018 2019 2020 2021 2022 ASR Total Share Repurchases• In August 2021, relaunched our multi-year share repurchase program after suspending share repurchases as of February 27, 2020. •
Slide 34: Stock Price Performance vs. Indices
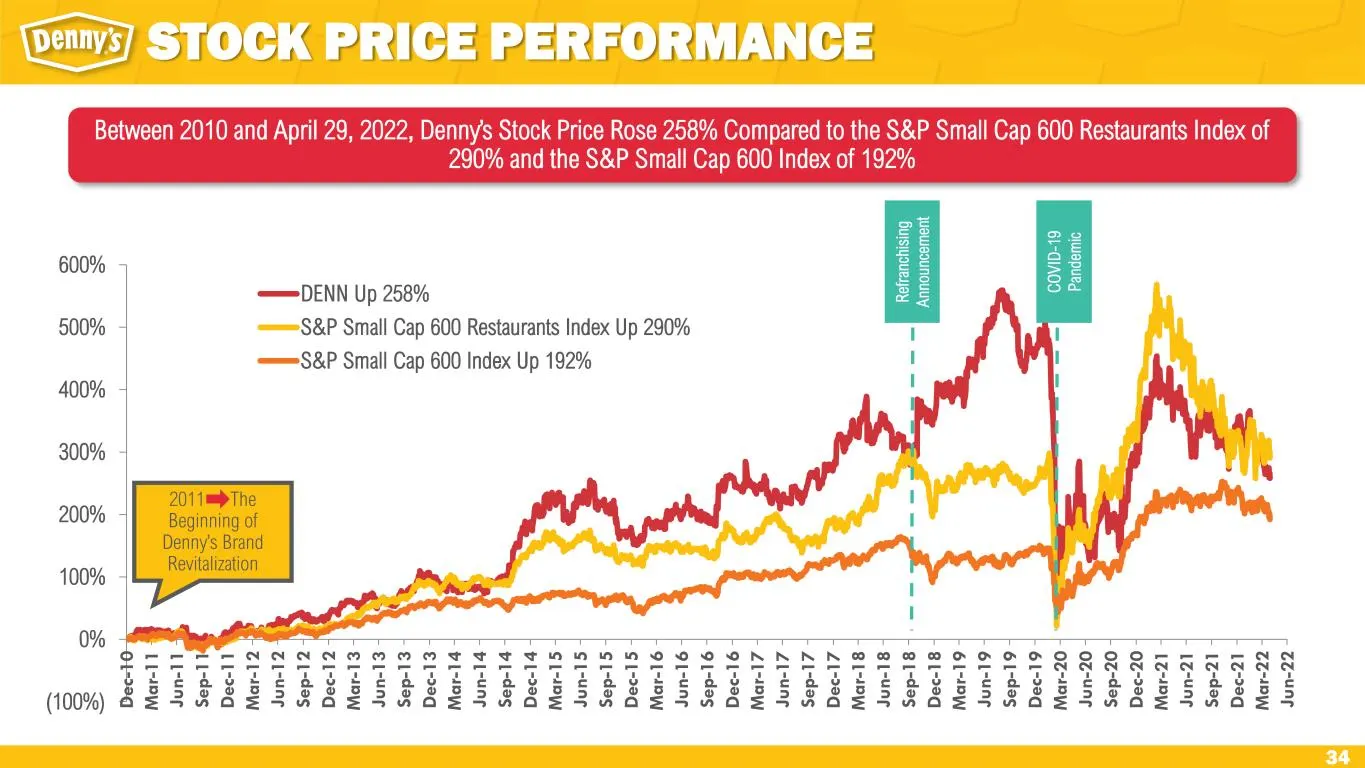
34 (100%) 0% 100% 200% 300% 400% 500% 600% D e c- 1 0 M a r- 1 1 Ju n -1 1 S e p -1 1 D e c- 1 1 M a r- 1 2 Ju n -1 2 S e p -1 2 D e c- 1 2 M a r- 1 3 Ju n -1 3 S e p -1 3 D e c- 1 3 M a r- 1 4 Ju n -1 4 S e p -1 4 D e c- 1 4 M a r- 1 5 Ju n -1 5 S e p -1 5 D e c- 1 5 M a r- 1 6 Ju n -1 6 S e p -1 6
Slide 35: Investment Highlights Summary
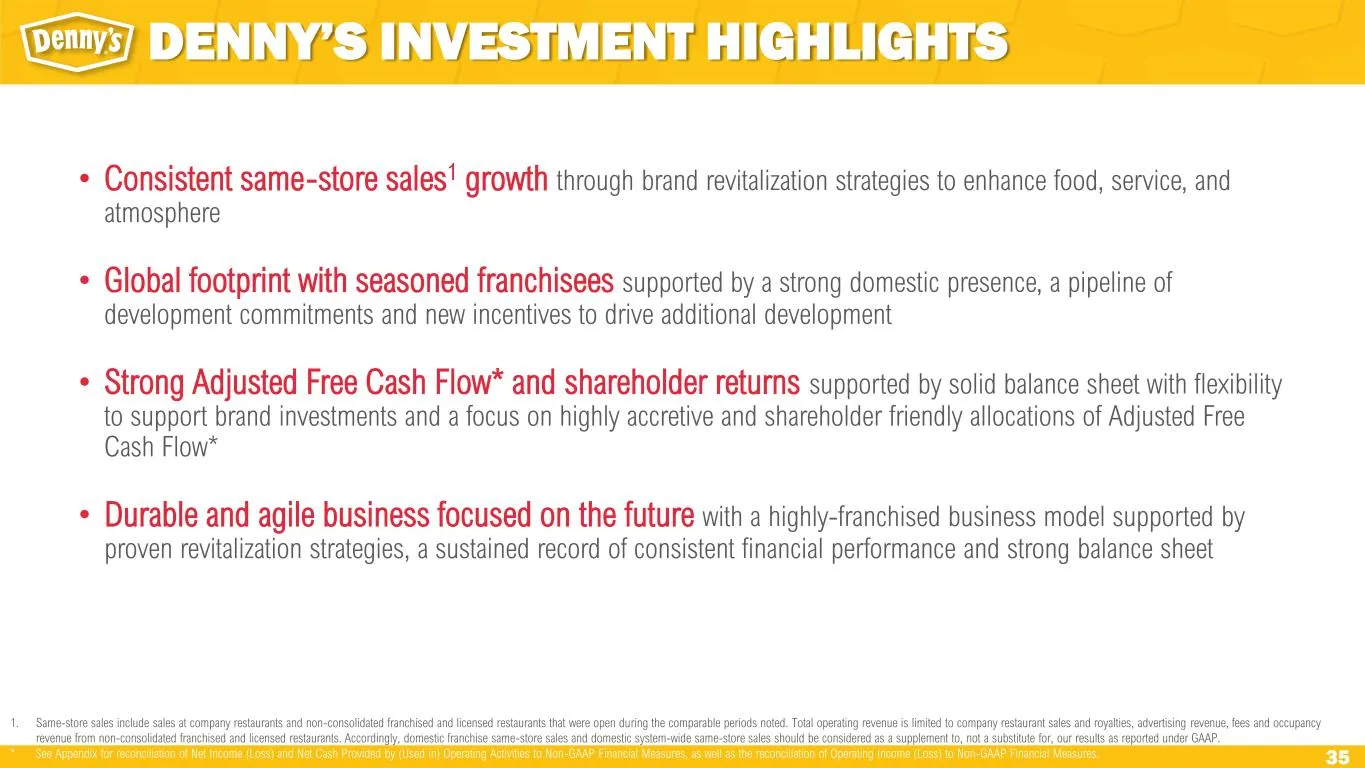
35 1. Same-store sales include sales at company restaurants and non-consolidated franchised and licensed restaurants that were open during the comparable periods noted. Total operating revenue is limited to company restaurant sales and royalties, advertising revenue, fees and occupancy revenue from

Slide 36: Appendix
APPENDIX
Slide 37: Management Team
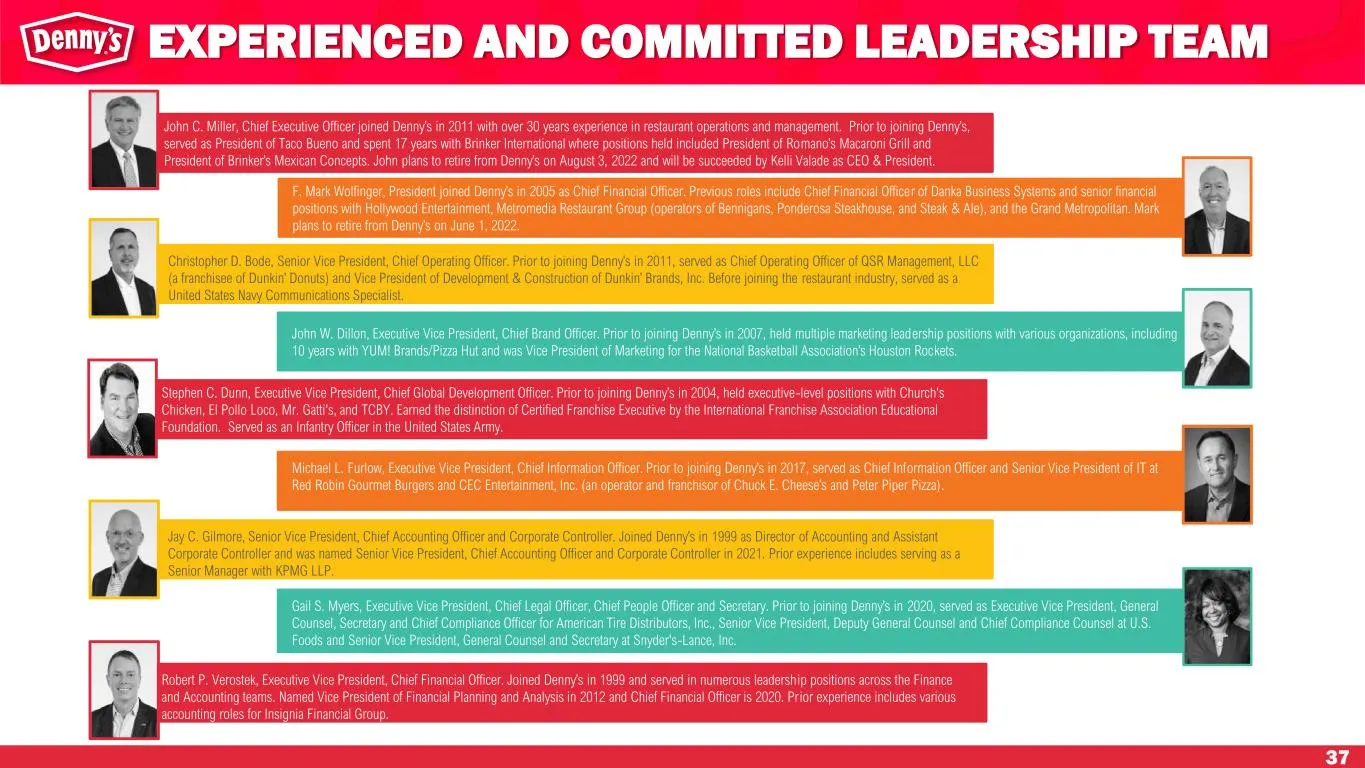
37 John C. Miller, Chief Executive Officer joined Denny’s in 2011 with over 30 years experience in restaurant operations and management. Prior to joining Denny’s, served as President of Taco Bueno and spent 17 years with Brinker International where positions held included President of Romano’s Macar
Slide 38: Reconciliation of Net Income (Loss) to Non-GAAP Financial Measures
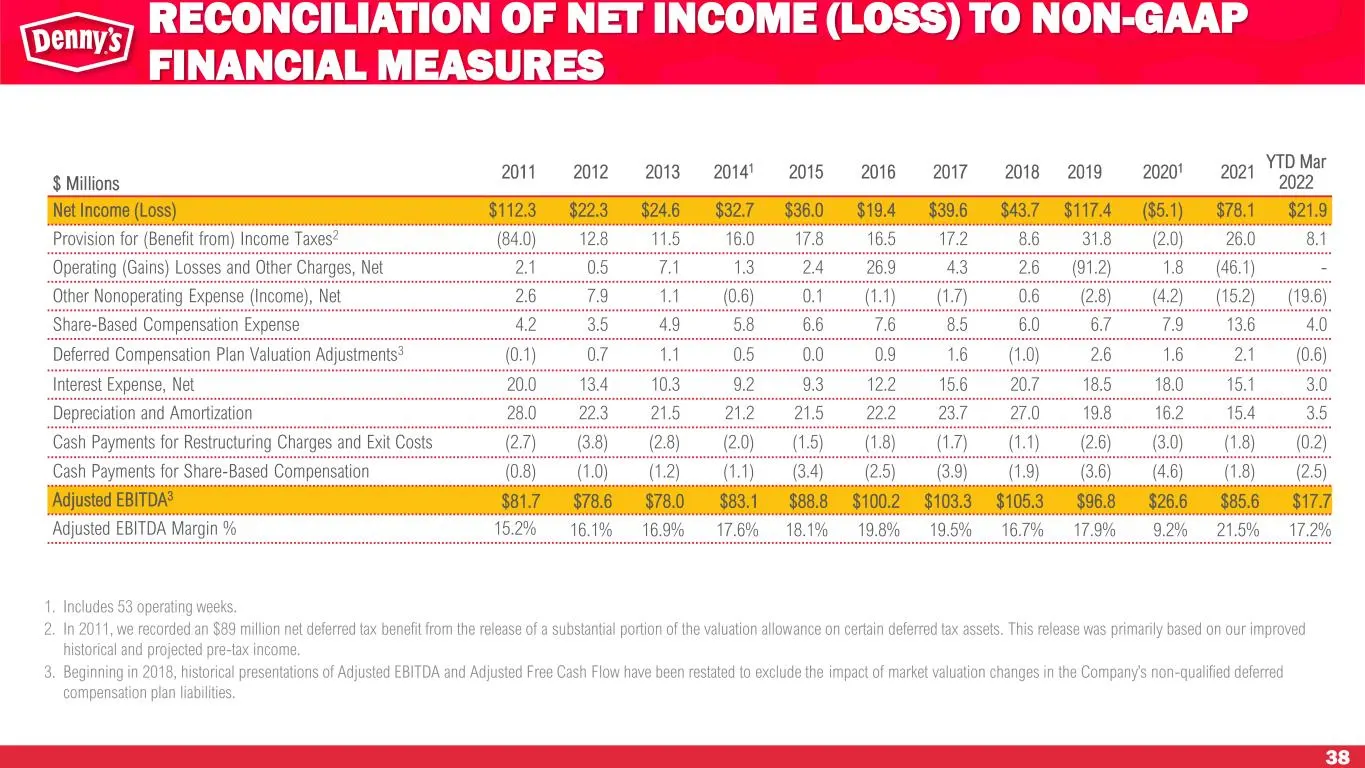
38 RECONCILIATION OF NET INCOME (LOSS) TO NON-GAAP FINANCIAL MEASURES $ Millions 2011 2012 2013 20141 2015 2016 2017 2018 2019 20201 2021 YTD Mar 2022 Net Income (Loss) $112.3 $22.3 $24.6 $32.7 $36.0 $19.4 $39.6 $43.7 $117.4 ($5.1) $78.1 $21.9 Provision for (Benefit from) Income Taxes2 (84.0) 12.8 1
Slide 39: Reconciliation of Net Cash from Operating Activities to Non-GAAP Measures
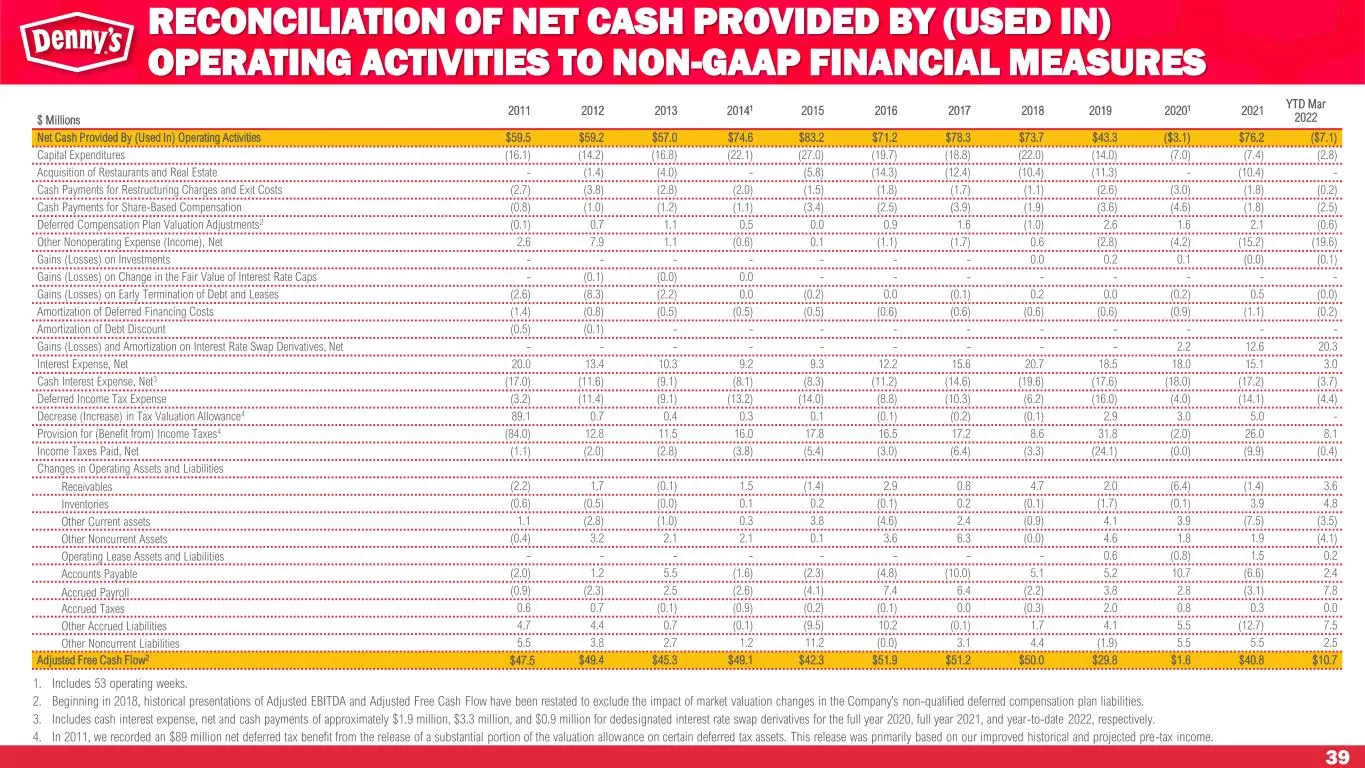
39 1. Includes 53 operating weeks. 2. Beginning in 2018, historical presentations of Adjusted EBITDA and Adjusted Free Cash Flow have been restated to exclude the impact of market valuation changes in the Company’s non-qualified deferred compensation plan liabilities. 3. Includes cash interest expen
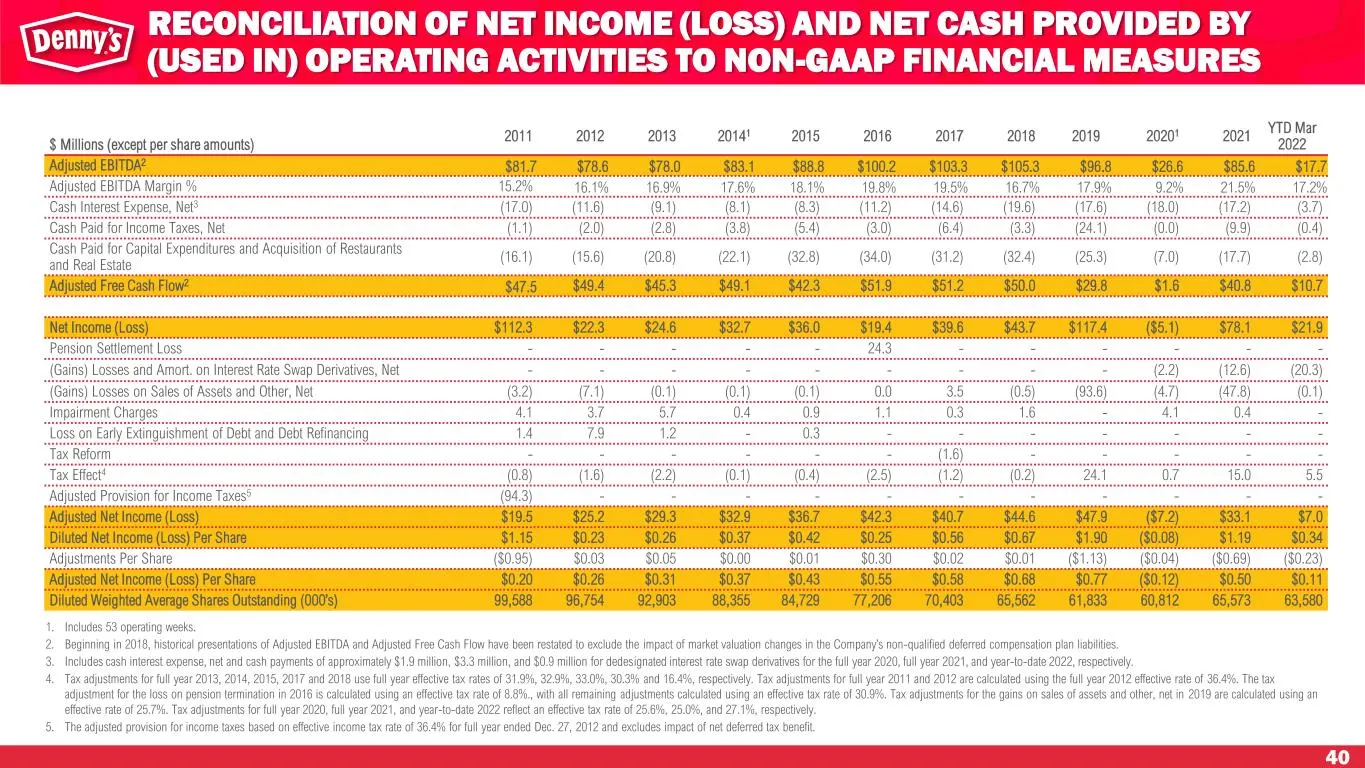
Slide 40: Reconciliation of Non-GAAP Financial Measures
40 1. Includes 53 operating weeks. 2. Beginning in 2018, historical presentations of Adjusted EBITDA and Adjusted Free Cash Flow have been restated to exclude the impact of market valuation changes in the Company’s non-qualified deferred compensation plan liabilities. 3. Includes cash interest expen
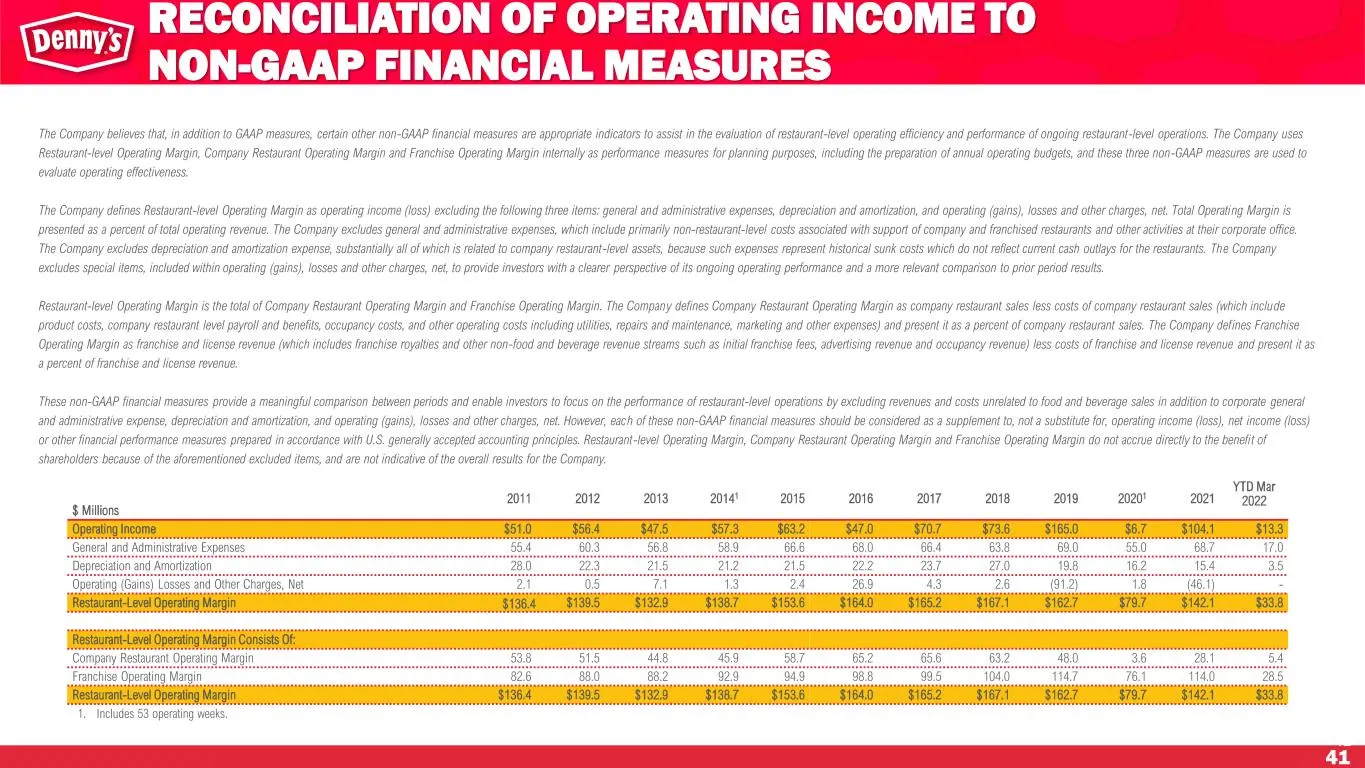
Slide 41: Reconciliation of Operating Income to Restaurant-Level Operating Margin
41 $ Millions 2011 2012 2013 20141 2015 2016 2017 2018 2019 20201 2021 YTD Mar 2022 Operating Income $51.0 $56.4 $47.5 $57.3 $63.2 $47.0 $70.7 $73.6 $165.0 $6.7 $104.1 $13.3 General and Administrative Expenses 55.4 60.3 56.8 58.9 66.6 68.0 66.4 63.8 69.0 55.0 68.7 17.0 Depreciation and Amortization
Source: SEC EDGAR · 8-K filed May 3, 2022
More decks from Dennys Corp
 Investor Presentation (August 2025)30 slides · Aug 4, 2025
 Investor Presentation (May 2025)32 slides · May 2025
 Investor Presentation (February 2025)32 slides · February 2025
 Investor Presentation (January 2025)32 slides · Jan 13, 2025
 Investor Day (October 2024)137 slides · Oct 22, 2024
 Q2 2024 Earnings Presentation22 slides · Jul 30, 2024