Dennys — Investor Presentation (January 2024)
26 slides from Dennys's investor presentation, Jan 8, 2024
Slide 1: Denny's Corporation Investor Presentation January 2024
D E N N Y ’ S C O R P O R AT I O N INVESTOR PRESENTATION J A N U A R Y 2 0 2 4
Slide 2: Forward-Looking Statements and Non-GAAP Financial Measures
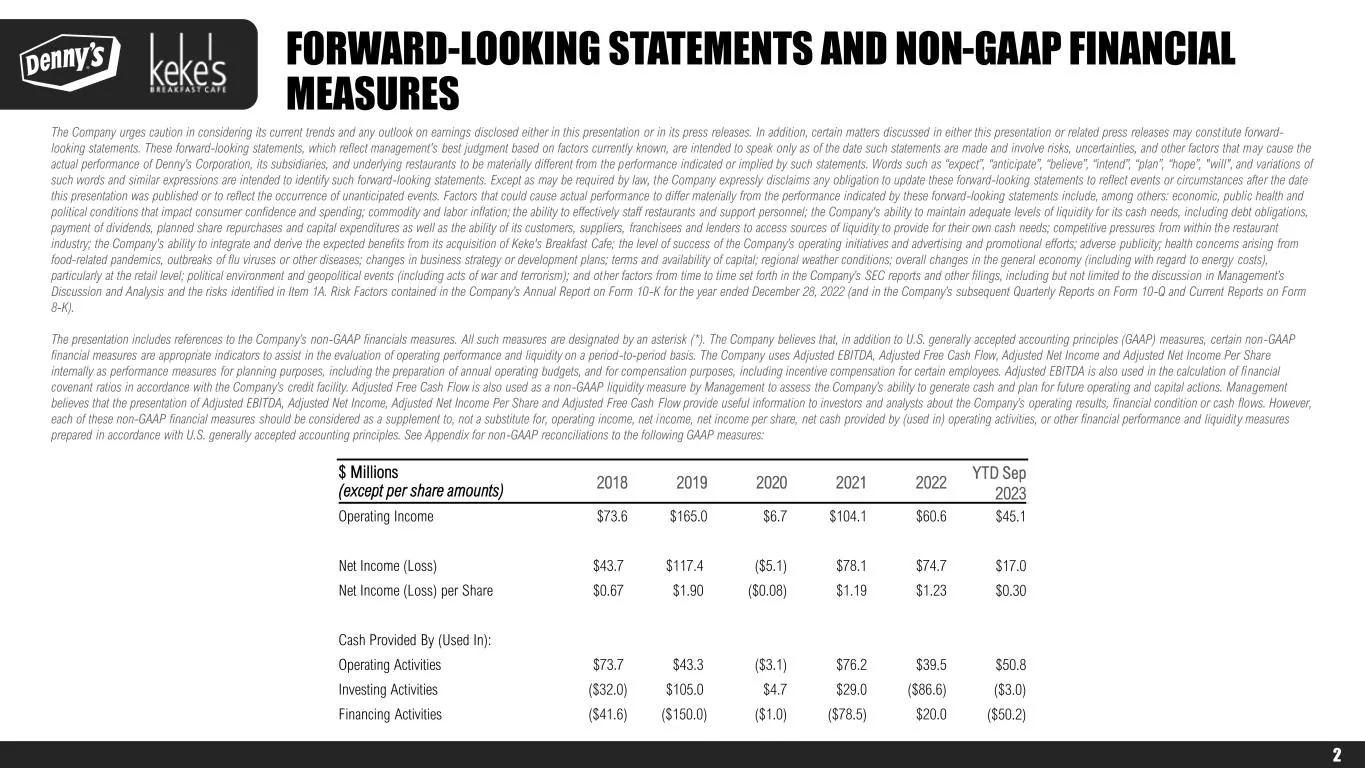
FORWARD-LOOKING STATEMENTS AND NON-GAAP FINANCIAL MEASURES The Company urges caution in considering its current trends and any outlook on earnings disclosed either in this presentation or in its press releases. In addition, certain matters discussed in either this presentation or related press relea
Slide 3: 70 Years and Counting
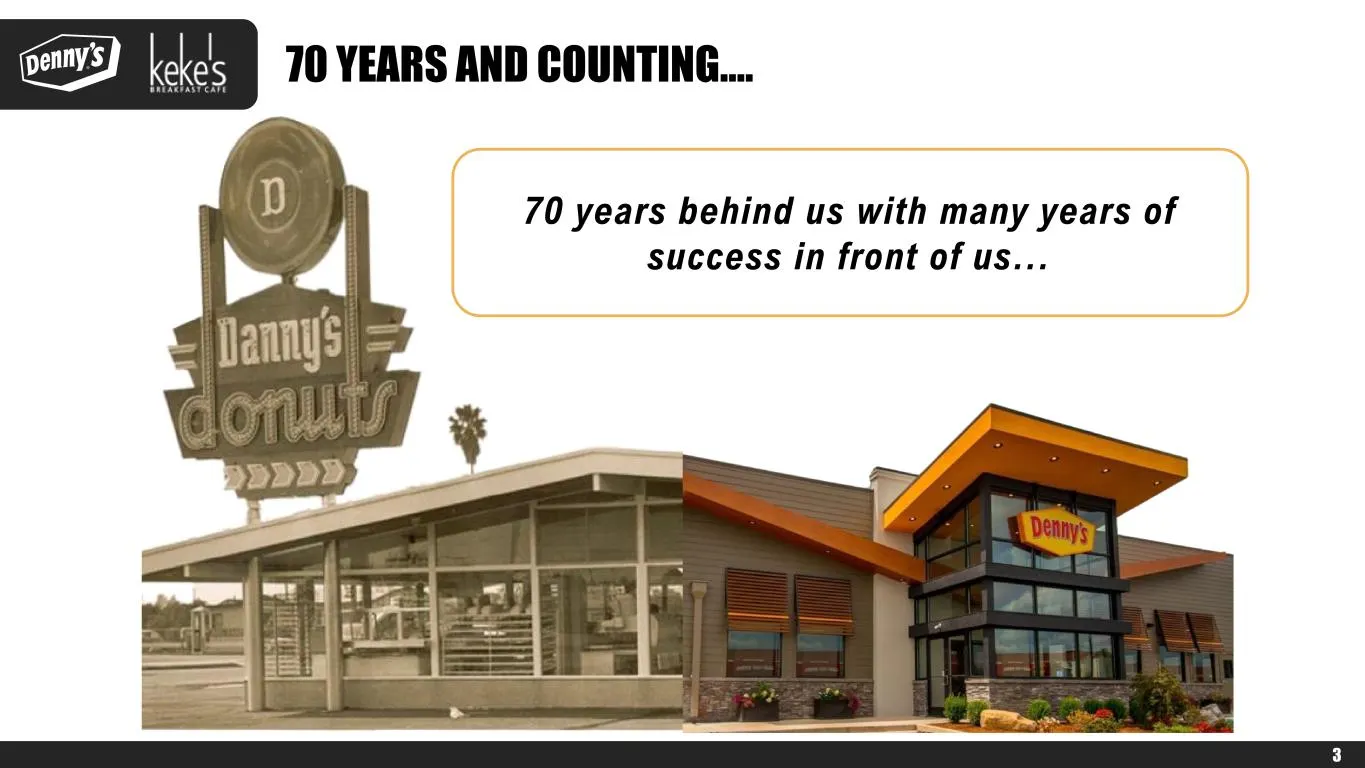
70 YEARS AND COUNTING…. 3 70 years behind us with many years of success in front of us…
Slide 4: We Love to Feed People – Body, Mind, and Soul
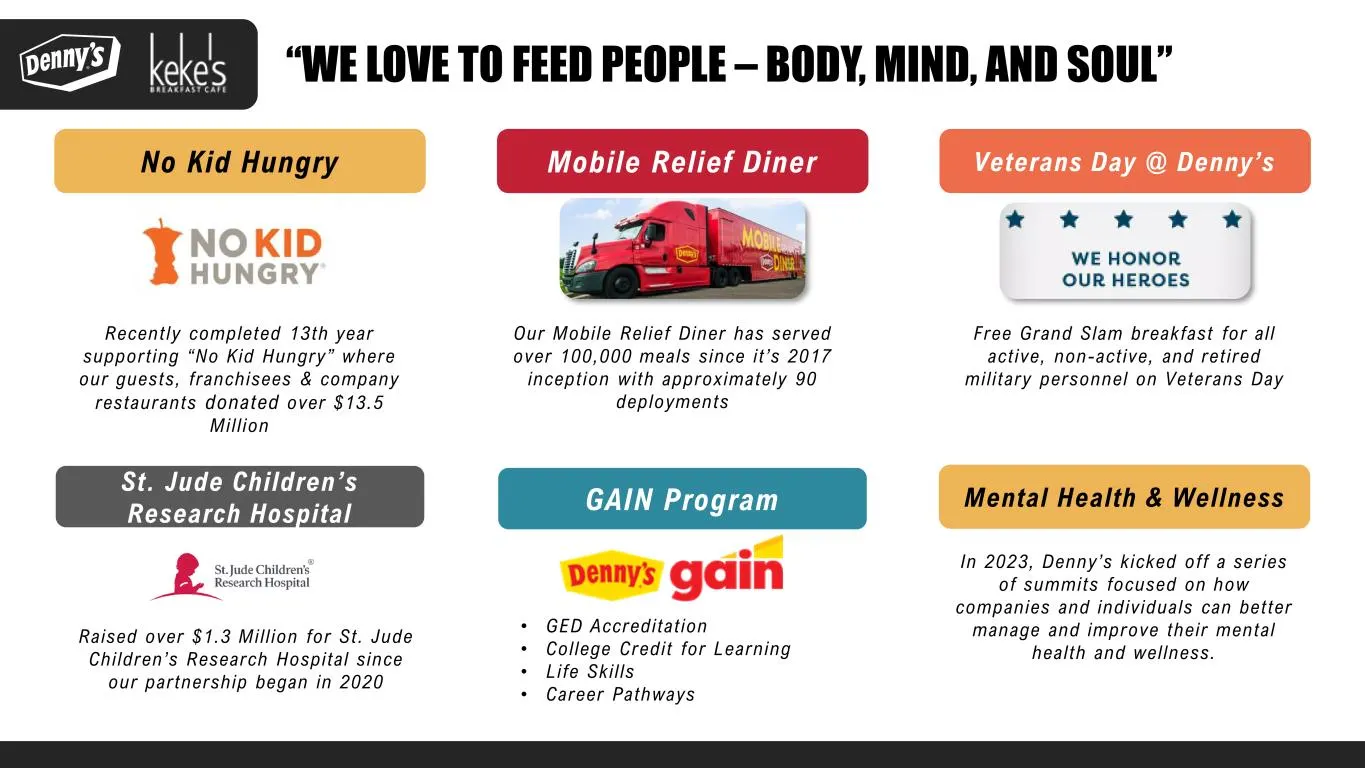
“WE LOVE TO FEED PEOPLE – BODY, MIND, AND SOUL” No Kid Hungry Mobile Relief Diner Veterans Day @ Denny’s Recently completed 13th year support ing “No Kid Hungry” where our guests, franchisees & company restaurants donated over $13.5 Mil l ion Our Mobile Relief Diner has served over 100,000 meals sin
Slide 5: 2023 Preliminary Highlights
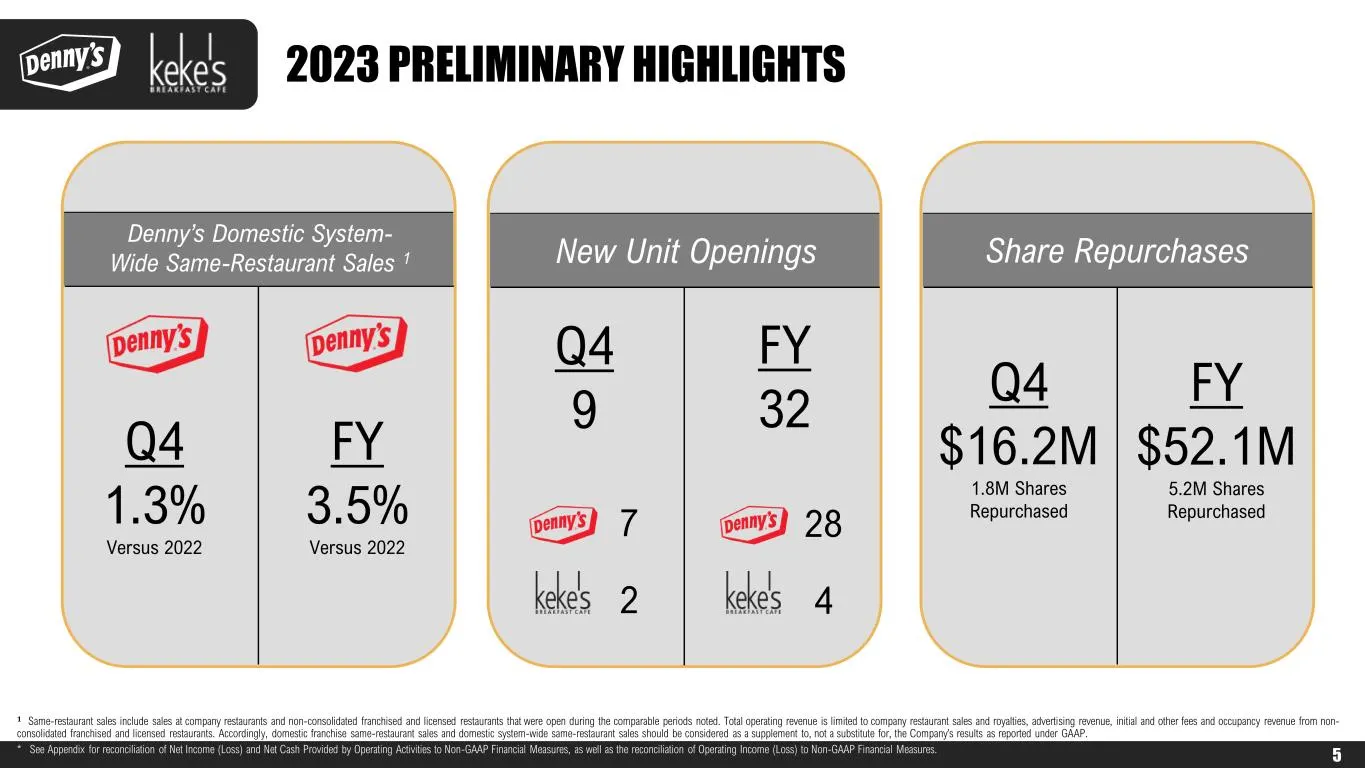
2023 PRELIMINARY HIGHLIGHTS 𝟏 Same-restaurant sales include sales at company restaurants and non-consolidated franchised and licensed restaurants that were open during the comparable periods noted. Total operating revenue is limited to company restaurant sales and royalties, advertising revenue…

Slide 6: Denny's Inc.
DENNY’S INC.
Slide 7: Denny's Domestic Average Weekly Sales & Same-Restaurant Sales
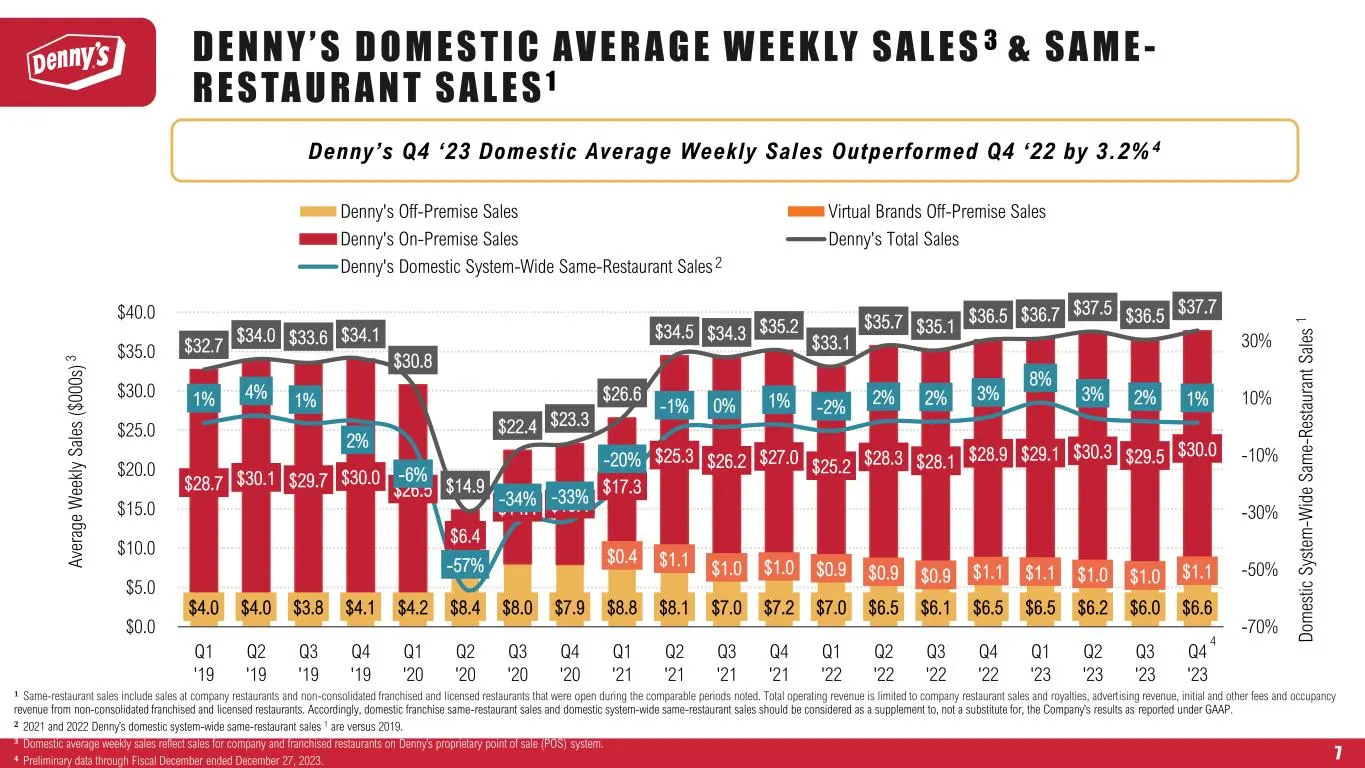
D E N N Y ’ S D O M E S T I C A V E R A G E W E E K LY S A L E S 3 & S A M E - R E S TA U R A N T S A L E S 1 $4.0 $4.0 $3.8 $4.1 $4.2 $8.4 $8.0 $7.9 $8.8 $8.1 $7.0 $7.2 $7.0 $6.5 $6.1 $6.5 $6.5 $6.2 $6.0 $6.6 $0.4 $1.1 $1.0 $1.0 $0.9 $0.9 $0.9 $1.1 $1.1 $1.0 $1.0 $1.1 $28.7 $30.1 $29.7 $30.0 $26.5
Slide 8: Denny's Off-Premise Sales
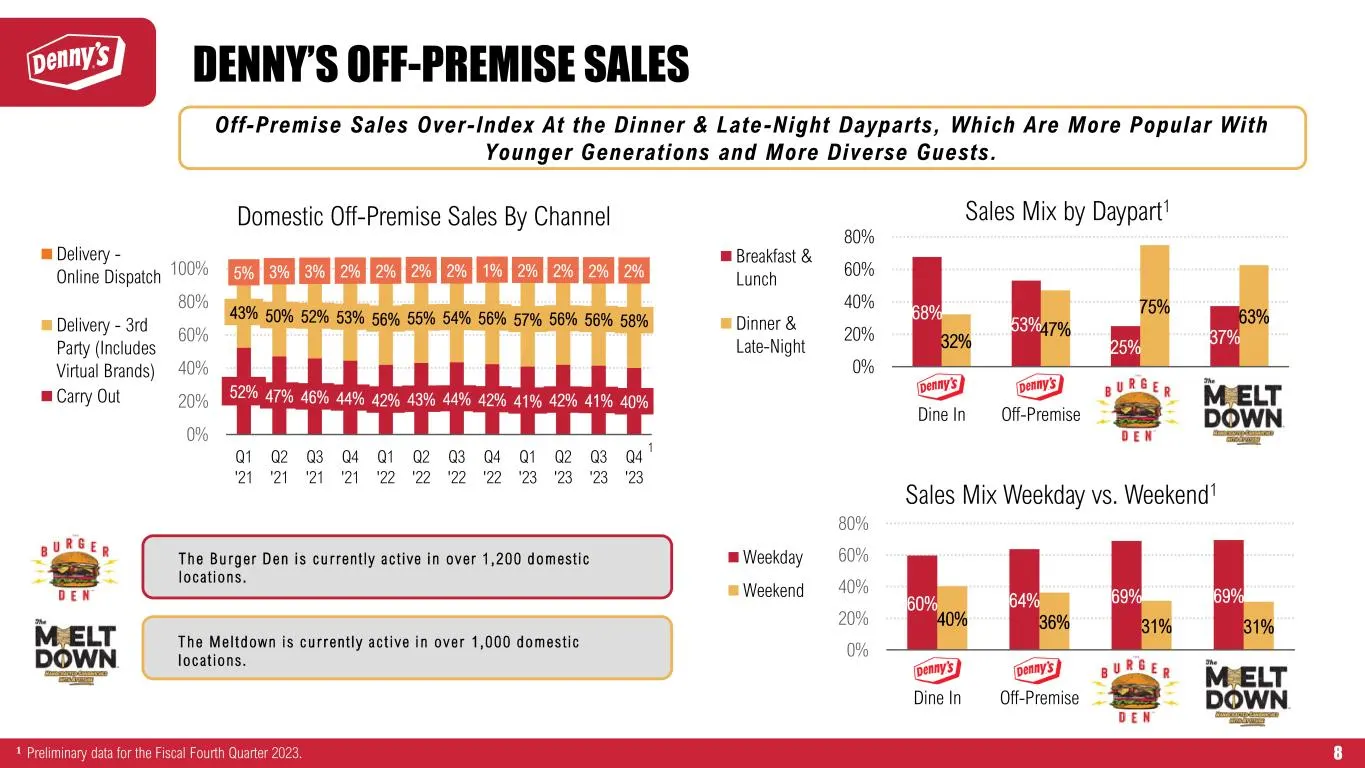
DENNY’S OFF-PREMISE SALES 52% 47% 46% 44% 42% 43% 44% 42% 41% 42% 41% 40% 43% 50% 52% 53% 56% 55% 54% 56% 57% 56% 56% 58% 5% 3% 3% 2% 2% 2% 2% 1% 2% 2% 2% 2% 0% 20% 40% 60% 80% 100% Q1 '21 Q2 '21 Q3 '21 Q4 '21 Q1 '22 Q2 '22 Q3 '22 Q4 '22 Q1 '23 Q2 '23 Q3 '23 Q4 '23 Domestic Off-Premise Sales By Chan
Slide 9: Denny's Domestic Footprint
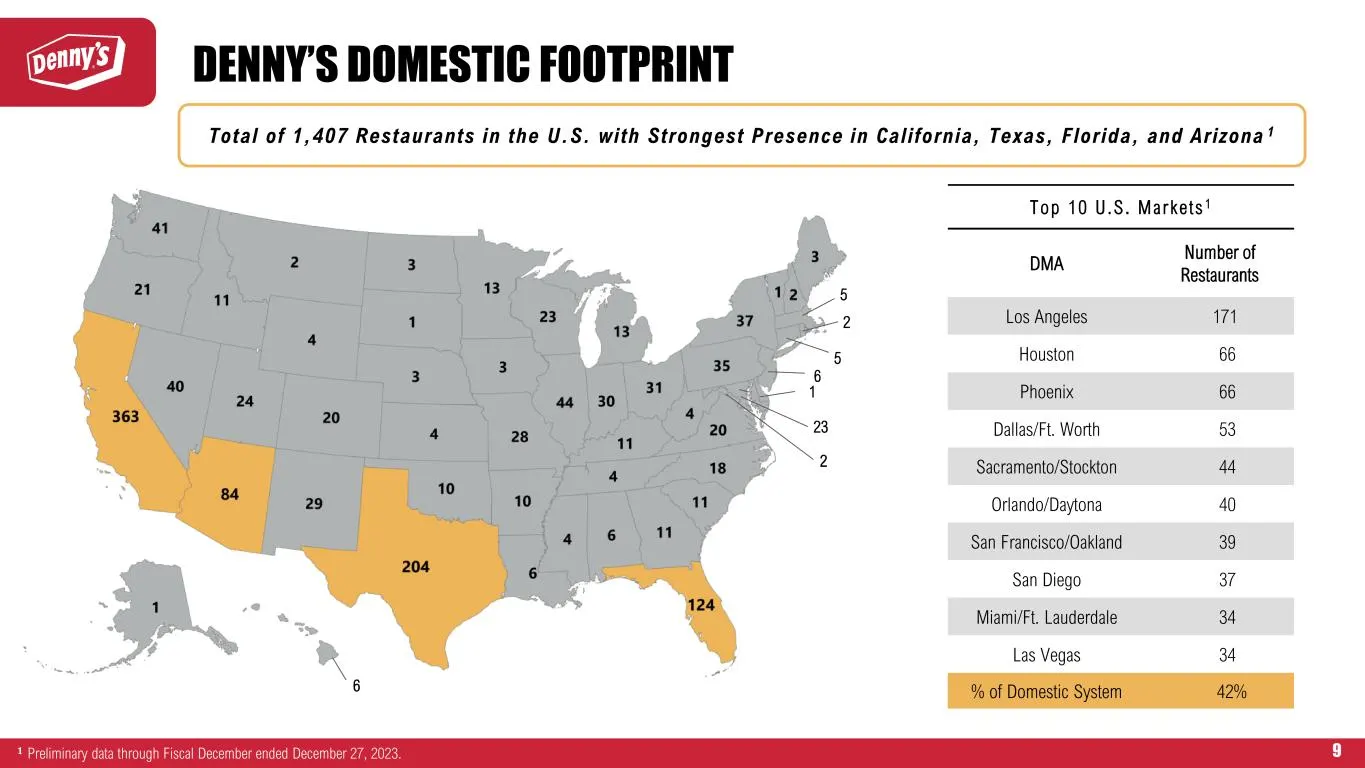
9𝟏 Preliminary data through Fiscal December ended December 27, 2023. Total of 1,407 Restaurants in the U.S. with Strongest Presence in California, Texas, Florida, and Arizona 1 Top 10 U .S . Marke t s 1 DMA Number of Restaurants Los Angeles 171 Houston 66 Phoenix 66 Dallas/Ft. Worth 53…
Slide 10: Denny's International Footprint
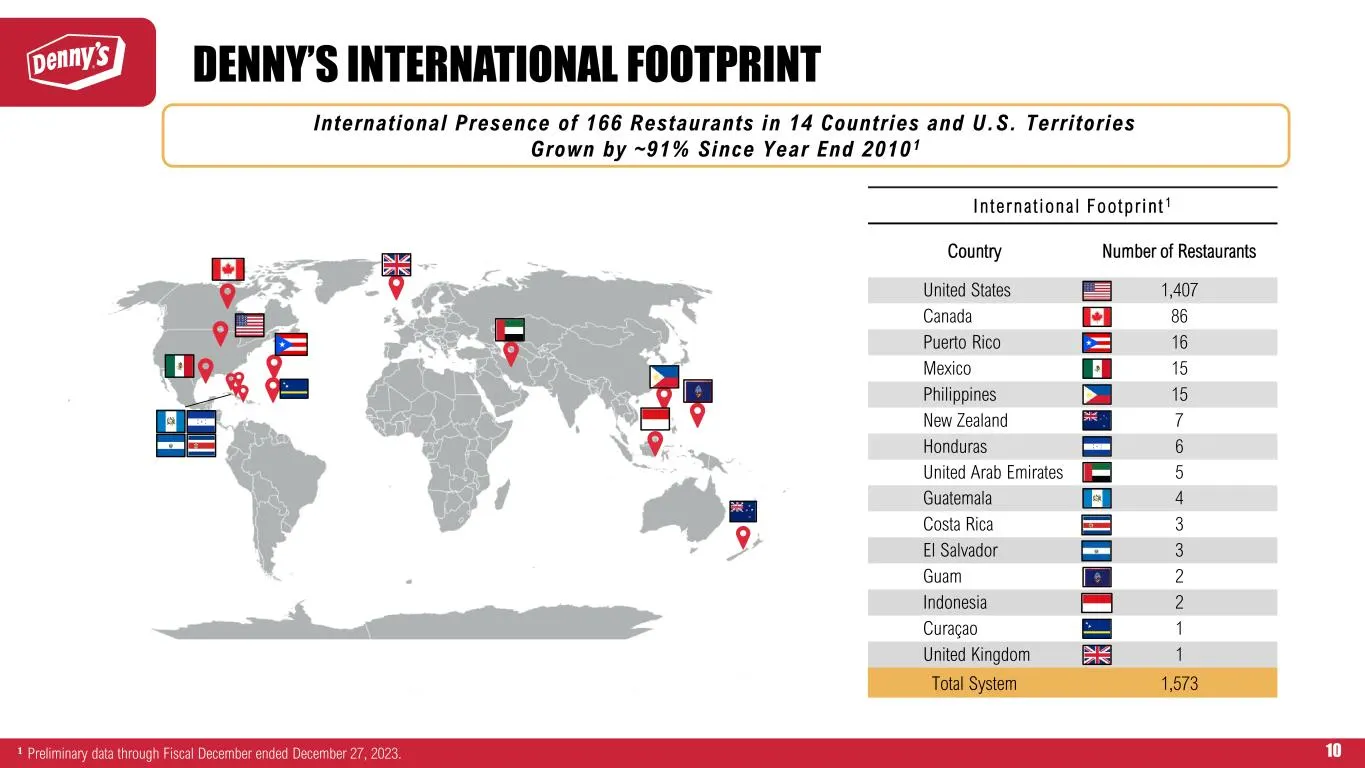
10 I n t e rna t i ona l Foo tp r i n t 1 Country Number of Restaurants United States 1,407 Canada 86 Puerto Rico 16 Mexico 15 Philippines 15 New Zealand 7 Honduras 6 United Arab Emirates 5 Guatemala 4 Costa Rica 3 El Salvador 3 Guam 2 Indonesia 2 Curaçao 1 United Kingdom 1 Total System 1,573 Intern
Slide 11: Denny's Strong Partnership with Franchisees
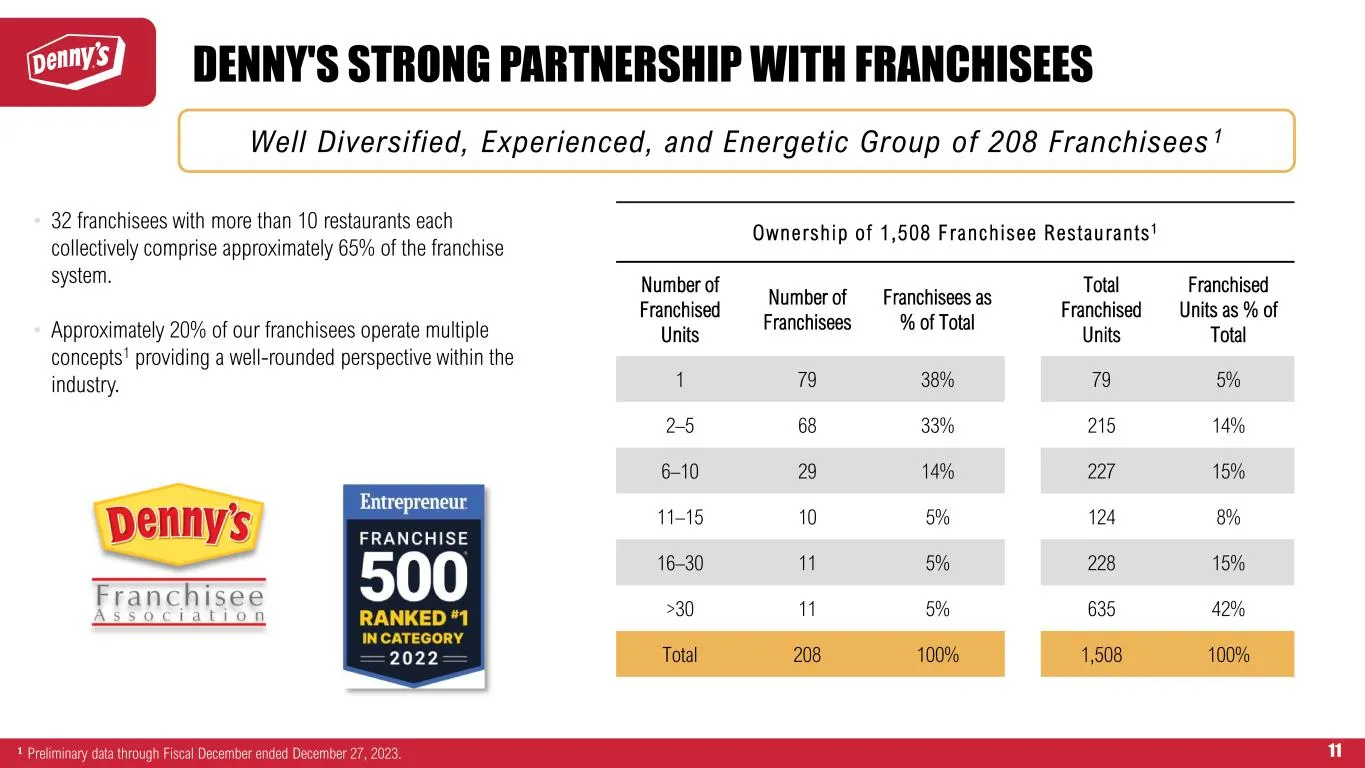
11 Well Diversified, Experienced, and Energetic Group of 208 Franchisees 1 • 32 franchisees with more than 10 restaurants each collectively comprise approximately 65% of the franchise system. • Approximately 20% of our franchisees operate multiple concepts1 providing a well-rounded perspective withi
Slide 12: Delivering Where Our Guests Count on Us
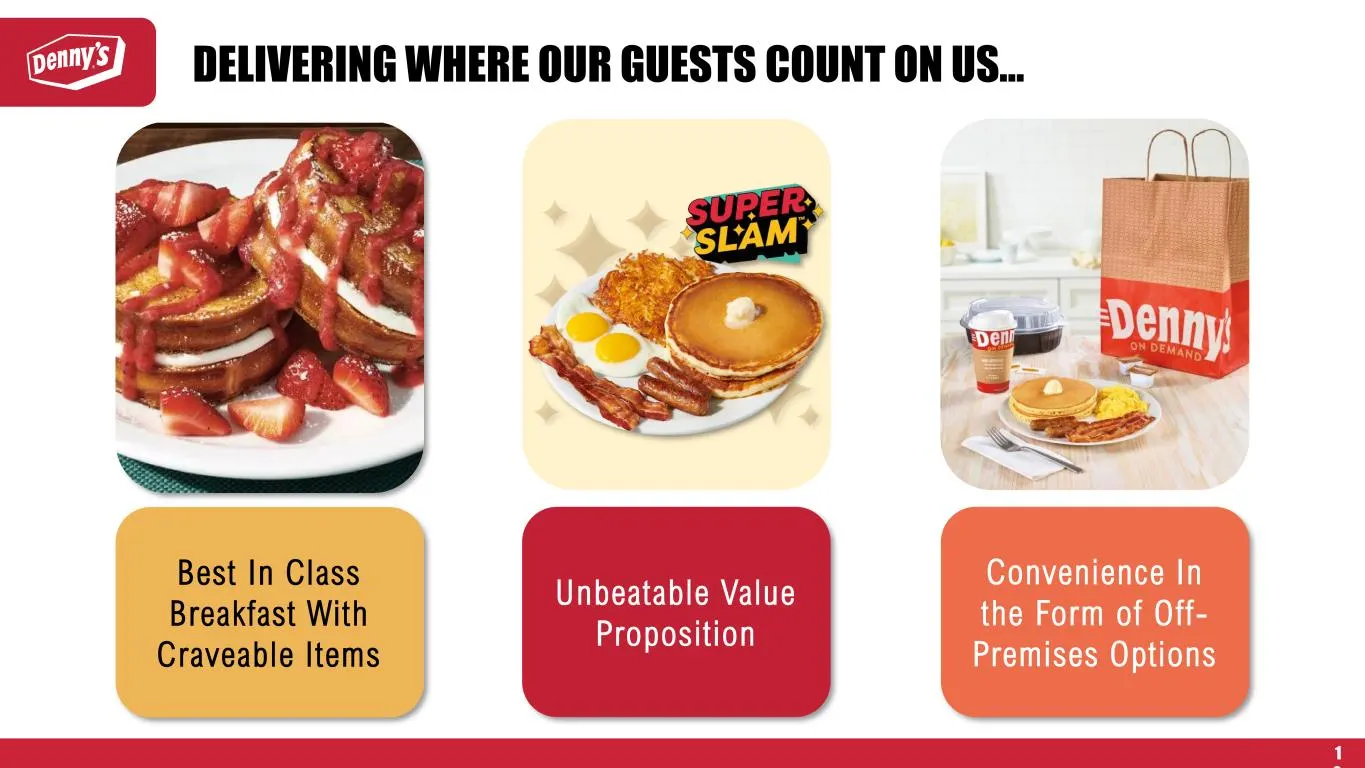
DELIVERING WHERE OUR GUESTS COUNT ON US… Unbeatable Value Proposition Convenience In the Form of Off- Premises Options Best In Class Breakfast With Craveable Items 1 2

Slide 13: Keke's
KEKE’S
Slide 14: Keke's Footprint and Performance
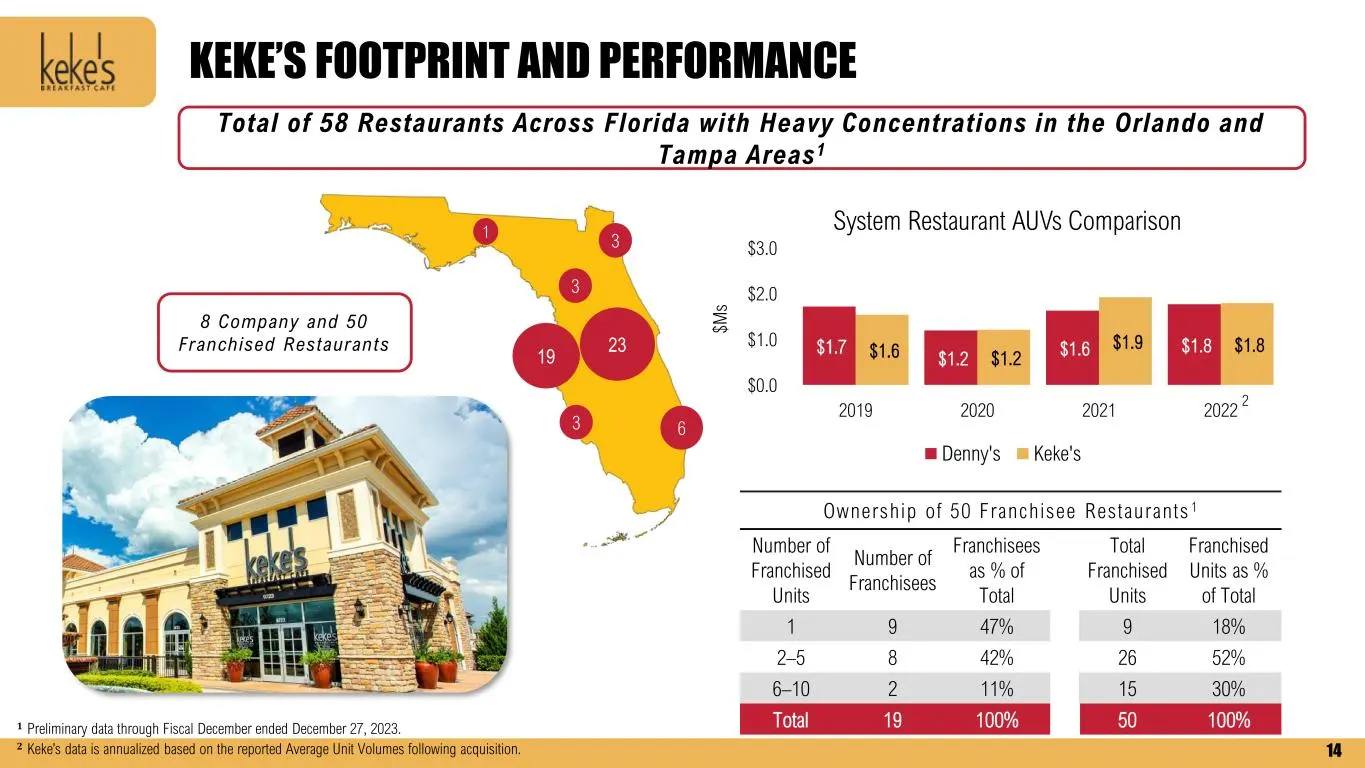
KEKE’S FOOTPRINT AND PERFORMANCE 14 63 3 3 1 Total of 58 Restaurants Across Florida with Heavy Concentrations in the Orlando and Tampa Areas1 𝟏 Preliminary data through Fiscal December ended December 27, 2023. 𝟐 Keke’s data is annualized based on the reported Average Unit Volumes following…

Slide 15: Denny's Corporation
DENNY’S CORPORATION
Slide 16: History of Consistently Returning Capital to Shareholders
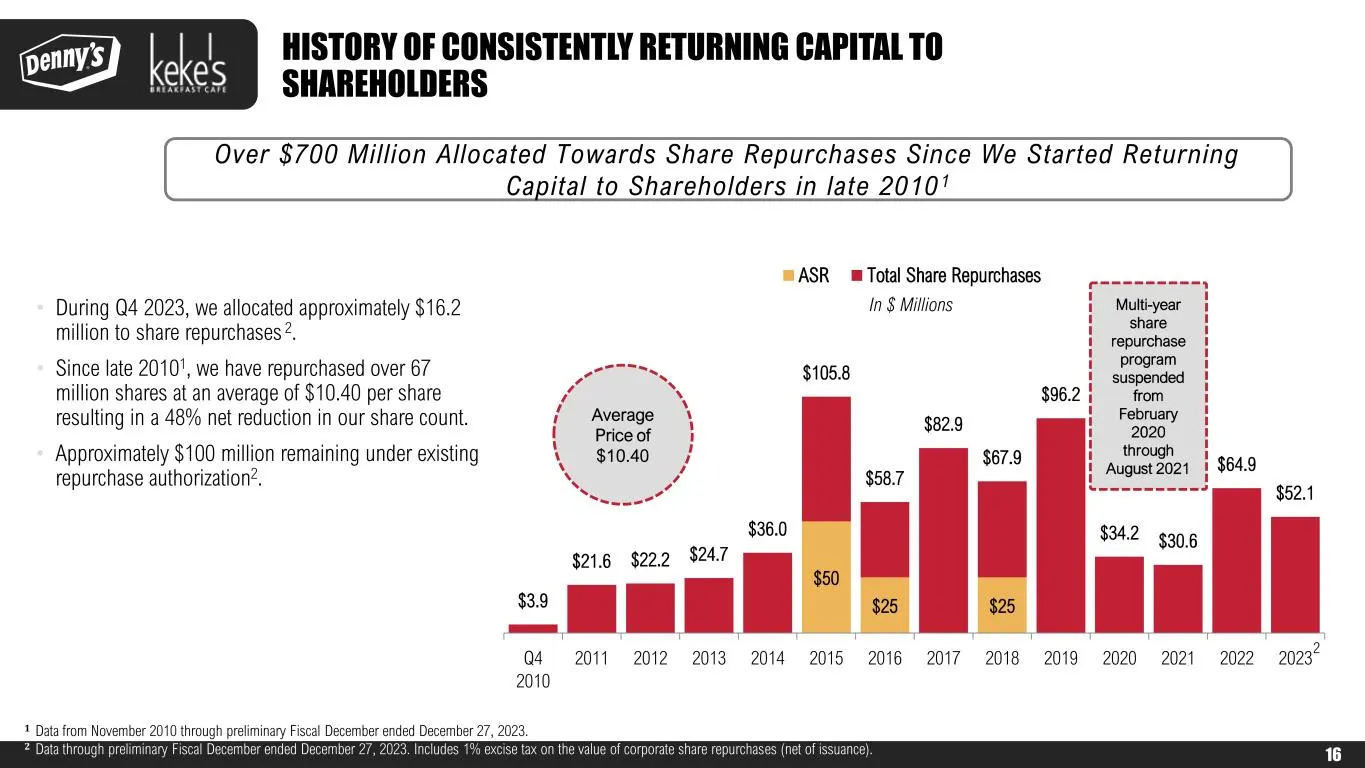
HISTORY OF CONSISTENTLY RETURNING CAPITAL TO SHAREHOLDERS $50 $25 $25 $3.9 $21.6 $22.2 $24.7 $36.0 $105.8 $58.7 $82.9 $67.9 $96.2 $34.2 $30.6 $64.9 $52.1 Q4 2010 2011 2012 2013 2014 2015 2016 2017 2018 2019 2020 2021 2022 2023 ASR Total Share Repurchases In $ Millions• During Q4 2023, we allocated a
Slide 17: Solid Balance Sheet with Flexibility
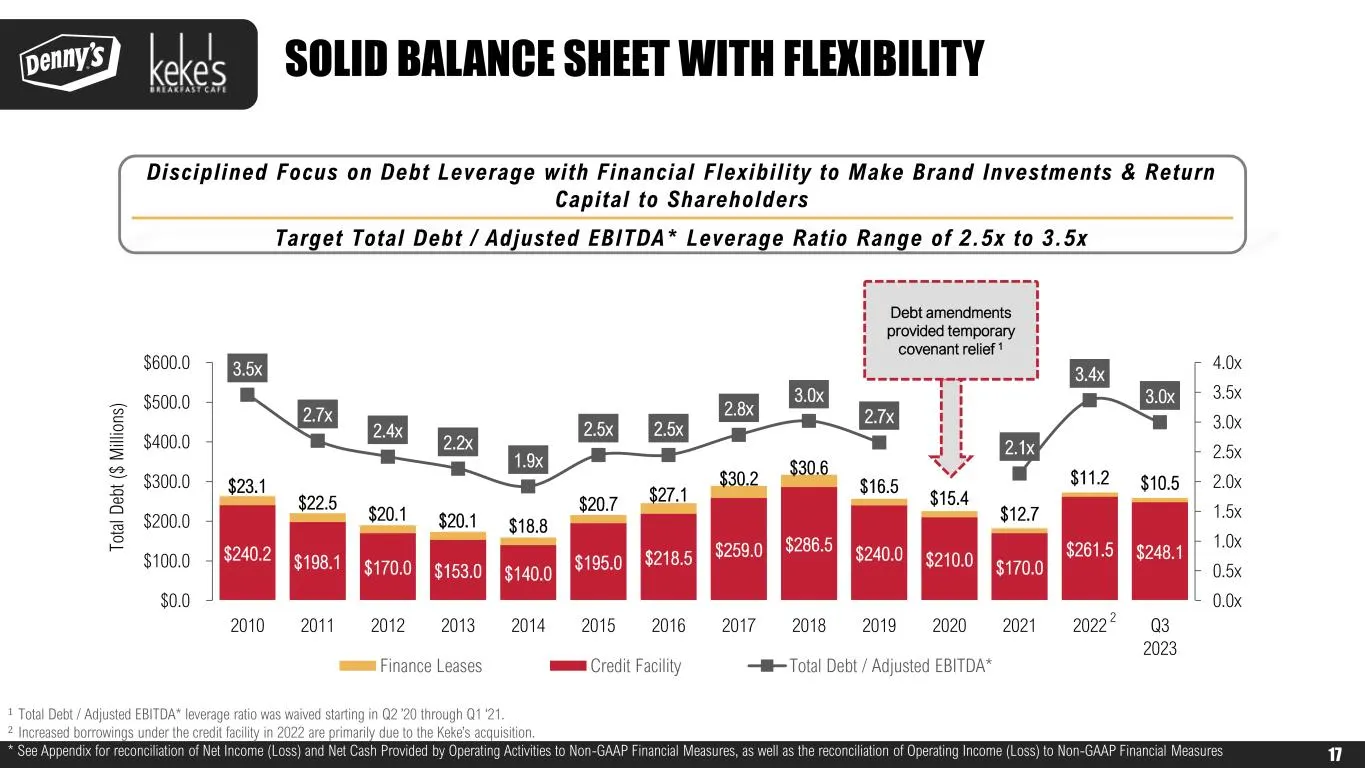
SOLID BALANCE SHEET WITH FLEXIBILITY $240.2 $198.1 $170.0 $153.0 $140.0 $195.0 $218.5 $259.0 $286.5 $240.0 $210.0 $170.0 $261.5 $248.1 $23.1 $22.5 $20.1 $20.1 $18.8 $20.7 $27.1 $30.2 $30.6 $16.5 $15.4 $12.7 $11.2 $10.5 3.5x 2.7x 2.4x 2.2x 1.9x 2.5x 2.5x 2.8x 3.0x 2.7x 2.1x 3.4x 3.0x 0.0x 0.5x 1.0x 1
Slide 18: Our Company Purpose, Vision, and Strategic Priorities
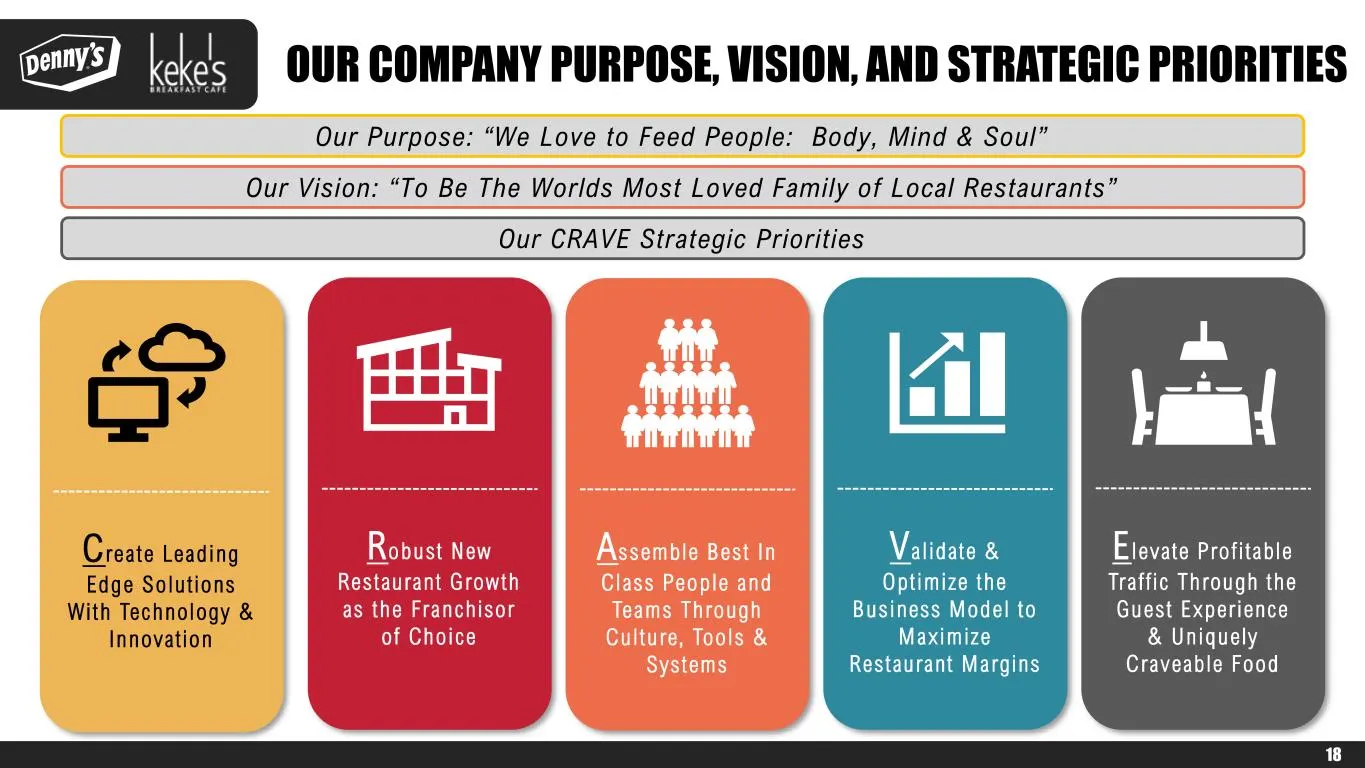
OUR COMPANY PURPOSE, VISION, AND STRATEGIC PRIORITIES Va l ida te & Opt imize the Bus iness Mode l to Max imize Res taurant Margins E l eva te Pro f i tab le Tra f f ic Through the Gues t Exper ience & Un iquely Craveable Food C rea te Lead ing Edge So lu t ions Wi th Technology & Innova t ion Robus

Slide 19: Appendix
APPENDIX
Slide 20: Denny's Franchised and Company Restaurant Sales
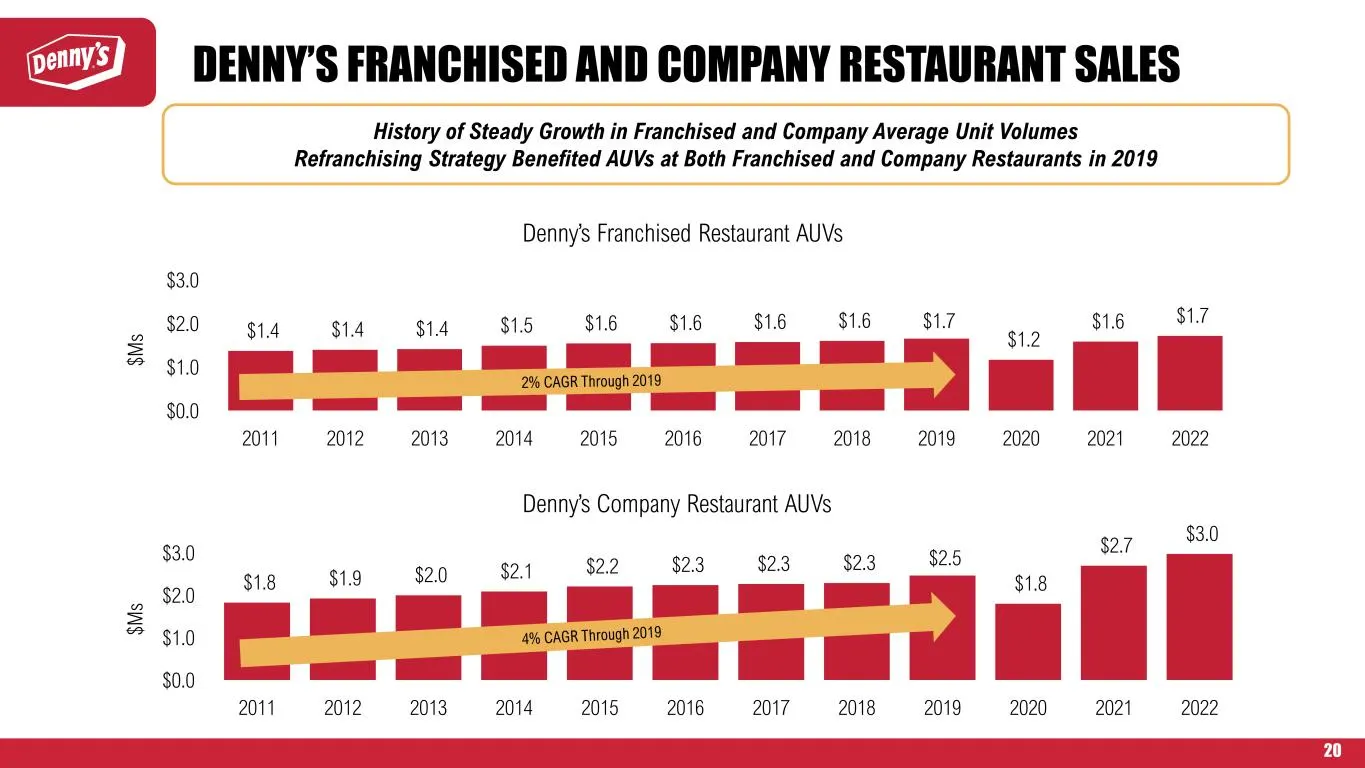
20 $1.8 $1.9 $2.0 $2.1 $2.2 $2.3 $2.3 $2.3 $2.5 $1.8 $2.7 $3.0 $0.0 $1.0 $2.0 $3.0 2011 2012 2013 2014 2015 2016 2017 2018 2019 2020 2021 2022 $M s Denny’s Company Restaurant AUVs $1.4 $1.4 $1.4 $1.5 $1.6 $1.6 $1.6 $1.6 $1.7 $1.2 $1.6 $1.7 $0.0 $1.0 $2.0 $3.0 2011 2012 2013 2014 2015 2016 2017 2018
Slide 21: Approximately $500 Million in Adjusted Free Cash Flow Over 12 Years
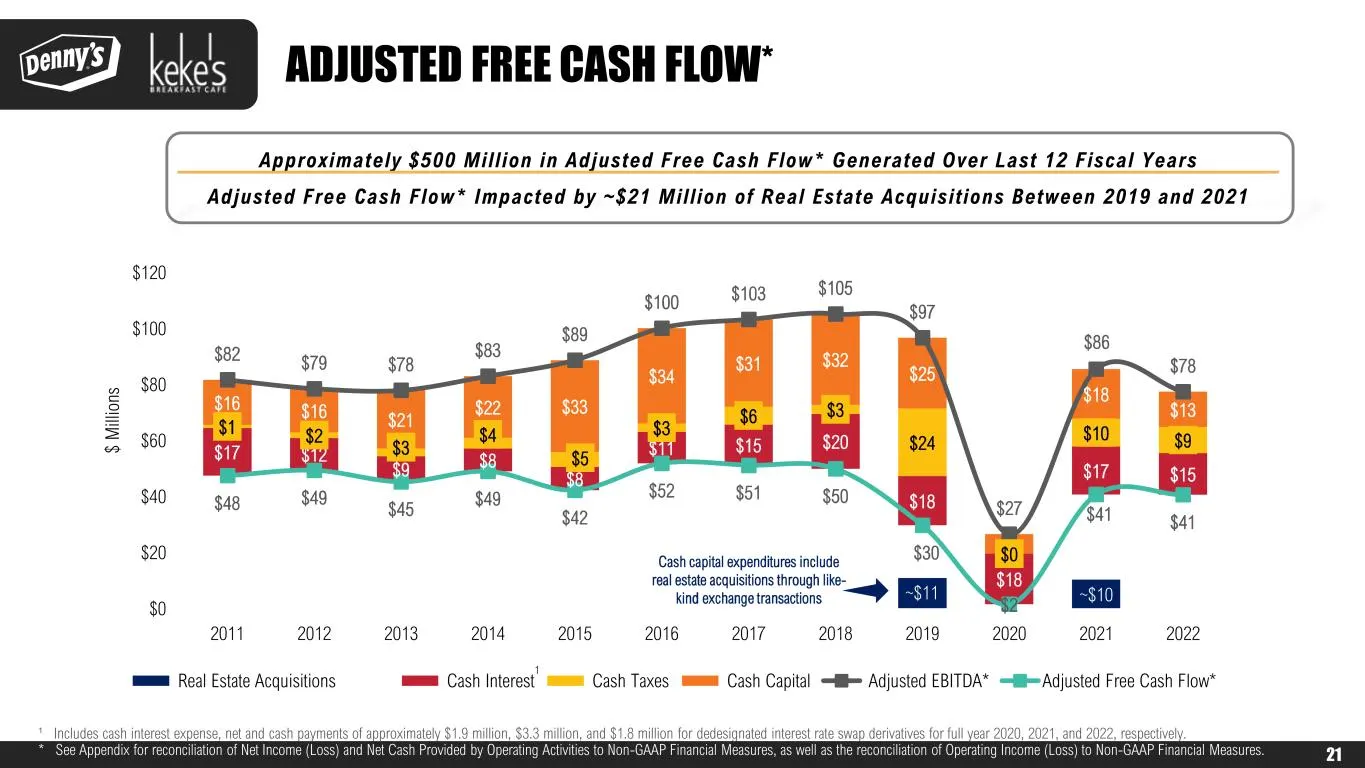
21 Approximately $500 Million in Adjusted Free Cash Flow* Generated Over Last 12 Fiscal Years Adjusted Free Cash Flow* Impacted by ~$21 Million of Real Estate Acquisitions Between 2019 and 2021 ¹ Includes cash interest expense, net and cash payments of approximately $1.9 million, $3.3 million, and $
Slide 22: Management Team
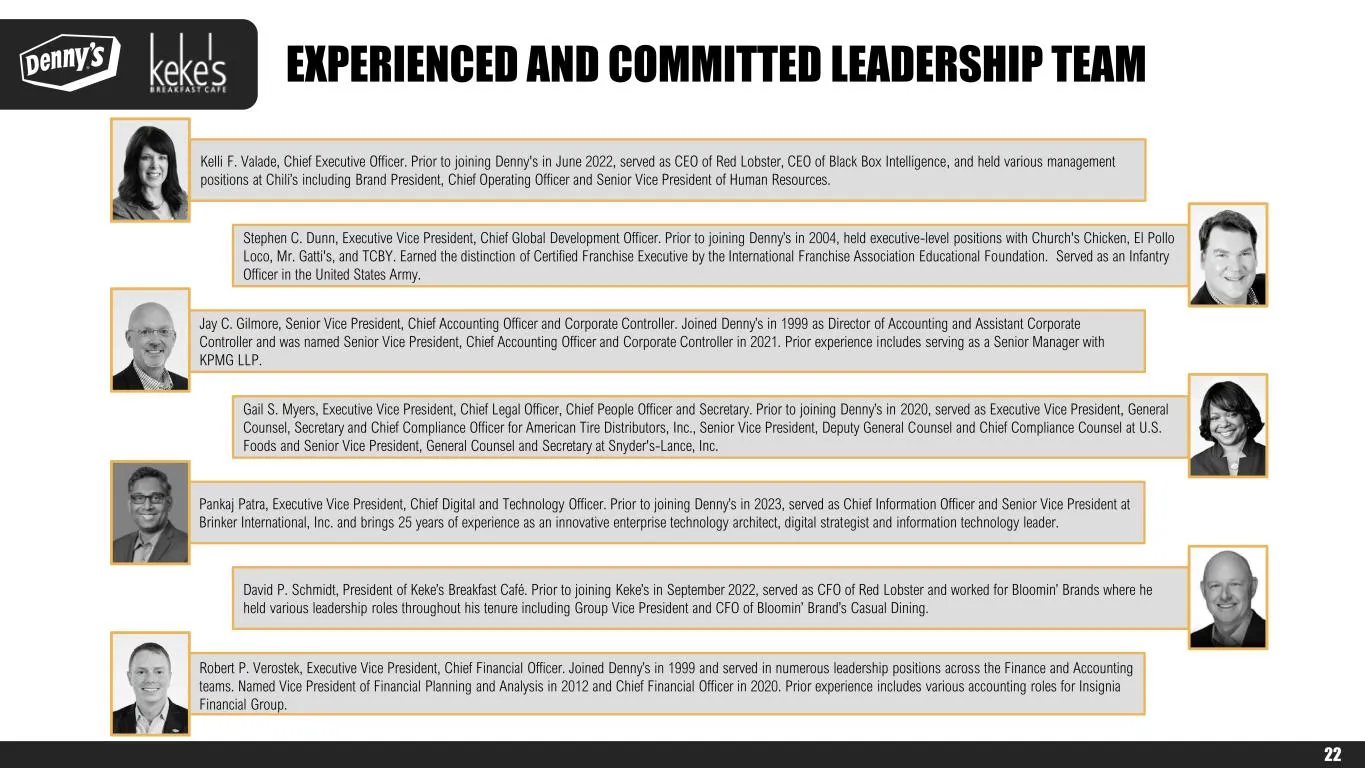
22 Robert P. Verostek, Executive Vice President, Chief Financial Officer. Joined Denny’s in 1999 and served in numerous leadership positions across the Finance and Accounting teams. Named Vice President of Financial Planning and Analysis in 2012 and Chief Financial Officer in 2020. Prior experience
Slide 23: Reconciliation of Net Income to Adjusted EBITDA
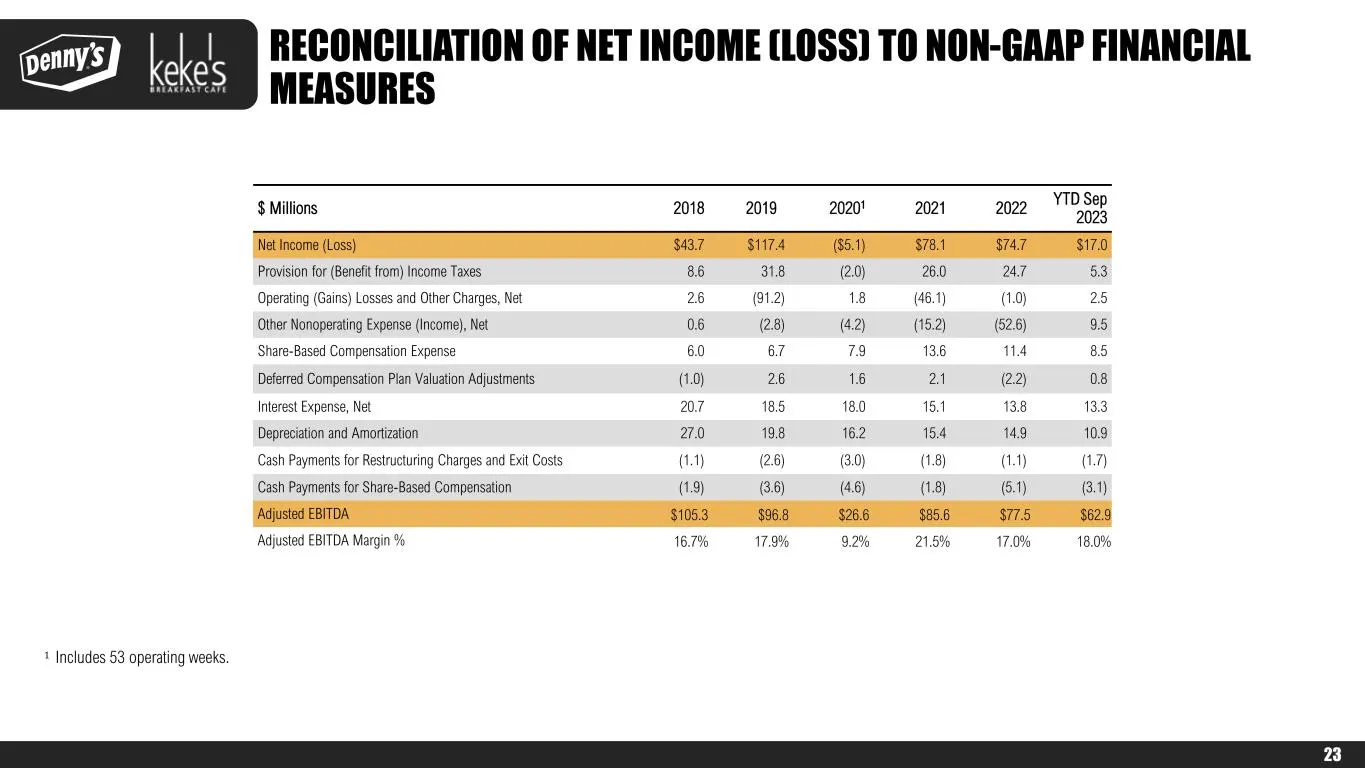
23 1 Includes 53 operating weeks. $ Millions 2018 2019 20201 2021 2022 YTD Sep 2023 Net Income (Loss) $43.7 $117.4 ($5.1) $78.1 $74.7 $17.0 Provision for (Benefit from) Income Taxes 8.6 31.8 (2.0) 26.0 24.7 5.3 Operating (Gains) Losses and Other Charges, Net 2.6 (91.2) 1.8 (46.1) (1.0) 2.5 Other Non
Slide 24: Reconciliation of Net Cash Provided by Operating Activities
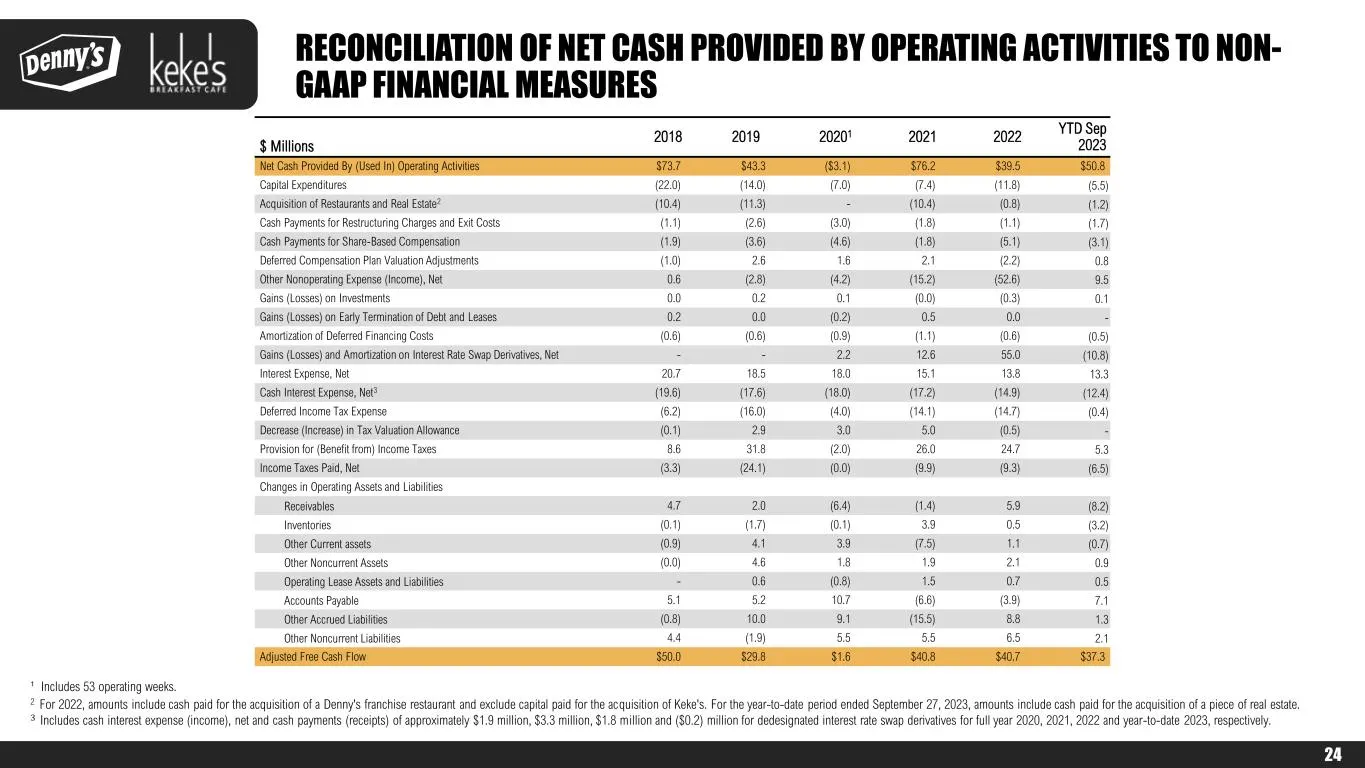
24 $ Millions 2018 2019 20201 2021 2022 YTD Sep 2023 Net Cash Provided By (Used In) Operating Activities $73.7 $43.3 ($3.1) $76.2 $39.5 $50.8 Capital Expenditures (22.0) (14.0) (7.0) (7.4) (11.8) (5.5) Acquisition of Restaurants and Real Estate2 (10.4) (11.3) - (10.4) (0.8) (1.2) Cash Payments for R
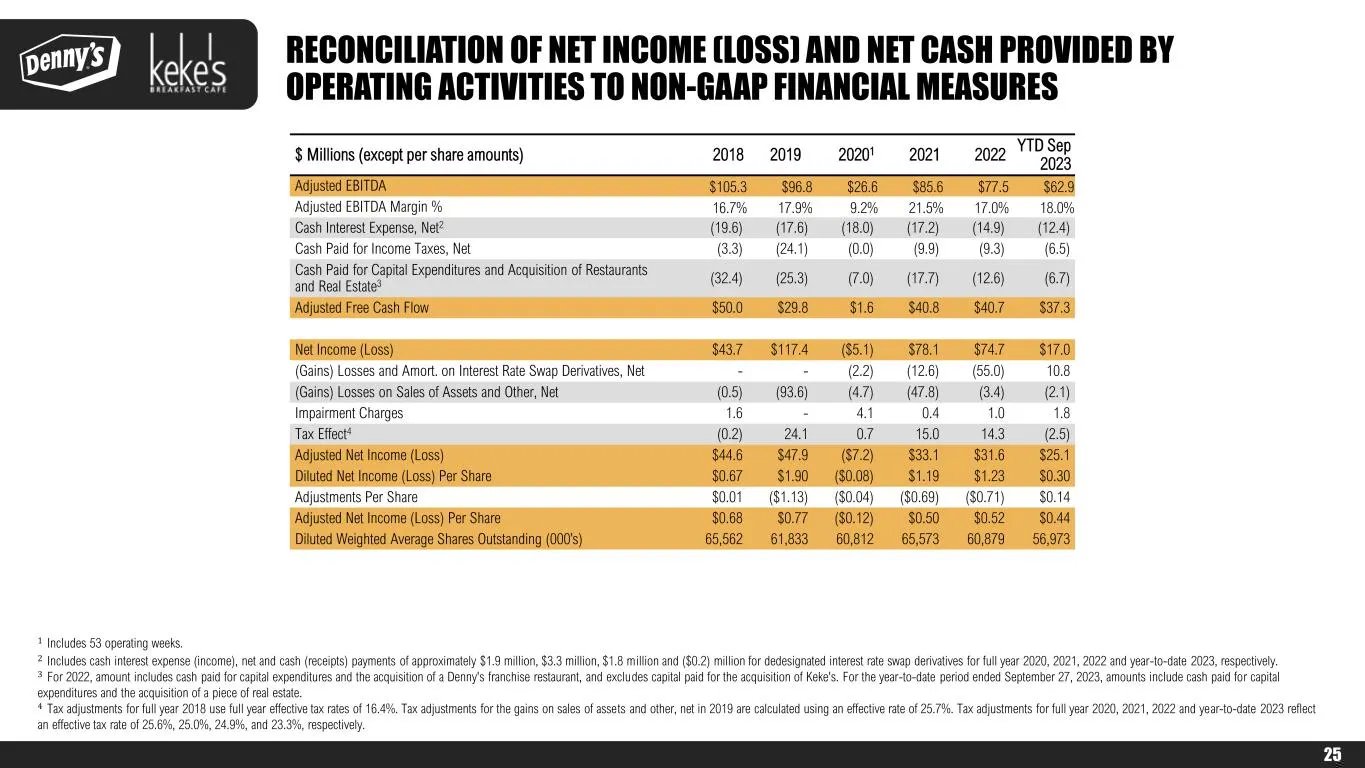
Slide 25: Reconciliation of Adjusted EBITDA to Adjusted Free Cash Flow
25 $ Millions (except per share amounts) 2018 2019 20201 2021 2022 YTD Sep 2023 Adjusted EBITDA $105.3 $96.8 $26.6 $85.6 $77.5 $62.9 Adjusted EBITDA Margin % 16.7% 17.9% 9.2% 21.5% 17.0% 18.0% Cash Interest Expense, Net2 (19.6) (17.6) (18.0) (17.2) (14.9) (12.4) Cash Paid for Income Taxes, Net (3.3)
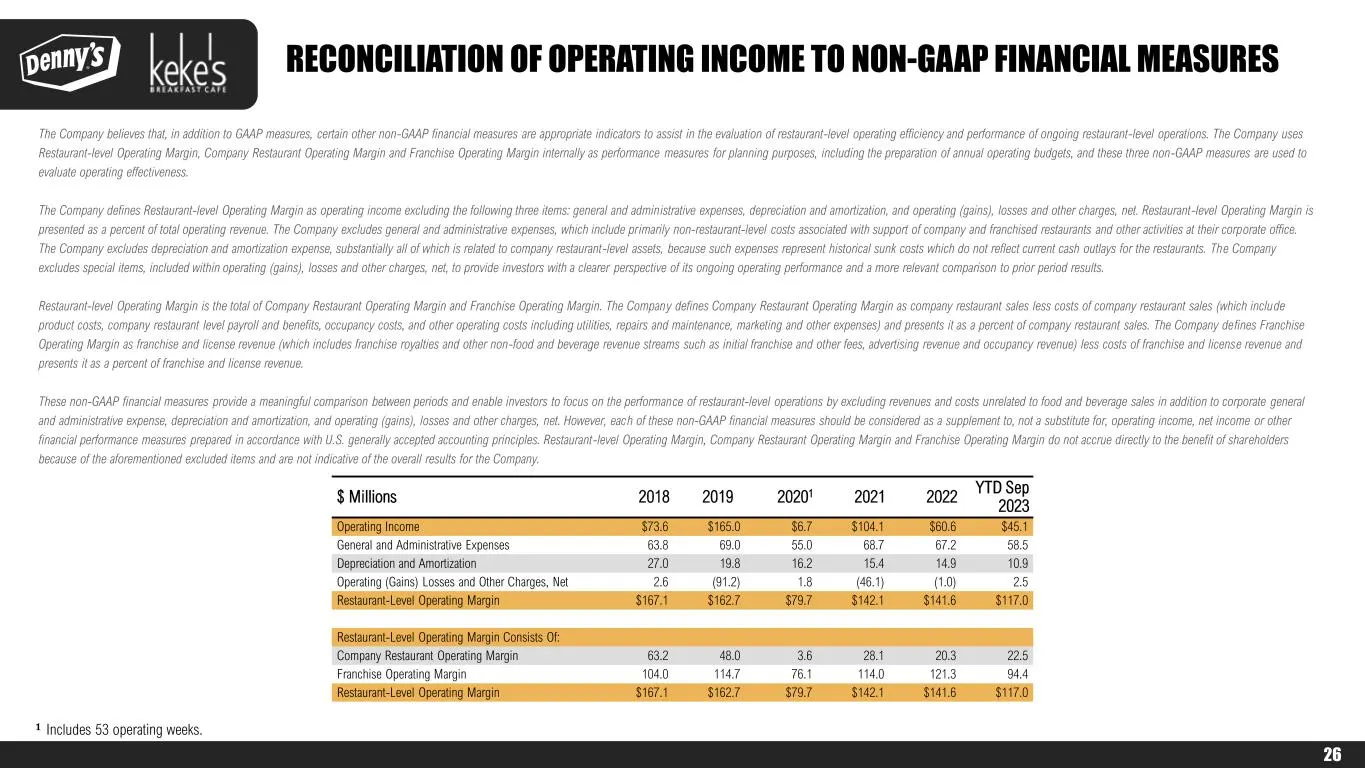
Slide 26: Reconciliation of Restaurant-Level Operating Margin
26 $ Millions 2018 2019 20201 2021 2022 YTD Sep 2023 Operating Income $73.6 $165.0 $6.7 $104.1 $60.6 $45.1 General and Administrative Expenses 63.8 69.0 55.0 68.7 67.2 58.5 Depreciation and Amortization 27.0 19.8 16.2 15.4 14.9 10.9 Operating (Gains) Losses and Other Charges, Net 2.6 (91.2) 1.8 (46.
Source: SEC EDGAR · 8-K filed Jan 8, 2024
More decks from Dennys Corp
 Investor Presentation (August 2025)30 slides · Aug 4, 2025
 Investor Presentation (May 2025)32 slides · May 2025
 Investor Presentation (February 2025)32 slides · February 2025
 Investor Presentation (January 2025)32 slides · Jan 13, 2025
 Investor Day (October 2024)137 slides · Oct 22, 2024
 Q2 2024 Earnings Presentation22 slides · Jul 30, 2024