Dennys — Investor Presentation (May 2021)
47 slides from Dennys's investor presentation, May 4, 2021
Slide 1: Investor Presentation May Through July 2021
INVESTOR PRESENTATION May Through July 2021
Slide 2: Forward-looking statements caution
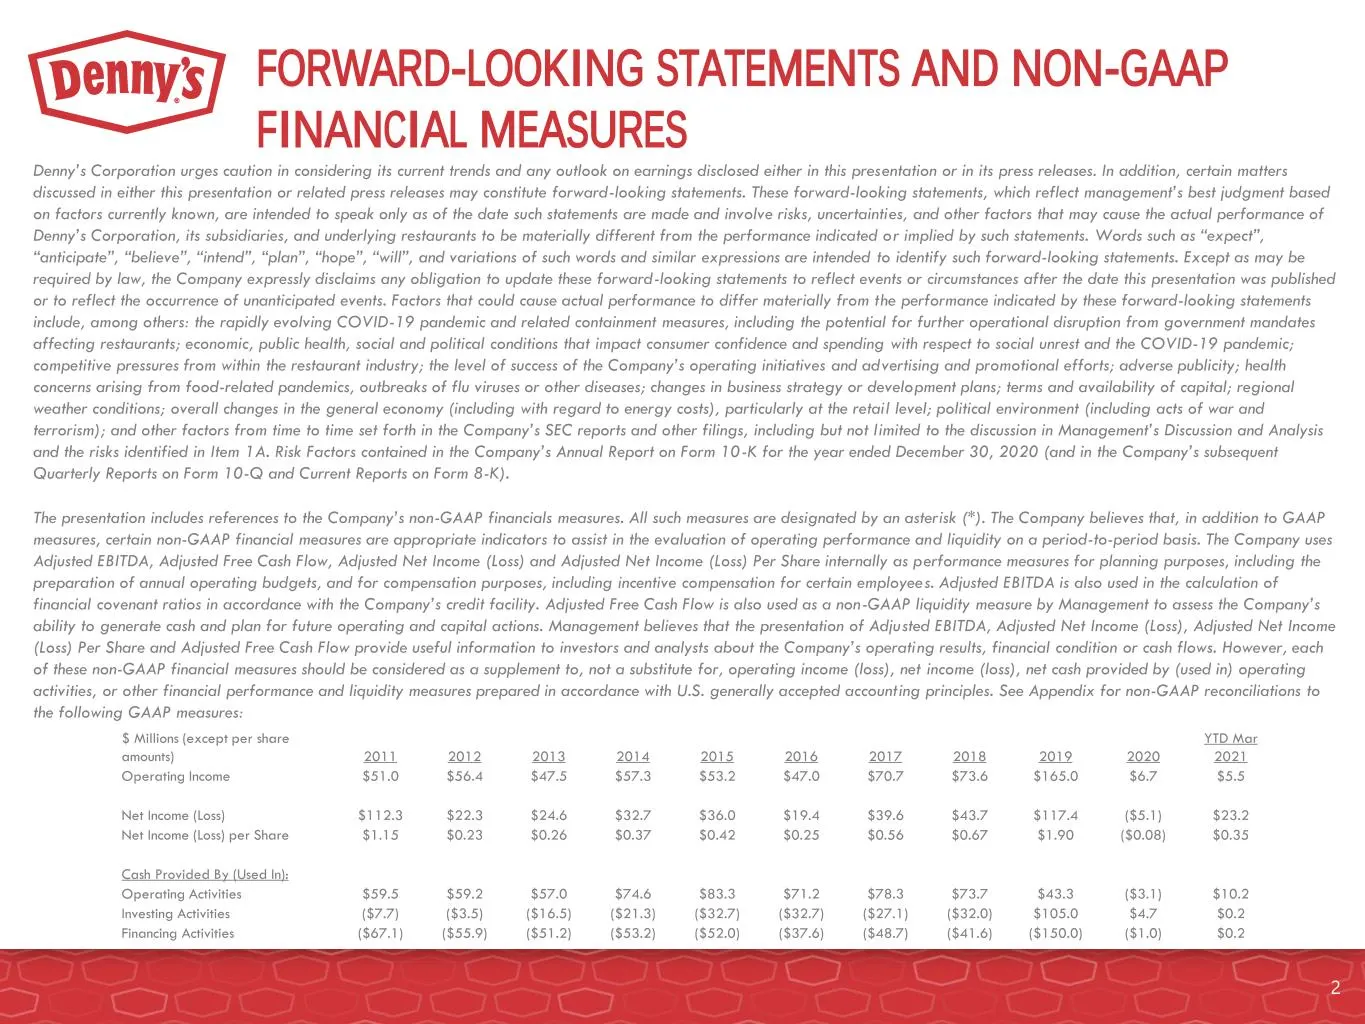
Denny’s Corporation urges caution in considering its current trends and any outlook on earnings disclosed either in this presentation or in its press releases. In addition, certain matters discussed in either this presentation or related press releases may constitute forward-looking statements. Thes
Slide 3: Denny's Investment Highlights
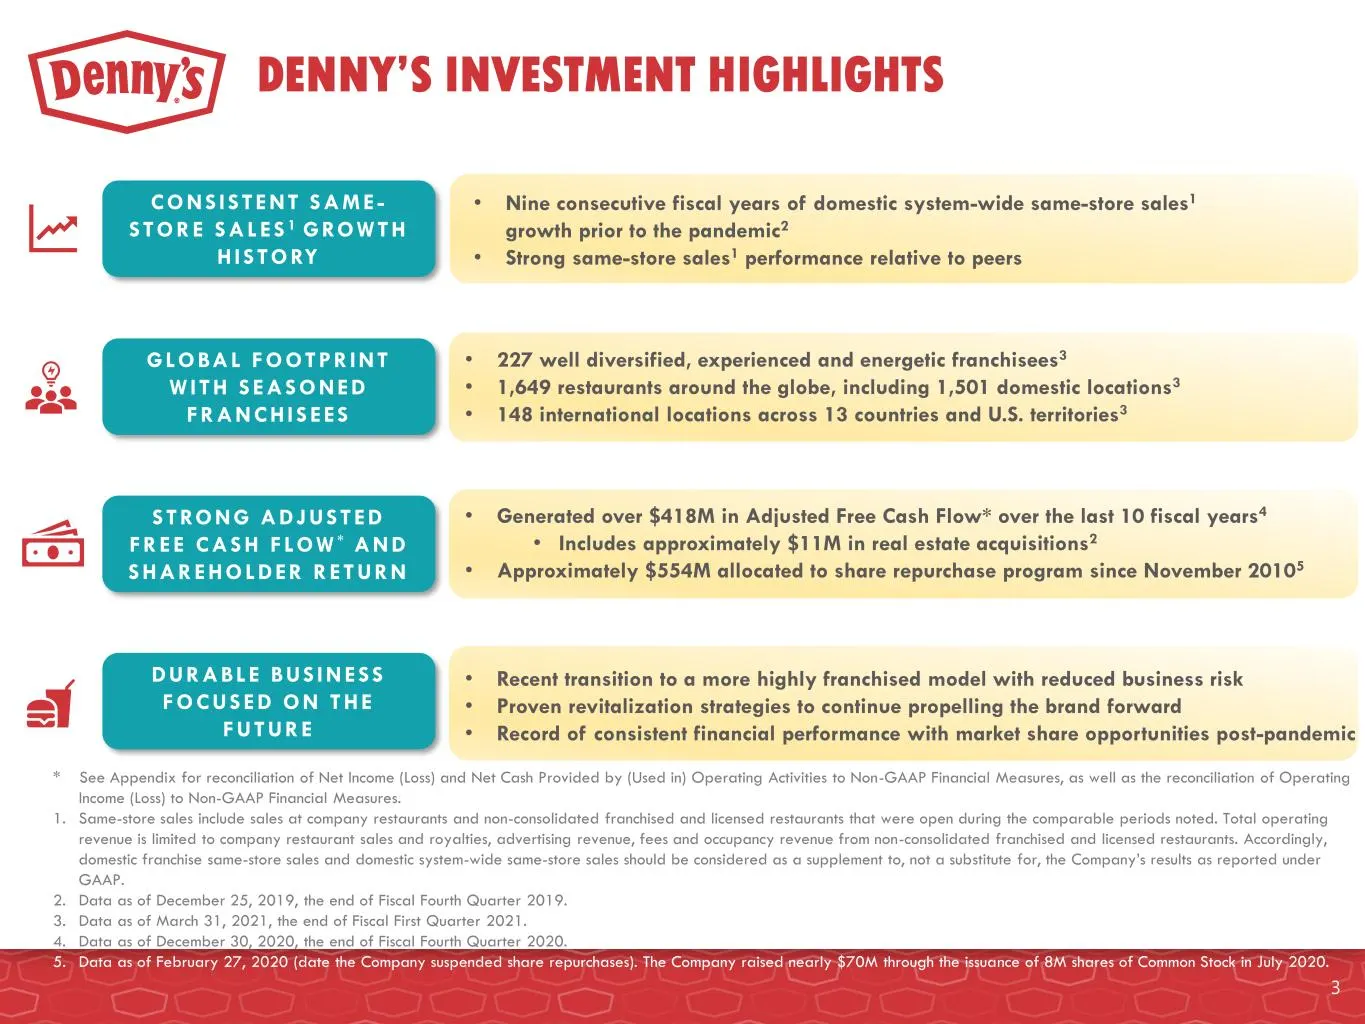
DENNY’S INVESTMENT HIGHLIGHTS • Nine consecutive fiscal years of domestic system-wide same-store sales1 growth prior to the pandemic2 • Strong same-store sales1 performance relative to peers • 227 well diversified, experienced and energetic franchisees3 • 1,649 restaurants around the globe, includin

Slide 4: 2021 Results & COVID-19 Business Response
2021 RESULTS & COVID-19 BUSINESS RESPONSE 4
Slide 5: Q1 2021 Highlights
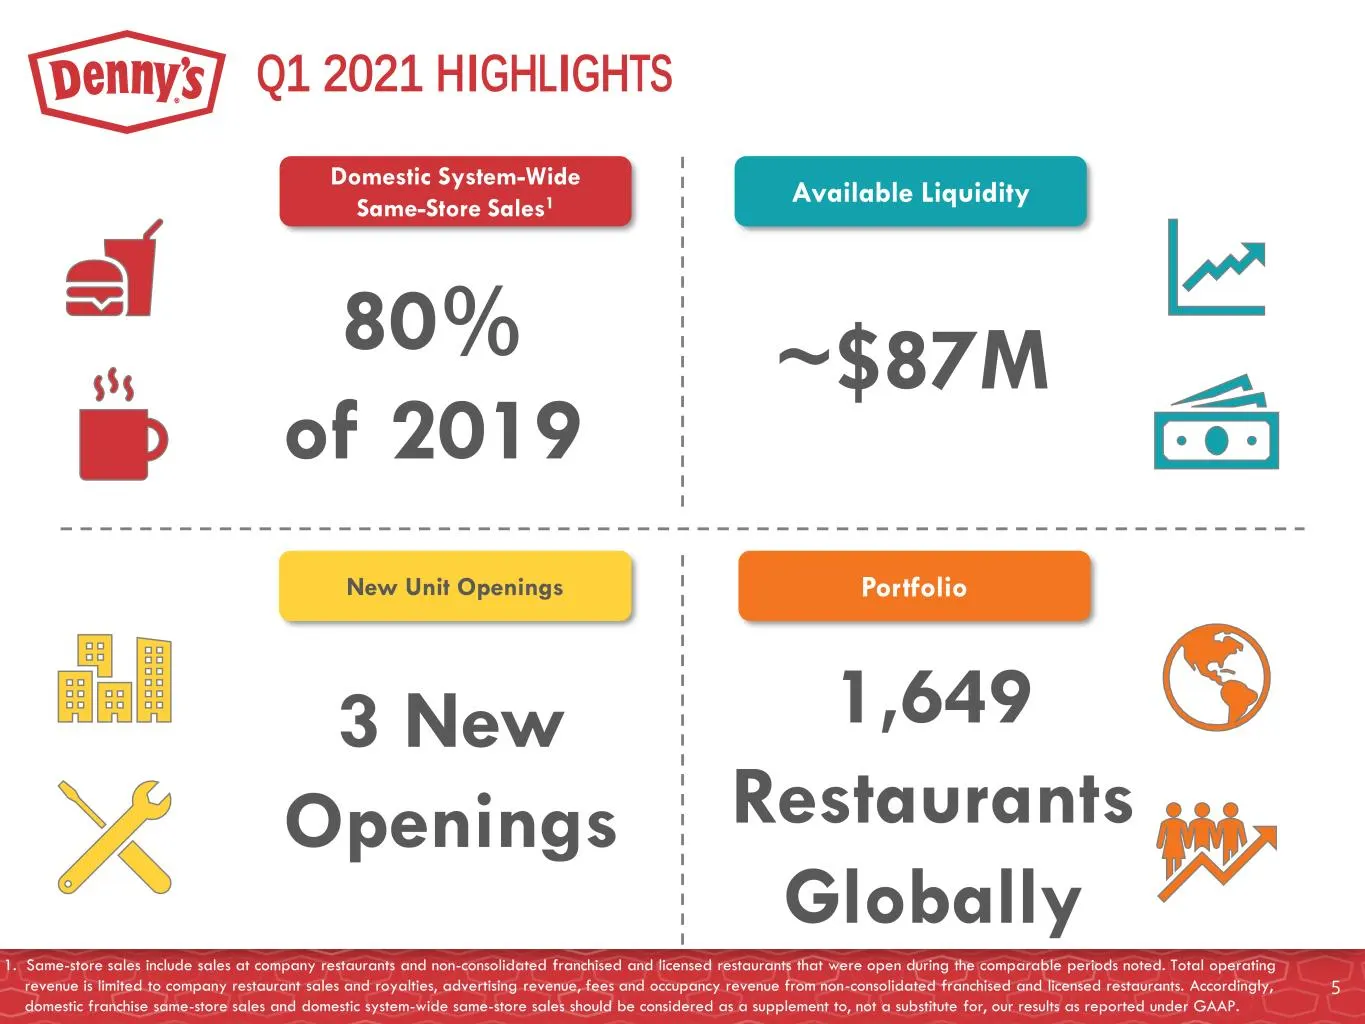
Q1 2021 HIGHLIGHTS 1. Same-store sales include sales at company restaurants and non-consolidated franchised and licensed restaurants that were open during the comparable periods noted. Total operating revenue is limited to company restaurant sales and royalties, advertising revenue, fees and occupan
Slide 6: Consumer Focus Areas
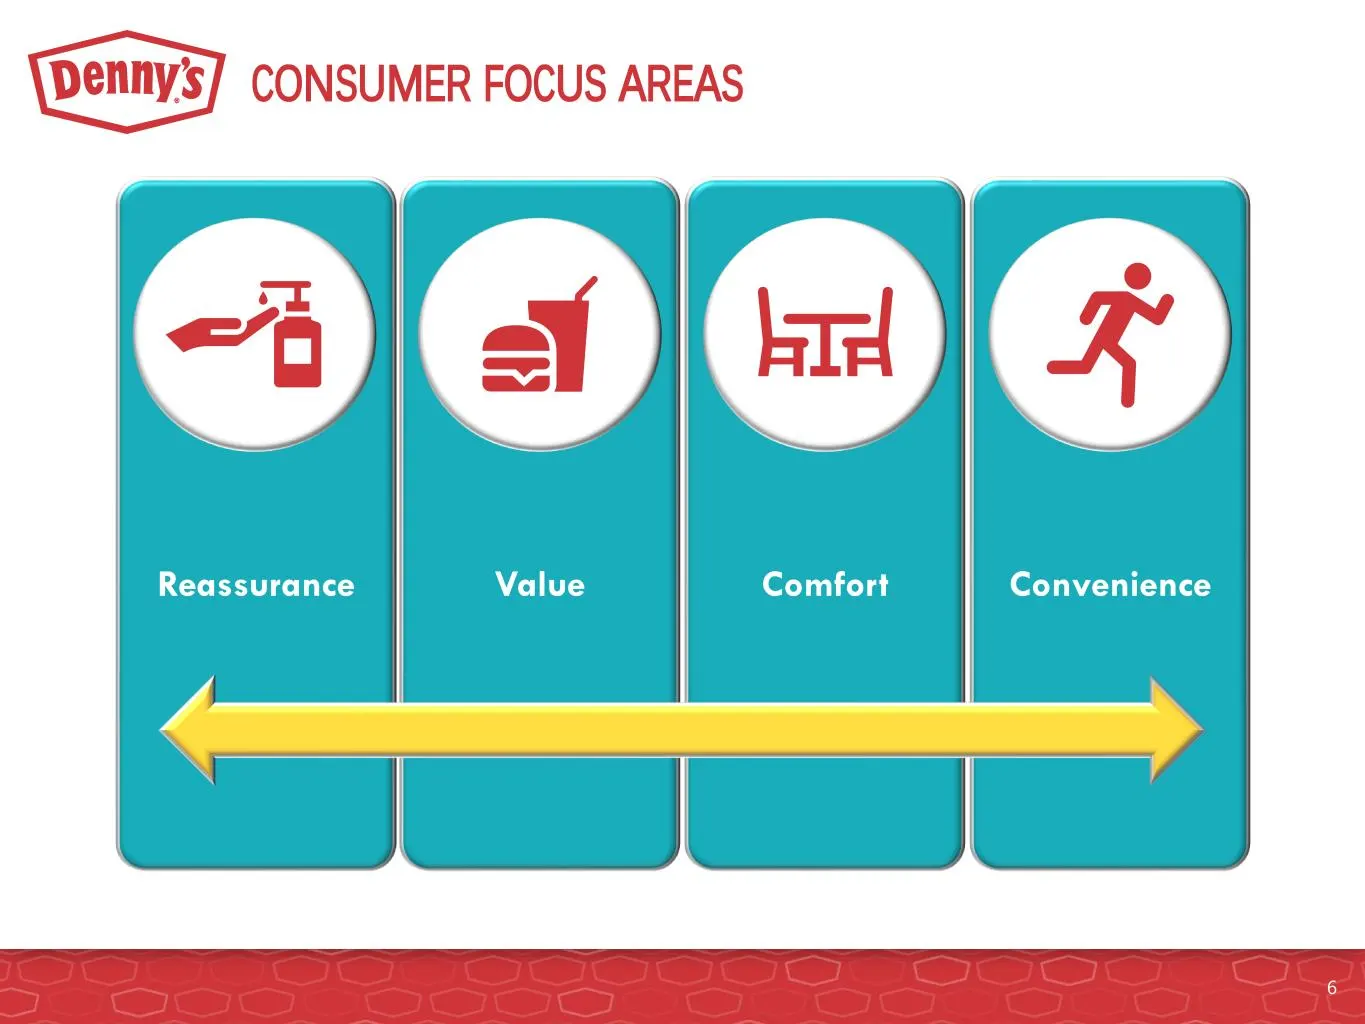
CONSUMER FOCUS AREAS ComfortReassurance Value Convenience 6
Slide 7: Reassurance
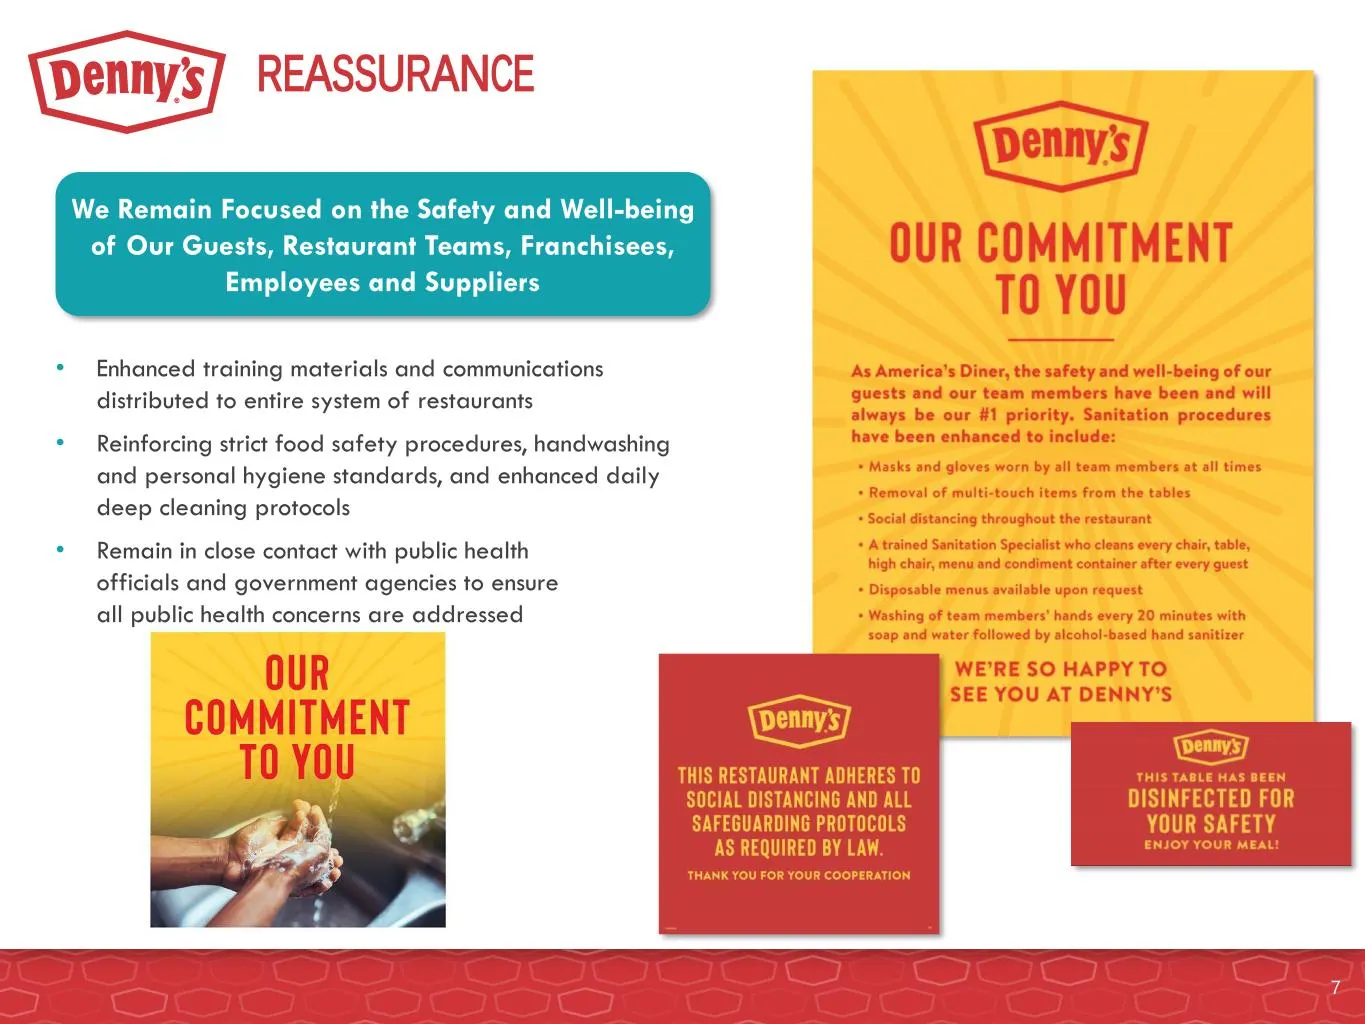
REASSURANCE • Enhanced training materials and communications distributed to entire system of restaurants • Reinforcing strict food safety procedures, handwashing and personal hygiene standards, and enhanced daily deep cleaning protocols • Remain in close contact with public health officials and gove
Slide 8: Value
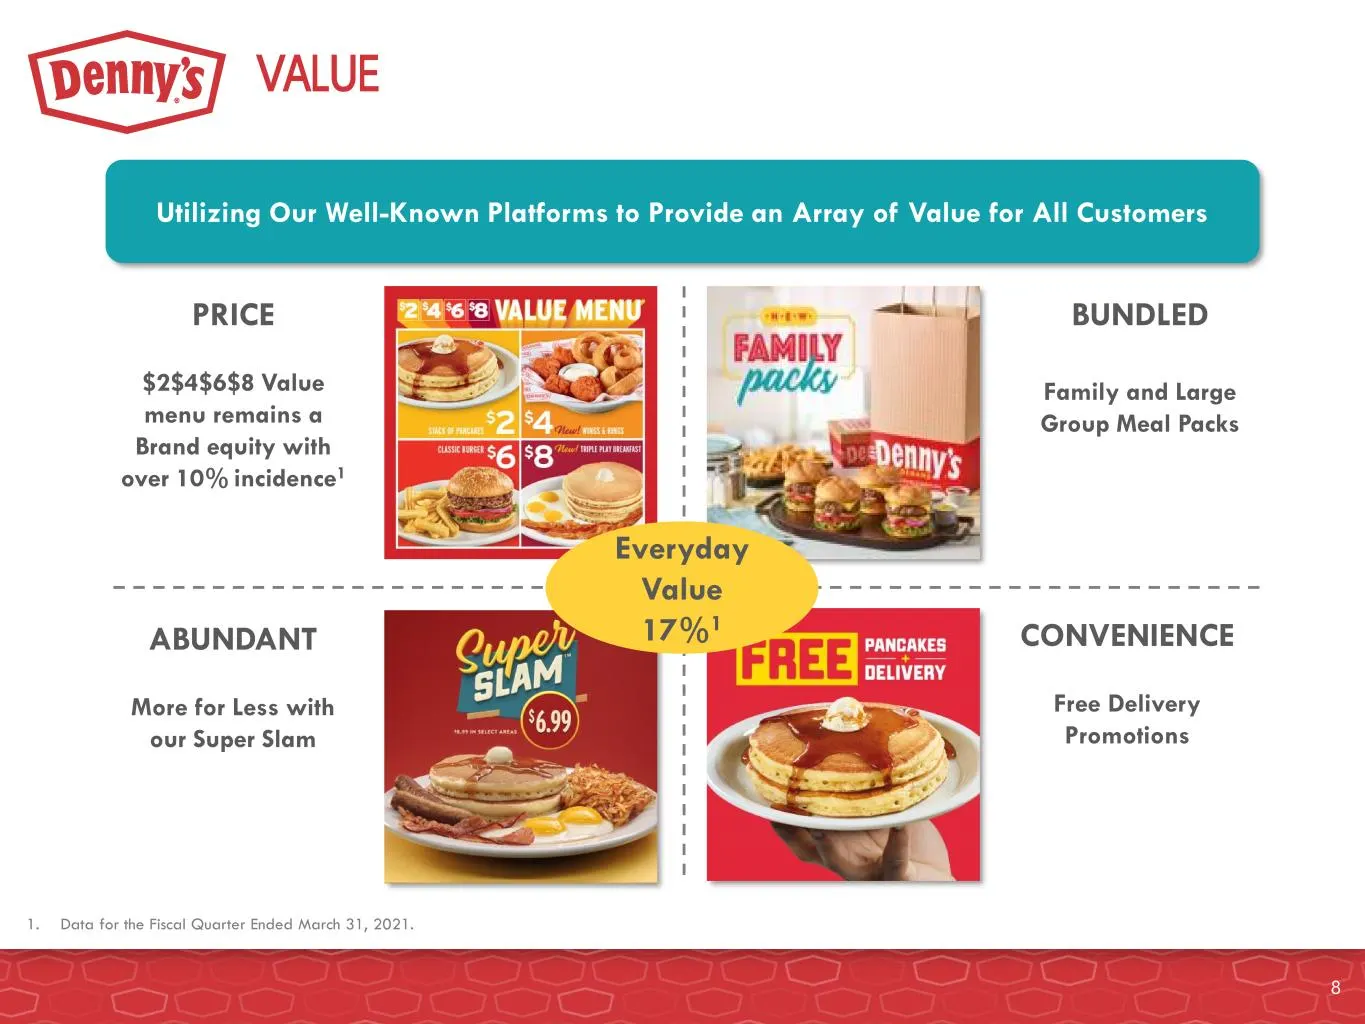
VALUE 8 PRICE $2$4$6$8 Value menu remains a Brand equity with over 10% incidence1 Utilizing Our Well-Known Platforms to Provide an Array of Value for All Customers BUNDLED Family and Large Group Meal Packs ABUNDANT More for Less with our Super Slam CONVENIENCE Free Delivery Promotions Everyday Value
Slide 9: Comfort
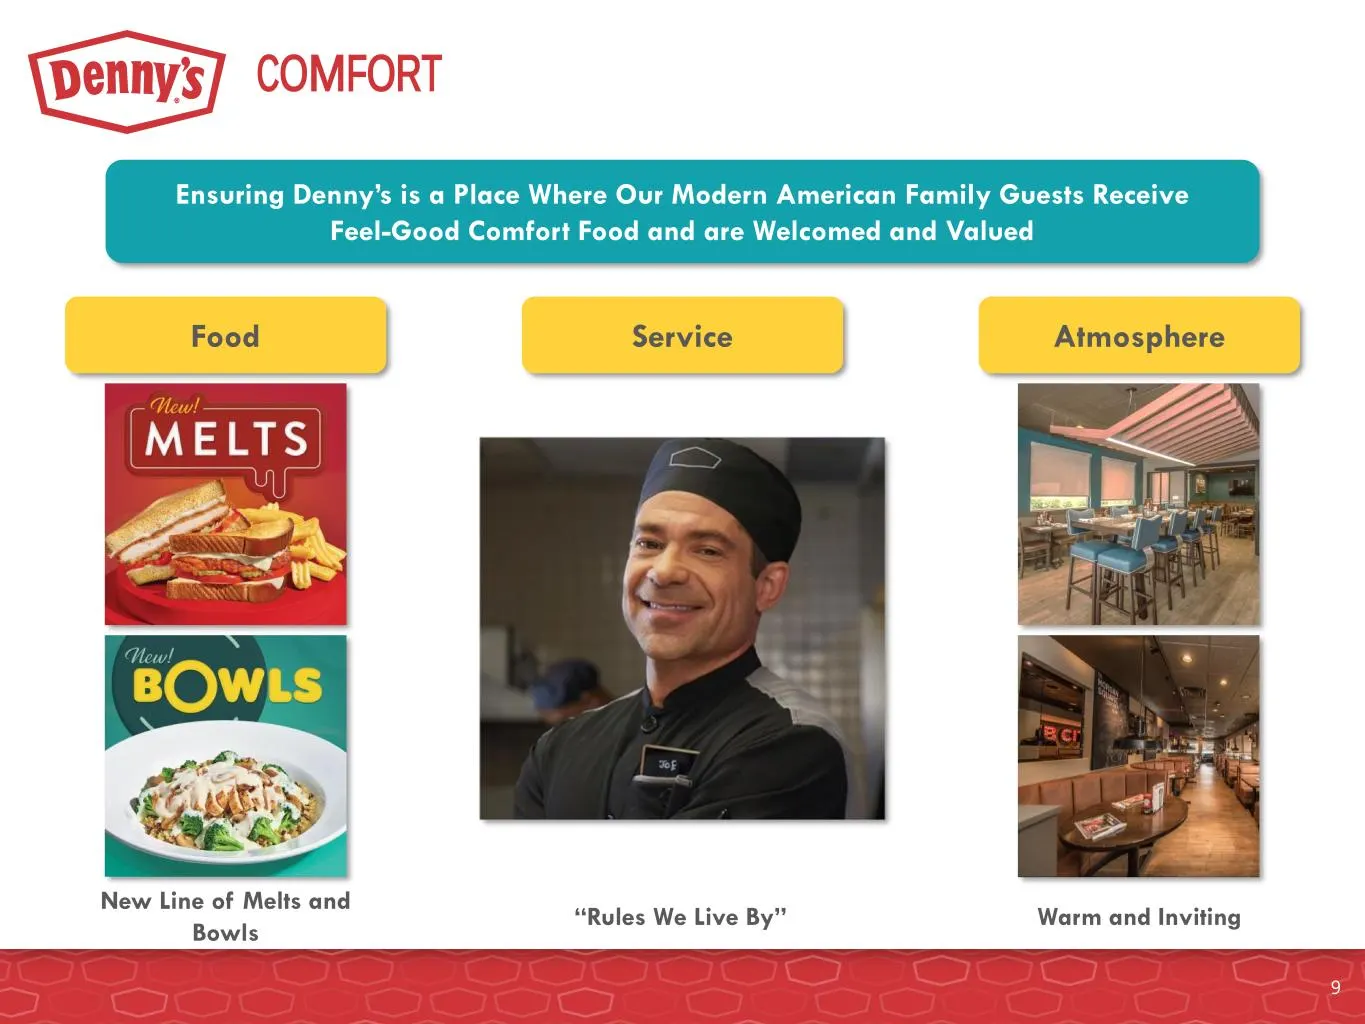
COMFORT 9 Ensuring Denny’s is a Place Where Our Modern American Family Guests Receive Feel-Good Comfort Food and are Welcomed and Valued Food Service Atmosphere New Line of Melts and Bowls “Rules We Live By” Warm and Inviting
Slide 10: Convenience
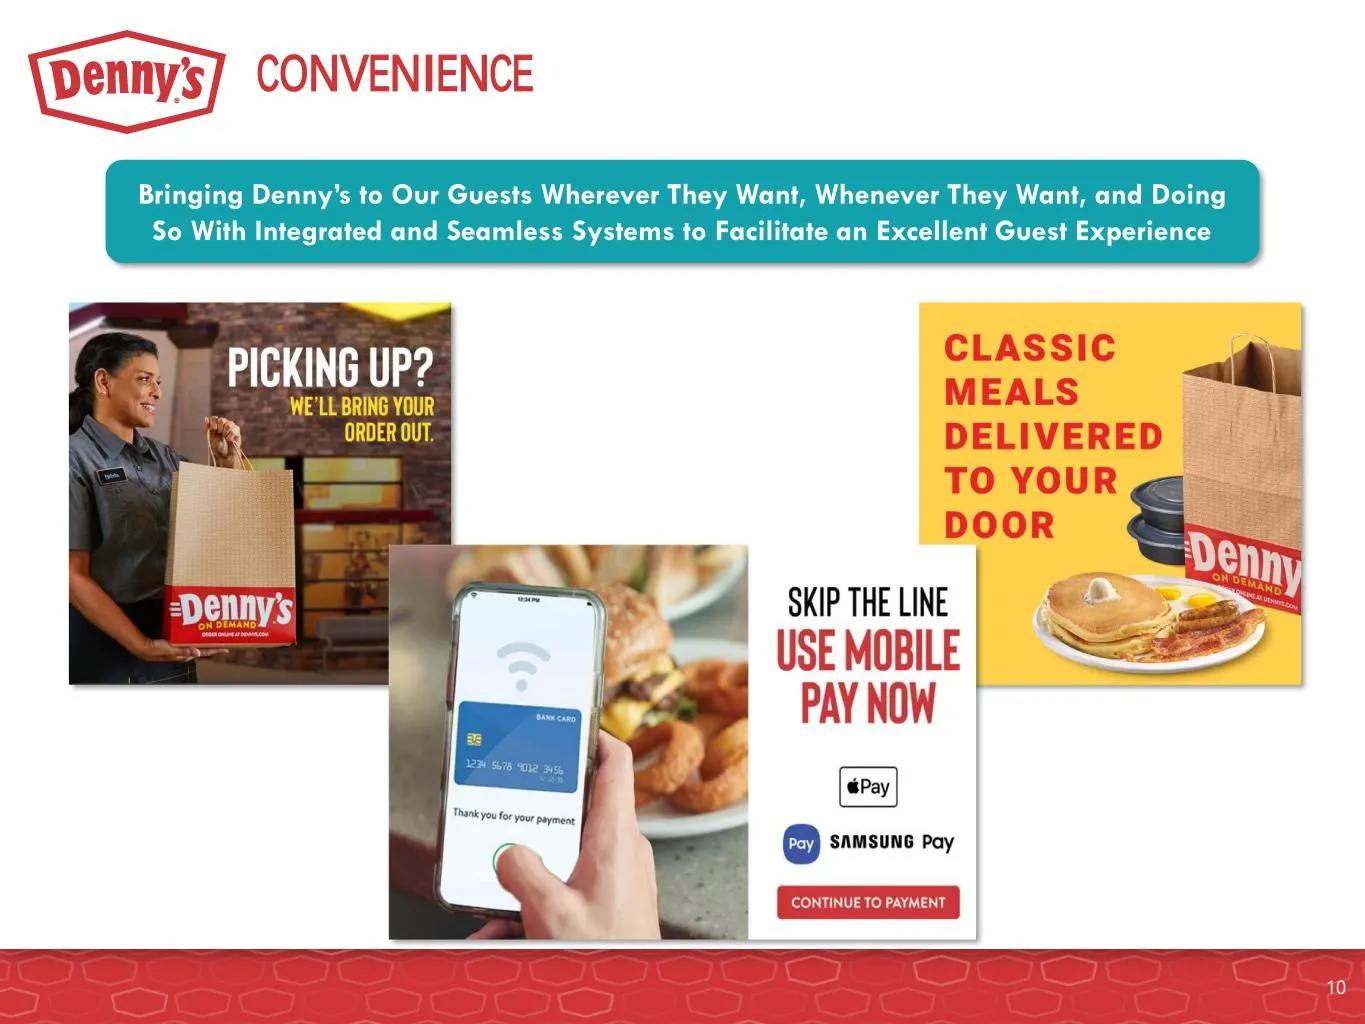
CONVENIENCE 10 Bringing Denny’s to Our Guests Wherever They Want, Whenever They Want, and Doing So With Integrated and Seamless Systems to Facilitate an Excellent Guest Experience
Slide 11: Denny's On Demand: Off-Premise Sales More Than Doubled
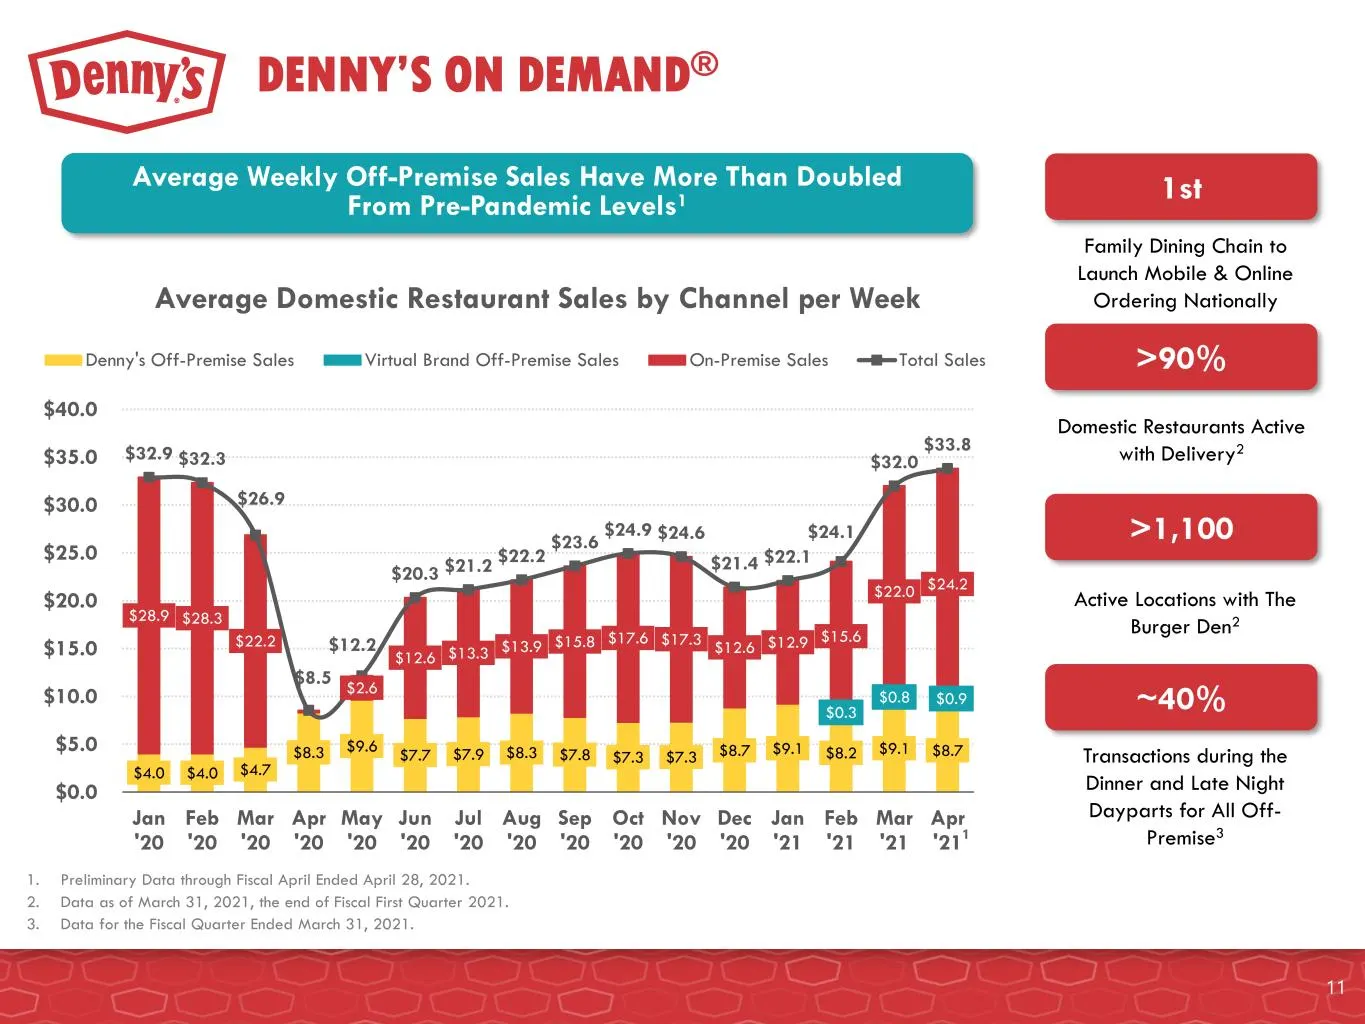
Average Weekly Off-Premise Sales Have More Than Doubled From Pre-Pandemic Levels1 DENNY’S ON DEMAND® $4.0 $4.0 $4.7 $8.3 $9.6 $7.7 $7.9 $8.3 $7.8 $7.3 $7.3 $8.7 $9.1 $8.2 $9.1 $8.7 $0.3 $0.8 $0.9 $28.9 $28.3 $22.2 $2.6 $12.6 $13.3 $13.9 $15.8 $17.6 $17.3 $12.6 $12.9 $15.6 $22.0 $24.2 $32.9 $32.3 $26
Slide 12: Sales Trends and Reopenings
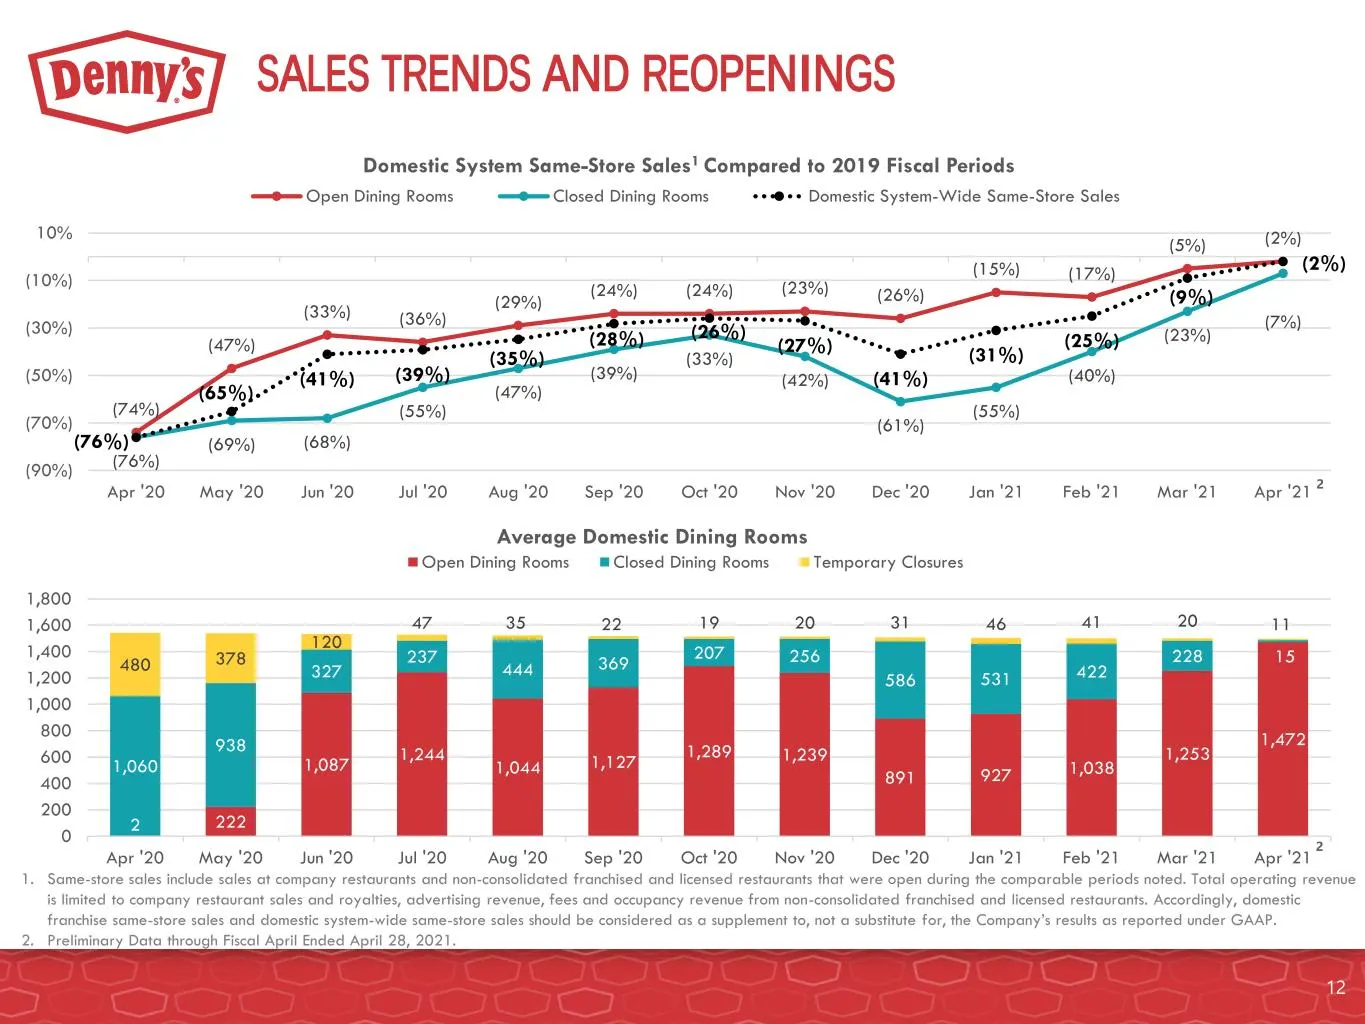
SALES TRENDS AND REOPENINGS 1. Same-store sales include sales at company restaurants and non-consolidated franchised and licensed restaurants that were open during the comparable periods noted. Total operating revenue is limited to company restaurant sales and royalties, advertising revenue, fees an
Slide 13: 24/7 Operations Sales Trends
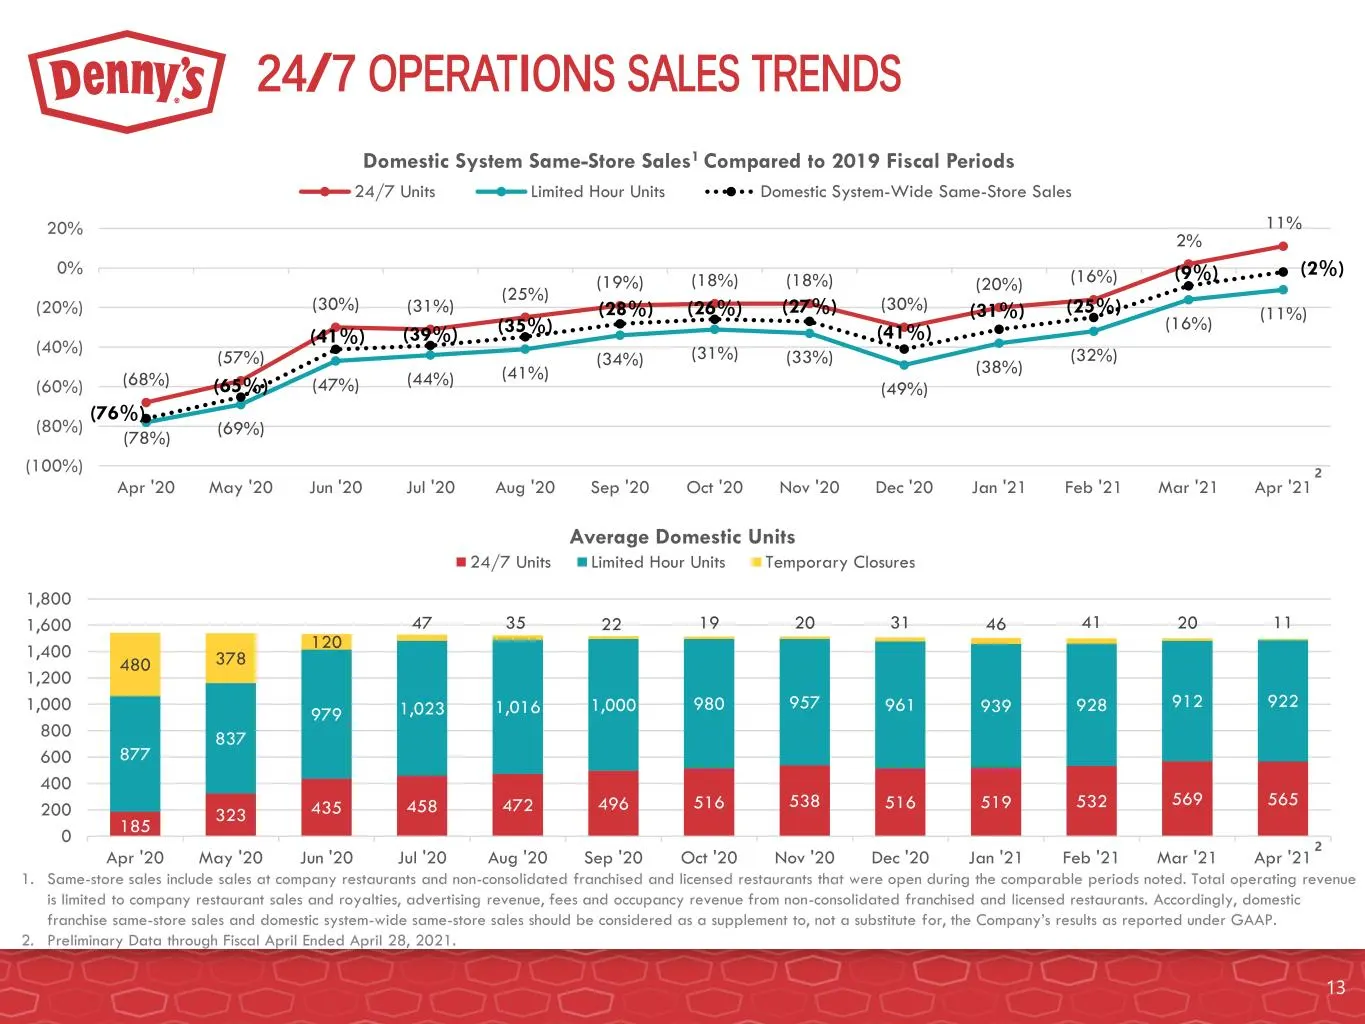
24/7 OPERATIONS SALES TRENDS 1. Same-store sales include sales at company restaurants and non-consolidated franchised and licensed restaurants that were open during the comparable periods noted. Total operating revenue is limited to company restaurant sales and royalties, advertising revenue, fees a
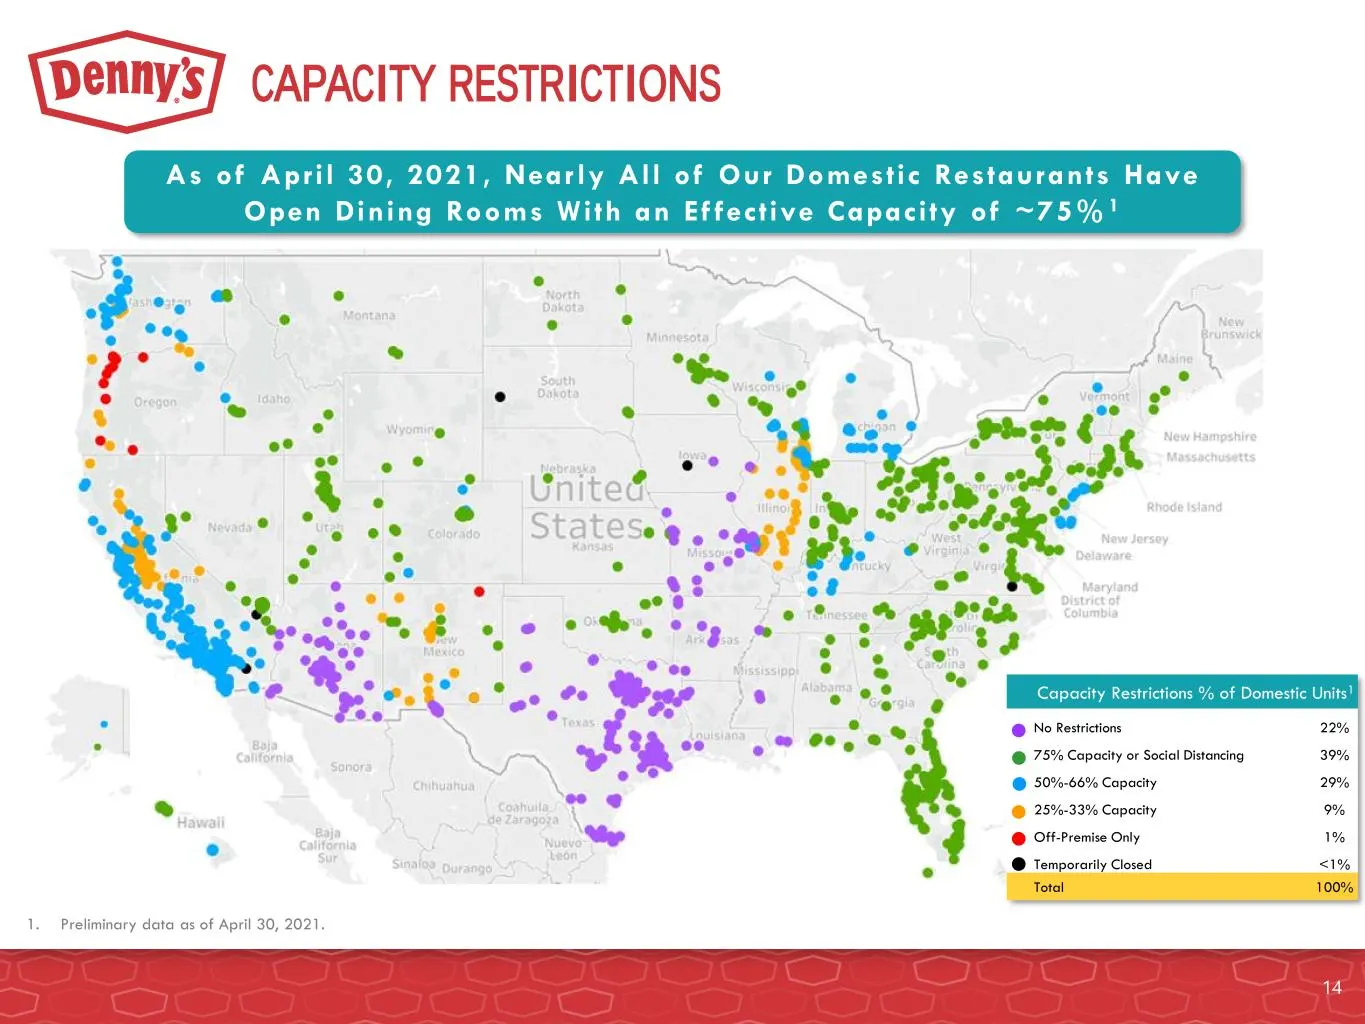
Slide 14: Capacity Restrictions
Capacity Restrictions % of Domestic Units1 No Restrictions 22% 75% Capacity or Social Distancing 39% 50%-66% Capacity 29% 25%-33% Capacity 9% Off-Premise Only 1% Temporarily Closed <1% Total 100% CAPACITY RESTRICTIONS 14 As of Apri l 30, 2021, Near ly All of Our Domestic Restaurants Have Open Dining
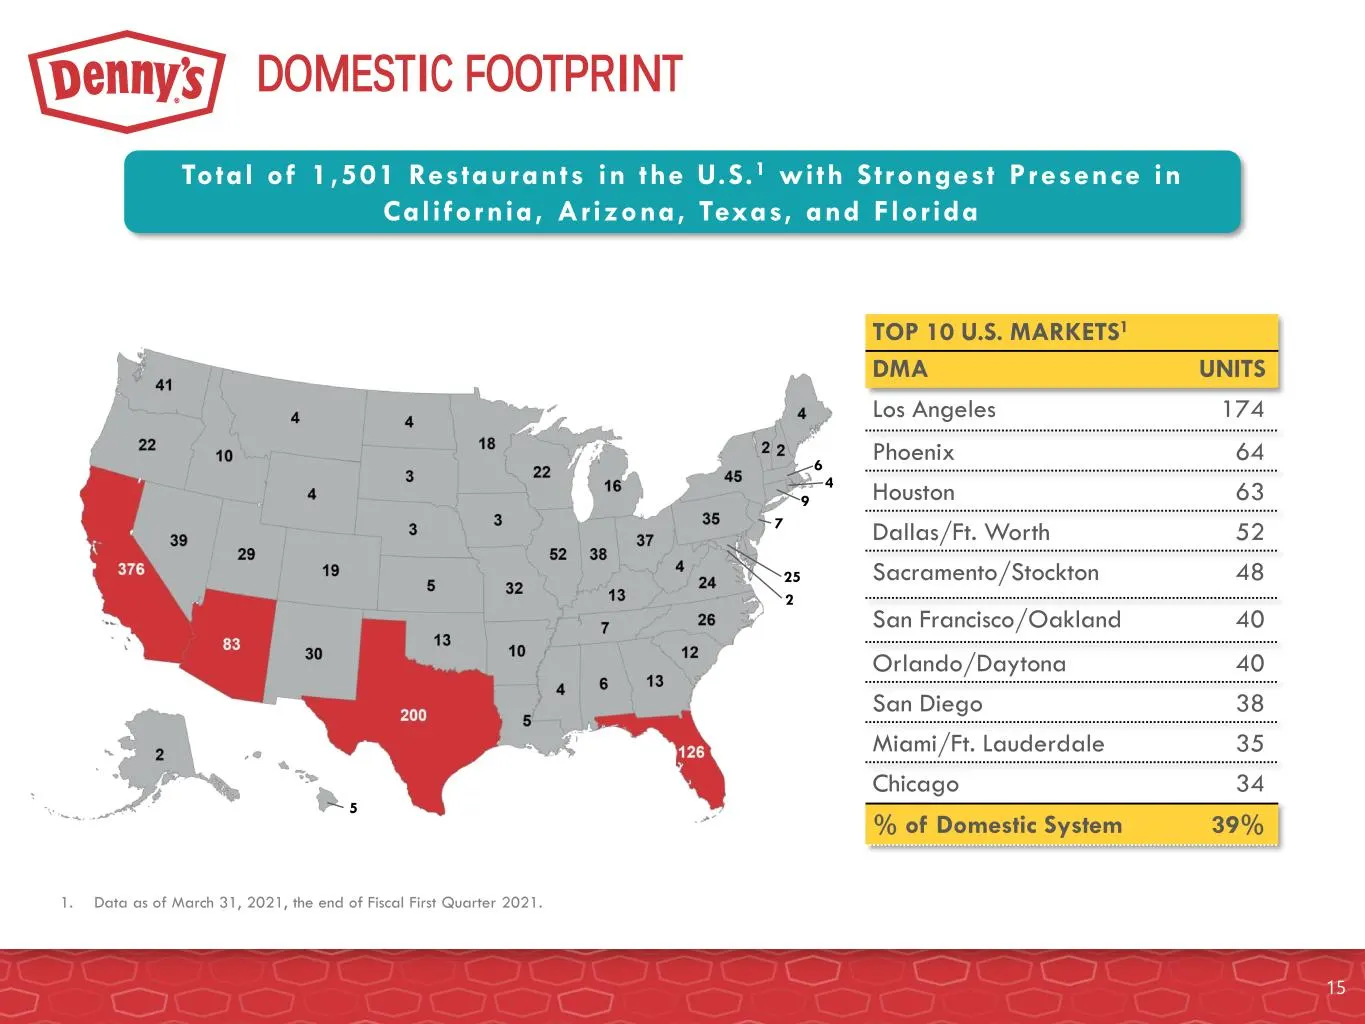
Slide 15: Domestic Footprint
DOMESTIC FOOTPRINT Total of 1,501 Restaurants in the U.S.1 with Strongest Presence in California, Arizona, Texas, and Florida TOP 10 U.S. MARKETS1 DMA UNITS Los Angeles 174 Phoenix 64 Houston 63 Dallas/Ft. Worth 52 Sacramento/Stockton 48 San Francisco/Oakland 40 Orlando/Daytona 40 San Diego 38 Miami
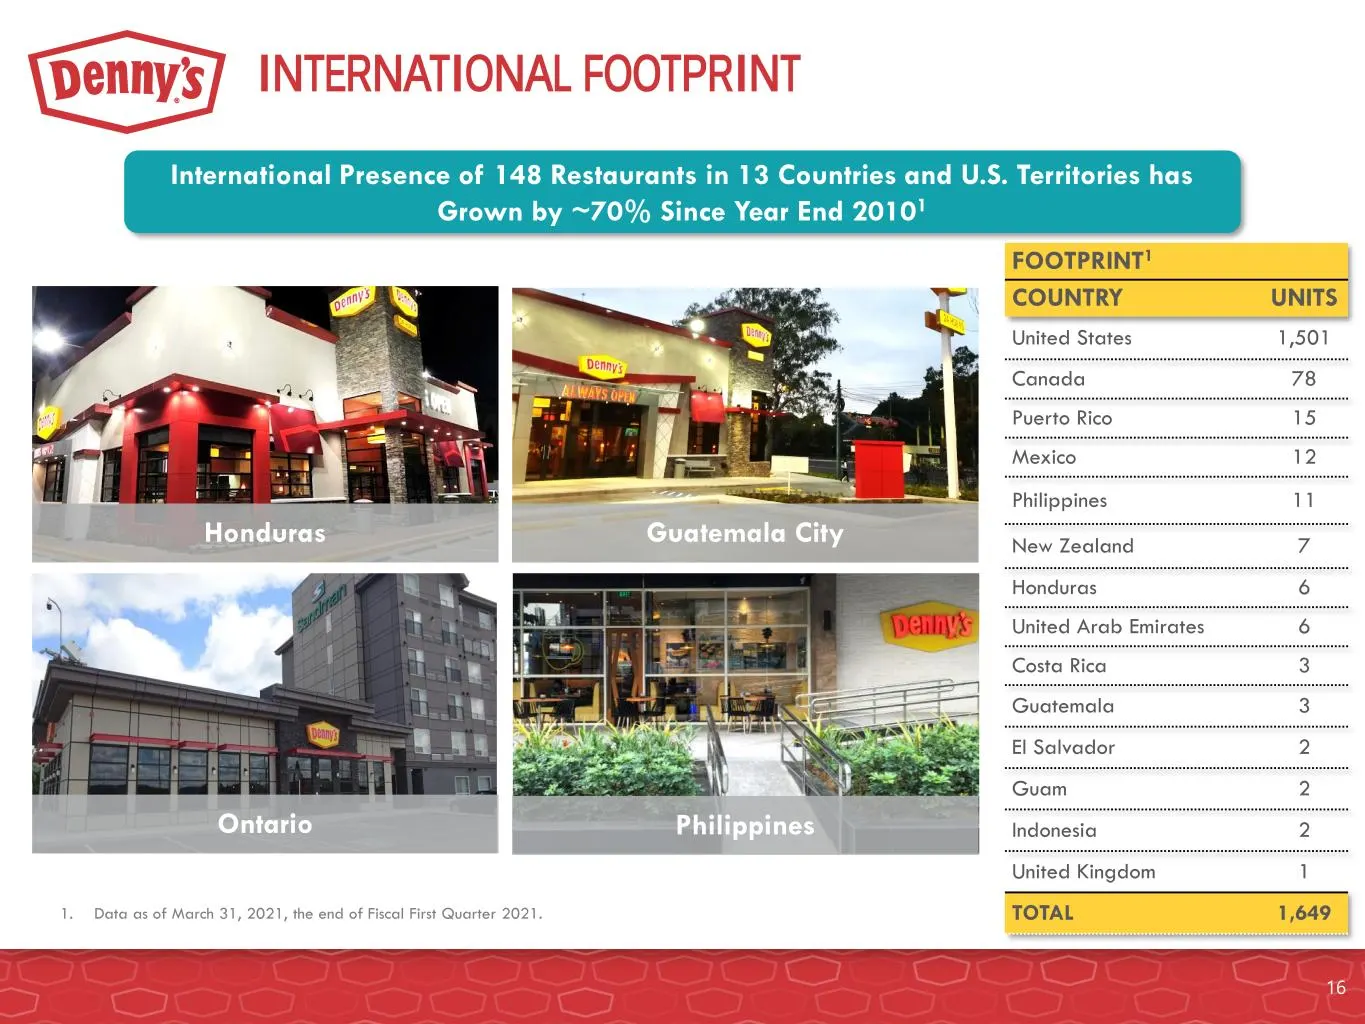
Slide 16: International Footprint
INTERNATIONAL FOOTPRINT Honduras Guatemala City PhilippinesOntario 1. Data as of March 31, 2021, the end of Fiscal First Quarter 2021. 16 International Presence of 148 Restaurants in 13 Countries and U.S. Territories has Grown by ~70% Since Year End 20101 FOOTPRINT1 COUNTRY UNITS United States 1,501
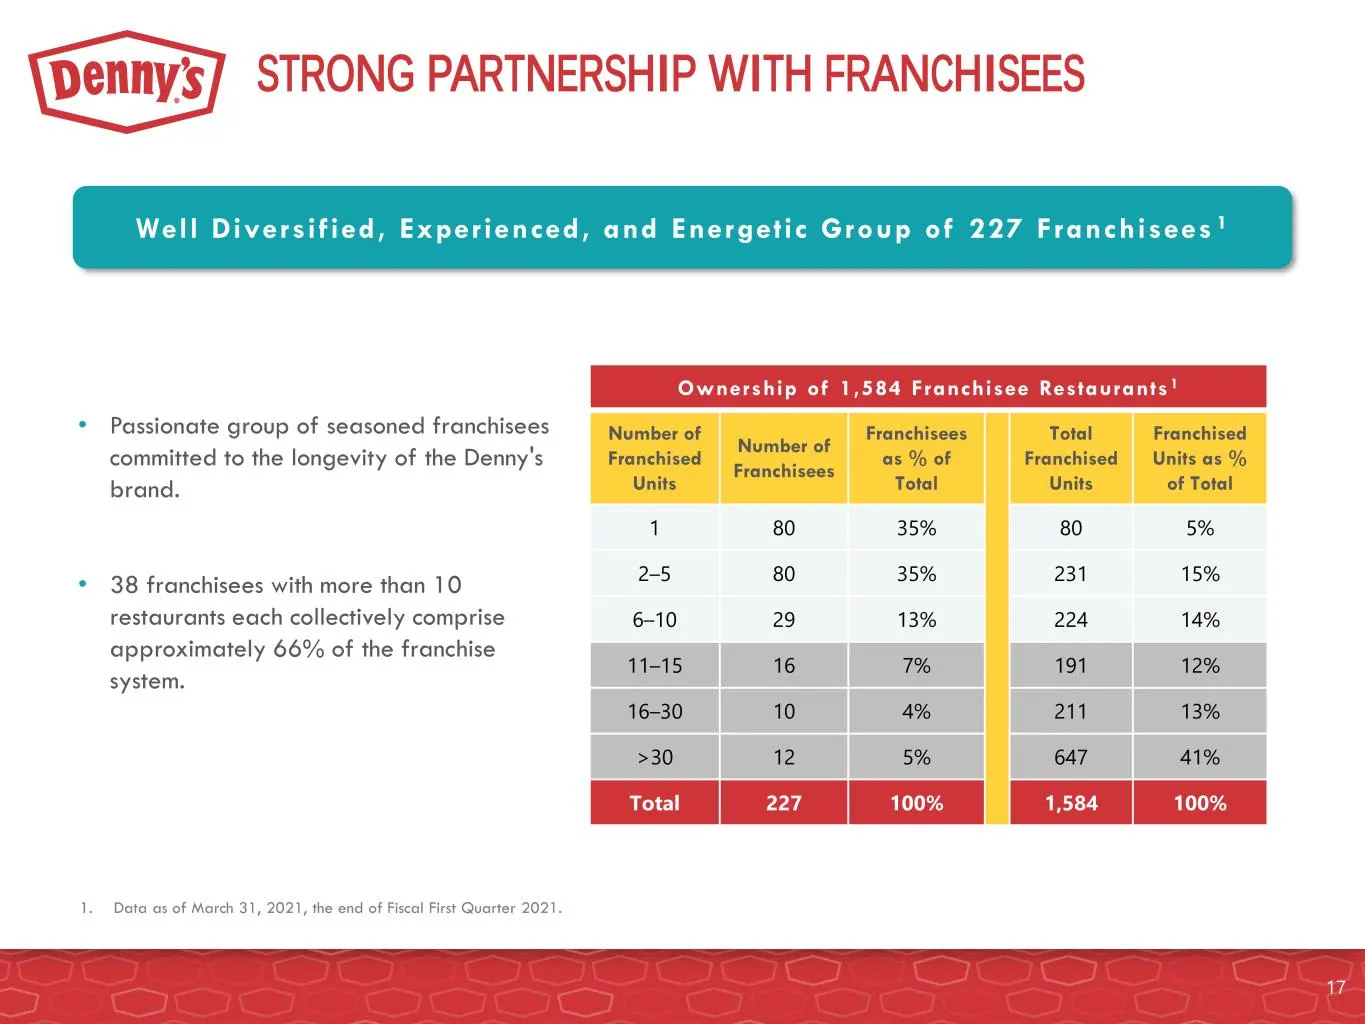
Slide 17: Strong Partnership with Franchisees
STRONG PARTNERSHIP WITH FRANCHISEES Well Diversif ied, Experienced, and Energetic Group of 227 Franchisees 1 Ownership of 1,584 Franchisee Restaurants 1 Number of Franchised Units Number of Franchisees Franchisees as % of Total Total Franchised Units Franchised Units as % of Total 1 80 35% 80 5% 2–5
Slide 18: COVID-19 Business Response
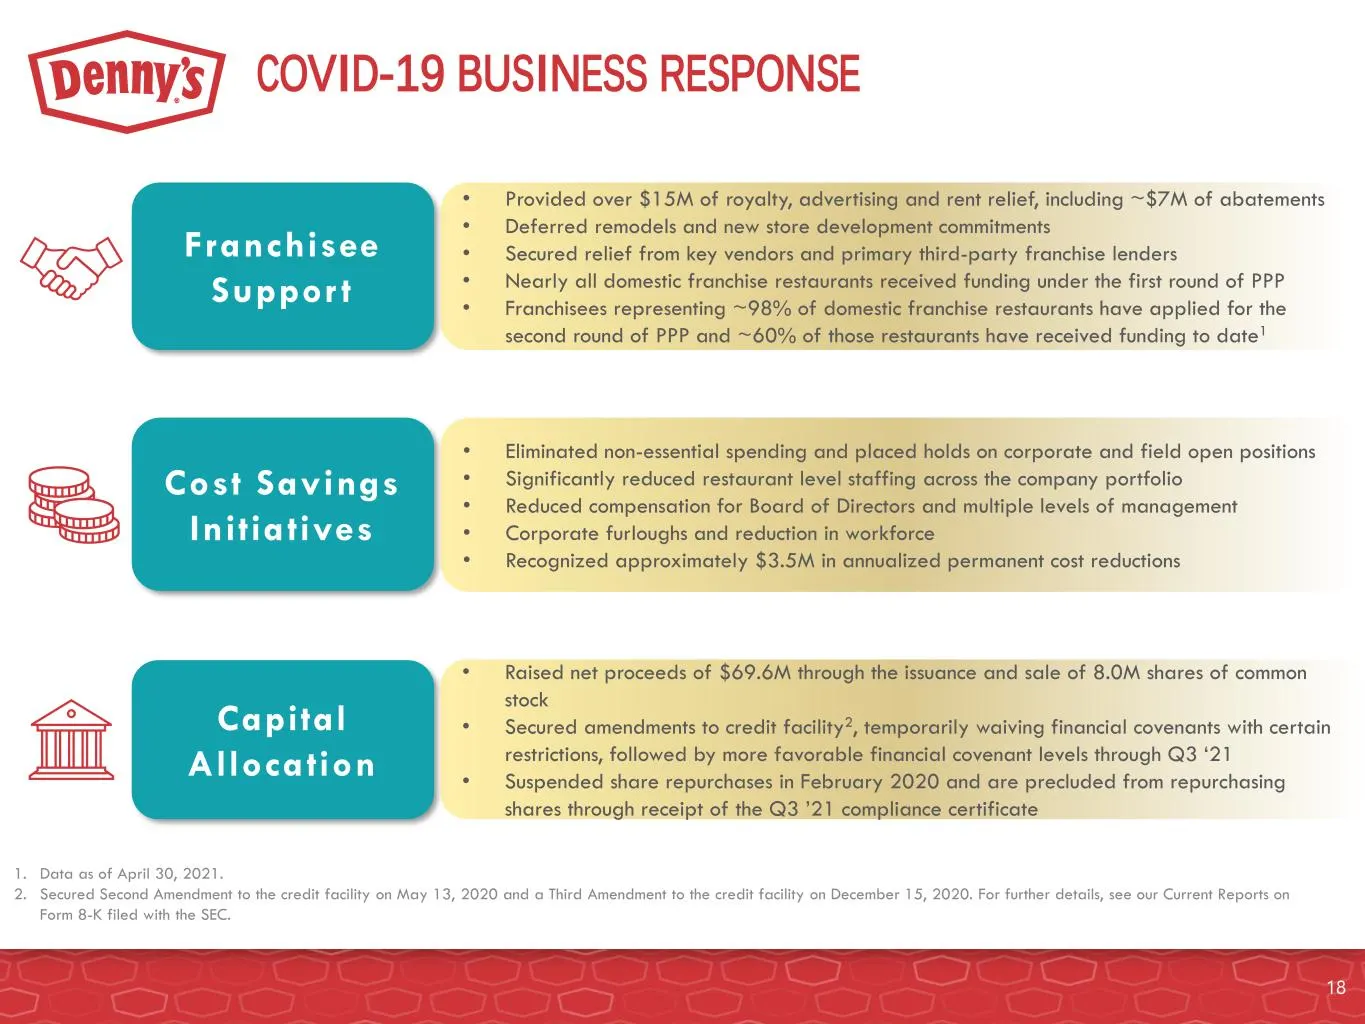
COVID-19 BUSINESS RESPONSE • Provided over $15M of royalty, advertising and rent relief, including ~$7M of abatements • Deferred remodels and new store development commitments • Secured relief from key vendors and primary third-party franchise lenders • Nearly all domestic franchise restaurants rece

Slide 19: A Resilient and Durable Brand Focused on the Future
A RESILIENT AND DURABLE BRAND FOCUSED ON THE FUTURE 19
Slide 20: Execution of Brand Revitalization Strategy Driving Results
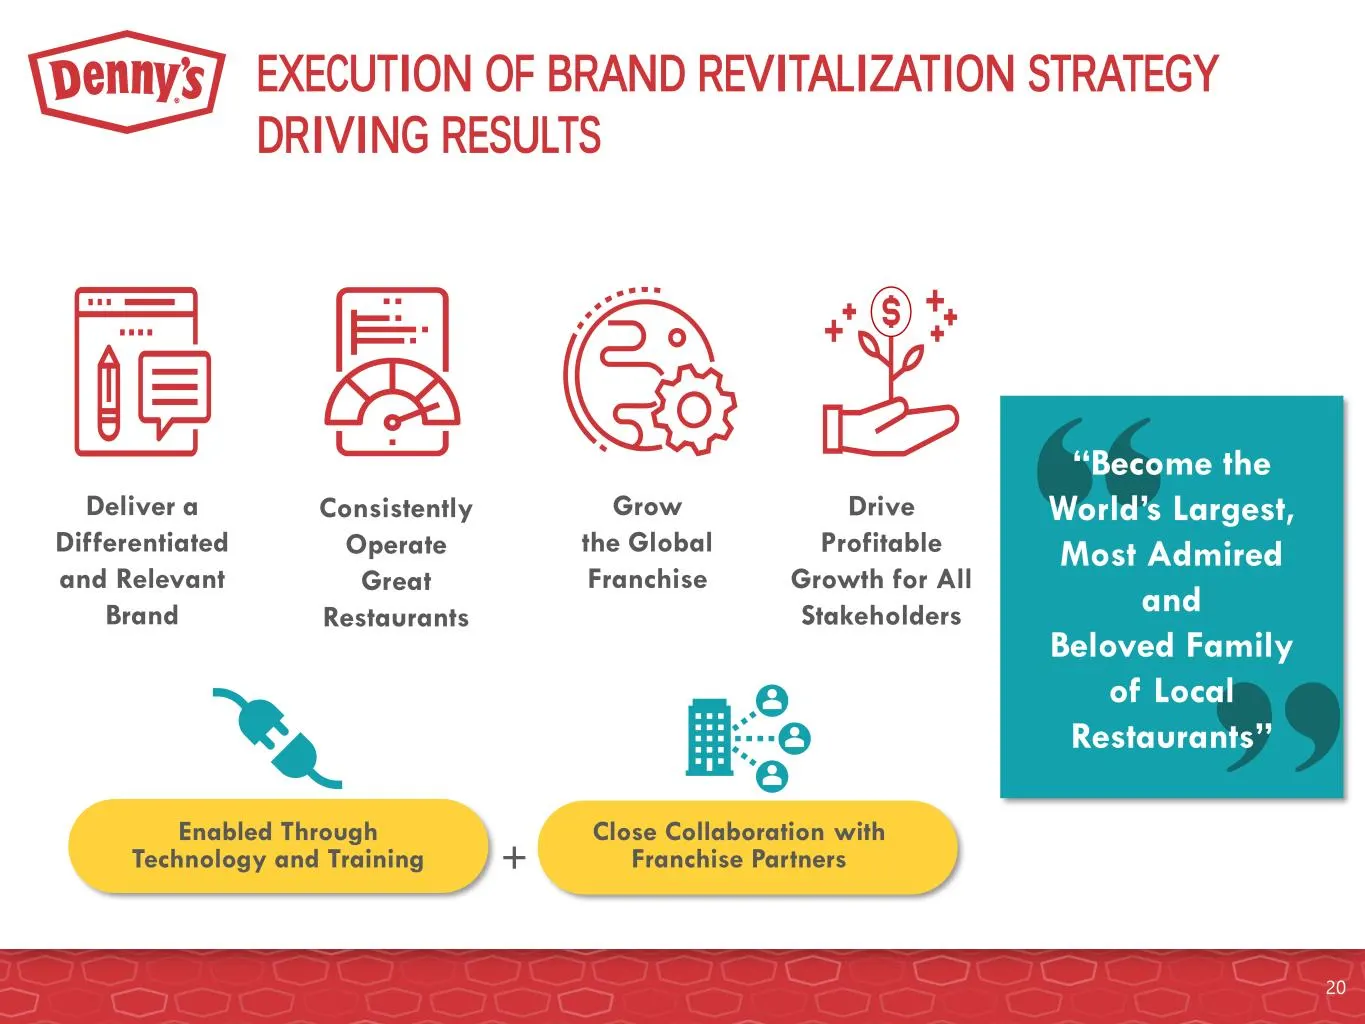
EXECUTION OF BRAND REVITALIZATION STRATEGY DRIVING RESULTS Deliver a Differentiated and Relevant Brand Consistently Operate Great Restaurants Grow the Global Franchise Drive Profitable Growth for All Stakeholders Enabled Through Technology and Training Close Collaboration with Franchise Partners+ “B
Slide 21: Delivering a Differentiated Brand and Operating Great Restaurants
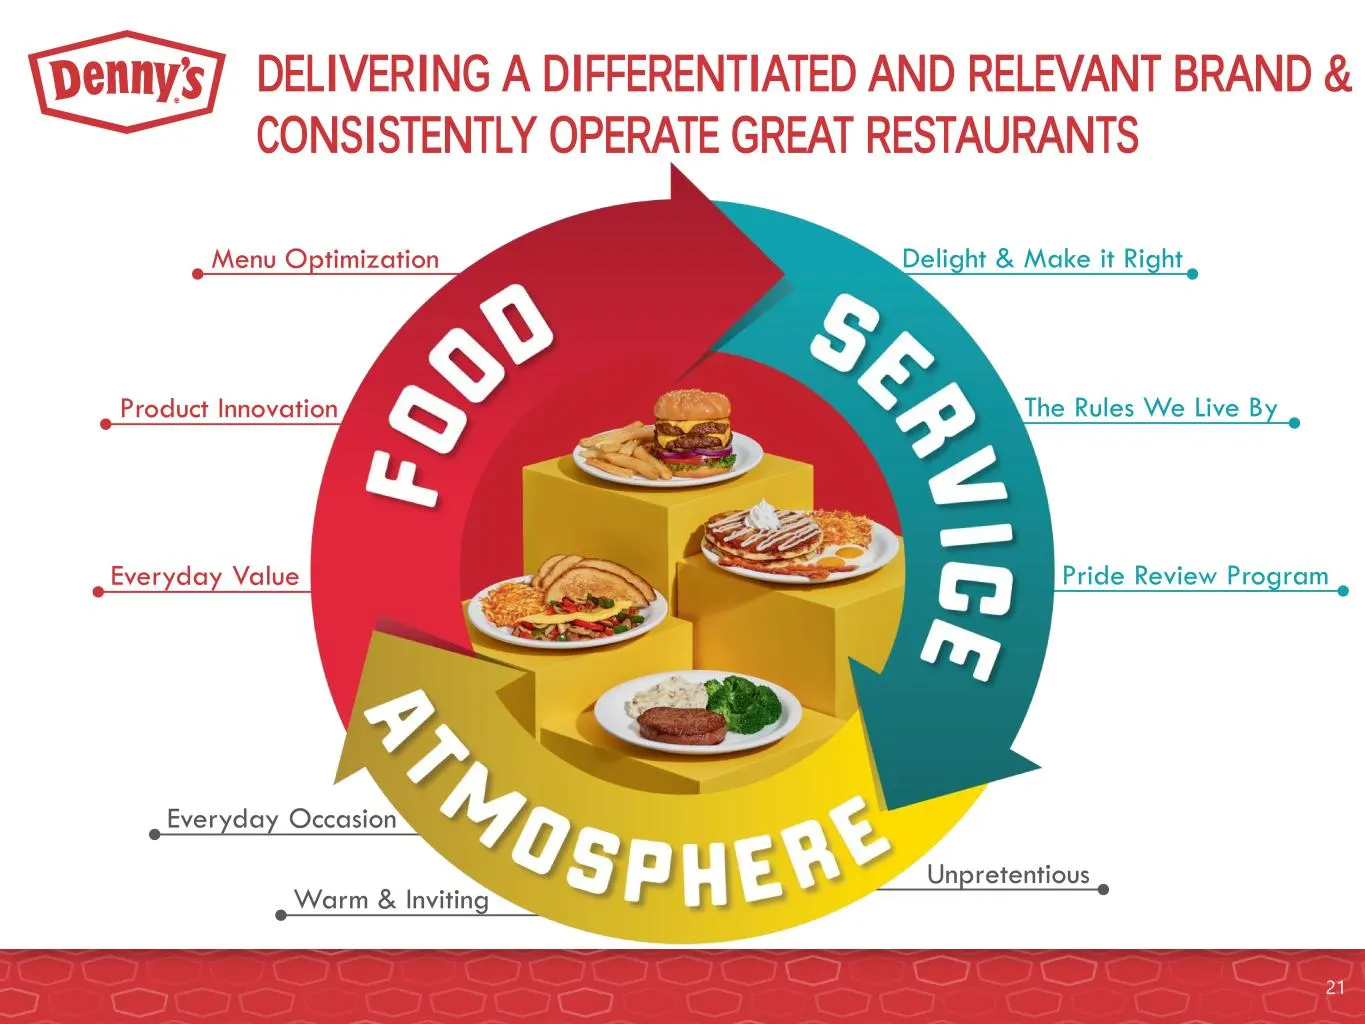
Warm & Inviting Everyday Occasion Pride Review Program Delight & Make it Right The Rules We Live By Everyday Value DELIVERING A DIFFERENTIATED AND RELEVANT BRAND & CONSISTENTLY OPERATE GREAT RESTAURANTS 21 Menu Optimization Product Innovation Unpretentious
Slide 22: Focus on a Menu with Quality Items at Optimal Prices
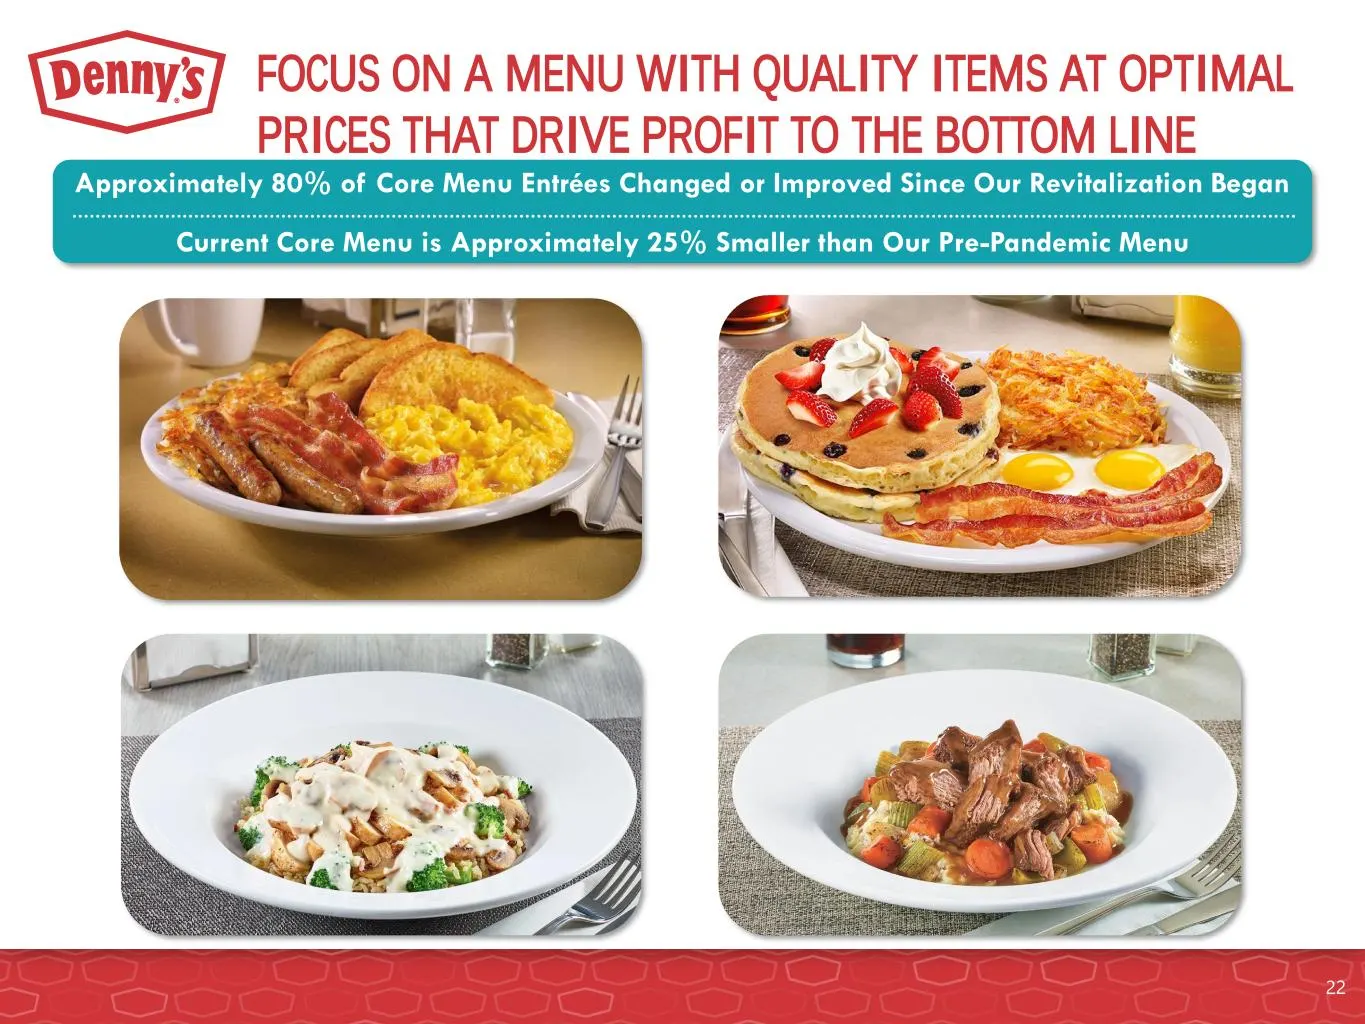
FOCUS ON A MENU WITH QUALITY ITEMS AT OPTIMAL PRICES THAT DRIVE PROFIT TO THE BOTTOM LINE Approximately 80% of Core Menu Entrées Changed or Improved Since Our Revitalization Began Current Core Menu is Approximately 25% Smaller than Our Pre-Pandemic Menu 22
Slide 23: Consistently Operating Great Restaurants
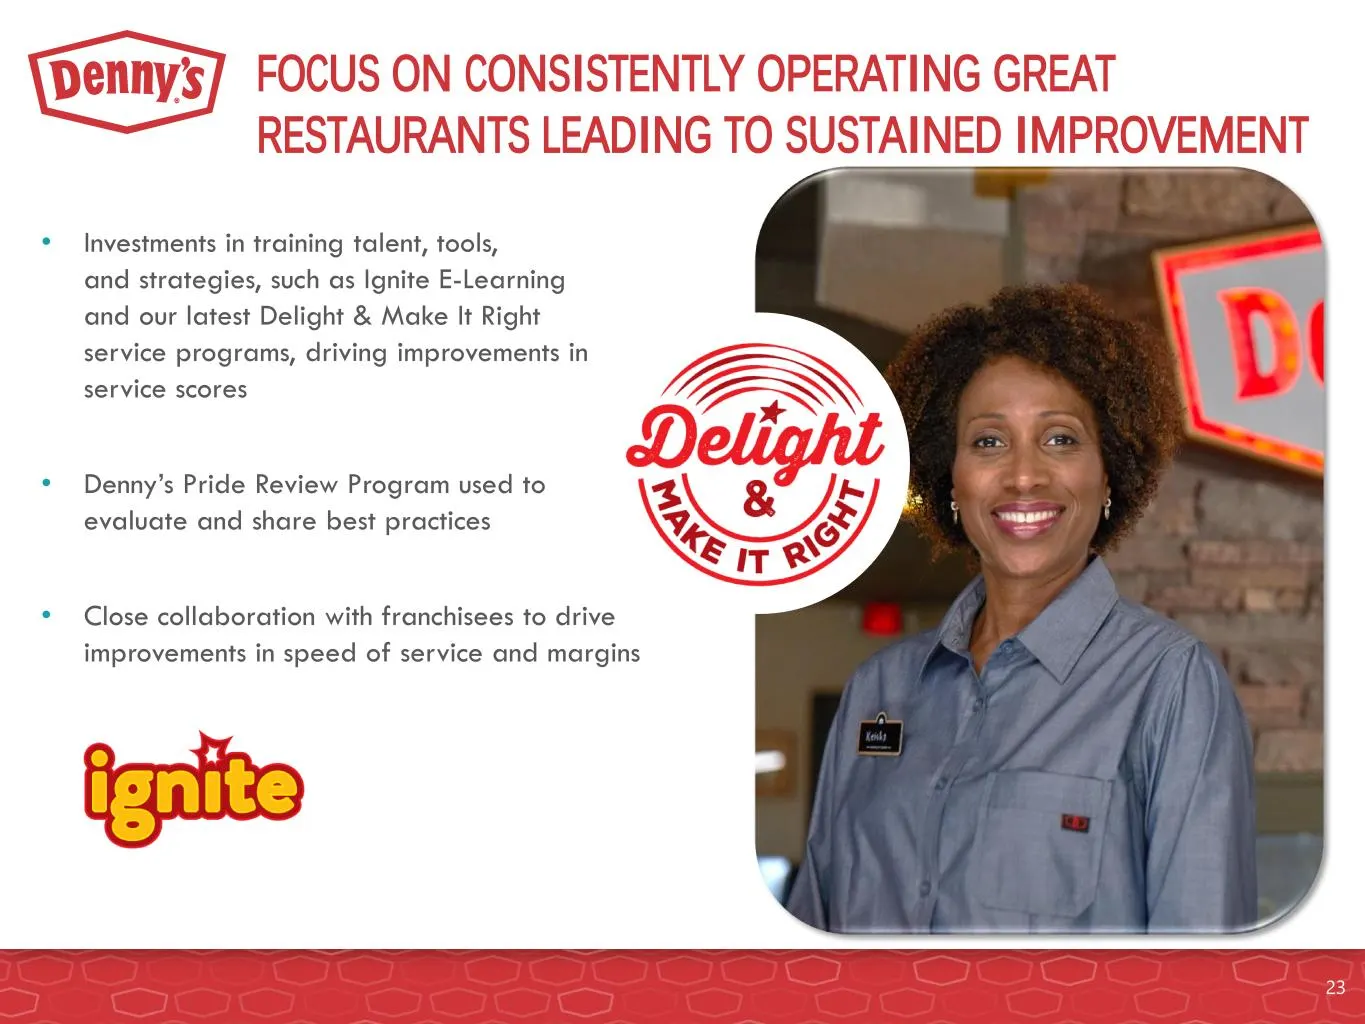
FOCUS ON CONSISTENTLY OPERATING GREAT RESTAURANTS LEADING TO SUSTAINED IMPROVEMENT • Investments in training talent, tools, and strategies, such as Ignite E-Learning and our latest Delight & Make It Right service programs, driving improvements in service scores • Denny’s Pride Review Program used to
Slide 24: Remodels Key to Revitalizing Legacy Brand
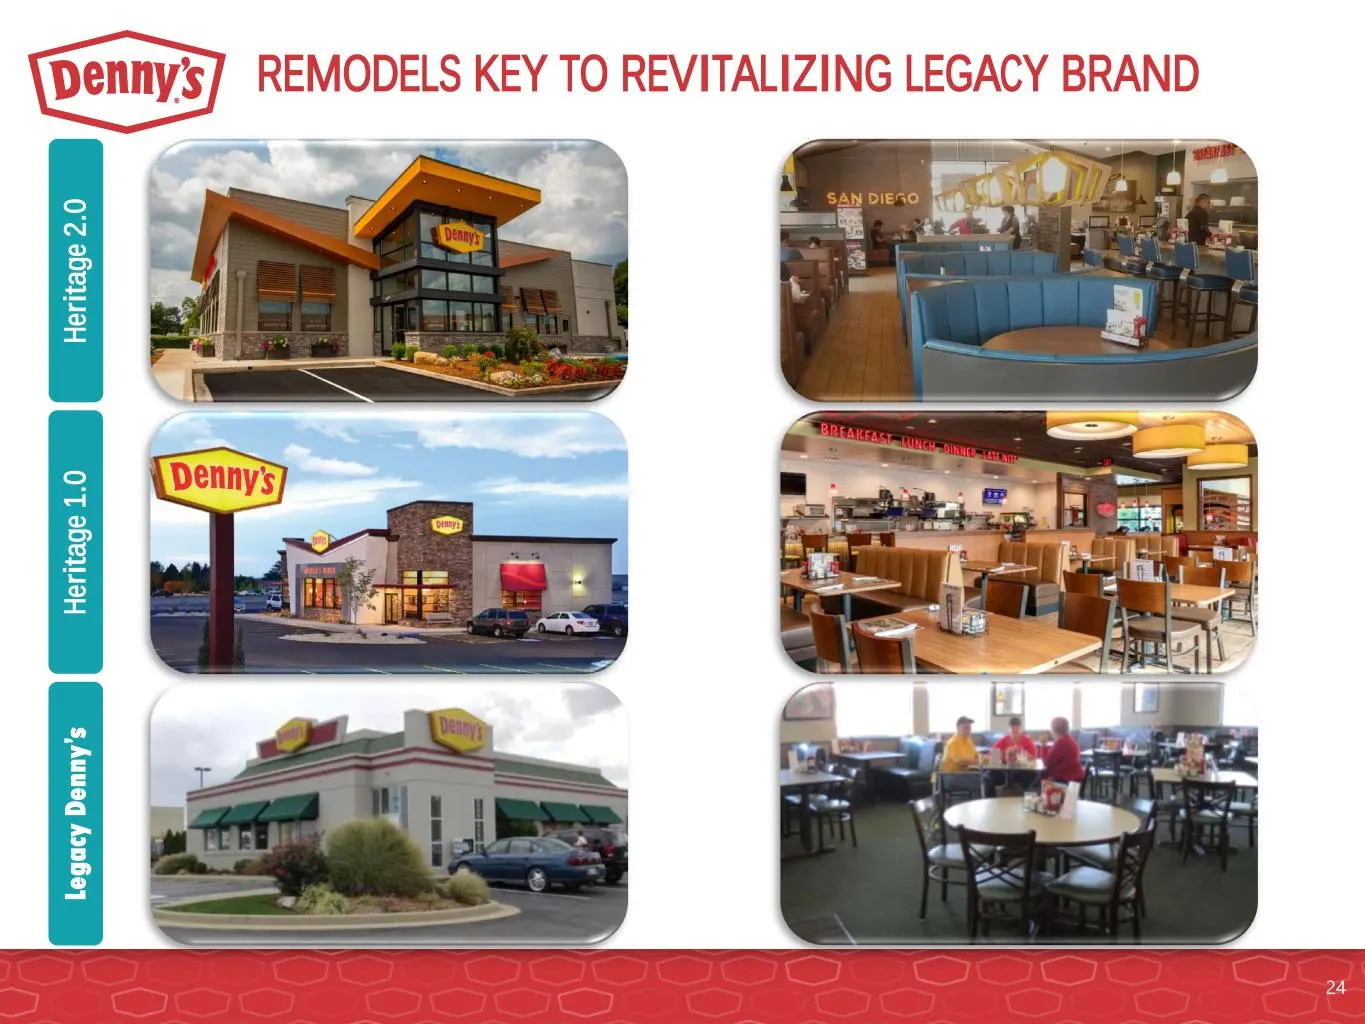
REMODELS KEY TO REVITALIZING LEGACY BRAND Le g a cy D e n n y ’s H e ri ta g e 1 .0 H e ri ta g e 2 .0 24
Slide 25: Well-Established Pipeline with Opportunities
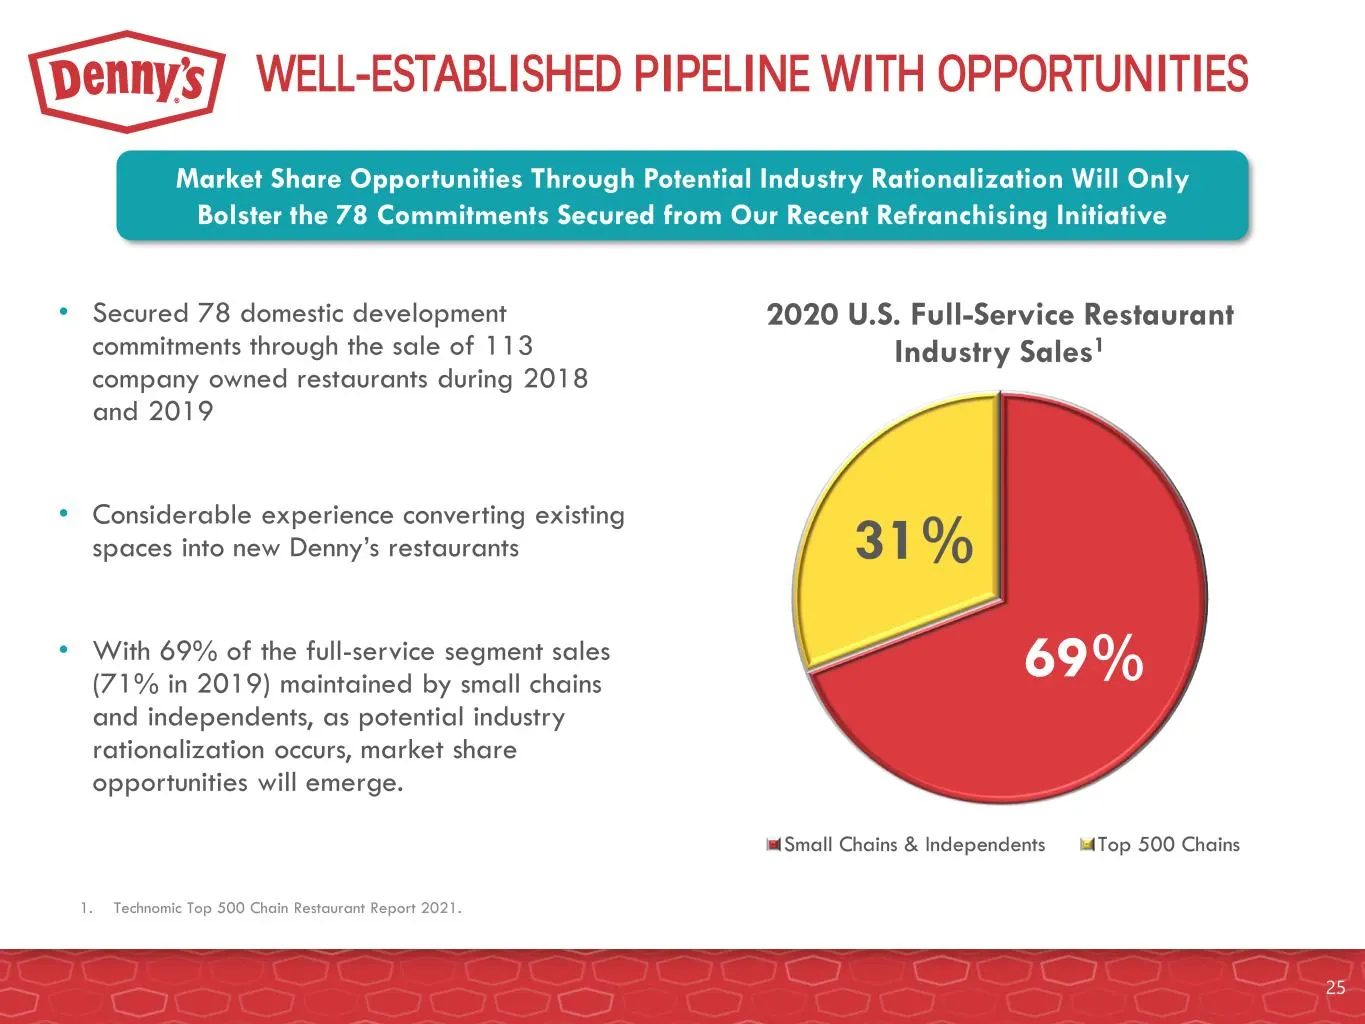
• Secured 78 domestic development commitments through the sale of 113 company owned restaurants during 2018 and 2019 • Considerable experience converting existing spaces into new Denny’s restaurants • With 69% of the full-service segment sales (71% in 2019) maintained by small chains and independent
Slide 26: Virtual Brands Provide Additional Market Share Opportunities
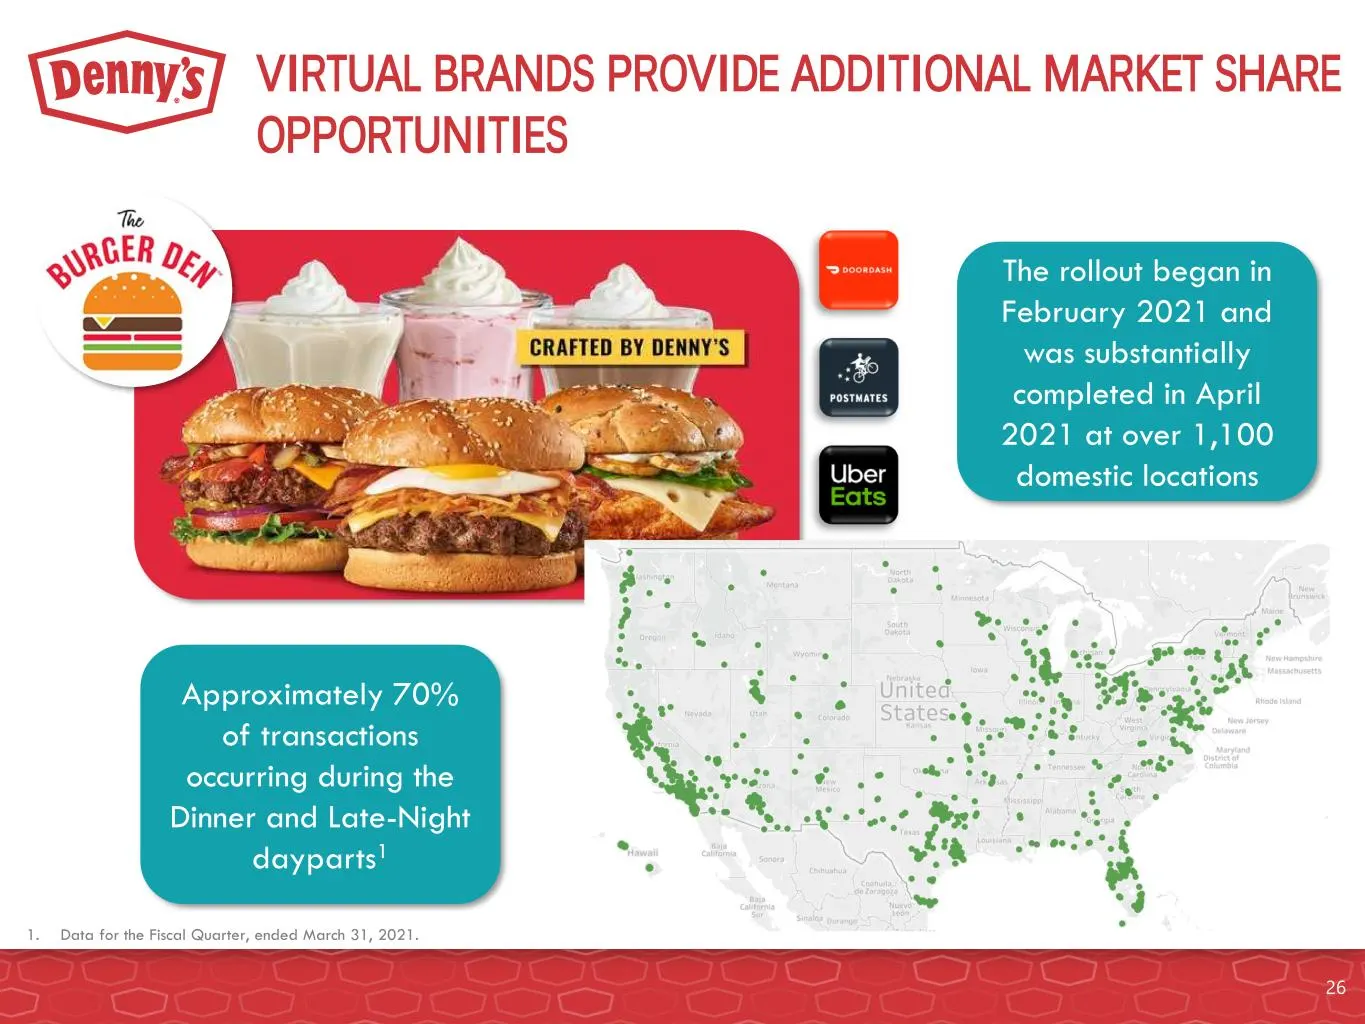
VIRTUAL BRANDS PROVIDE ADDITIONAL MARKET SHARE OPPORTUNITIES 26 The rollout began in February 2021 and was substantially completed in April 2021 at over 1,100 domestic locations Approximately 70% of transactions occurring during the Dinner and Late-Night dayparts1 1. Data for the Fiscal Quarter, end
Slide 27: Virtual Brands Provide Additional Market Share Opportunities
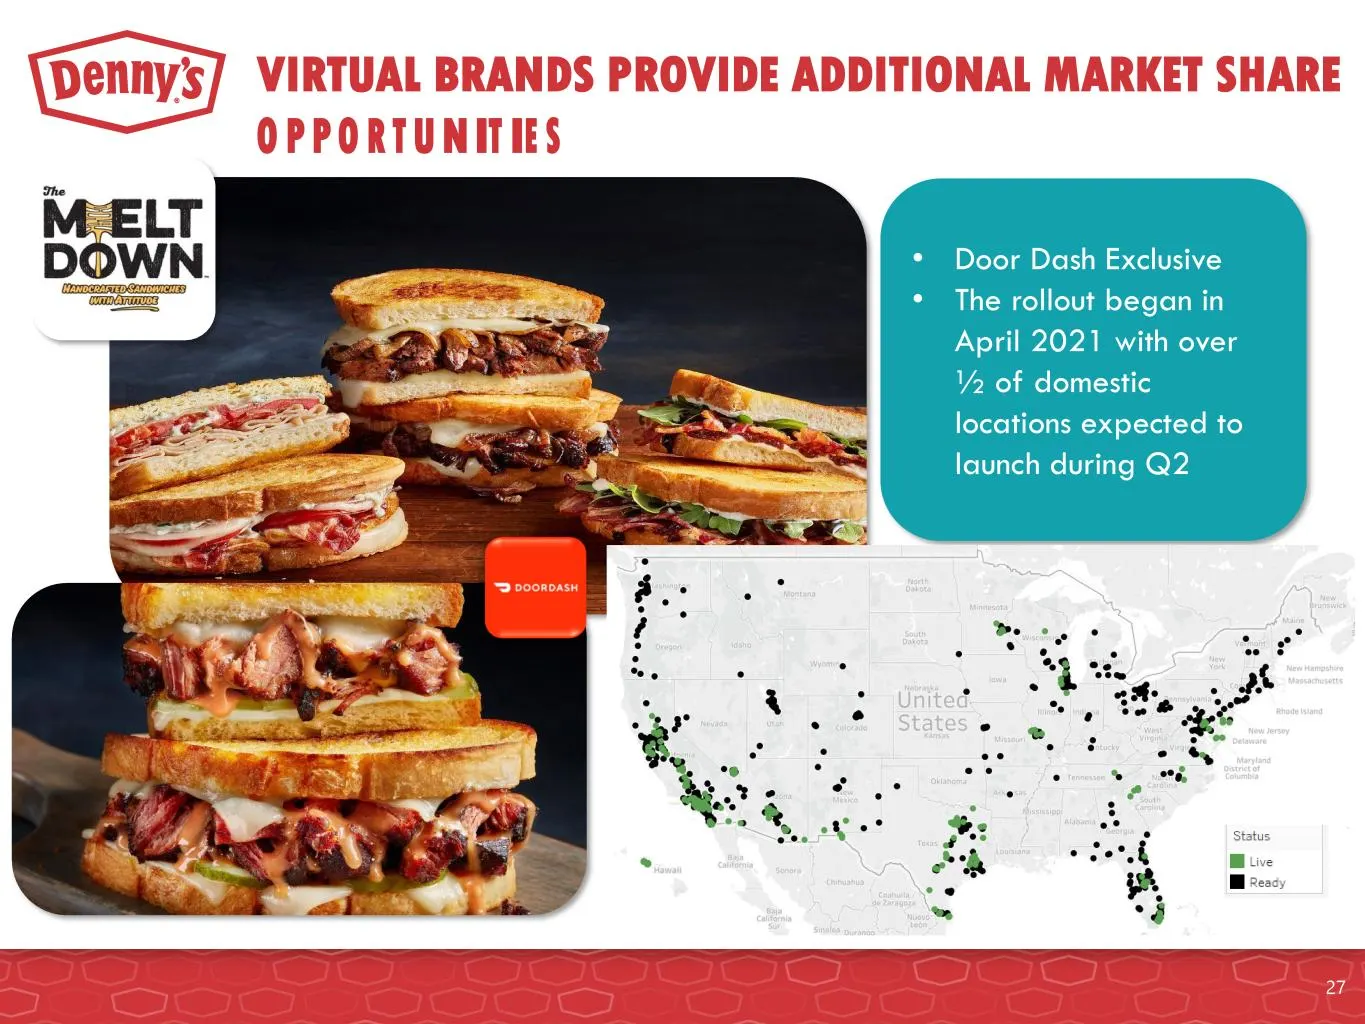
VIRTUAL BRANDS PROVIDE ADDITIONAL MARKET SHARE OPPORTUNITIES 27 • Door Dash Exclusive • The rollout began in April 2021 with over ½ of domestic locations expected to launch during Q2
Slide 28: Strong Collaboration with Franchisees
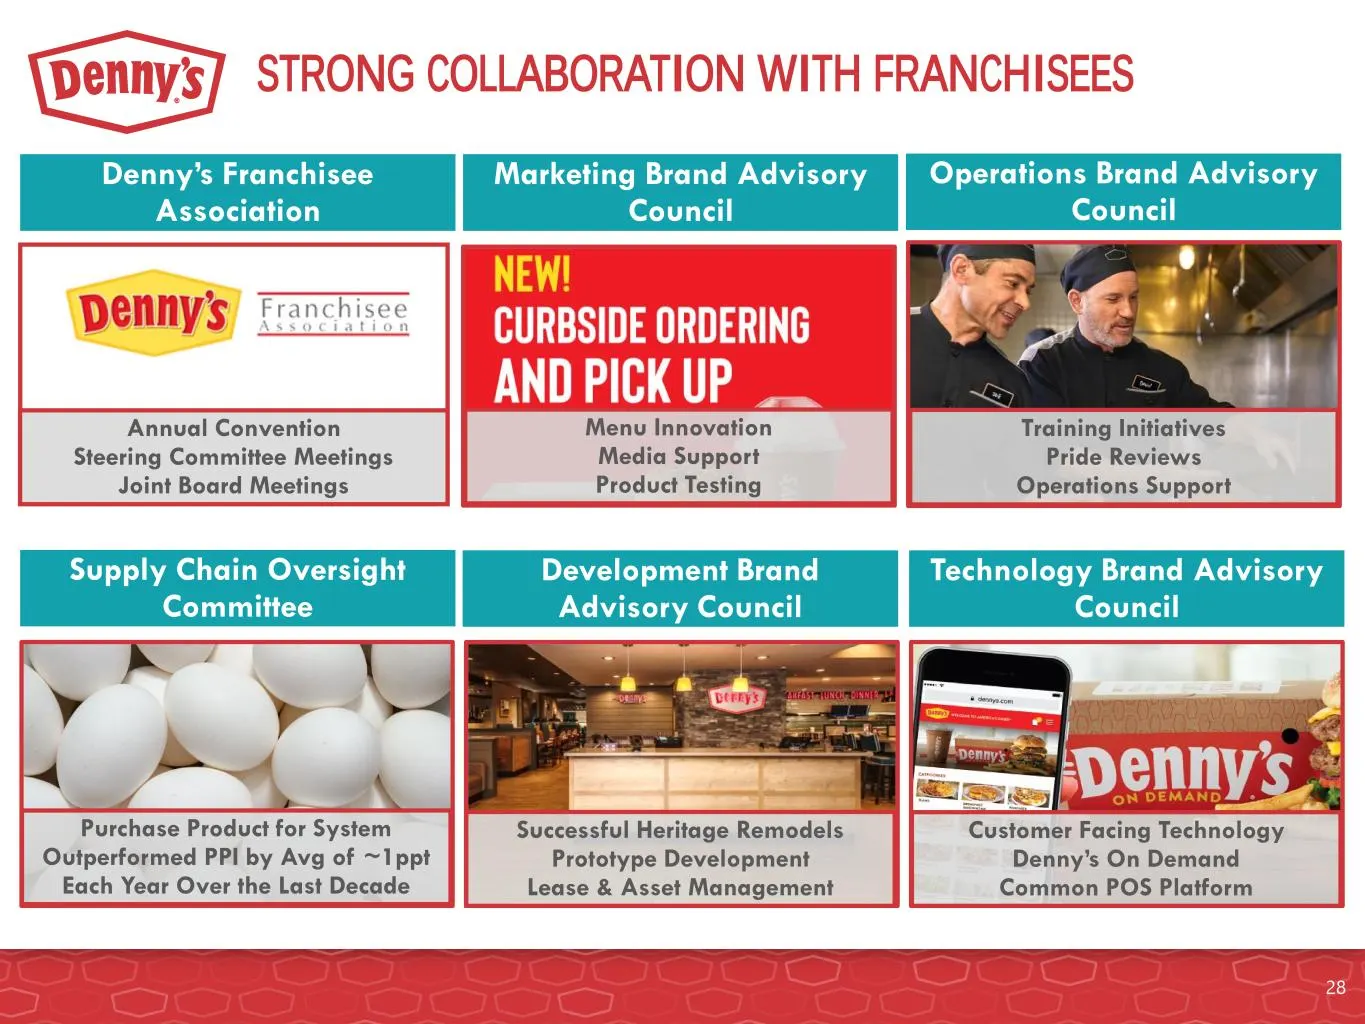
STRONG COLLABORATION WITH FRANCHISEES Marketing Brand Advisory Council Operations Brand Advisory Council Supply Chain Oversight Committee Development Brand Advisory Council Denny’s Franchisee Association Technology Brand Advisory Council Training Initiatives Pride Reviews Operations Support Purchase

Slide 29: Historical Performance
HISTORICAL PERFORMANCE 29
Slide 30: Total System Sales and Adjusted EBITDA
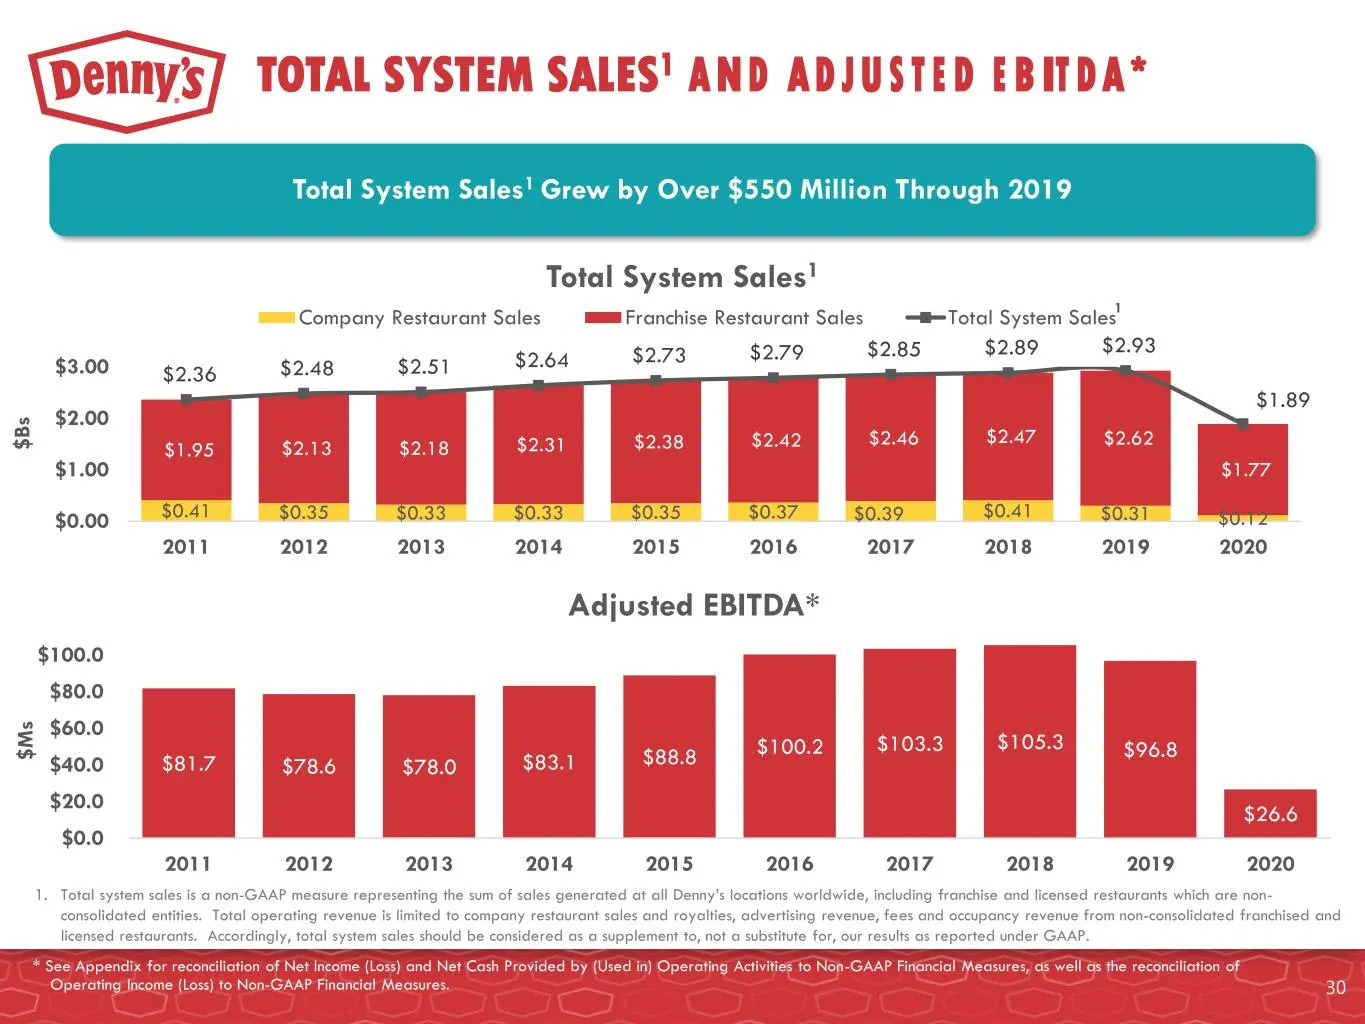
TOTAL SYSTEM SALES1 AND ADJUSTED EBITDA* 1. Total system sales is a non-GAAP measure representing the sum of sales generated at all Denny’s locations worldwide, including franchise and licensed restaurants which are non- consolidated entities. Total operating revenue is limited to company restaurant
Slide 31: Franchised and Company Restaurant Sales
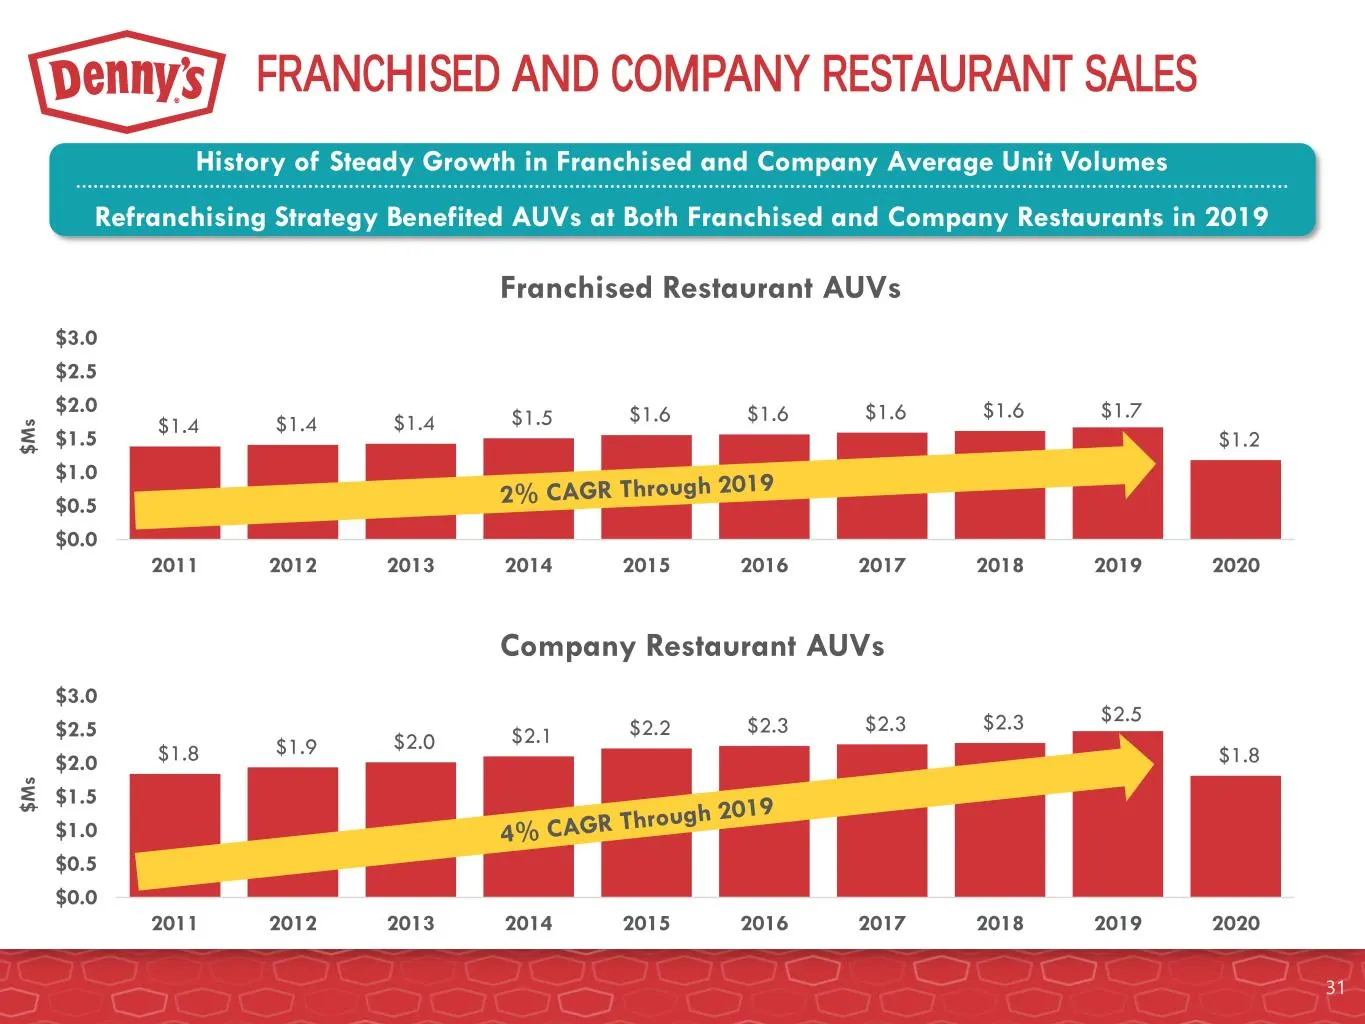
$1.8 $1.9 $2.0 $2.1 $2.2 $2.3 $2.3 $2.3 $2.5 $1.8 $0.0 $0.5 $1.0 $1.5 $2.0 $2.5 $3.0 2011 2012 2013 2014 2015 2016 2017 2018 2019 2020 Company Restaurant AUVs FRANCHISED AND COMPANY RESTAURANT SALES History of Steady Growth in Franchised and Company Average Unit Volumes Refranchising Strategy Benefi
Slide 32: Franchise and Company Margins
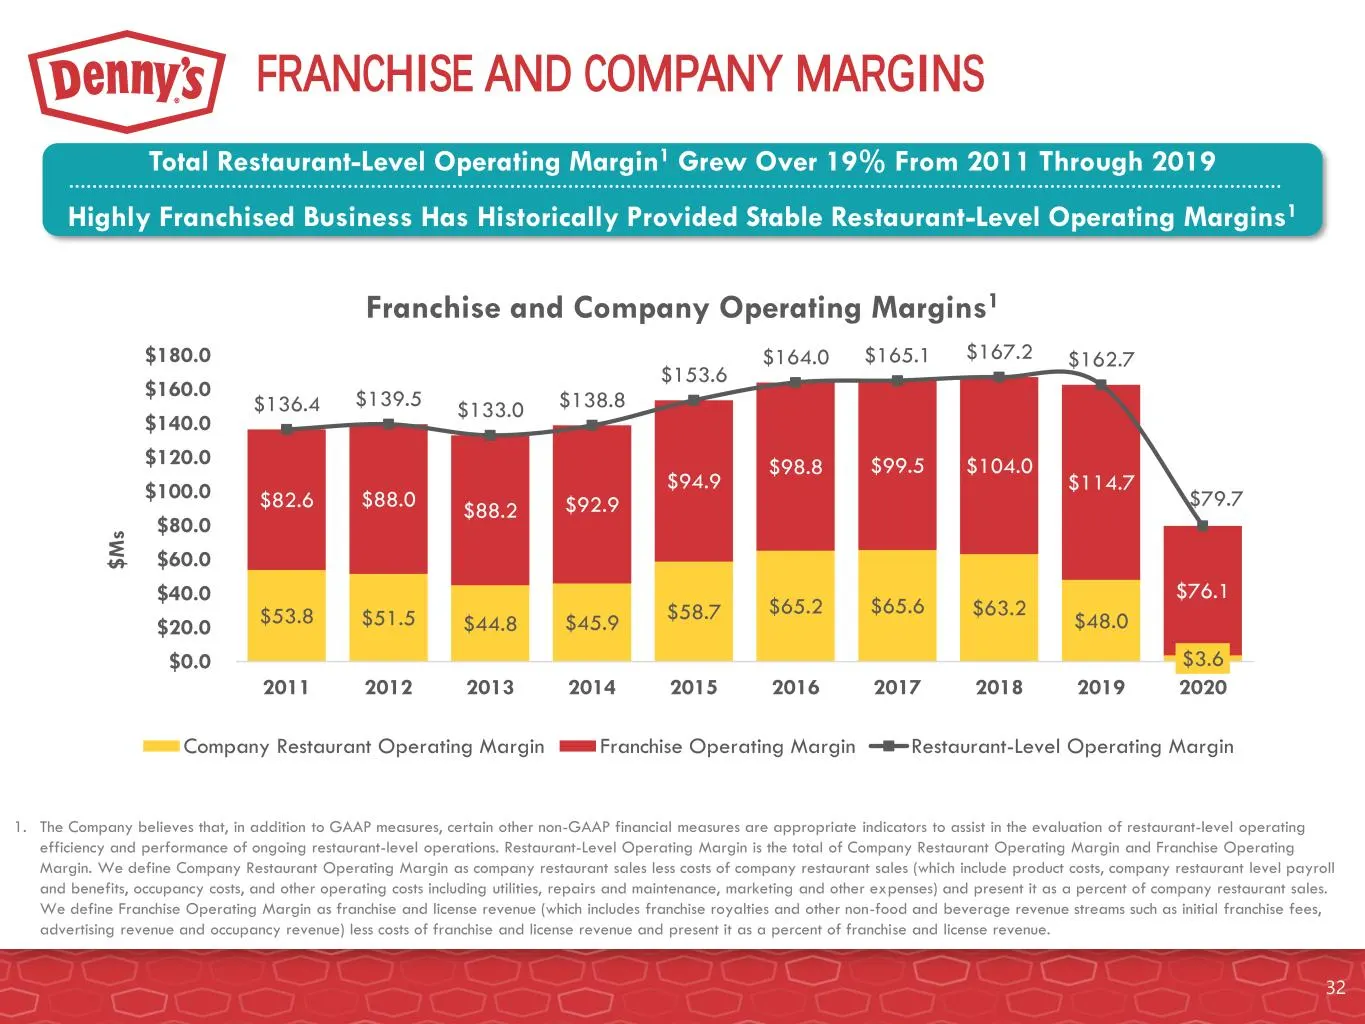
FRANCHISE AND COMPANY MARGINS $53.8 $51.5 $44.8 $45.9 $58.7 $65.2 $65.6 $63.2 $48.0 $3.6 $82.6 $88.0 $88.2 $92.9 $94.9 $98.8 $99.5 $104.0 $114.7 $76.1 $136.4 $139.5 $133.0 $138.8 $153.6 $164.0 $165.1 $167.2 $162.7 $79.7 $0.0 $20.0 $40.0 $60.0 $80.0 $100.0 $120.0 $140.0 $160.0 $180.0 2011 2012 2013 2
Slide 33: General and Administrative Expenses
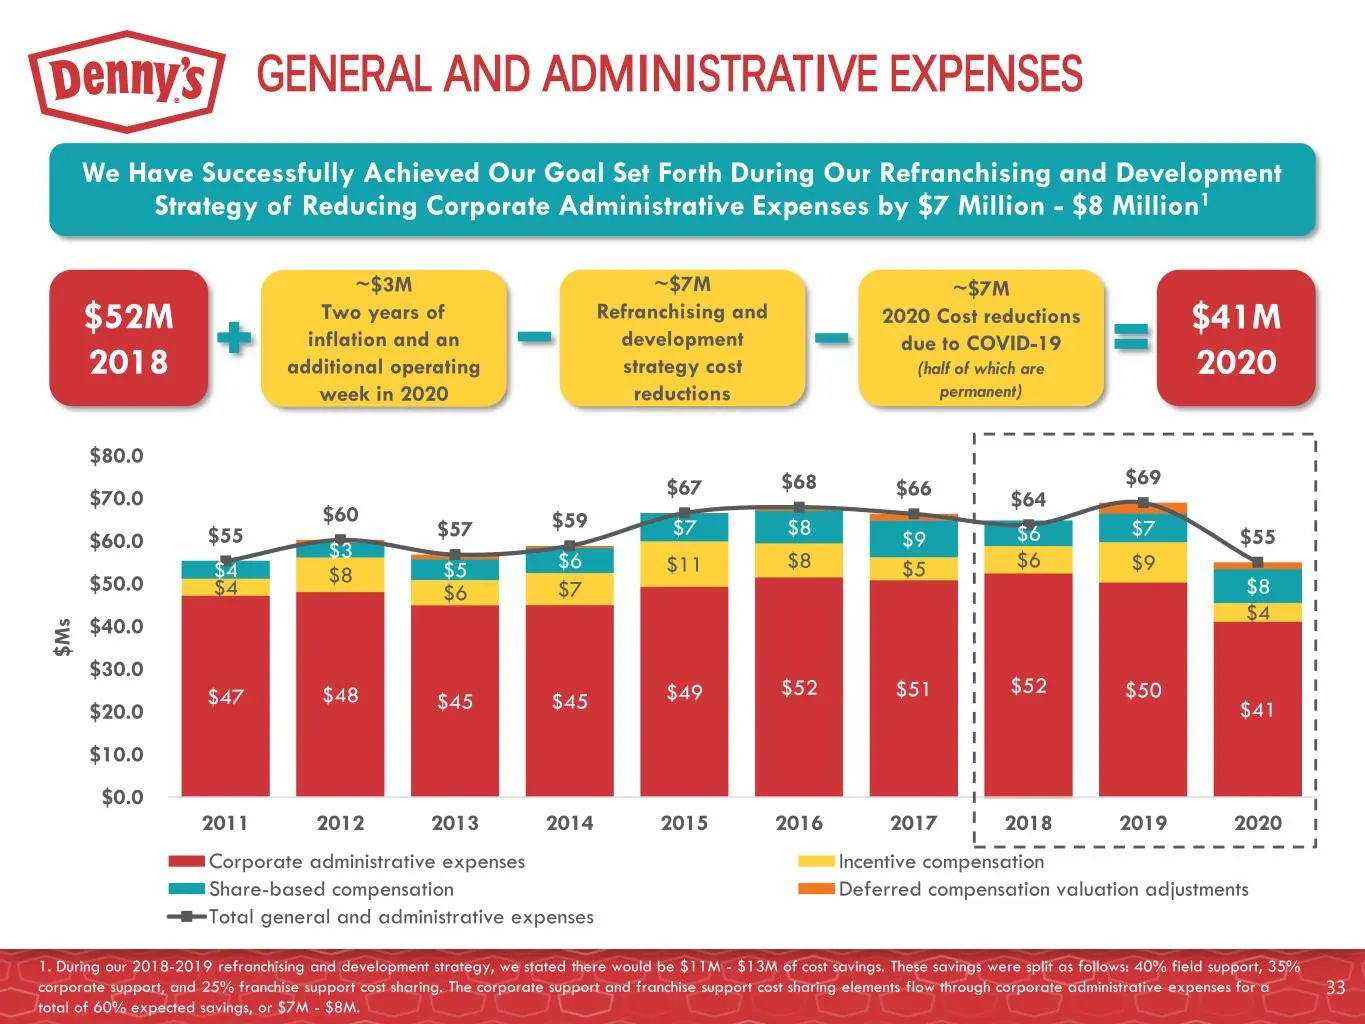
GENERAL AND ADMINISTRATIVE EXPENSES $47 $48 $45 $45 $49 $52 $51 $52 $50 $41 $4 $8 $6 $7 $11 $8 $5 $6 $9 $4 $4 $3 $5 $6 $7 $8 $9 $6 $7 $8 $55 $60 $57 $59 $67 $68 $66 $64 $69 $55 $0.0 $10.0 $20.0 $30.0 $40.0 $50.0 $60.0 $70.0 $80.0 2011 2012 2013 2014 2015 2016 2017 2018 2019 2020 $ M s Corporate admi
Slide 34: Domestic System-Wide Same-Store Sales
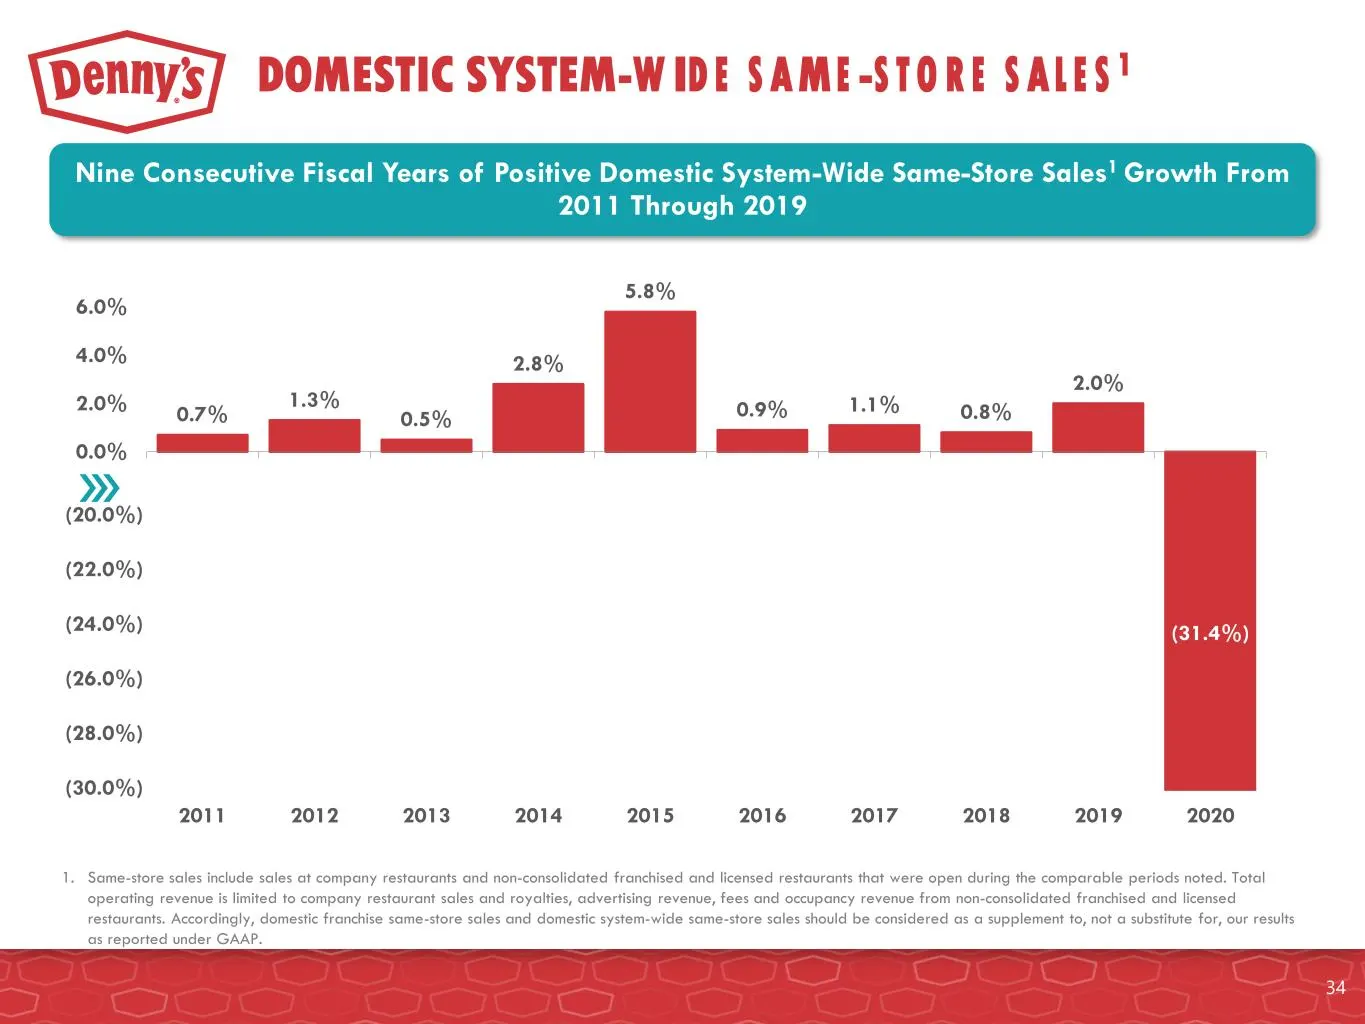
DOMESTIC SYSTEM-WIDE SAME-STORE SALES1 1. Same-store sales include sales at company restaurants and non-consolidated franchised and licensed restaurants that were open during the comparable periods noted. Total operating revenue is limited to company restaurant sales and royalties, advertising reven
Slide 35: Global Development
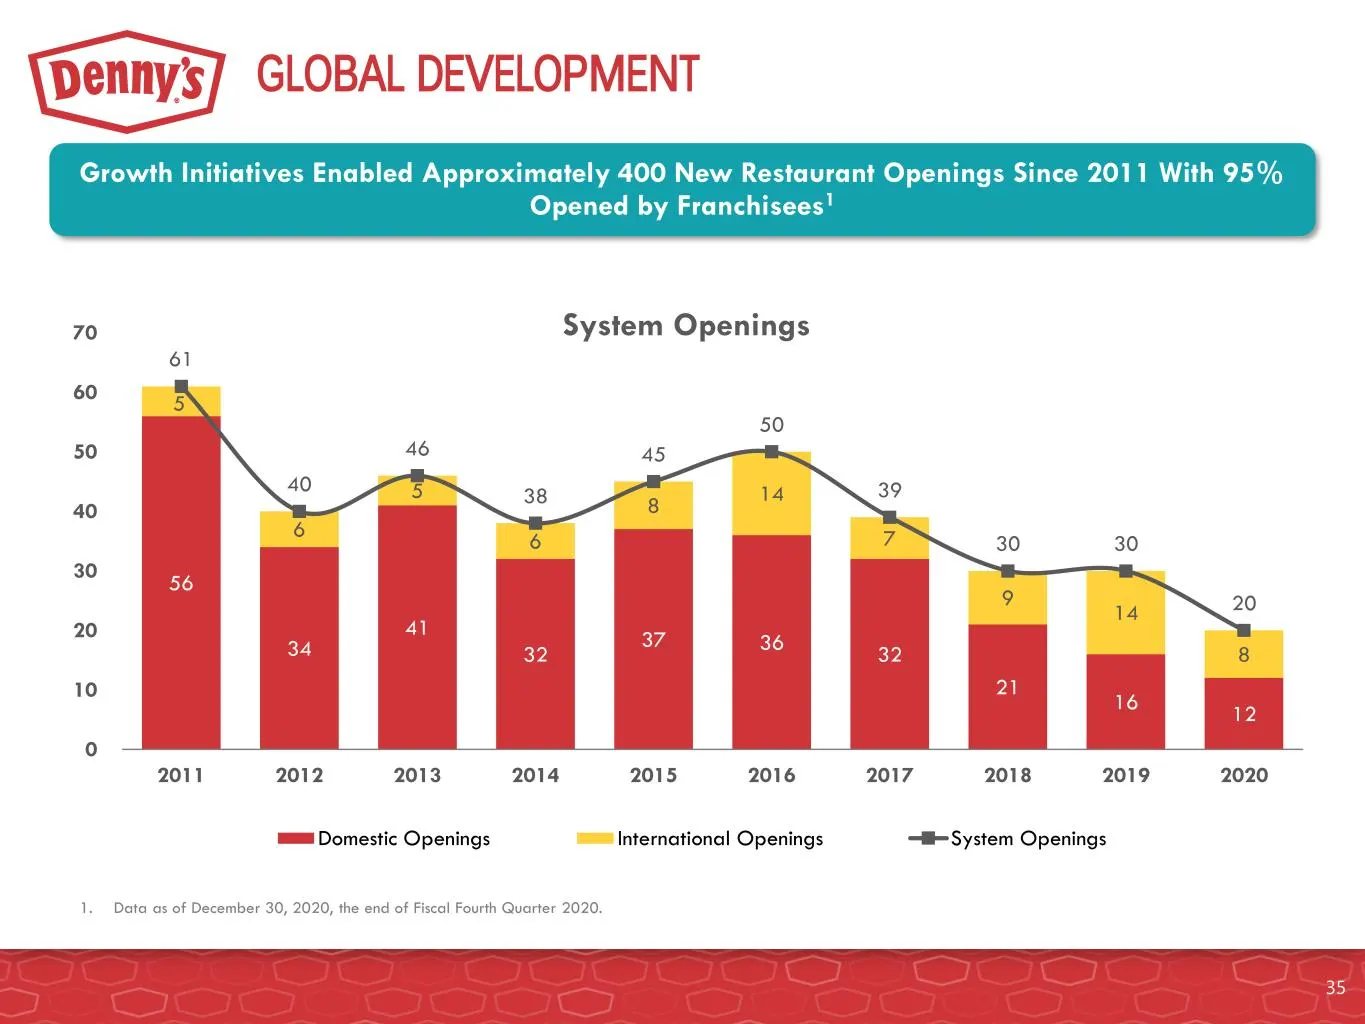
GLOBAL DEVELOPMENT 56 34 41 32 37 36 32 21 16 12 5 6 5 6 8 14 7 9 14 8 61 40 46 38 45 50 39 30 30 20 0 10 20 30 40 50 60 70 2011 2012 2013 2014 2015 2016 2017 2018 2019 2020 System Openings Domestic Openings International Openings System Openings 35 Growth Initiatives Enabled Approximately 400 New R
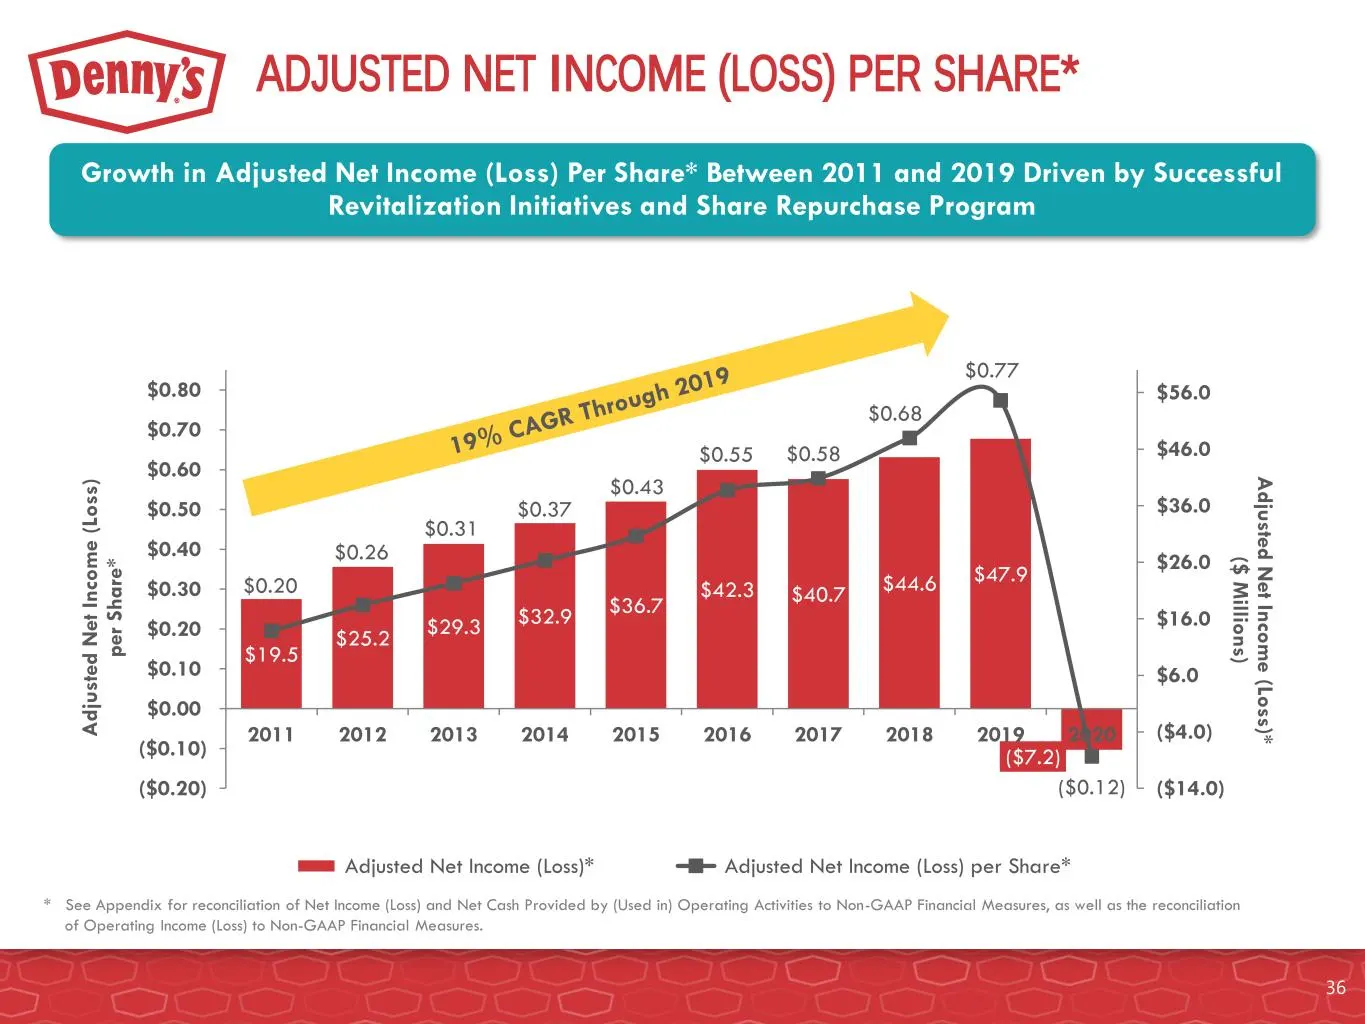
Slide 36: Adjusted Net Income (Loss) Per Share
ADJUSTED NET INCOME (LOSS) PER SHARE* $19.5 $25.2 $29.3 $32.9 $36.7 $42.3 $40.7 $44.6 $47.9 ($7.2) $0.20 $0.26 $0.31 $0.37 $0.43 $0.55 $0.58 $0.68 $0.77 ($0.12) ($14.0) ($4.0) $6.0 $16.0 $26.0 $36.0 $46.0 $56.0 ($0.20) ($0.10) $0.00 $0.10 $0.20 $0.30 $0.40 $0.50 $0.60 $0.70 $0.80 2011 2012 2013 2014
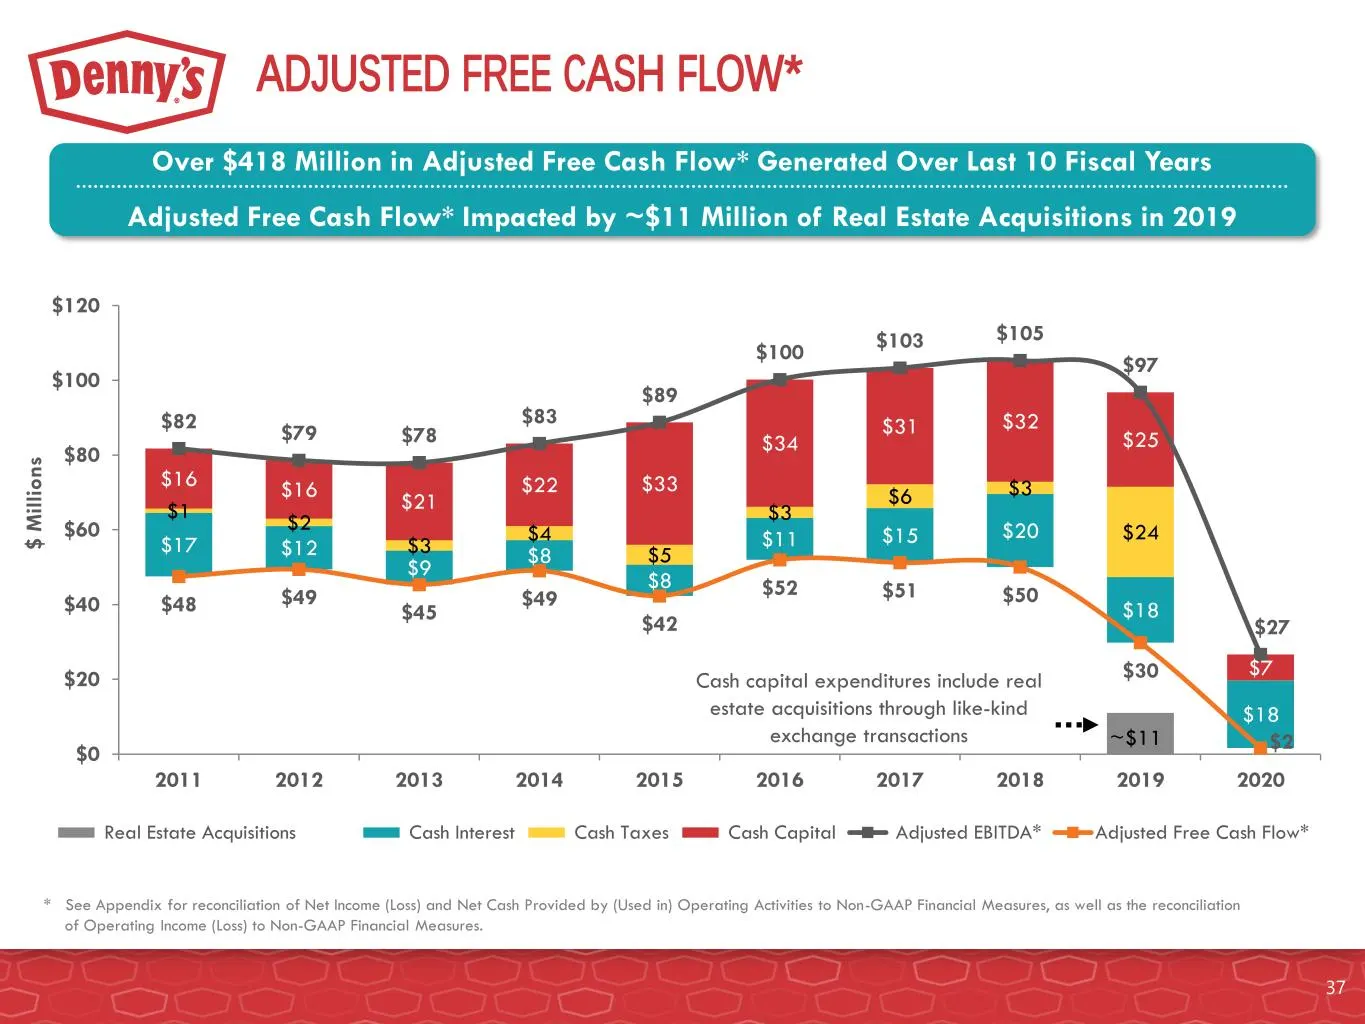
Slide 37: Adjusted Free Cash Flow
~$11 $17 $12 $9 $8 $8 $11 $15 $20 $18 $18 $1 $2 $3 $4 $5 $3 $6 $3 $24 $16 $16 $21 $22 $33 $34 $31 $32 $25 $7 $82 $79 $78 $83 $89 $100 $103 $105 $97 $27 $48 $49 $45 $49 $42 $52 $51 $50 $30 $2 $0 $20 $40 $60 $80 $100 $120 2011 2012 2013 2014 2015 2016 2017 2018 2019 2020 $ M il li o n s Real Estate Ac
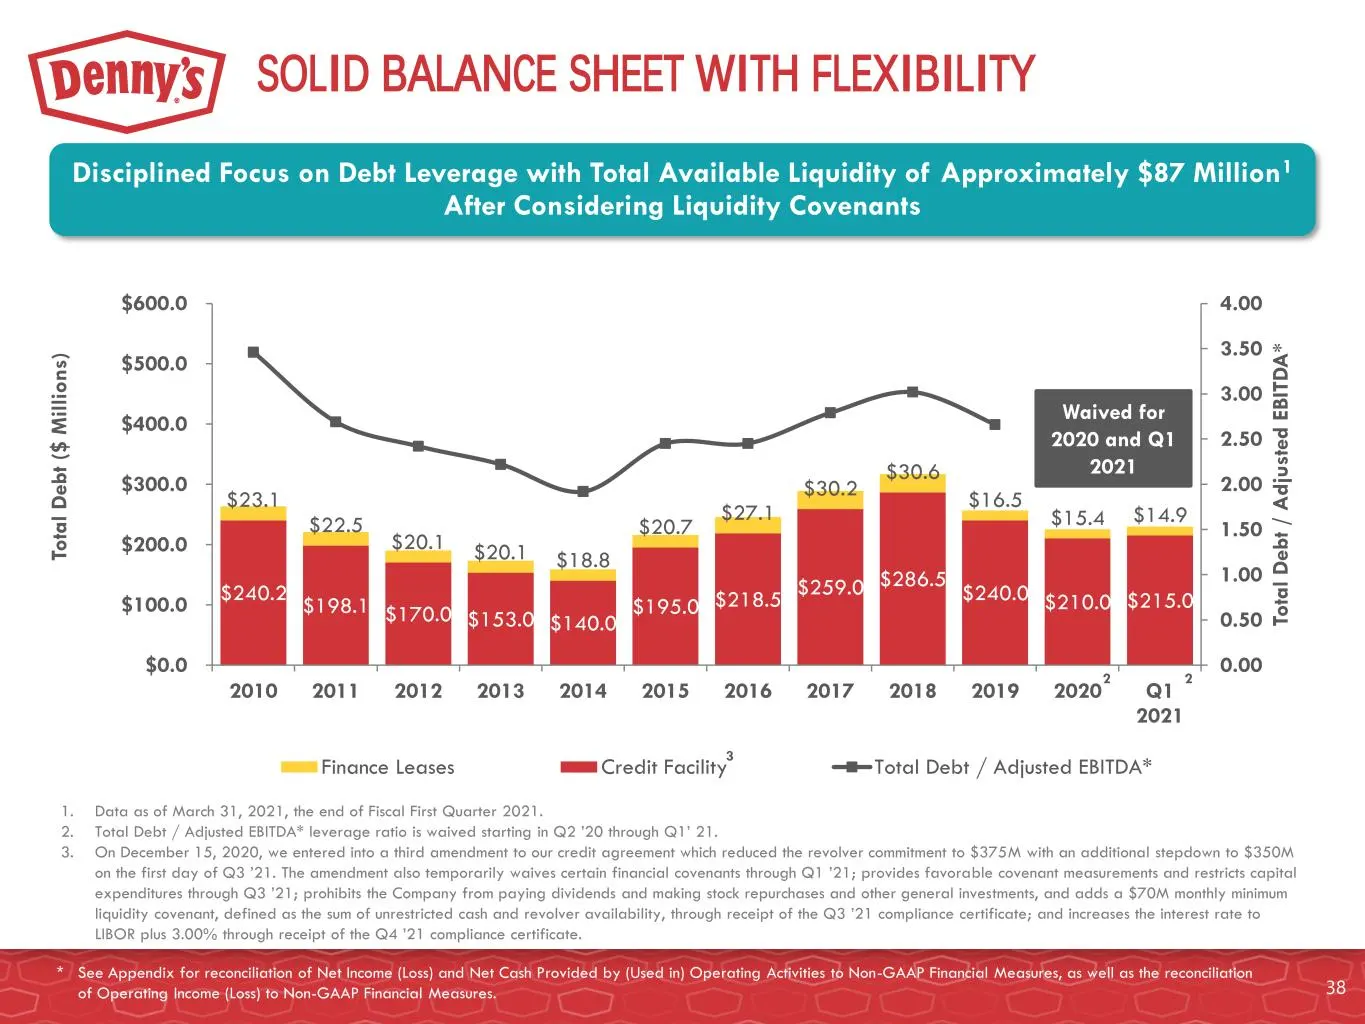
Slide 38: Solid Balance Sheet with Flexibility
Disciplined Focus on Debt Leverage with Total Available Liquidity of Approximately $87 Million1 After Considering Liquidity Covenants SOLID BALANCE SHEET WITH FLEXIBILITY 1. Data as of March 31, 2021, the end of Fiscal First Quarter 2021. 2. Total Debt / Adjusted EBITDA* leverage ratio is waived sta
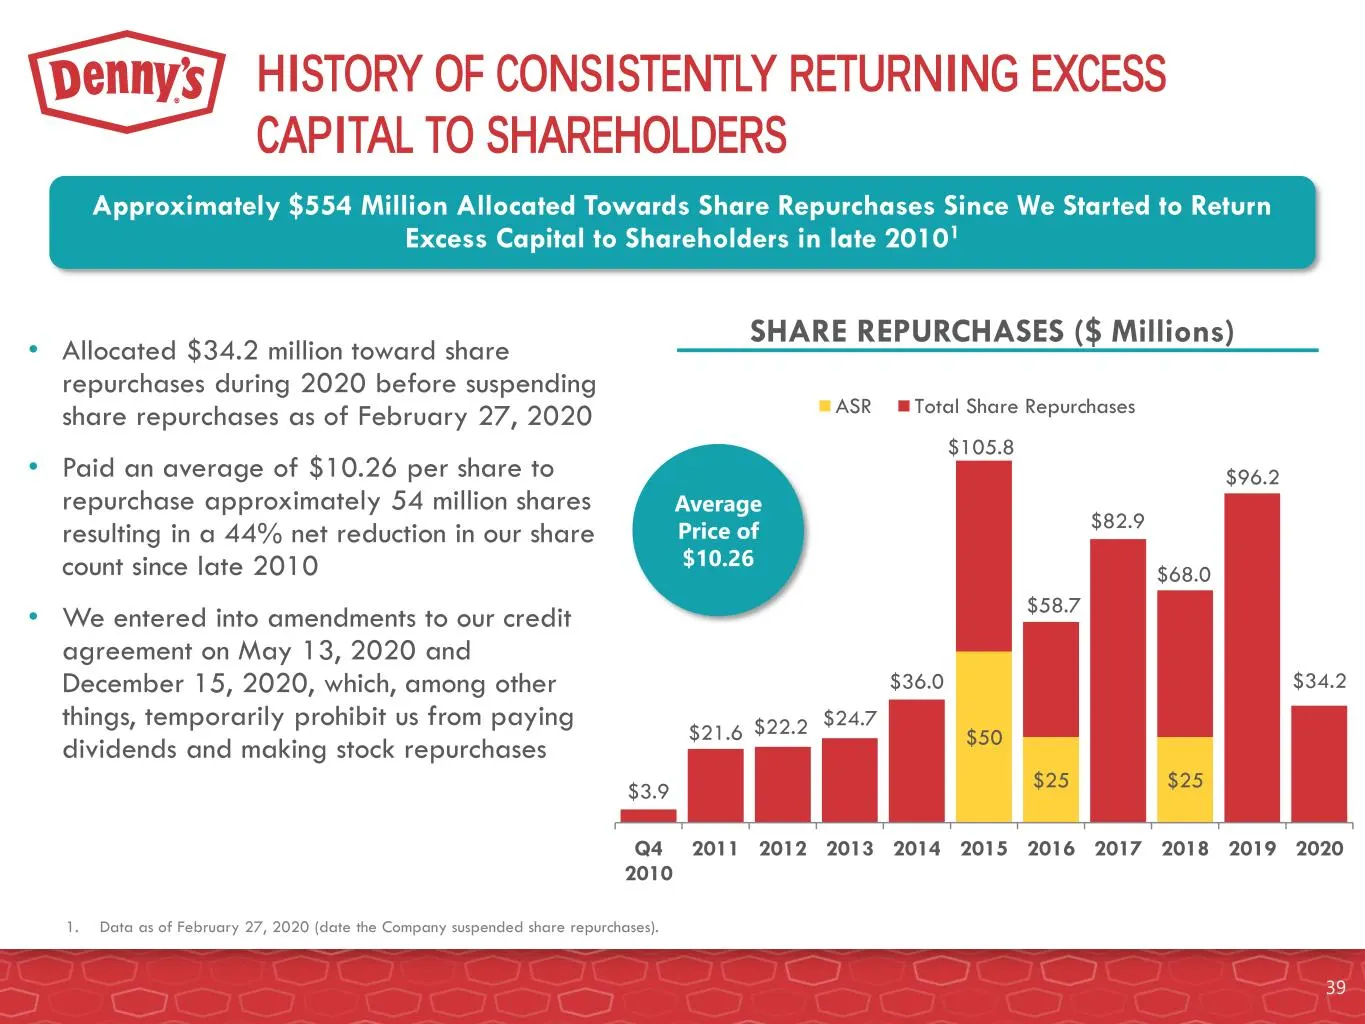
Slide 39: History of Consistently Returning Excess Capital to Shareholders
HISTORY OF CONSISTENTLY RETURNING EXCESS CAPITAL TO SHAREHOLDERS $50 $25 $25 $3.9 $21.6 $22.2 $24.7 $36.0 $82.9 $96.2 $34.2 Q4 2010 2011 2012 2013 2014 2015 2016 2017 2018 2019 2020 ASR Total Share Repurchases • Allocated $34.2 million toward share repurchases during 2020 before suspending share rep
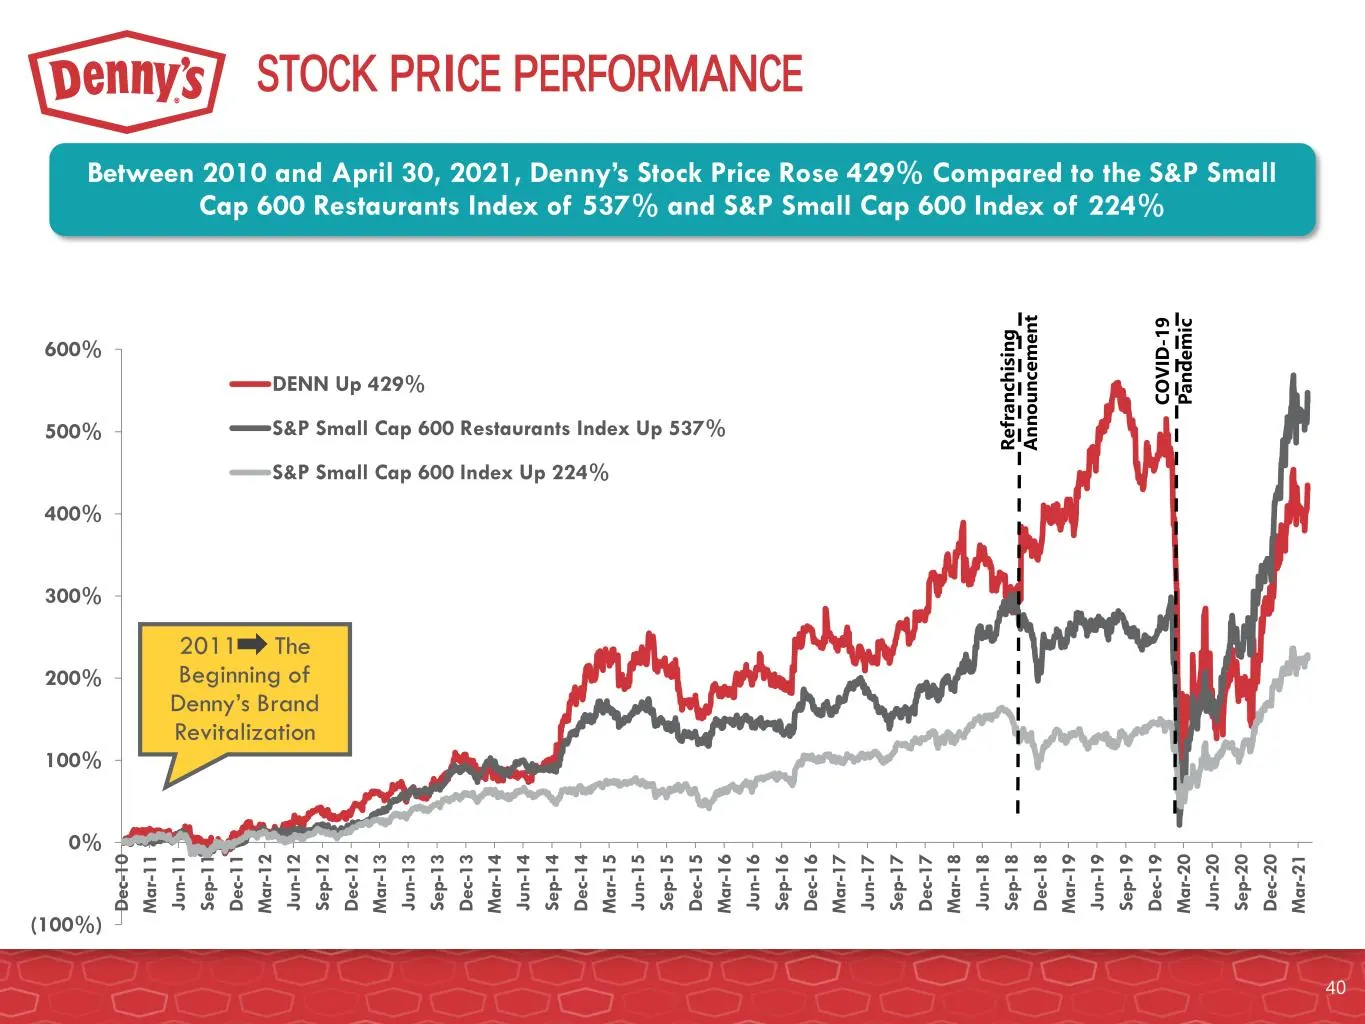
Slide 40: Stock Price Performance
STOCK PRICE PERFORMANCE (100%) 0% 100% 200% 300% 400% 500% 600% D e c -1 0 M a r- 1 1 J u n -1 1 S e p -1 1 D e c -1 1 M a r- 1 2 J u n -1 2 S e p -1 2 D e c -1 2 M a r- 1 3 J u n -1 3 S e p -1 3 D e c -1 3 M a r- 1 4 J u n -1 4 S e p -1 4 D e c -1 4 M a r- 1 5 J u n -1 5 S e p -1 5 D e c -1 5 M a r
Slide 41: Denny's Investment Highlights
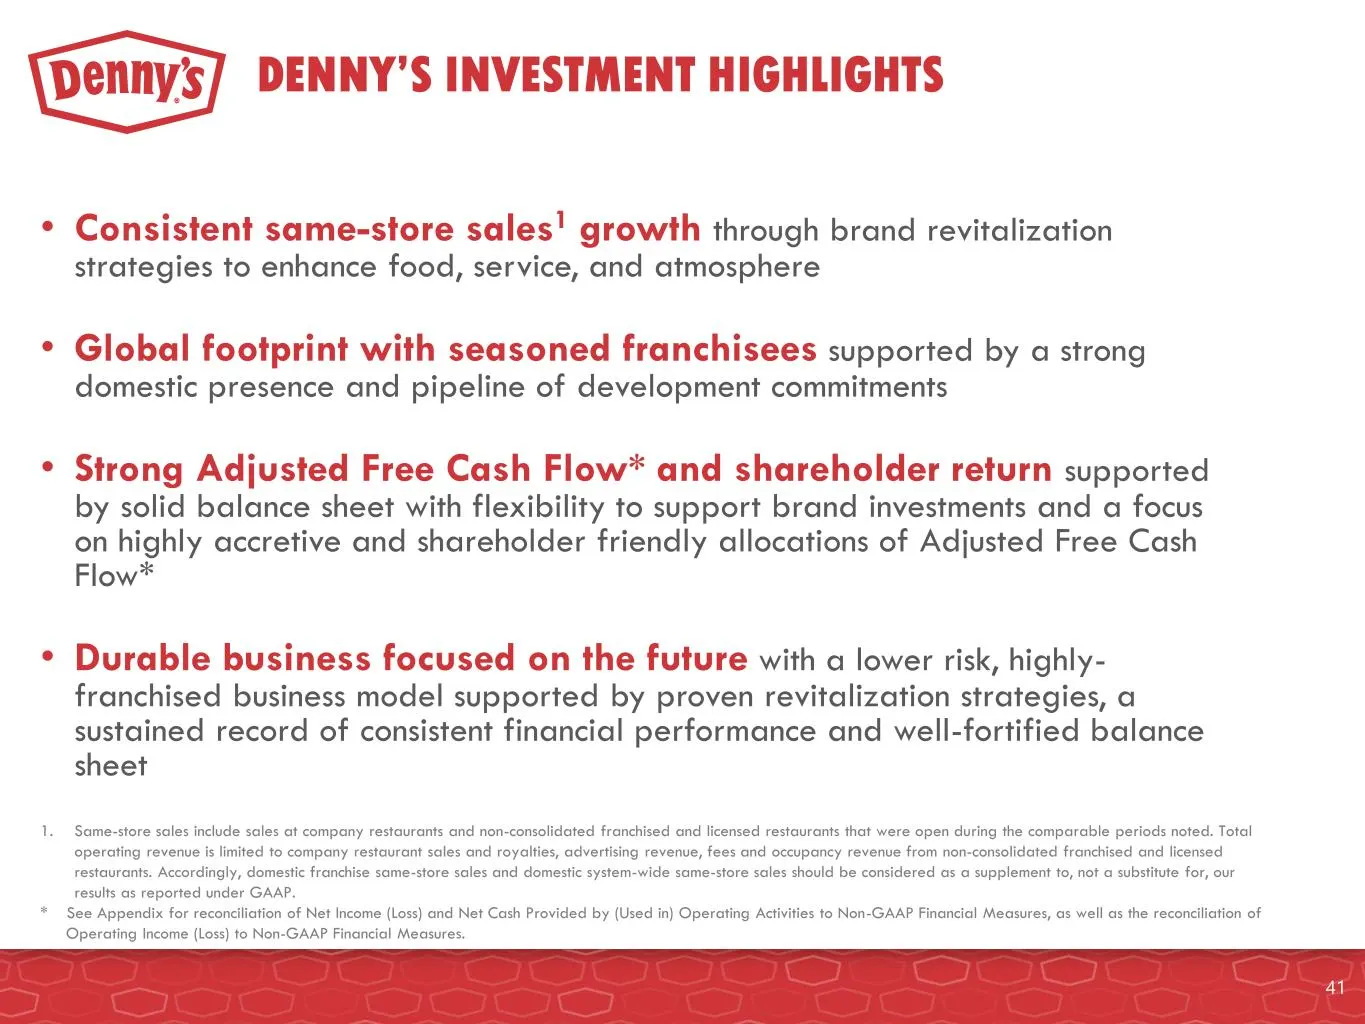
DENNY’S INVESTMENT HIGHLIGHTS 1. Same-store sales include sales at company restaurants and non-consolidated franchised and licensed restaurants that were open during the comparable periods noted. Total operating revenue is limited to company restaurant sales and royalties, advertising revenue, fees

Slide 42: Appendix
APPENDIX 42
Slide 43: Experienced and Committed Leadership Team
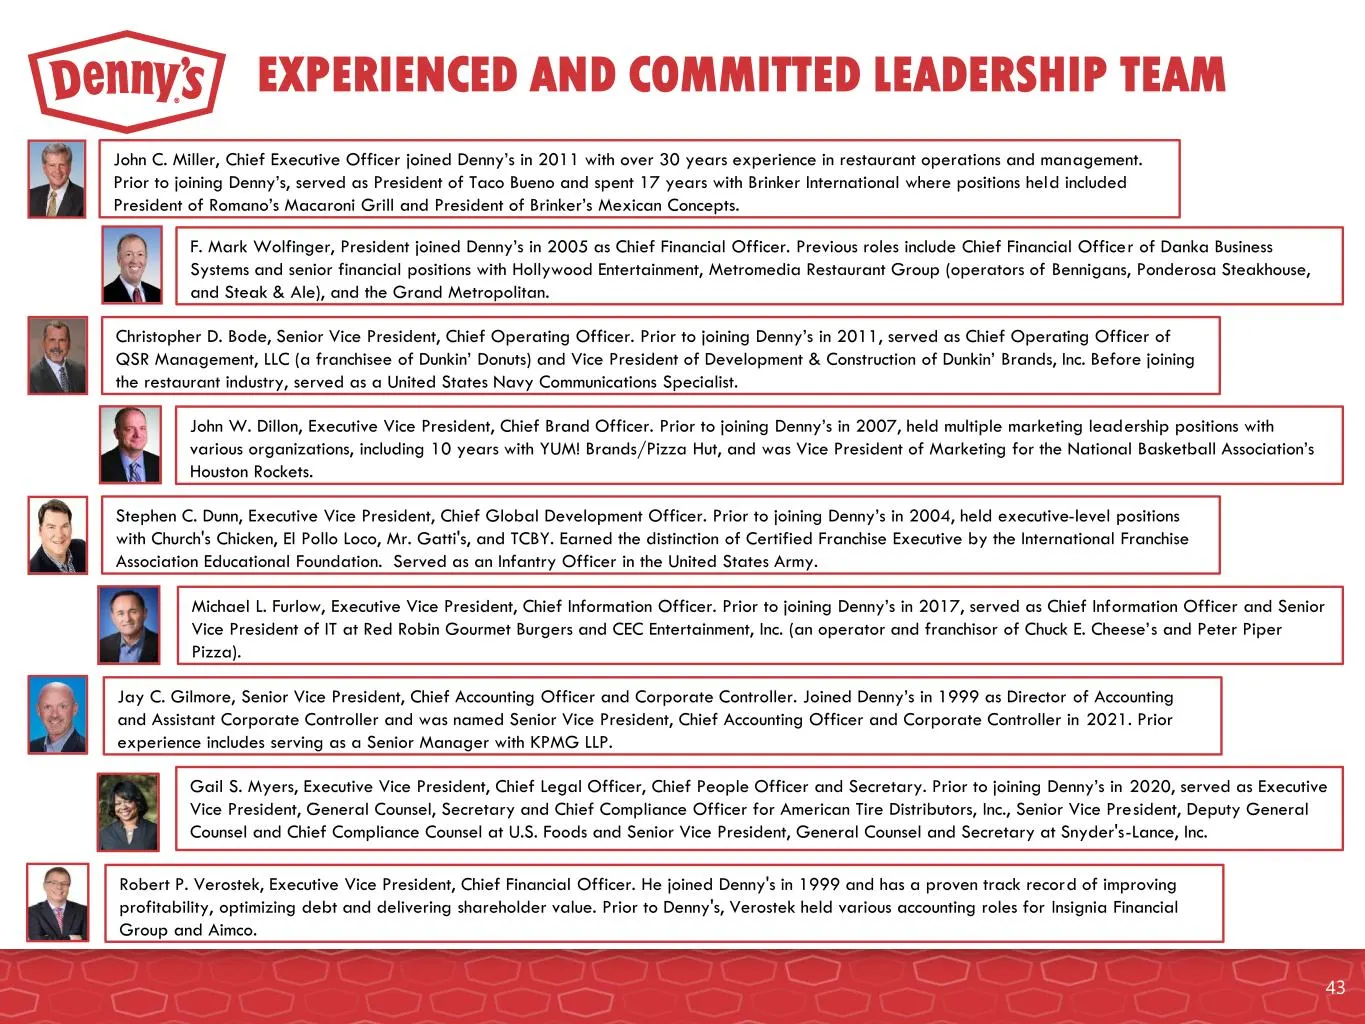
EXPERIENCED AND COMMITTED LEADERSHIP TEAM John C. Miller, Chief Executive Officer joined Denny’s in 2011 with over 30 years experience in restaurant operations and management. Prior to joining Denny’s, served as President of Taco Bueno and spent 17 years with Brinker International where positions he
Slide 44: Reconciliation of Net Income (Loss) to Non-GAAP Financial Measures
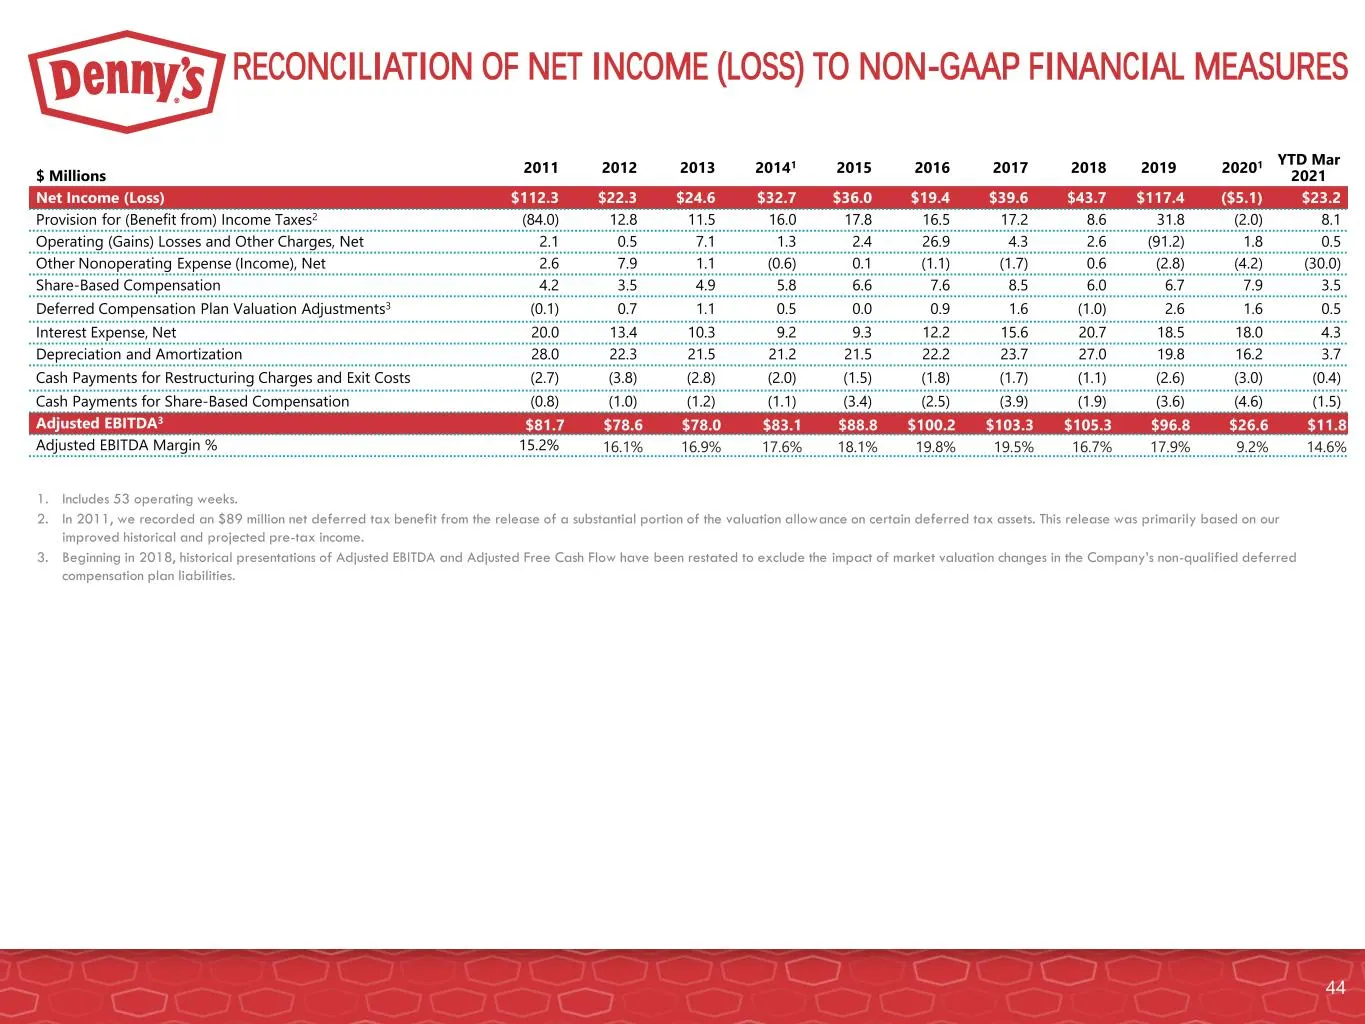
RECONCILIATION OF NET INCOME (LOSS) TO NON-GAAP FINANCIAL MEASURES $ Millions 2011 2012 2013 20141 2015 2016 2017 2018 2019 20201 YTD Mar 2021 Net Income (Loss) $112.3 $22.3 $24.6 $32.7 $36.0 $19.4 $39.6 $43.7 $117.4 ($5.1) $23.2 Provision for (Benefit from) Income Taxes2 (84.0) 12.8 11.5 16.0 17.8
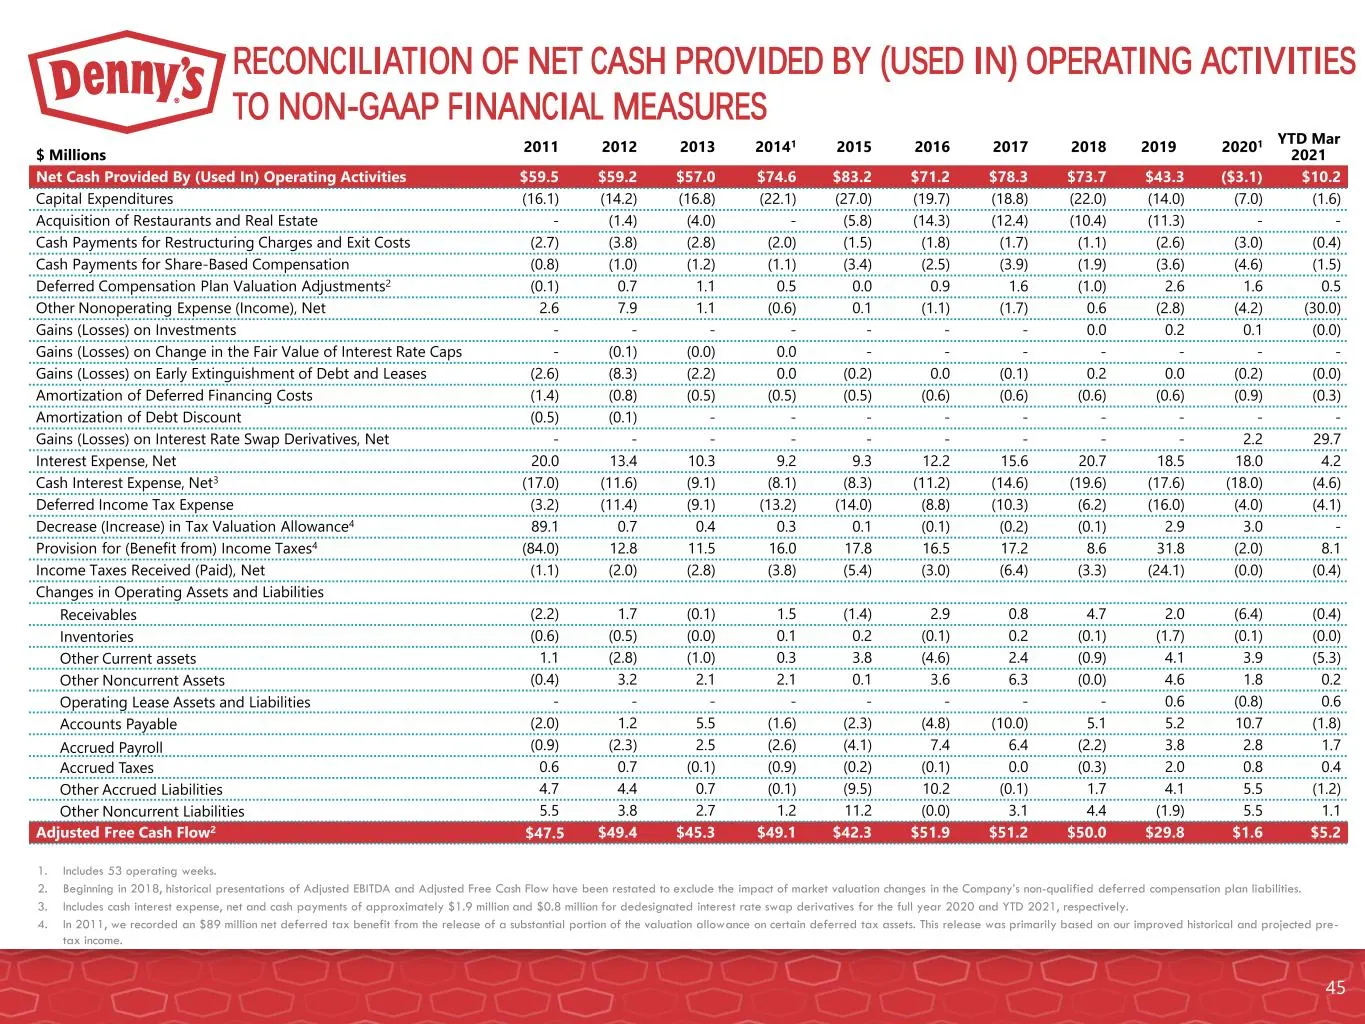
Slide 45: Reconciliation of Net Cash Provided by Operating Activities to Non-GAAP Measures
RECONCILIATION OF NET CASH PROVIDED BY (USED IN) OPERATING ACTIVITIES TO NON-GAAP FINANCIAL MEASURES $ Millions 2011 2012 2013 20141 2015 2016 2017 2018 2019 20201 YTD Mar 2021 Net Cash Provided By (Used In) Operating Activities $59.5 $59.2 $57.0 $74.6 $83.2 $71.2 $78.3 $73.7 $43.3 ($3.1) $10.2 Capi
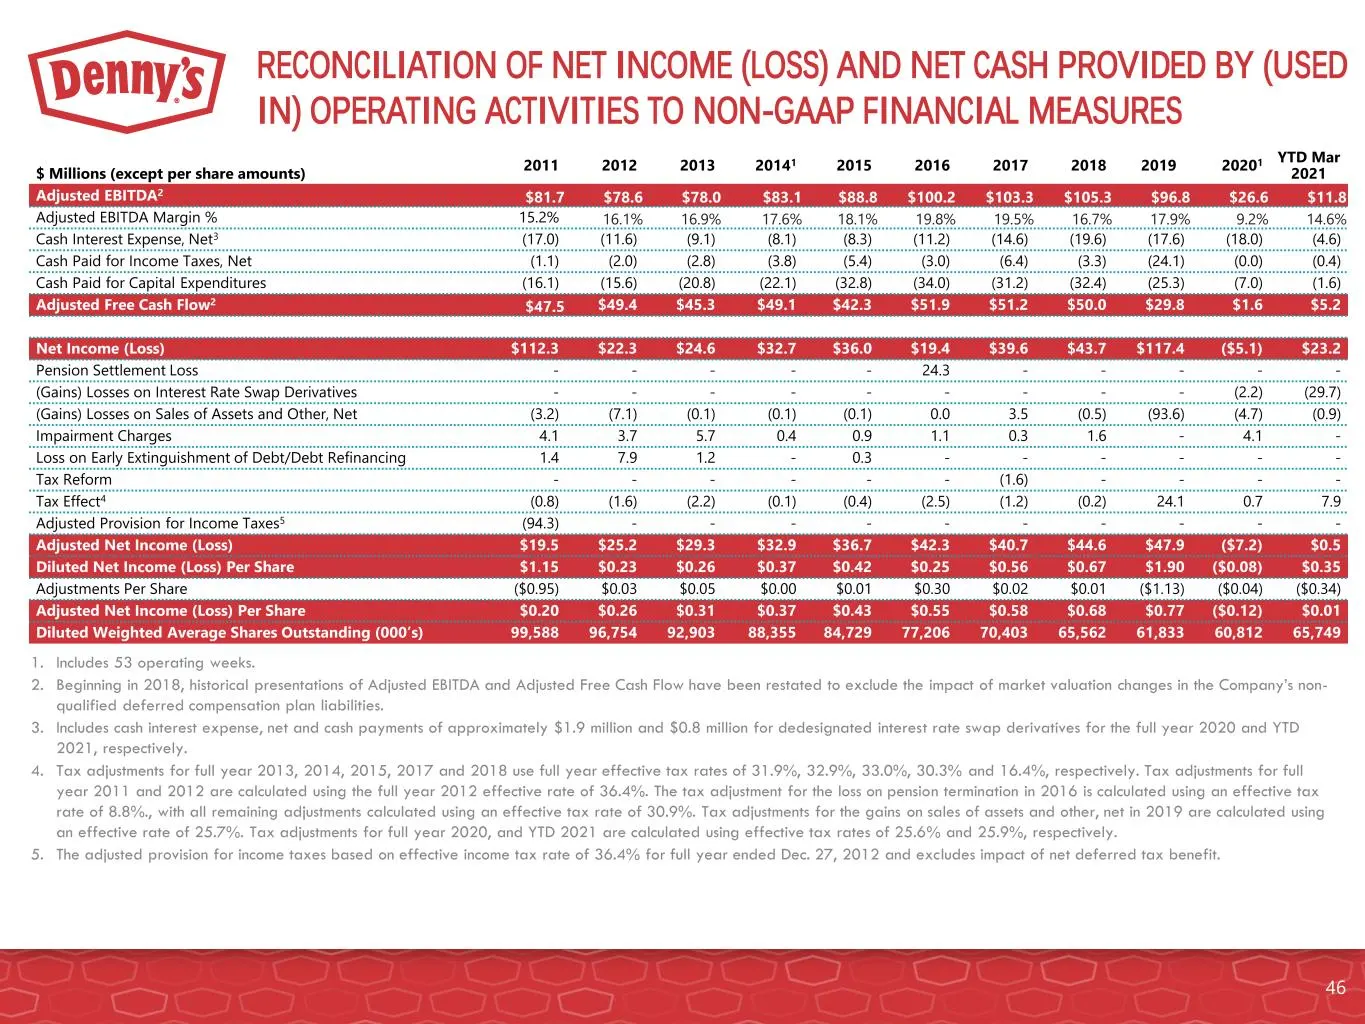
Slide 46: Reconciliation of Net Income and Operating Cash Flow to Non-GAAP Measures
RECONCILIATION OF NET INCOME (LOSS) AND NET CASH PROVIDED BY (USED IN) OPERATING ACTIVITIES TO NON-GAAP FINANCIAL MEASURES $ Millions (except per share amounts) 2011 2012 2013 20141 2015 2016 2017 2018 2019 20201 YTD Mar 2021 Adjusted EBITDA2 $81.7 $78.6 $78.0 $83.1 $88.8 $100.2 $103.3 $105.3 $96.8
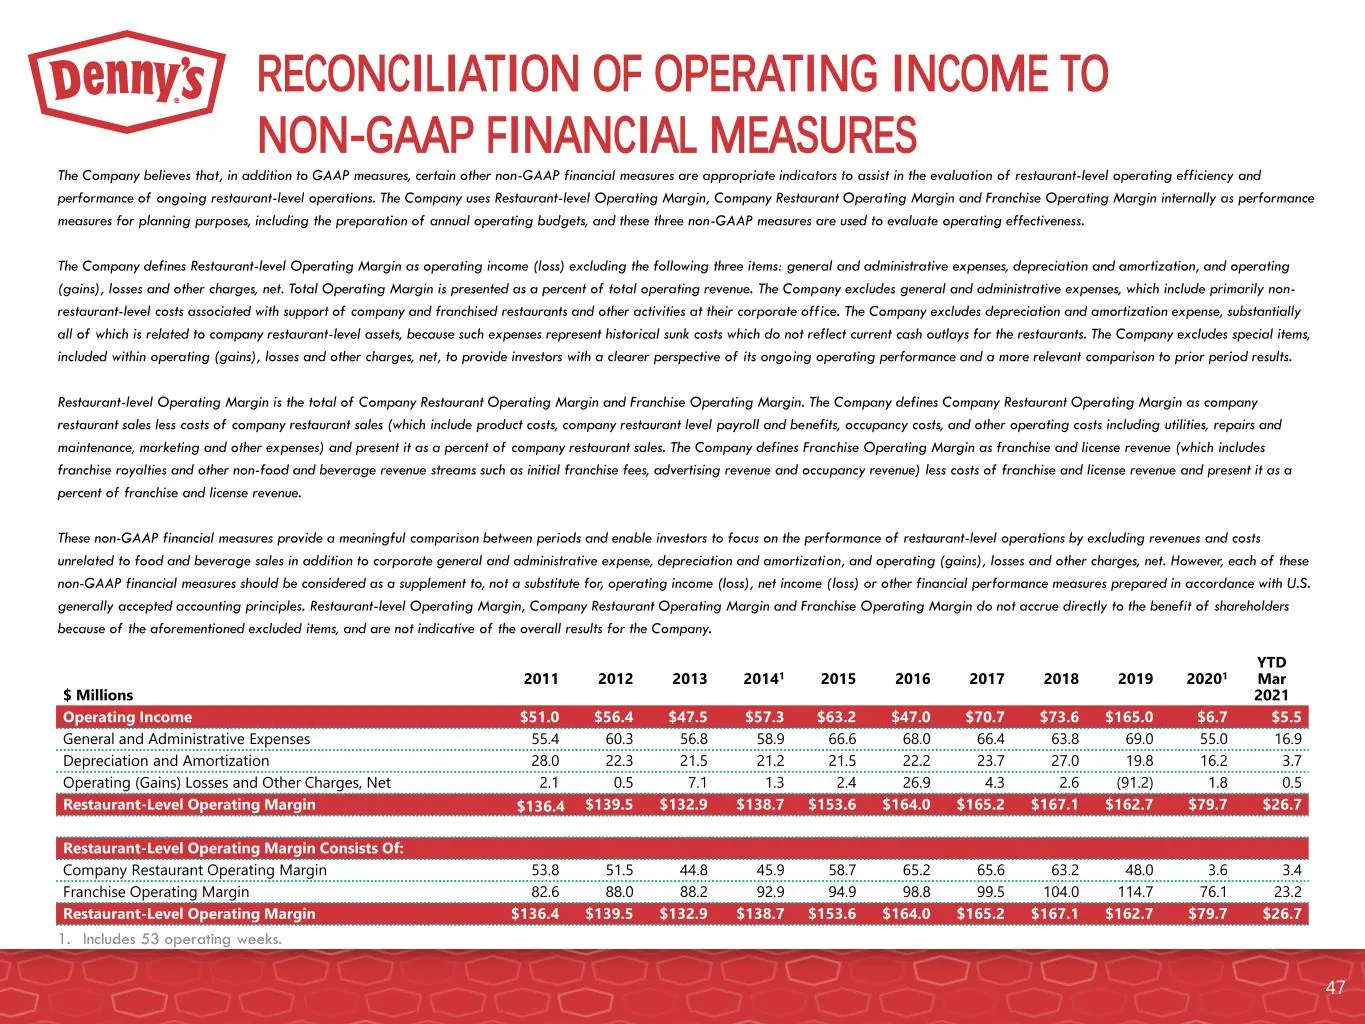
Slide 47: Reconciliation of Operating Income to Non-GAAP Financial Measures
RECONCILIATION OF OPERATING INCOME TO NON-GAAP FINANCIAL MEASURES $ Millions 2011 2012 2013 20141 2015 2016 2017 2018 2019 20201 YTD Mar 2021 Operating Income $51.0 $56.4 $47.5 $57.3 $63.2 $47.0 $70.7 $73.6 $165.0 $6.7 $5.5 General and Administrative Expenses 55.4 60.3 56.8 58.9 66.6 68.0 66.4 63.8
Source: SEC EDGAR · 8-K filed May 4, 2021
More decks from Dennys Corp
 Investor Presentation (August 2025)30 slides · Aug 4, 2025
 Investor Presentation (May 2025)32 slides · May 2025
 Investor Presentation (February 2025)32 slides · February 2025
 Investor Presentation (January 2025)32 slides · Jan 13, 2025
 Investor Day (October 2024)137 slides · Oct 22, 2024
 Q2 2024 Earnings Presentation22 slides · Jul 30, 2024