David Bonamini
Chief Financial Officer
Replay available
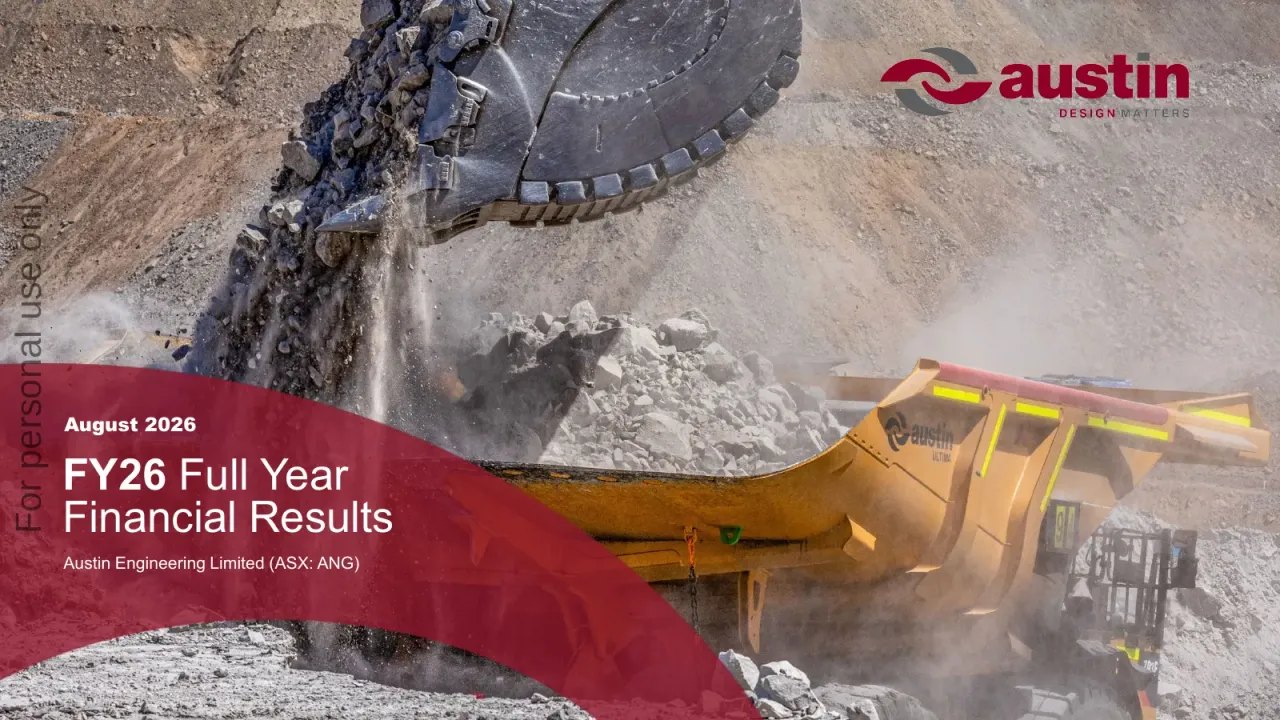
Austin Engineering (ASX:ANG) Q4 2026 earnings call, held 2026-08-25. Watch the replay and read the transcript on 6ix.
On 6ix: 6ix.com/event/austin-engineering-limited-ang-q4-2026-earnings-call
Automated transcript · Written by software from the replay's audio. It can mishear names and figures; the replay is the record.
0:00 Good morning, everyone, and thank you for joining Austin Engineering's investor briefing for the full year results for financial year 2026. Together with me is Austin's Chief Financial Officer, David Bonamini, who will take you through the presentation released in our ASX this morning and then open for questions at the end. Turning to slide three, I will begin with an overview of the results, David will then run through the financials, and I will return to discuss regional performance, operational priorities, and our outlook and guidance for 2027. Then we will move into the Q and A at the end. Unless otherwise stated, financial year 'twenty six and 'twenty five financial performance measures exclude foreign exchange movements and relate to continuing operations.
0:52 Cash flow measures include both continuing and discontinuing operations. If I then could move on to Slide seven for the results overview. FY 'twenty six was a challenging and disappointing year for Austin. Operational issues across North America, South America and Indonesia weighed on earnings. Importantly, these issues were operational in nature and within our control. During FY '26, we took decisive action to address them, strengthening operational discipline and positioning the business for improved performance. Group revenue for the full year was $329,000,000 down 12.7% on the prior year.
1:41 This reflected softer trade volumes across North America and APAC, together with the impact of the loss making legacy OEM contract in South America. These pressures were partly offset by continued growth in Australian buckets and spare parts. Group EBITDA was $20,400,000 down from $43,000,000 in FY25. The decline was driven by a $9,300,000 loss in Chile, mostly from the legacy OEM contract, margin declines in The US from productivity and outsourcing issues, and lower trade volumes in APAC, which was partly offset by strong bucket growth in Australia.
2:32 Group EBIT was CAD10.8 million. Despite the earning decline, operating cash flow was a clear strength. It increased by CAD24.1 million to $26,700,000 supported by disciplined working capital management and a $32,200,000 reduction in inventory. Net debt reduced to $5,800,000 from $12,800,000 strengthening our financial flexibility as we execute the operational improvement plan. Earlier this year, the board declared an interim dividend of 0.3¢ per share, CHF 40, which was paid in April.
3:19 Given the full year results and the importance of preserving capital to support the operational reset of the business, the Board has determined not to declare a final dividend in FY 'twenty '6. Importantly, the issues we faced are well operational and within our control, and the corrective actions are beginning to deliver visible progress. Customer activity remains robust, with the exception of North America. We closed FY 'twenty six with an order book of $132,900,000 and have secured a further $32,000,000 of orders since one July 'twenty six. That activity, together with stronger cash generation and reduced net debt, provides a firmer platform for financial year 'twenty seven.
4:13 I can move on to slide nine. Slide nine sets out both the financial year 'twenty six performance across our three segments and management's response. The important point is that we understand the issues, have acted on them and are seeing early evidence of improvement. In South America, the commercial and operational reset is underway. In North America, productivity, outsourcing and second half margins improved. In APAC, bucket and spare parts growth continued to support resilience. In South America, our EBITDA loss increased to $9,300,000 primarily driven by the legacy OEM contract and operational inefficiencies.
5:01 To address this, we have reset that commercial arrangement, put new management in place, and are implementing labor and production controls. In North America, EBITDA came in at $9,500,000 impacted by product mix, productivity and high outsourcing costs. Our actions here include running a targeted productivity program, reducing contractor reliance and adopting welding technology. Looking at APAC, EBITDA was $24,900,000 with lower trade volumes partly offset by growth in buckets and spare parts. Our focus is on accelerating bucket growth, diversifying our product and geographic mix, and improving margin discipline.
5:53 Whilst the FY 'twenty six earnings results was disappointing, the stronger cash outcome and reduced net debt gives us the capacity to execute the recovery plan. The focus now is disciplined delivery and converting the actions already taken into improved earnings. If I turn to slide 10, I will briefly explain the causes of the South American result, then focus on the actions taken and why we believe the business is positioned for improvement in FY 'twenty seven. As previously communicated, the Chilean business took on a large OEM contract in financial year 2024. The operations was not adequately prepared for the required volume increases or the different manufacturing requirements of the OEM specifications.
6:48 This affected labour productivity, steel utilisation and facility efficiency. To meet delivery requirements, some production was shifted to Baikal. Whilst this addressed an immediate capacity constraint, it also extended the margin impact beyond Chile. The financial impact has been significant. The OEM contract generated $21,000,000 in revenue for financial year '26, but delivered a negative EBITDA of $5,700,000 translating into a negative 27% margin. The total regional EBITDA loss for South America was $1,300,000 for the full year compared to a loss of $1,700,000 in financial year 'twenty five.
7:39 We have taken decisive action. The OEM contract was renegotiated in March 2026 with improved pricing and payment terms, and delivery under these revised terms commenced in late June. These terms are expected to improve the contract economics. Other key actions taken include: a new management team is in place, supported by the North American team, to improve labor utilization and production consistency. The workforce has been right sized and part of production governance has been established. We have gained control over our steel yard and processes to manage steel utilization. Chile is firmly in recovery mode. The order book stands to the end of the current calendar year with further demand expected.
8:32 There is more work to do, but the revised commercial terms, new management structure and stronger operating controls position the business for improved performance in financial '27. Turning now to slide 11. I want to spend a moment on North America because this is where we have seen some of the most tangible early progress from our operational improvement program. North America provides a clear example of the early benefits from our operational improvement initiatives. Productivity improved from 62% in July 2025 to approximately 80% in the final quarter of financial year 'twenty six.
9:19 This reflected workstation KPIs, improved planning and scheduling, standard work instructions, and a deliberate shift away from contractors towards permanent workforce capability, supported by our internal well school and training programme. Outsourcing also reduced materially. Full trade bills outsourced fell from 33 units in financial year twenty five to 17 in the first half and just three in the second half of financial year
9:53 Improves production control, supports capability and provides a stronger platform for margin recovery. North American margins improved to 9.5% in the second half from 5.8% in the first half. While further progress is required, this is measurable early evidence that the initiatives are taking hold. North America enters FY 'twenty seven with further efficiency gains targeted and a stronger operational foundation from which to rebuild earnings. I'll now hand over to our CFO, David Bonamini, to go over the financial results in more detail. Thanks, Zai. Good morning, everyone. I'll start with the group's profit and loss performance, and I'll cover results by region before moving to the cash flow and balance sheet.
10:51 Turning to Slide 13, group performance. Group revenue for the full year was $329,000,000 down 12.7%, reflecting lower activity across all regions. APAC was impacted by softer trade volumes, North America by lower trade sales and product mix, and South America by the capping of the OEM production. EBITDA declined by 52.5% to $20,400,000 This was driven by the $9,300,000 loss in Chile, as I referred to, an 8,800,000 reduction in North America profit from productivity and operating issues, and an $8,300,000 decline in APAC from lower trade volumes, partly offset by Australia's margin improvement from the bucket growth.
11:43 EBITDA margin was 6.2% from 11.4% in the prior year. Depreciation and amortization was broadly stable at $9,700,000 compared to $9,900,000 in the prior year. EBIT was $10,800,000 down 67.5% from $33,200,000 with EBIT margin at 3.3. The effective tax rate across the group was 18%, with tax expense recognized primarily in The U. S. And Indonesia. Net profit was CAD7.6 million, down from CAD27.7 million in the prior year. The decline reflects lower EBITDA, partly offset by lower depreciation, interest and tax expense.
12:30 I would note that the statutory profit numbers include net material items of 4,200,000 compared to CAD14.2 million in FY 'twenty five. Turning to Slide 14 and the revenue and EBITDA charts. You can see the group's revenue growth trajectory from $2.00 $3,000,000 in FY 'twenty two through to $377,000,000 in FY 'twenty five, and then reaching $329,000,000 in FY 'twenty six. Looking at the revenue by region. APAC revenue fell 15% to $147,000,000 largely due to the timing of the major trade orders, which were partially offset by the growth in the Australian bucket sales.
13:16 North America revenue declined 13.5% to $127,000,000 driven by lower trade sales, customer replacement cycles and product mix. South American revenue was down 3% to CAD54.9 million, impacted by the cap on the OEM production and offset by an increase in service revenue. Turning to the EBITDA chart. APAC EBITDA was CAD24.9 million at 16.9% margin. The decline was driven by lower trade volumes, partially offset by stronger Australian bucket performance and spare parts growth. North America EBITDA was CAD9.5 million, impacted by the decline in trade volumes and product mix, product inefficiencies, facility bottlenecks and the cost of the contract labor and third party contractors.
14:08 South America's loss widened to $9,300,000 from $1,700,000 in FY 'twenty five, impacted by the loss making OEM contracts, higher labor, contractor and steel costs. While the full year performance was weaker year on year, APAC remains the largest contributor and improved in the second half. North American margins are recovering, and Chile is positioned to improve materially in FY 'twenty seven with the contract reset and the new operational controls in place. Turning to Slide 15, cash flow. Cash flow was a highlight for the year and demonstrates the discipline we have embedded across the business. Operating cash flow increased significantly to million, an improvement of CAD24.1 million on the previous year's CAD22.6 million.
15:02 This was driven mainly by the unwind of working capital, particularly the CAD32 million reduction in inventory. EBITDA to free cash flow conversion improved materially to 99% for the full year, a significant achievement given the earnings decline. Capital expenditure was $6,800,000 down from CAD9.9 million in FY 'twenty five, supporting upgrades to U. S. Facilities and operational equipment across the business. Free cash flow after interest, tax and capital expenditure was CAD19.9 million compared to a negative 5,700,000 in the prior year, which is an improvement of 25,600,000. The cash position was used to fund payments of dividend payments of 7,100,000 and CAD1.2 million share buyback during the year.
15:52 The group closed the year with CAD17.1 million in cash, with the reduction reflecting return on capital to shareholders through dividends and buybacks. Despite the lower EBITDA, the group delivered significant improved cash performance, demonstrating that working capital discipline and the financial controls we have embedded are delivering tangible benefits. Turning to Slide 16, financial position. The balance sheet remains strong, with total assets of $251,000,000 and net assets of 134,000,000 Net debt was reduced to $5,800,000 from $12,800,000 at the end of FY 'twenty five, and the net debt to equity ratio is now 4.1, down from 8.2% in June 2025.
16:40 Working capital movements included: inventory decreased by CAD32.2 million or 37% to CAD55.7 million. This reflects the improvement in inventory management and the deliberate unwind of elevated stock levels. Receivables and contract assets decreased by CAD10.3 million or 14% to CAD61.7 million. Payables and provisions decreased by CAD21.9 million from the Ausbio Steel and US supply payments, while customer advance payments decreased by CAD4 million, with US advance payments down CAD10 million during the year. Overall net working capital decreased by 26.1 to £50,600,000 I'll now hand you back to Zoe.
17:27 Thanks, David. And I'll move on to provide an update on the performance of our regions. So first, looking at Asia Pacific on Slide 18. APAC was our largest revenue generating region, contributing 44.7 of group revenue and continued to be the cornerstone of profitability for the group. The Australian bucket business was a real standout, delivering a $17,400,000 revenue uplift and growing from 10% of APAC's product revenue in FY 'twenty five to twenty six percent in FY 'twenty six. We also continued to diversify our customer revenue mix, with 51% of work now sourced from outside single customer relationships.
18:16 This is an important strategic milestone. Pleasingly, profitability improved in the second half to 18.7%, up from 15% in the first half, reflecting operational improvements and disciplined execution. The order book strengthened through the year with demand increasing in the second half. Together with continued bucket growth, broader customer exposure and stronger demand conversion, that supports our confidence in the APAC outlook for FY 'twenty seven. On to slide 19 and North America. Despite the revenue decline this year to 127,000,000 North America remains a significant contributor at 38.6% of group revenue.
19:07 The revenue decline of 13.5% was driven by customer replacement cycles, deferrals and product mix, with all the levels softer than expected. I have covered already the operational improvement plan we are executing, improving workshop productivity, increasing production flow and reducing dependency on external contractors. The results are showing productivity improved from 62% to 80%, while outsourced assemblies dropped from 33 units in FY 2025 to just three in the second half, and margins improved from 5.8% in the first half to 9.5% in the second half.
19:53 Underlying customer activity is currently soft, with our order book down year on year. With productivity improving, outsourcing materially reduced, and more work being bought in house, North America is better positioned to convert demand into improved margins and earnings. Looking at South America on Slide 20. Revenue was CAD54.9 million, broadly in line with the prior year, but the financial performance was significantly impacted by the challenges with the OEM contract I outlined earlier. As I mentioned, the OEM contract was renegotiated earlier in March, with improved pricing and payment terms and deliveries under the new terms commencing in late June.
20:42 A new operational improvement plan has been implemented, with the new management team supported by the North American team rolling out CASPER's operational improvement processes and practices. The order book extends to the end of the current calendar year, with further than mine expected. Our focus is now on disciplined execution under the revised contract terms and converting stronger operating controls into improved financial year 'twenty seven performance.
21:13 Turning to slide 22, our strategy on the page. Our strategy remains focused on margin recovery, customer growth and product differentiation. We will continue to advance our strategic priorities, which are anchored by three operational pillars: manufacturing leadership, product leadership and customer care. Under product leadership, we continue to design and engineer products that meet the changing needs of our customers for productivity and efficiency gains. Mining bucket sales are growing across the group, including for dippers. Our Oz IQ digital product has been launched and we continue to develop our digital systems capability.
22:06 On the customer focus, we have invested in our sales teams, increasing marketing activity, and expanded customer support personnel in Australia and Chile. And in manufacturing leadership, we are introducing common operating systems across the business, implementing standard work instructions and embedding disciplined KPI management. An important proof point is the traction with new customers. During FY26, new customers across Africa, The Middle East, India and North America contributed $12,000,000 in sales and established a further $40,000,000 sales pipeline. This demonstrated the opportunity to broaden our customer base and convert our global footprint and product capability into growth.
22:59 Turning to slide 23. This gives you a good picture of the breadth of our revenue base, and I think it's an important slide from the content of the full year results. Looking at the commodity mix, copper and iron ore each stood at about 25%, and met coal exposure has grown from 9% to 15%, while gold has come back from 15% to 8%. On the product side, bodies remain our largest category at 62%, and I'm pleased to see buckets growing from 6% to 10%, and other products and parts moving from 4% to 10%. And on the customer side, miners represent 83% of our revenue, broadly consistent with last year and reflects the depth of our relationship with our major operators.
23:54 Our OEM channel holds steady at 8% and remains an area of ongoing opportunity for us. The key takeaway is that Austin has diversified revenue across commodities, product and customer time.
24:10 Combined with the growth in buckets, other products and parts, this provides resilience and creates multiple avenues for growth. Now turning to our final slide, slide 25, which also provides guidance for FY 'twenty seven. Austin's strategic fundamentals remain strong. Our global footprint, diversified commodity exposure and design lens solutions position us well to support customers looking for productivity and efficiency gains. The operational improvements undertaken in financial year '26 provide a clear pathway to improve earnings. Each region has specific measurable improvement drivers for FY '27.
24:58 In Chile, the OEM contract reset with improved commercial terms and stronger operating controls is expected to drive margin recovery. In The US, it is about productivity, recovery and lower outsourcing, with the order book expected to strengthen across financial year 'twenty seven. In APAC, we are looking at continued bucket growth, diversified revenue and a stronger demand conversion. Meanwhile, at a group level, working capital discipline, cost control and embedded operating KPIs will continue to support cash generation and financial flexibility. Looking at our guidance, we expect FY 'twenty seven underlying EBITDA from continued operations, excluding foreign exchange movements, to be between 17,000,000 and $21,000,000 We expect the improvement in EBITDA to come from actions already underway, revised contract economics and stronger controls in Chile, productivity and outsourcing improvements in North America, and bucket growth diversification and demand converters in APAC.
26:16 As we wrap up, I want to reiterate the key messages from today.
26:22 FY 'twenty six was disappointing earnings year, and we are and we are understating the workflow required. However, the causes are understood, the issues are within our control, and the signs of correction action has already been taken. Austin's strategic fundamentals remain strong. Our global footprint, diversified commodity exposure, design led products, and growing customer pipeline position us well to support customers seeking productivity and efficiency gains. We enter FY twenty seven as a leaner and more disciplined business with stronger cash generation, reduced net debt and a clearer operational foundation.
27:09 Our focus is to convert this platform into improved earnings and sustainable long term growth. With that, David and I are happy to take any questions you might have. Thank you. So I will now begin the question and answer session. To ask a question, you can either raise your hand and we'll unmute your microphone, or you can submit a text question and we'll read that out.
27:35 In order to raise your hand, you can use the hand icon which is marked as react. In order to submit a text question, you can do so through the question function which is a square icon with a question mark. Your first question comes from Mike Mannell, and I'll just unmute Mike now. Mike, if you'd like to unmute, you can ask your question now. Okay. Sorry. Yeah. My my microphone has been turned off. Okay.
28:23 Right. First of all, big thanks to Sai and David for the briefing. You will recall that you had a briefing for shareholders a couple of months ago, and it was very well received by all of us, both those who listened in and those who later read the transcript. And you made a commitment to shareholders to continue these briefings. So they very much appreciate it and look forward to. I think sometimes senior management and companies lose track or lose perspective of their shareholders.
29:09 Now I'm a retiree who has invested most of my money into the Australian stock market, and there are tens of thousands of people like me. And we communicate on various platforms and share share information, etcetera.
29:28 And I just want to emphasize and a a large percentage of us actually specialize in small and micro caps such as Austin, which has a market cap of only about $100,000,000. Now two comments. First of all, unfortunately, the vast majority of the these small micro caps all wait to present their results till the very last week or few days of the reporting season. And in Austin's case, I can understand this to some extent, because, obviously, you wanna give us a a a pretty current update on the amount of orders for the for the forthcoming financial year. That's fine. But what I would like you to do going forward is not have the briefing right on market open because in my case, I've got two other companies, one of which has a briefing, but we've and I know one other person on Hot Copper wrote the same thing this morning. We try to read three or four company reports in the hour going into open, and then we have to choose which briefing. So if you pushed it back to, say, one hour to 11:00 Sydney time, it would make it a lot easier for us to read reports, get our head care, and time to to to write down those questions. So I have got a question for you. And, yeah,
30:58 we simply cannot have too much communication. If you think something's not that important, put out a little note on on on the Internet about it. It'll be read. We read every word. Every damn word we read. So trust me. It's not a waste of space. Okay. I was gonna ask you about North America, but when I saw one of the the latest slides, where you it's a new thing that you're doing, and it's very, in my my estimation, very important, is you break down by commodity where our business is, and you also break it down by client. And I've been a shareholder of Austin for a large number of years, and I had expected that mining contractors were a big part of our business. I mean, how many there are hundreds of mining contractors here in Australia. Some of them I'm sorry. Just a few other questions in the queue. So if you could just maybe take another question.
32:03 My question is, I was shocked to see mining contractors made up only 1% of Austin's business. Why is it so low, and are you planning to target these contractors in a better fashion? Thanks, Mark. Thanks for your question. I guess it's reflective of mining contractors normally buy bodies that can operate across multiple sites because they normally move their equipment from site to site. So if you look at Austin's clients and clients that it's exposed to, it's normally exposed to clients in what I could call bulk commodities, where there's a lot of dirt being moved at once.
32:57 So you look at the iron ore, copper, oil sands and coal is normally where there's a big bucket portfolio. And some of our clients have gone to incredible lightweight because they actually operate that site for a very long time. It's not that we don't have any exposure to mining contractors, but it's normally that they buy bodies that last much longer, they're heavier, and then they actually compromise weight for longevity, if I can say it that way. There's other clients that do that, so they don't perform a mainstay of Austin's business. I hope that answers your question. Your next question comes from David Morton and he's asked, with Australian bucket revenue growing strongly and the Australian operations being increasingly integrated, how are you thinking about manufacturing capacity and the optimal configuration of the Mackay Paget footprint across MainTech and Osborne as you scale the bucket and other business practices sorry, other product businesses.
34:12 So if you'd like to go ahead and answer that one. Yeah. So the bucket growth is not just in Main Tech. It is actually in Tewdale as well. So our Cudale facility or birthplace facility is probably the bigger of the two entities when it comes to new buckets and repair of buckets. We also have BuyTime that does buckets and differs and is used for overflow. The challenge is not more the footprint is probably the easiest thing to resolve, The more challenging aspect is actually getting the people and ensuring we actually use automation to scale up production.
35:03 So I guess we don't have any significant capacity constraints currently for the demand we have on our books for the Australian operations. Your next question comes from Bruce. He's asked, in regard to bodies, do you think you've been losing market share or do you think the market has decreased? No, we don't think we've lost market share. It's just that the market goes through, I guess, cycles. And if you look at APAC, it came down slightly, but that's all with one major client. We've got a major exposure to one significant Tier one client in Australia, so they've just bought slightly less this year than last year, and that happens.
36:06 North America, that has seen a significant decrease in both buckets or trays as well as our order book, and I think that is multifactorial. I think it's definitely cyclical. Product mix, we can't underestimate the impact of product mix on our revenue lines. And to give you an example, we can sell a body for one client in North America at a certain size for about $350 and another client $700 So one body doesn't necessarily the same outcome, That's based on size and complexity of that body, if it's got heated channels, if it's got chrome ordering, etcetera.
36:57 So that plays a big impact. But to answer your answer, no, we do not believe we have lost market share. Okay. Your next question comes from Oliver Porter, and I'll just unmute his microphone now. Hi. Sorry, David. Have got me? Yes. Yes. Yeah. Thanks for taking my question. I'll I'll keep it quick. Just wanted to ask after those first deliveries in June under the renegotiated OEM contract, have those been received and how's that relationship as it stands? Relationship is strong. Like I said, we've got that OEM have actually placed orders for us until the calendar year, the end of this calendar year.
37:47 And if we could supply them more, they would like to take on more, we're obviously making sure we effectively crawl, walk and then run. So we actually are planning to upscale production throughput in Chile, but we need to do so in a controlled manner. But the relationship is strong and there is no issues with that relationship. Right. And then the so the free cash flow print was great. It was helped a bit by working capital release. Do you expect some of that to reverse into '27 as you return to growth? Or you you make a point of focus on working cap management? How do you think we should think about that into '27?
38:34 There's no doubt there's two parts of that working capital. Significant part is a reduction in work in progress, which is there's two elements to that, is ensuring we try and have a lot more linear or production flow through our facilities rather than trying to rush it all through in before the financial year end, but also probably reflective of, I guess, the cycle we are in right now. We have worked hard on reducing our raw material inventories, and that, again, a there timing element of that. But I think people should look at the raw materials and then look at the customer deposits we carry on our books because we like to try and offset all the work, the raw materials we carry against the cost of the deposits we take, and that roughly is offsetting each other at this point in time.
39:31 Right. Thanks a lot, David. I'll pass it on. Thank you. Your next question comes from Patrick Moore, who said, what did you have to give up or sacrifice to make the change in the Chile OEM contract? Nothing. That one's pretty easy. Let me just maybe elaborate on that. I think in February when we did our results release, we made clear and was a unanimous board decision that if we couldn't reset the OEM contract, we couldn't continue with it because it was a loss making contract for us. So it was from that perspective, the line was drawn in the sand and we had to be profitable to continue with that contract. So we didn't give anything up. It was pretty much saying we shared our results transparently with the OEM. Obviously, we're listed company, they can see it's validated in the market.
40:33 So the negotiations, whilst I wouldn't say pleasant, they accepted their position. Thank you. Your next question comes from Peter Donovan. Please go ahead, Peter. Hi. Sorry, David. Mainly just around you. Obviously, you spoke about kind of expanding into some other geographical spaces, so like Africa, Middle East. Just considering looking forward, how much of this work you think is gonna make up the total order book?
41:27 It's like, the current order book, how much it makes up, that's a good question. Probably, I would say, million to 40,000,000 right now is our current order book for product that is going to go into territories that we haven't operated in before. Yes, thanks. And then also, just in terms of the base business, that any I guess, just in terms of organic growth, kind of the capacity we should look at there and kind of what margins you could would you be able to get back to historical margins you're hoping in the next couple of years? The short answer is we hope we'll definitely need to get back to those margins.
42:14 So if you look at APAC, they actually performed reasonably well. Yes, margins are slightly softer, but that margins were softer more due to the first half performance where we had too many people in Indonesia for the workload, which had the right size, and then we did that 15 cat bodies in Bai Tom, which was a disaster and will never be repeated. APAC actually, with the exception of those two issues, had a solid year, even though they had softer revenue by the solid year. Our US margins is definitely softer and has been softer, but we're working hard on that, and you can see progressively increasing that. Now product mix does play an impact on that, but we are hopeful that in calendar year 'twenty seven, because the North Americans work a lot more on a calendar year basis than a financial year basis with their auto releases, we are hopeful, and that hope is based on discussions with the clients, that we will see a significant increase in the order intake in FY27 with the more bigger, more expensive bodies coming through our workshop, which by default carries a larger margin for us.
43:34 And then in Chile, we are hopeful that with the reset that that business will see a turnaround and move into profitability in the next twelve months. Okay, thanks. I'll pass it on. Thank you. Your next question comes from Martin, who's asked, what is the likely impact for Chile FYE at full year '27? Martin, thanks for the question. We do not give segment reporting. That's probably a slippery slope. As I've said, we are hopeful with the contract reset and the work we've been doing in Chile that business turns around into a profit situation in FY27, but that's probably as far as I'm comfortable to go at this point in time.
44:32 Thank you. Your next question comes from Reese, who's asked, which part of the world and division are you most excited for in the next couple of years? I guess all of them, Rice. I think that's the beauty of the Austin Business Model is that we actually do have a footprint that covers the world. So we've got North America, South America, and we've got the APAC Region, but that APAC Region can support through the BiCarm facility and the access to facilities and work flow can support through The Middle East, Europe, The Spines, as well as Africa. So all of those regions is exciting and we just need to ensure they all perform at the right level.
45:35 Your next question comes from Michael, who's asked, where does your order book stand today compared to the same time last year? And what is your optimal level of revenue given the size of your operations today? Order book is at the end of June, and that's the figures we are quoting. That does mean, obviously, we're always taking an order. It was about 10% softer. With APAC up South America and North America down compared to last year. And that probably demarcation is probably still relevant today if we roll that a little bit forward, but we obviously haven't published that comparative.
46:25 Thank you. Your next question comes from Anthony who's asked, how significant is the future electrification of mining trucks on tray design and production? Very little impact. Trays will stay the same. Automation has very little impact and so is the electrification on trays. There's no real impact. People still would like to have lightweight trays because it's easier to, you can put more payload onto the tray and that's what we do irrespective of if it's a fuel powered, diesel powered truck or electric driven truck.
47:14 And remember, quite a bit of the trucks we do today are electric driven, they just got a diesel engine. So what they'll do is they'll just replace that diesel engine with an electric battery so the outcome doesn't change. Thank you. We're nearing the end of the questions now, so just a reminder to everyone, if you would like to ask a question or a follow-up question, please either raise your hand with the react icon or you can submit a text question. Your next question comes from Ned who said oh, sorry. He's asked, assuming the forecast outcome is achieved, do you envisage returning to paying an interim dividend after first half twenty six twenty seven? Ned, board, obviously that's a board decision and the board will make that decision based on the results at that point in time and the perception of where we need to utilise our capital.
48:16 But as you can see over the last few years, the board has bias to pay dividends and we understand our shareholders would like dividends and we do have quite a large retail book, so that lies heavily in that decision making process. And we also have franking credits to distribute. So the short answer is it's a board decision, but most likely the board will lean towards being fivourable to fight the bills. You, Simon. We've got no more questions or raised hands at this time, so I might hand over to you for any final comments that you'd like to make. Just shortly, thanks again everyone for taking the time to join this morning's call and for your interest in Austin.
49:14 We do appreciate it's a very busy period. We take on those comments that Mike made, and we thank you all for your time and have a good day. Again, if anybody would like to reach out to David or myself, we are available to have a discussion if required. Thank you.
Follow Austin Engineering Limited into a list and get an email when it puts out news.
Chief Financial Officer
Shareholder/Investor
Shareholder/Investor
Shareholder/Investor