Aleris International — Bear Stearns Commodity and Capital Goods Conference November 2007
23 slides from Aleris International's conference presentation, Nov 28, 2007
Slide 1: Bear Stearns Commodity and Capital Goods Conference
Exhibit 99.1 Bear Stearns Commodity and Capital Goods Conference November 2007
Slide 2: Forward Looking Statements
Forward Looking Statements The following information contains, or may be deemed to contain, “forward-looking statements” (as defined in the U.S. Private Securities Litigation Reform Act of 1995). By their nature, forward-looking statements involve risks and uncertainties because they relate to event
Slide 3: Steve Demetriou, Chief Executive Officer
Steve Demetriou Chief Executive Officer
Slide 4: Reported 3Q & YTD Performance Summary
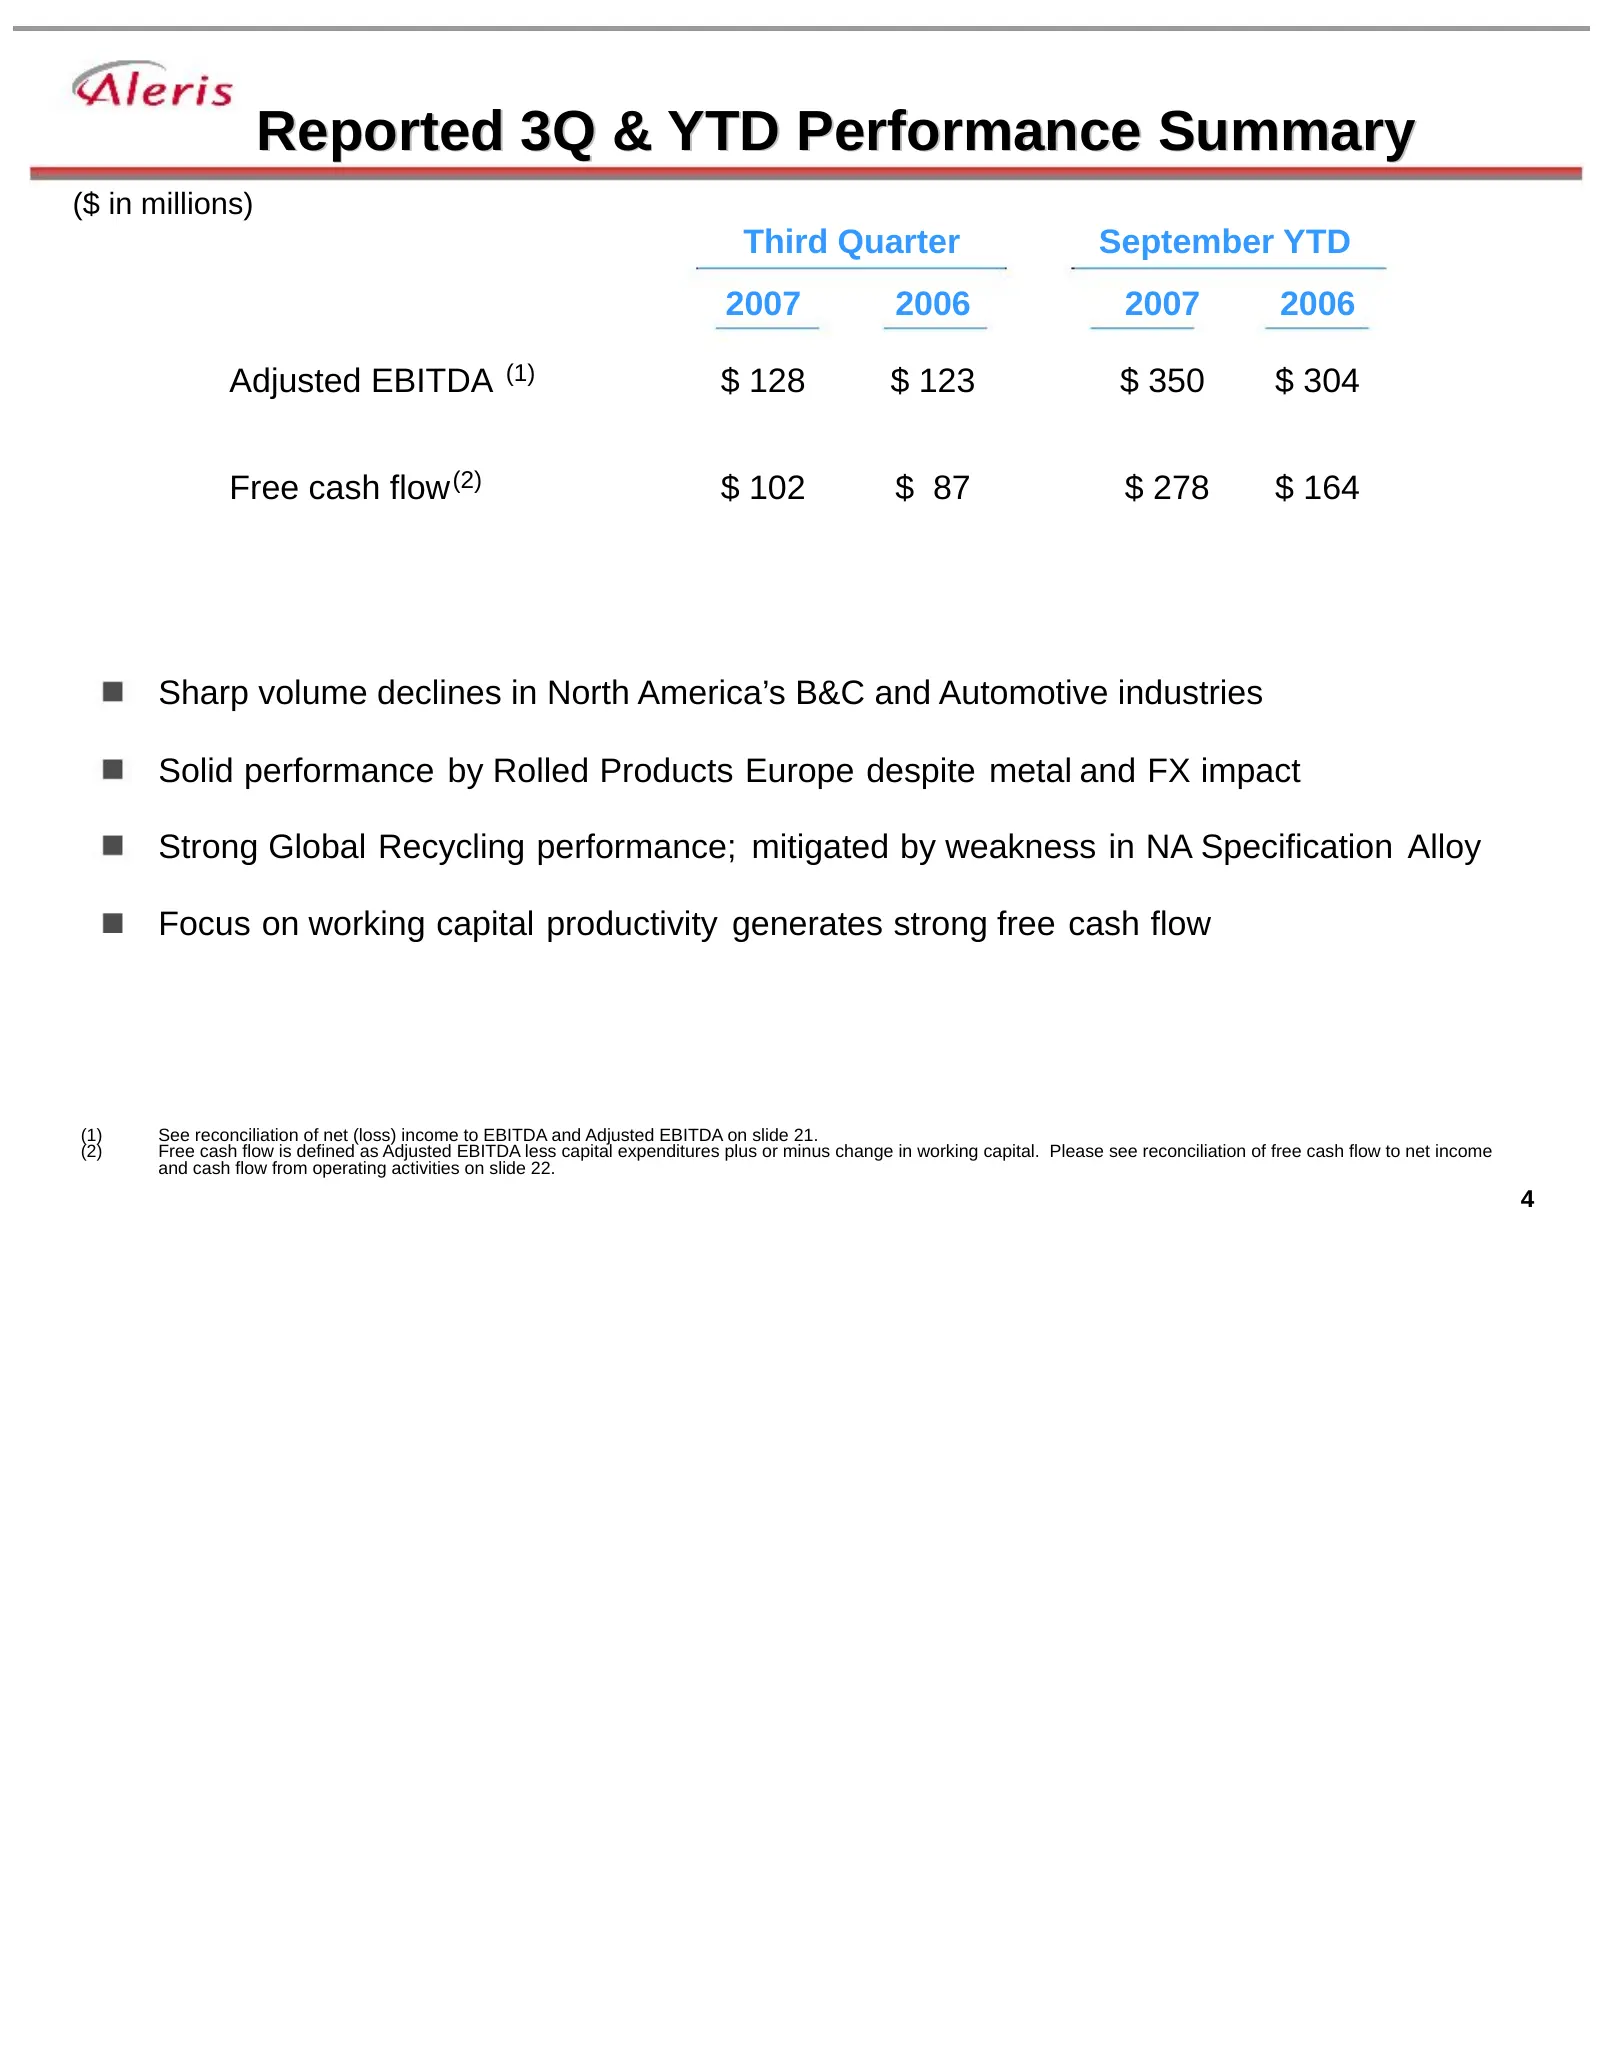
Reported 3Q & YTD Performance Summary ($ in millions) Third Quarter September YTD 2007 2006 2007 2006 Adjusted EBITDA (1) $ 128 $ 123 $ 350 $ 304 Free cash flow (2) $ 102 $ 87 $ 278 $ 164 Sharp volume declines in North America’s B&C and Automotive industries Solid performance by Rolled Products Euro
Slide 5: Sale of Zinc Business Unit
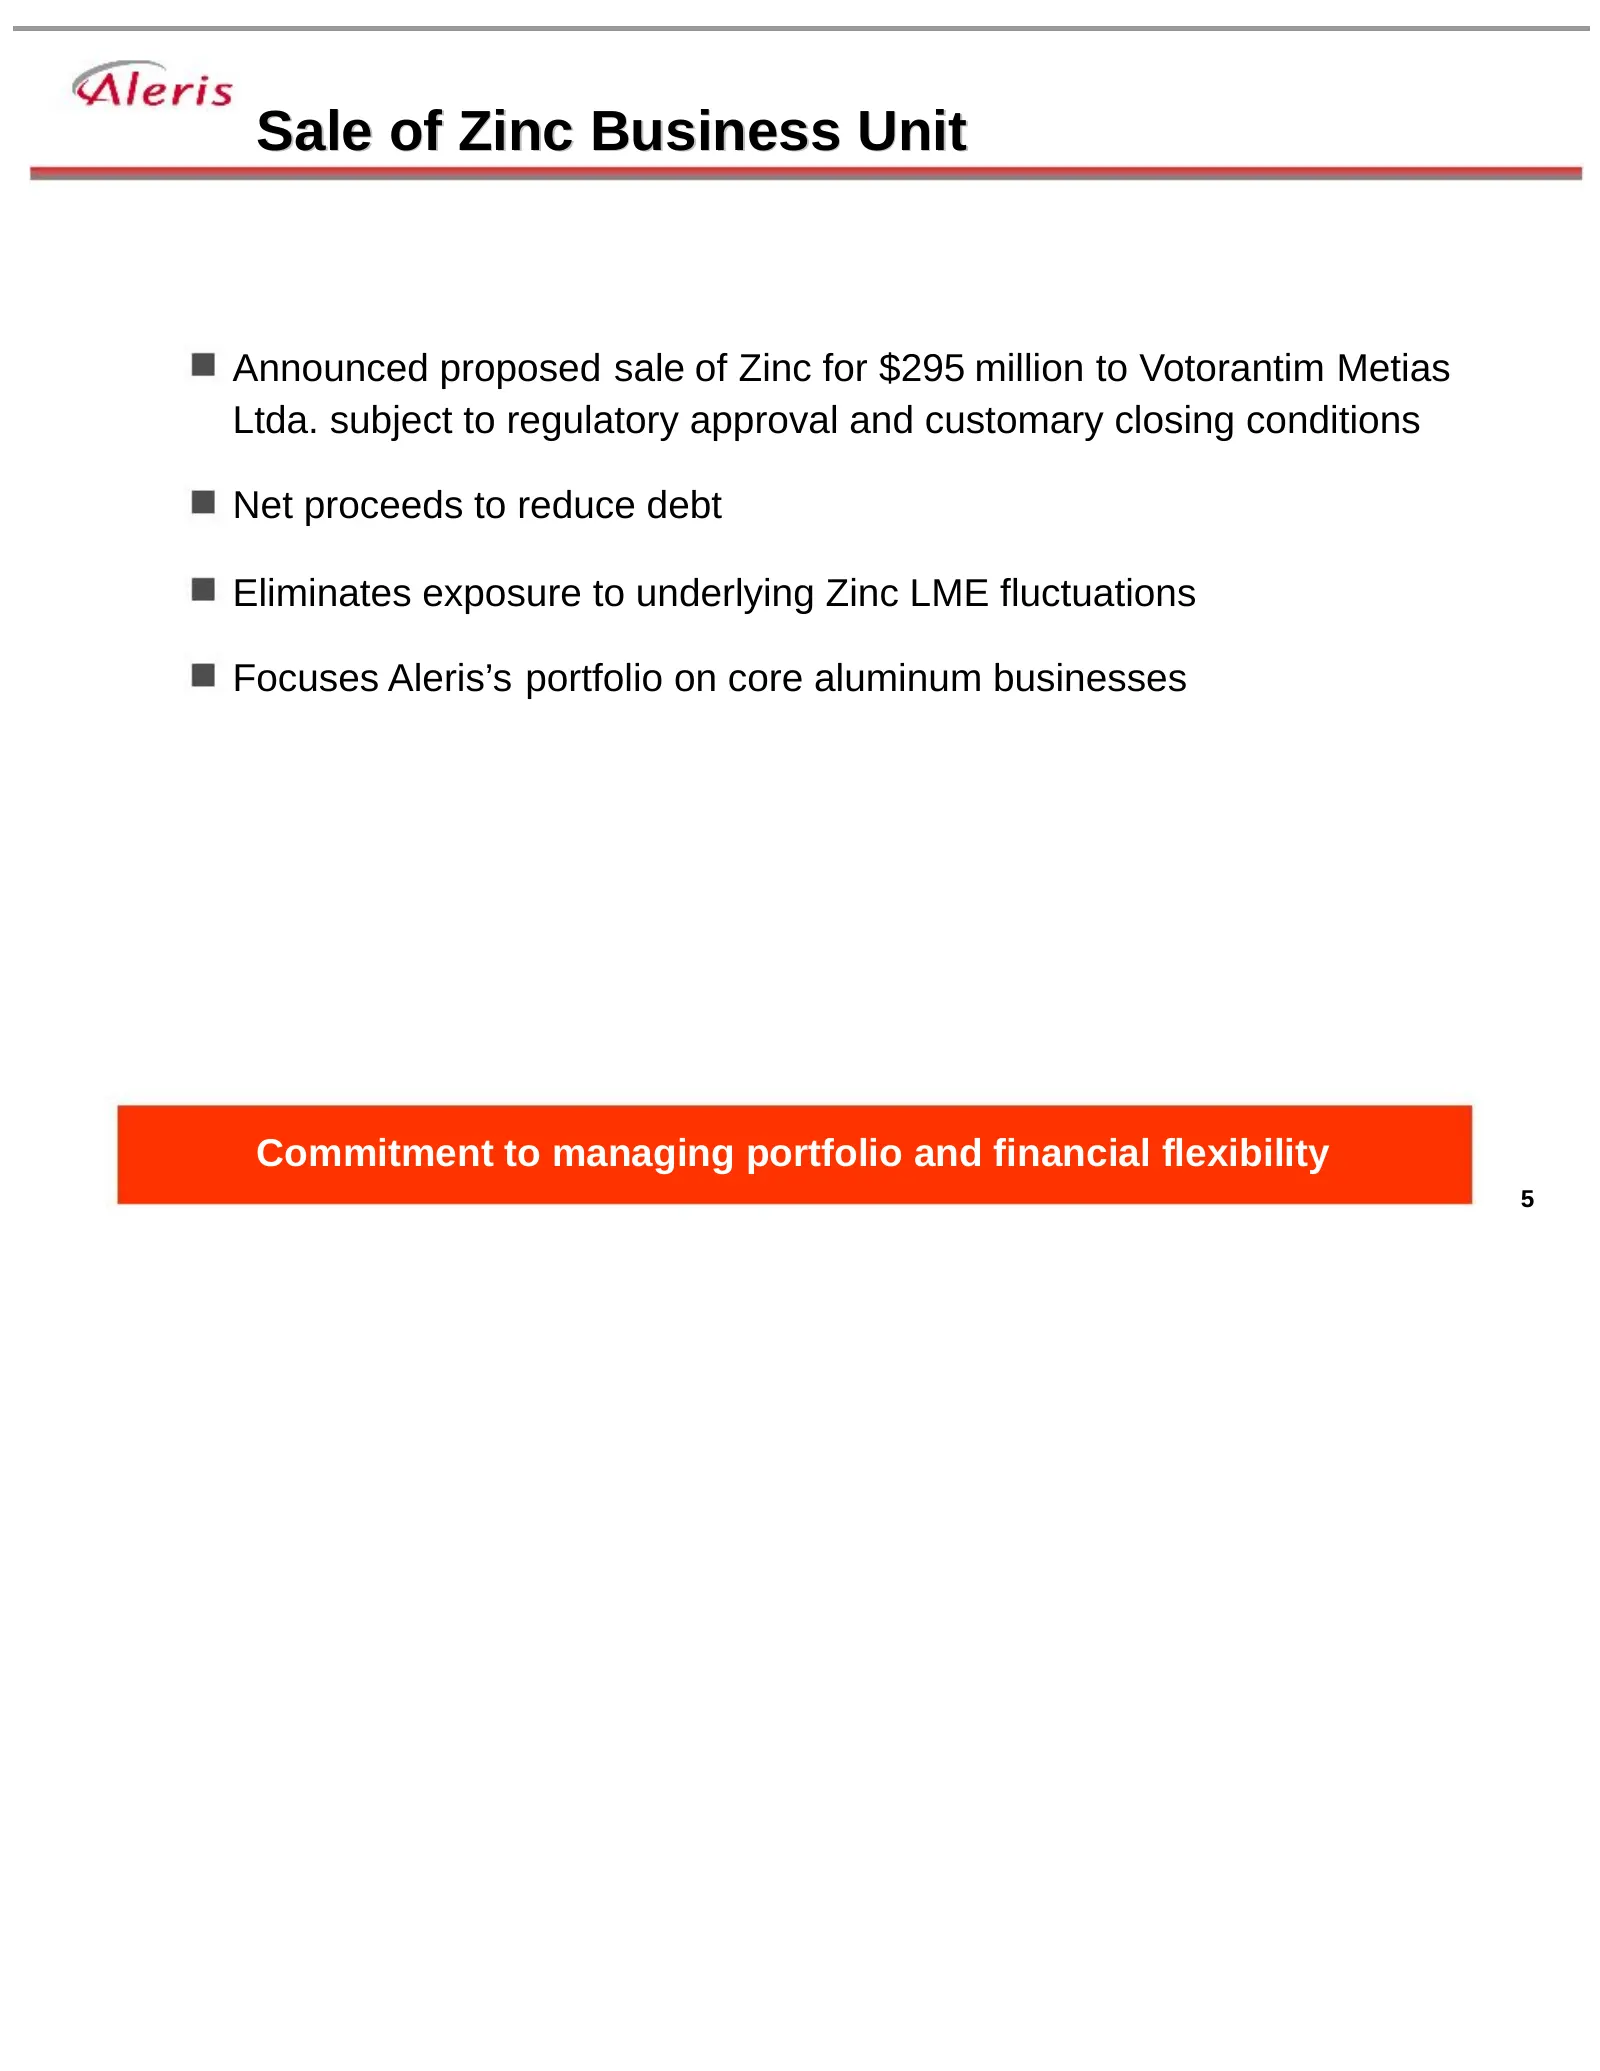
Sale of Zinc Business Unit Announced proposed sale of Zinc for $295 million to Votorantim Metias Ltda. subject to regulatory approval and customary closing conditions Net proceeds to reduce debt Eliminates exposure to underlying Zinc LME fluctuations Focuses Aleris’s portfolio on core aluminum busin
Slide 6: Pro Forma LTM Financial Results, Excl. Zinc
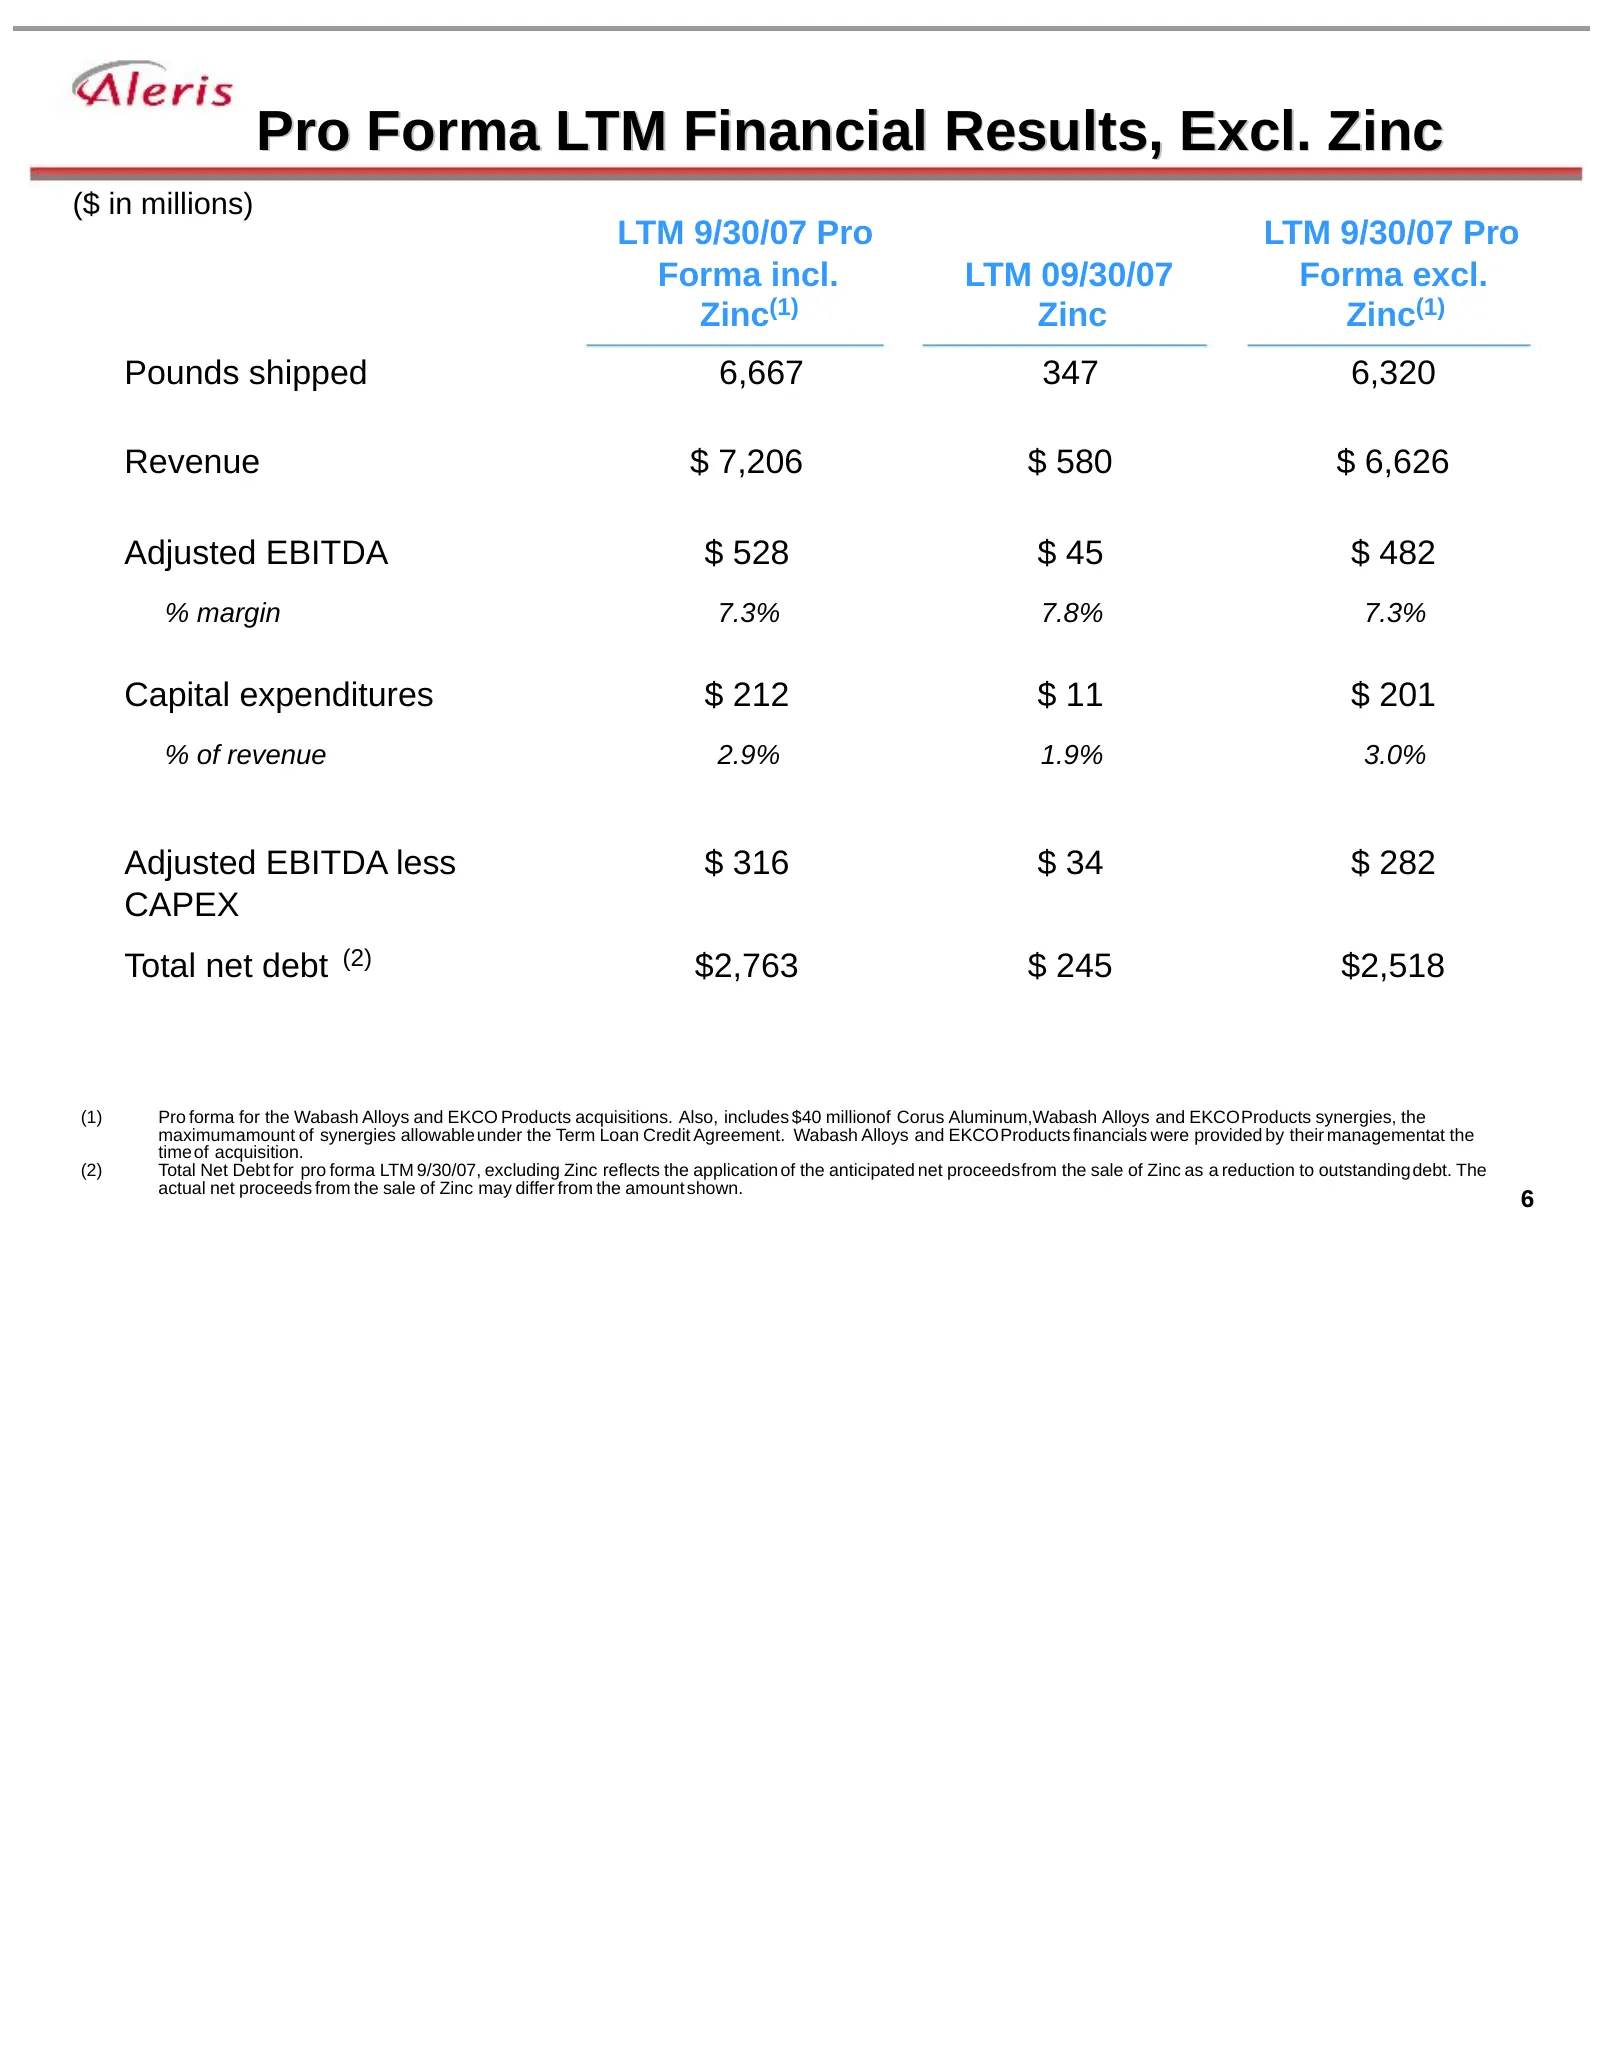
Pro Forma LTM Financial Results, Excl. Zinc ($ in millions) LTM 9/30/07 Pro LTM 9/30/07 Pro Forma incl. LTM 09/30/07 Forma excl. Zinc(1) Zinc Zinc(1) Pounds shipped 6,667 347 6,320 Revenue $ 7,206 $ 580 $ 6,626 Adjusted EBITDA $ 528 $ 45 $ 482 % margin 7.3% 7.8% 7.3% Capital expenditures $ 212 $ 11
Slide 7: Aleris Timeline
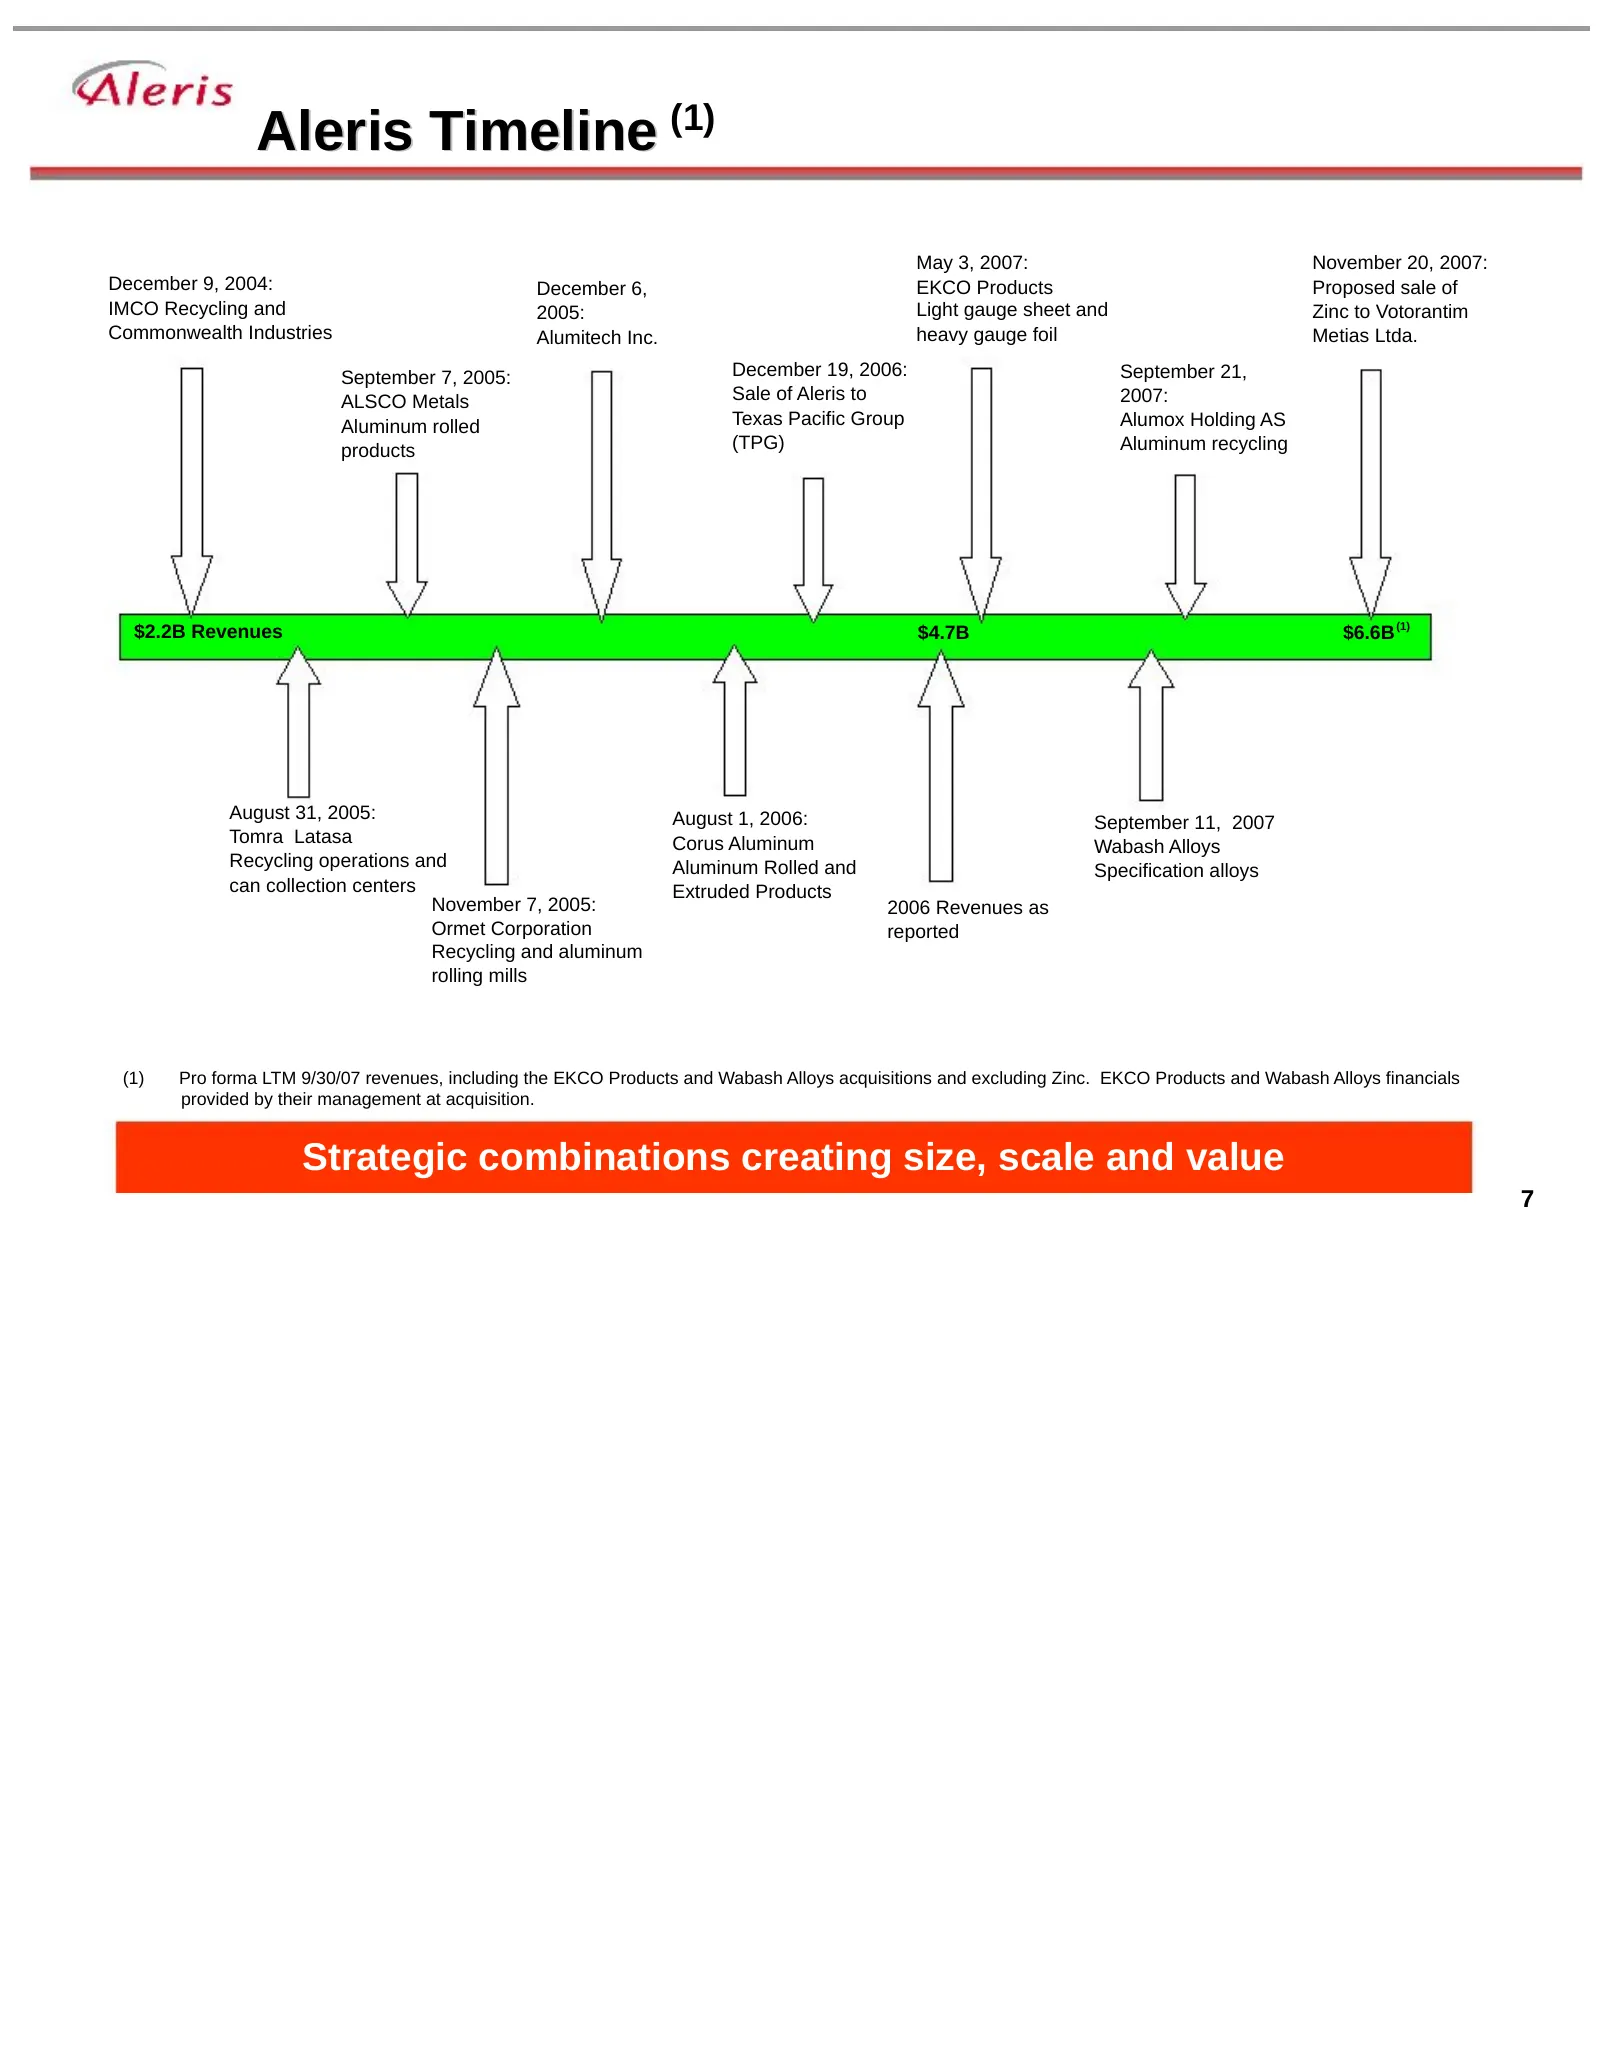
Aleris Timeline (1) May 3, 2007: November 20, 2007: December 9, 2004: December 6, EKCO Products Proposed sale of IMCO Recycling and 2005: Light gauge sheet and Zinc to Votorantim Commonwealth Industries Alumitech Inc. heavy gauge foil Metias Ltda. September 7, 2005: December 19, 2006: September 21,
Slide 8: Pro Forma Aleris
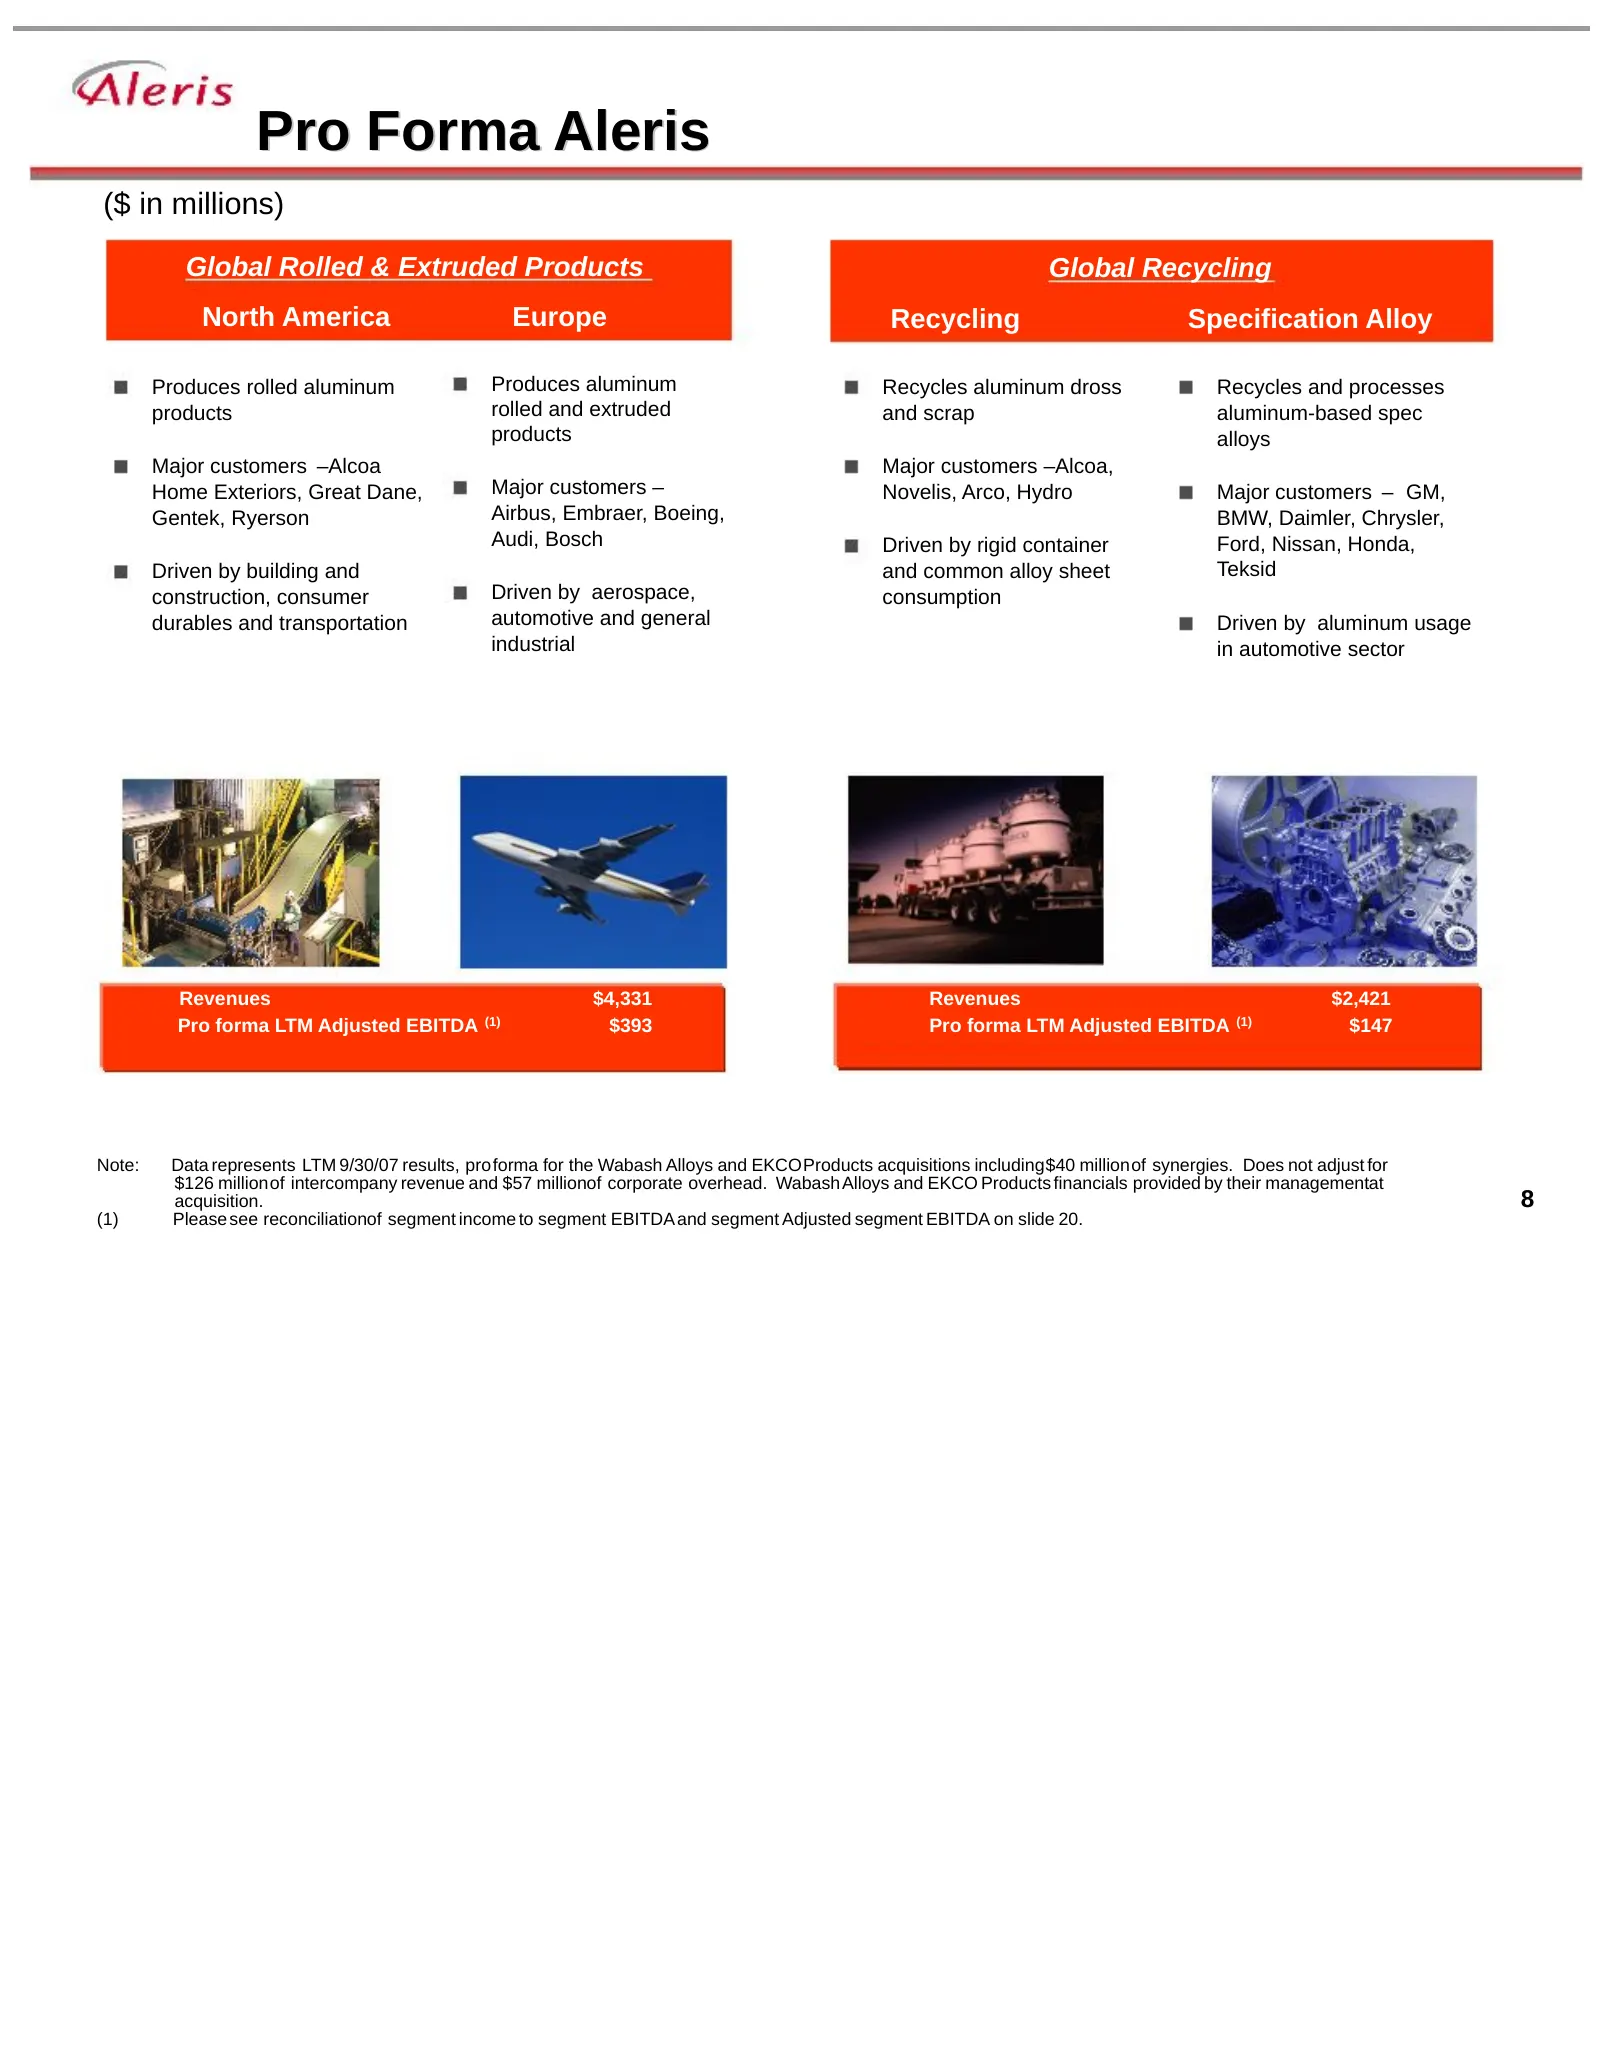
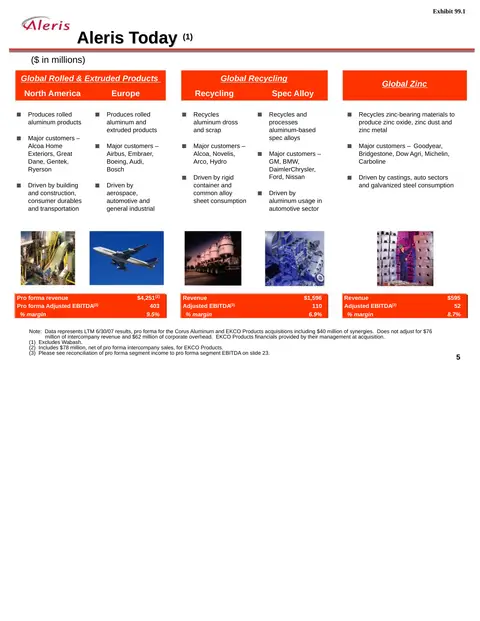
Pro Forma Aleris ($ in millions) Global Rolled & Extruded Products Global Recycling North America Europe Recycling Specification Alloy Produces rolled aluminum Produces aluminum Recycles aluminum dross Recycles and processes products rolled and extruded and scrap aluminum-based spec products alloys
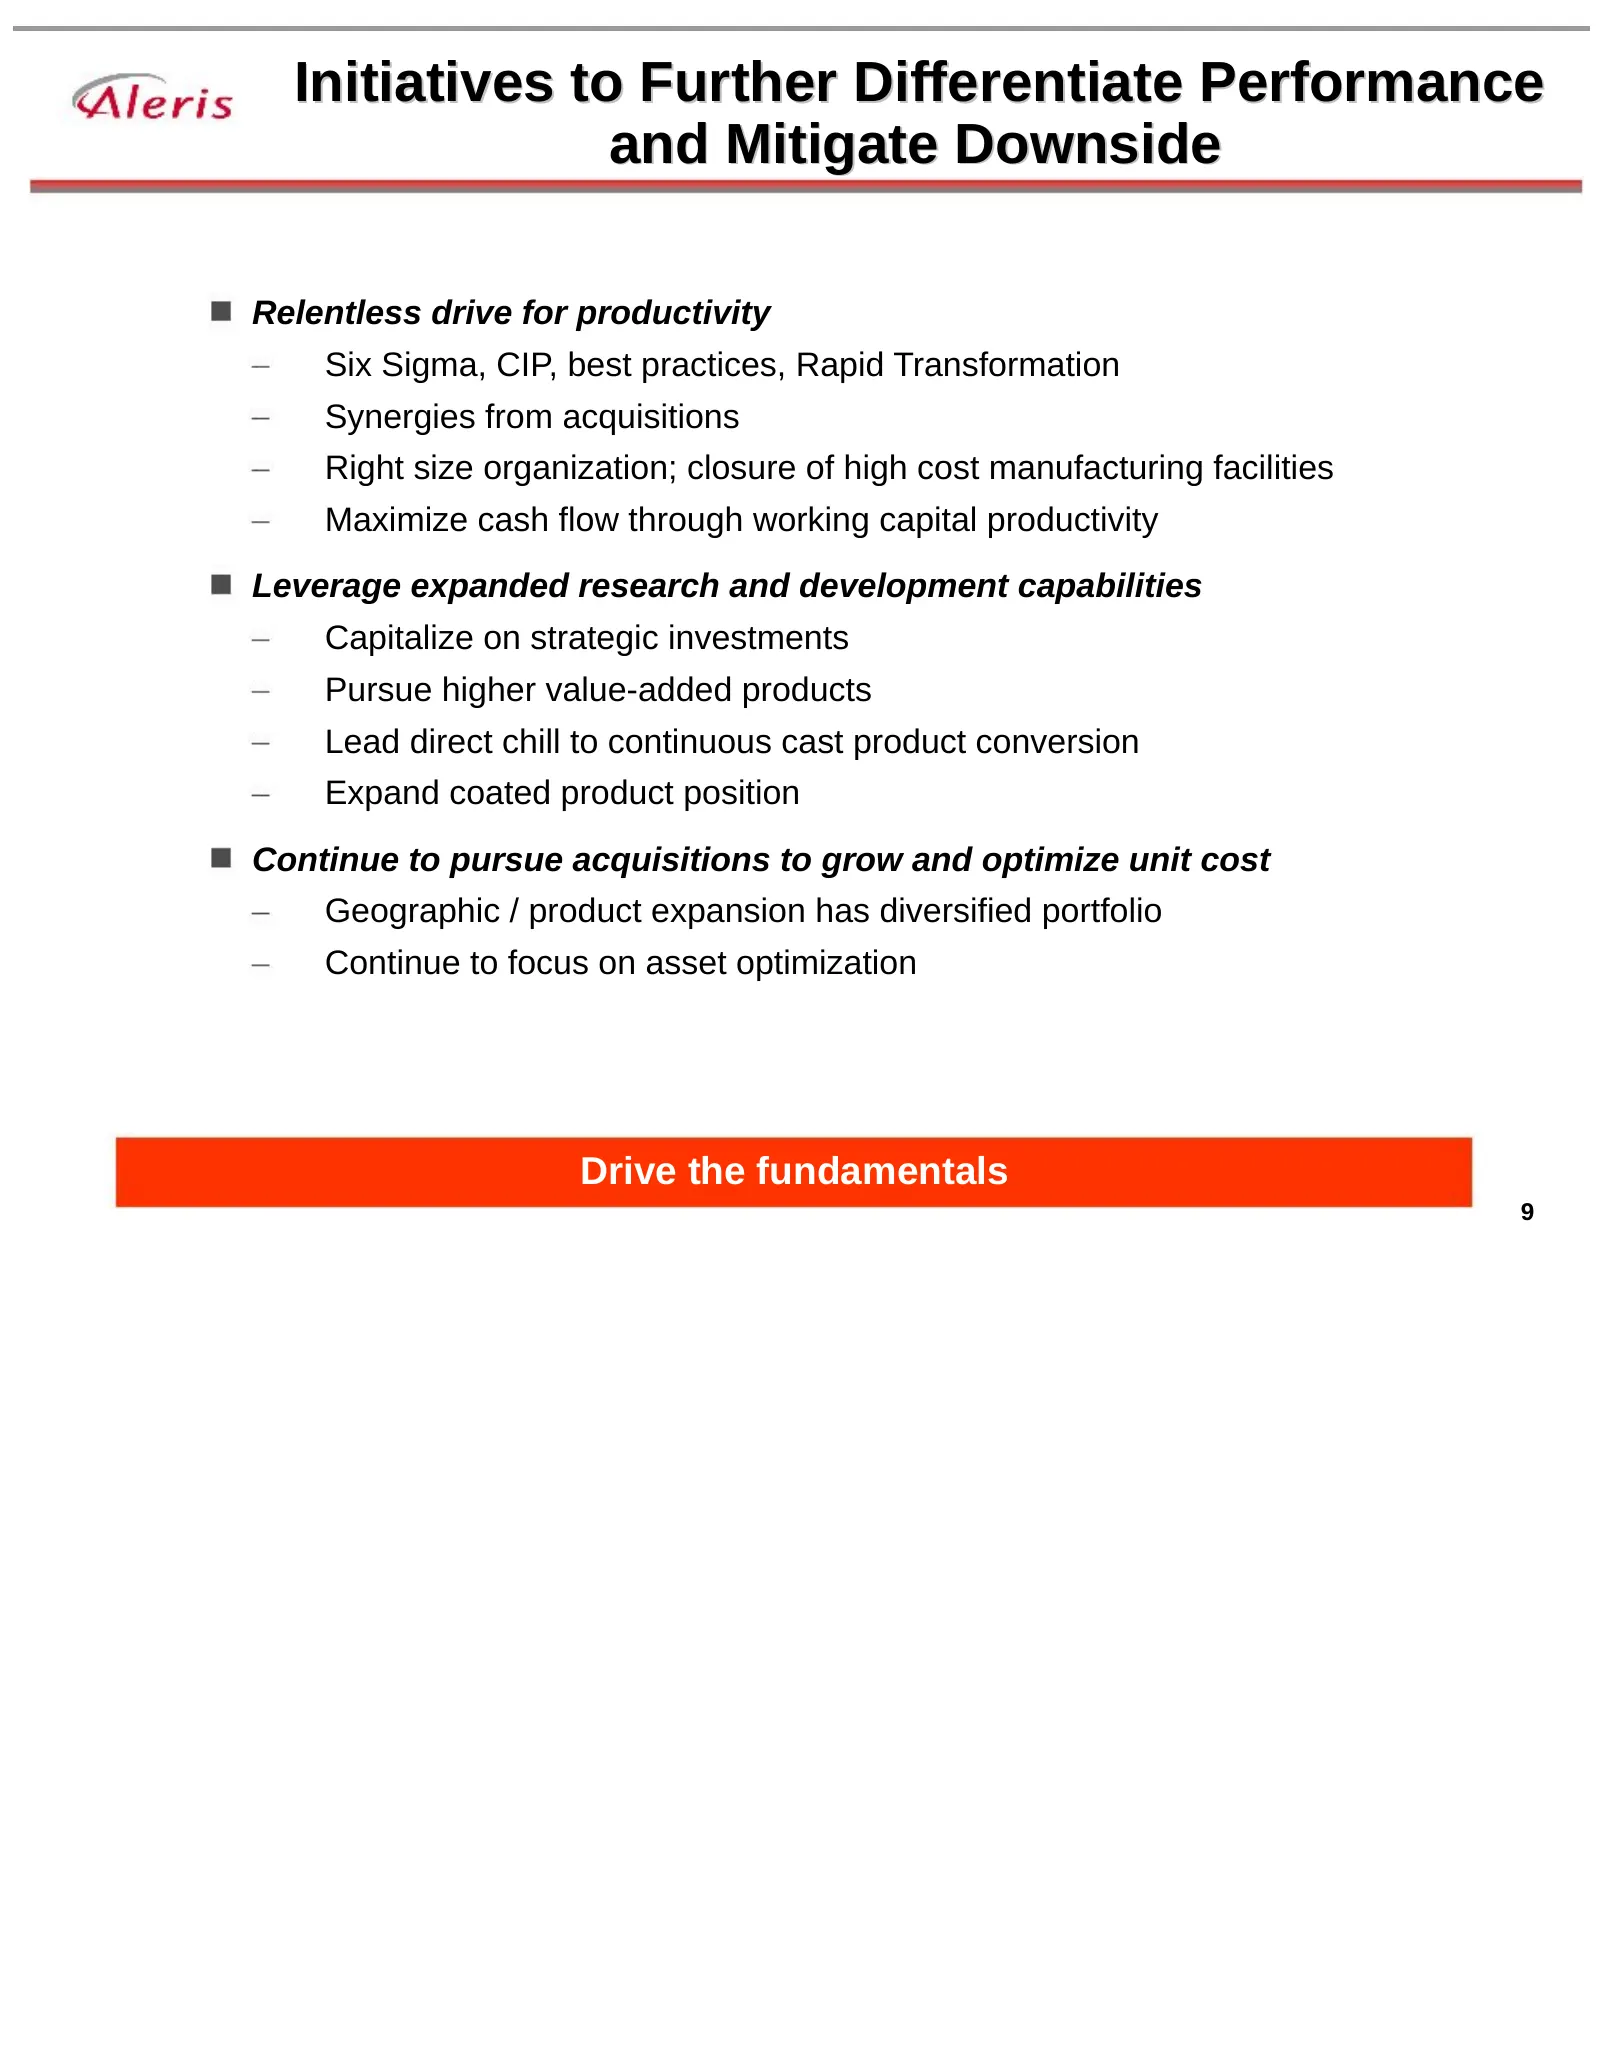
Slide 9: Initiatives to Further Differentiate Performance and Mitigate Downside
Initiatives to Further Differentiate Performance and Mitigate Downside Relentless drive for productivity Six Sigma, CIP, best practices, Rapid Transformation Synergies from acquisitions Right size organization; closure of high cost manufacturing facilities Maximize cash flow through working capital
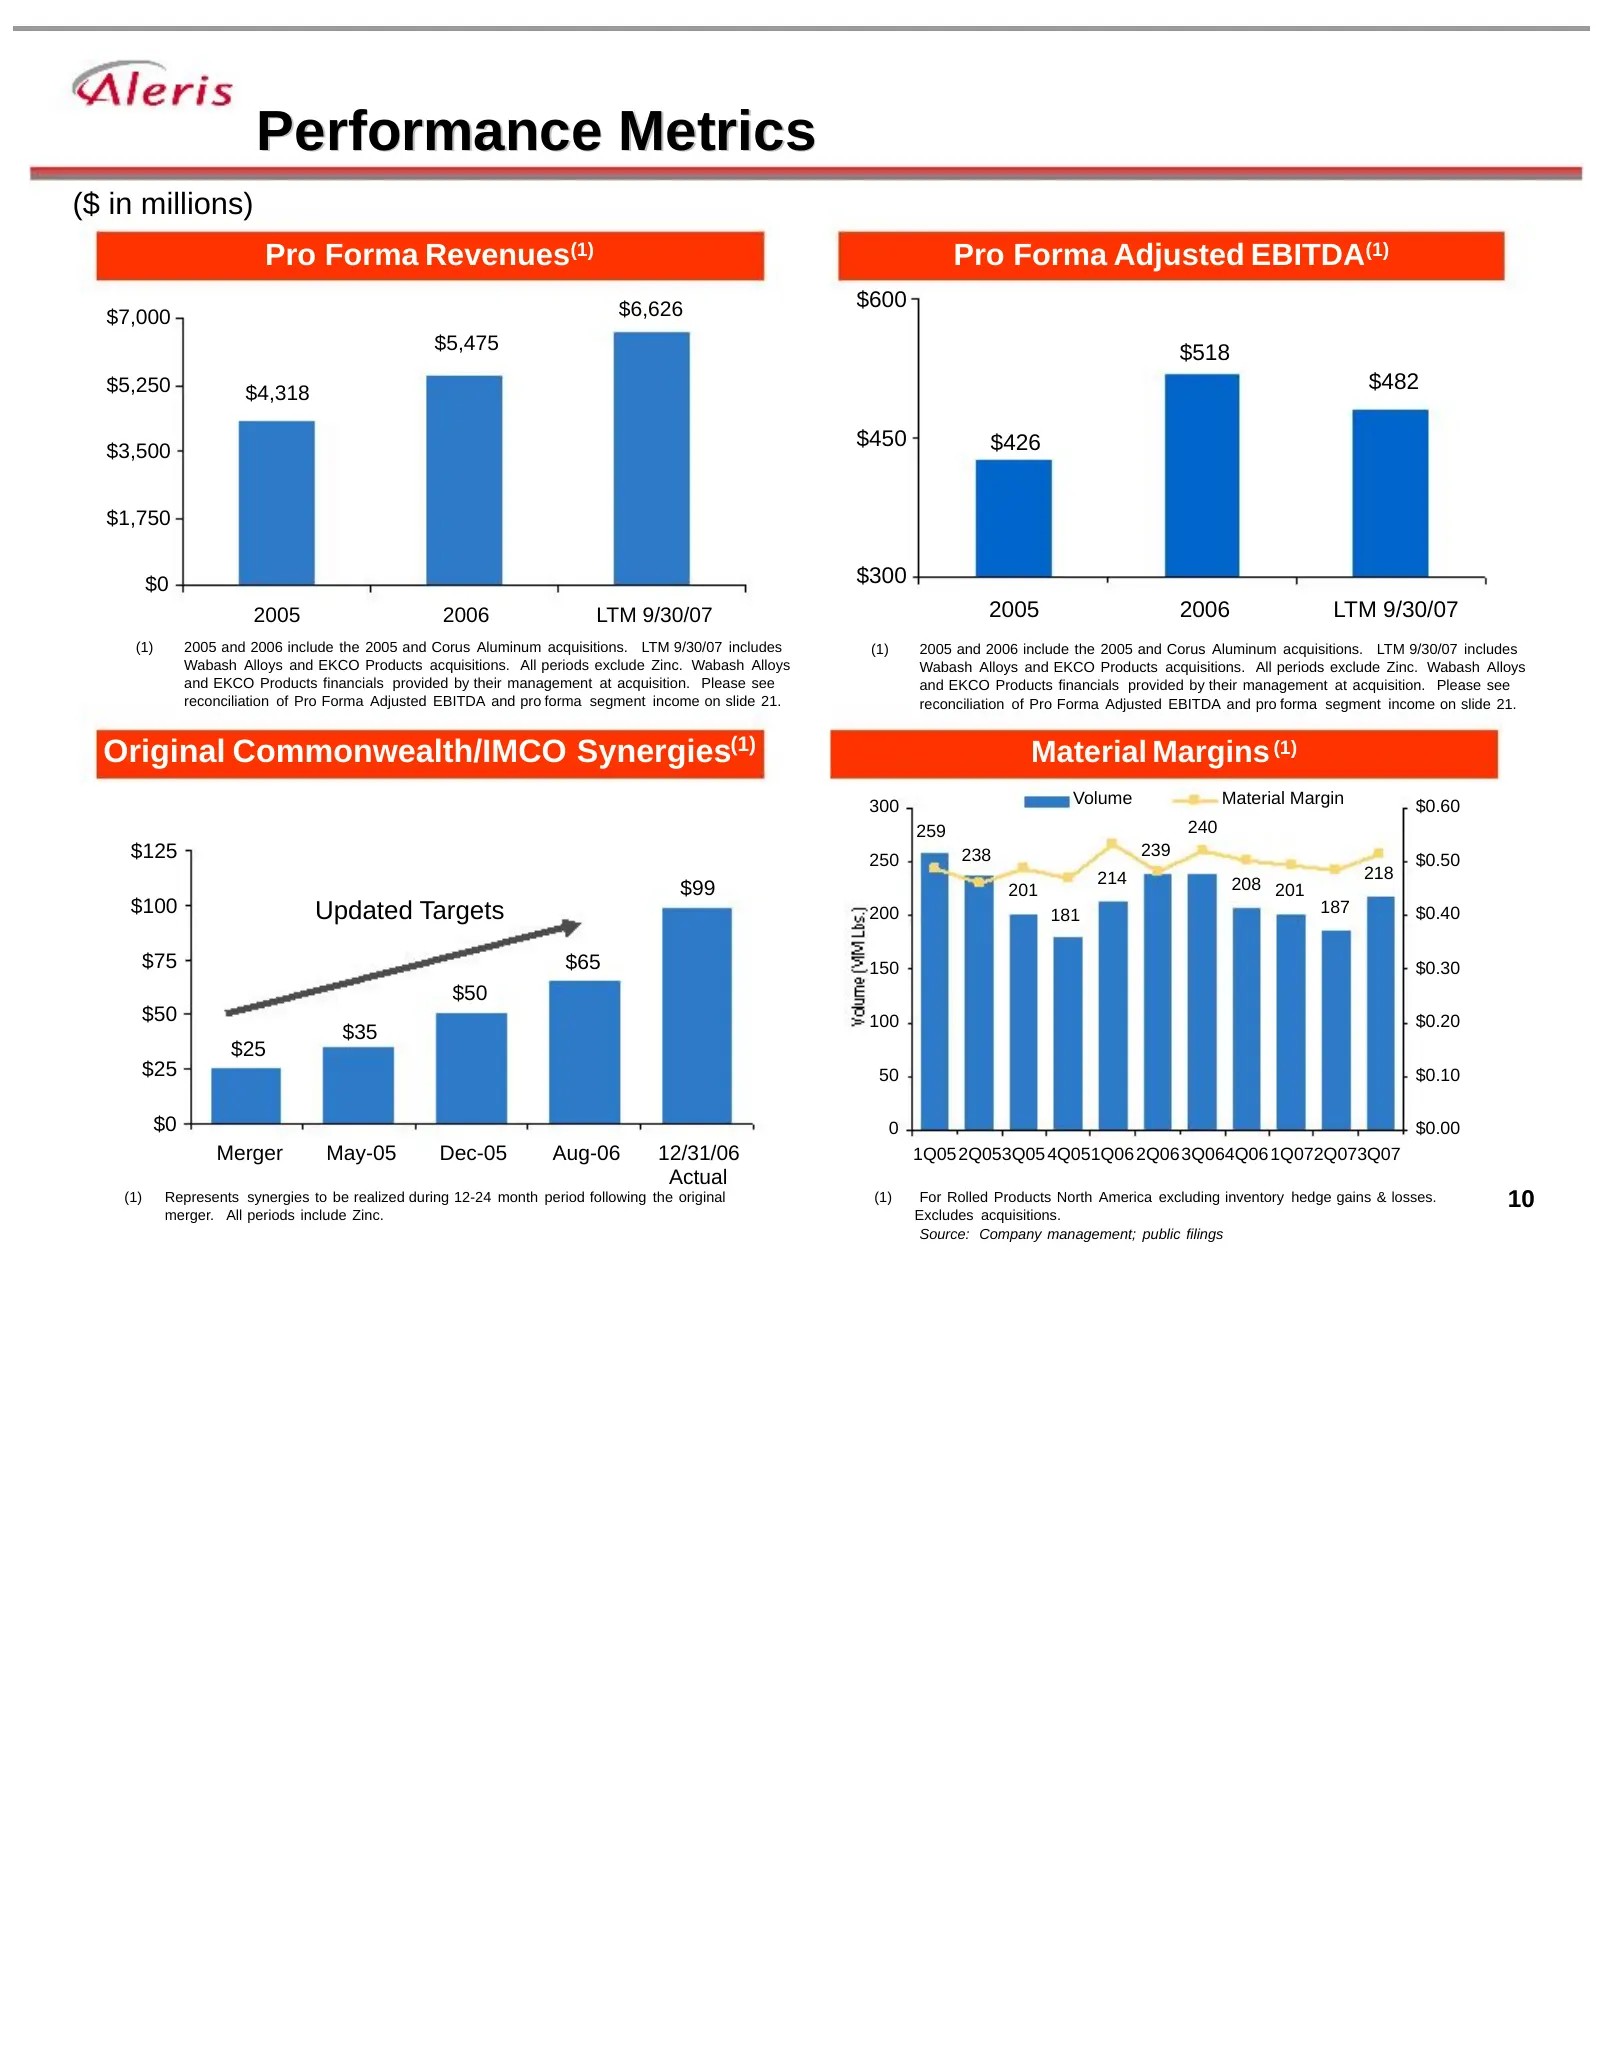
Slide 10: Performance Metrics
Performance Metrics ($ in millions) Pro Forma Revenues(1) Pro Forma Adjusted EBITDA(1) $6,626 $600 $7,000 $5,475 $518 $5,250 $4,318 $482 $450 $426 $3,500 $1,750 $0 $300 2005 2006 LTM 9/30/07 2005 2006 LTM 9/30/07 (1) 2005 and 2006 include the 2005 and Corus Aluminum acquisitions. LTM 9/30/07 include
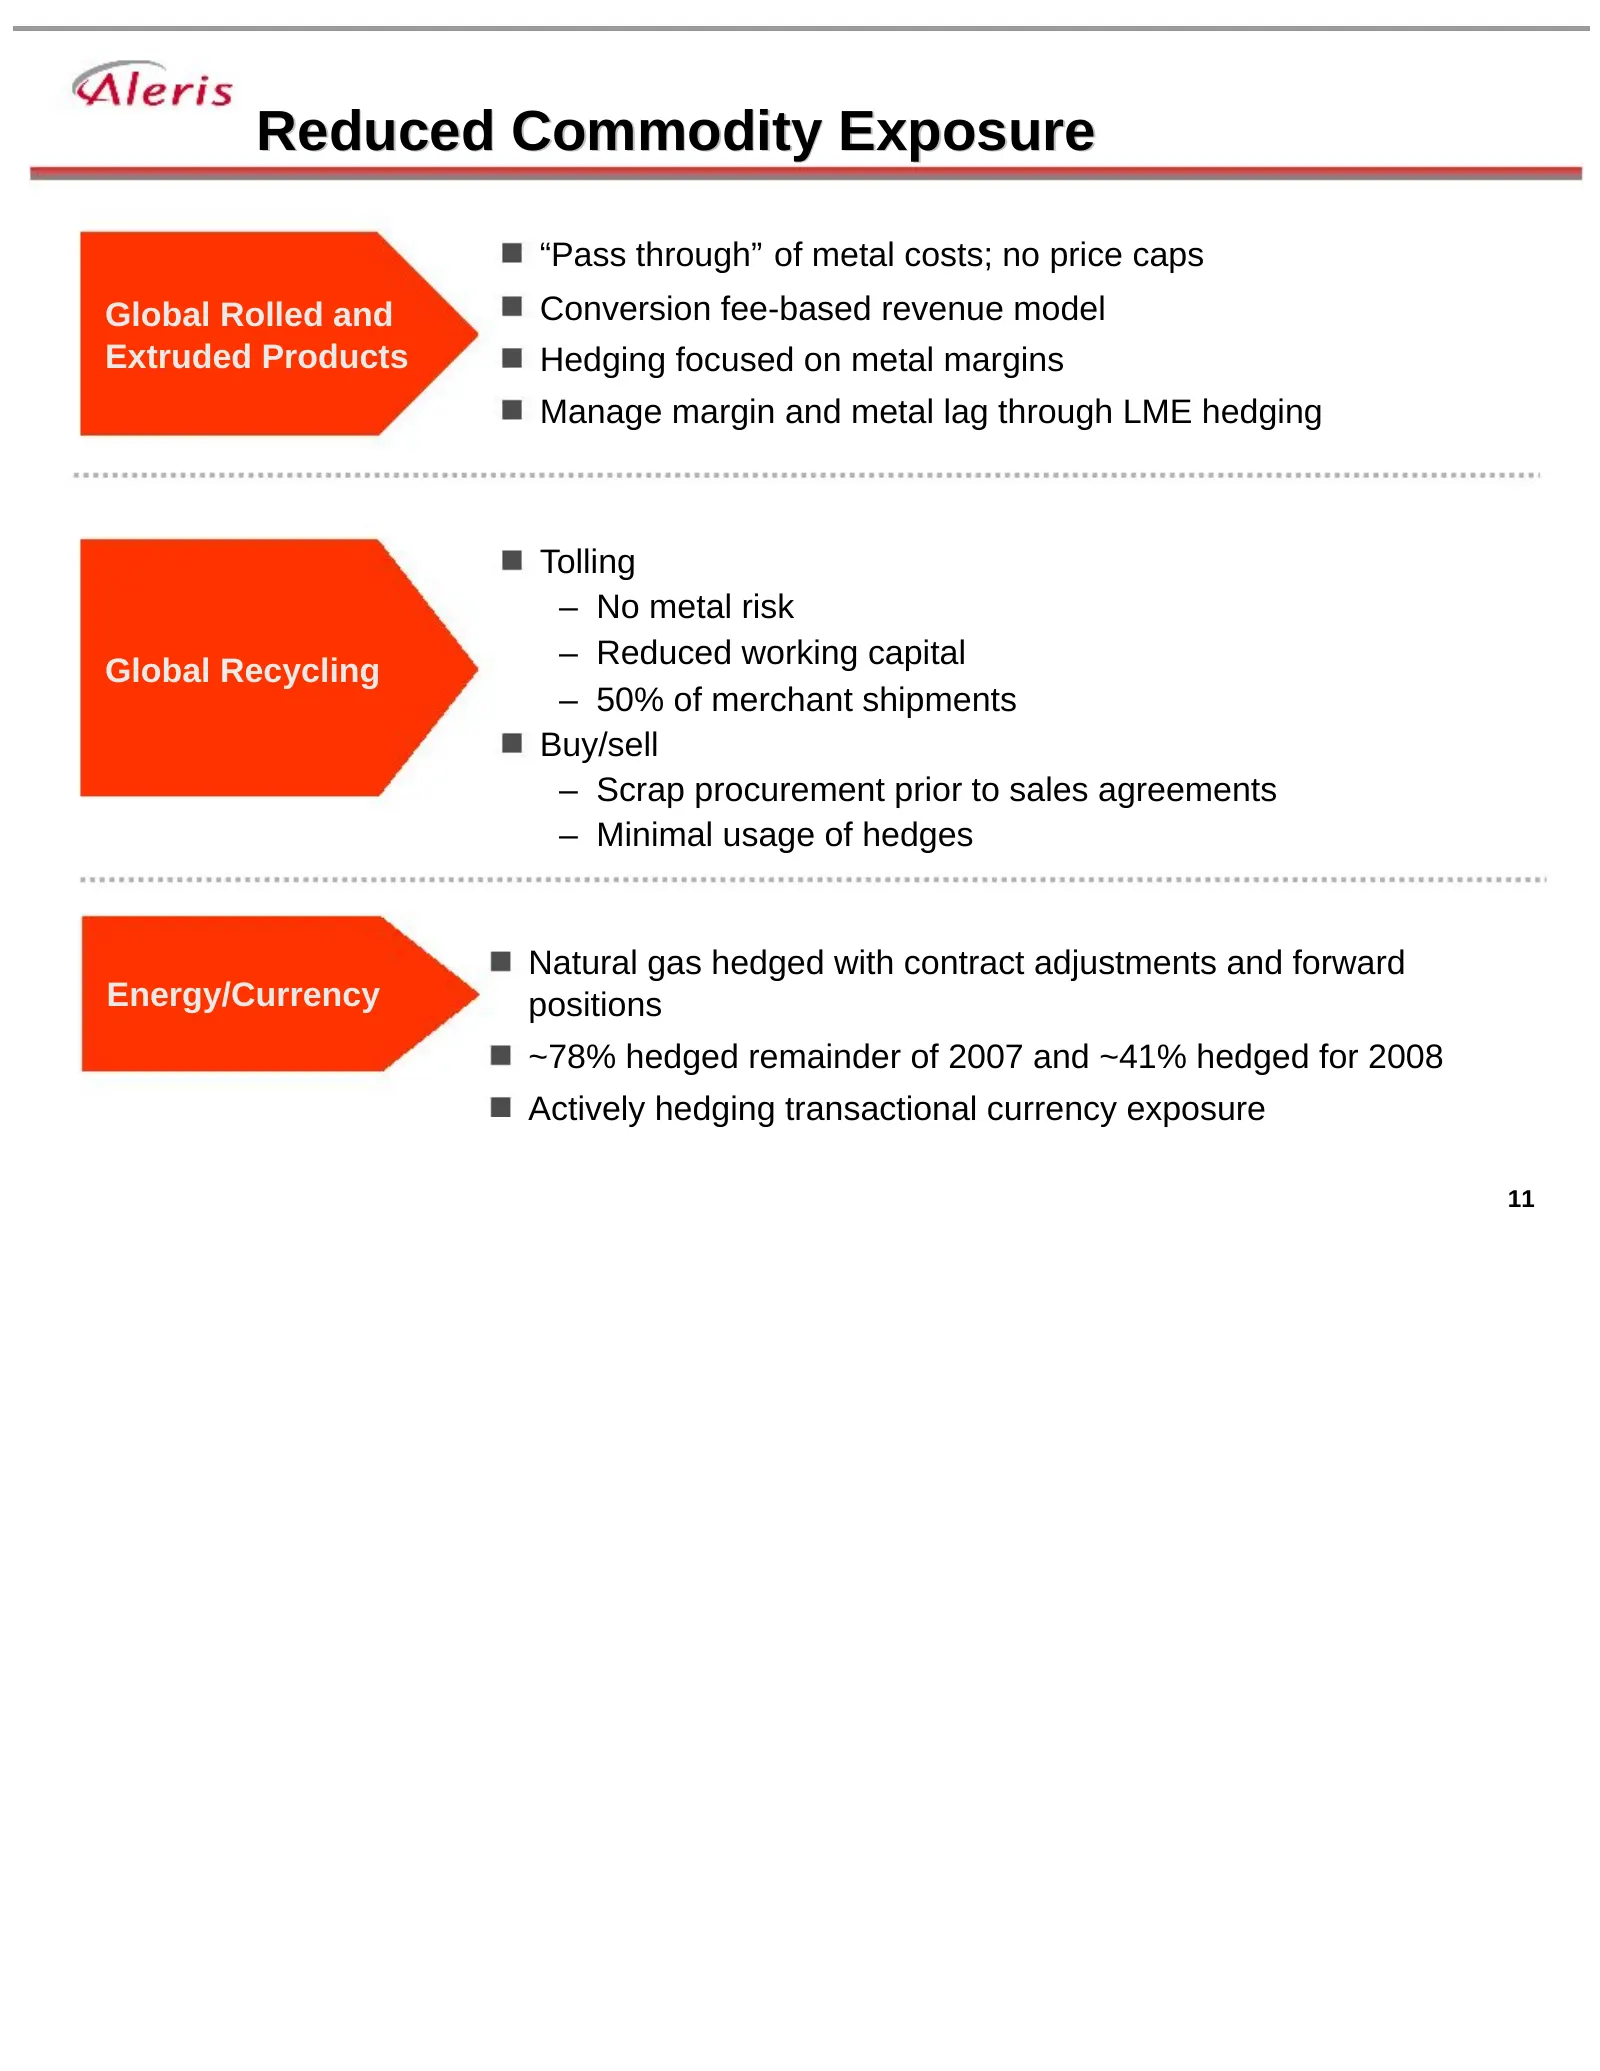
Slide 11: Reduced Commodity Exposure
Reduced Commodity Exposure “Pass through” of metal costs; no price caps Global Rolled and Conversion fee-based revenue model Extruded Products Hedging focused on metal margins Manage margin and metal lag through LME hedging Tolling – No metal risk – Reduced working capital Global Recycling – 50% of
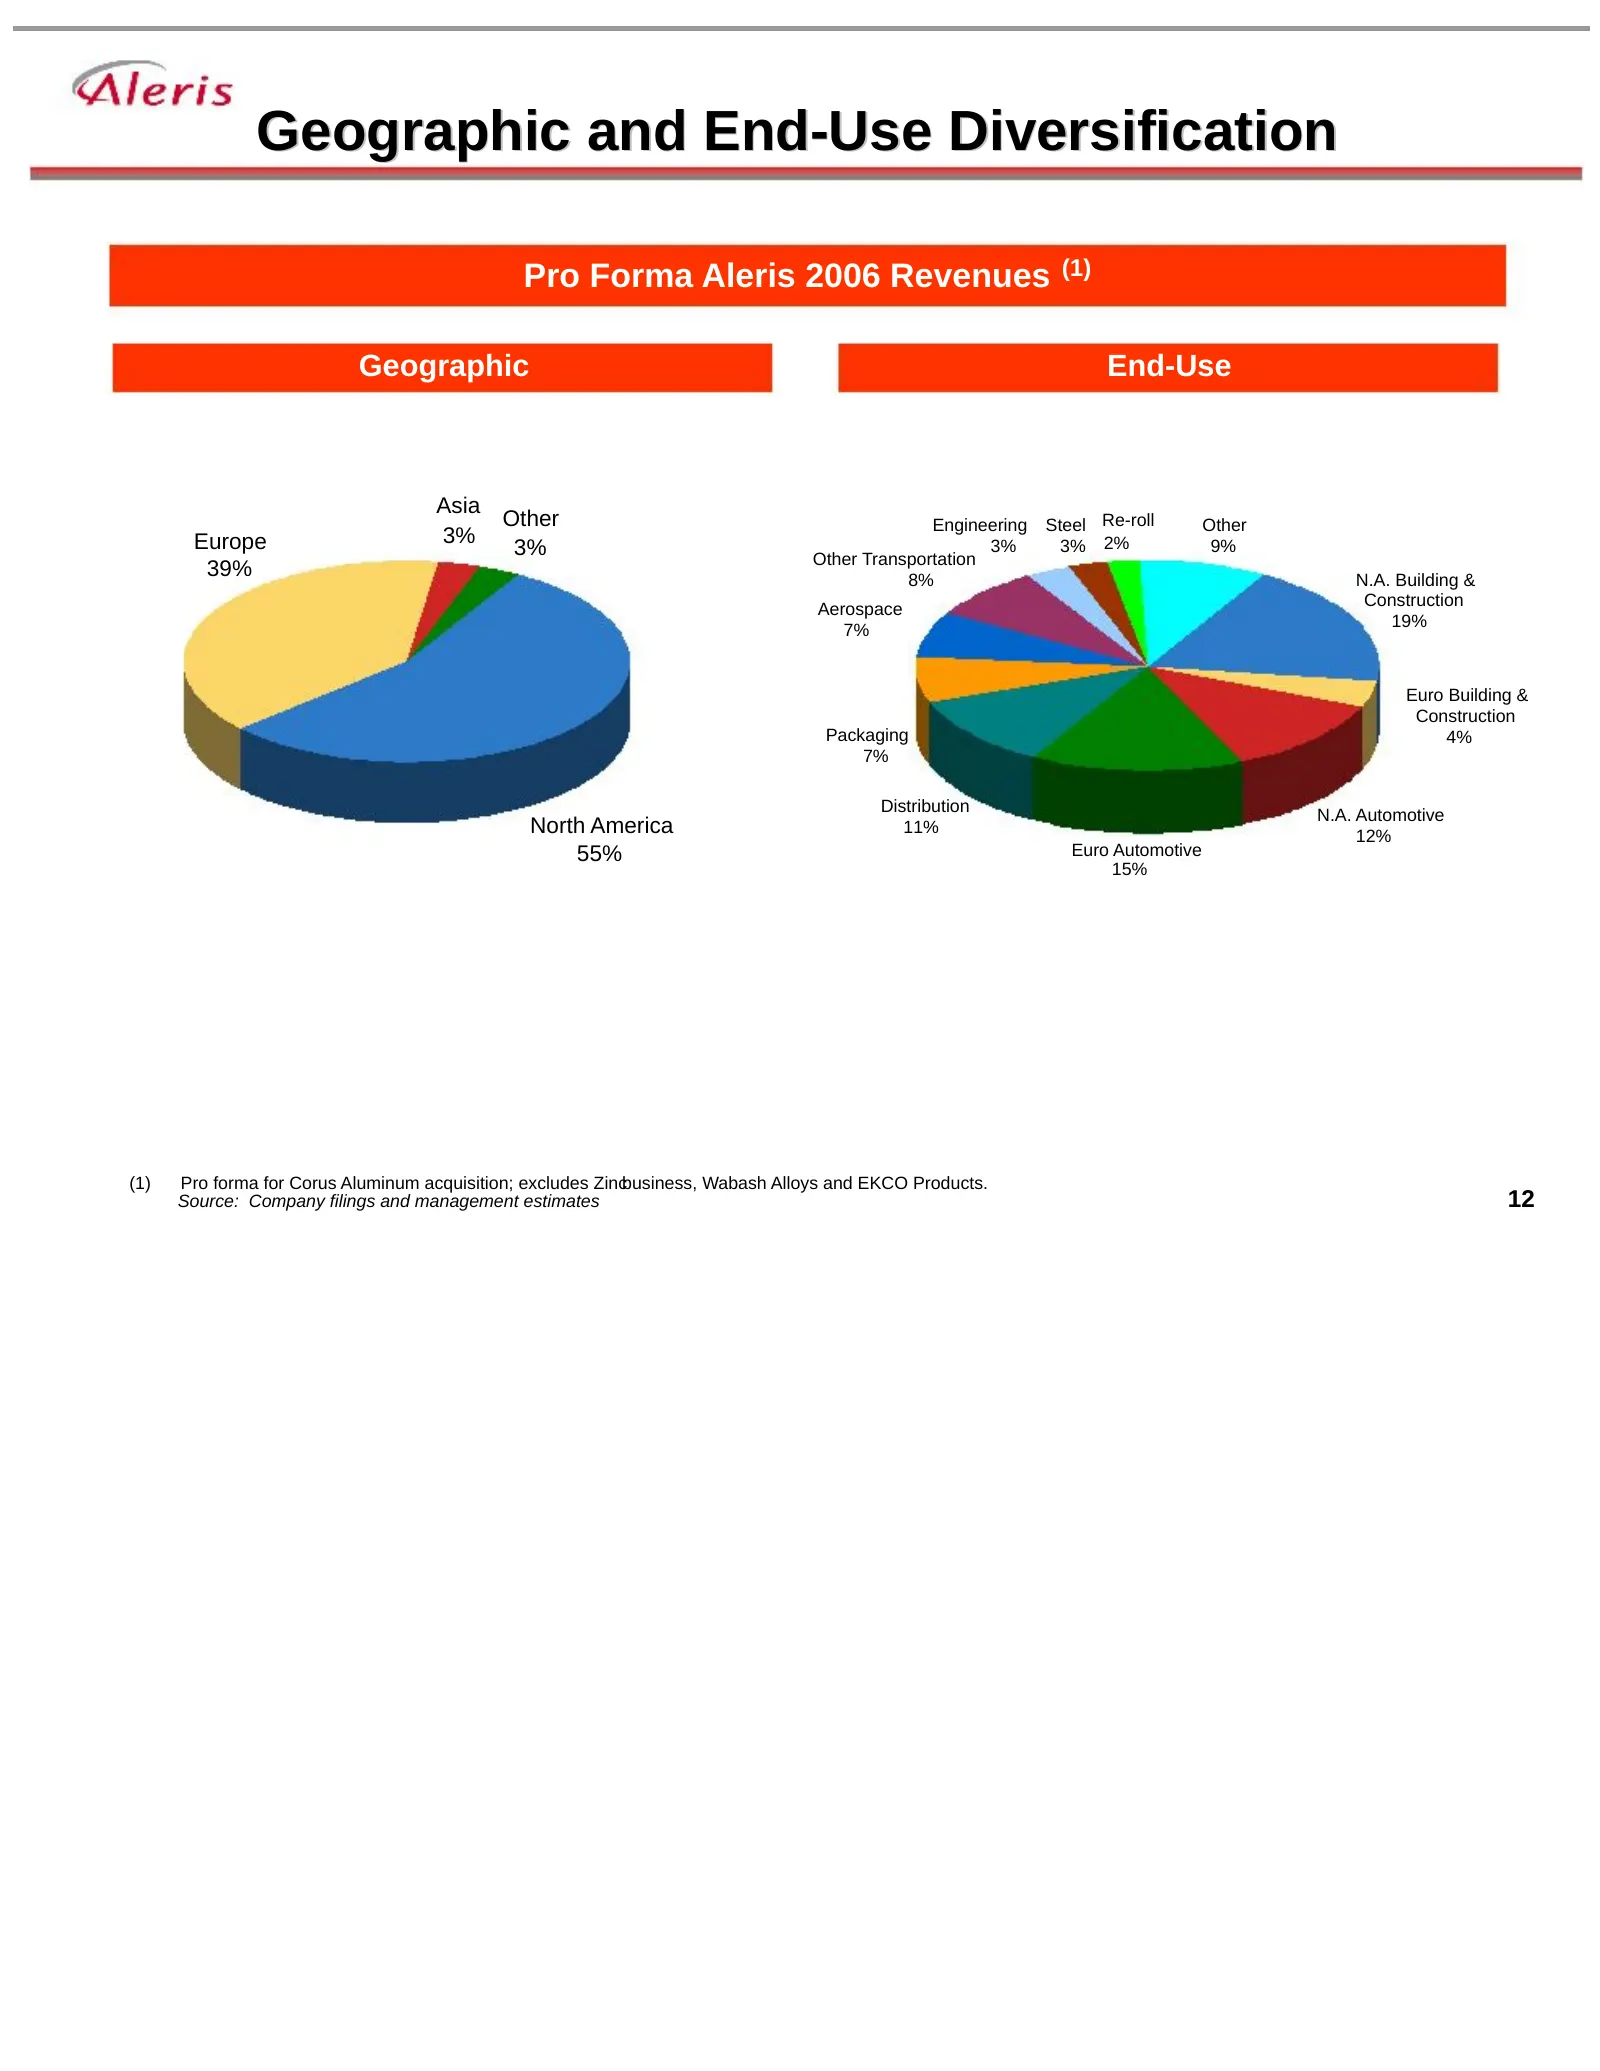
Slide 12: Geographic and End-Use Diversification
Geographic and End-Use Diversification Pro Forma Aleris 2006 Revenues (1) Geographic End-Use Asia Other Engineering Steel Re-roll Other Europe 3% 3% 2% 3% Other Transportation 3% 9% 39% 8% N.A. Building & Construction Aerospace 19% 7% Euro Building & Construction Packaging 4% 7% Distribution N.A. Au
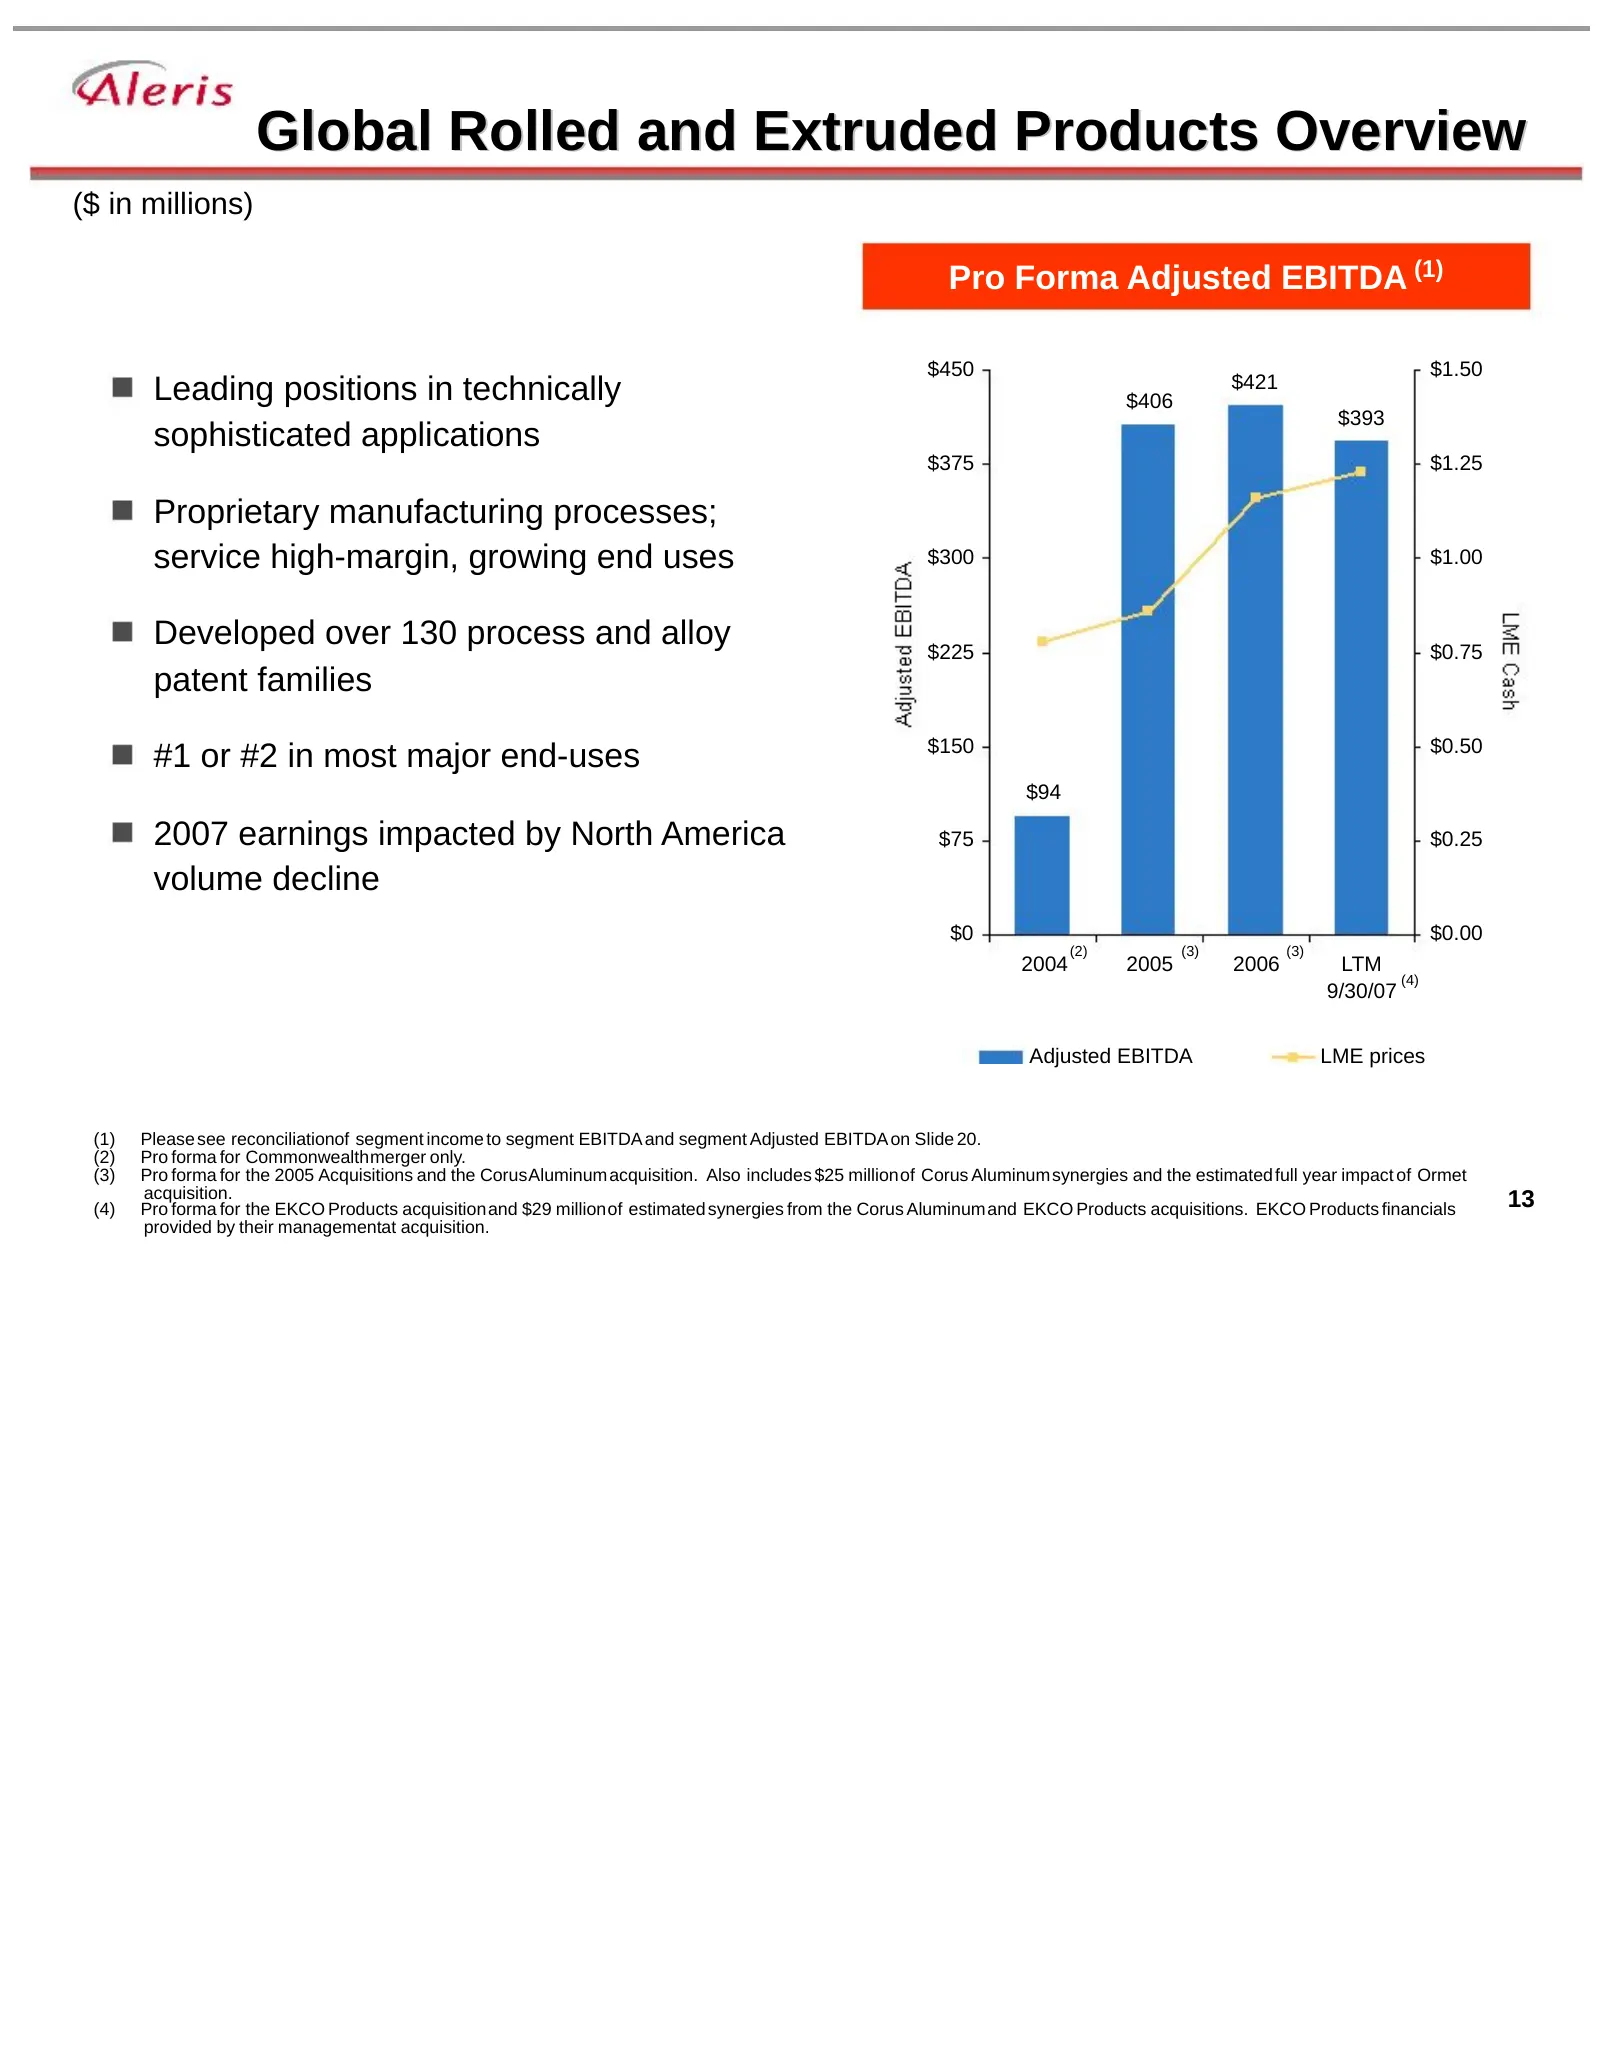
Slide 13: Global Rolled and Extruded Products Overview
Global Rolled and Extruded Products Overview ($ in millions) Pro Forma Adjusted EBITDA (1) $450 $1.50 Leading positions in technically $406 $421 $393 sophisticated applications $375 $1.25 Proprietary manufacturing processes; service high-margin, growing end uses $300 $1.00 Developed over 130 process
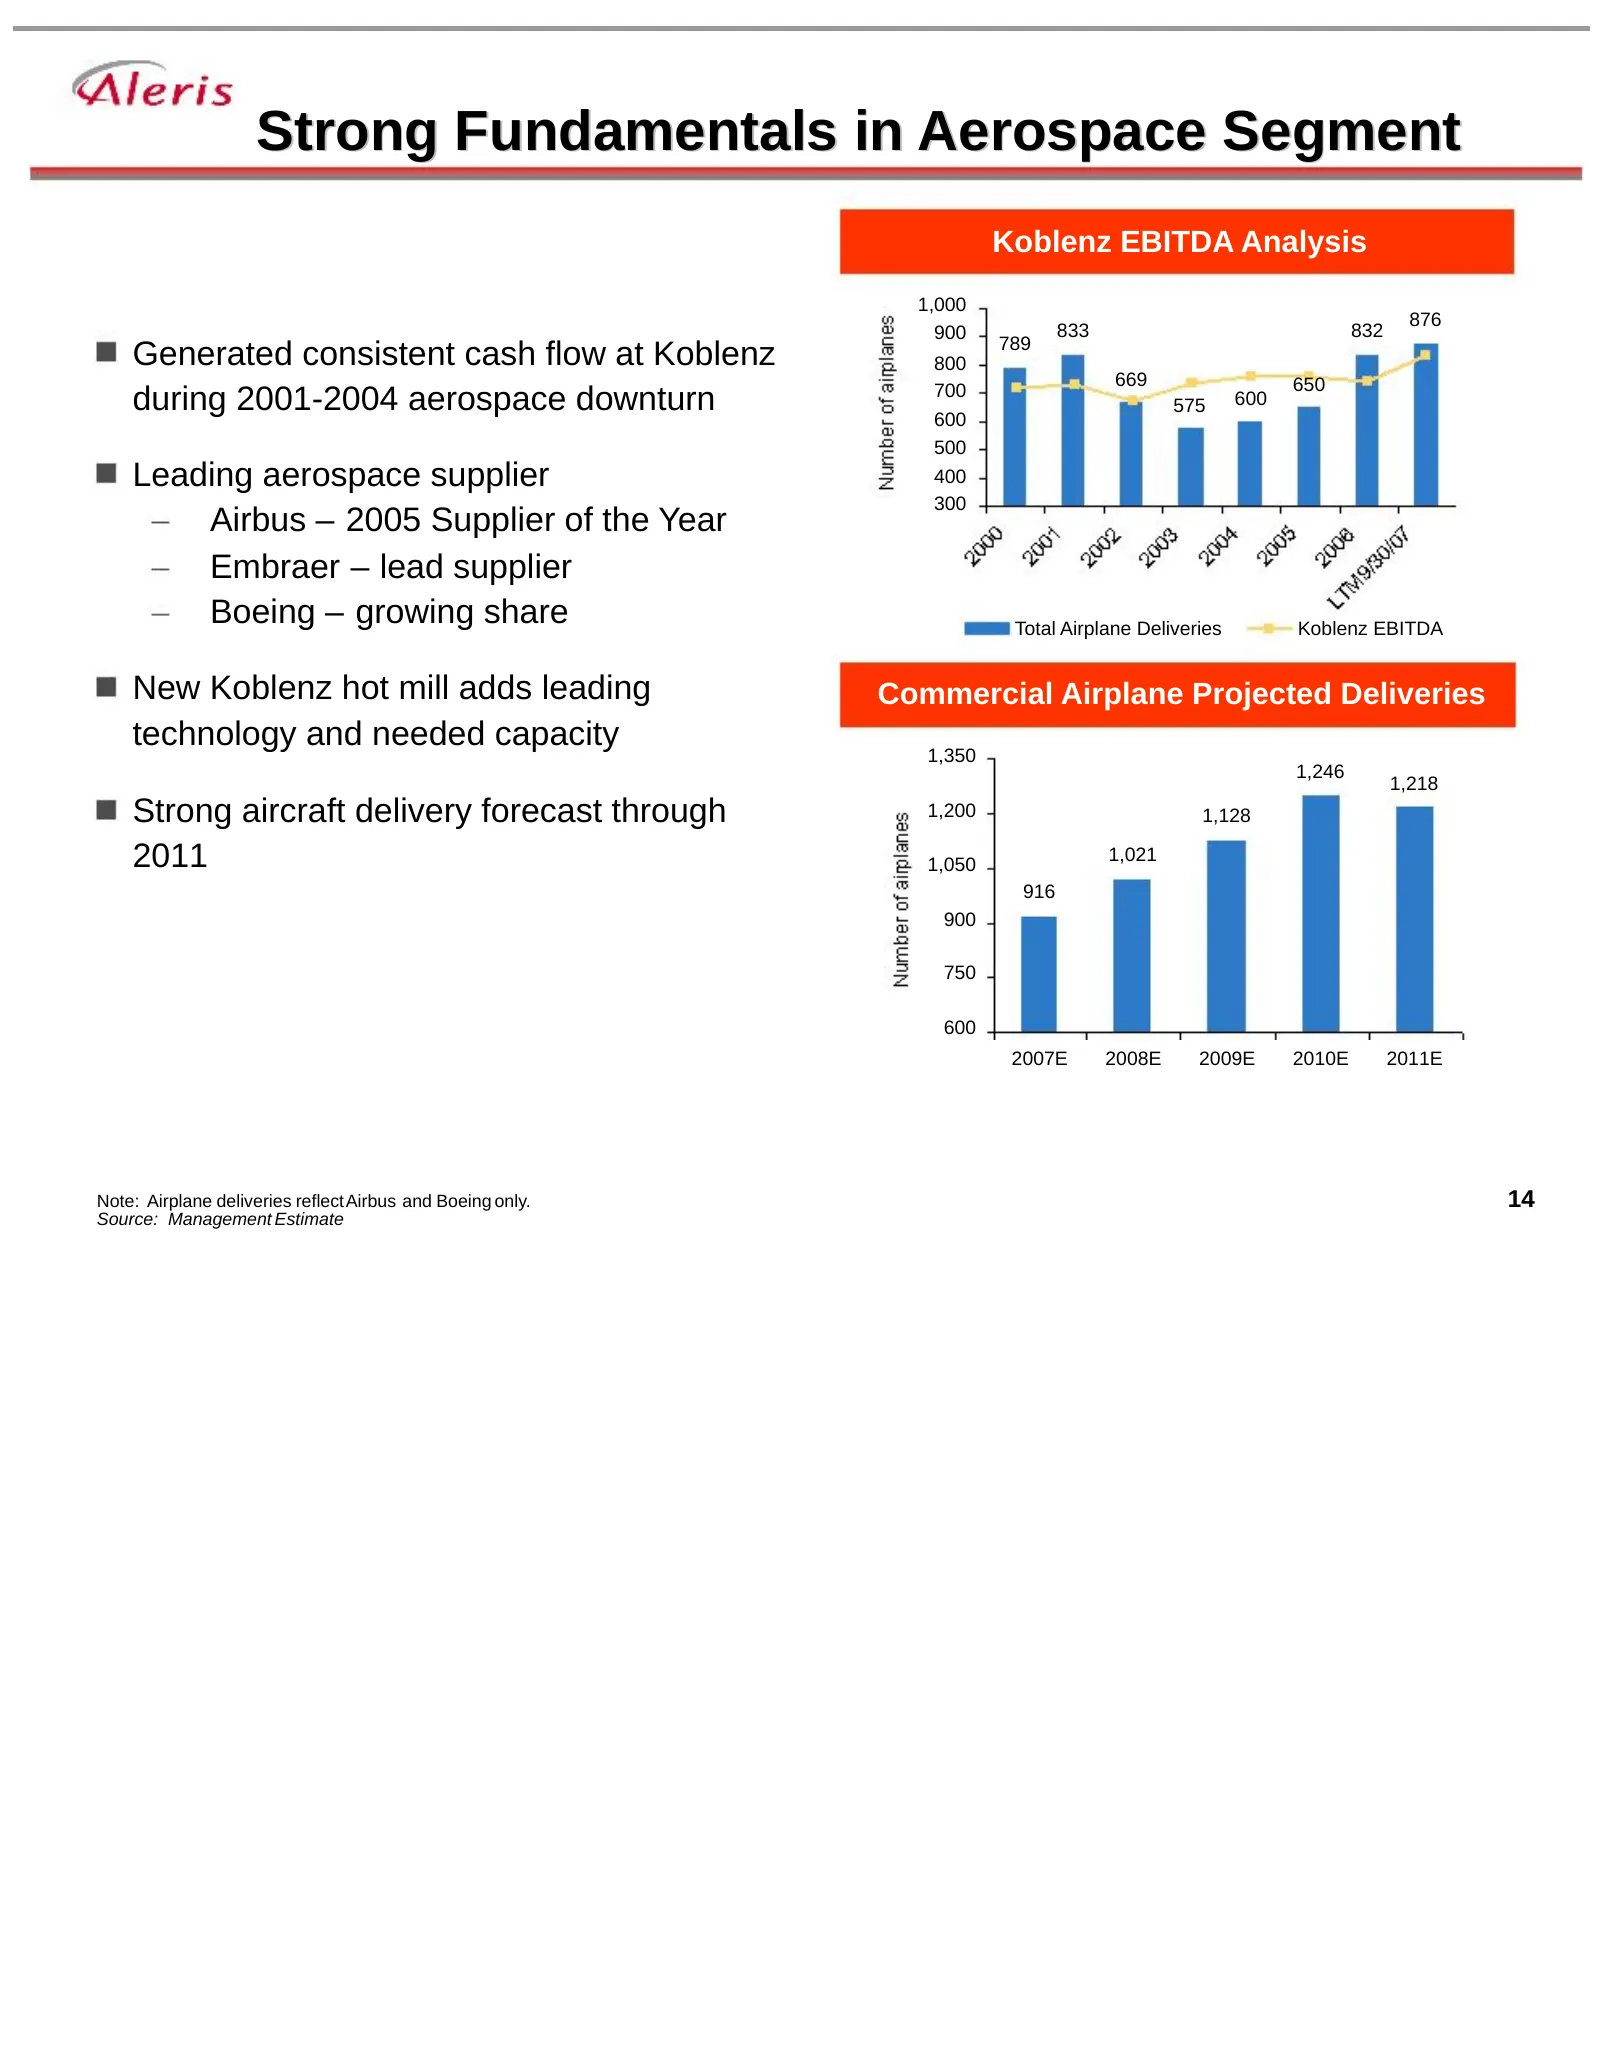
Slide 14: Strong Fundamentals in Aerospace Segment
Strong Fundamentals in Aerospace Segment Koblenz EBITDA Analysis 1,000 876 900 833 832 789 Generated consistent cash flow at Koblenz 800 669 650 during 2001-2004 aerospace downturn 700 600 575 600 500 Leading aerospace supplier 400 300 Airbus – 2005 Supplier of the Year Embraer – lead supplier Boein
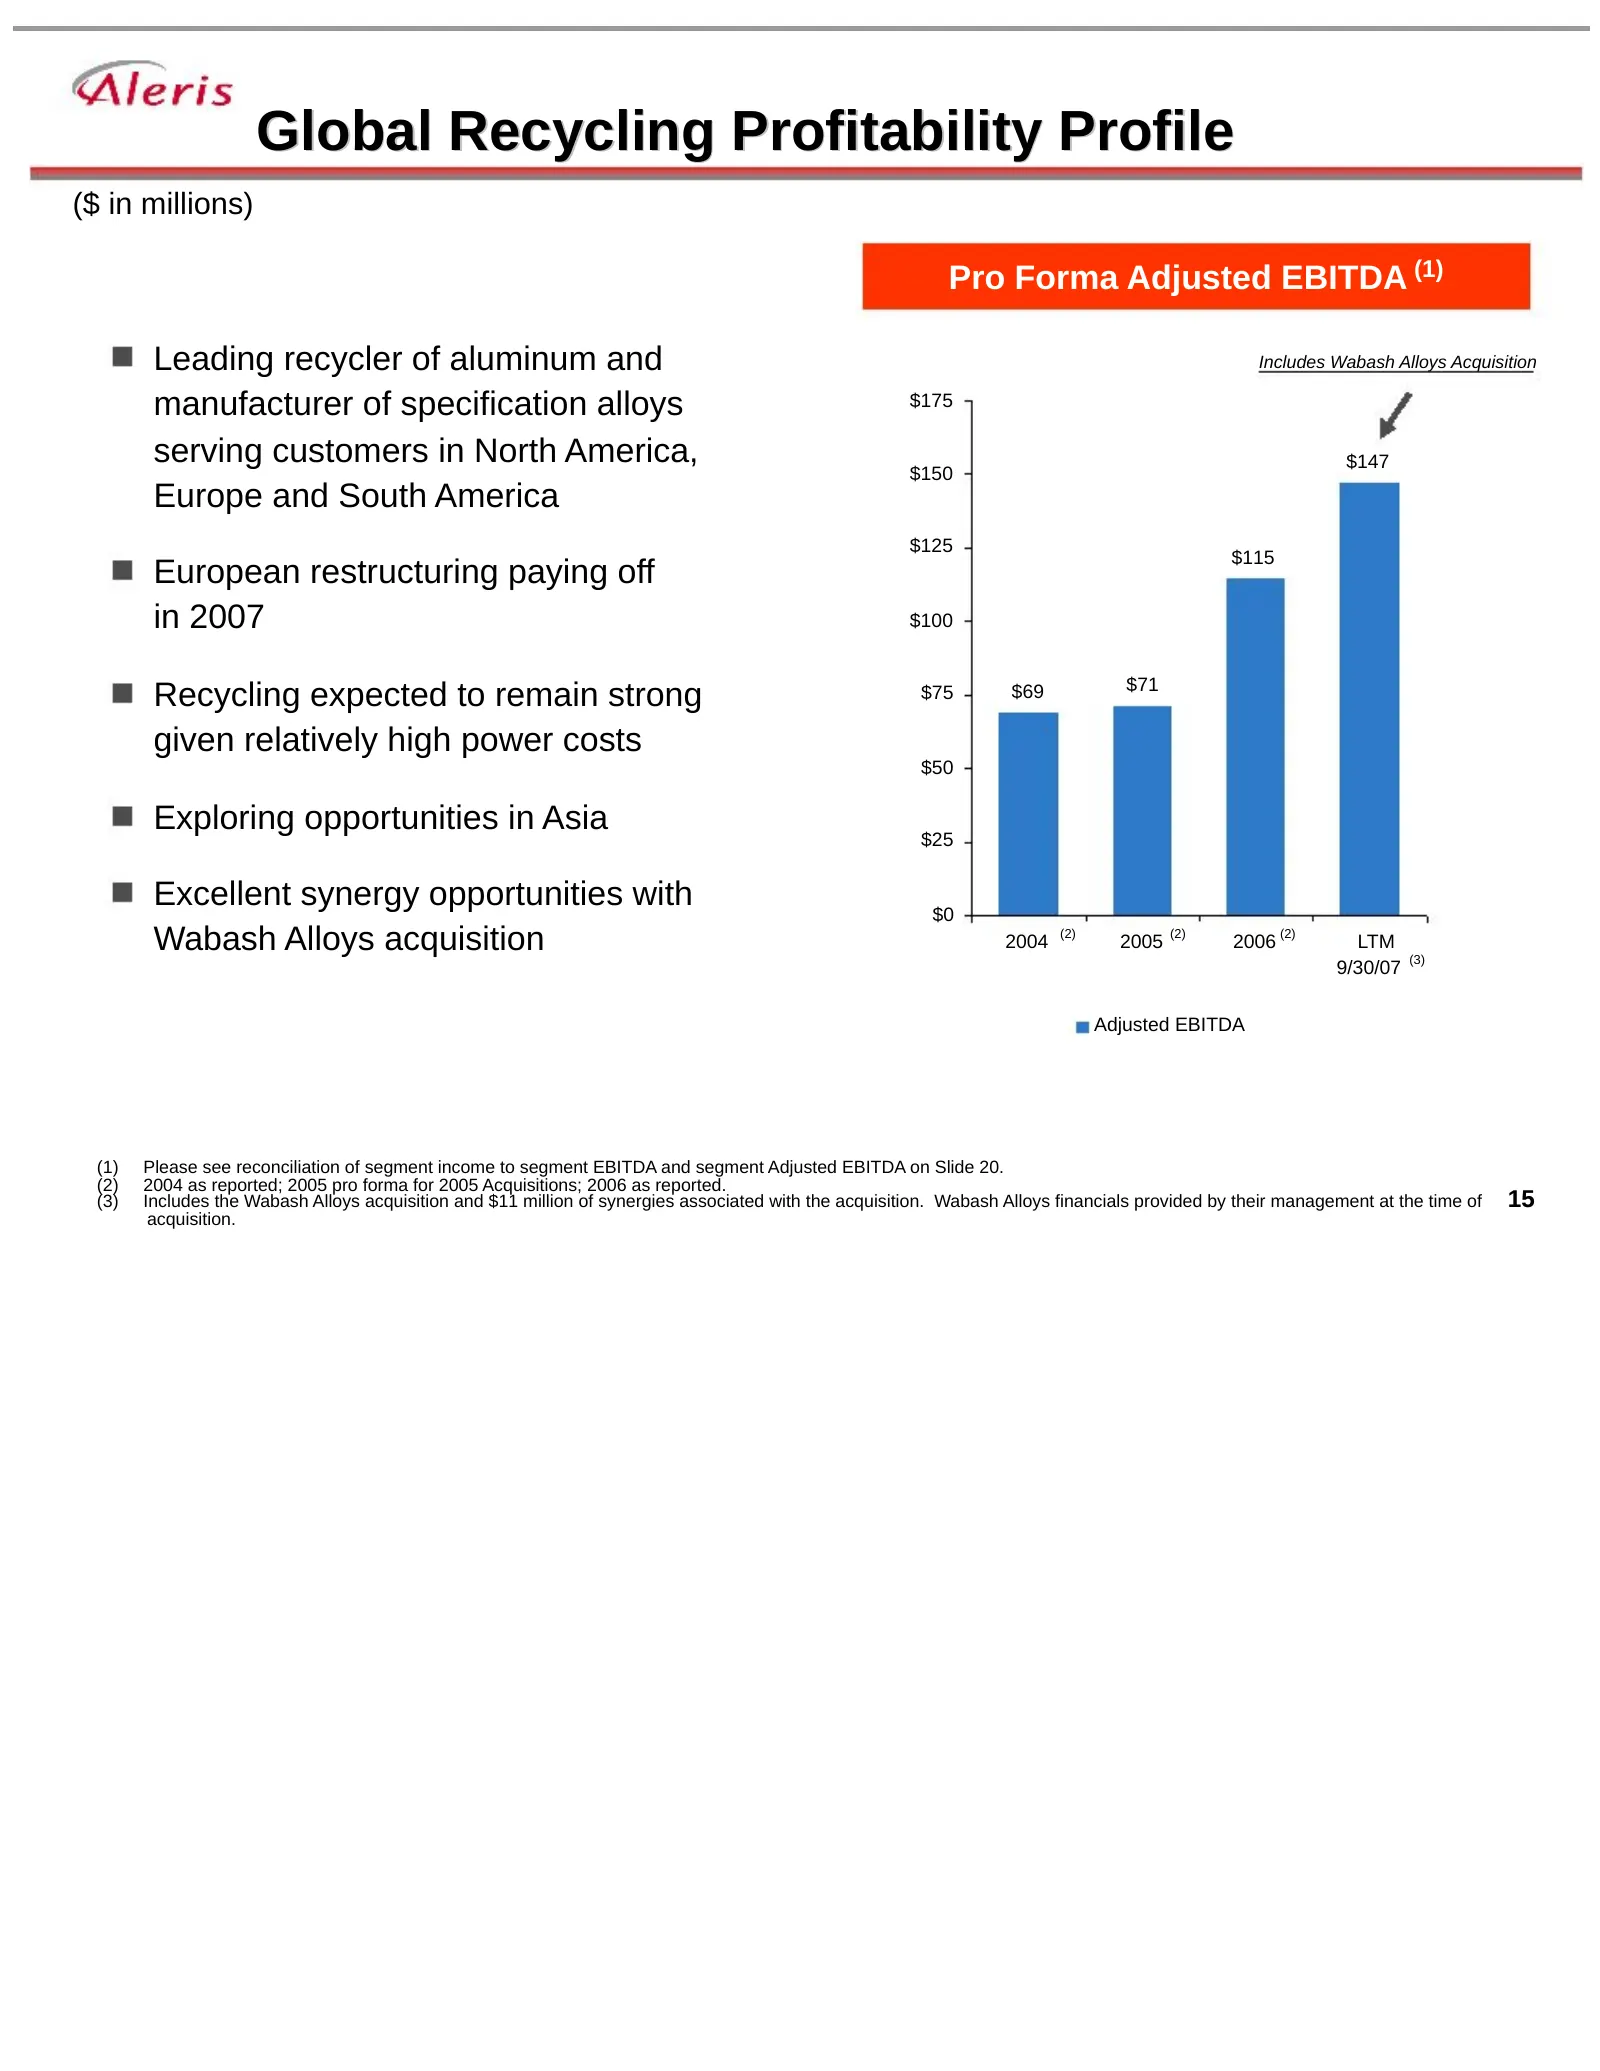
Slide 15: Global Recycling Profitability Profile
Global Recycling Profitability Profile ($ in millions) Pro Forma Adjusted EBITDA (1) Leading recycler of aluminum and Includes Wabash Alloys Acquisition manufacturer of specification alloys $175 serving customers in North America, $147 $150 Europe and South America $125 $115 European restructuring p
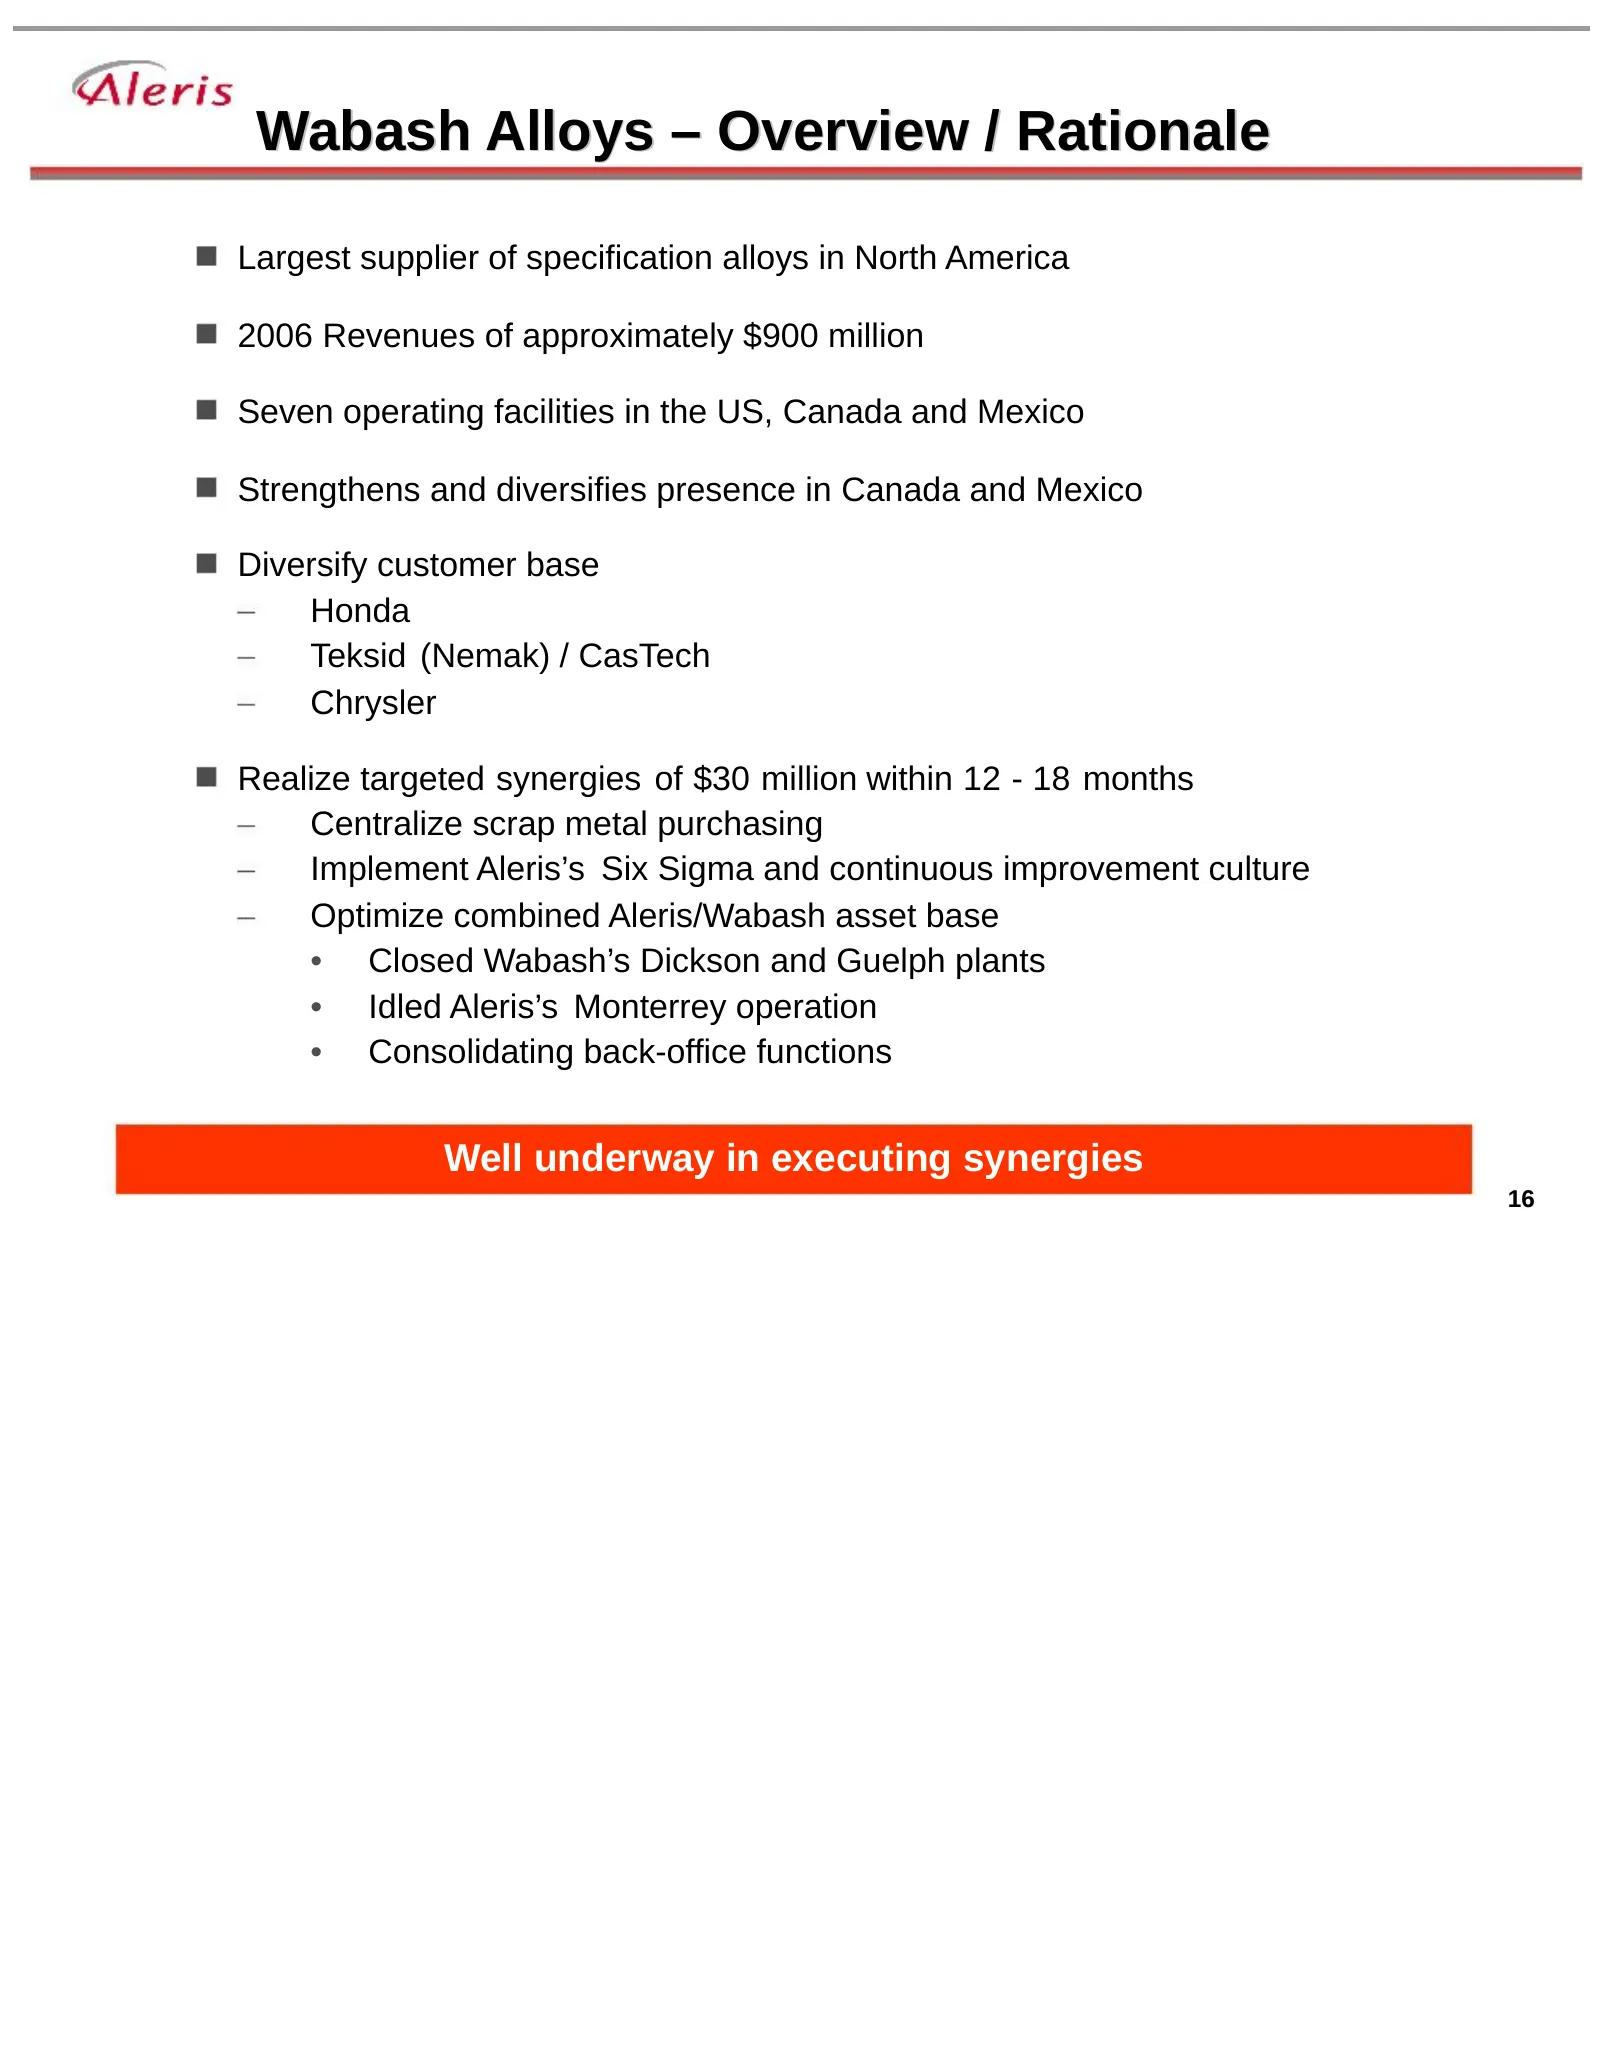
Slide 16: Wabash Alloys – Overview / Rationale
Wabash Alloys – Overview / Rationale Largest supplier of specification alloys in North America 2006 Revenues of approximately $900 million Seven operating facilities in the US, Canada and Mexico Strengthens and diversifies presence in Canada and Mexico Diversify customer base Honda Teksid (Nemak) /
Slide 17: Merger Productivity and Synergy Realization
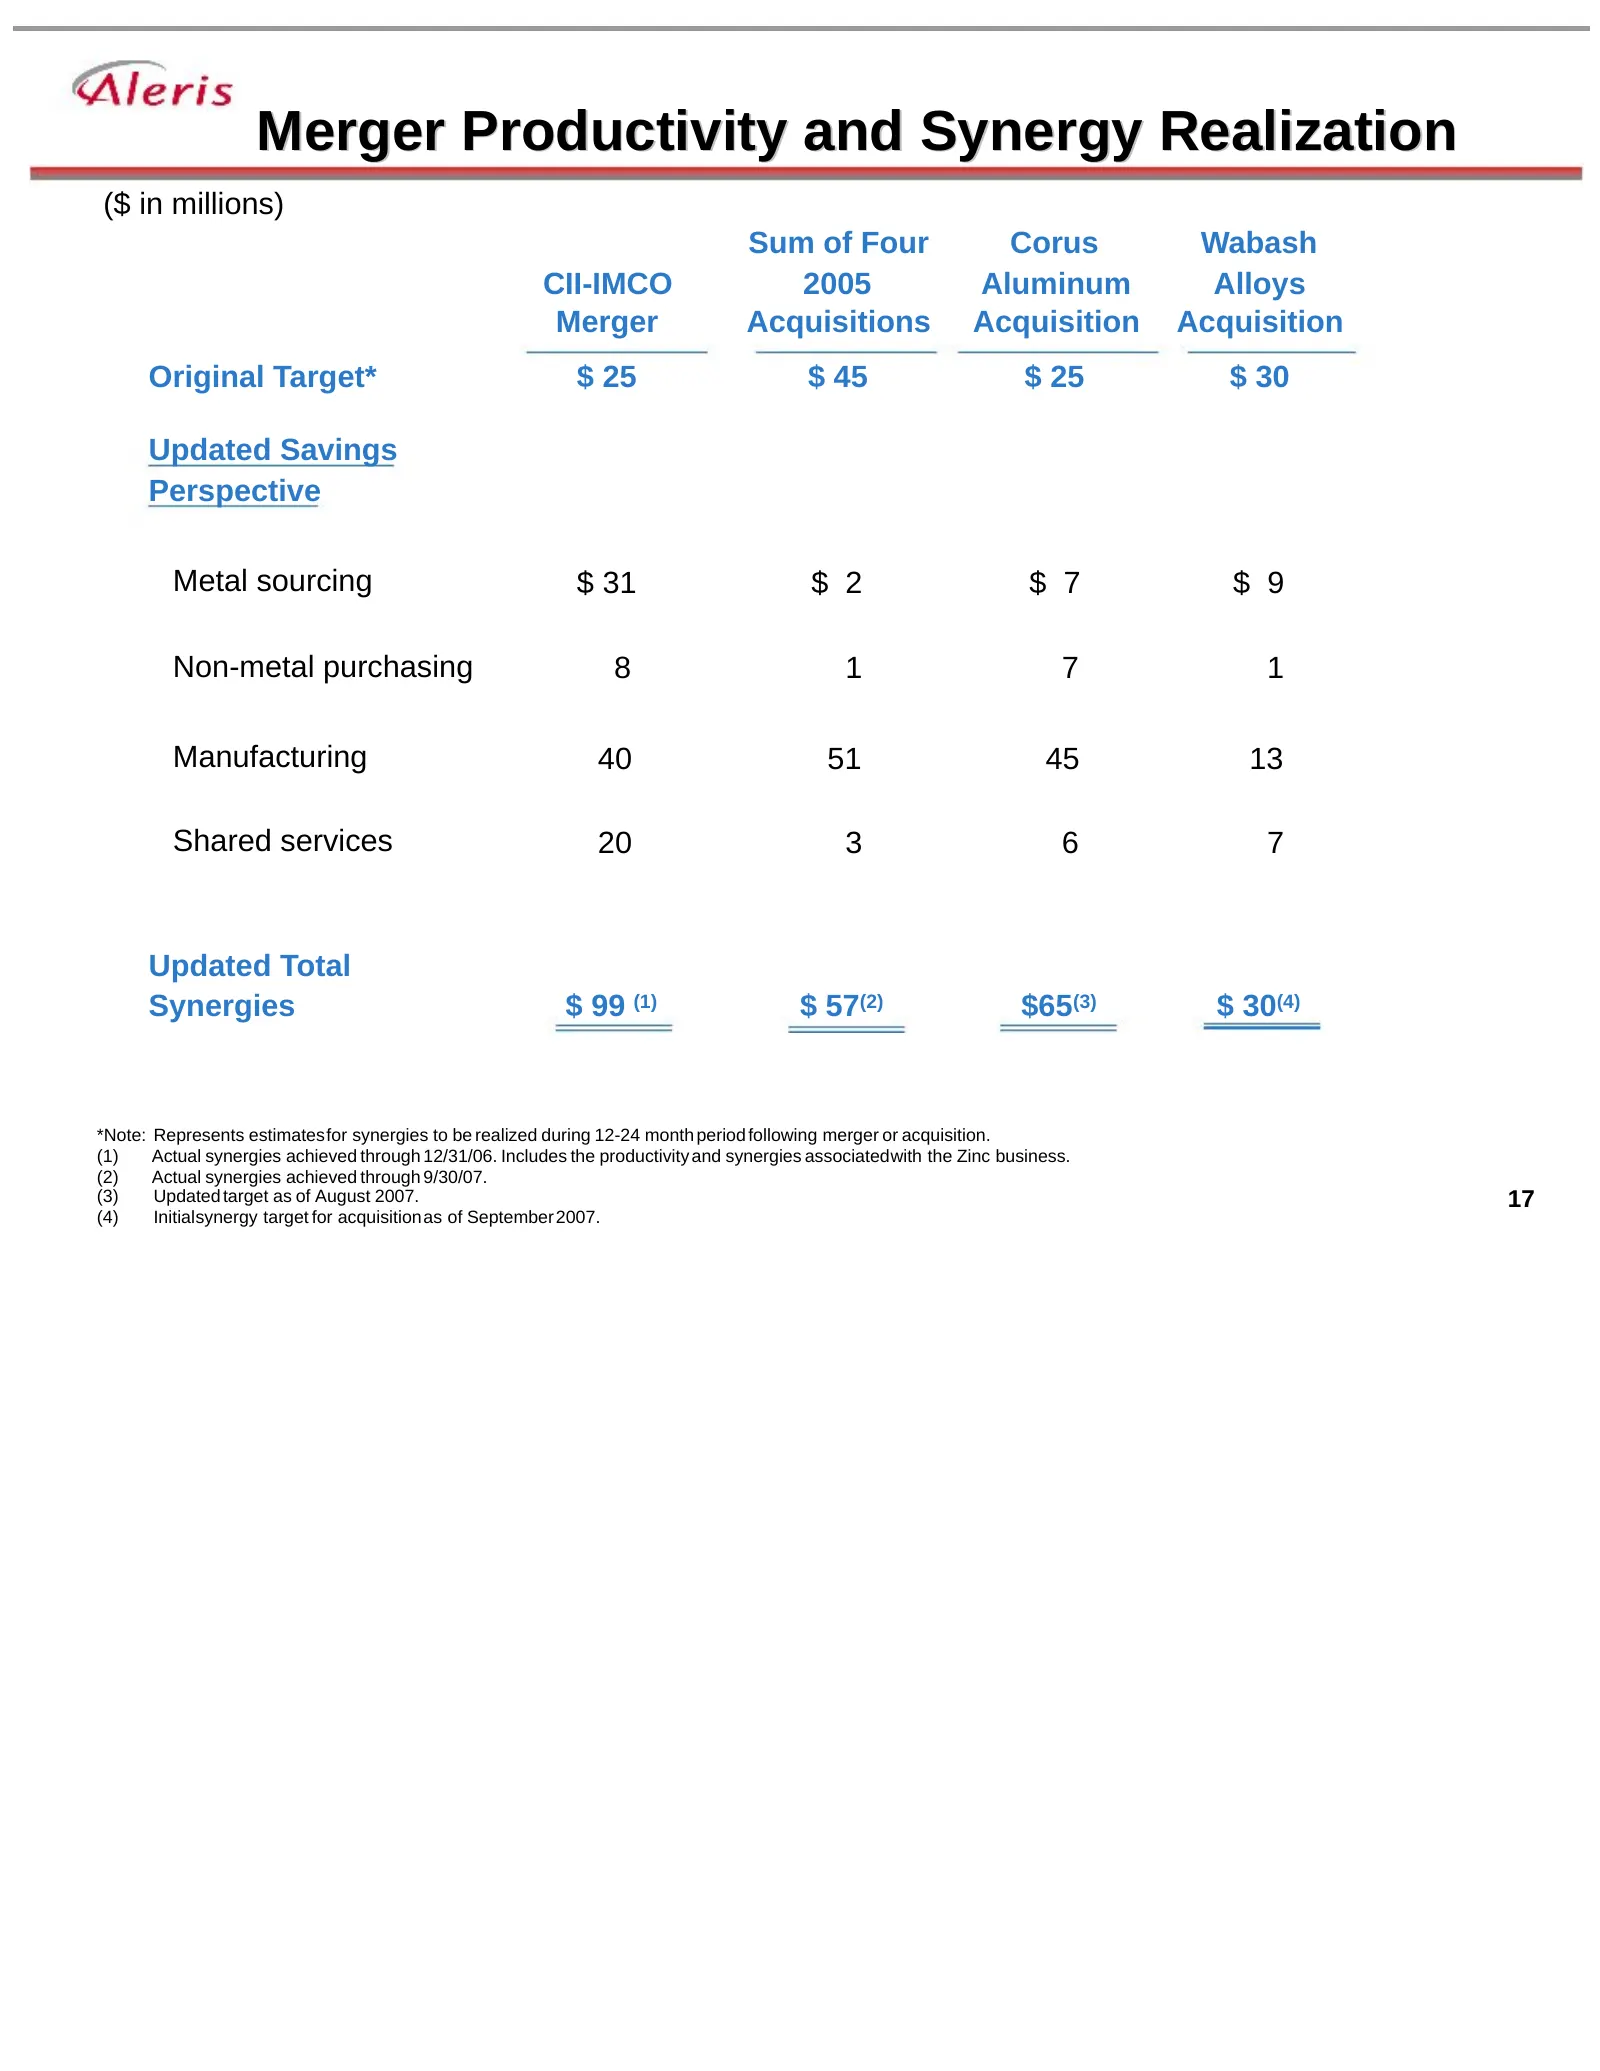
Merger Productivity and Synergy Realization ($ in millions) Sum of Four Corus Wabash CII-IMCO 2005 Aluminum Alloys Merger Acquisitions Acquisition Acquisition Original Target* $ 25 $ 45 $ 25 $ 30 Updated Savings Perspective Metal sourcing $ 31 $ 2 $ 7 $ 9 Non-metal purchasing 8 1 7 1 Manufacturing 4
Slide 18: Pro Forma Capital Expenditures Overview
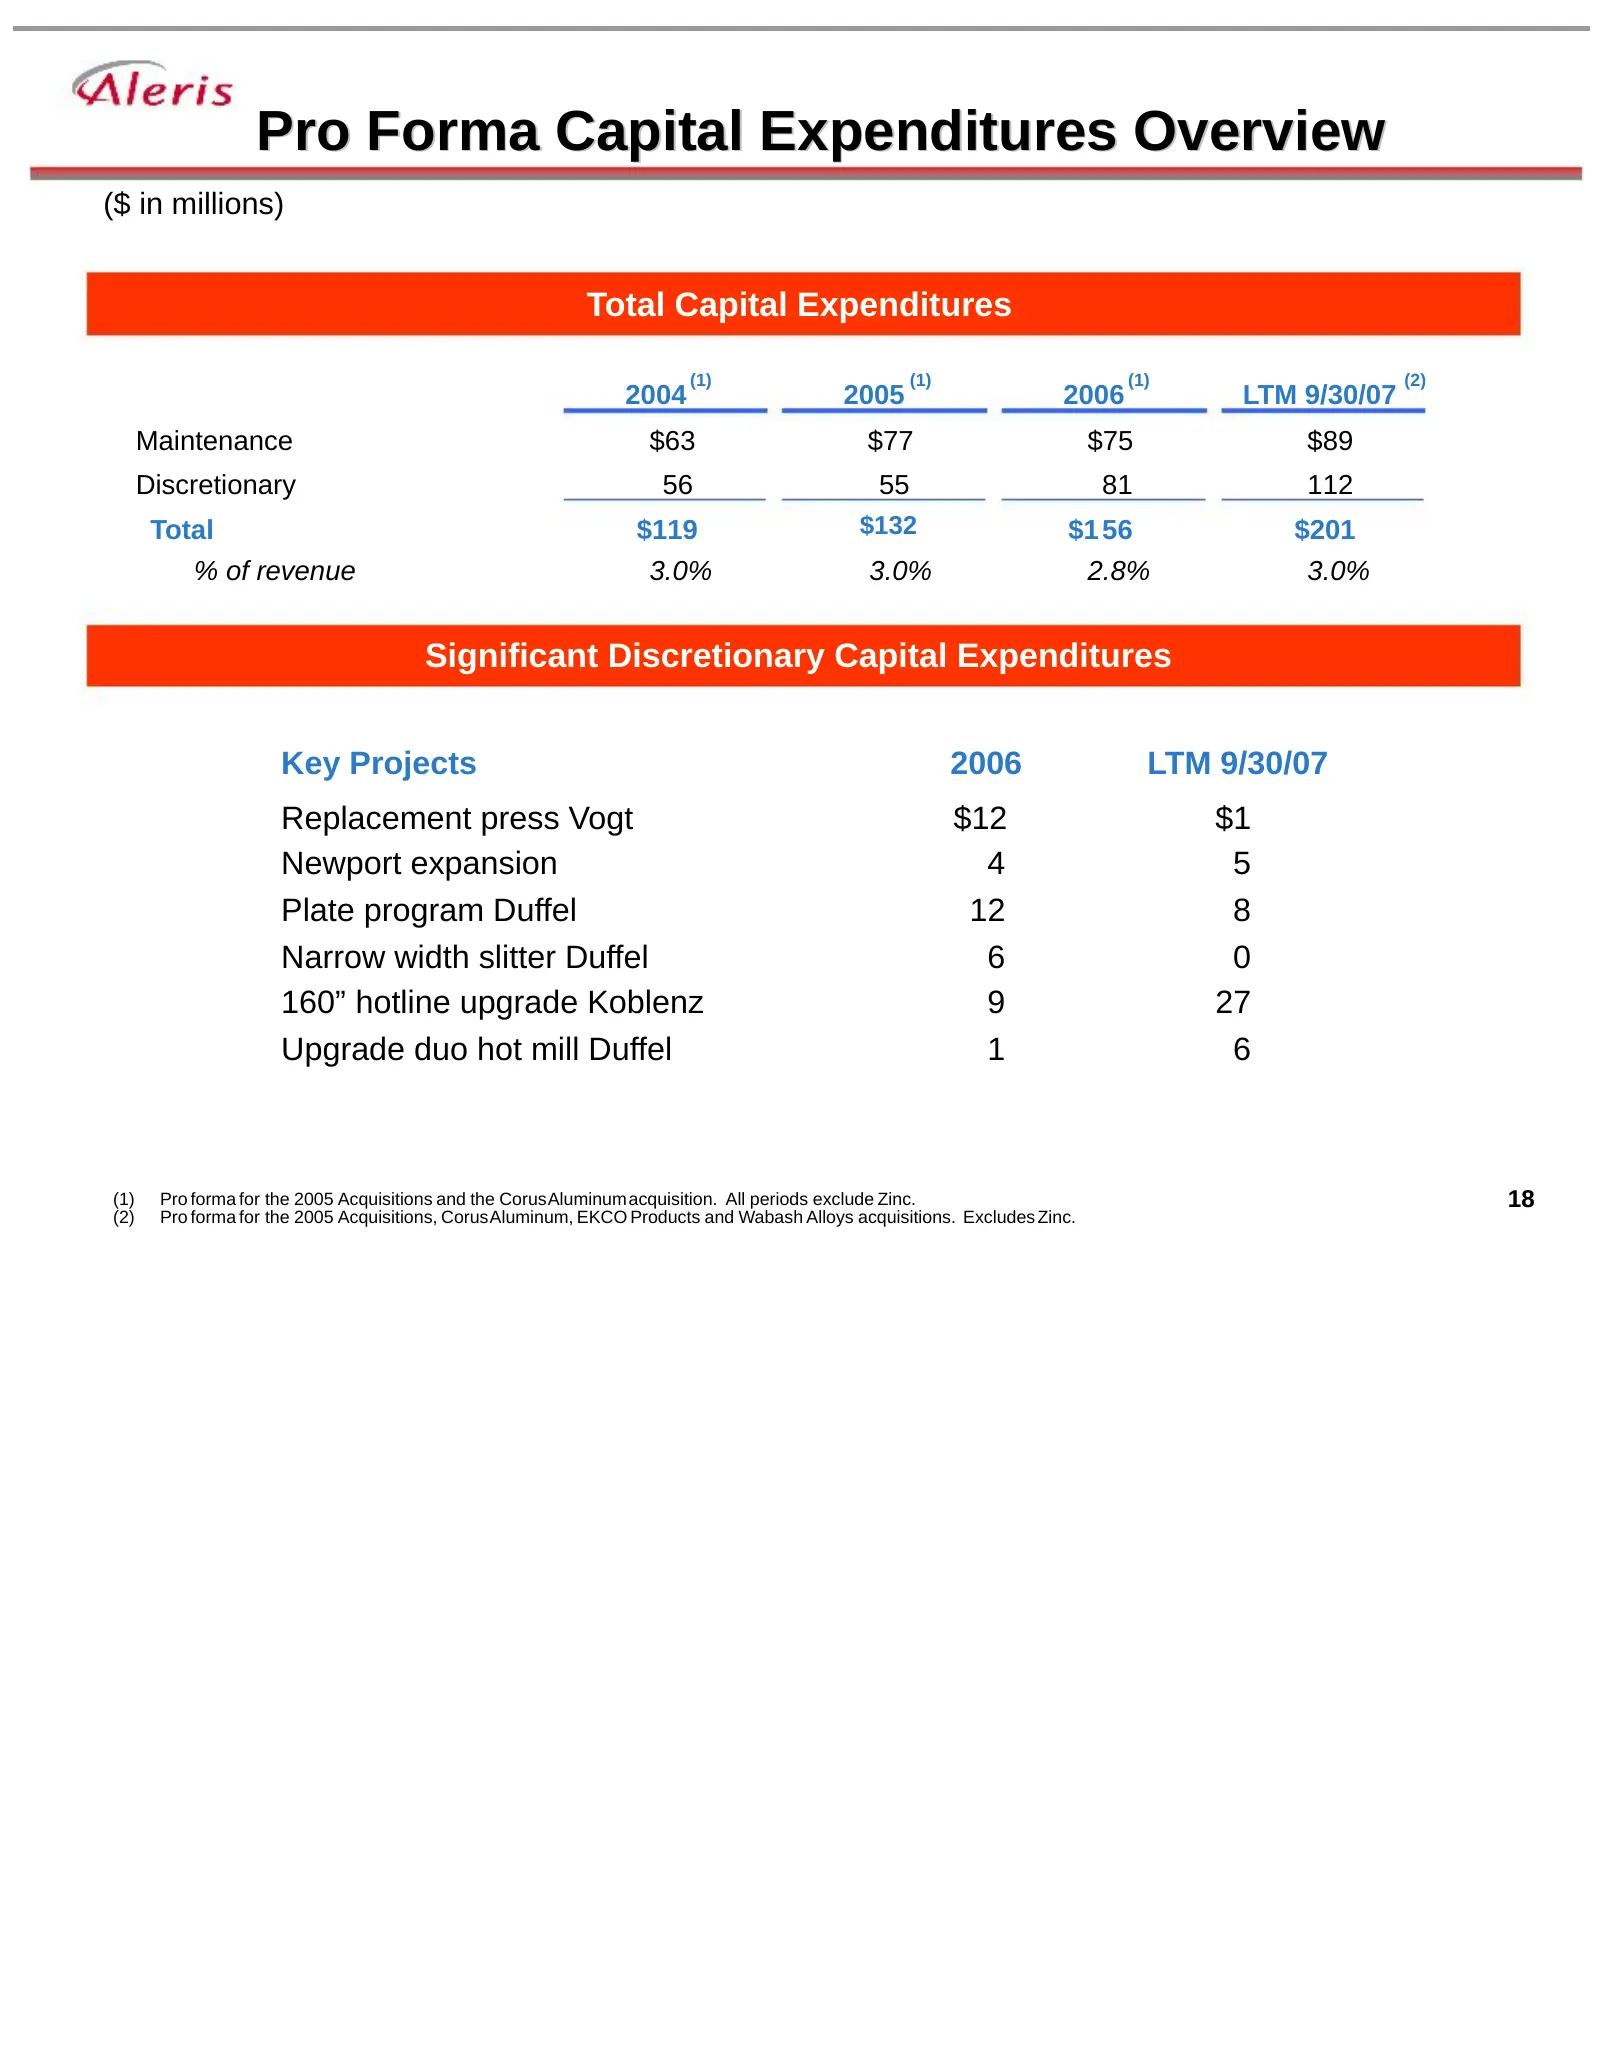
Pro Forma Capital Expenditures Overview ($ in millions) Total Capital Expenditures (1) (1) (1) (2) 2004 2005 2006 LTM 9/30/07 Maintenance $63 $77 $75 $89 Discretionary 56 55 81 112 Total $119 $132 $1 56 $201 % of revenue 3.0% 3.0% 2.8% 3.0% Significant Discretionary Capital Expenditures Key Projects
Slide 19: Appendix: EBITDA & Free Cash Flow Reconciliations
Appendix: EBITDA & Free Cash Flow Reconciliations 19
Slide 20: Reconciliation of Segment Income to Segment EBITDA and Adjusted Segment EBITDA
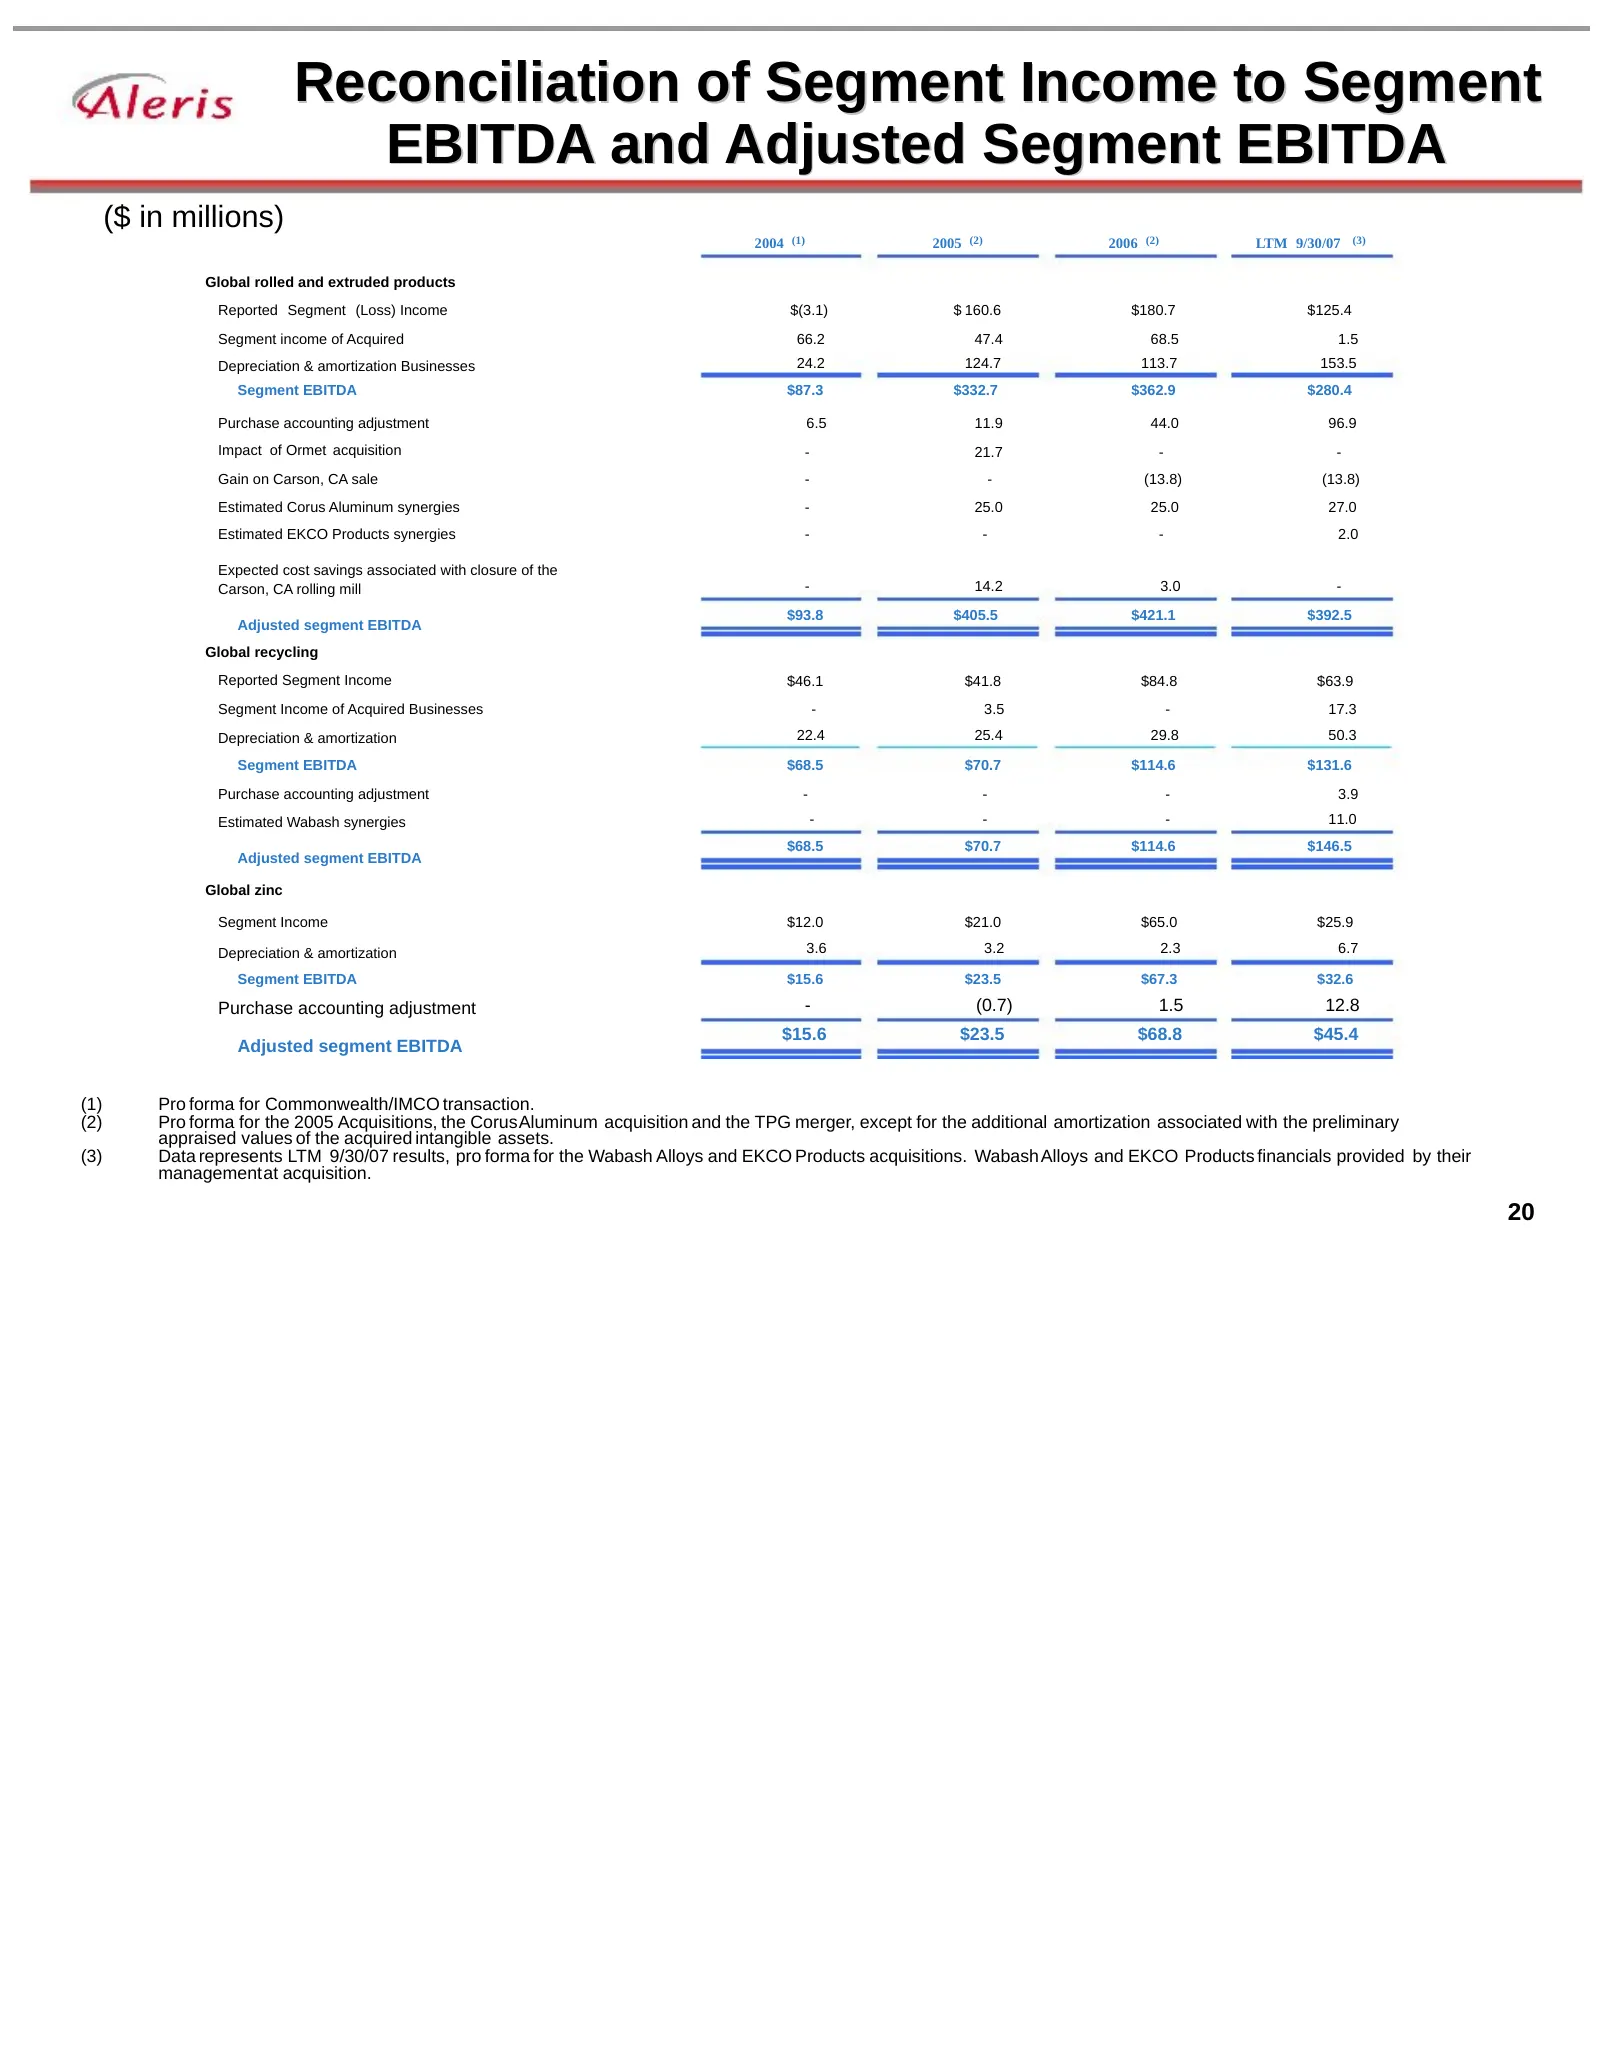
Reconciliation of Segment Income to Segment EBITDA and Adjusted Segment EBITDA ($ in millions) 2004 (1) 2005 (2) 2006 (2) LTM 9/30/07 (3) Global rolled and extruded products Reported Segment (Loss) Income $(3.1) $ 160.6 $180.7 $125.4 Segment income of Acquired 66.2 47.4 68.5 1.5 Depreciation & amort
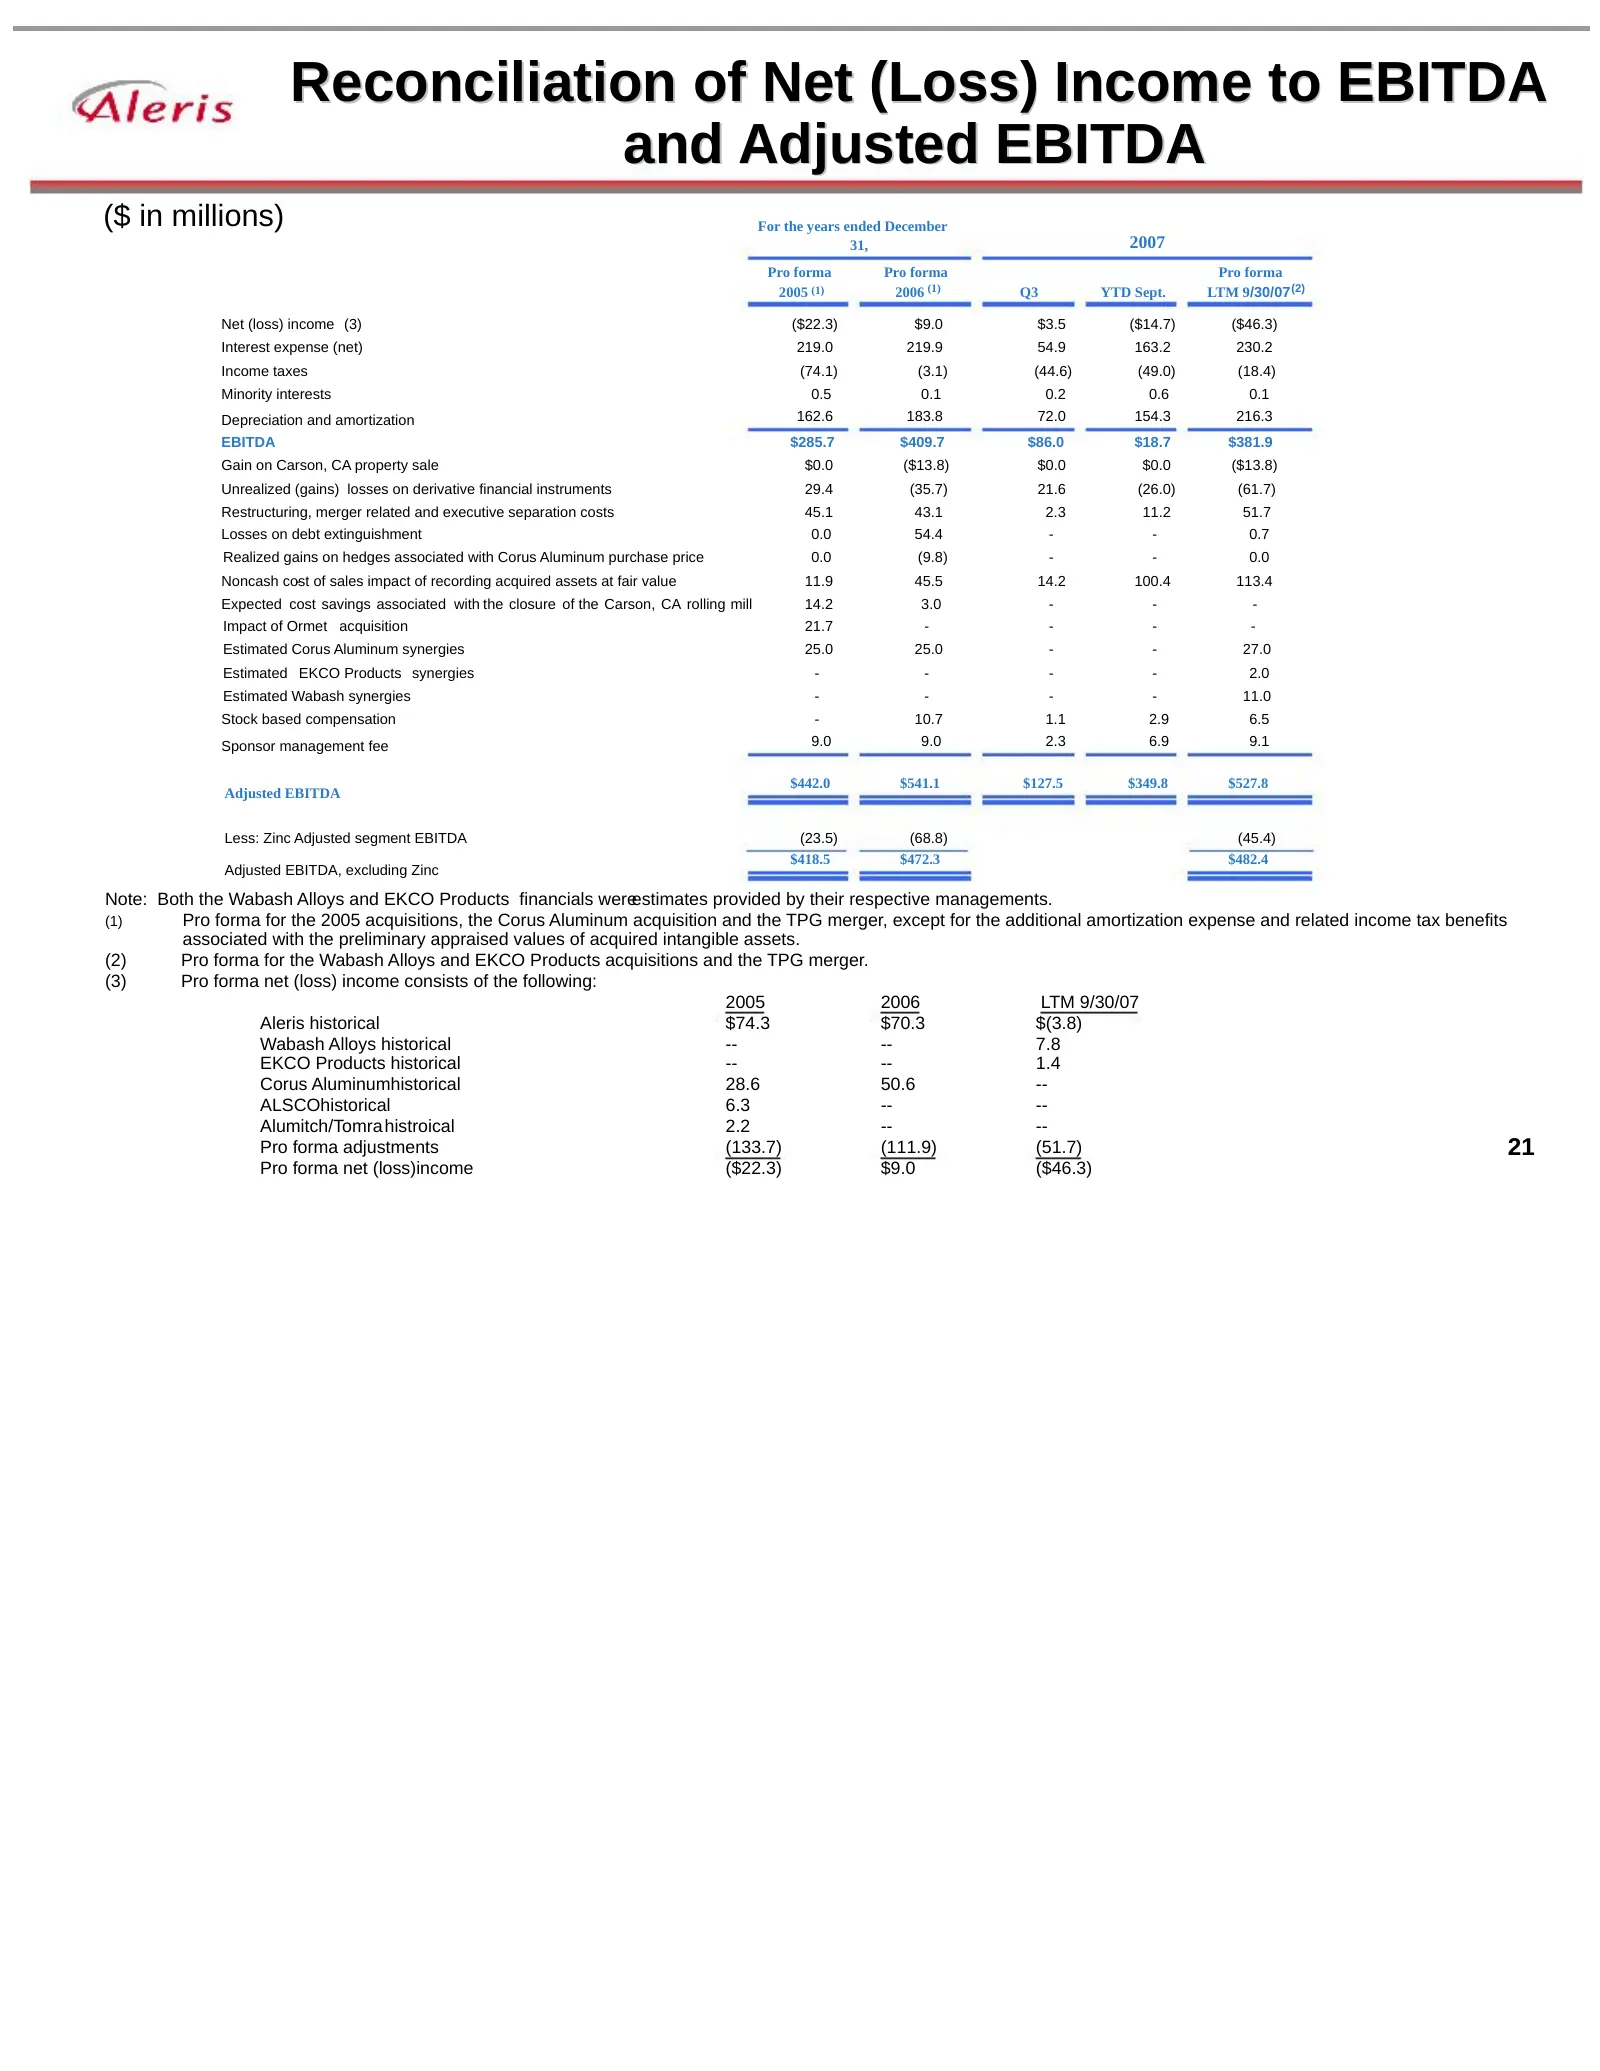
Slide 21: Reconciliation of Net (Loss) Income to EBITDA and Adjusted EBITDA
Reconciliation of Net (Loss) Income to EBITDA and Adjusted EBITDA ($ in millions) For the years ended December 31, 2007 Pro forma Pro forma Pro forma 2005 (1) 2006 (1) Q3 YTD Sept. LTM 9/30/07 (2) Net (loss) income (3) ($22.3) $9.0 $3.5 ($14.7) ($46.3) Interest expense (net) 219.0 219.9 54.9 163.2 2
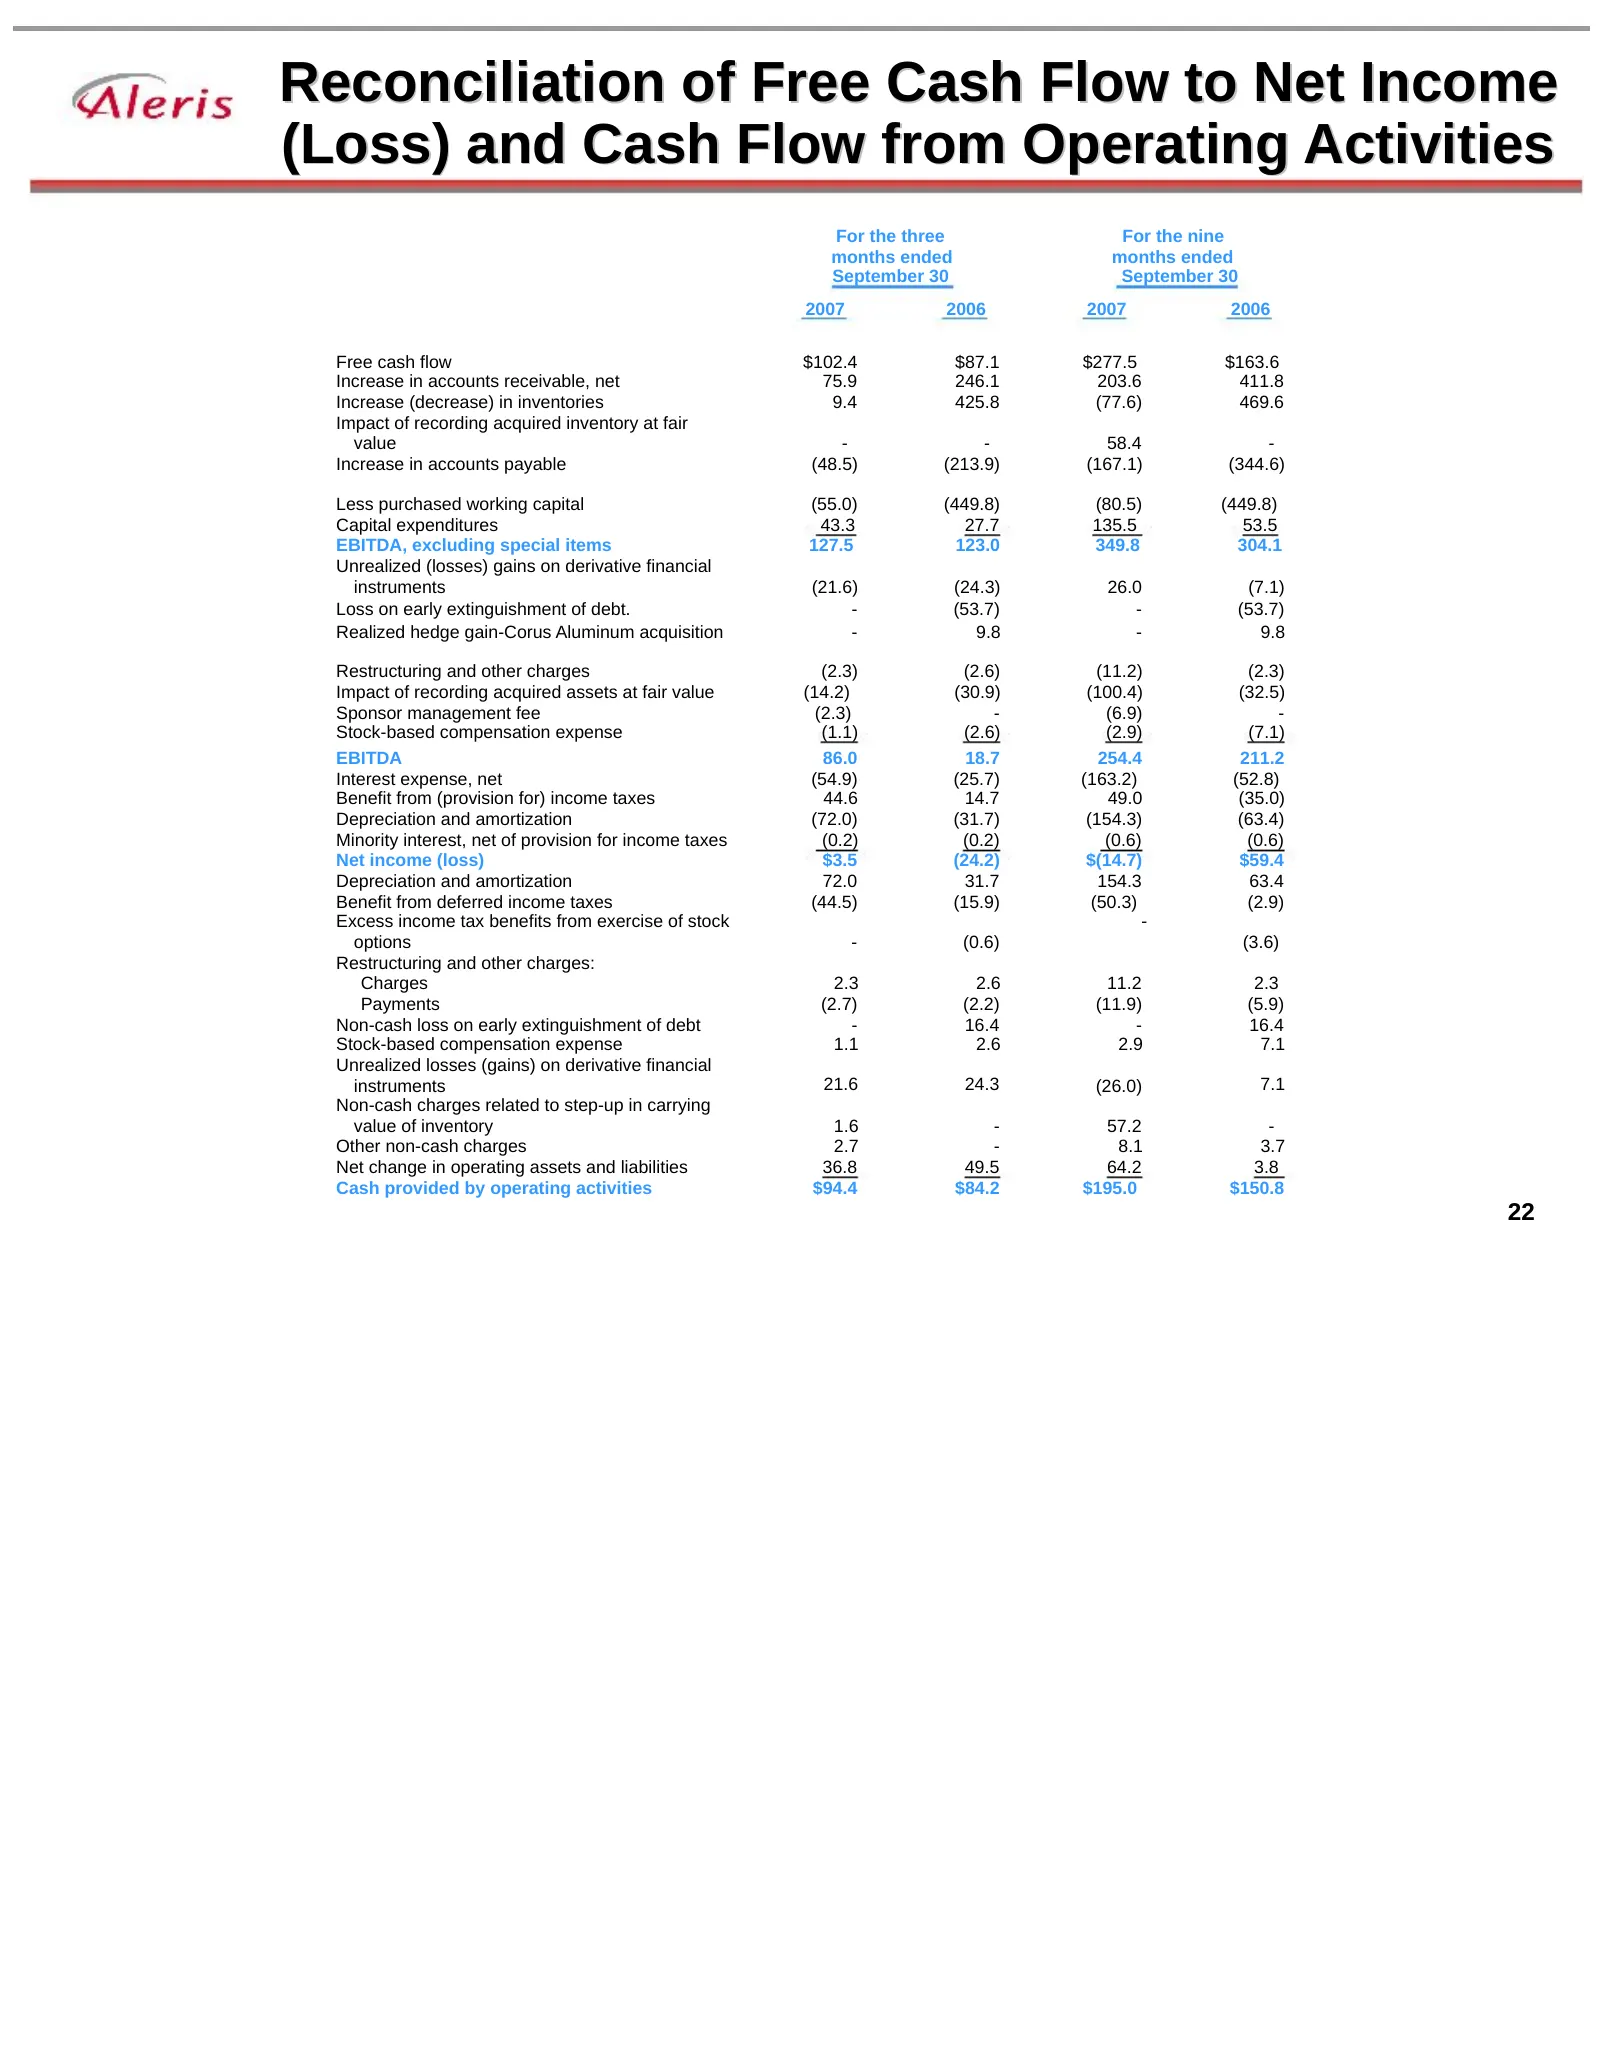
Slide 22: Reconciliation of Free Cash Flow to Net Income (Loss) and Cash Flow from Operating Activities
Reconciliation of Free Cash Flow to Net Income (Loss) and Cash Flow from Operating Activities For the three For the nine months ended months ended September 30 September 30 2007 2006 2007 2006 Free cash flow $102.4 $87.1 $277.5 $163.6 Increase in accounts receivable, net 75.9 246.1 203.6 411.8 Incre

Slide 23: Aleris Q&A
“Aleris Q&A 23
Source: SEC EDGAR · 8-K filed Nov 28, 2007
More decks from Aleris International Inc
 2008 Bank of America Credit Conference26 slides · Nov 21, 2008
 Deutsche Bank Leverage Finance Conference 200828 slides · Sep 25, 2008
 FY2007 Earnings Presentation33 slides · Mar 31, 2008
 FY2007 Earnings Presentation33 slides · Mar 27, 2008
 Investor Presentation (October 2007)14 slides · Oct 3, 2007
 Debt Investor Presentation (March 2007)6 slides · Mar 7, 2007