Aleris International — FY2007 Earnings Presentation
33 slides from Aleris International's earnings presentation, Mar 31, 2008
Slide 1: Fourth Quarter and Full Year 2007 Earnings Call Webcast
Exhibit 99.2 Fourth Quarter and Full Year 2007 Earnings Call Webcast March 27, 2008 Revised March 31, 2008 9:00 am EDT 3/27/08 1
Slide 2: Forward Looking Statements
Forward Looking Statements The following information contains, or may be deemed to contain, “forward- looking statements” (as defined in the U.S. Private Securities Litigation Reform Act of 1995). By their nature, forward-looking statements involve risks and uncertainties because they relate to even
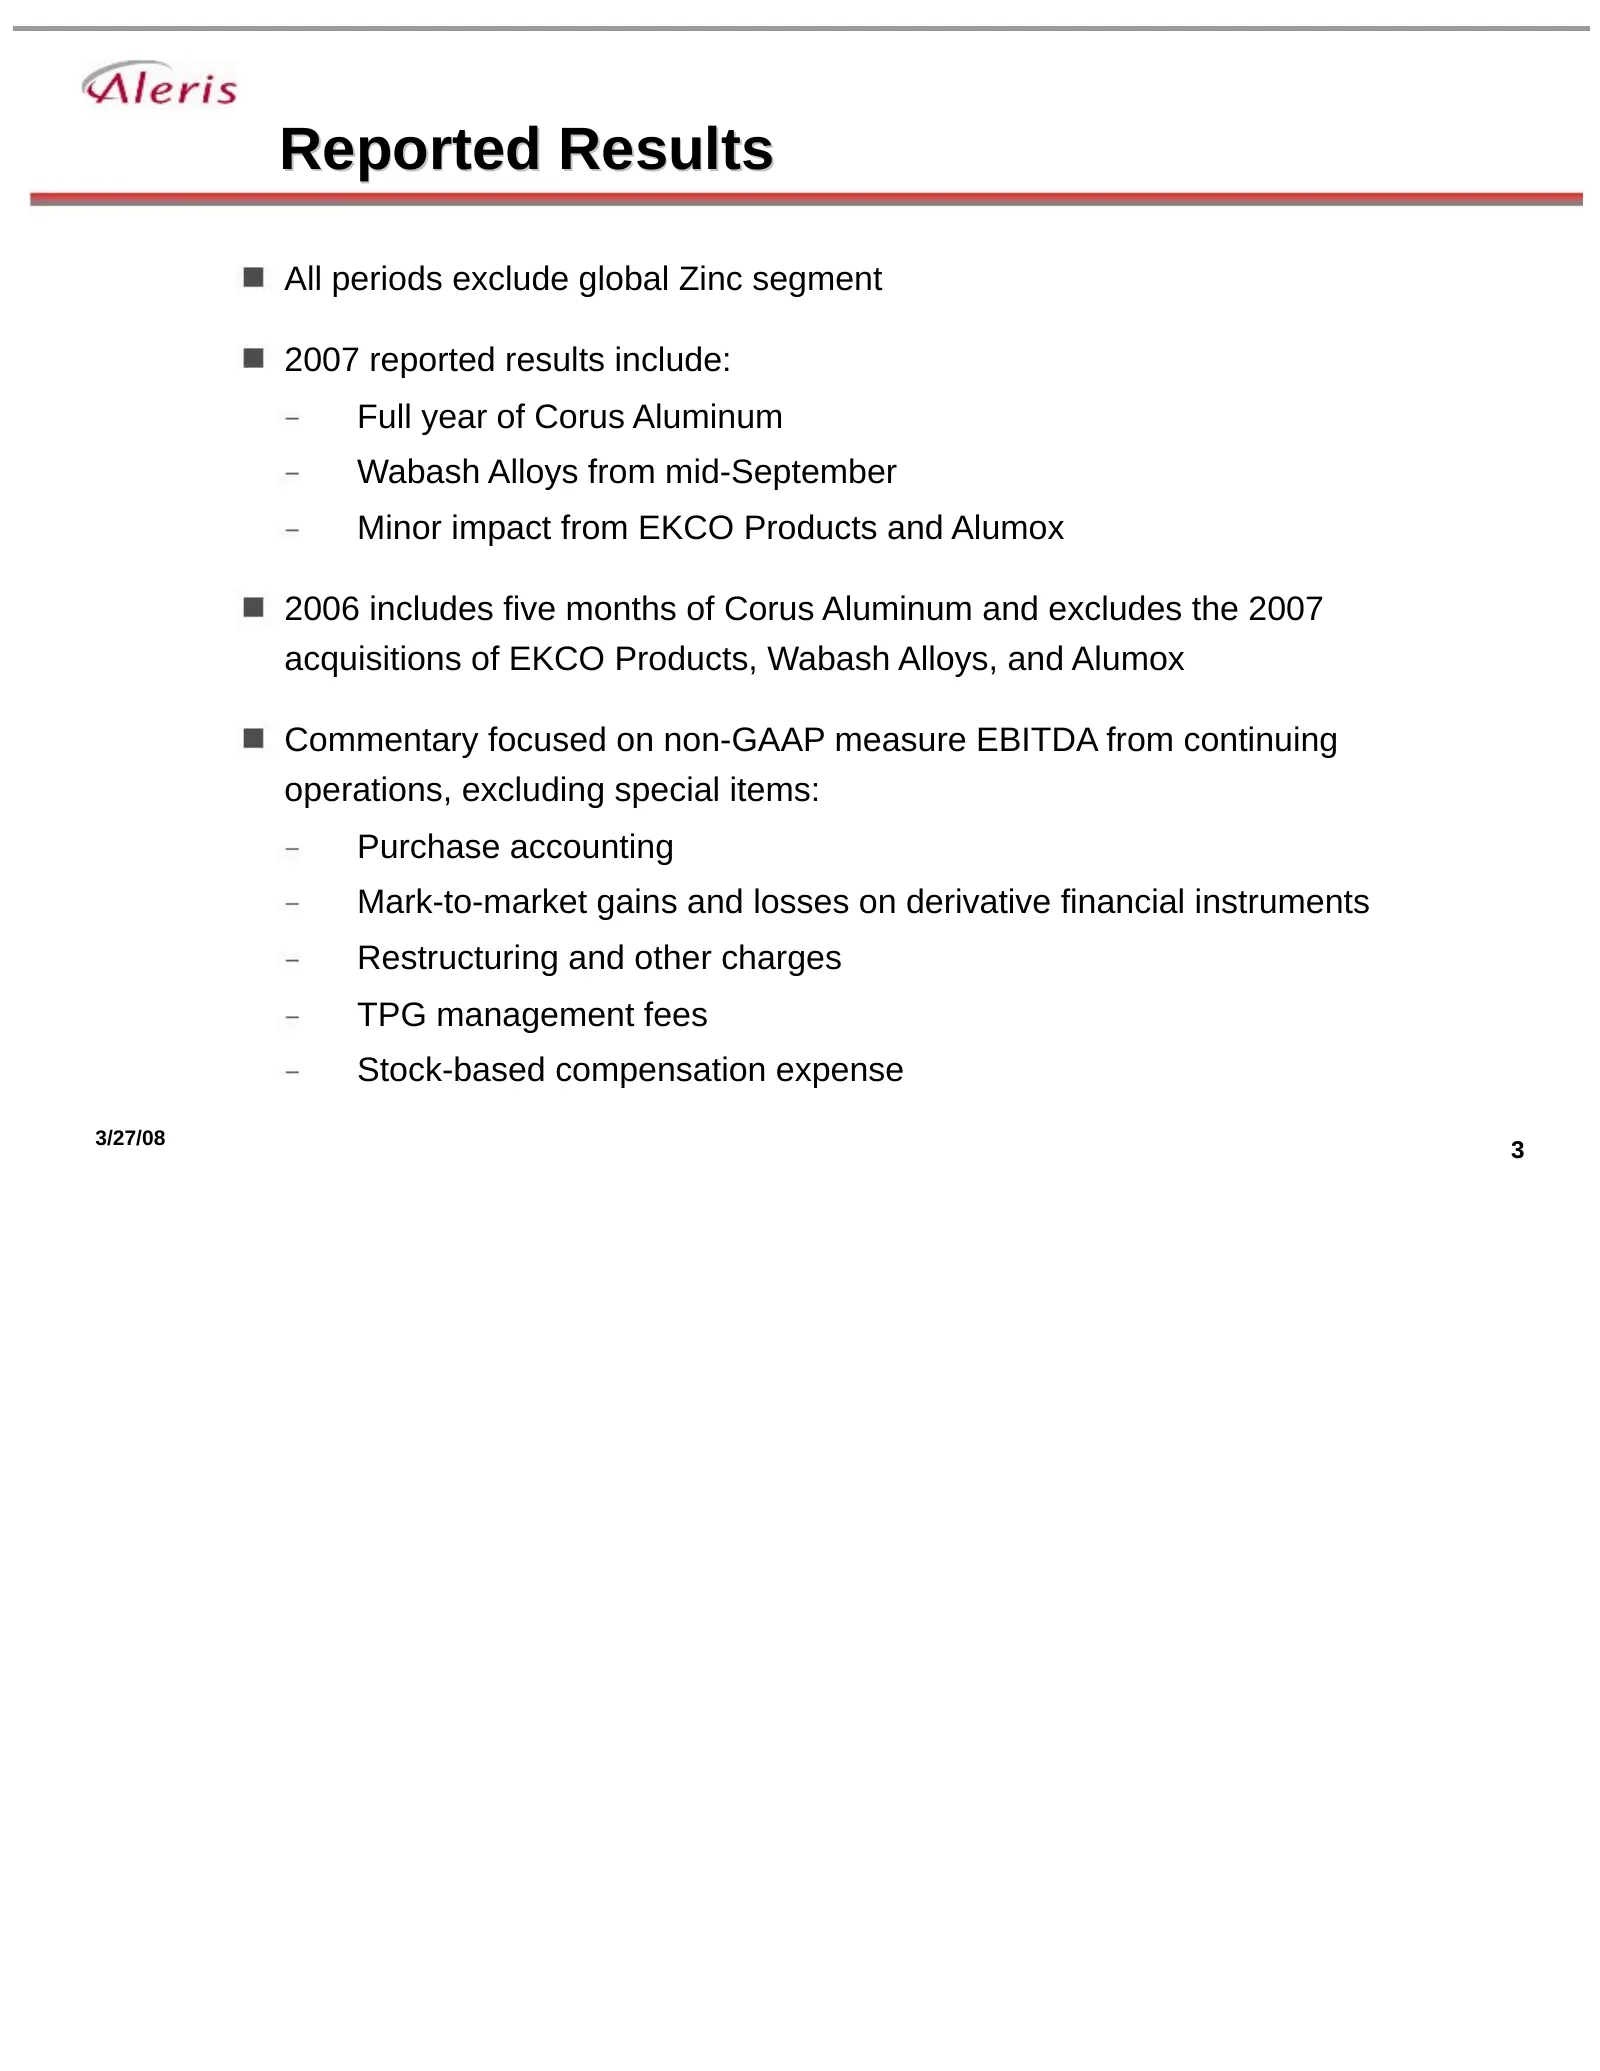
Slide 3: Reported Results
Reported Results All periods exclude global Zinc segment 2007 reported results include: Full year of Corus Aluminum Wabash Alloys from mid-September Minor impact from EKCO Products and Alumox 2006 includes five months of Corus Aluminum and excludes the 2007 acquisitions of EKCO Products, Wabash Allo
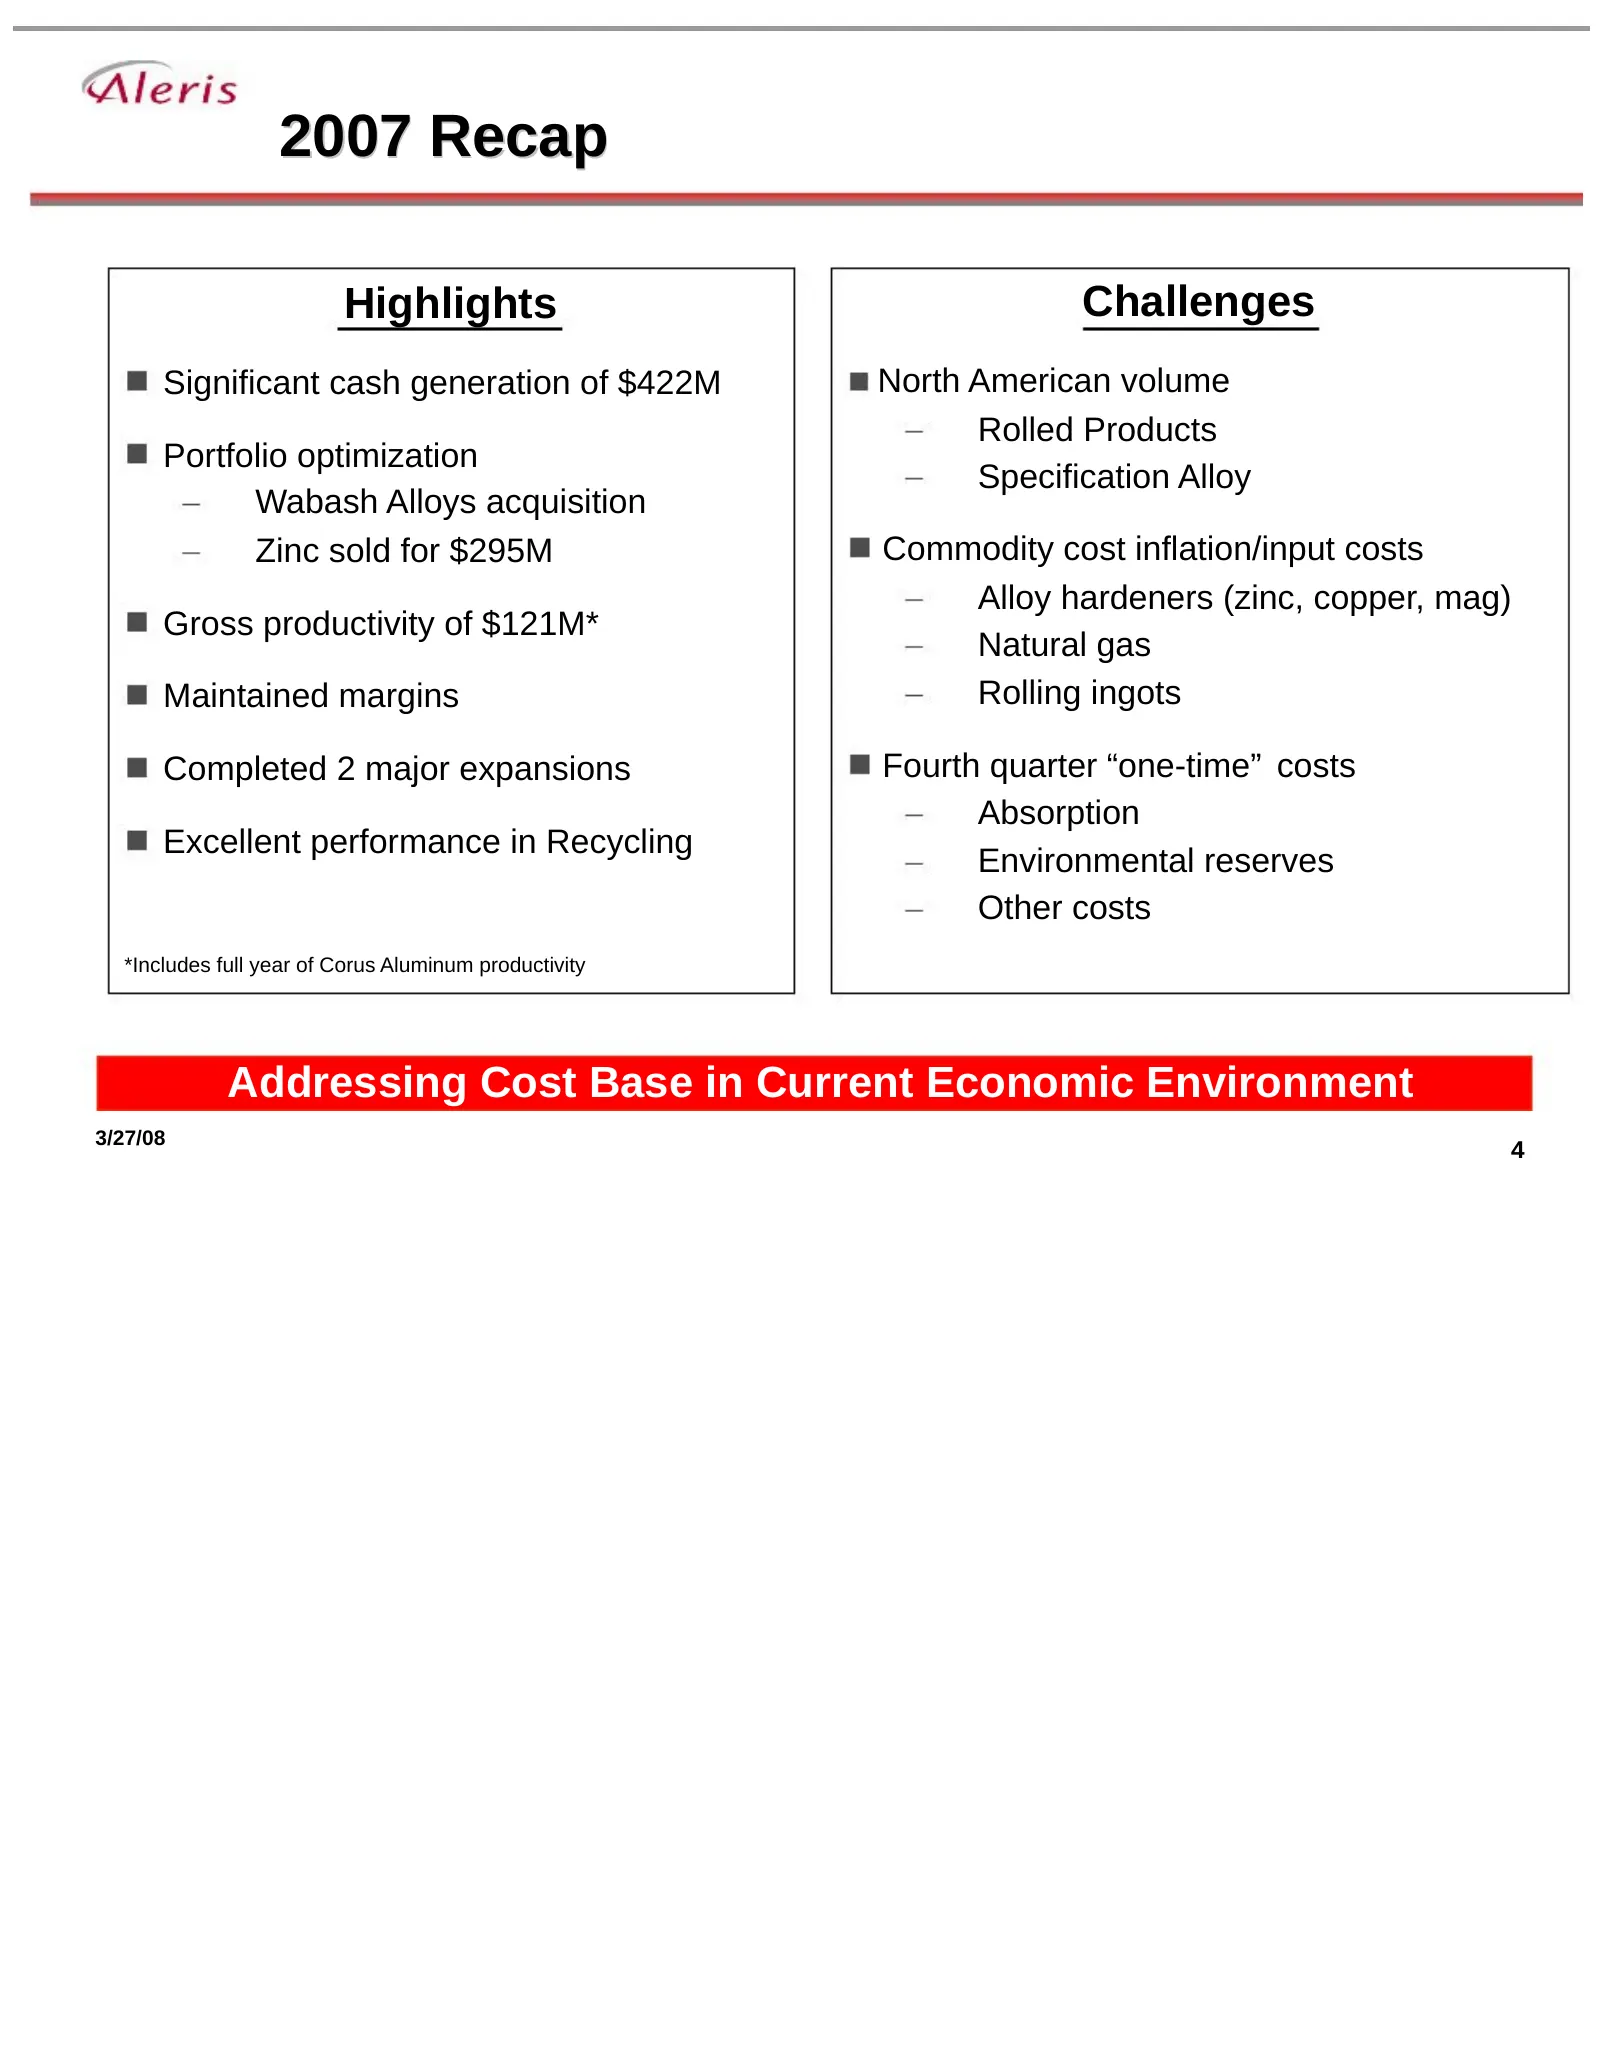
Slide 4: 2007 Recap
2007 Recap Highlights Challenges Significant cash generation of $422M North American volume Rolled Products Portfolio optimization Specification Alloy Wabash Alloys acquisition Zinc sold for $295M Commodity cost inflation/input costs Alloy hardeners (zinc, copper, mag) Gross productivity of $121M* N
Slide 5: 2007 Performance
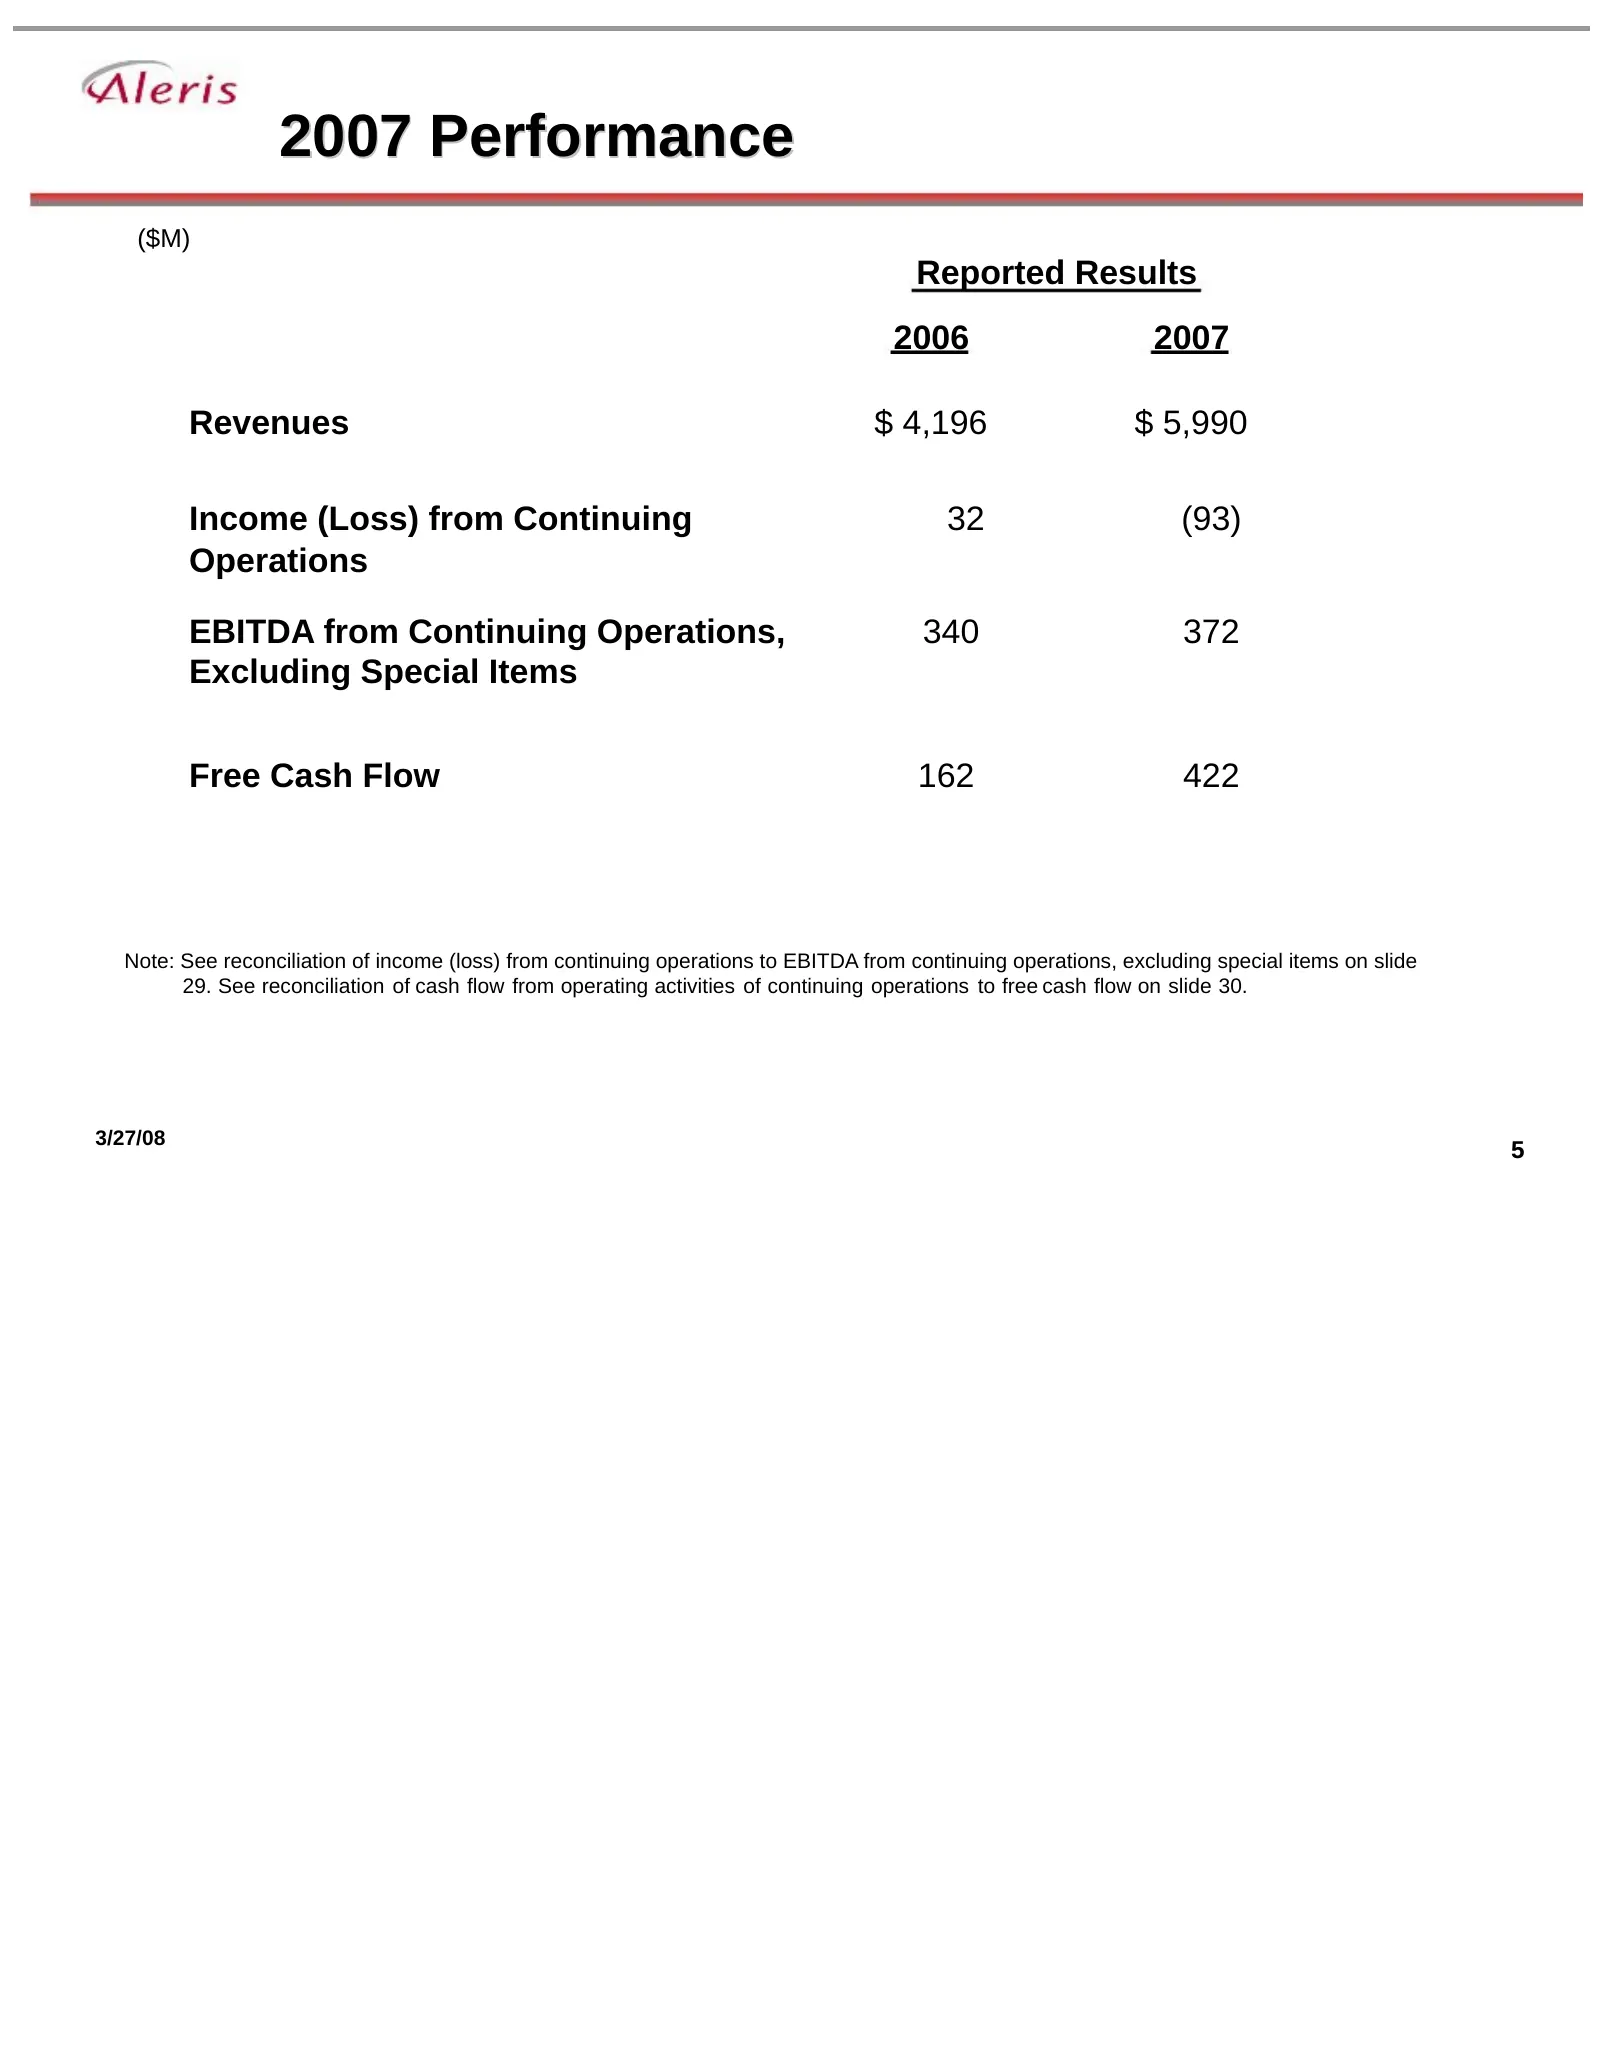
2007 Performance ($M) Reported Results 2006 2007 Revenues $ 4,196 $ 5,990 Income (Loss) from Continuing 32 (93) Operations EBITDA from Continuing Operations, 340 372 Excluding Special Items Free Cash Flow 162 422 Note: See reconciliation of income (loss) from continuing operations to EBITDA from con
Slide 6: Full Year Comparison
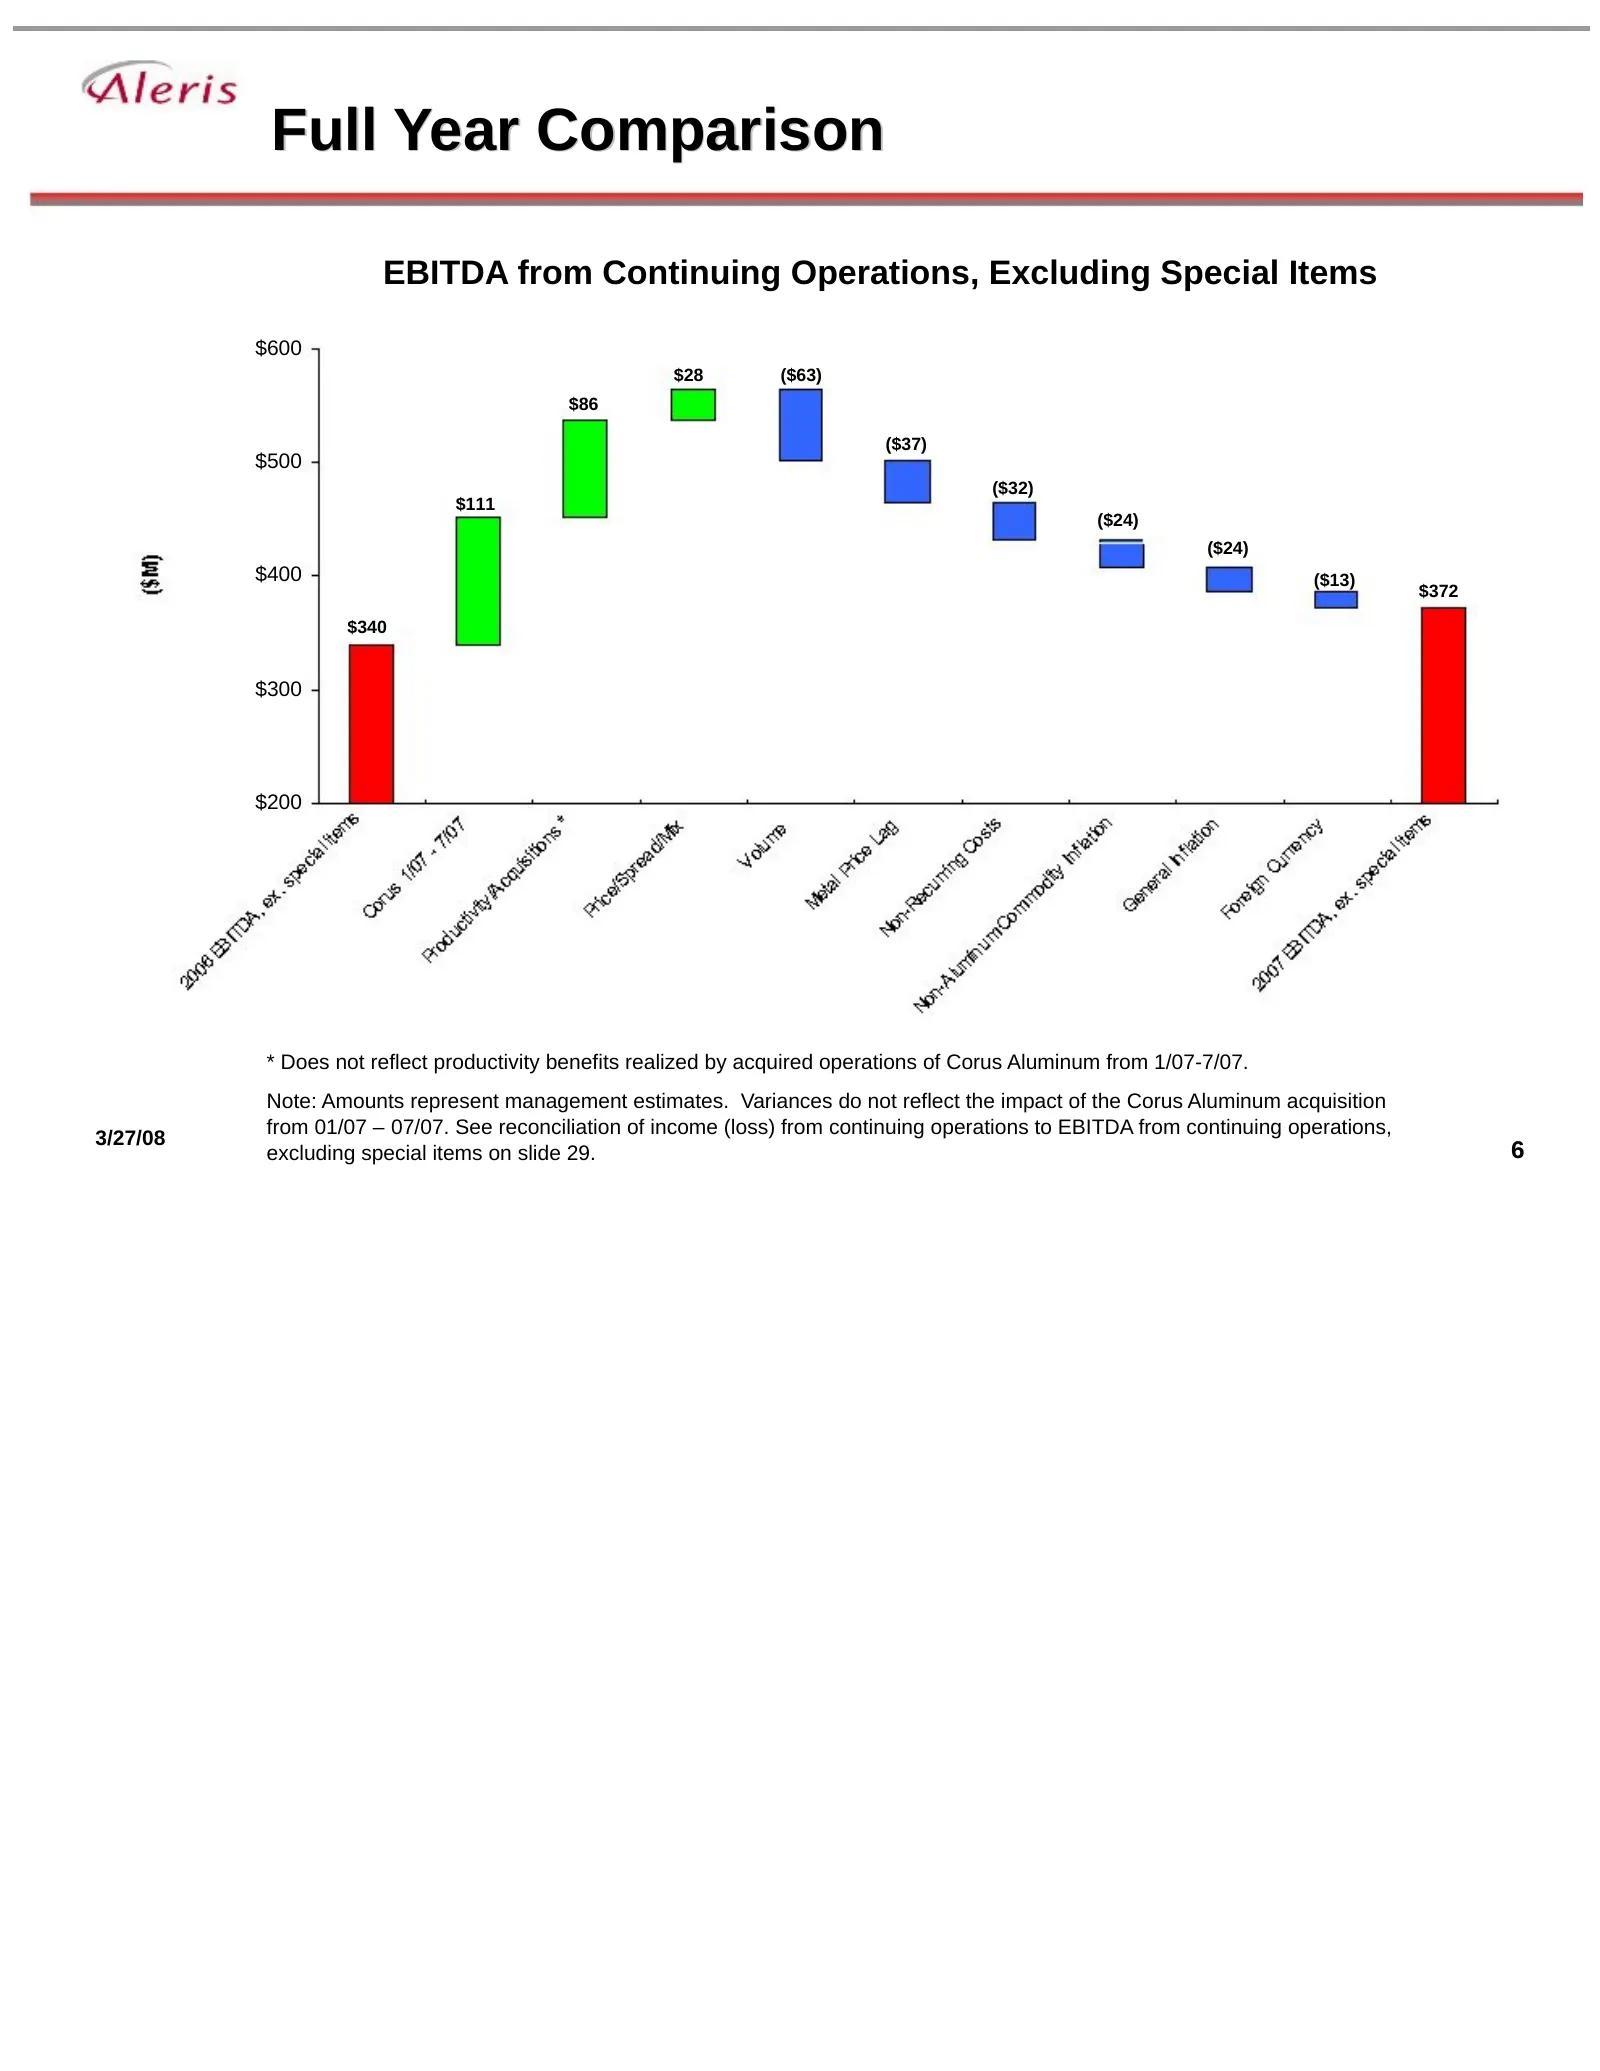
Full Year Comparison EBITDA from Continuing Operations, Excluding Special Items $600 $28 ($63) $86 ($37) $500 ($32) $111 ($24) ($24) $400 ($13) $372 $340 $300 $200 * Does not reflect productivity benefits realized by acquired operations of Corus Aluminum from 1/07-7/07. Note: Amounts represent manag
Slide 7: “One-Time” Costs
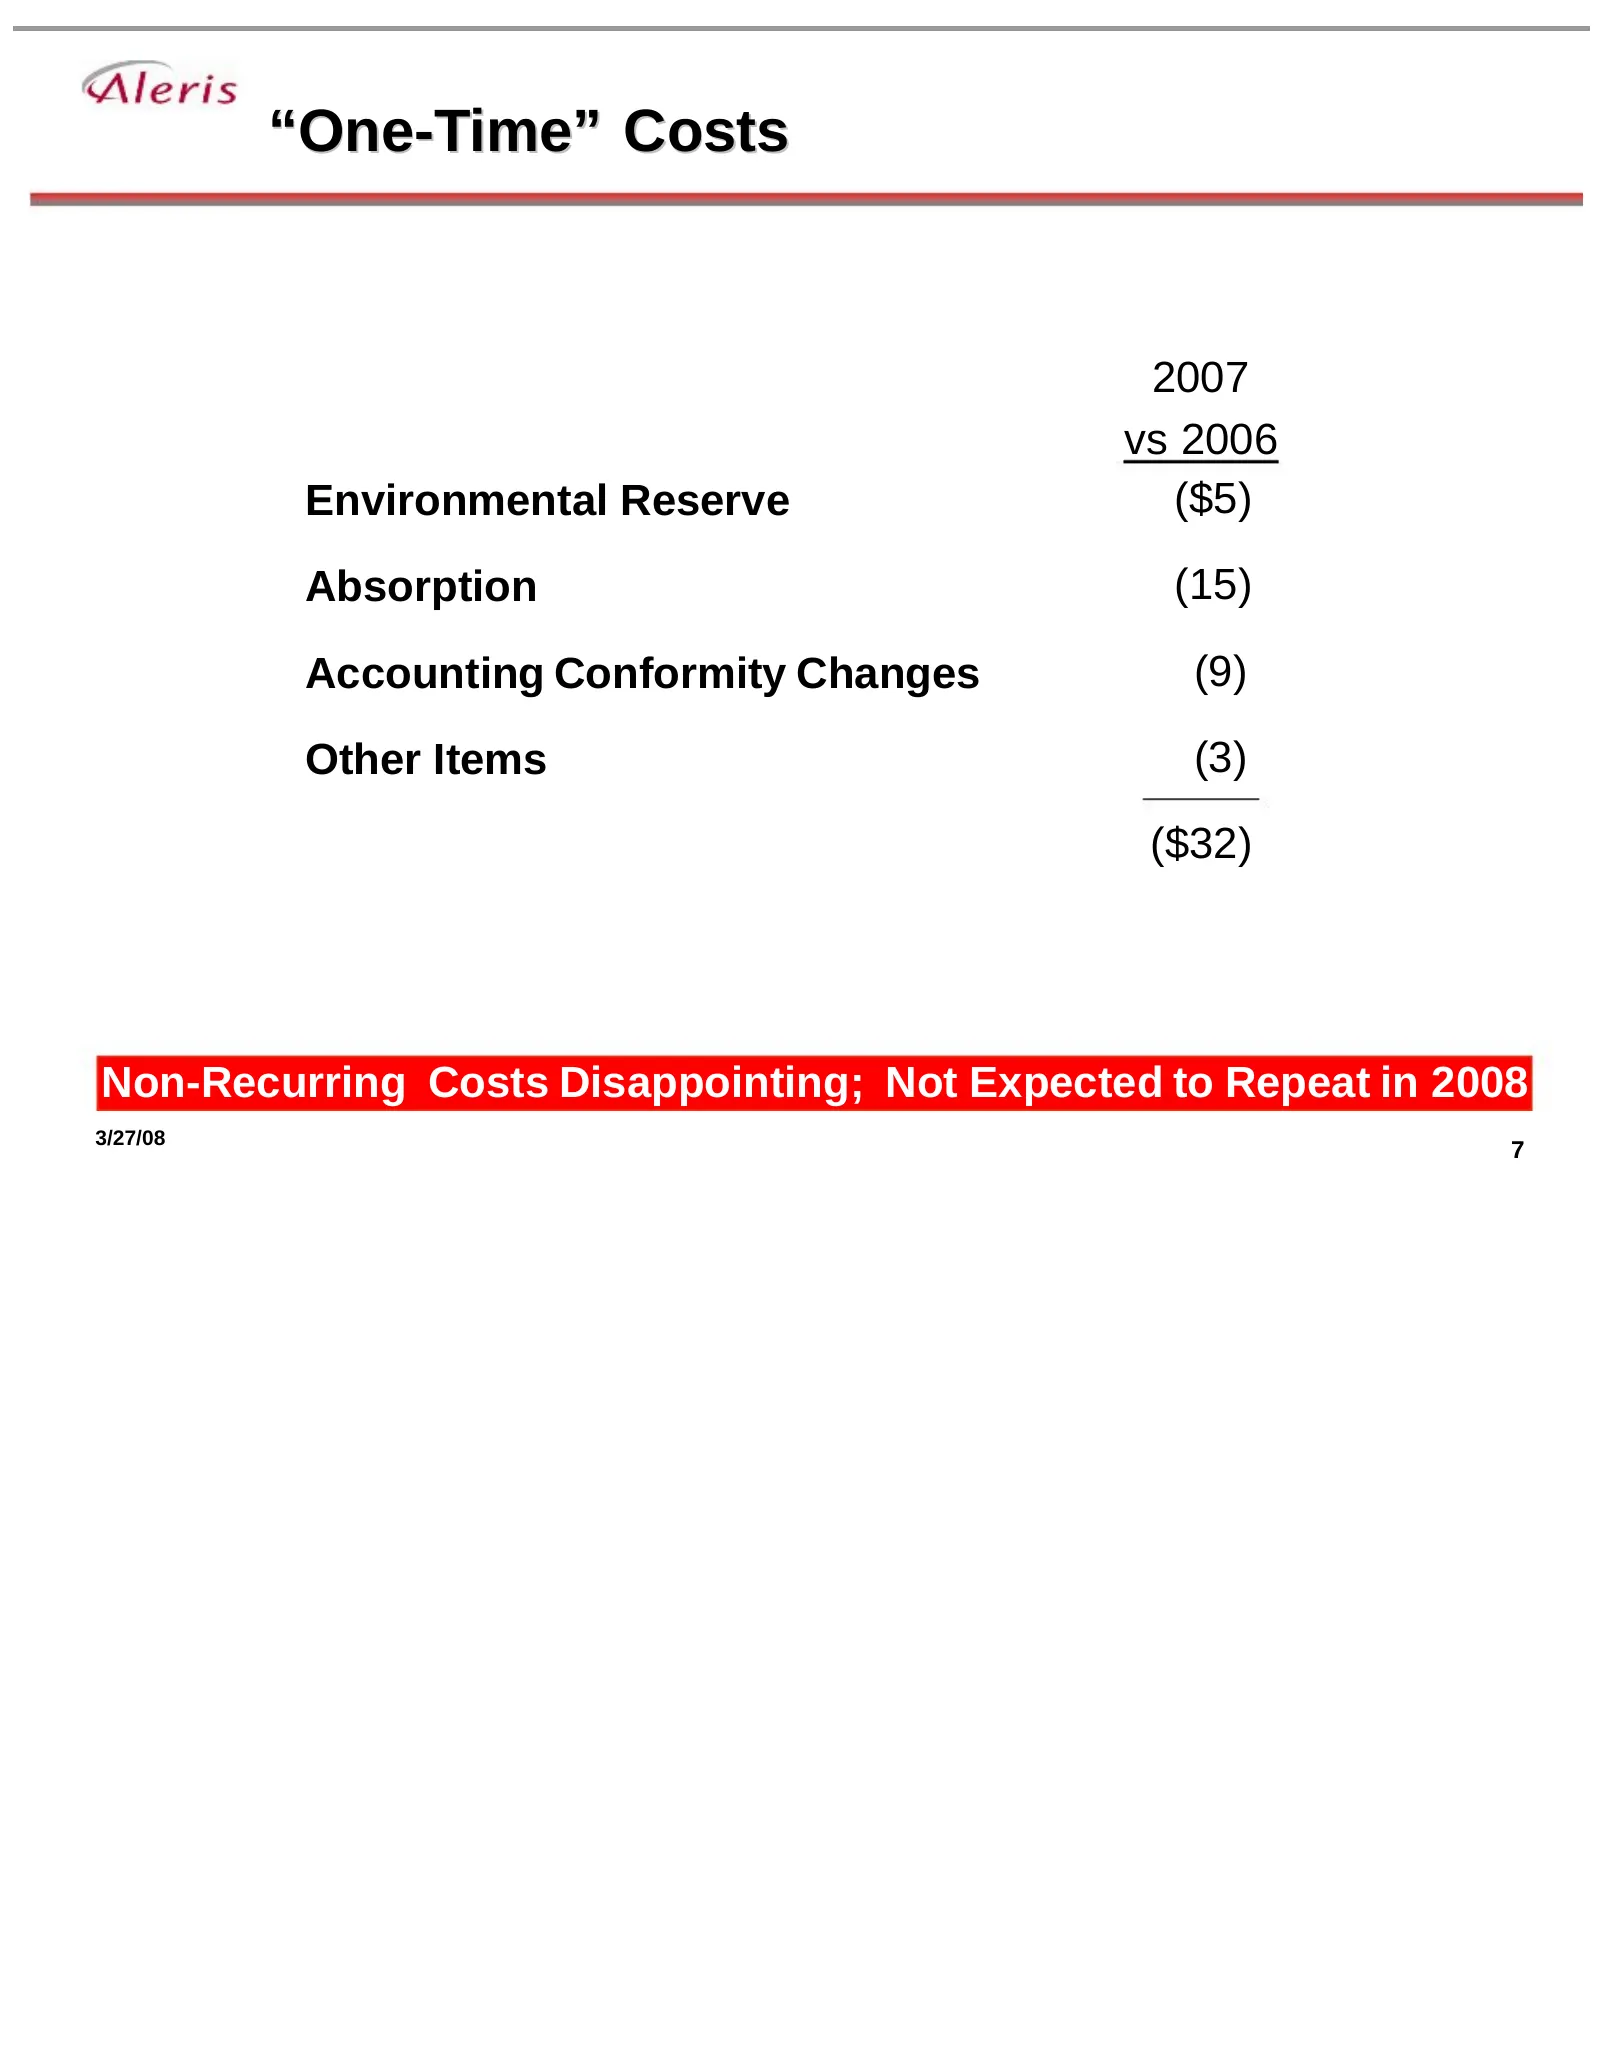
“One-Time” Costs 2007 vs 2006 Environmental Reserve ($5) Absorption (15) Accounting Conformity Changes (9) Other Items (3) ($32) Non-Recurring Costs Disappointing; Not Expected to Repeat in 2008 3/27/08 7
Slide 8: Pounds Shipped
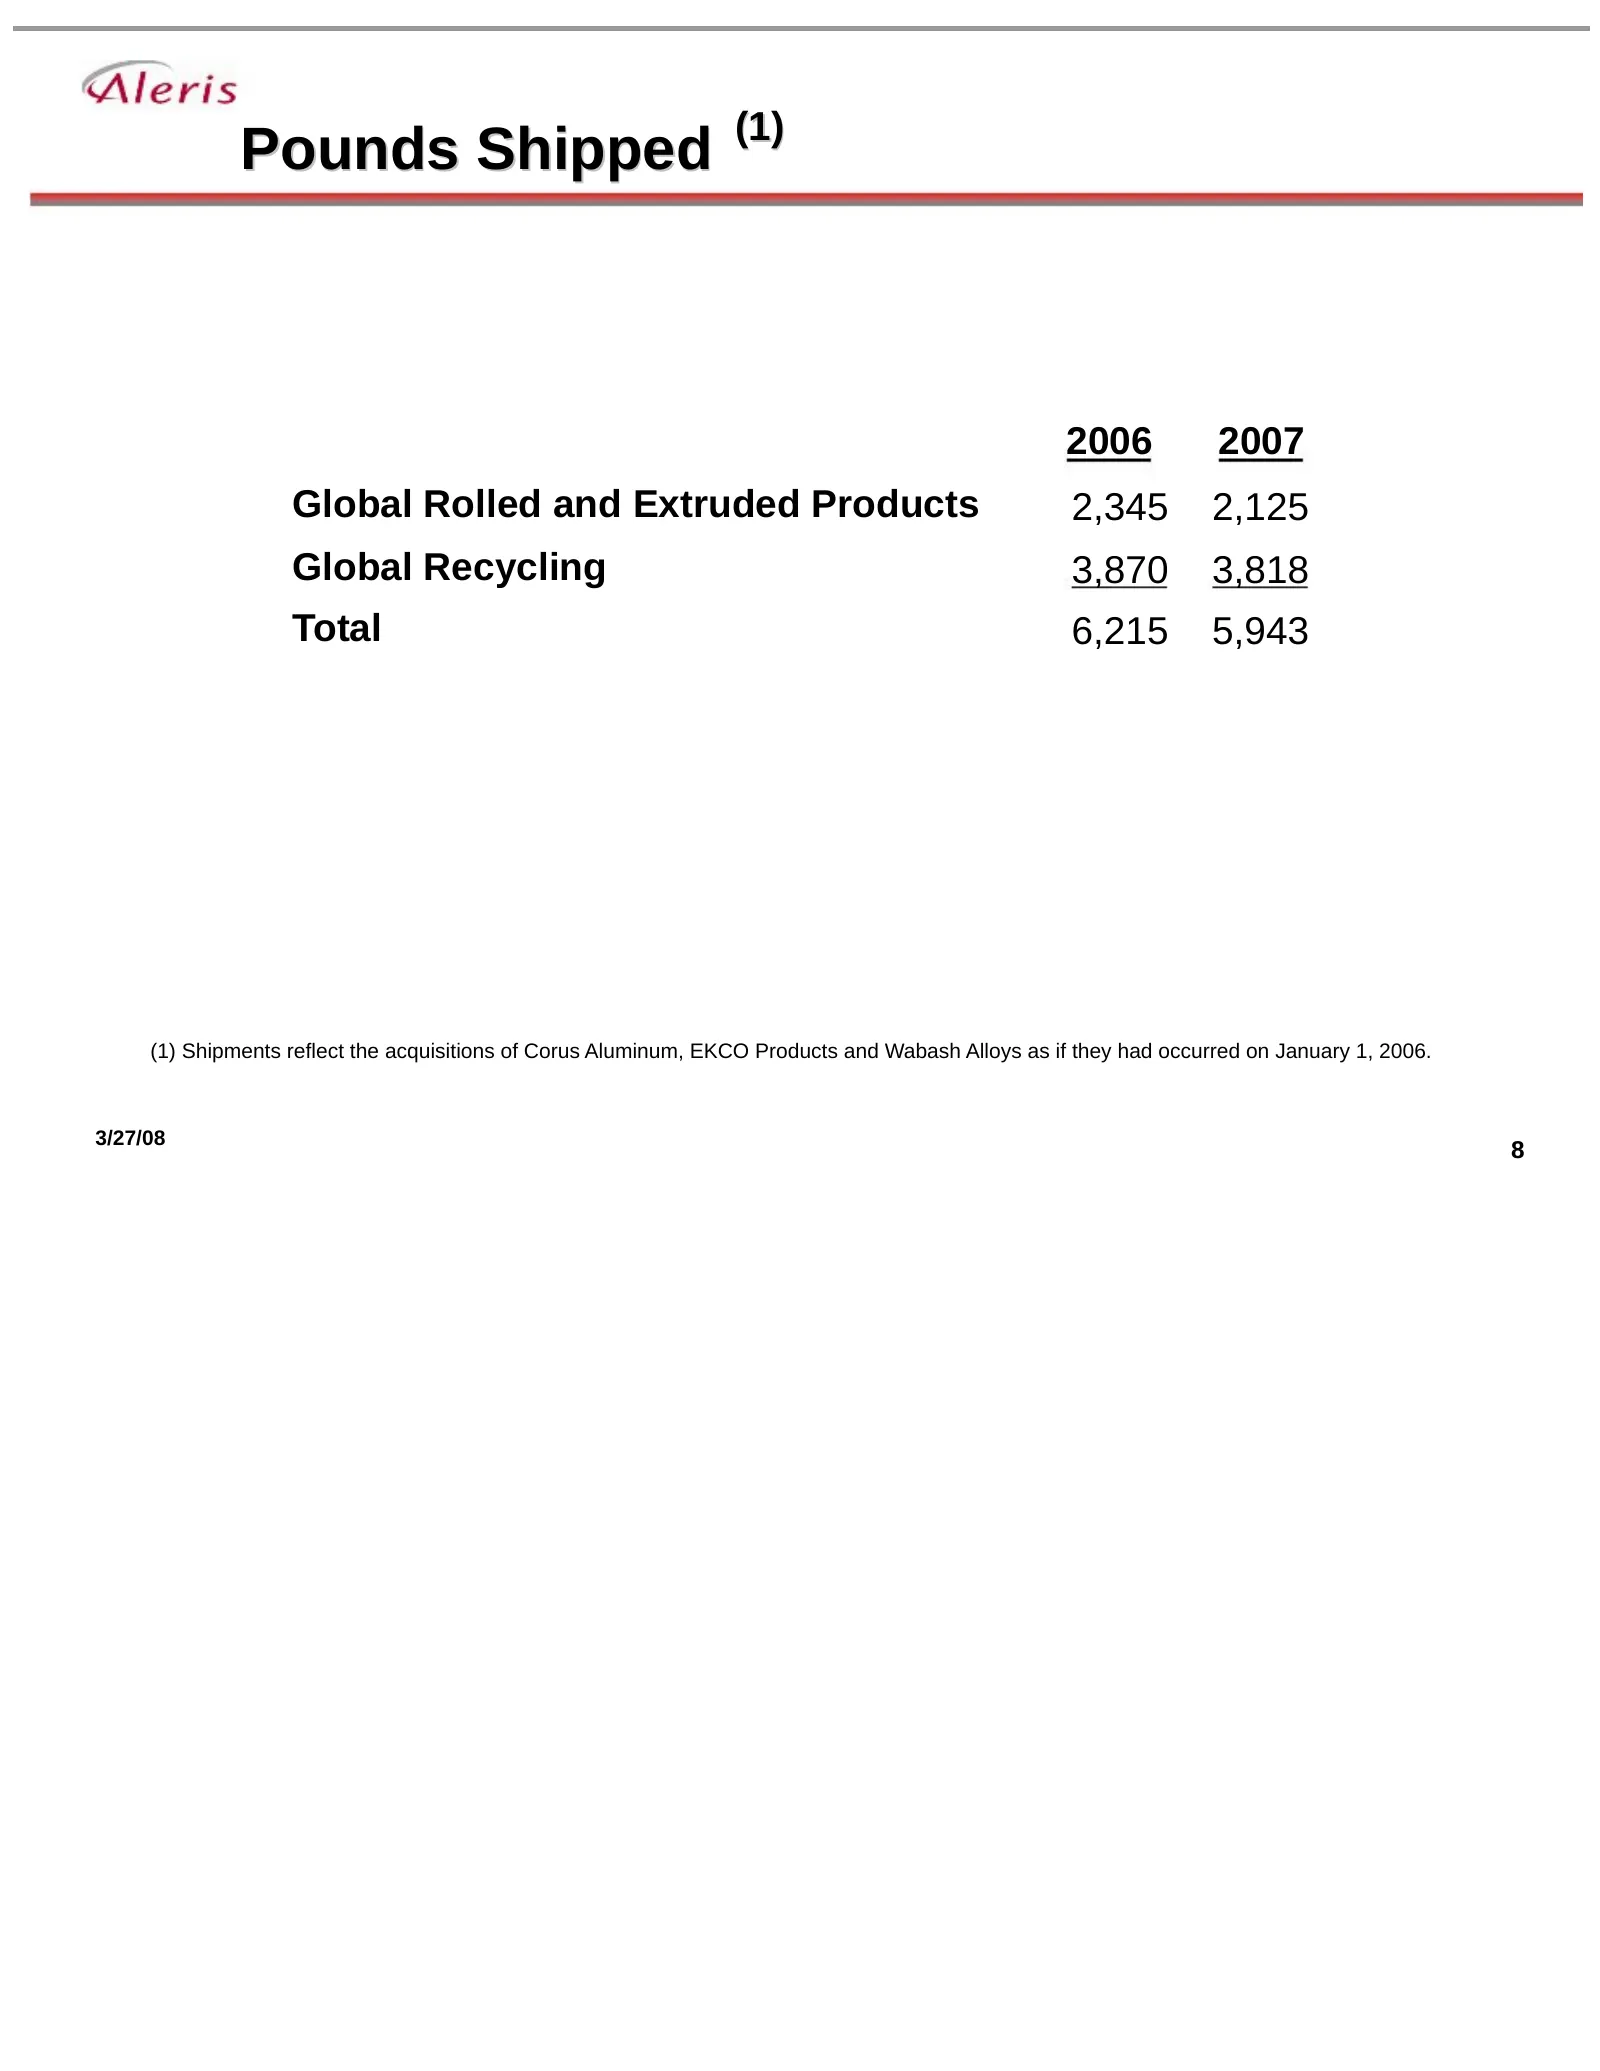
Pounds Shipped (1) 2006 2007 Global Rolled and Extruded Products 2,345 2,125 Global Recycling 3,870 3,818 Total 6,215 5,943 (1) Shipments reflect the acquisitions of Corus Aluminum, EKCO Products and Wabash Alloys as if they had occurred on January 1, 2006. 3/27/08 8
Slide 9: 2007 North American Rolled Products
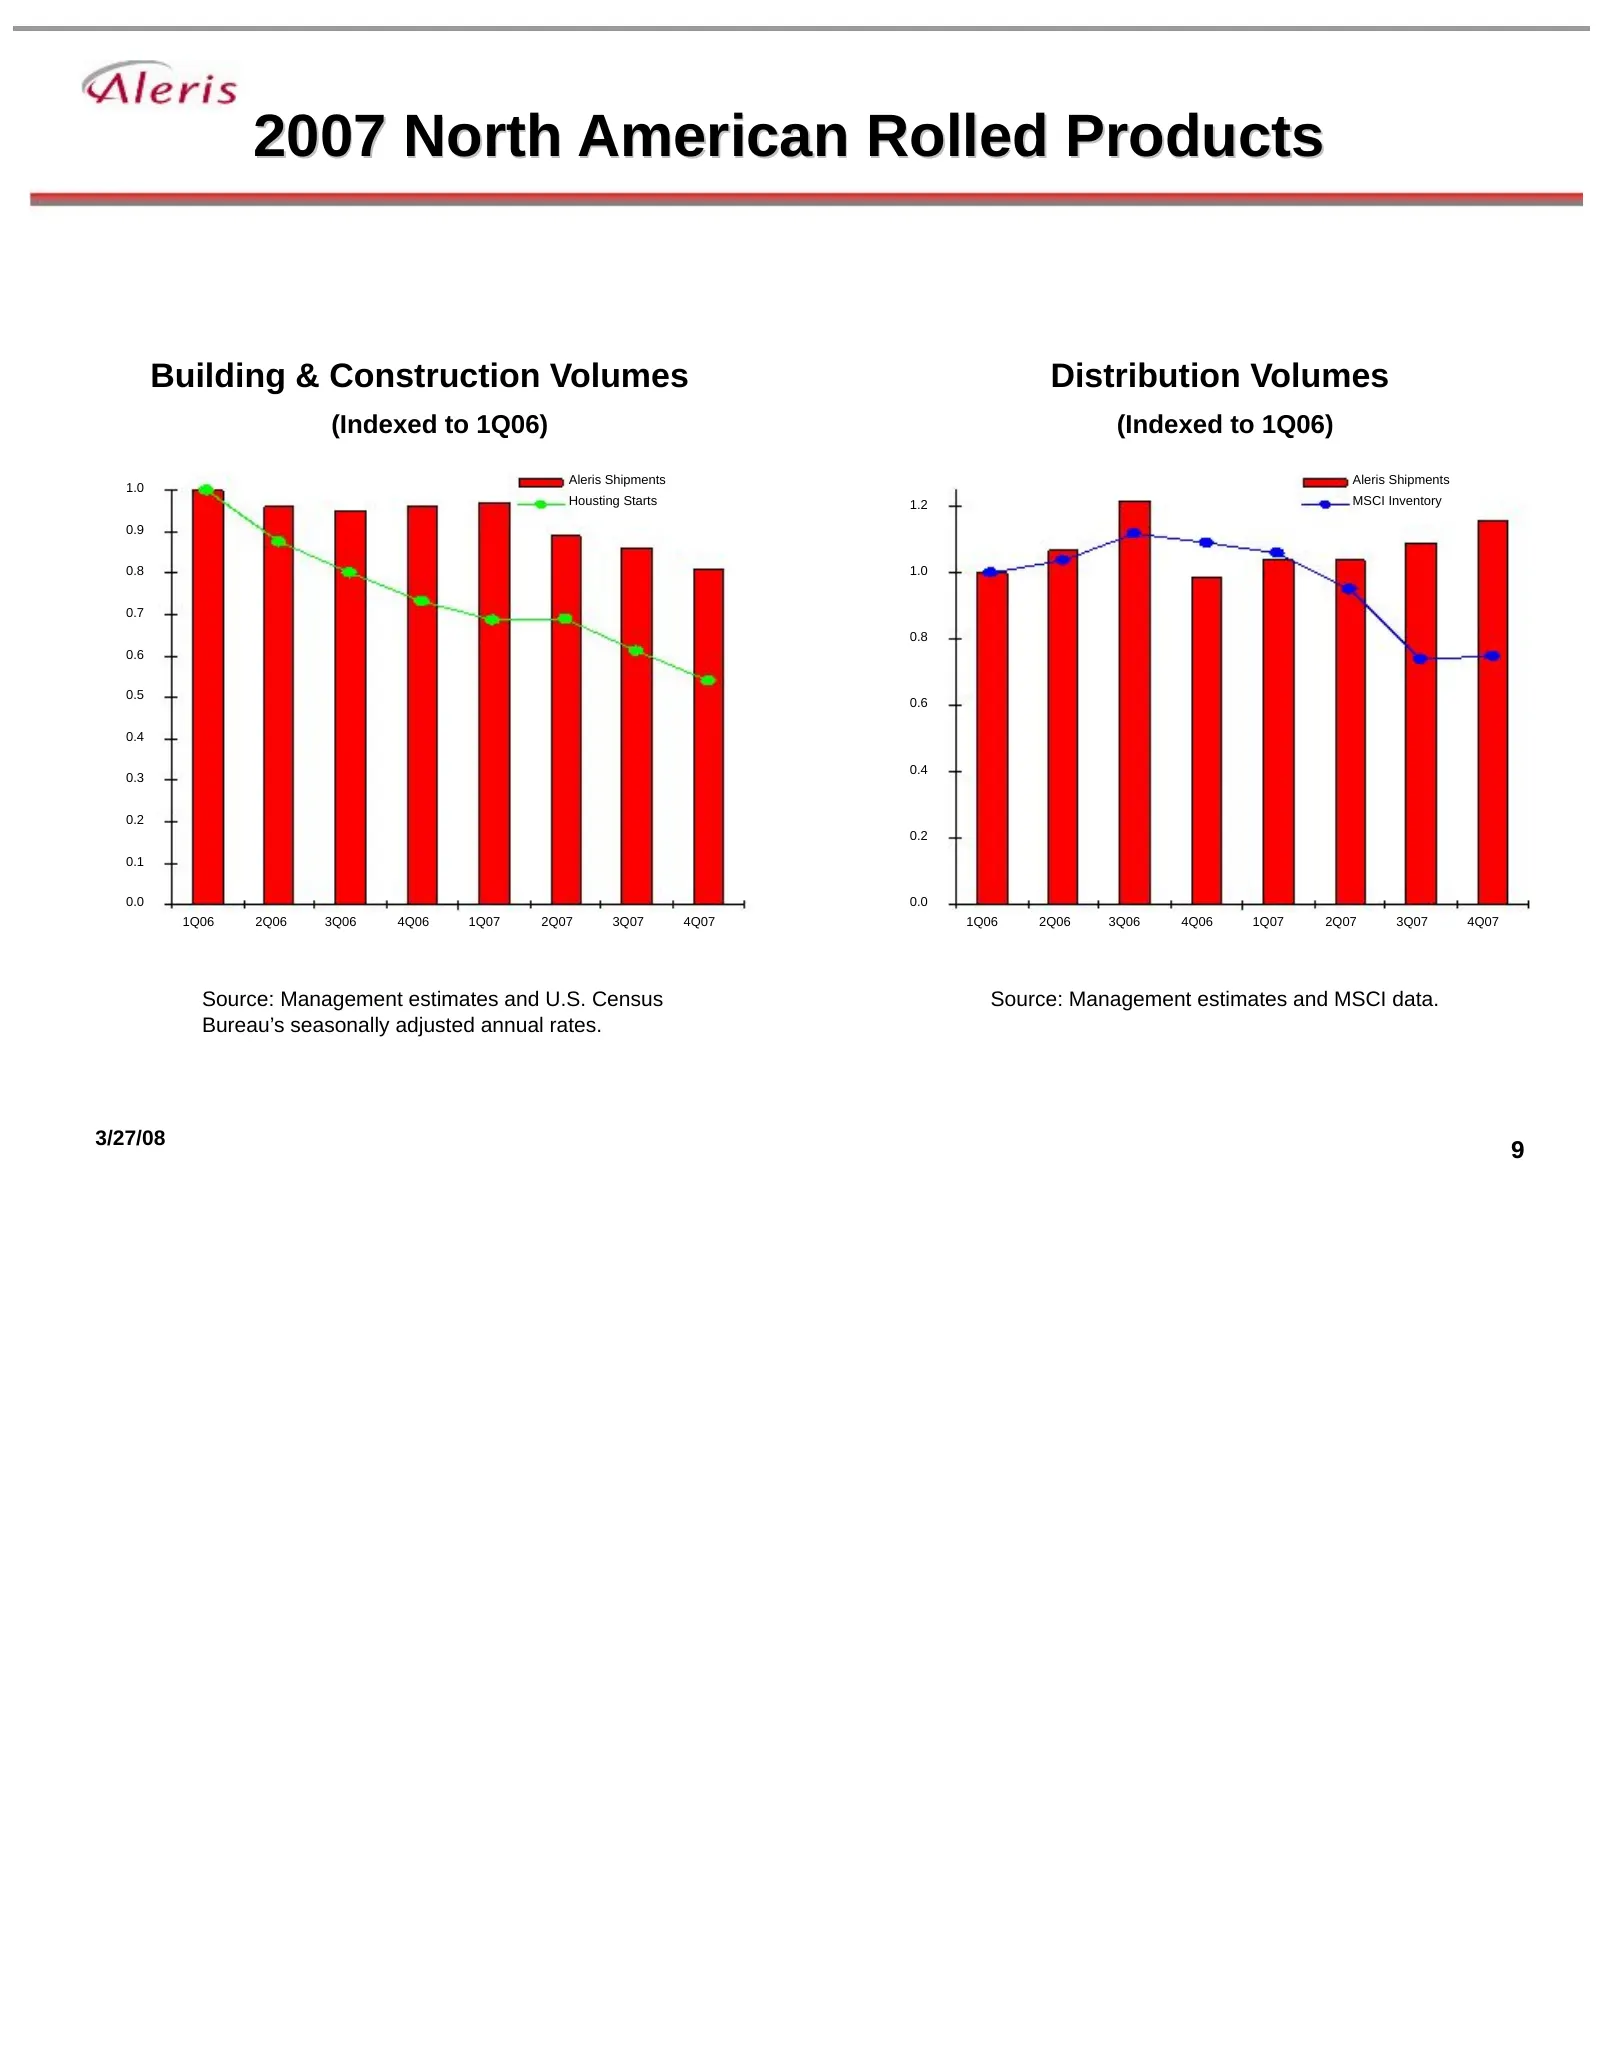
2007 North American Rolled Products Building & Construction Volumes Distribution Volumes (Indexed to 1Q06) (Indexed to 1Q06) Aleris Shipments Aleris Shipments 1.0 Housting Starts 1.2 MSCI Inventory 0.9 0.8 1.0 0.7 0.8 0.6 0.5 0.6 0.4 0.4 0.3 0.2 0.2 0.1 0.0 0.0 1Q06 2Q06 3Q06 4Q06 1Q07 2Q07 3Q07 4Q0
Slide 10: Margin Performance
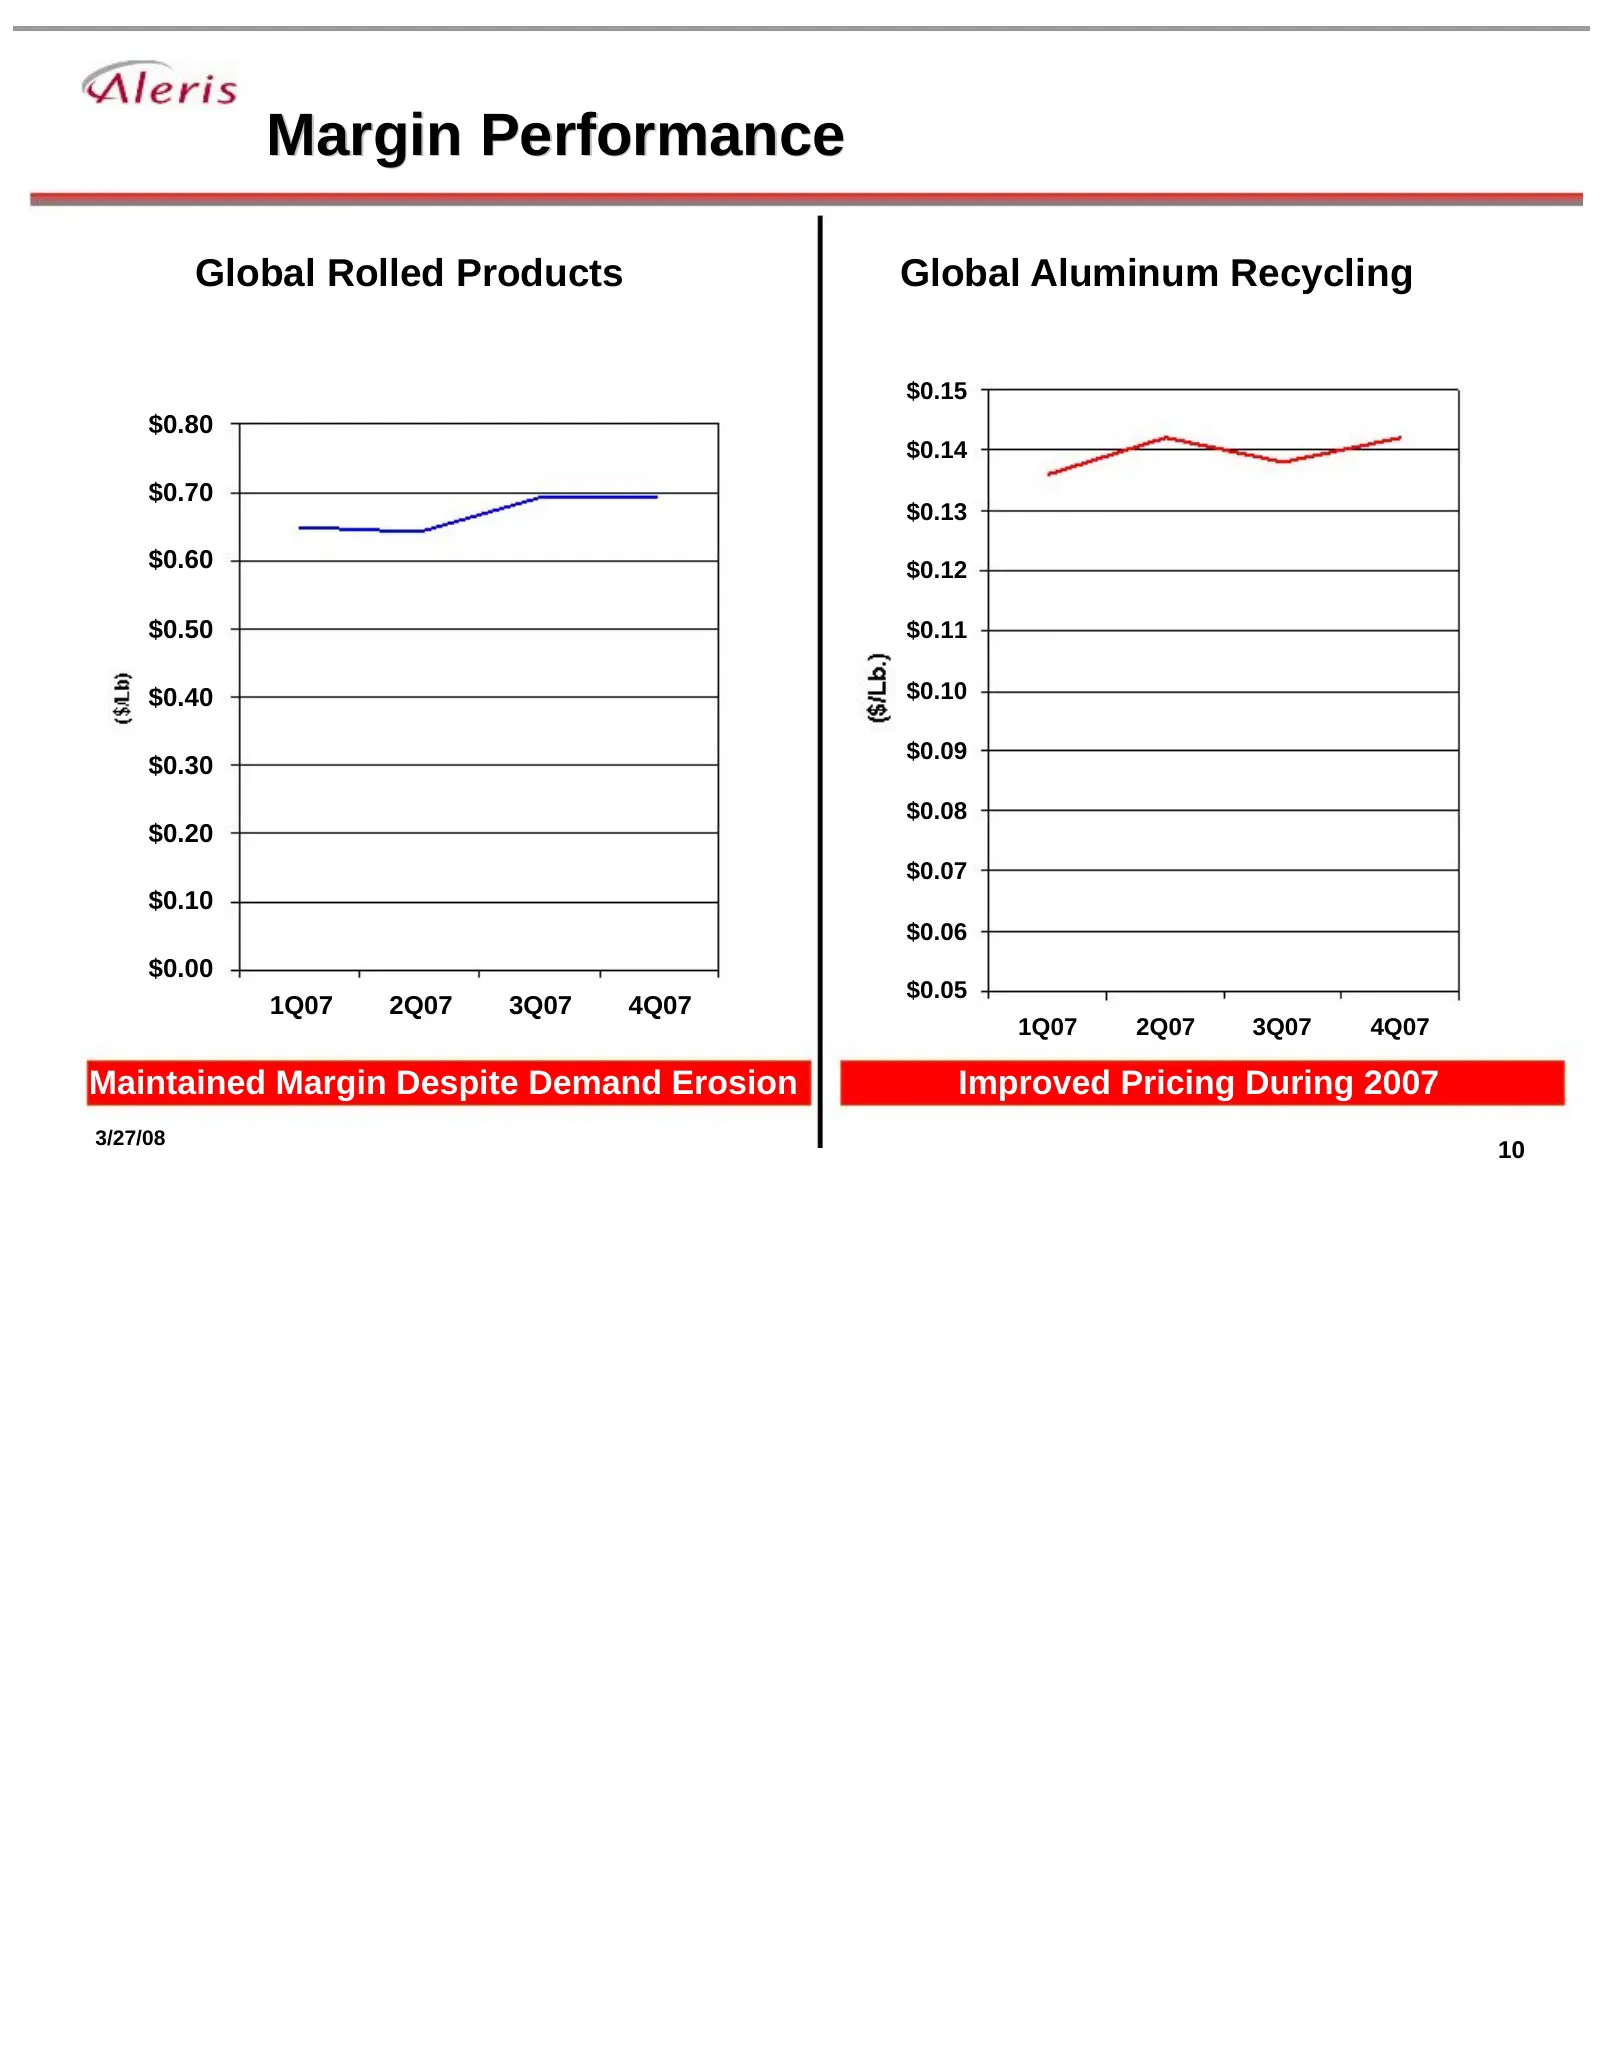
Margin Performance Global Rolled Products Global Aluminum Recycling $0.15 $0.80 $0.14 $0.70 $0.13 $0.60 $0.12 $0.50 $0.11 $0.40 $0.10 $0.09 $0.30 $0.08 $0.20 $0.07 $0.10 $0.06 $0.00 $0.05 1Q07 2Q07 3Q07 4Q07 1Q07 2Q07 3Q07 4Q07 Maintained Margin Despite Demand Erosion Improved Pricing During 2007 3/
Slide 11: European Rolled Products Shipments
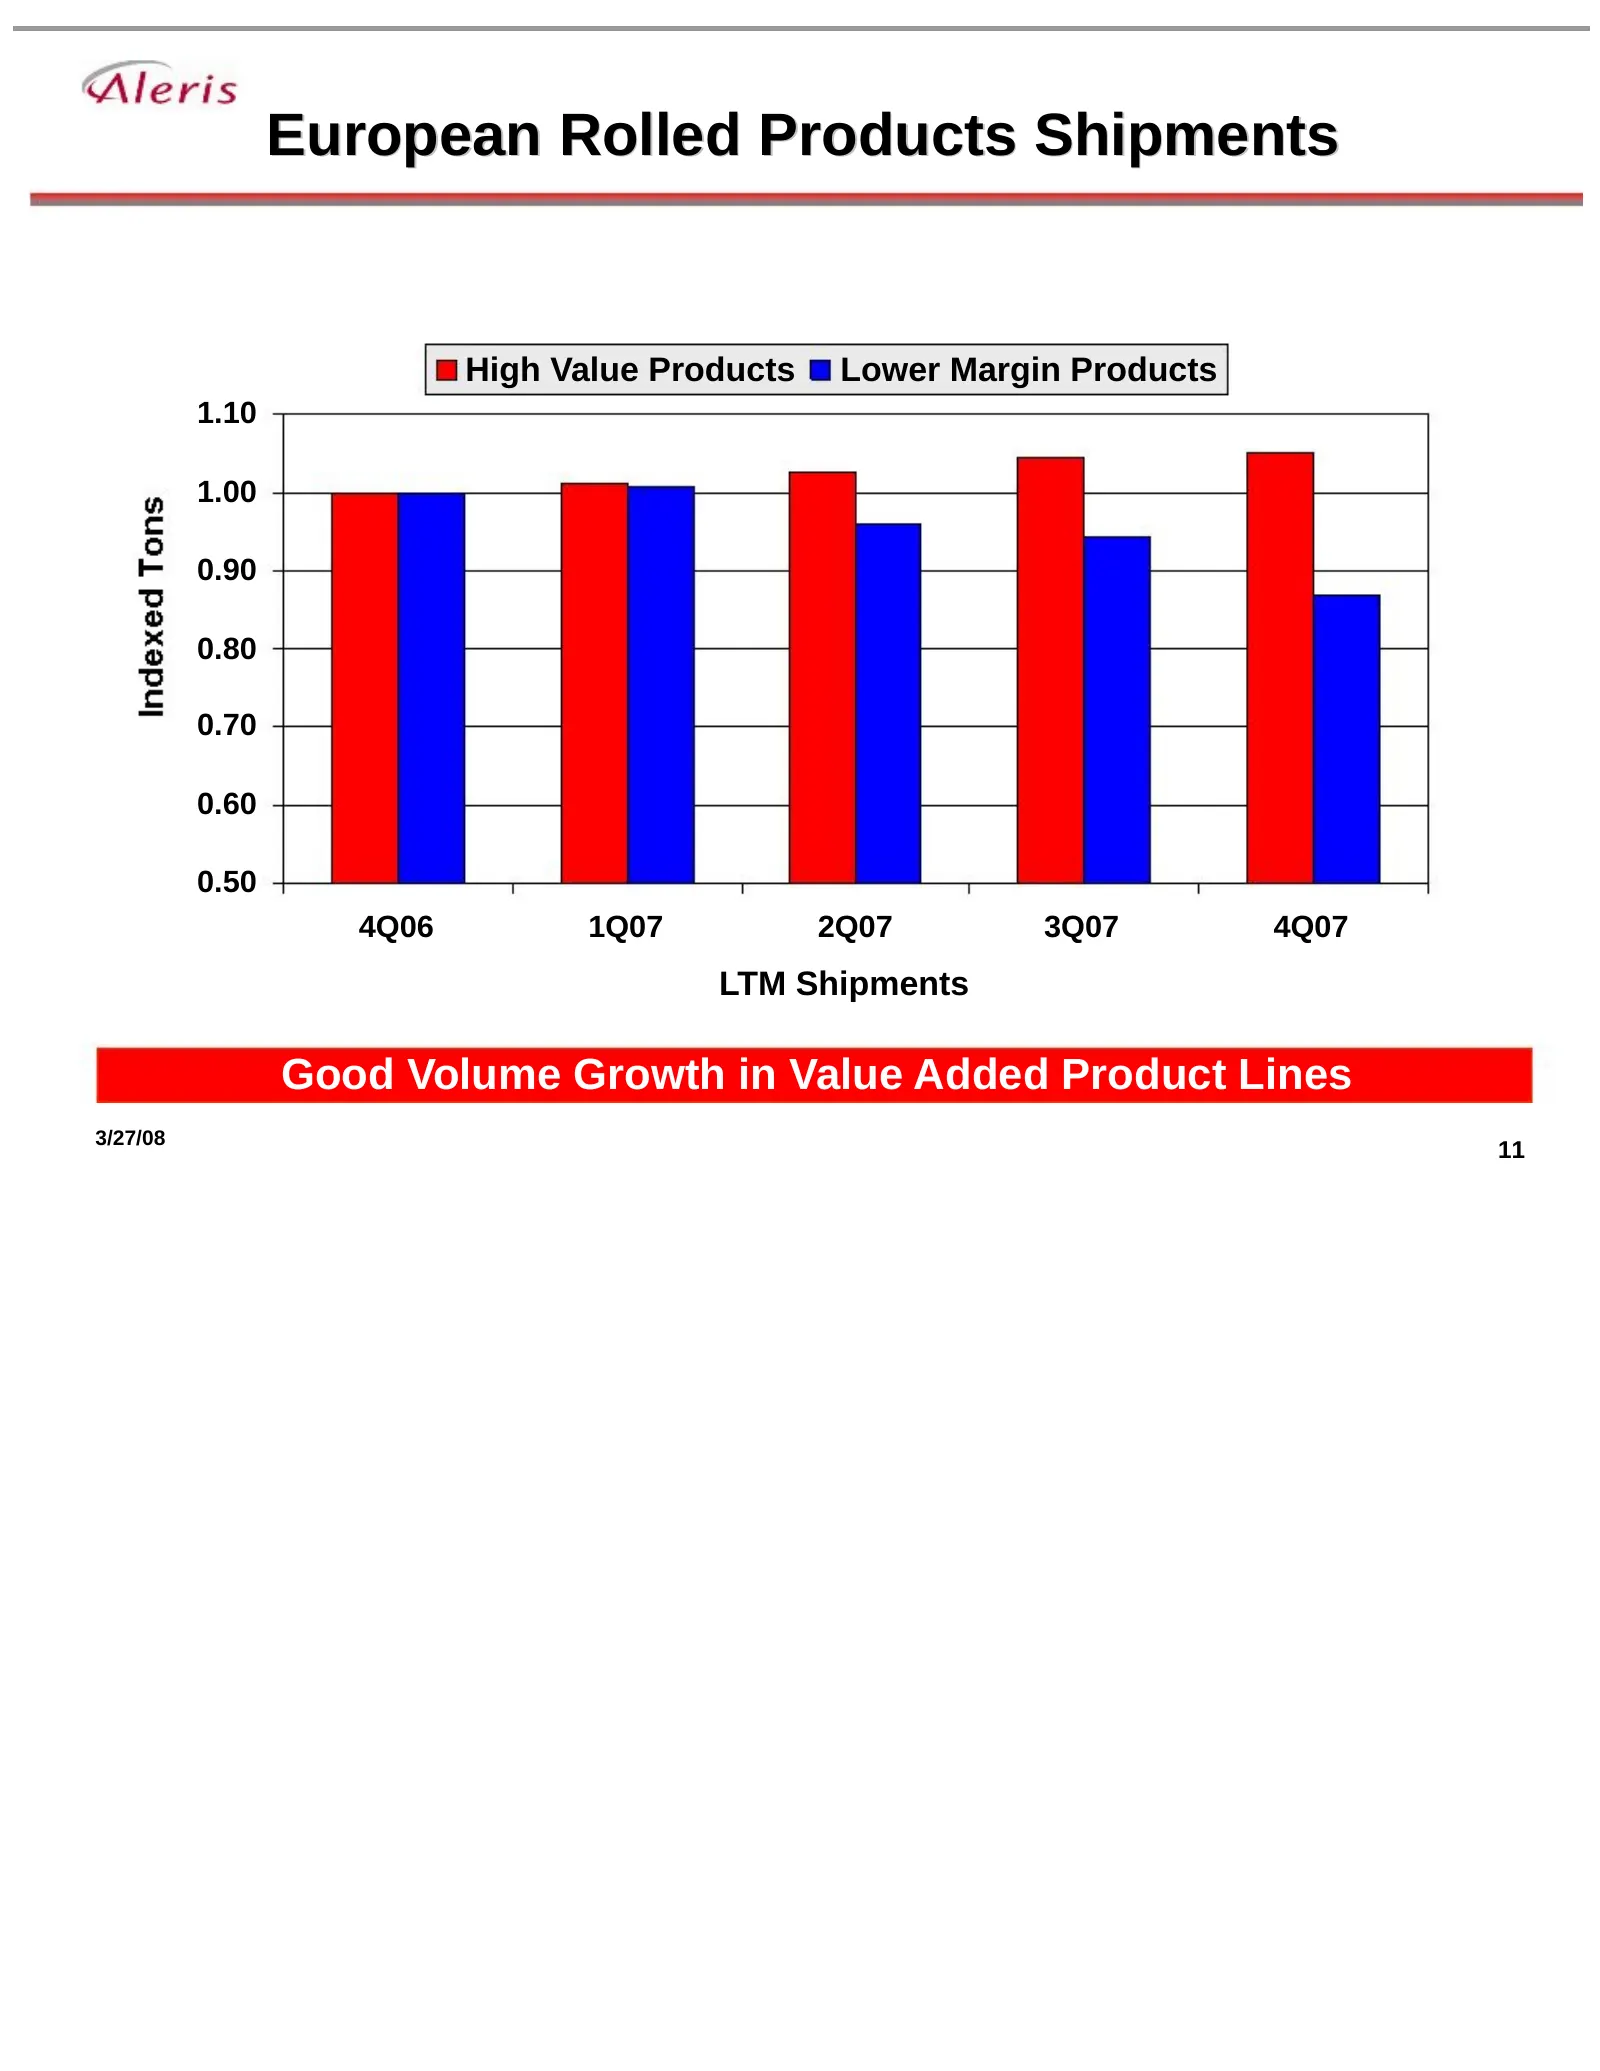
European Rolled Products Shipments High Value Products Lower Margin Products 1.10 1.00 0.90 0.80 0.70 0.60 0.50 4Q06 1Q07 2Q07 3Q07 4Q07 LTM Shipments Good Volume Growth in Value Added Product Lines 3/27/08 11
Slide 12: 2007 Gross Productivity Recap
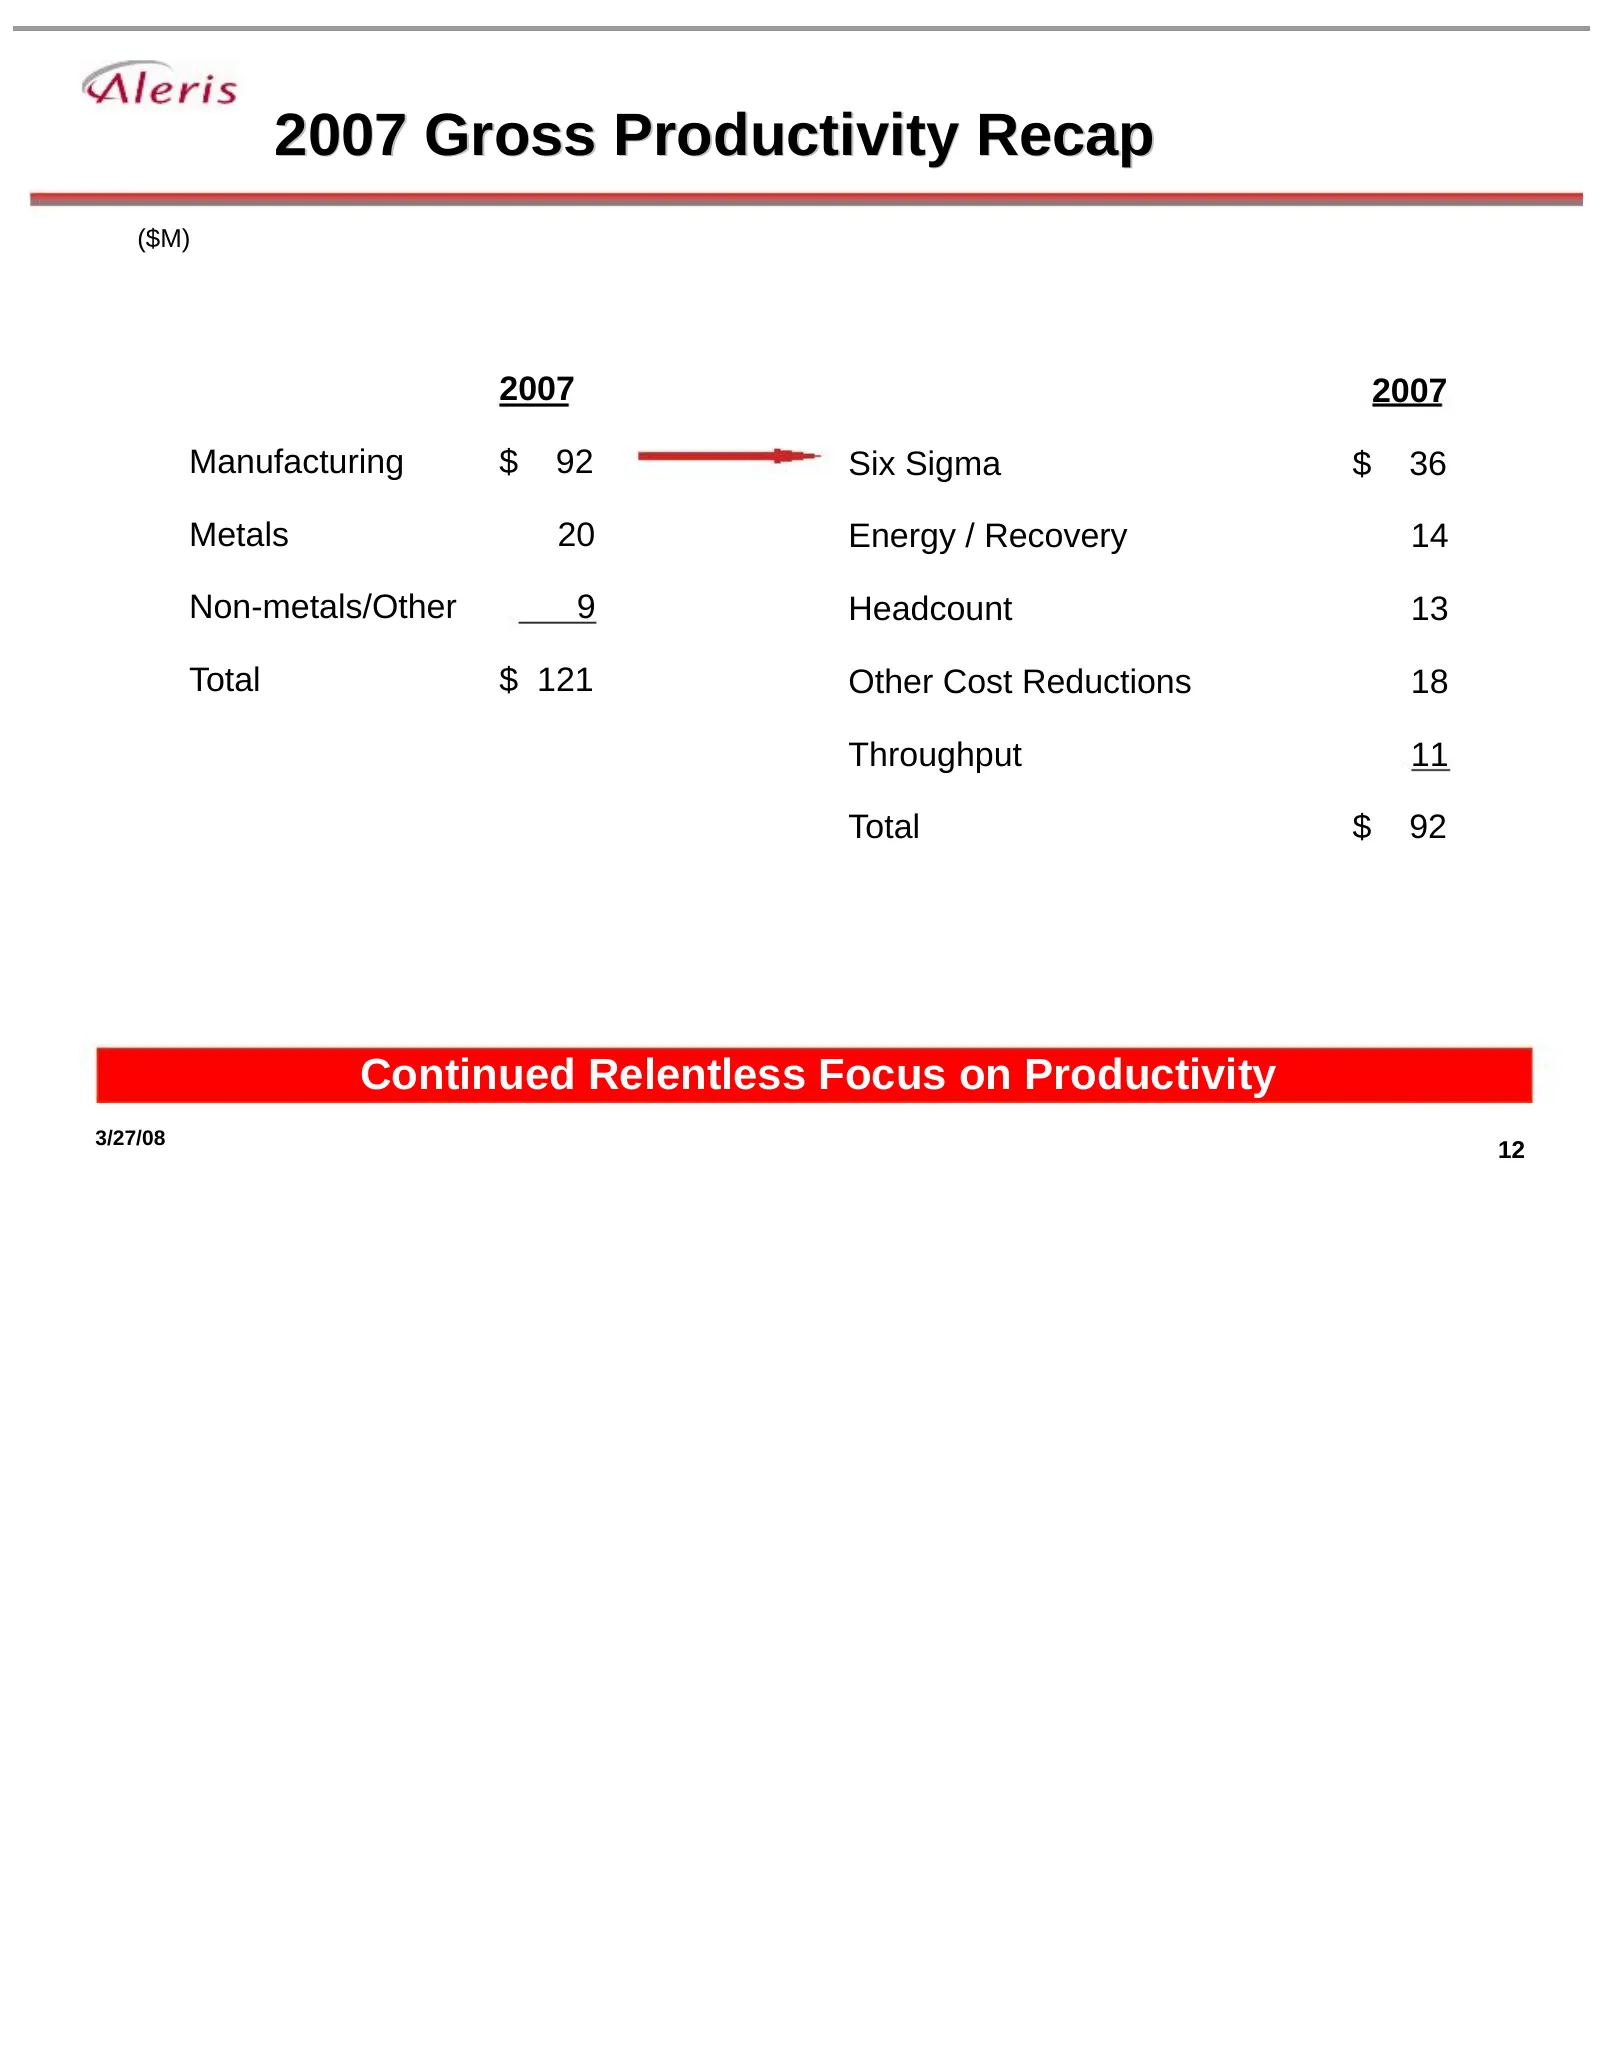
2007 Gross Productivity Recap ($M) 2007 2007 Manufacturing $ 92 Six Sigma $ 36 Metals 20 Energy / Recovery 14 Non-metals/Other 9 Headcount 13 Total $ 121 Other Cost Reductions 18 Throughput 11 Total $ 92 Continued Relentless Focus on Productivity 3/27/08 12
Slide 13: Commodity Cost Inflation
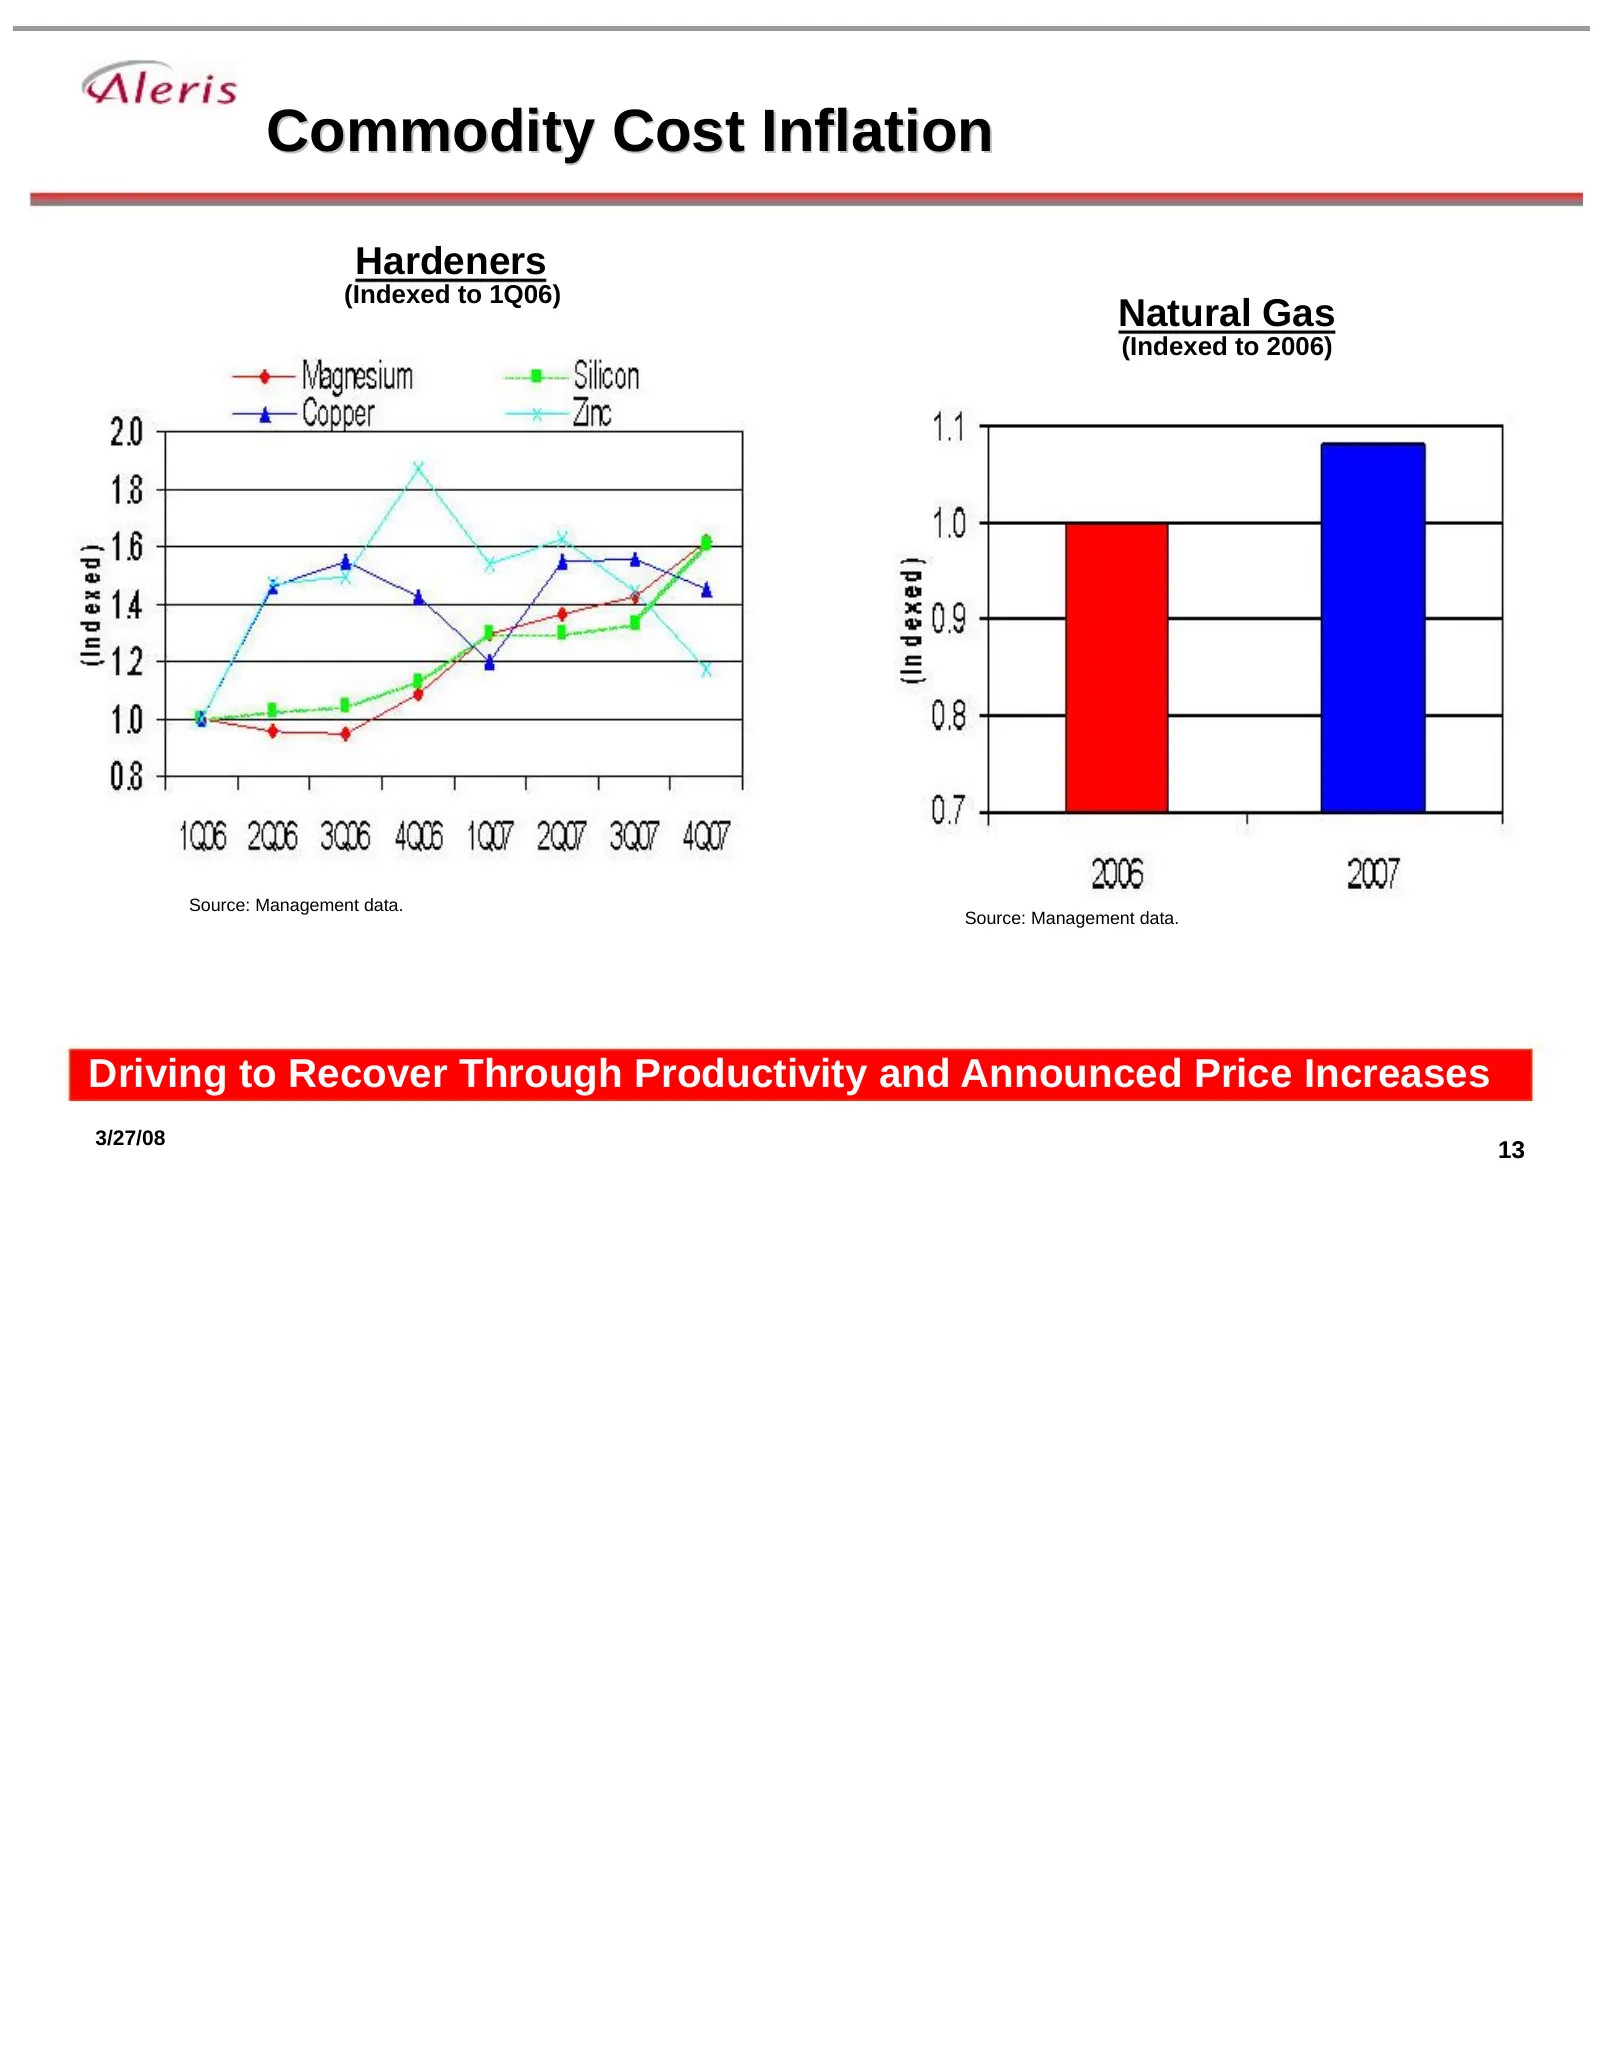
Commodity Cost Inflation Hardeners (Indexed to 1Q06) Natural Gas (Indexed to 2006) Source: Management data. Source: Management data. Driving to Recover Through Productivity and Announced Price Increases 3/27/08 13
Slide 14: Aluminum LME and Currency
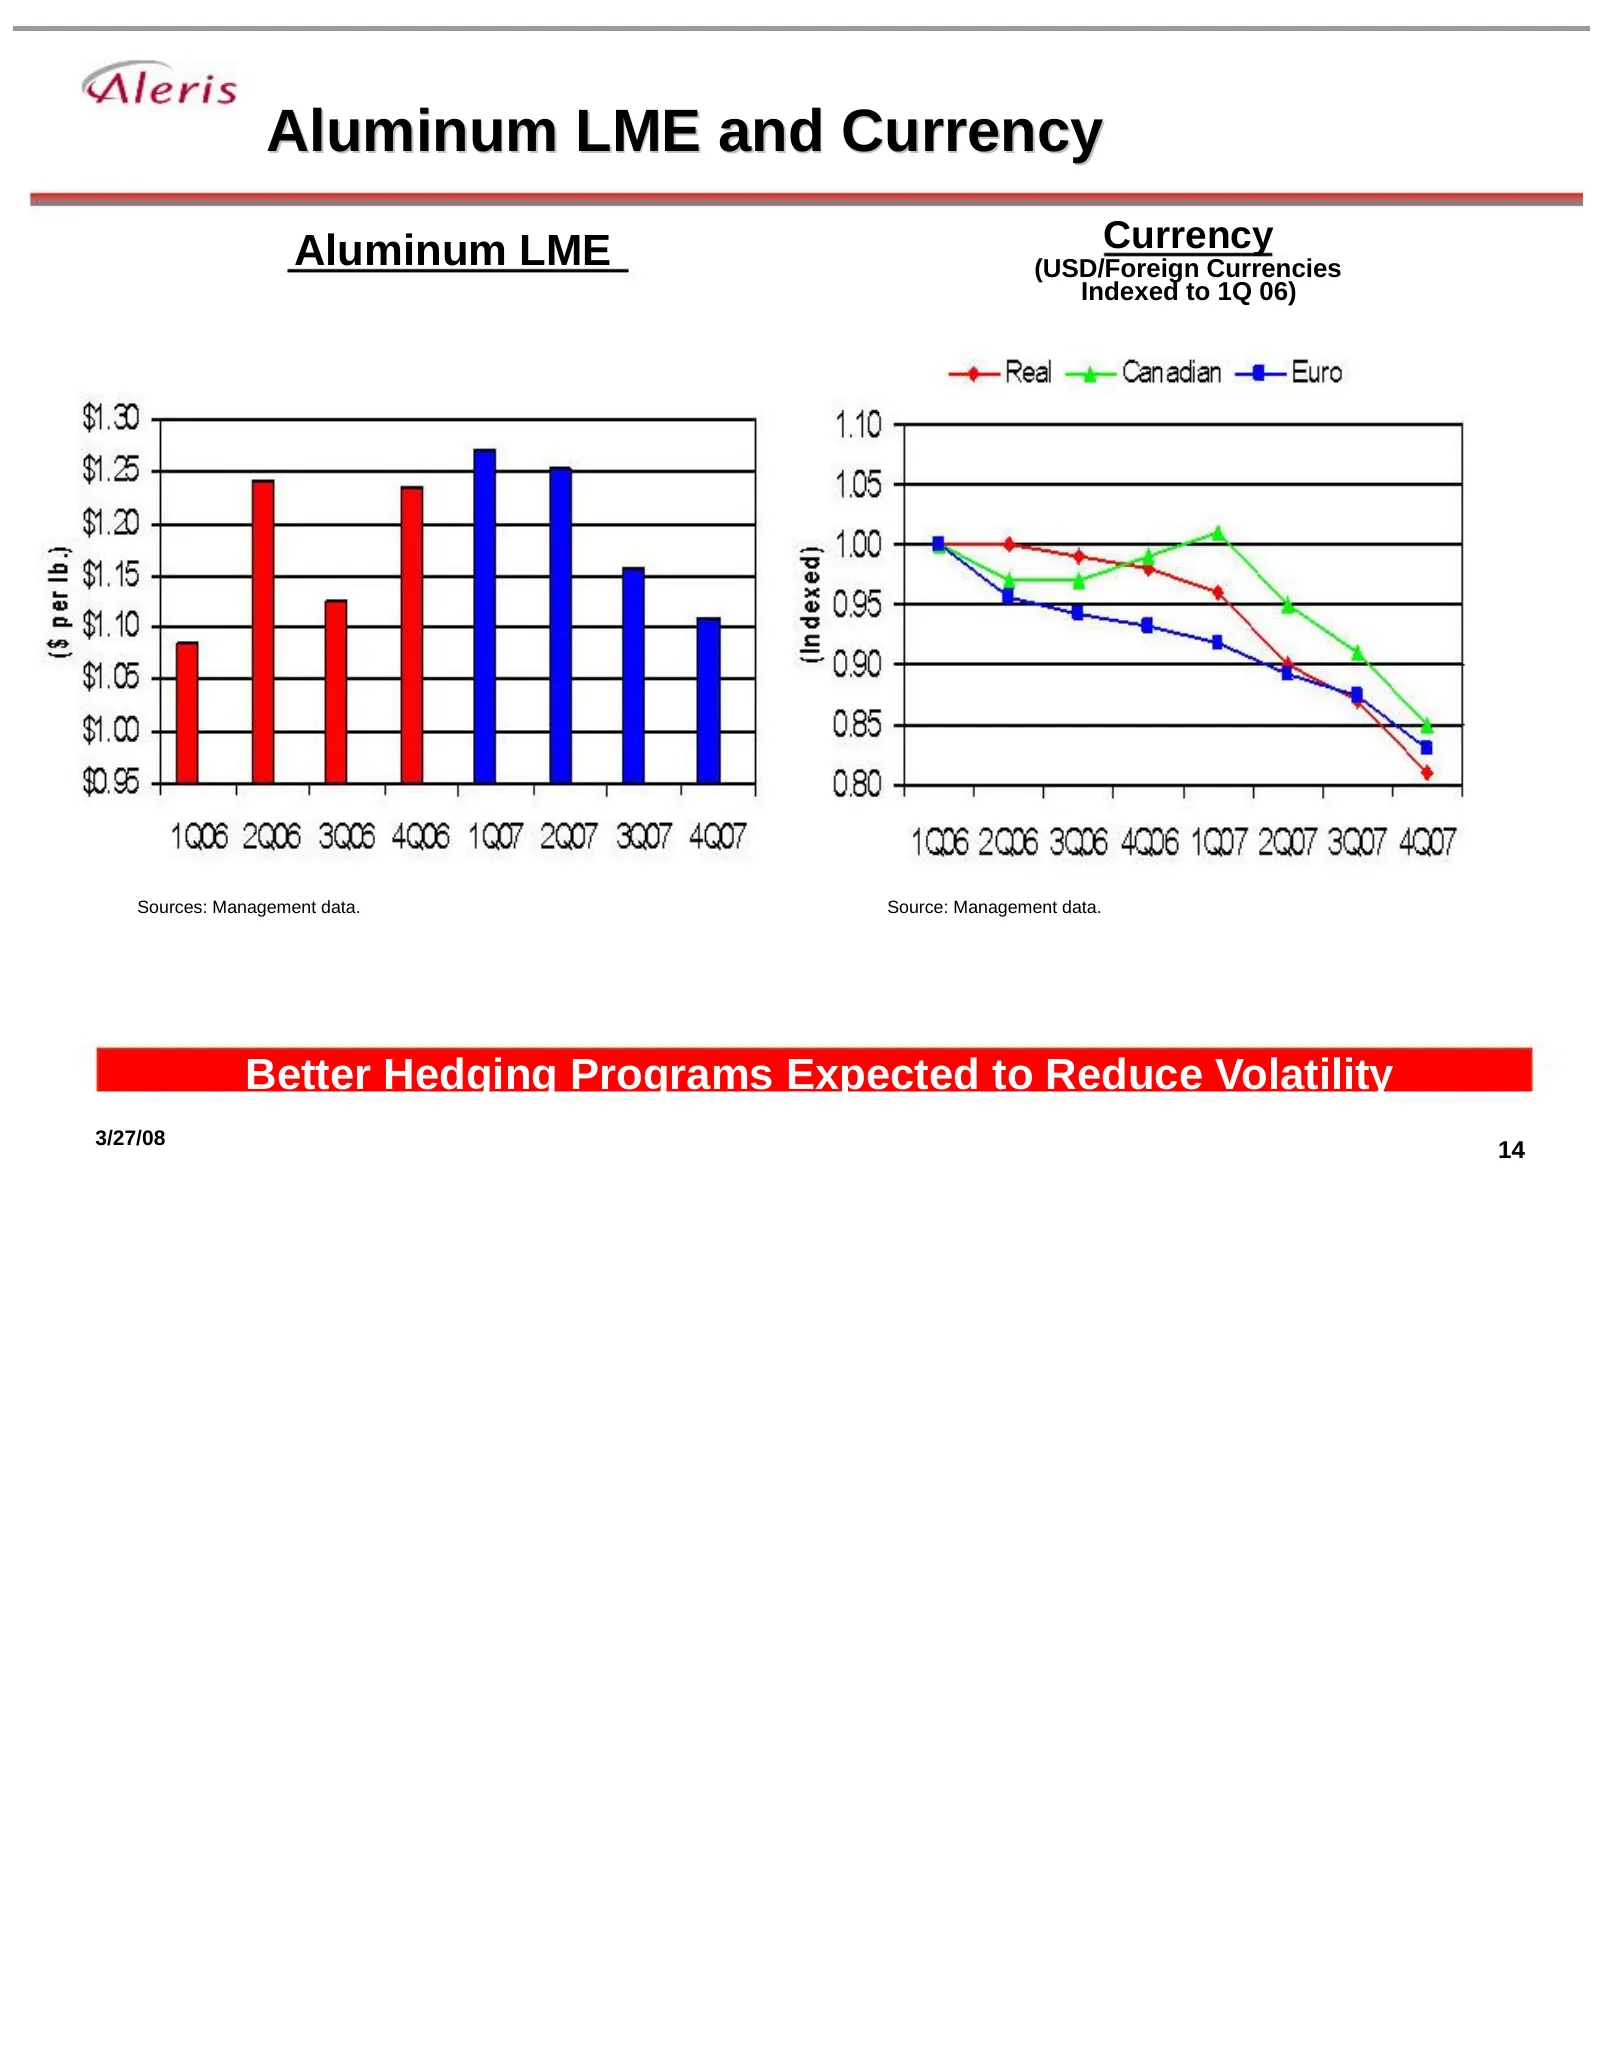
Aluminum LME and Currency Aluminum LME Currency (USD/Foreign Currencies Indexed to 1Q 06) Sources: Management data. Source: Management data. Better Hedging Programs Expected to Reduce Volatility 3/27/08 14
Slide 15: 2007 Free Cash Flow Summary
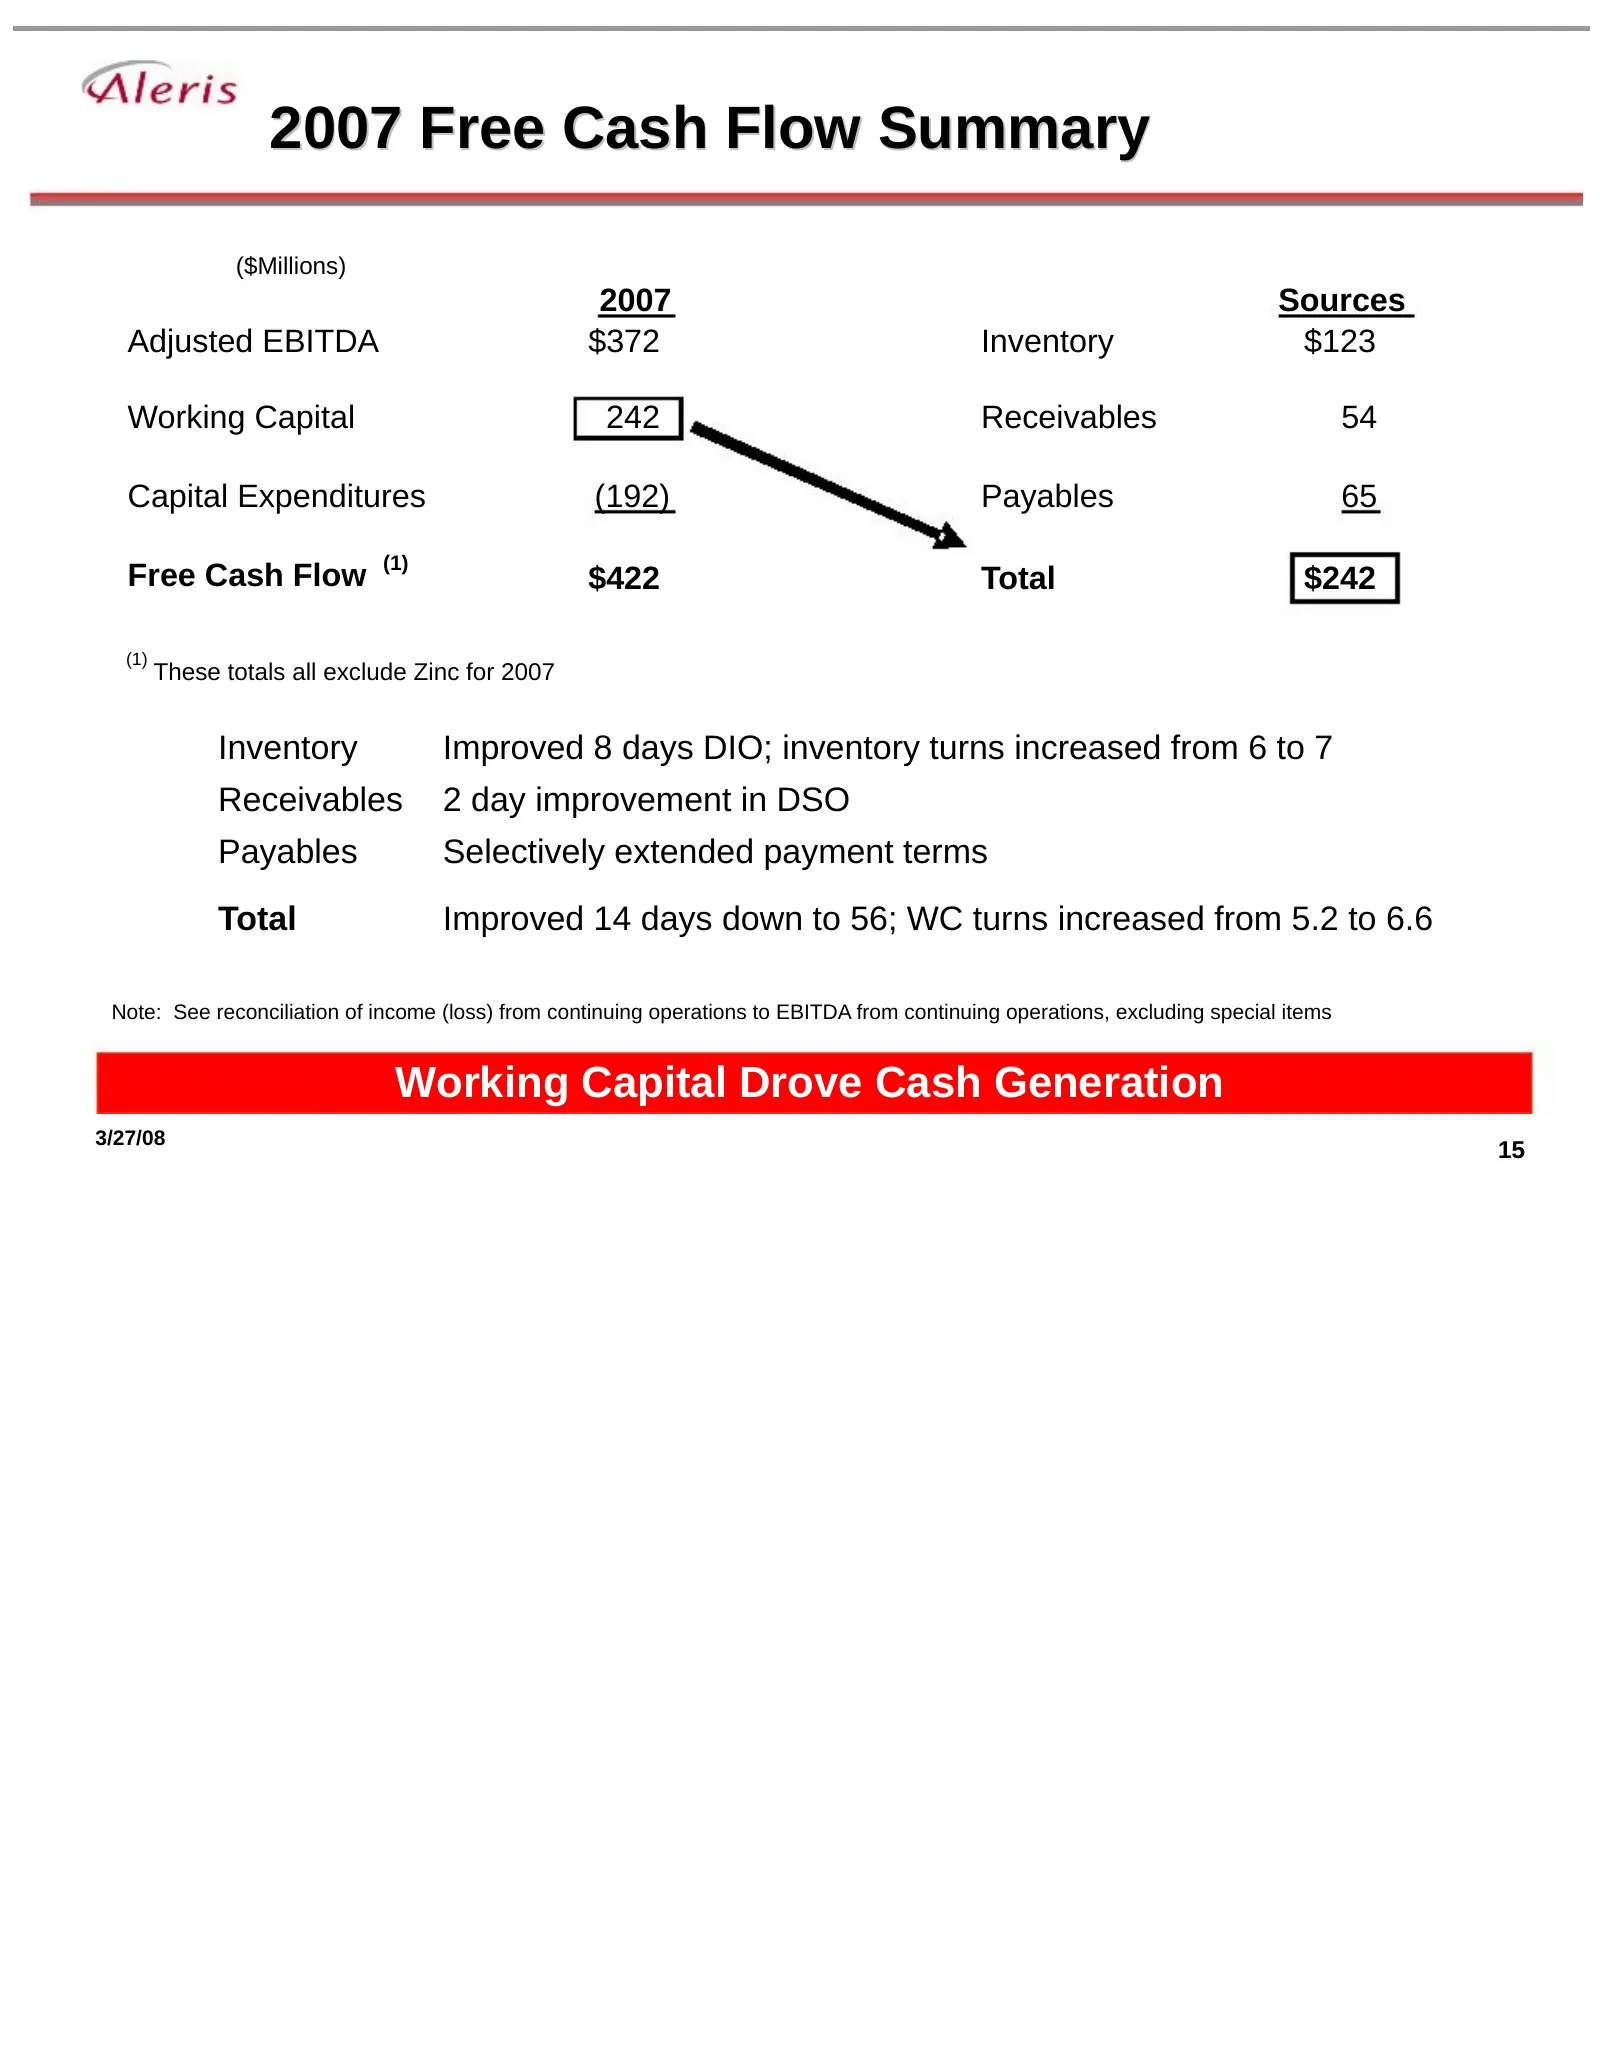
2007 Free Cash Flow Summary ($Millions) 2007 Sources Adjusted EBITDA $372 Inventory $123 Working Capital 242 Receivables 54 Capital Expenditures (192) Payables 65 Free Cash Flow (1) $422 Total $242 (1) These totals all exclude Zinc for 2007 Inventory Improved 8 days DIO; inventory turns increased fr
Slide 16: Financial Statistics
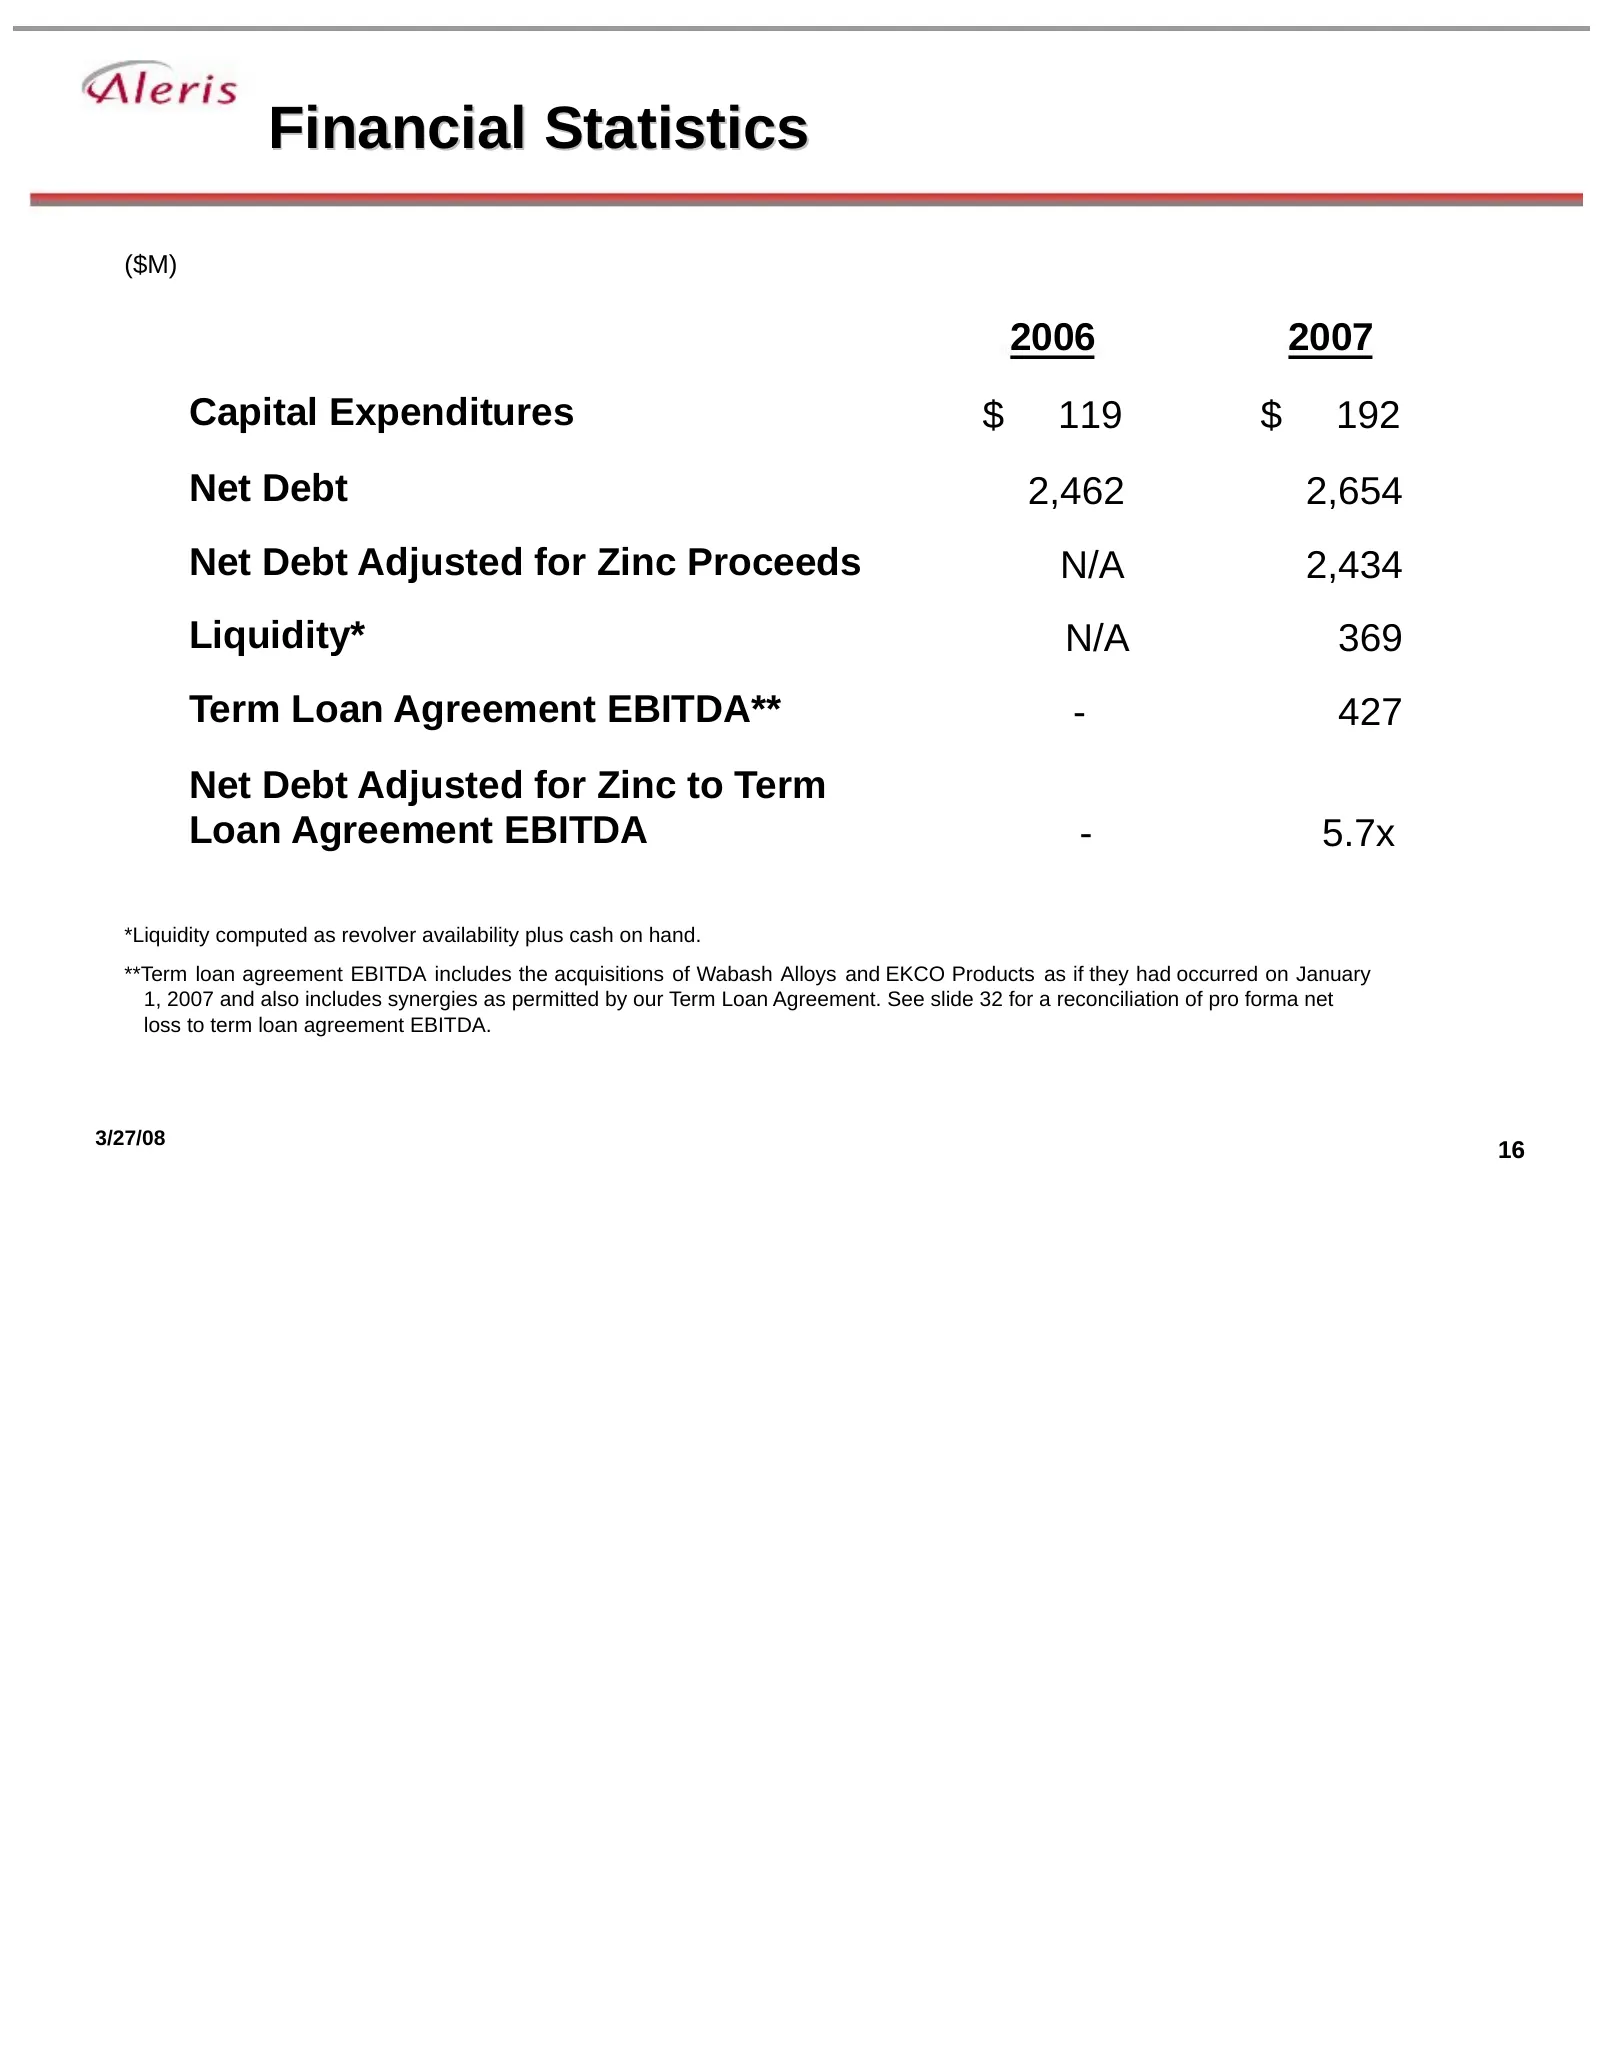
Financial Statistics ($M) 2006 2007 Capital Expenditures $ 119 $ 192 Net Debt 2,462 2,654 Net Debt Adjusted for Zinc Proceeds N/A 2,434 Liquidity* N/A 369 Term Loan Agreement EBITDA** - 427 Net Debt Adjusted for Zinc to Term Loan Agreement EBITDA - 5.7x *Liquidity computed as revolver availability p
Slide 17: Global Rolled and Extruded Products – Full Year
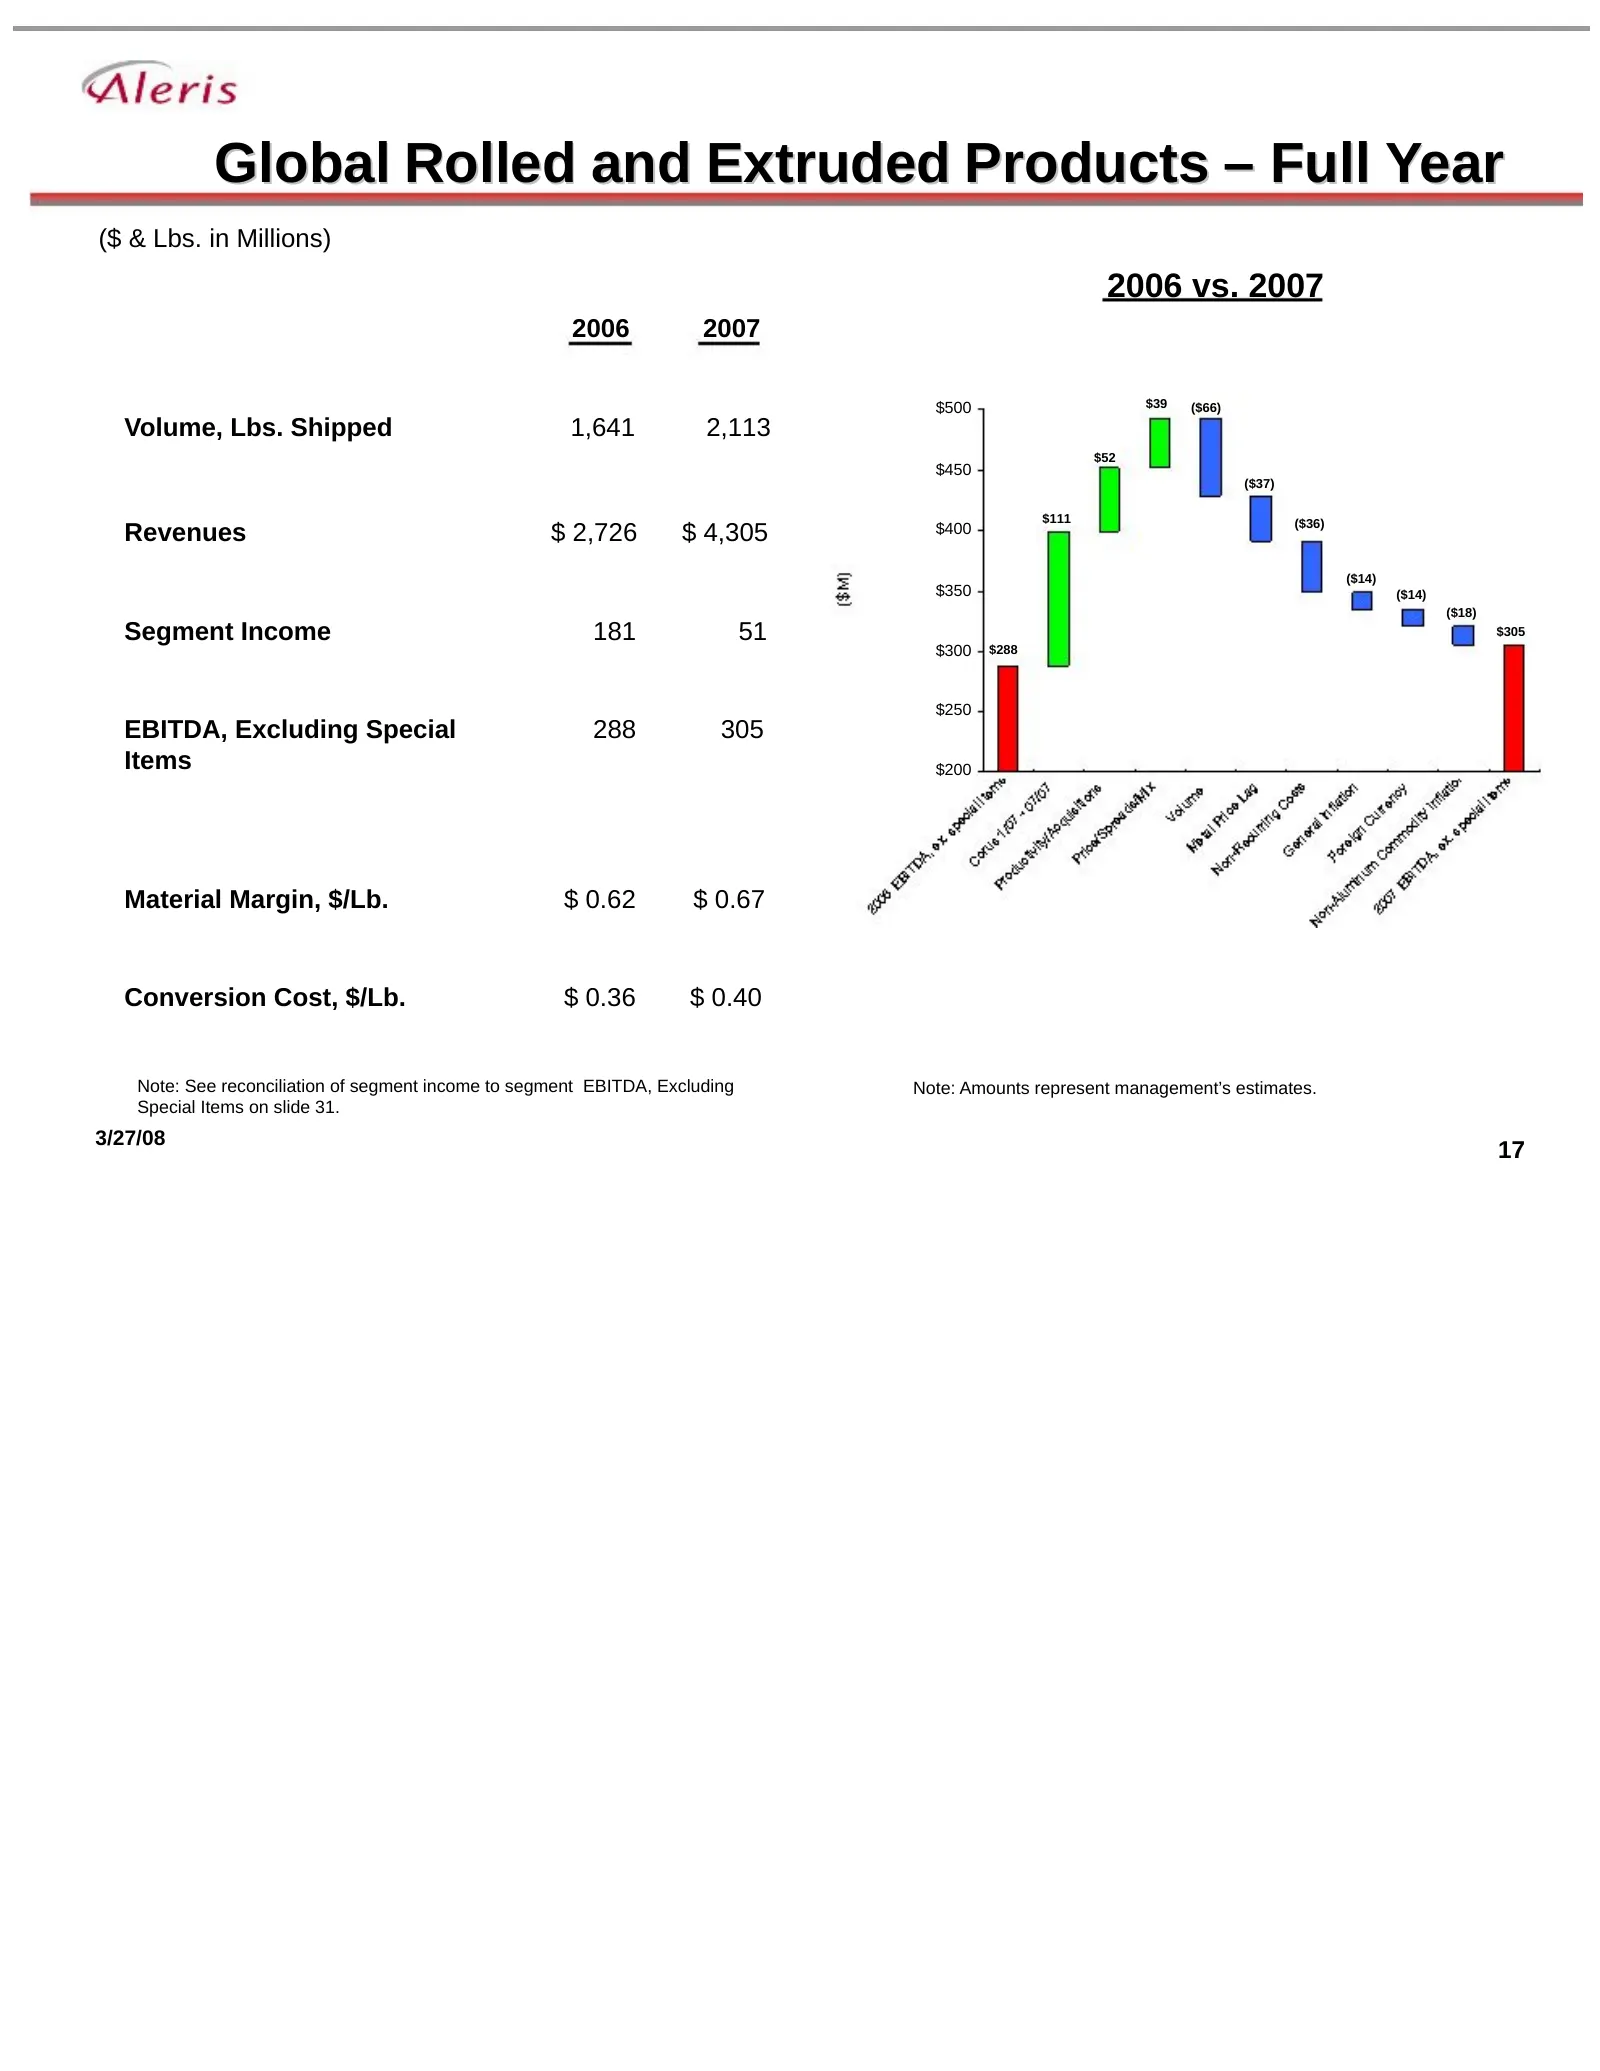
Global Rolled and Extruded Products – Full Year ($ & Lbs. in Millions) 2006 vs. 2007 2006 2007 $500 $39 ($66) Volume, Lbs. Shipped 1,641 2,113 $52 $450 ($37) $111 ($36) Revenues $ 2,726 $ 4,305 $400 ($14) $350 ($14) ($18) Segment Income 181 51 $305 $300 $288 $250 EBITDA, Excluding Special 288 305 It
Slide 18: Global Recycling – Full Year
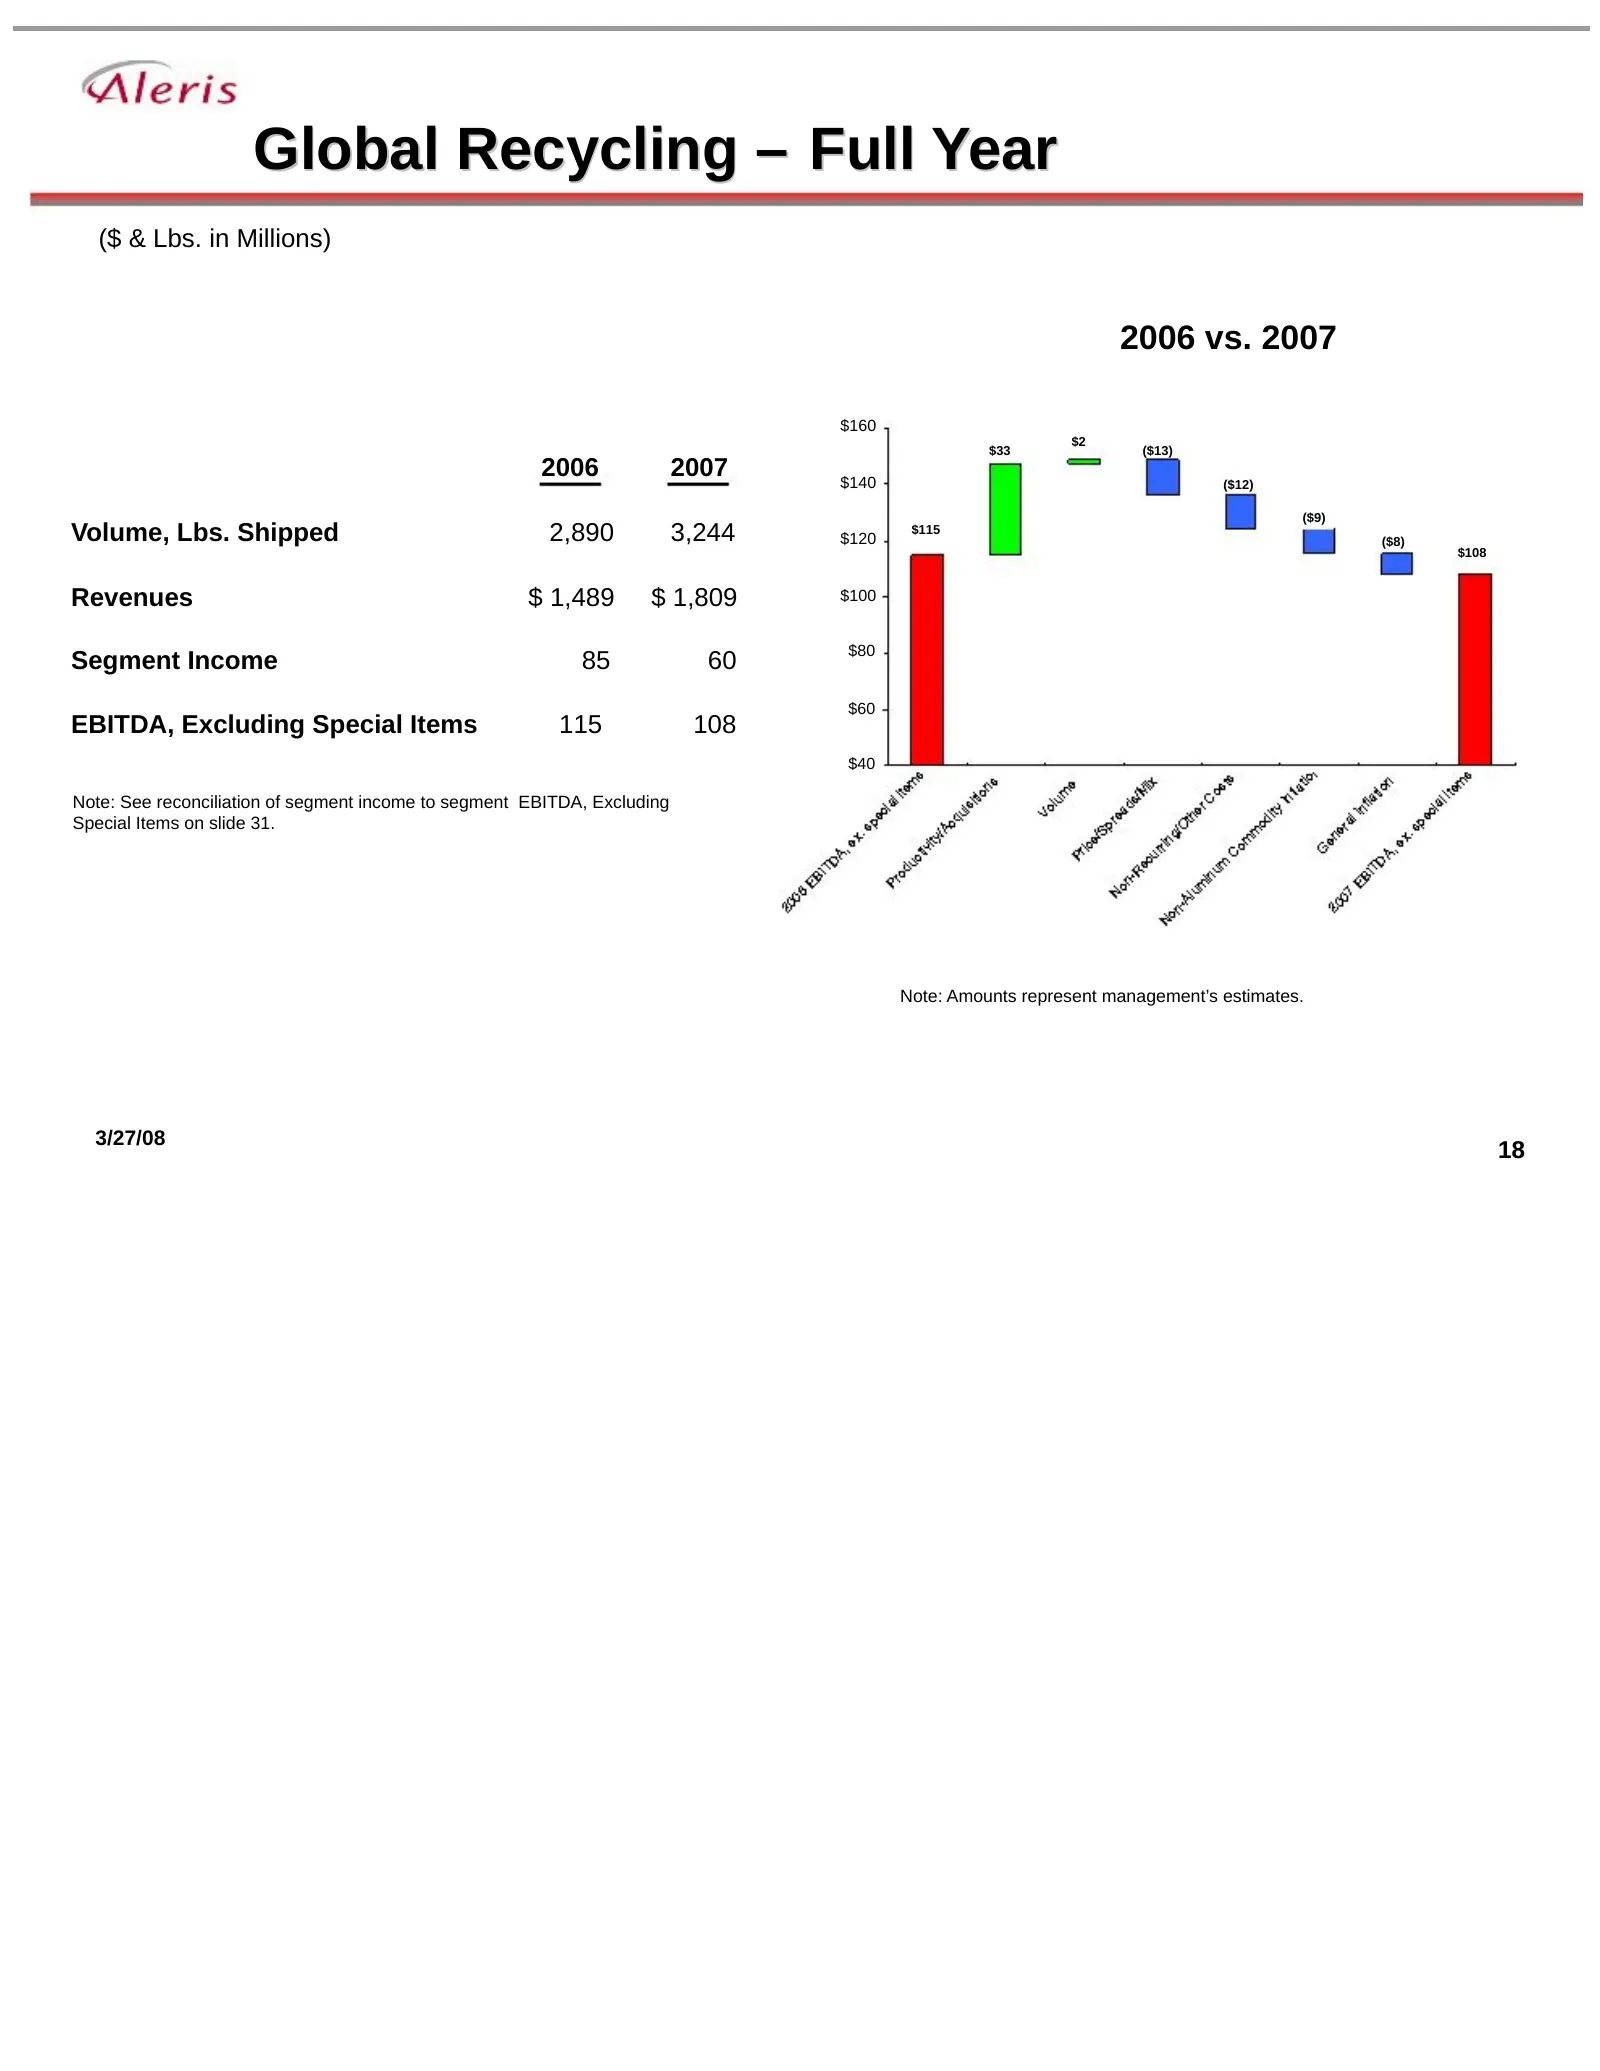
Global Recycling – Full Year ($ & Lbs. in Millions) 2006 vs. 2007 $160 $2 $33 ($13) 2006 2007 $140 ($12) ($9) Volume, Lbs. Shipped 2,890 3,244 $120 $115 ($8) $108 Revenues $ 1,489 $ 1,809 $100 $80 Segment Income 85 60 $60 EBITDA, Excluding Special Items 115 108 $40 Note: See reconciliation of segmen
Slide 19: Fourth Quarter Performance
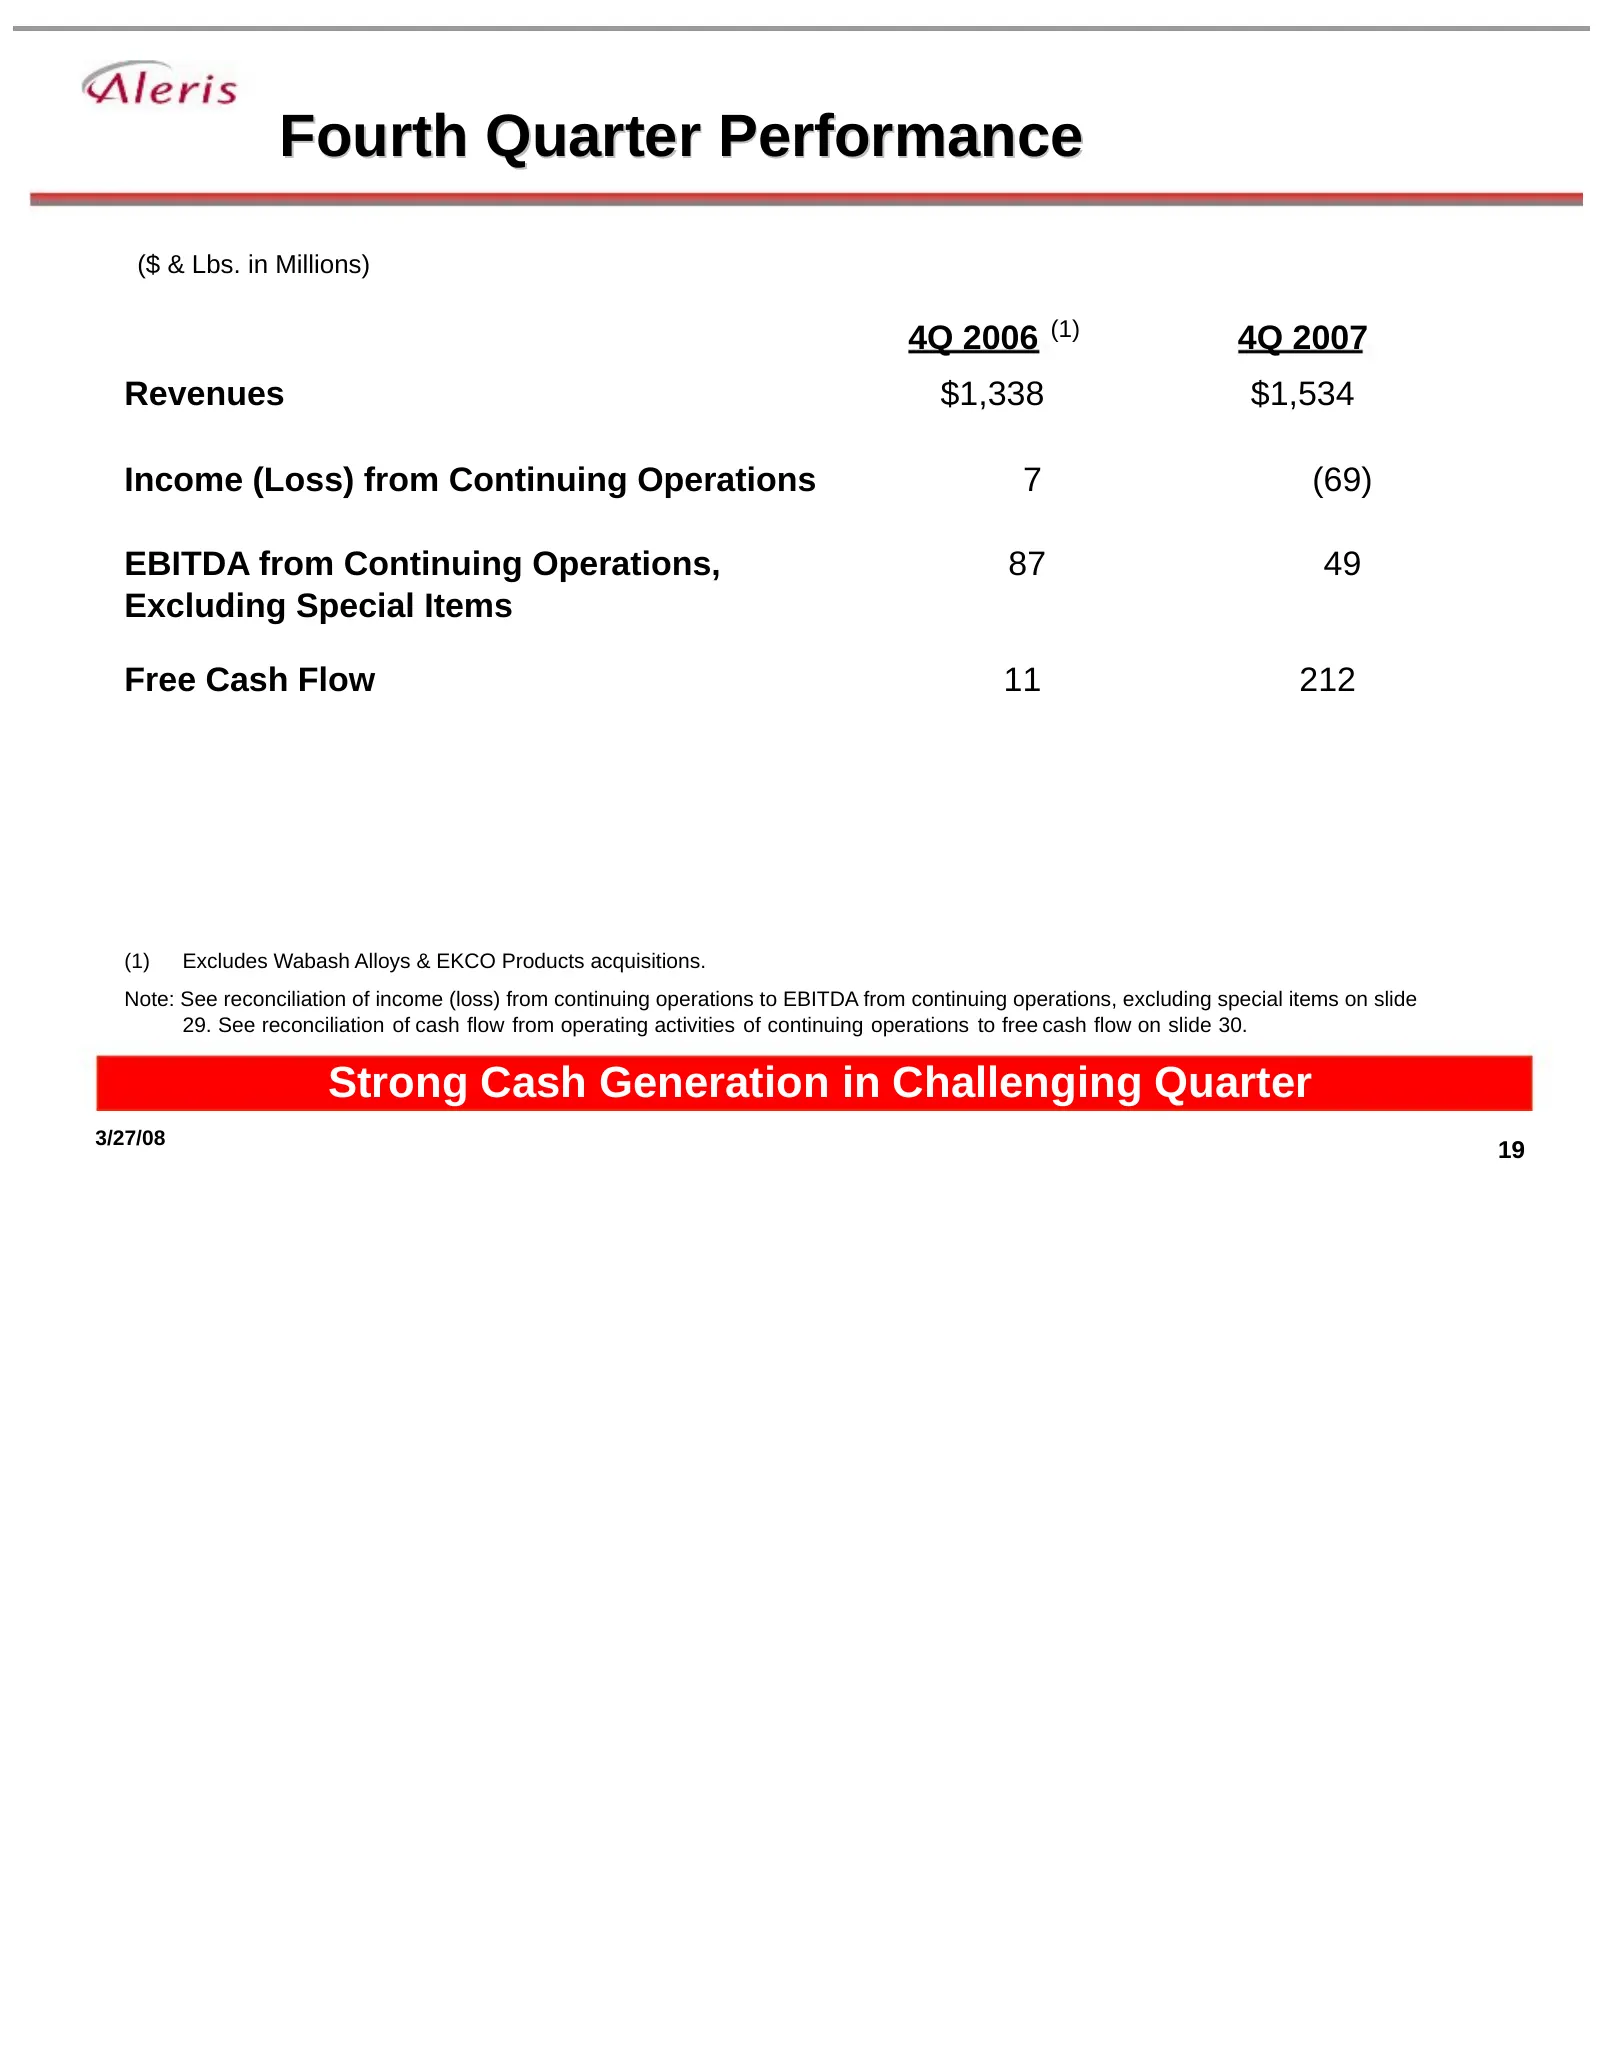
Fourth Quarter Performance ($ & Lbs. in Millions) 4Q 2006 (1) 4Q 2007 Revenues $1,338 $1,534 Income (Loss) from Continuing Operations 7 (69) EBITDA from Continuing Operations, 87 49 Excluding Special Items Free Cash Flow 11 212 (1) Excludes Wabash Alloys & EKCO Products acquisitions. Note: See recon
Slide 20: Fourth Quarter Comparison
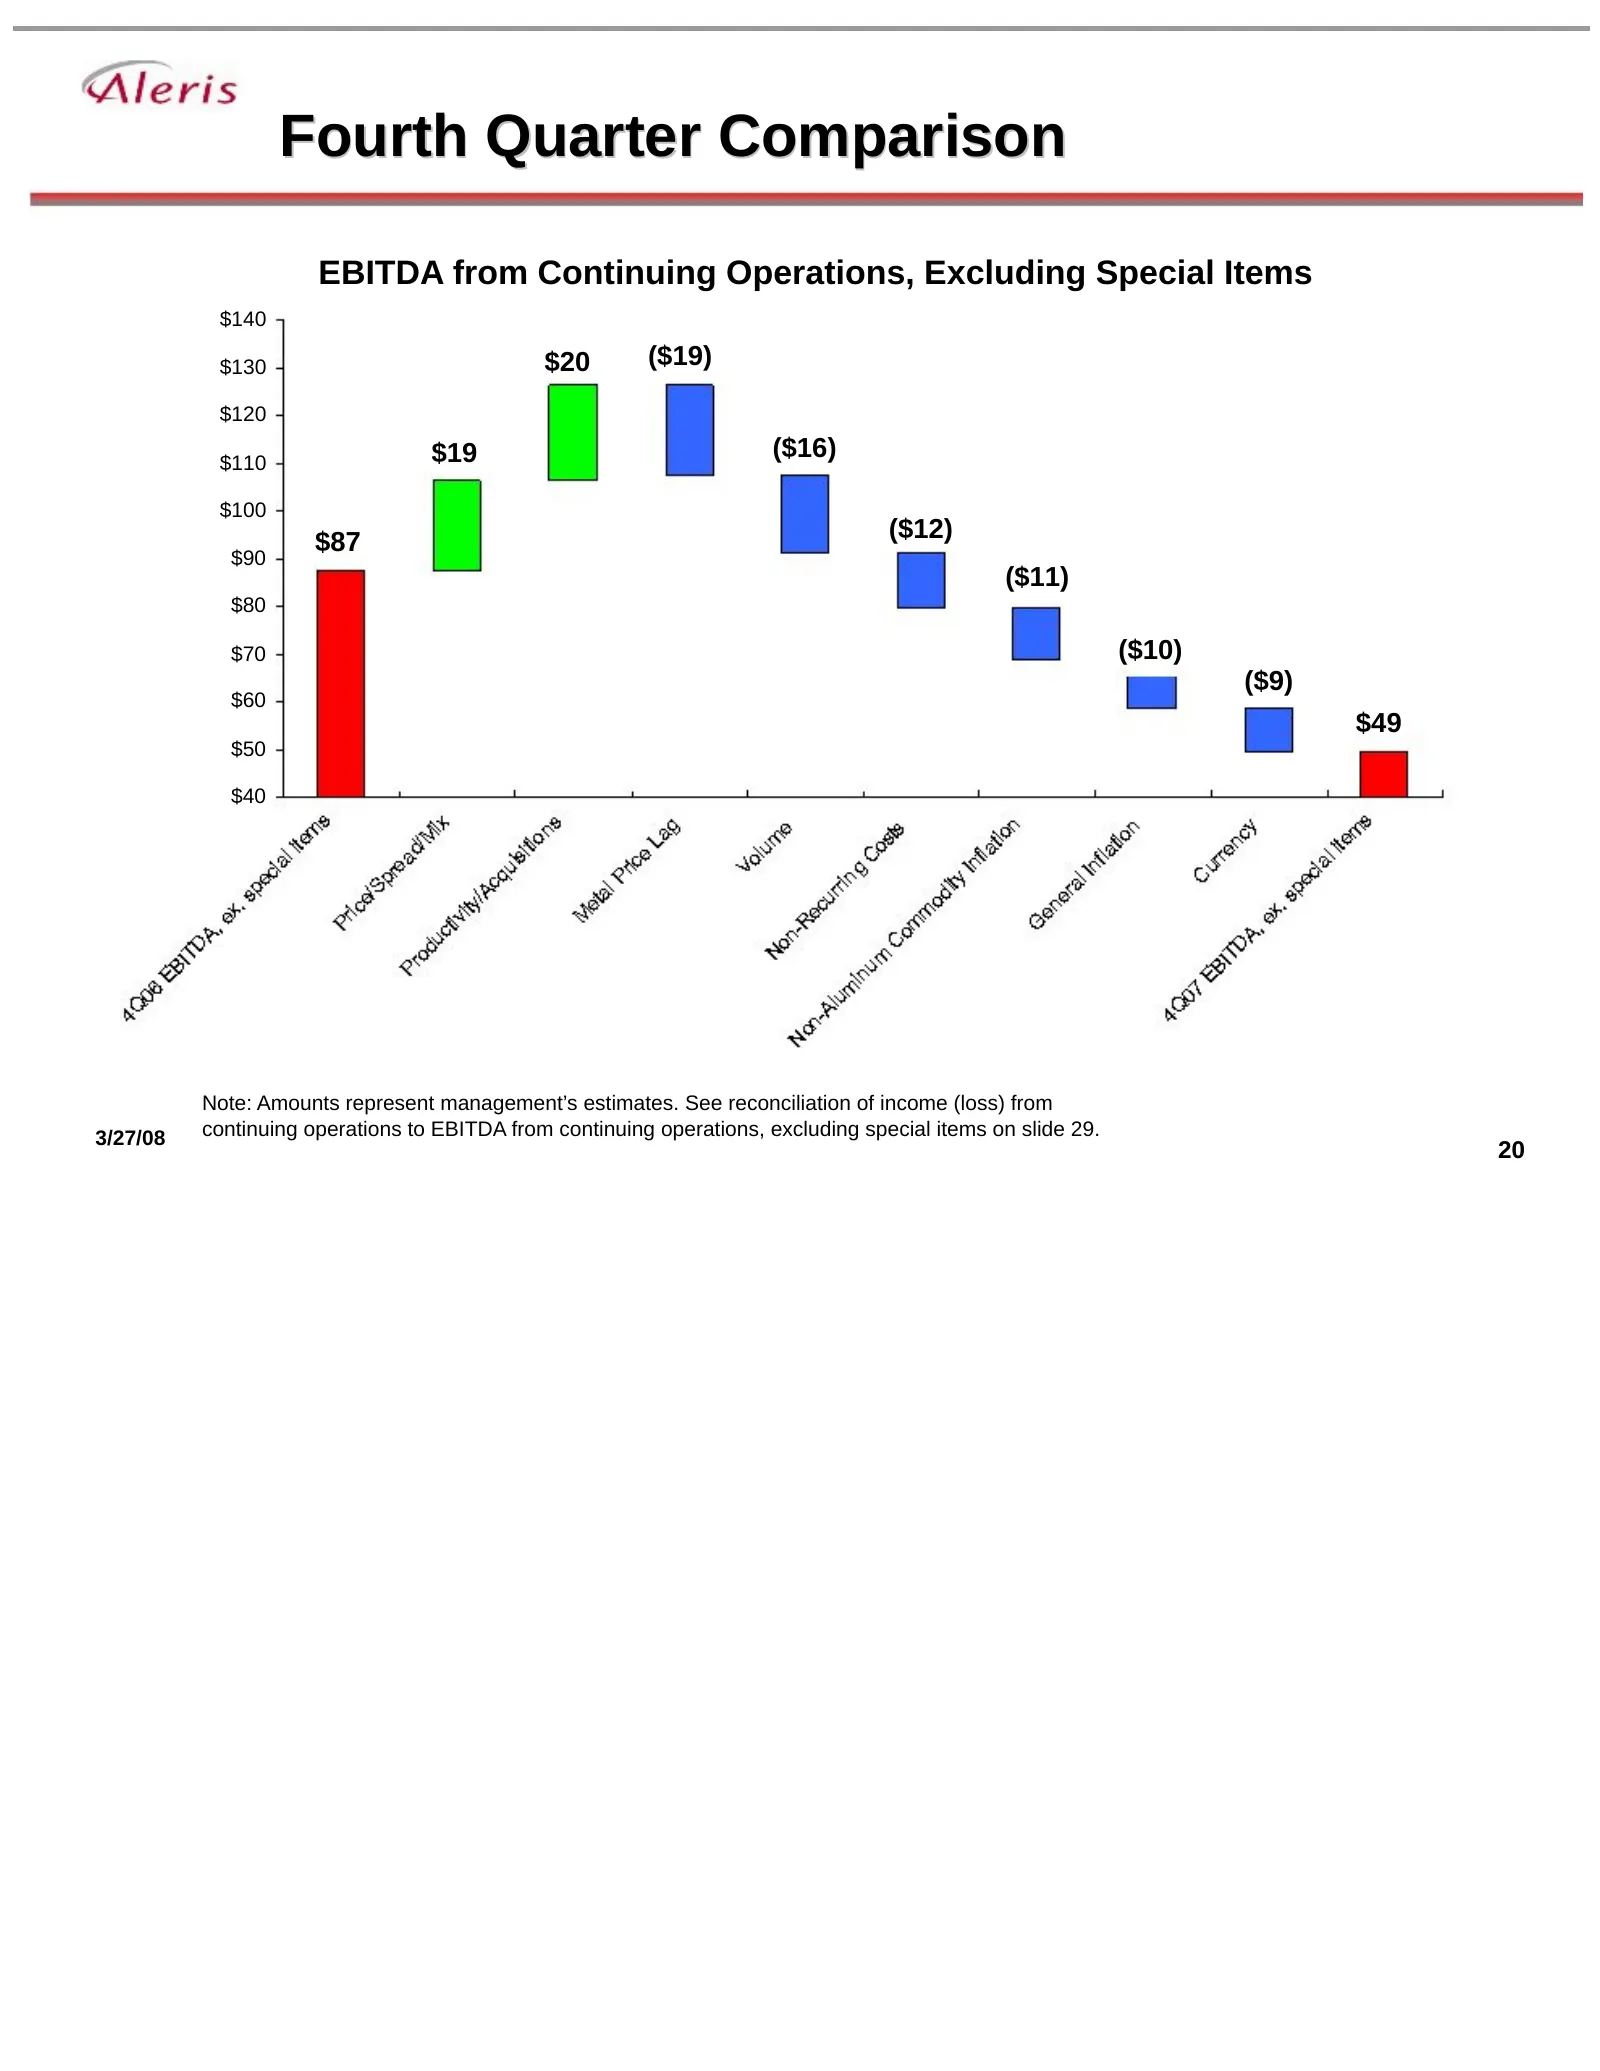
Fourth Quarter Comparison EBITDA from Continuing Operations, Excluding Special Items $140 $130 $20 ($19) $120 $110 $19 ($16) $100 $87 ($12) $90 ($11) $80 $70 ($10) ($9) $60 $49 $50 $40 Note: Amounts represent management’s estimates. See reconciliation of income (loss) from 3/27/08 continuing operati
Slide 21: Global Rolled and Extruded Products – 4Q
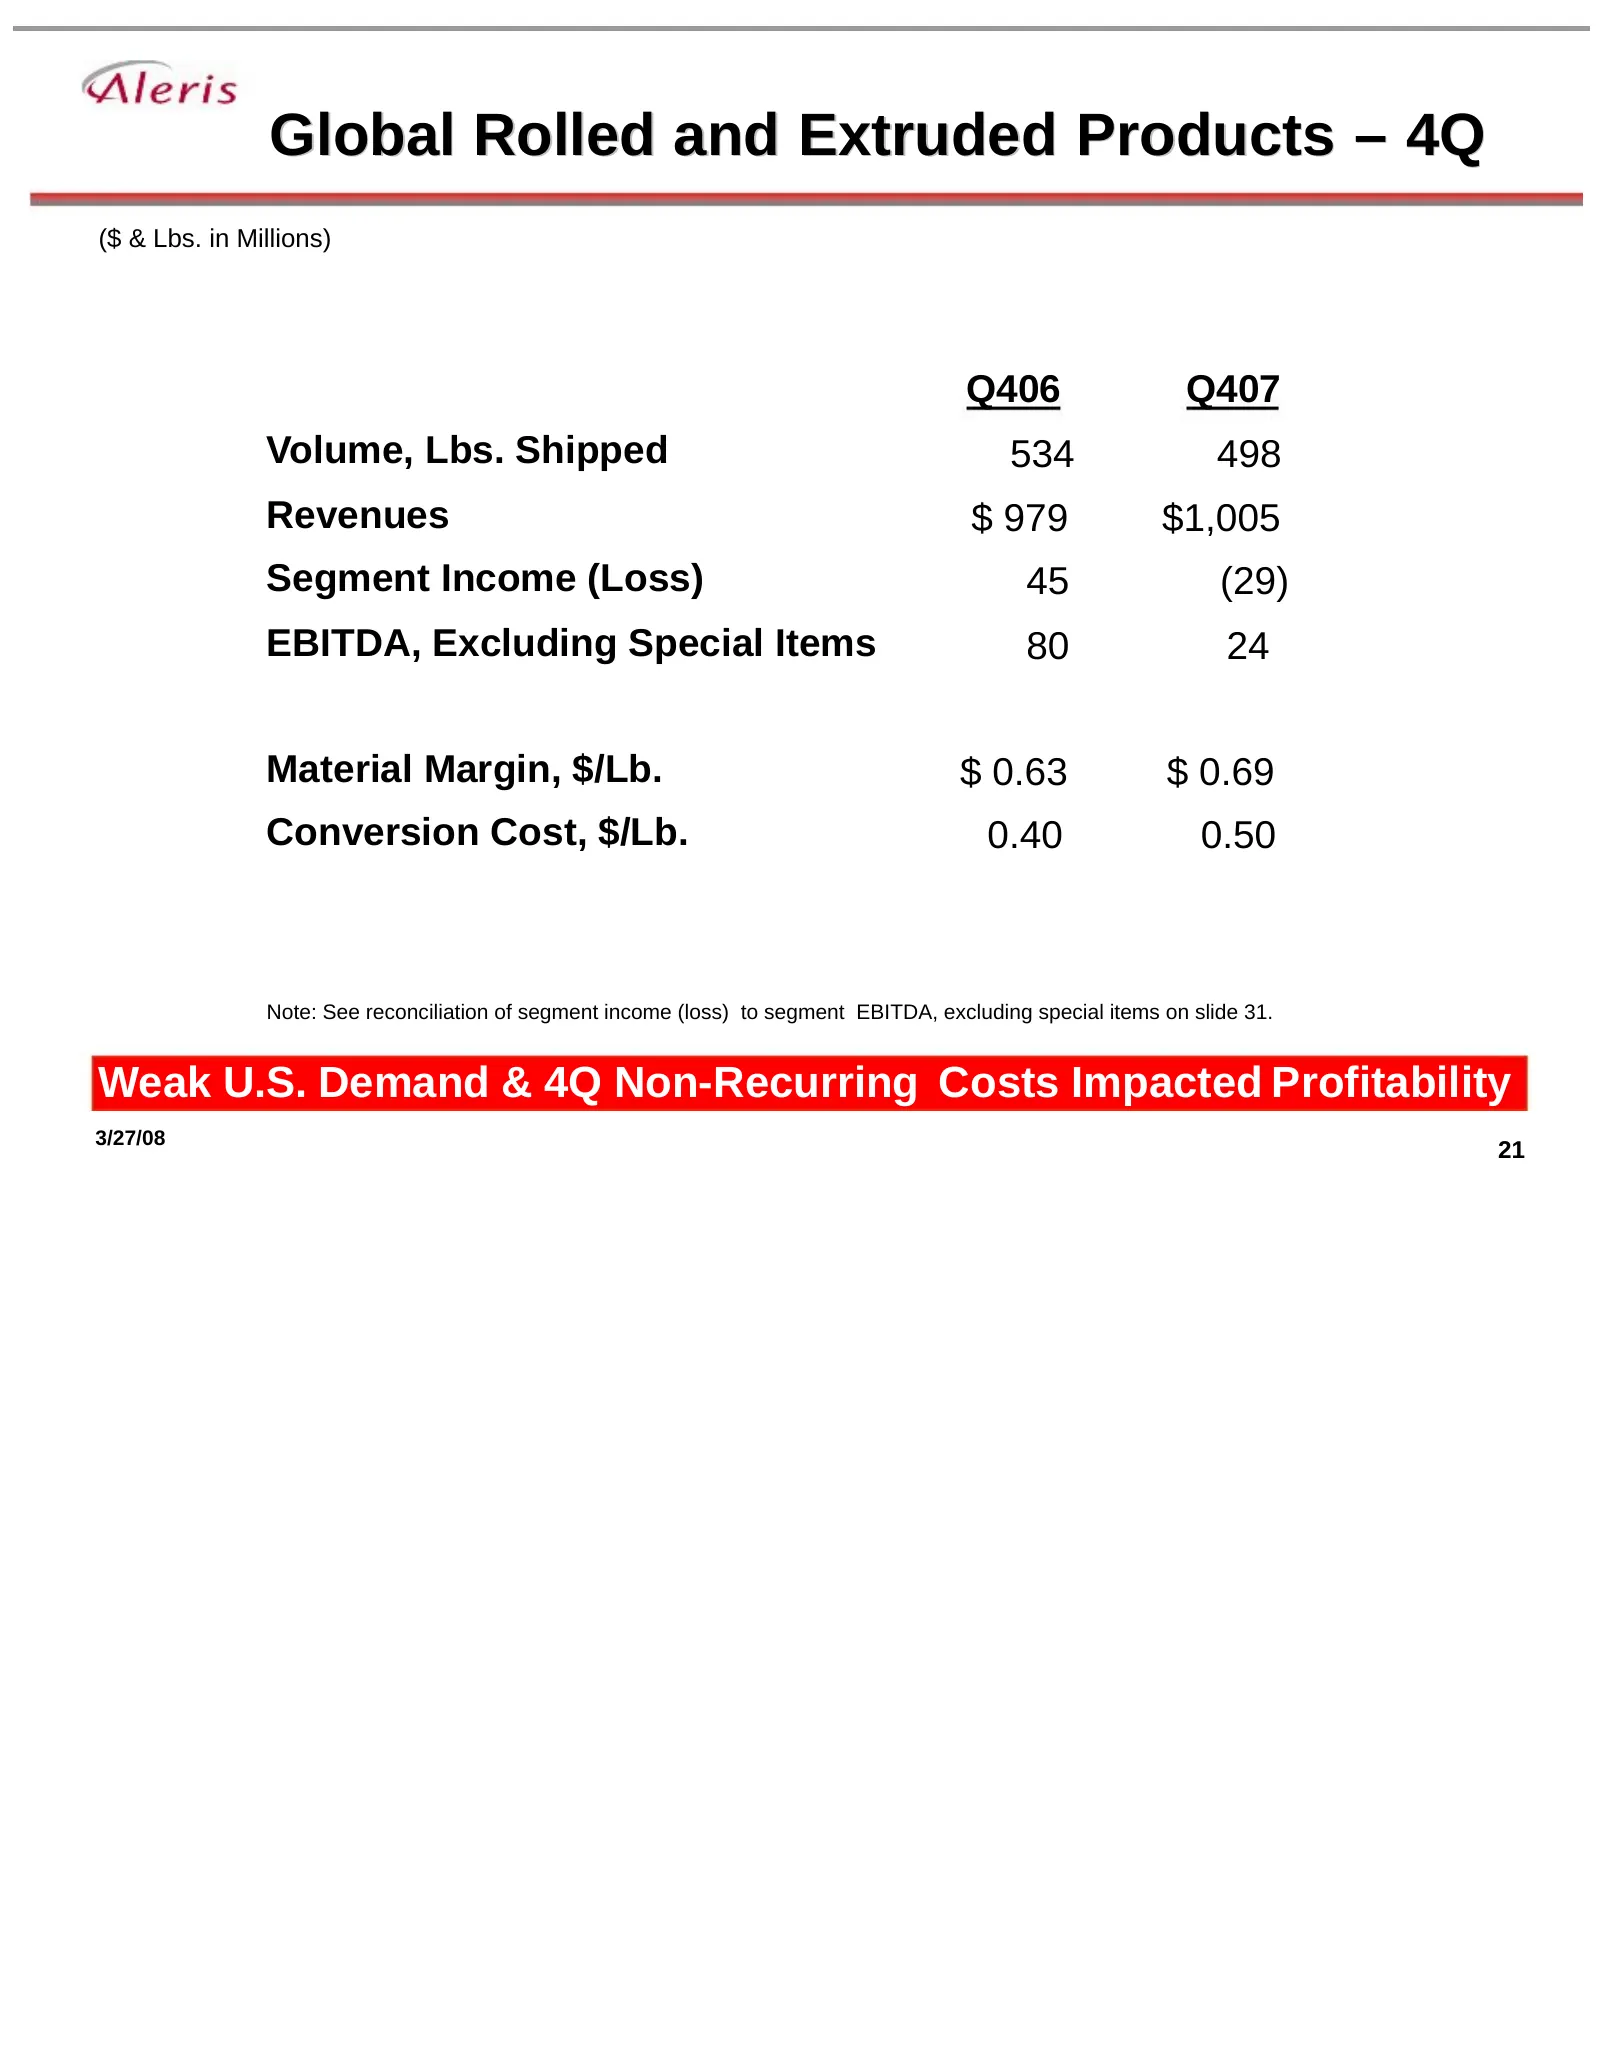
Global Rolled and Extruded Products – 4Q ($ & Lbs. in Millions) Q406 Q407 Volume, Lbs. Shipped 534 498 Revenues $ 979 $1,005 Segment Income (Loss) 45 (29) EBITDA, Excluding Special Items 80 24 Material Margin, $/Lb. $ 0.63 $ 0.69 Conversion Cost, $/Lb. 0.40 0.50 Note: See reconciliation of segment i
Slide 22: Global Recycling – Q4
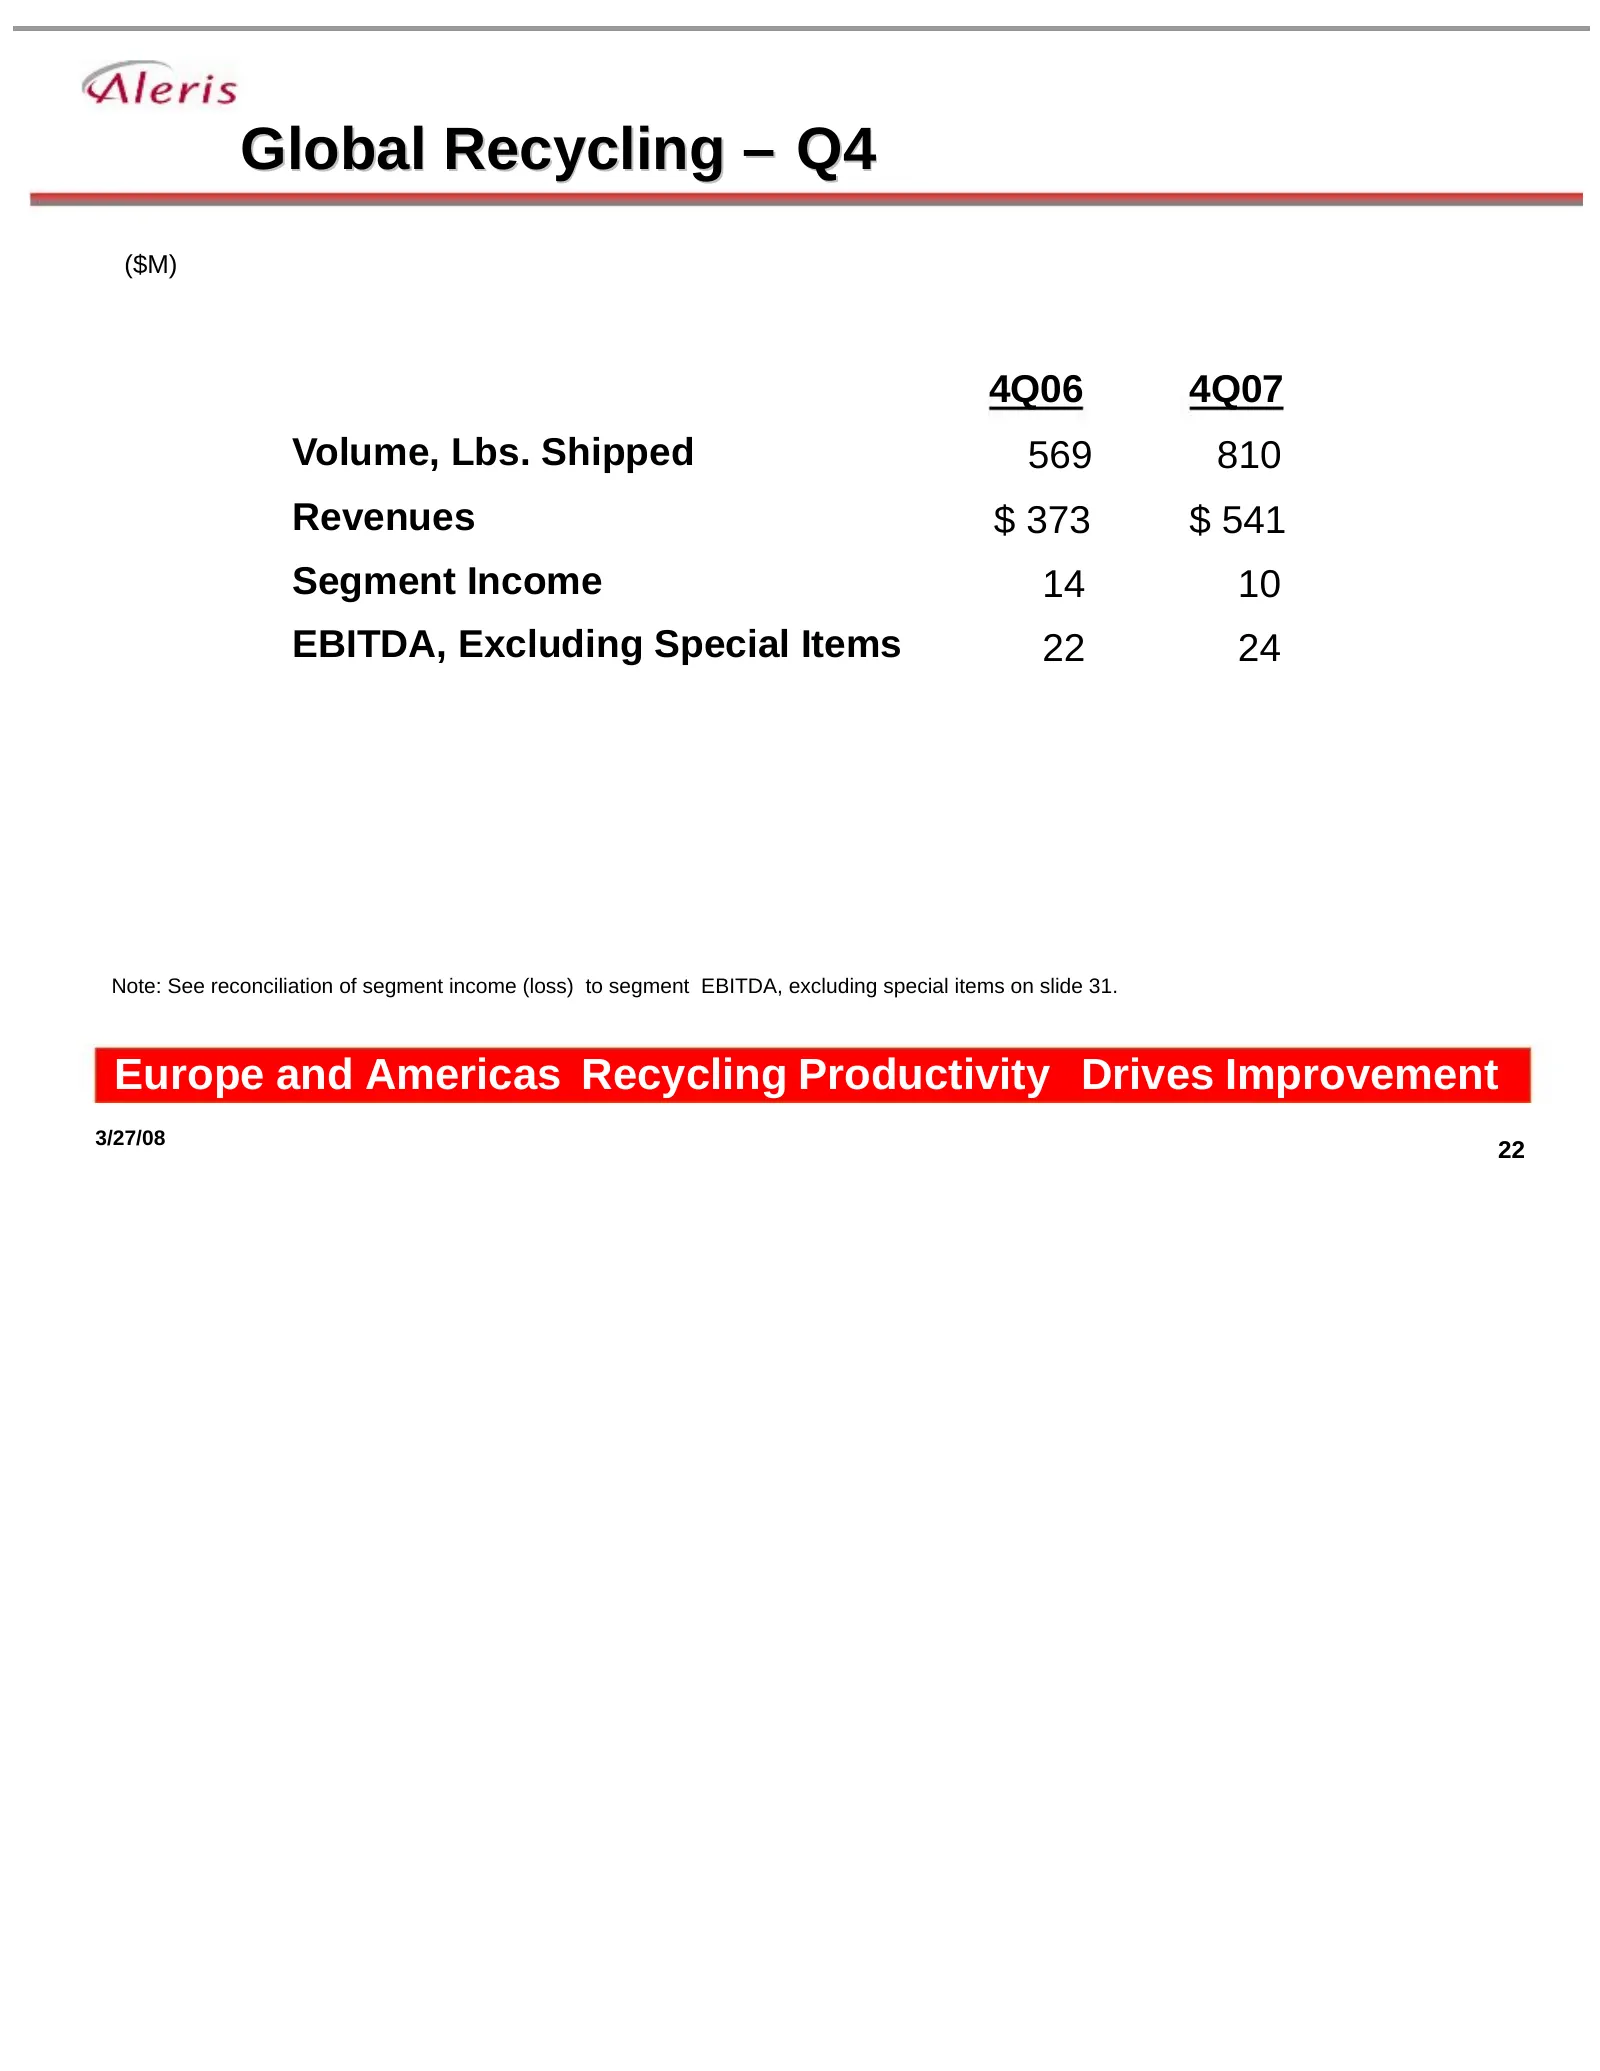
Global Recycling – Q4 ($M) 4Q06 4Q07 Volume, Lbs. Shipped 569 810 Revenues $ 373 $ 541 Segment Income 14 10 EBITDA, Excluding Special Items 22 24 Note: See reconciliation of segment income (loss) to segment EBITDA, excluding special items on slide 31. Europe and Americas Recycling Productivity Drive
Slide 23: Attacking the Costs
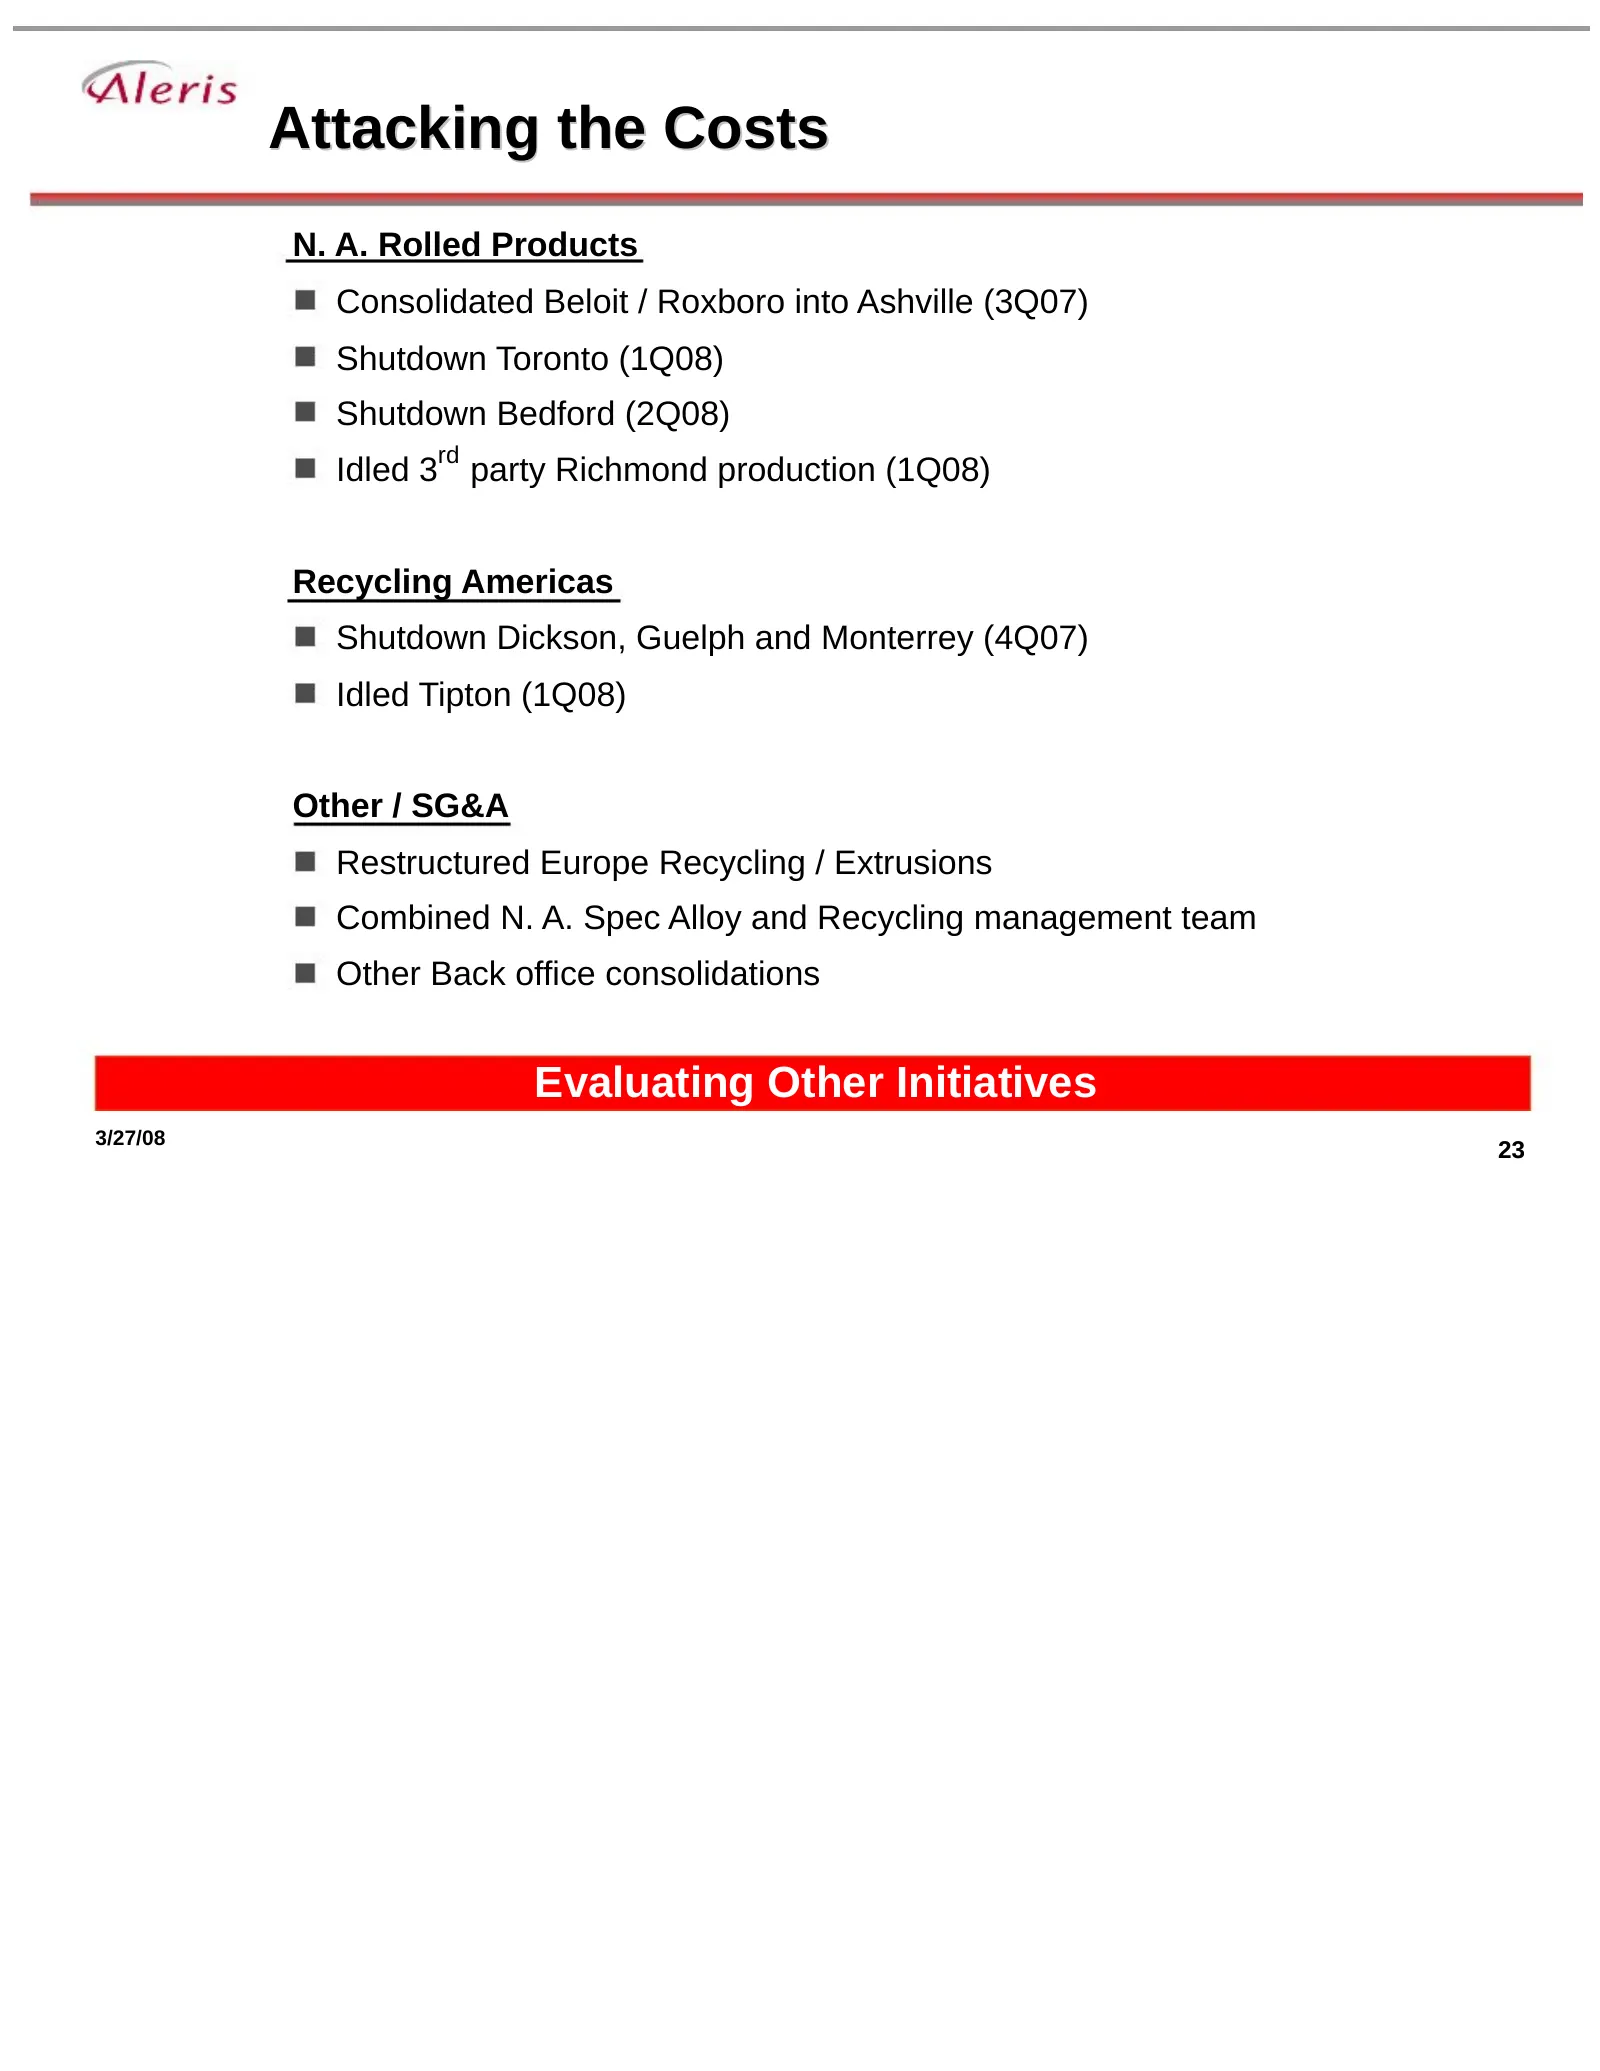
Attacking the Costs N. A. Rolled Products Consolidated Beloit / Roxboro into Ashville (3Q07) Shutdown Toronto (1Q08) Shutdown Bedford (2Q08) rd Idled 3 party Richmond production (1Q08) Recycling Americas Shutdown Dickson, Guelph and Monterrey (4Q07) Idled Tipton (1Q08) Other / SG&A Restructured Euro
Slide 24: Positioning the Cost Base
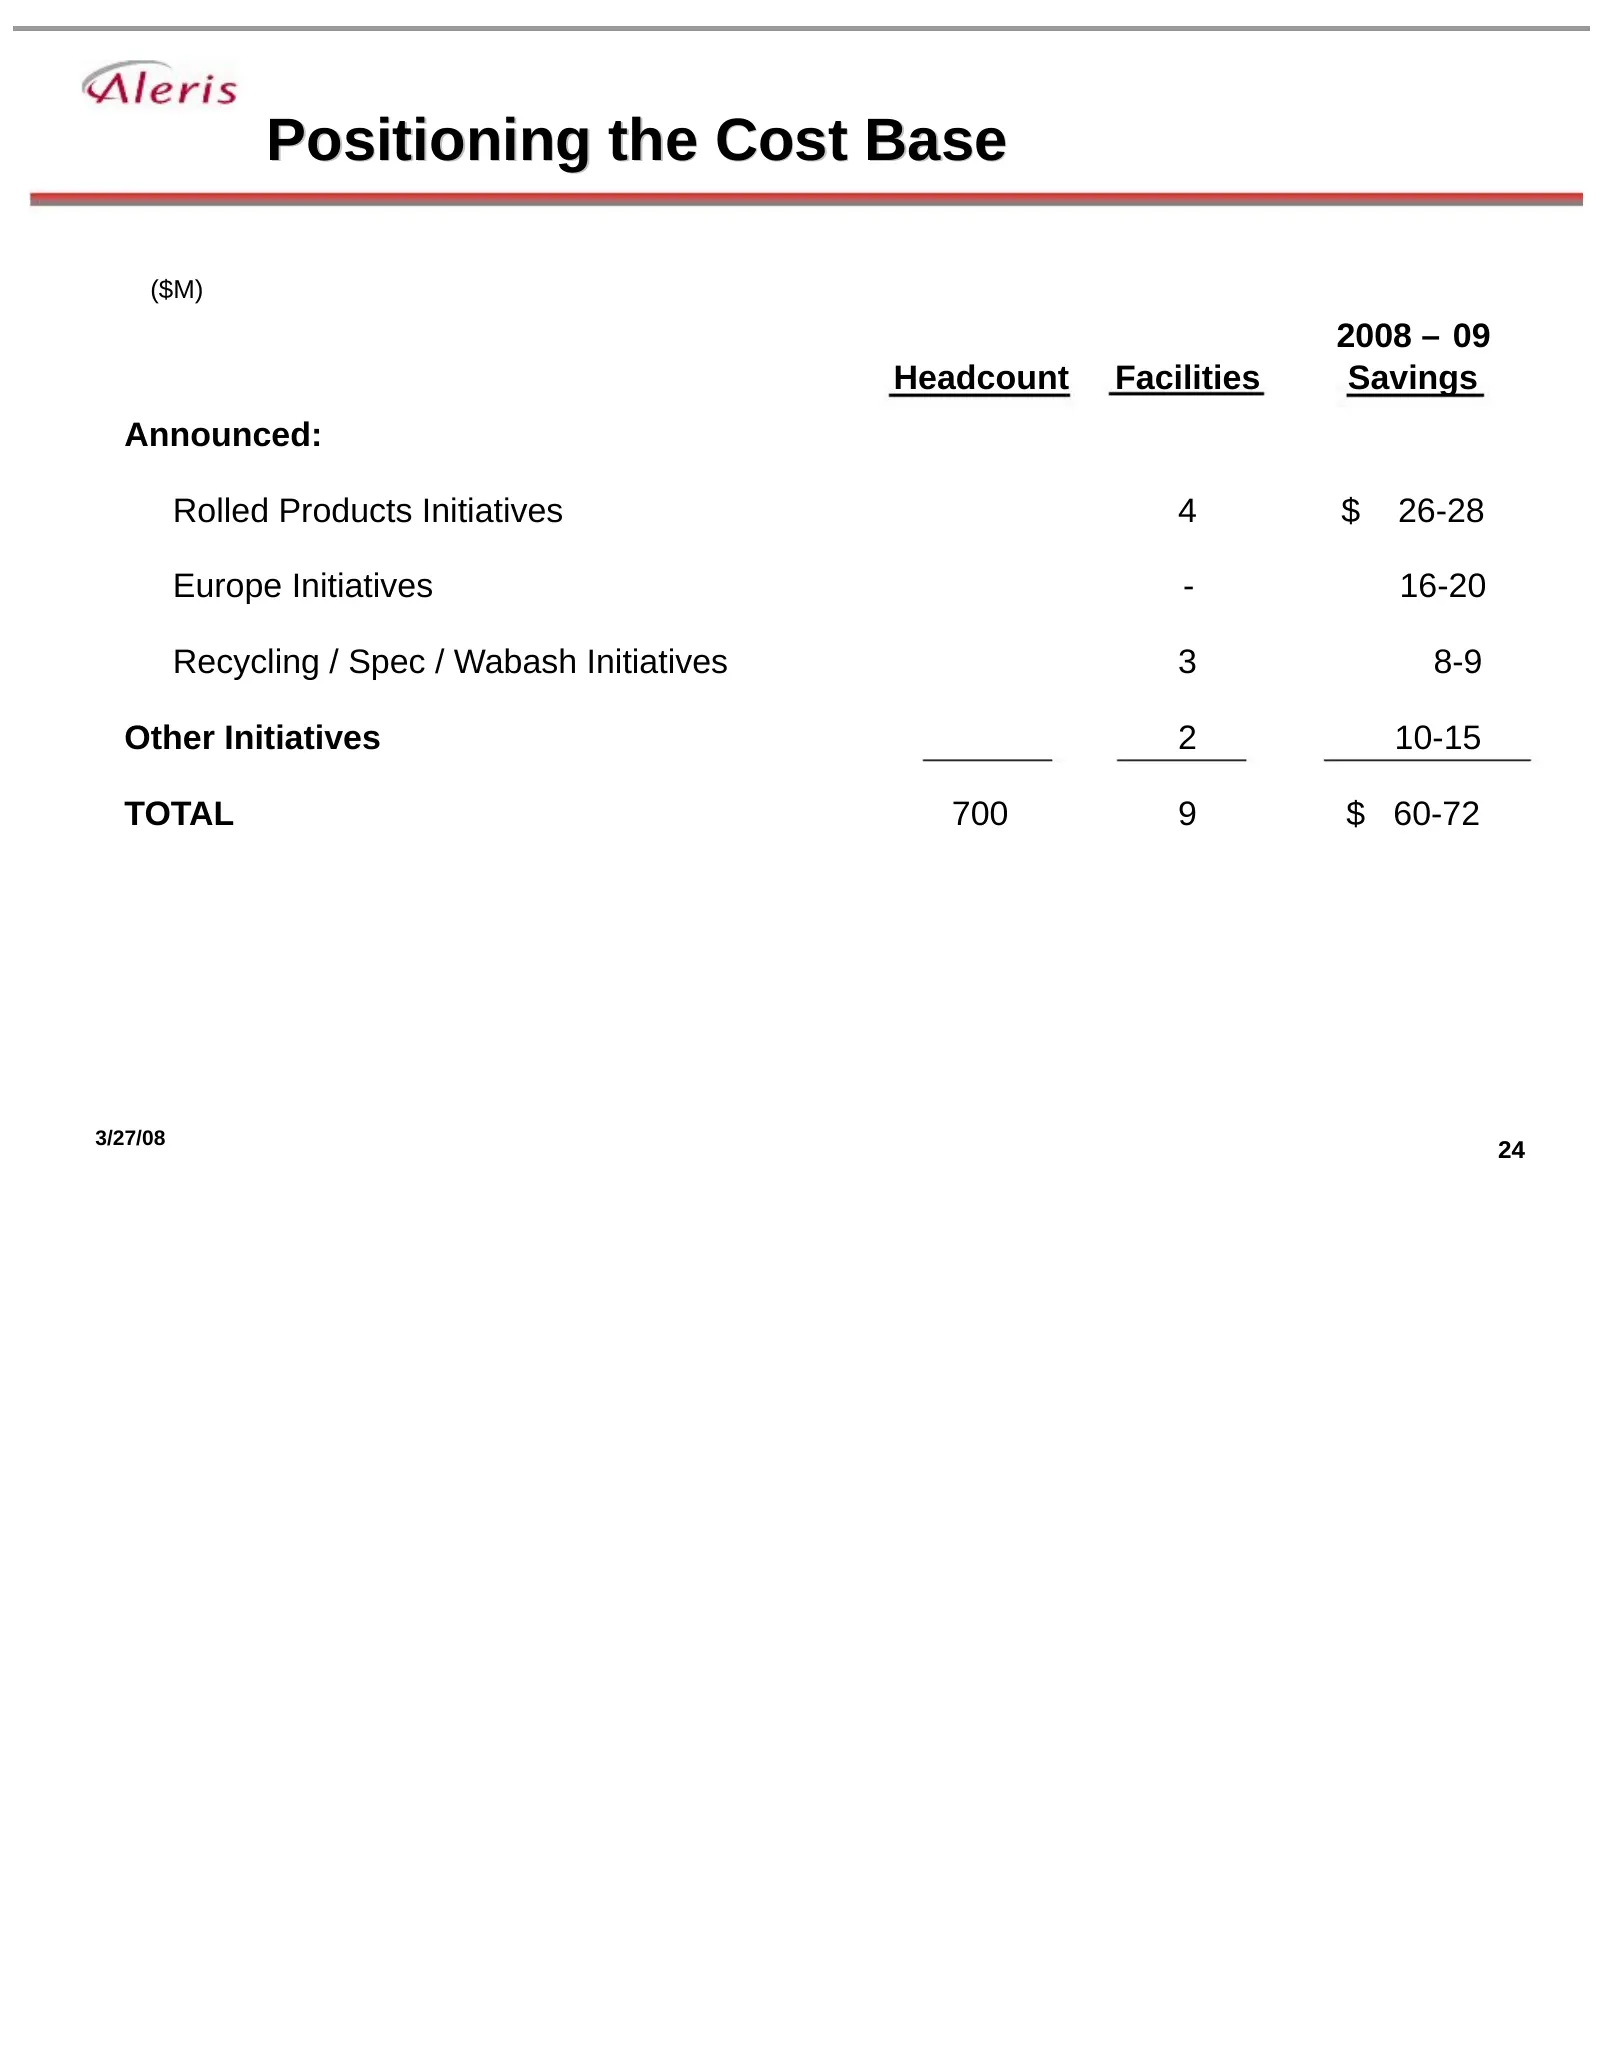
Positioning the Cost Base ($M) 2008 – 09 Headcount Facilities Savings Announced: Rolled Products Initiatives 4 $ 26-28 Europe Initiatives - 16-20 Recycling / Spec / Wabash Initiatives 3 8-9 Other Initiatives 2 10-15 TOTAL 700 9 $ 60-72 3/27/08 24
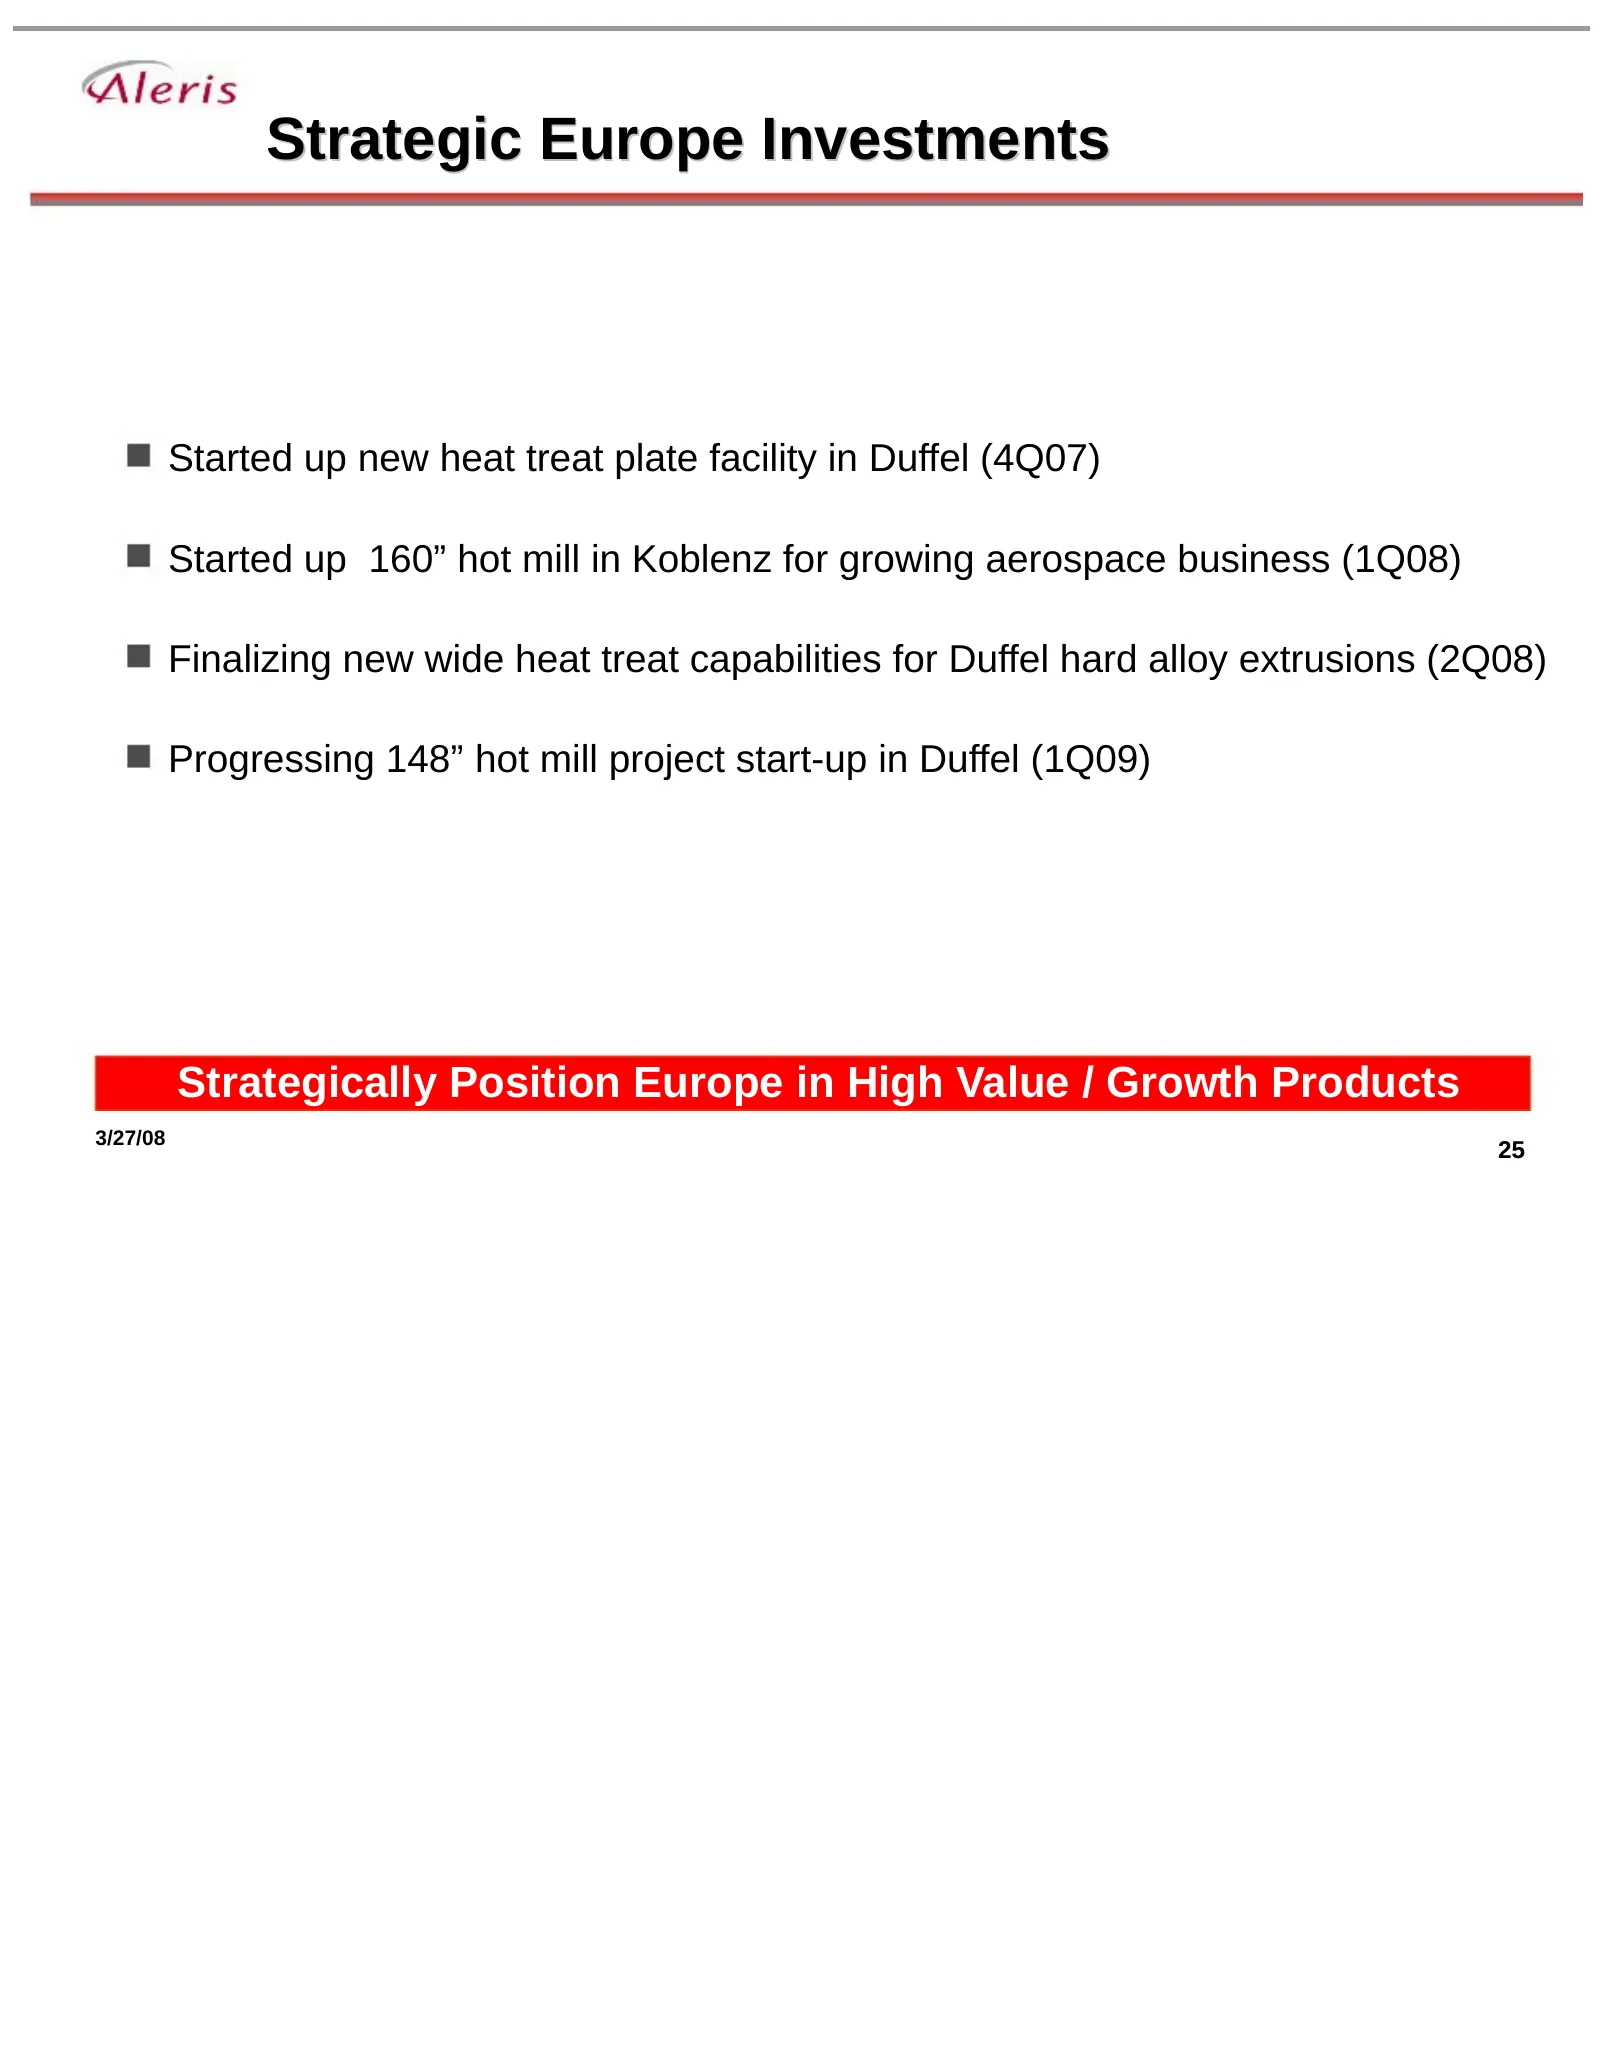
Slide 25: Strategic Europe Investments
Strategic Europe Investments Started up new heat treat plate facility in Duffel (4Q07) Started up 160” hot mill in Koblenz for growing aerospace business (1Q08) Finalizing new wide heat treat capabilities for Duffel hard alloy extrusions (2Q08) Progressing 148” hot mill project start-up in Duffel (1
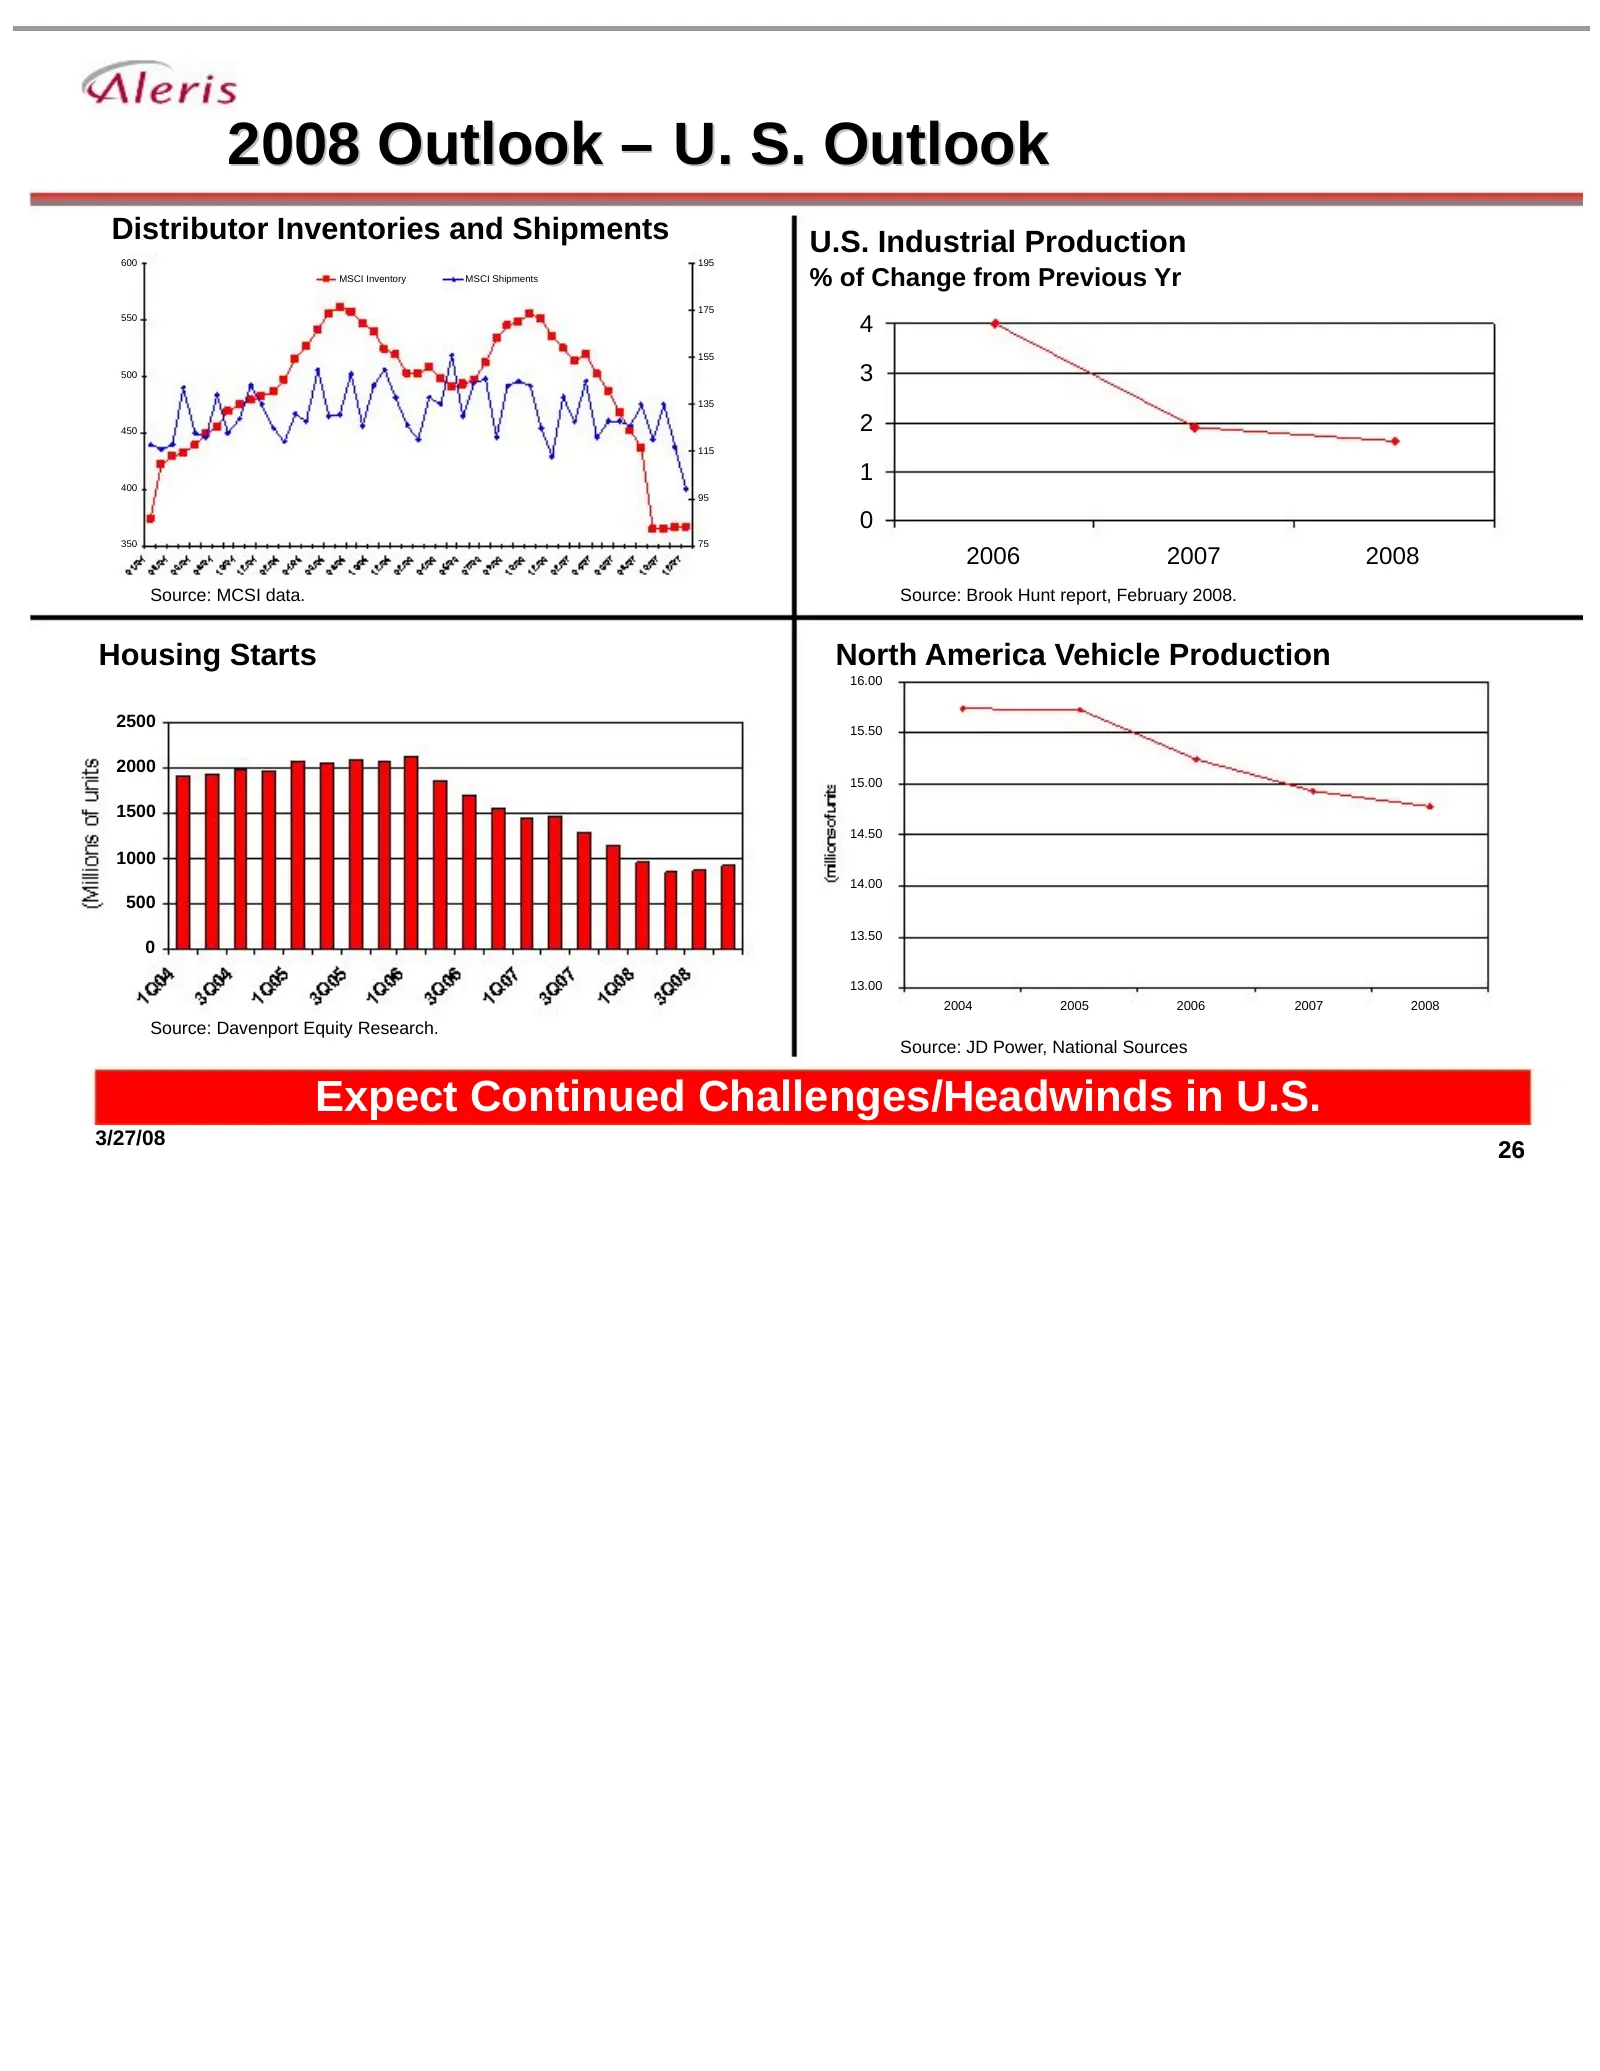
Slide 26: 2008 Outlook – U. S. Outlook
2008 Outlook – U. S. Outlook Distributor Inventories and Shipments U.S. Industrial Production 600 195 MSCI Inventory MSCI Shipments % of Change from Previous Yr 175 550 4 155 500 3 135 450 2 115 400 1 95 0 350 75 2006 2007 2008 Source: MCSI data. Source: Brook Hunt report, February 2008. Housing Sta
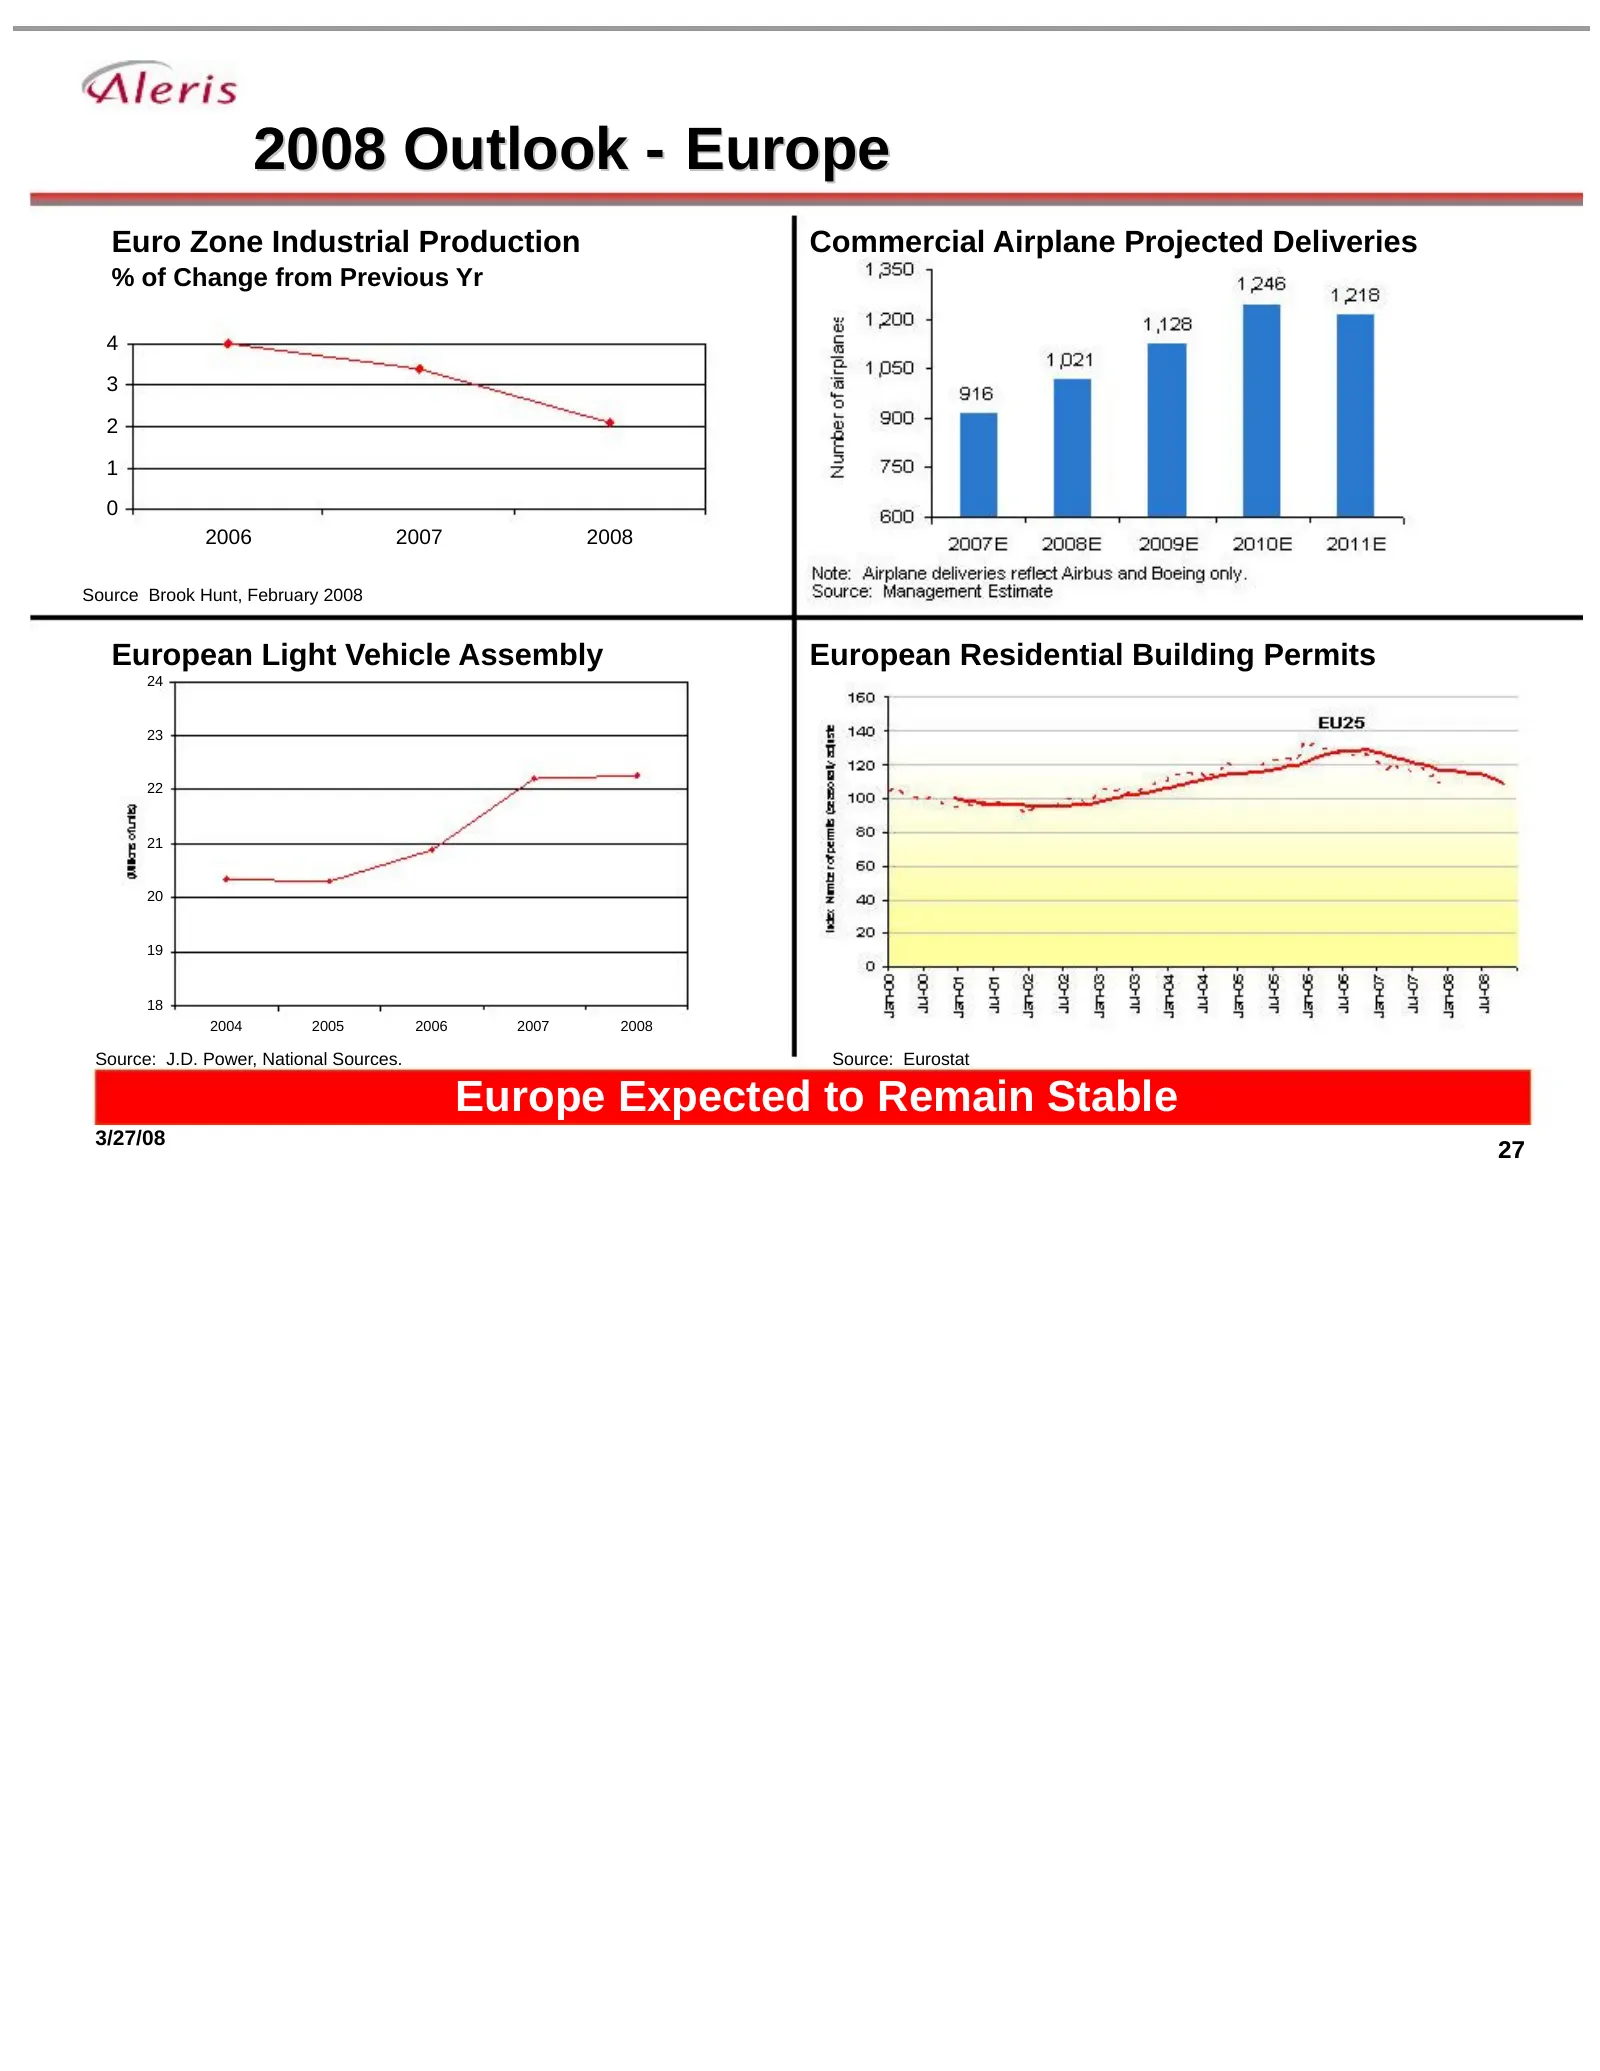
Slide 27: 2008 Outlook - Europe
2008 Outlook - Europe Euro Zone Industrial Production Commercial Airplane Projected Deliveries % of Change from Previous Yr 4 3 2 1 0 2006 2007 2008 Source Brook Hunt, February 2008 European Light Vehicle Assembly European Residential Building Permits 24 23 22 21 20 19 18 2004 2005 2006 2007 2008 So
Slide 28: Reconciliations of Non-GAAP Measures and Appendix
Reconciliations of Non-GAAP Measures and Appendix This presentation refers to various non-GAAP (generally accepted accounting principles) financial measures including EBITDA from continuing operations, EBITDA from continuing operations, excluding special items, and free cash flow from continuing ope
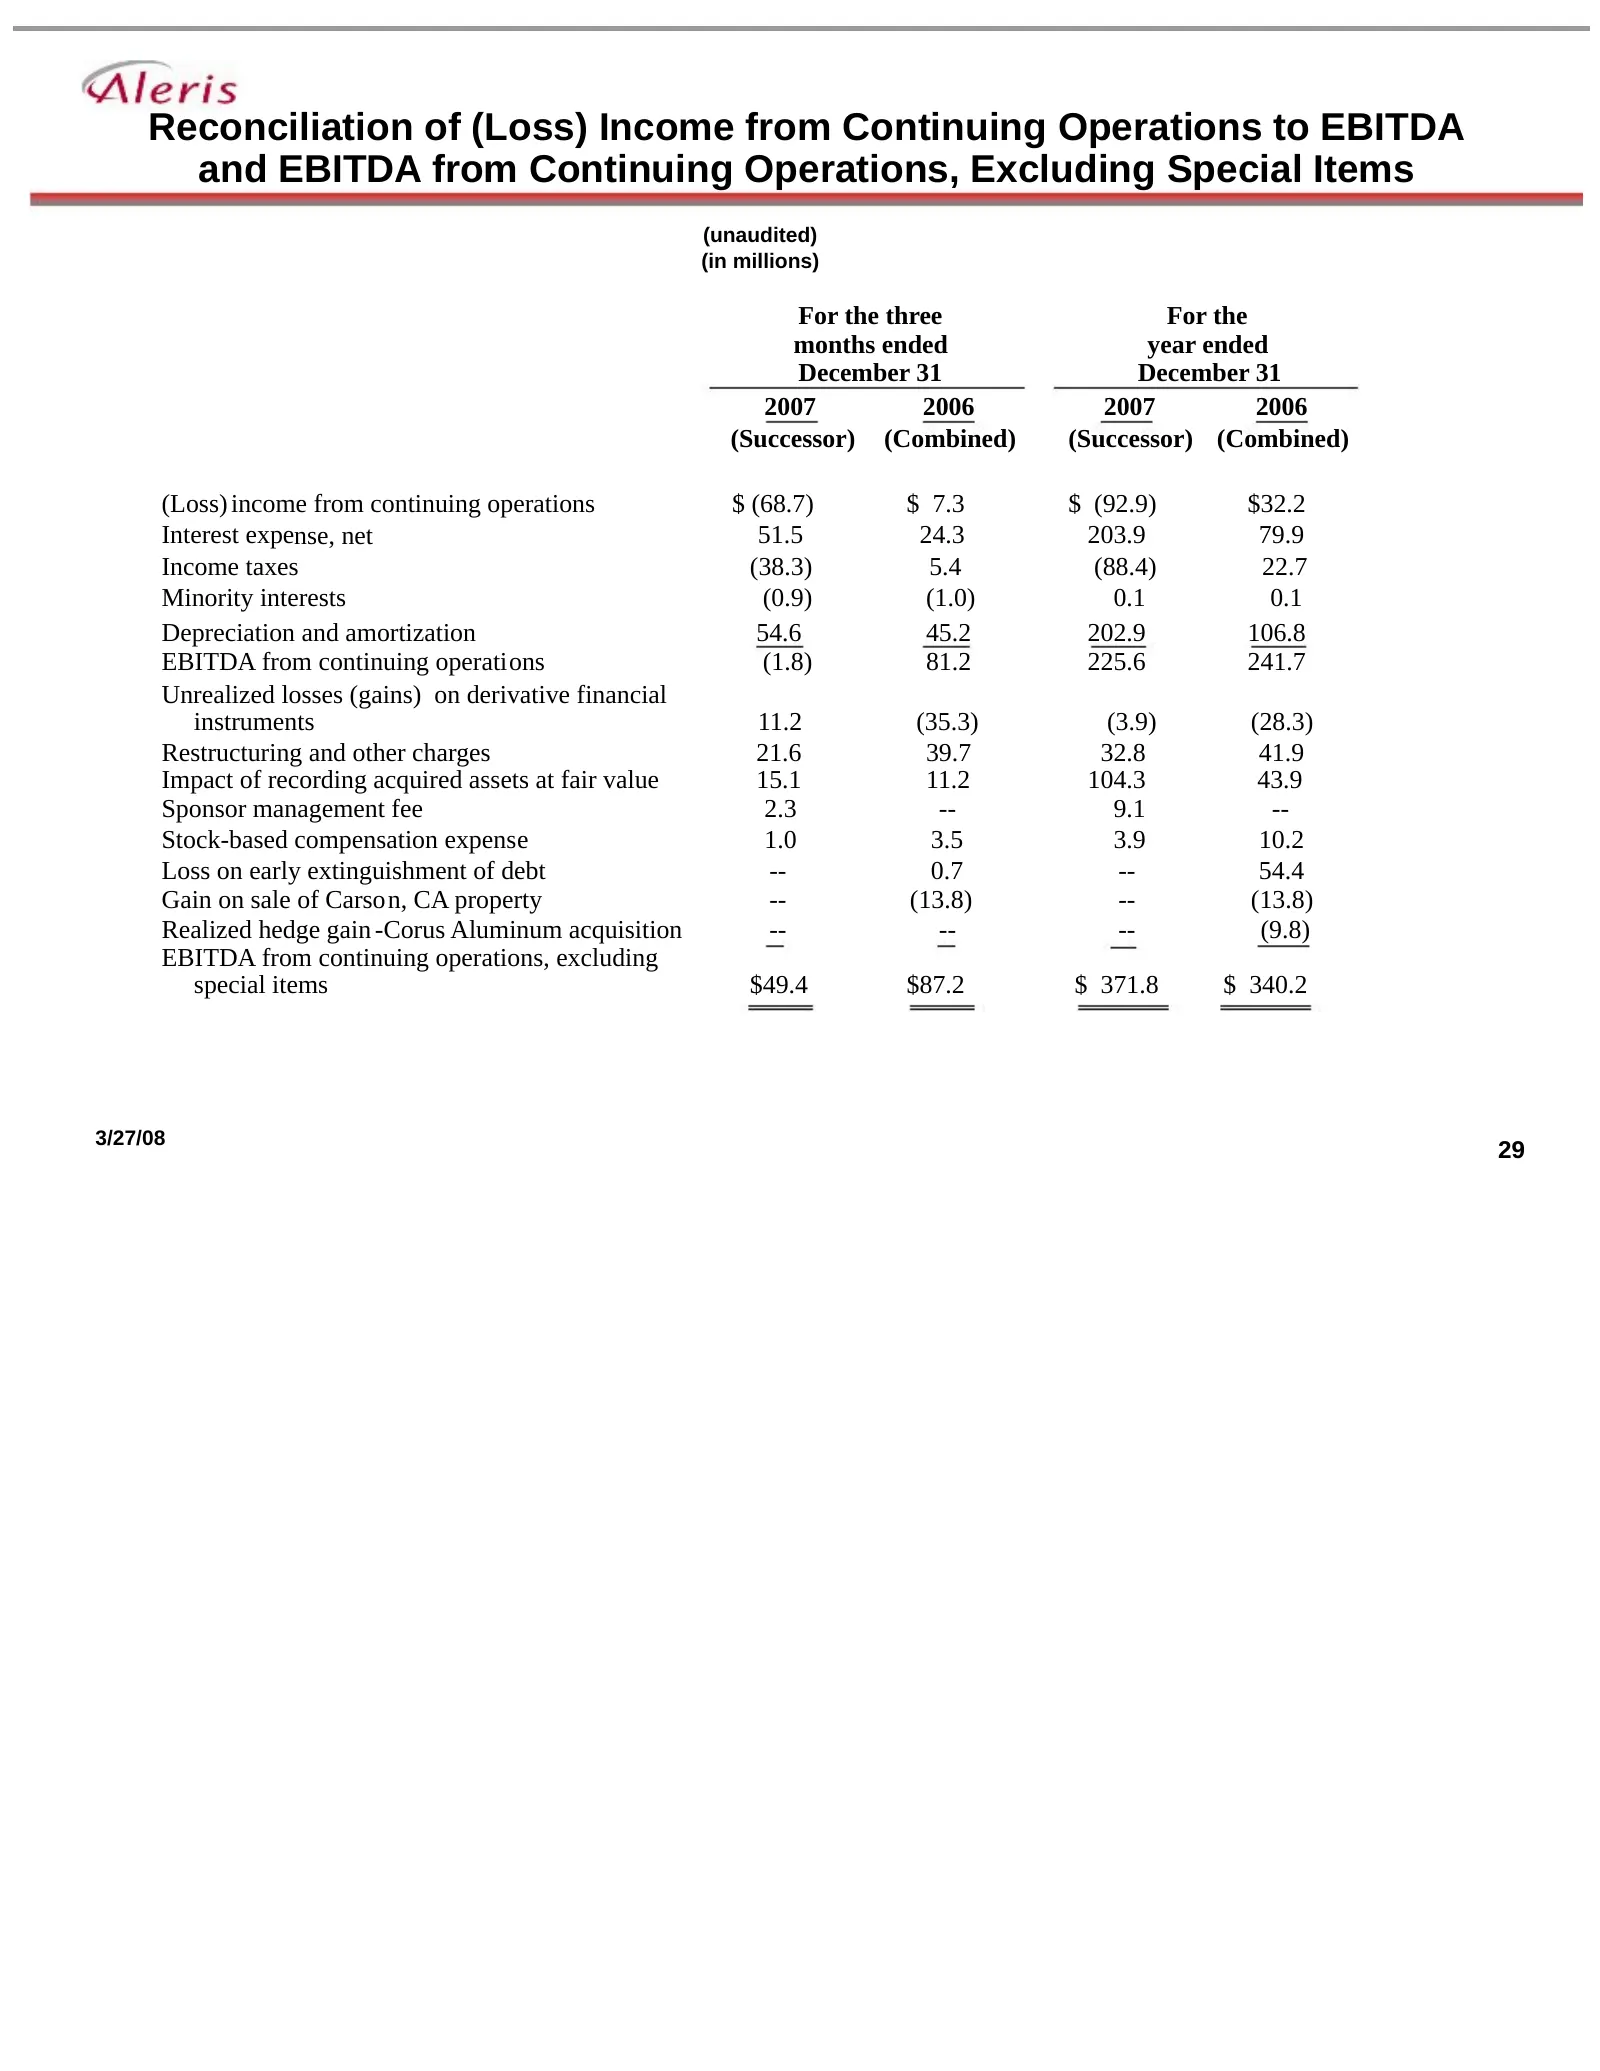
Slide 29: Reconciliation of (Loss) Income from Continuing Operations to EBITDA
Reconciliation of (Loss) Income from Continuing Operations to EBITDA and EBITDA from Continuing Operations, Excluding Special Items (unaudited) (in millions) For the three For the months ended year ended December 31 December 31 2007 2006 2007 2006 (Successor) (Combined) (Successor) (Combined) (Loss)
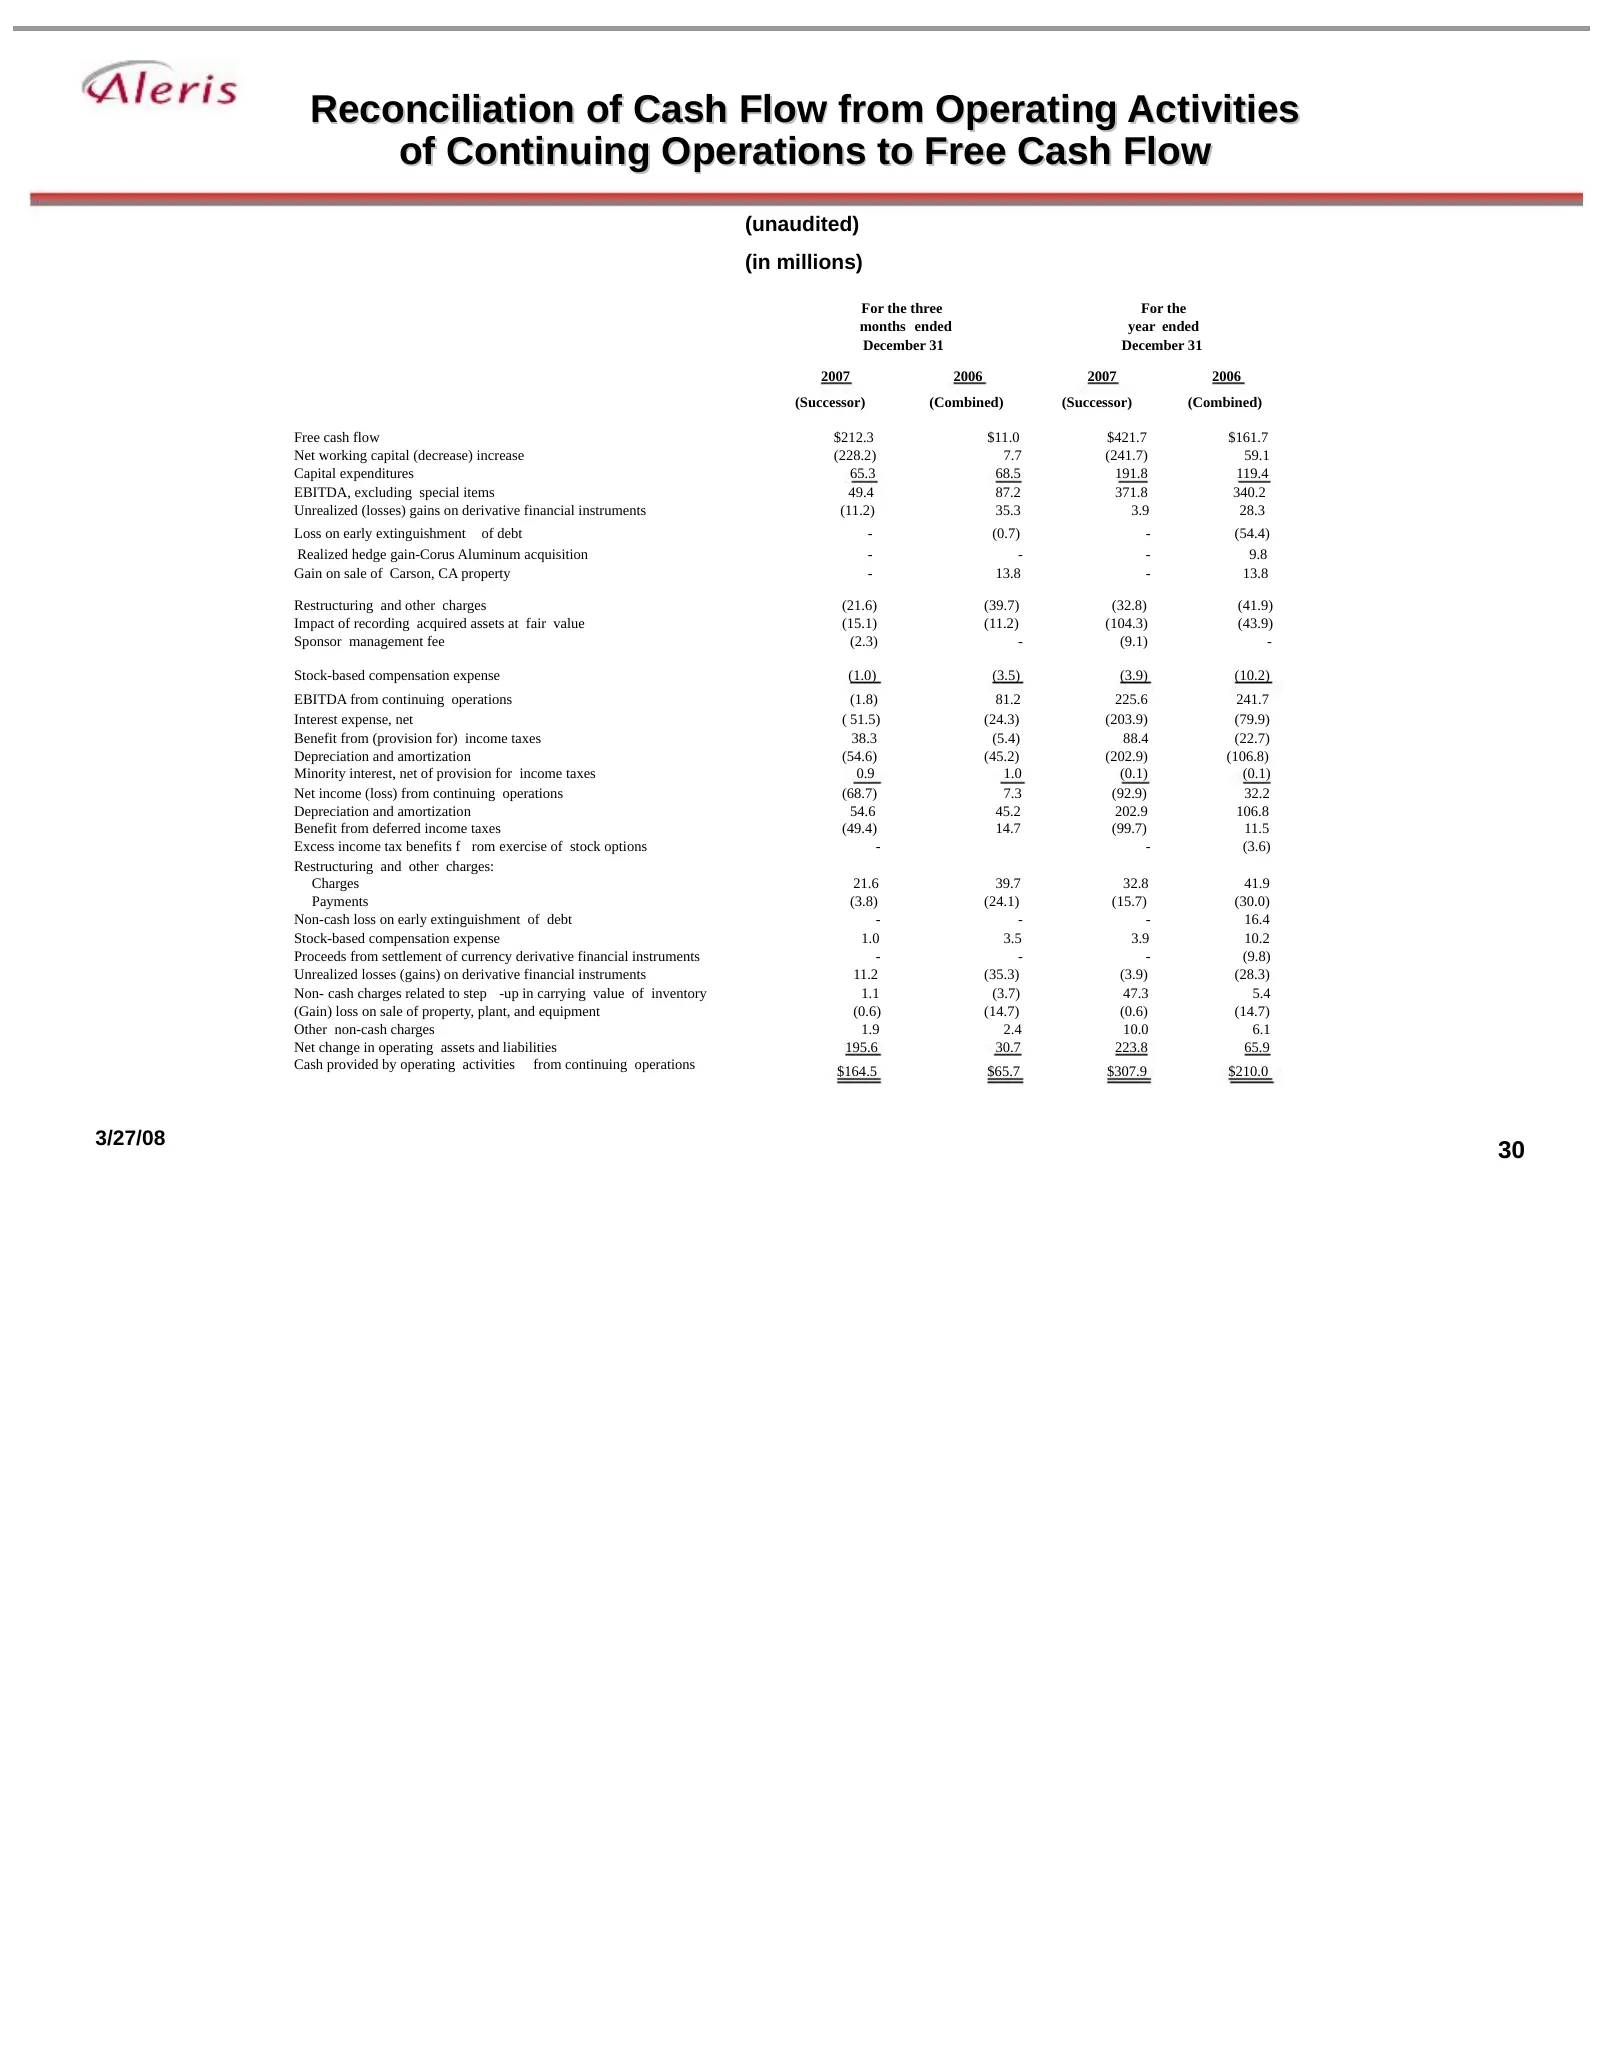
Slide 30: Reconciliation of Cash Flow from Operating Activities to Free Cash Flow
Reconciliation of Cash Flow from Operating Activities of Continuing Operations to Free Cash Flow (unaudited) (in millions) For the three For the months ended year ended December 31 December 31 2007 2006 2007 2006 (Successor) (Combined) (Successor) (Combined) Free cash flow $212.3 $11.0 $421.7 $161.7
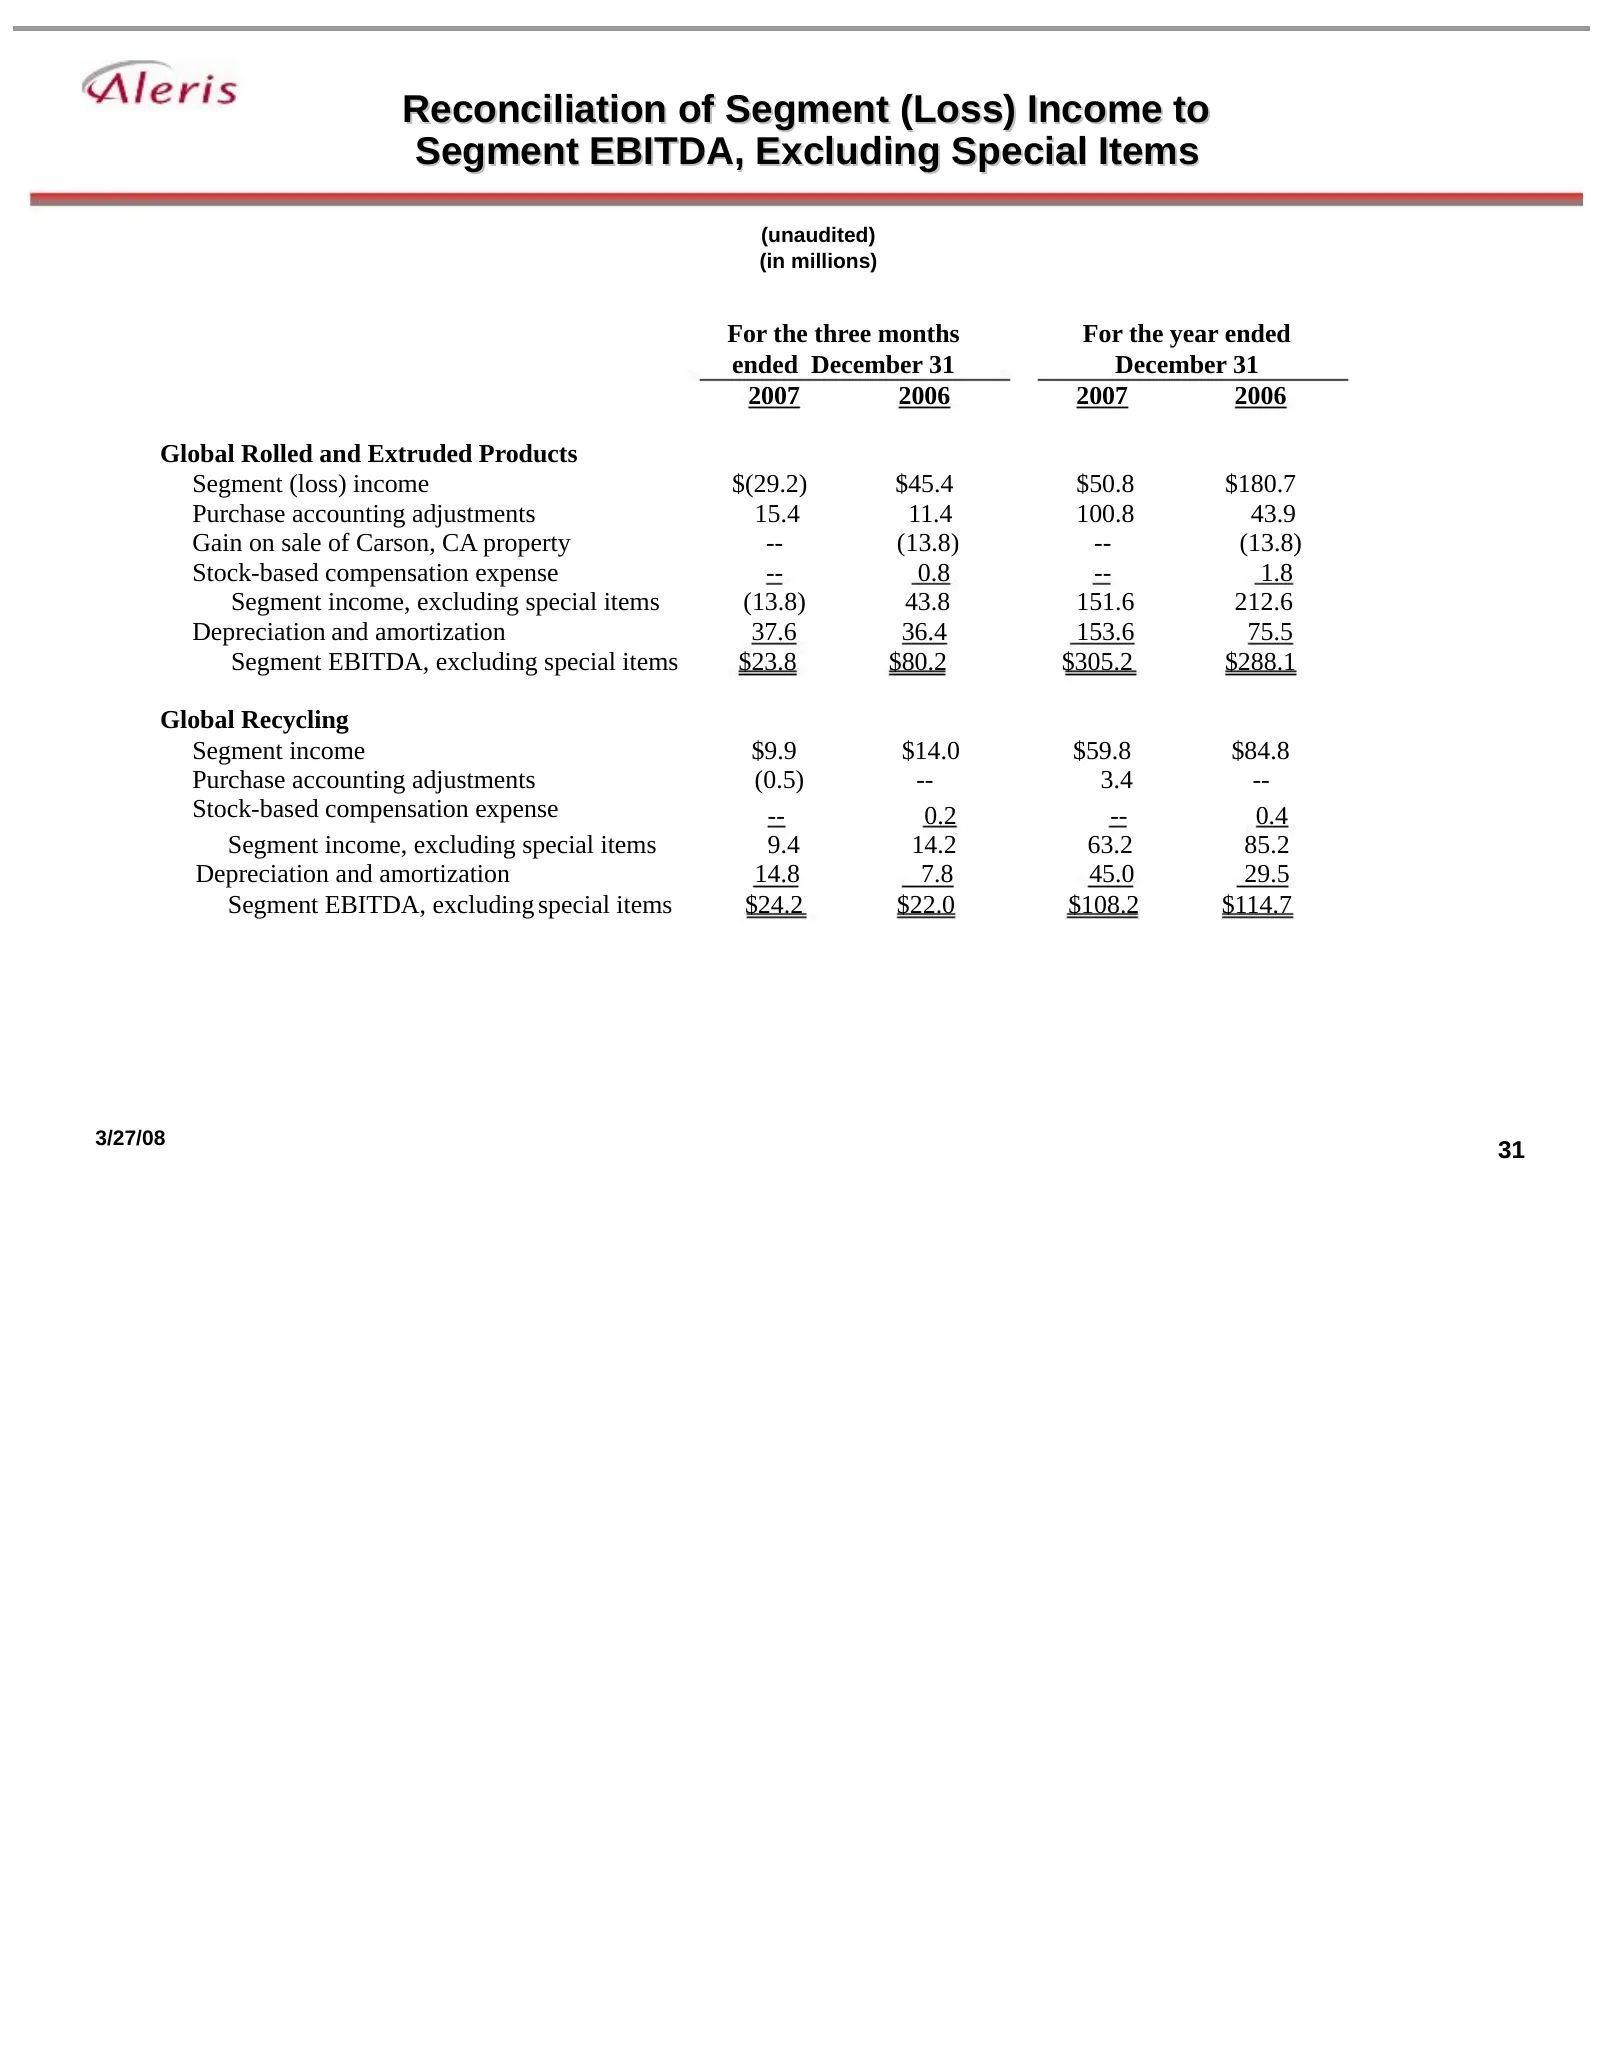
Slide 31: Reconciliation of Segment (Loss) Income to Segment EBITDA
Reconciliation of Segment (Loss) Income to Segment EBITDA, Excluding Special Items (unaudited) (in millions) For the three months For the year ended ended December 31 December 31 2007 2006 2007 2006 Global Rolled and Extruded Products Segment (loss) income $(29.2) $45.4 $50.8 $180.7 Purchase account
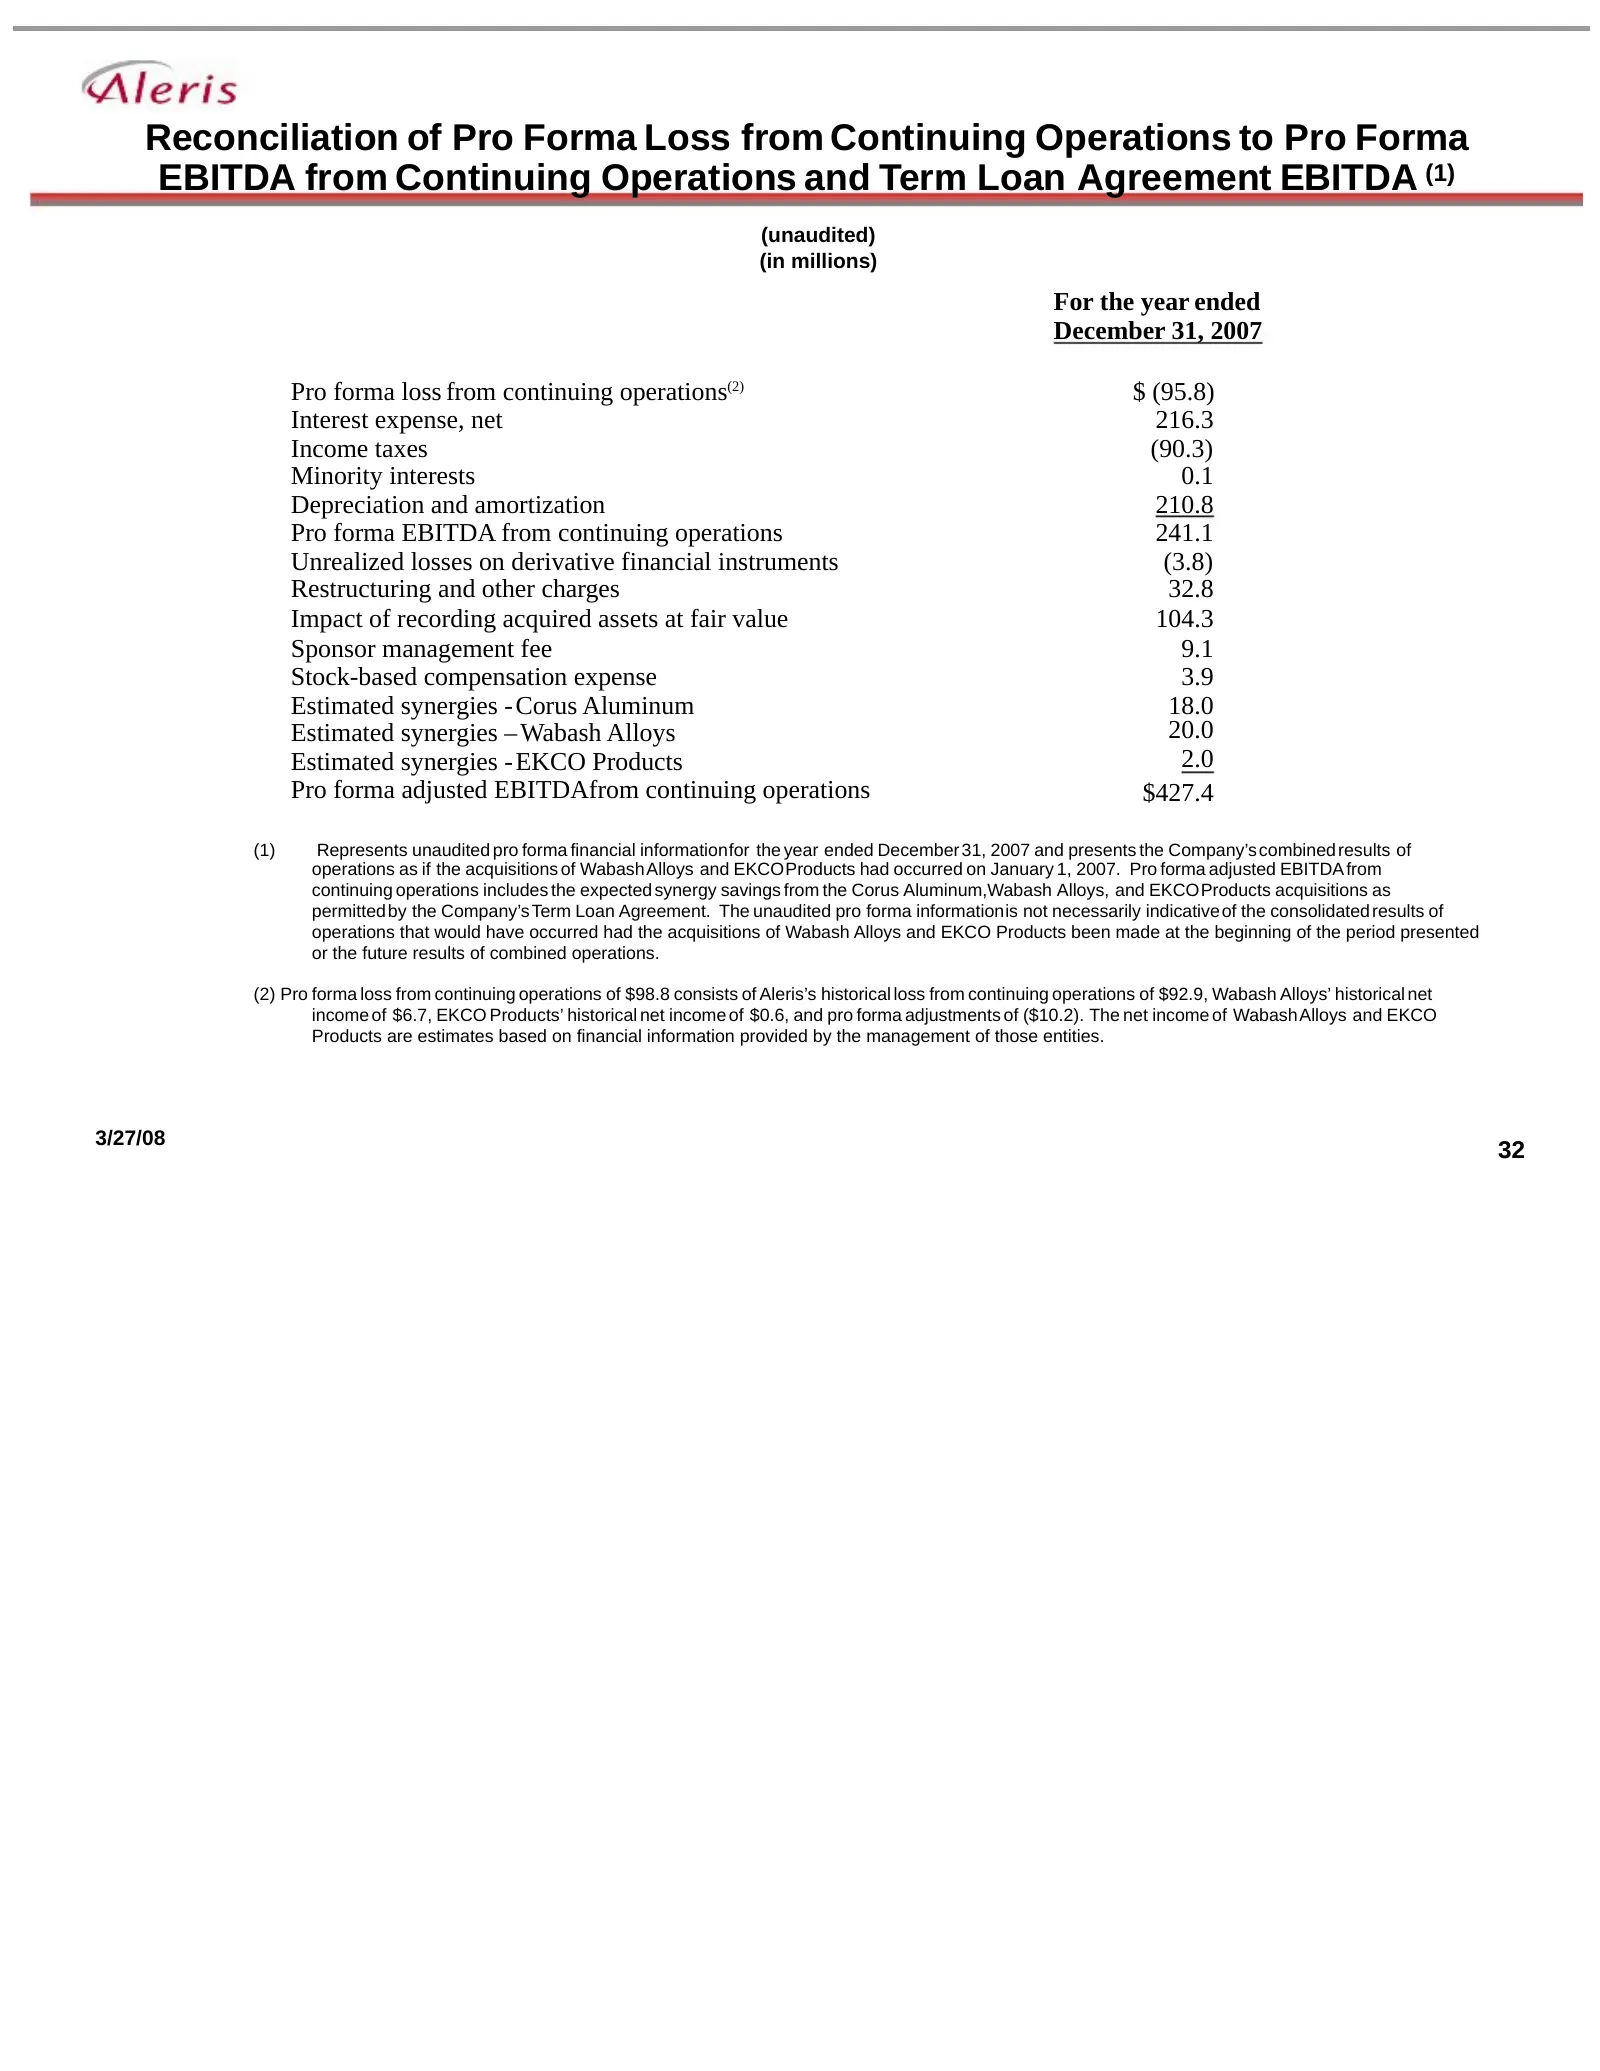
Slide 32: Reconciliation of Pro Forma Loss to Term Loan Agreement EBITDA
Reconciliation of Pro Forma Loss from Continuing Operations to Pro Forma EBITDA from Continuing Operations and Term Loan Agreement EBITDA (1) (unaudited) (in millions) For the year ended December 31, 2007 Pro forma loss from continuing operations(2) $ (95.8) Interest expense, net 216.3 Income taxes
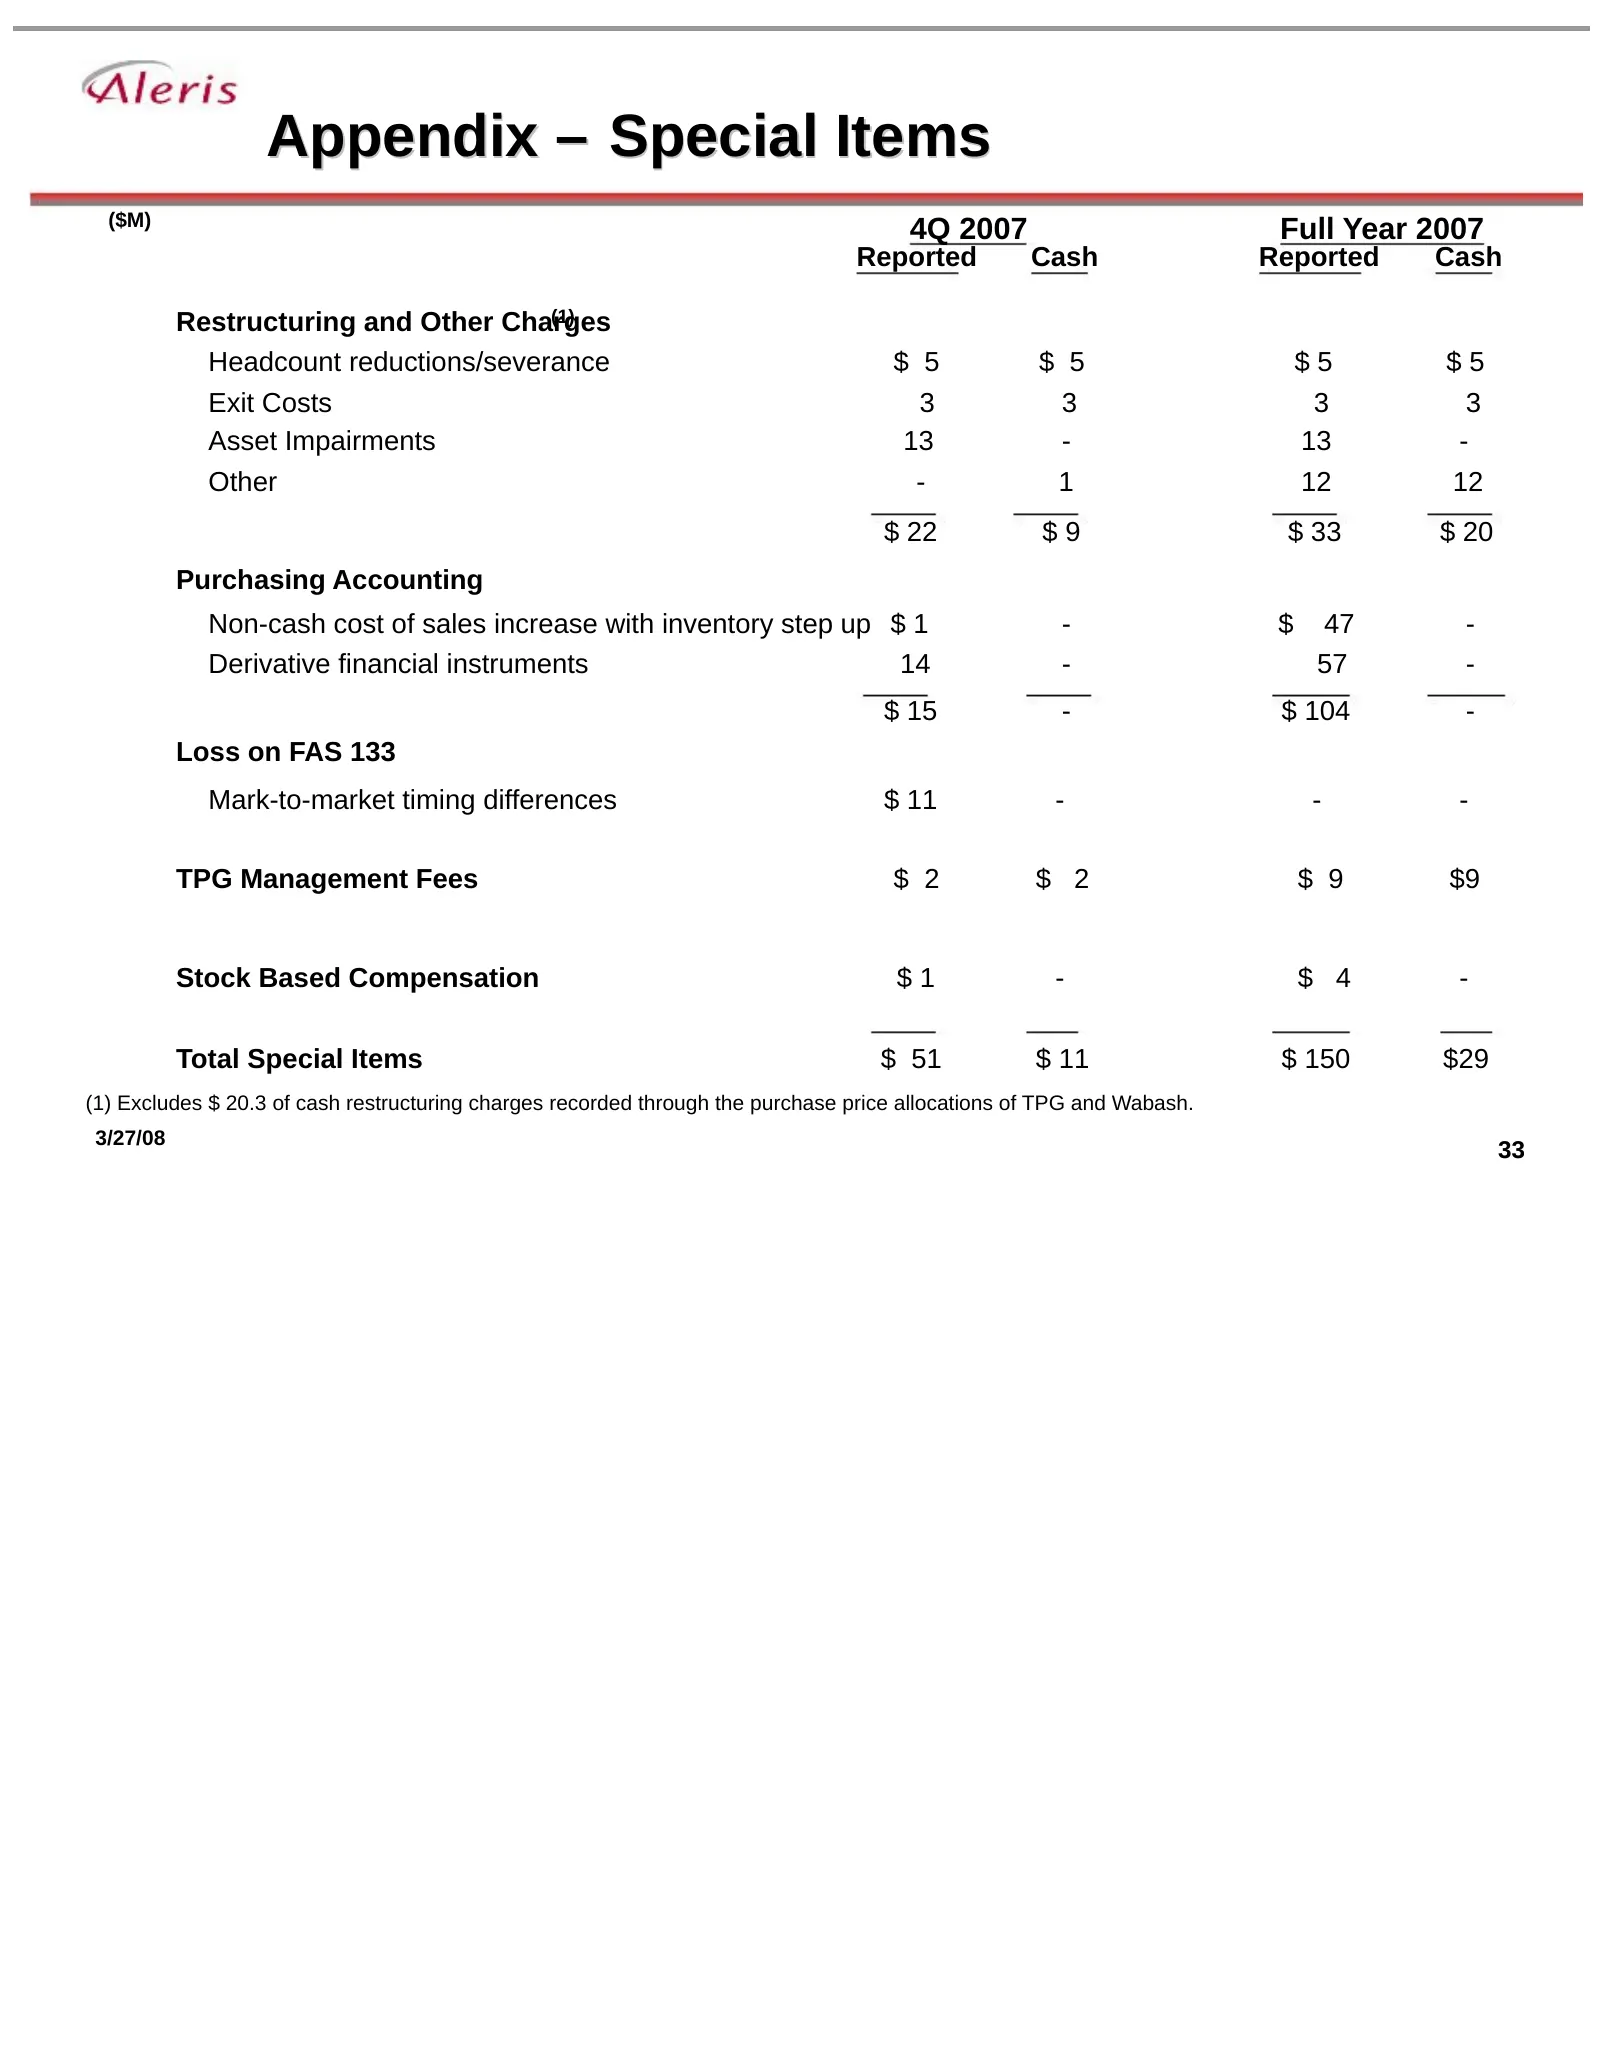
Slide 33: Appendix – Special Items
Appendix – Special Items ($M) 4Q 2007 Full Year 2007 Reported Cash Reported Cash (1) Restructuring and Other Charges Headcount reductions/severance $ 5 $ 5 $5 $5 Exit Costs 3 3 3 3 Asset Impairments 13 - 13 - Other - 1 12 12 $ 22 $9 $ 33 $ 20 Purchasing Accounting Non-cash cost of sales increase wit
Source: SEC EDGAR · 8-K/A filed Mar 31, 2008
More decks from Aleris International Inc
 2008 Bank of America Credit Conference26 slides · Nov 21, 2008
 Deutsche Bank Leverage Finance Conference 200828 slides · Sep 25, 2008
 FY2007 Earnings Presentation33 slides · Mar 27, 2008
 Bear Stearns Commodity and Capital Goods Conference November 200723 slides · Nov 28, 2007
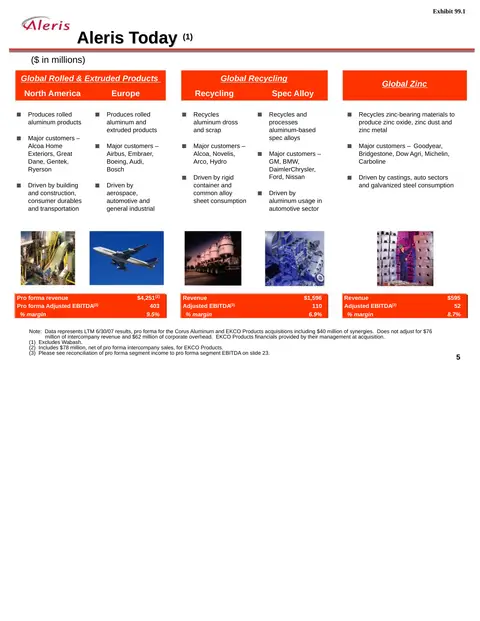 Investor Presentation (October 2007)14 slides · Oct 3, 2007
 Debt Investor Presentation (March 2007)6 slides · Mar 7, 2007