Aleris International — Deutsche Bank Leverage Finance Conference 2008
28 slides from Aleris International's conference presentation, Sep 25, 2008
Slide 1: Deutsche Bank Leverage Finance Conference
Exhibit 99.1 Deutsche Bank Leverage Finance Conference September 25, 2008
Slide 2: Safe Harbor
Safe Harbor Statements contained in this presentation that state the Company’s or its management’s expectations or predictions of the future are forward-looking statements intended to be covered by the safe harbor provisions of the Securities Act of 1933 and the Securities Exchange Act of 1934. Forw
Slide 3: Aleris Timeline
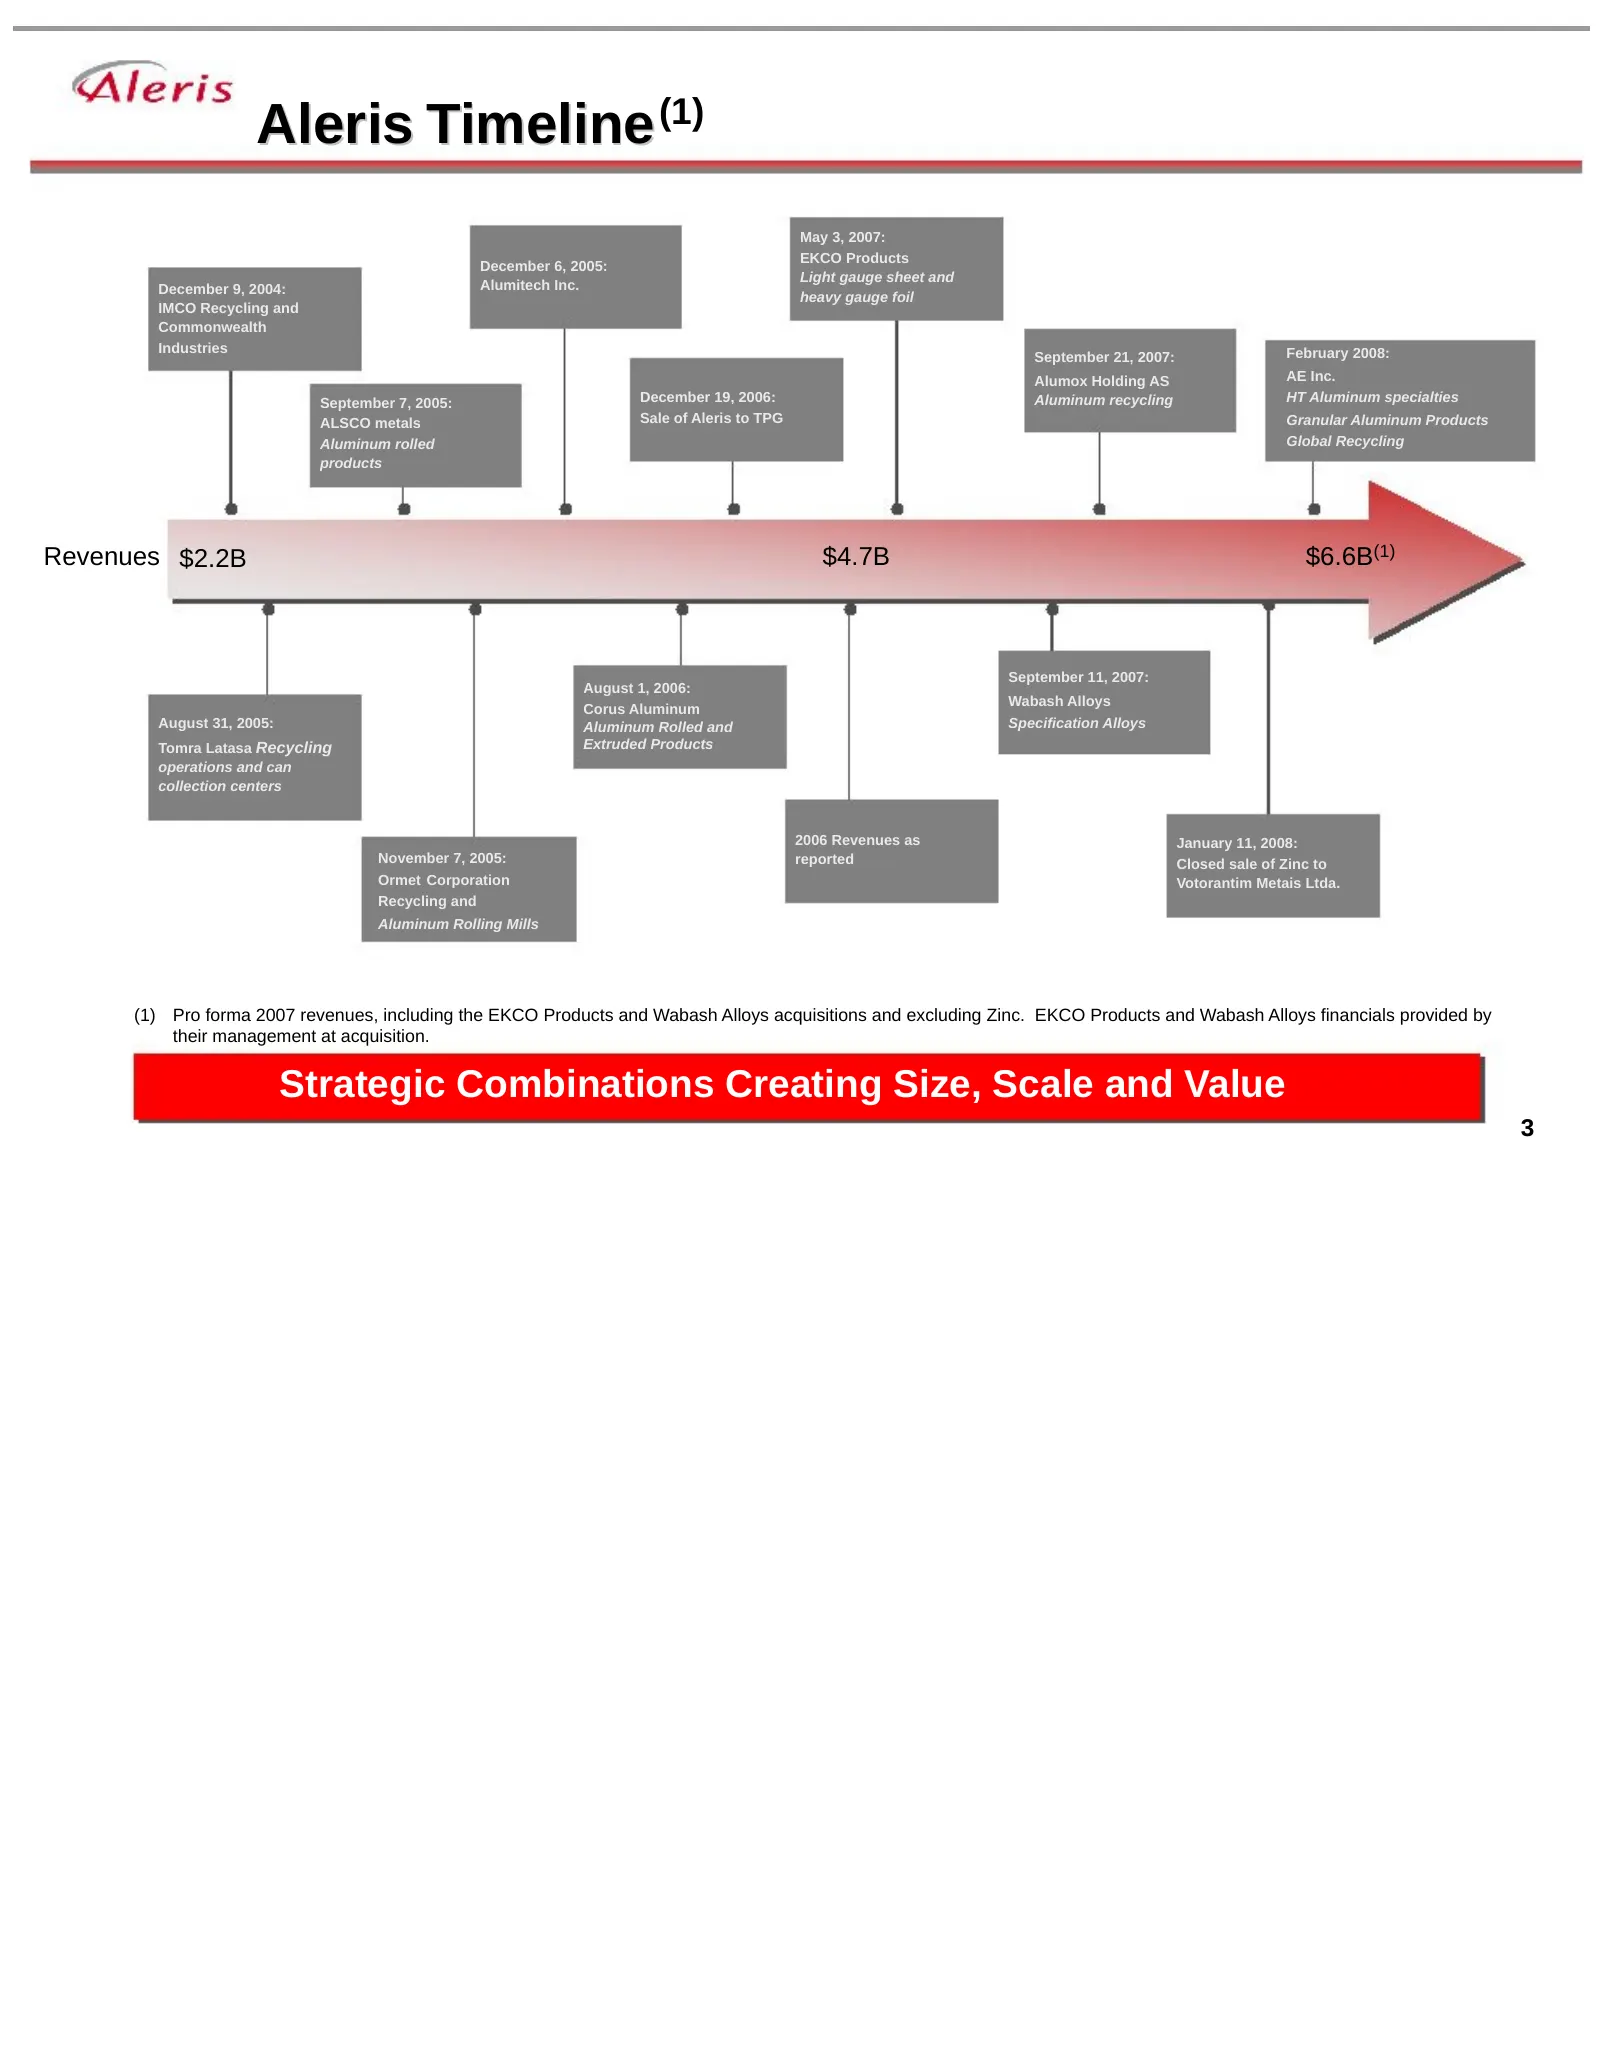
Aleris Timeline (1) May 3, 2007: EKCO Products December 6, 2005: Light gauge sheet and December 9, 2004: Alumitech Inc. heavy gauge foil IMCO Recycling and Commonwealth Industries February 2008: September 21, 2007: Alumox Holding AS AE Inc. September 7, 2005: December 19, 2006: Aluminum recycling HT
Slide 4: Pro Forma Aleris
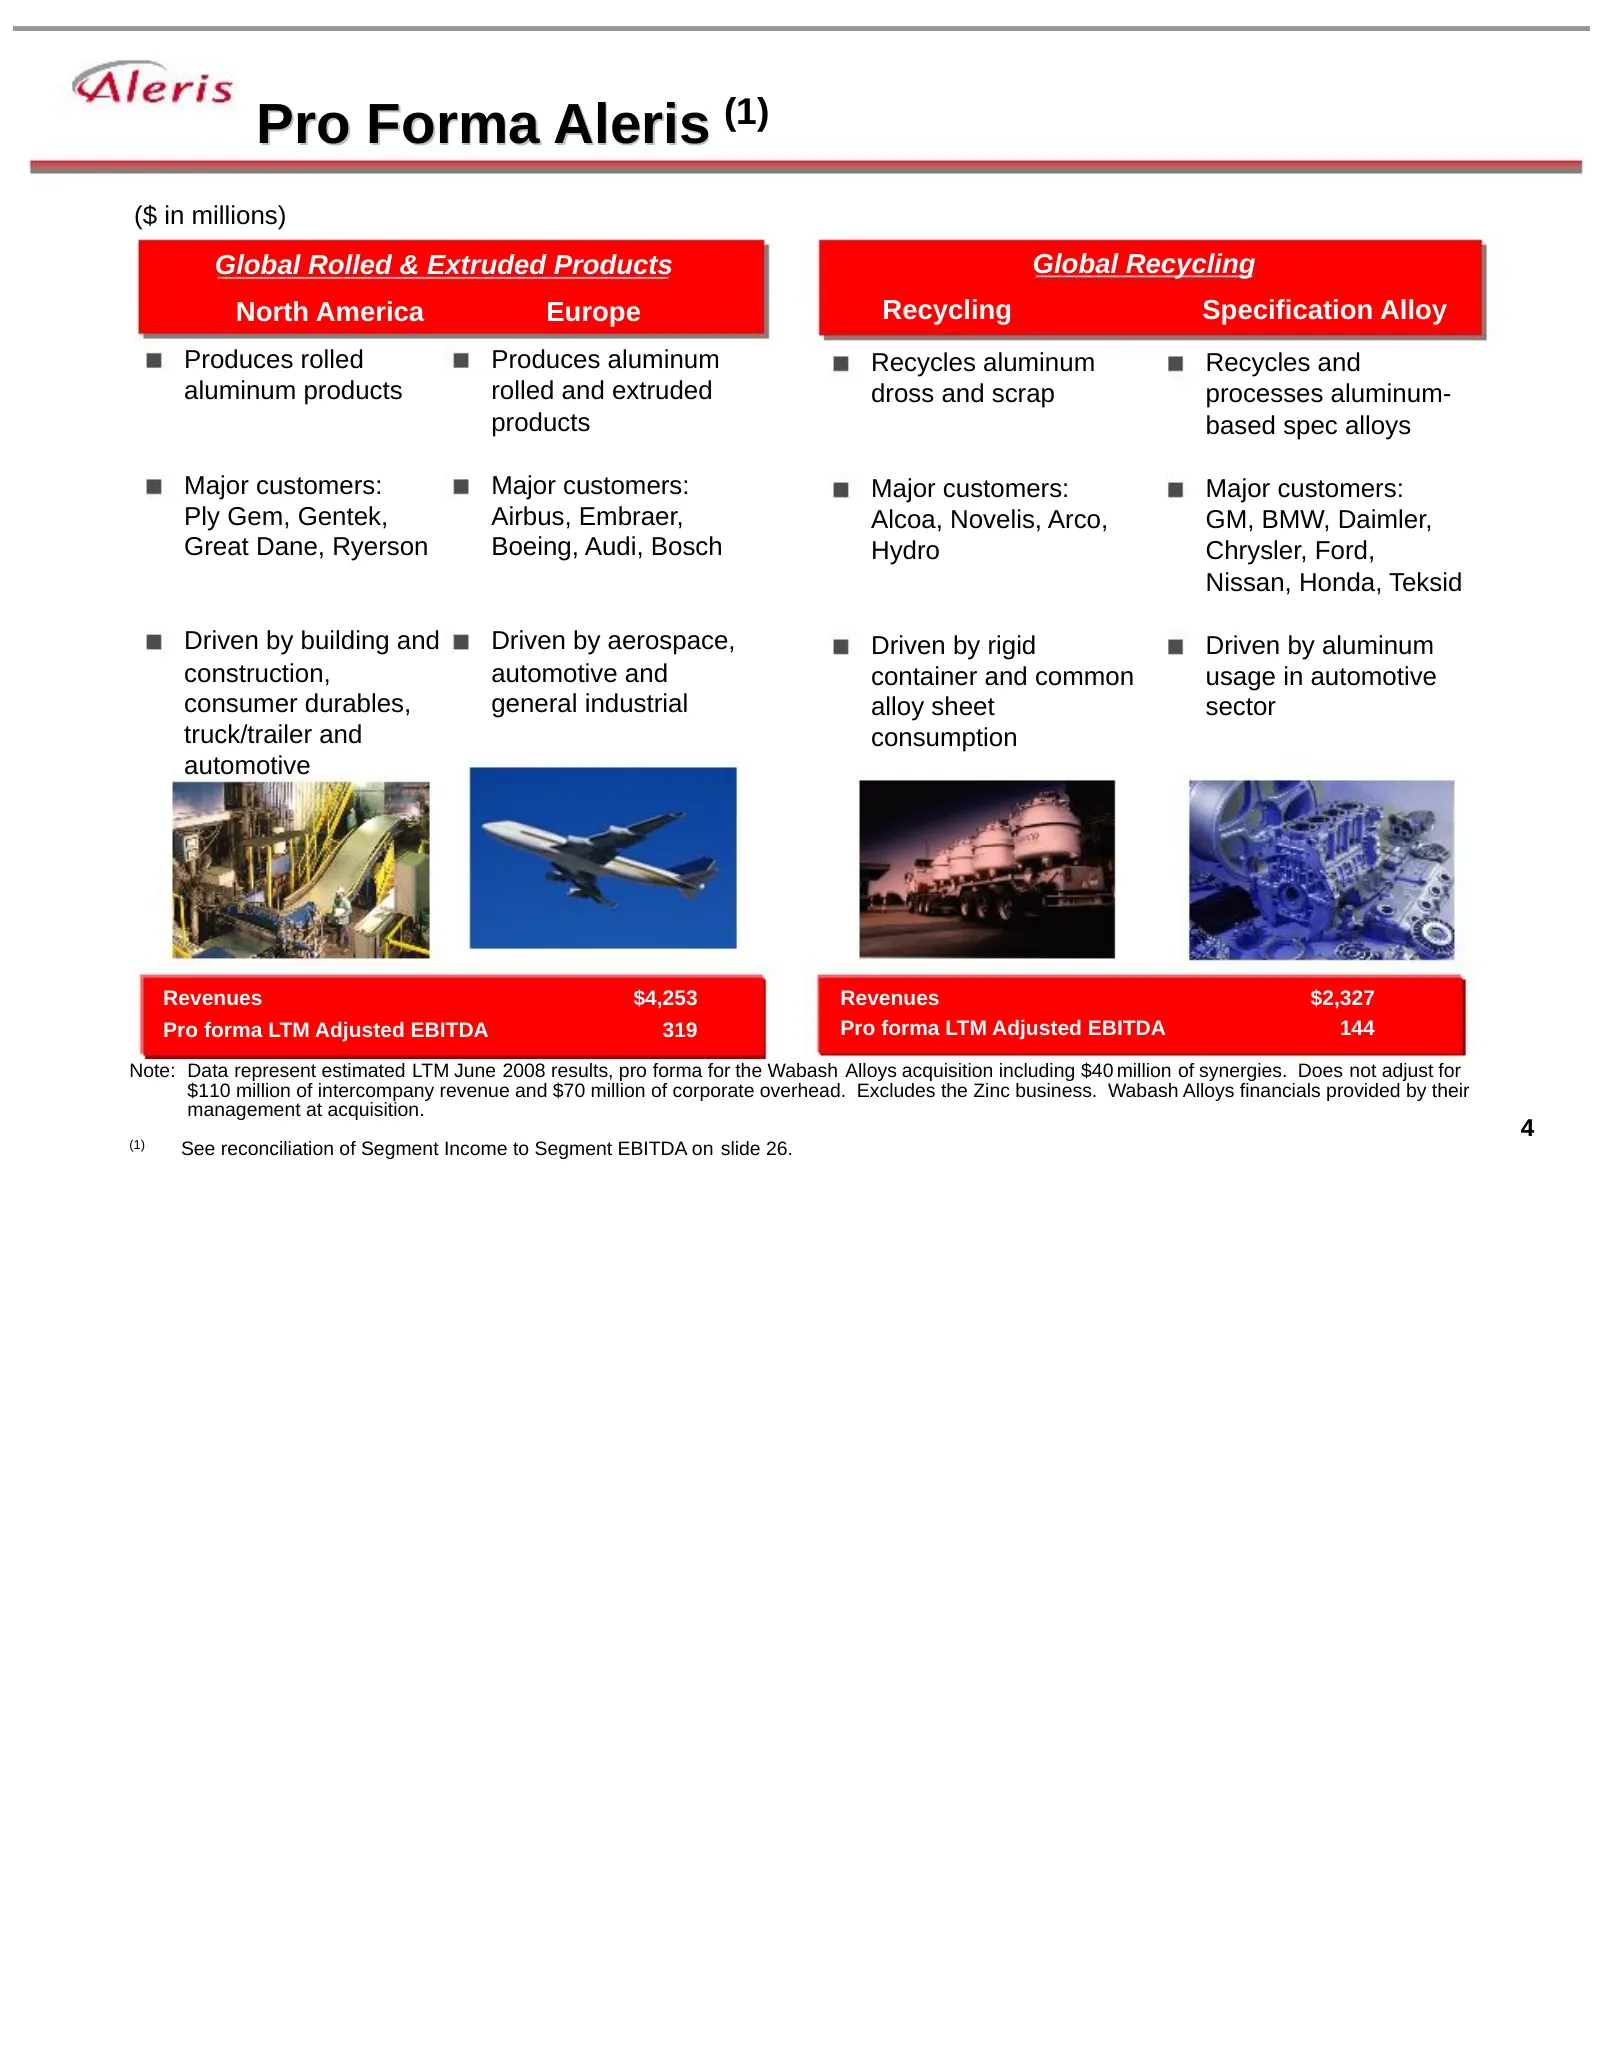
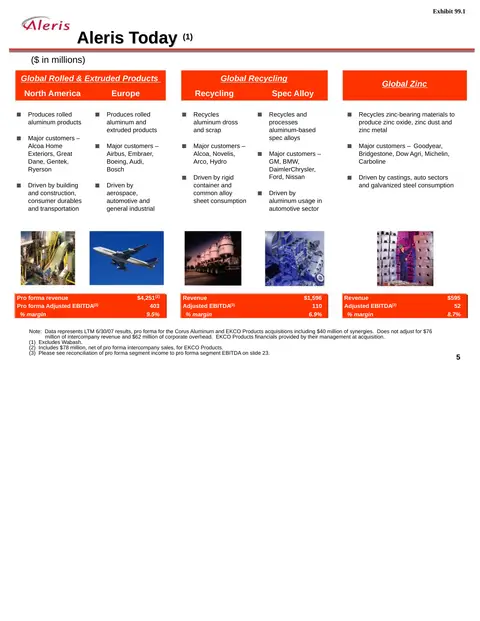
Pro Forma Aleris (1) ($ in millions) Global Rolled & Extruded Products Global Recycling North America Europe Recycling Specification Alloy Produces rolled Produces aluminum Recycles aluminum Recycles and aluminum products rolled and extruded dross and scrap processes aluminum- products based spec al
Slide 5: Geographic and End-Use Diversification
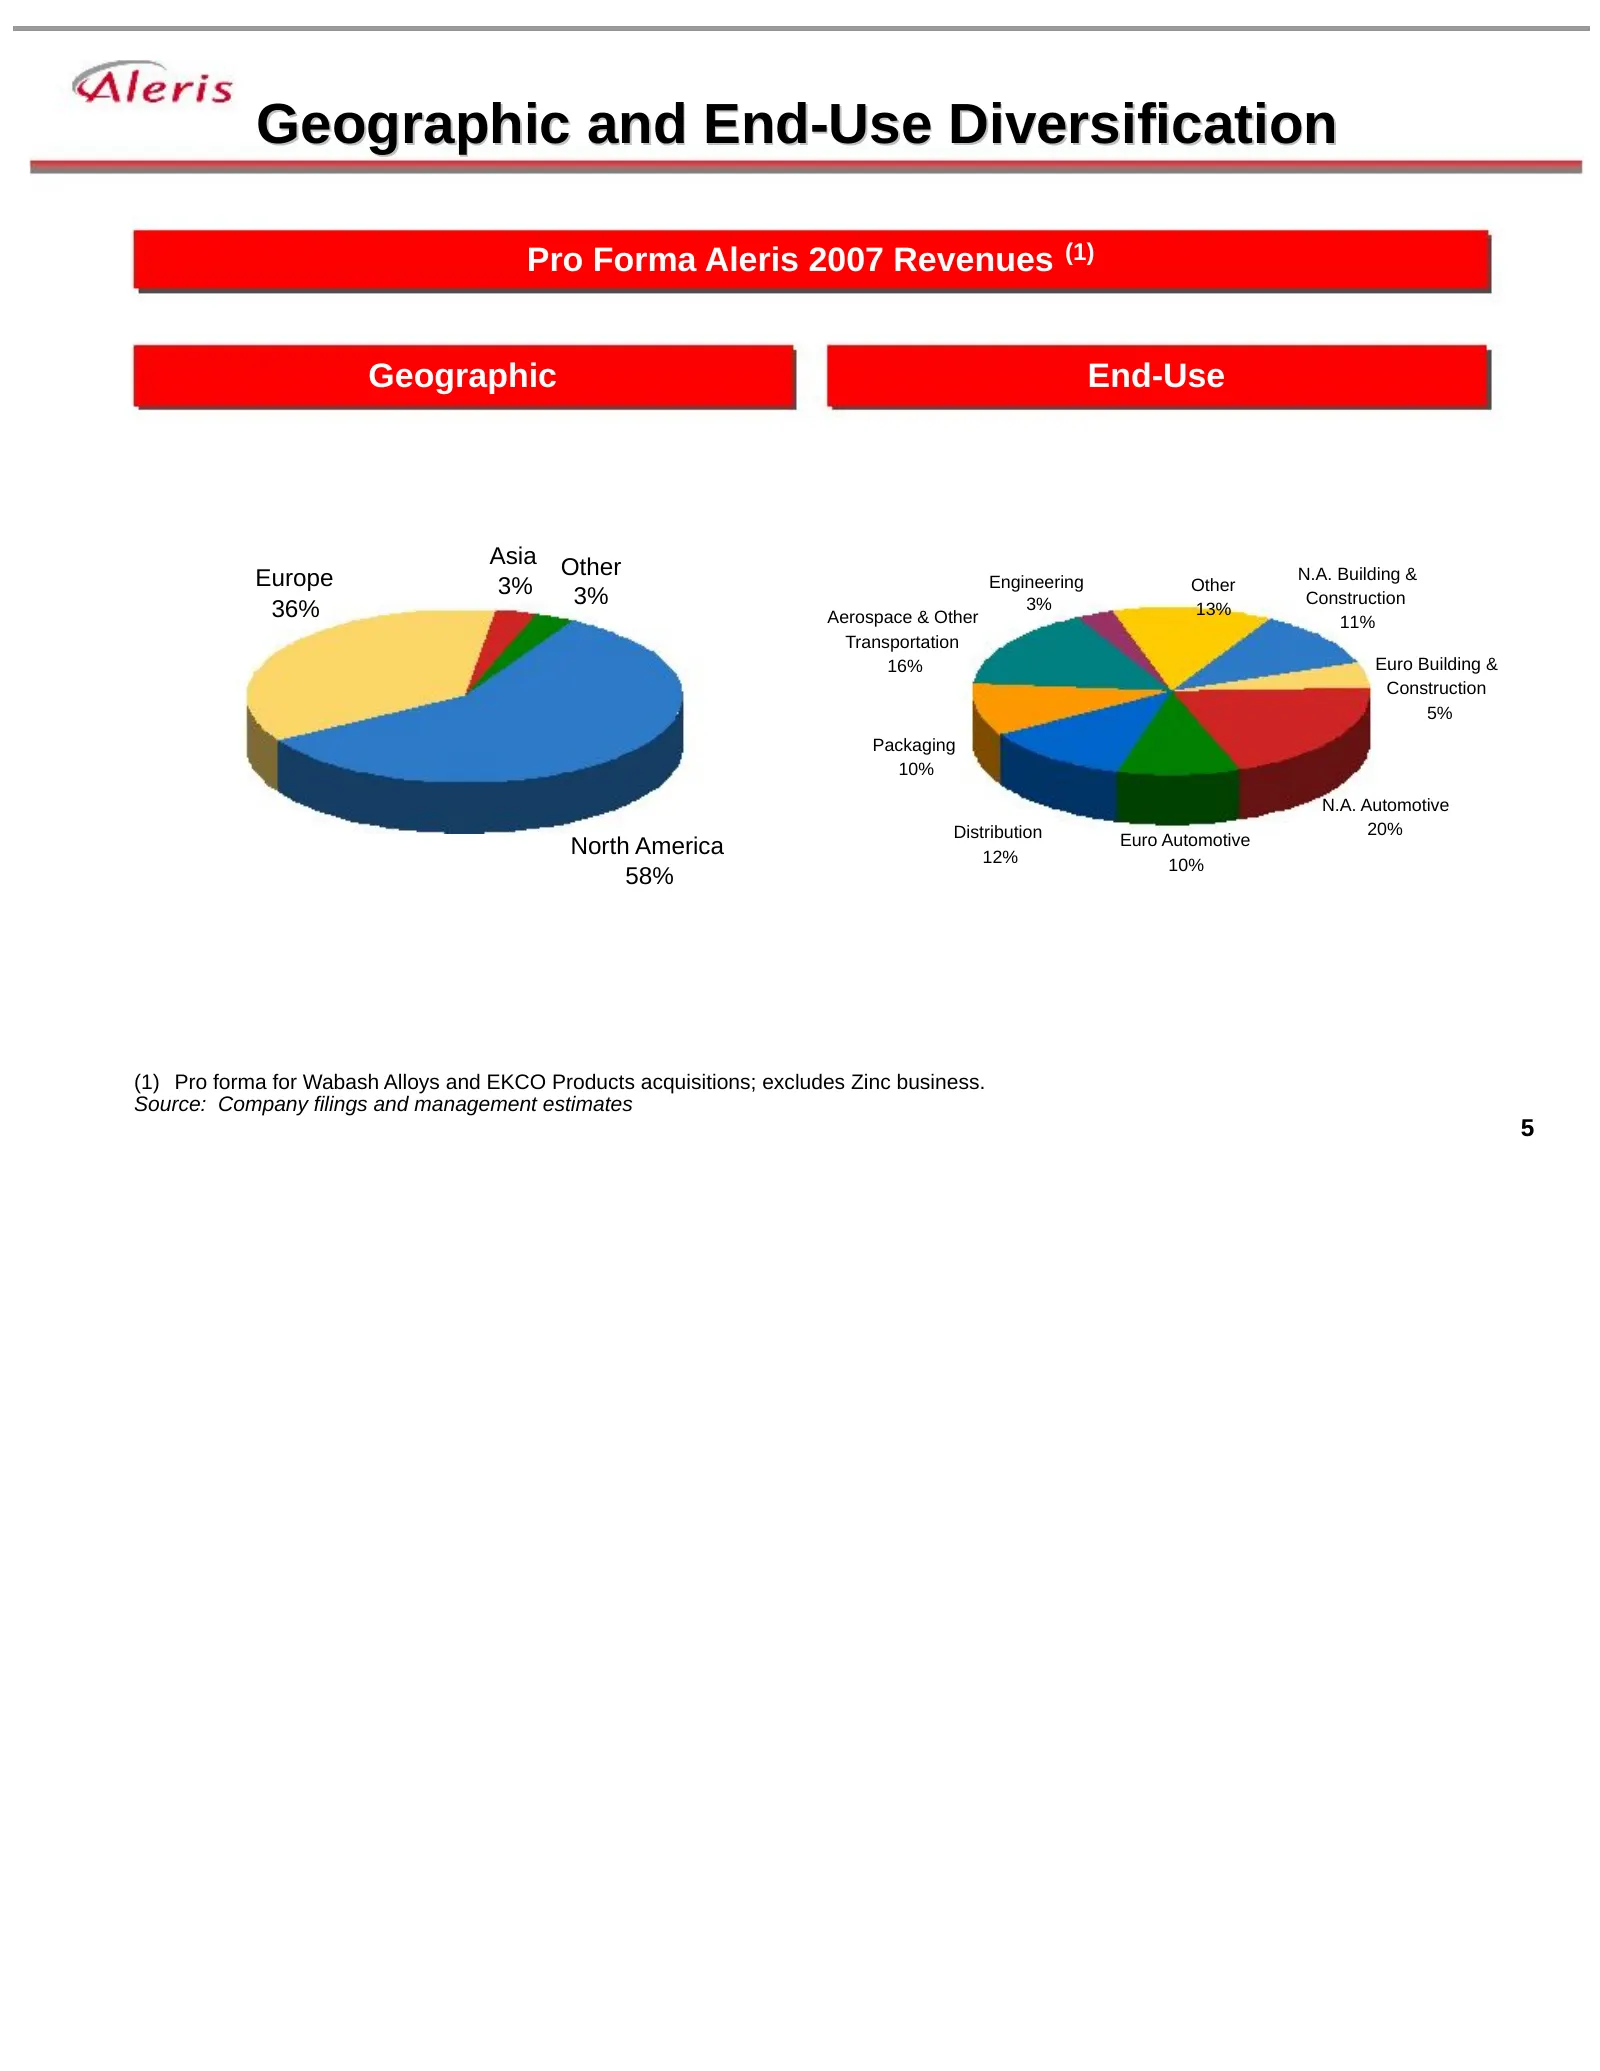
Geographic and End-Use Diversification Pro Forma Aleris 2007 Revenues (1) Geographic End-Use Asia Other Europe Engineering N.A. Building & 3% 3% Other Construction 36% 3% 13% Aerospace & Other 11% Transportation 16% Euro Building & Construction 5% Packaging 10% N.A. Automotive Distribution 20% North
Slide 6: North American Industry Indicators
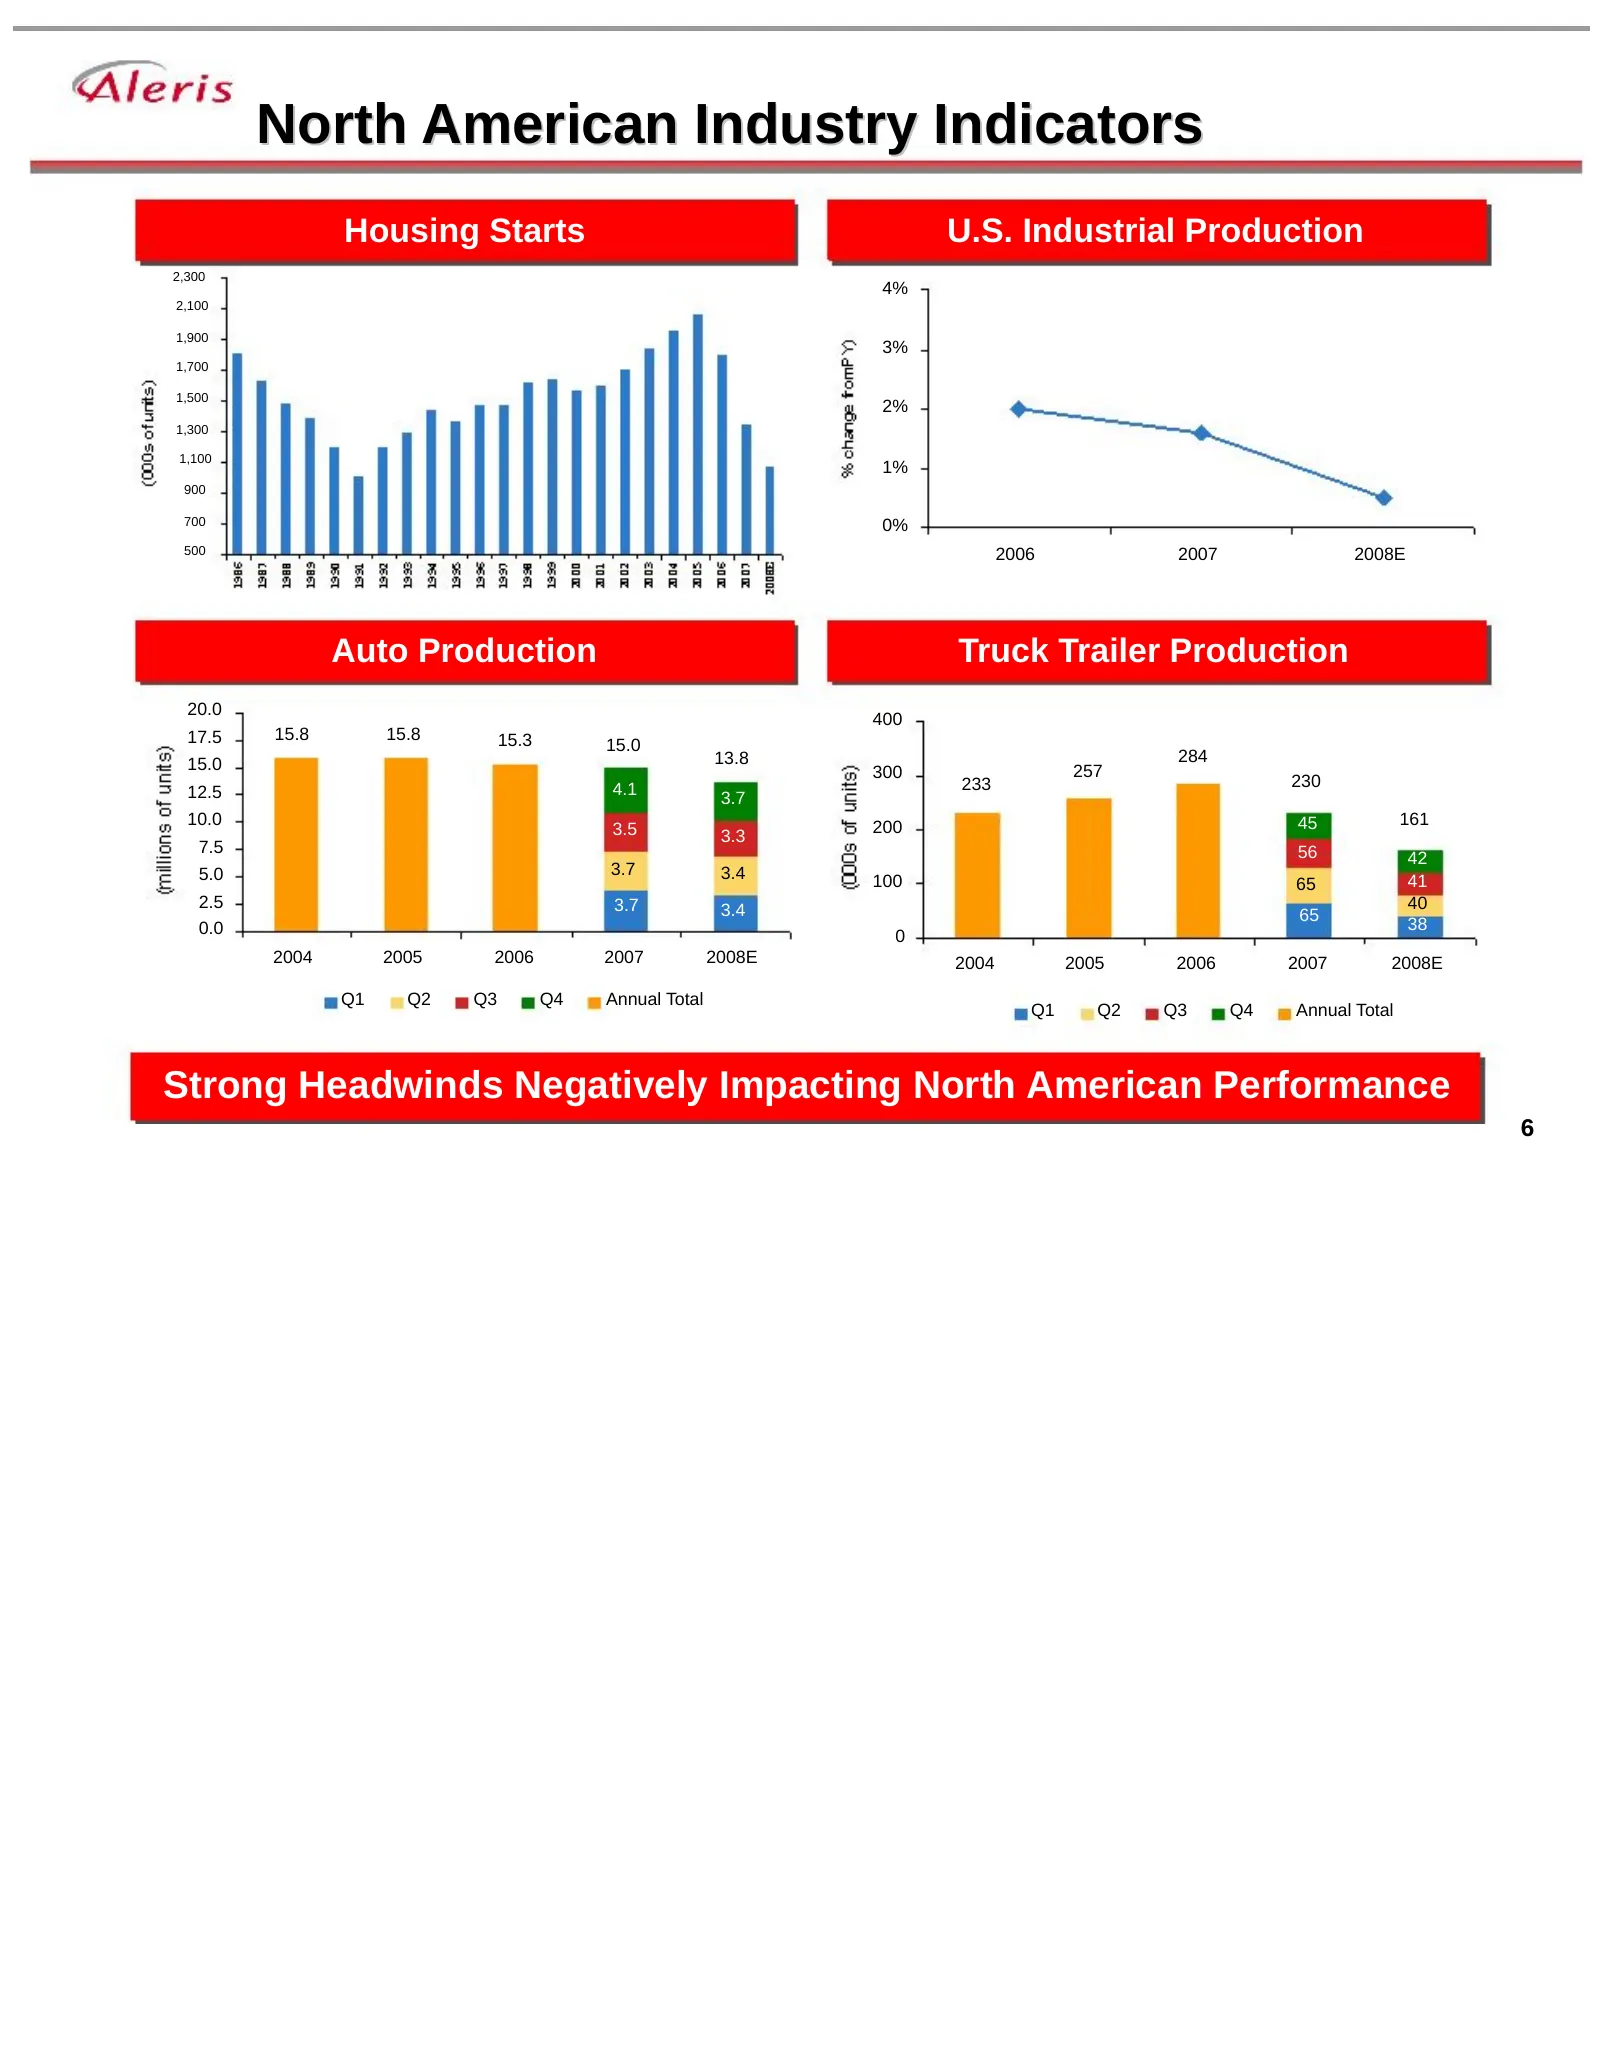
North American Industry Indicators Housing Starts U.S. Industrial Production 2,300 4% 2,100 1,900 3% 1,700 1,500 2% 1,300 1,100 1% 900 700 0% 500 2006 2007 2008E Auto Production Truck Trailer Production 20.0 400 17.5 15.8 15.8 15.3 15.0 15.0 13.8 284 300 257 4.1 233 230 12.5 3.7 10.0 200 45 161 3.5
Slide 7: European Industry Indicators
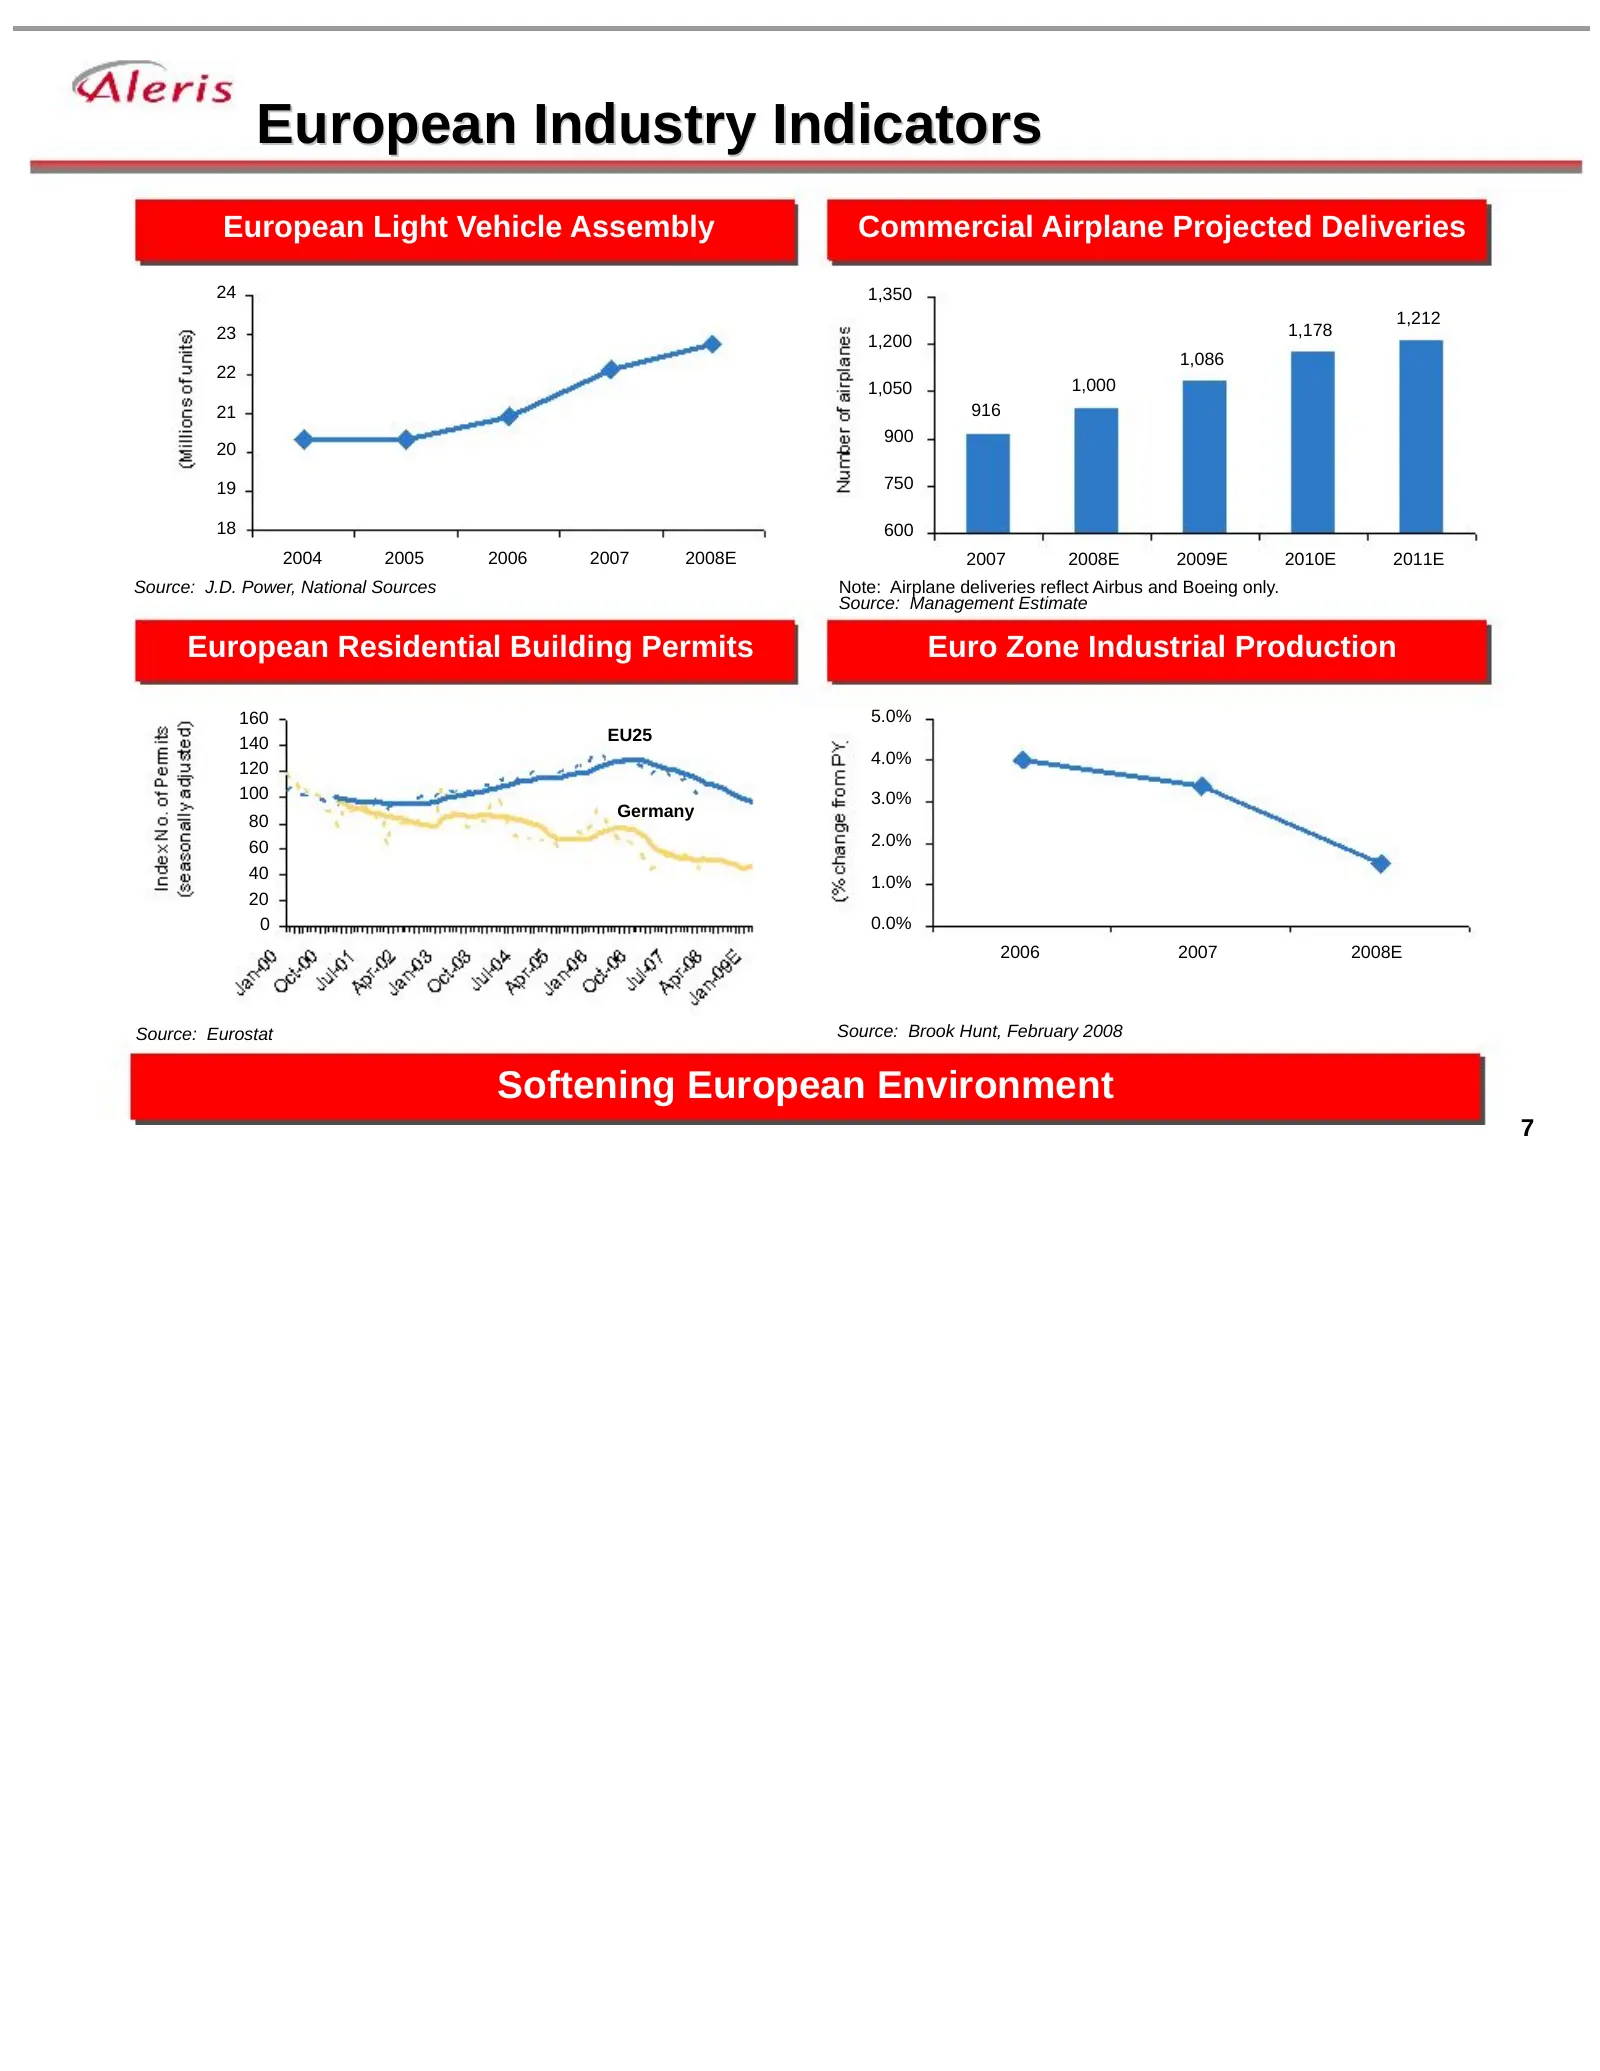
European Industry Indicators European Light Vehicle Assembly Commercial Airplane Projected Deliveries 24 1,350 1,212 23 1,178 1,200 1,086 22 1,050 1,000 21 916 900 20 19 750 18 600 2004 2005 2006 2007 2008E 2007 2008E 2009E 2010E 2011E Source: J.D. Power, National Sources Note: Airplane deliveries r
Slide 8: North American Rolled Products
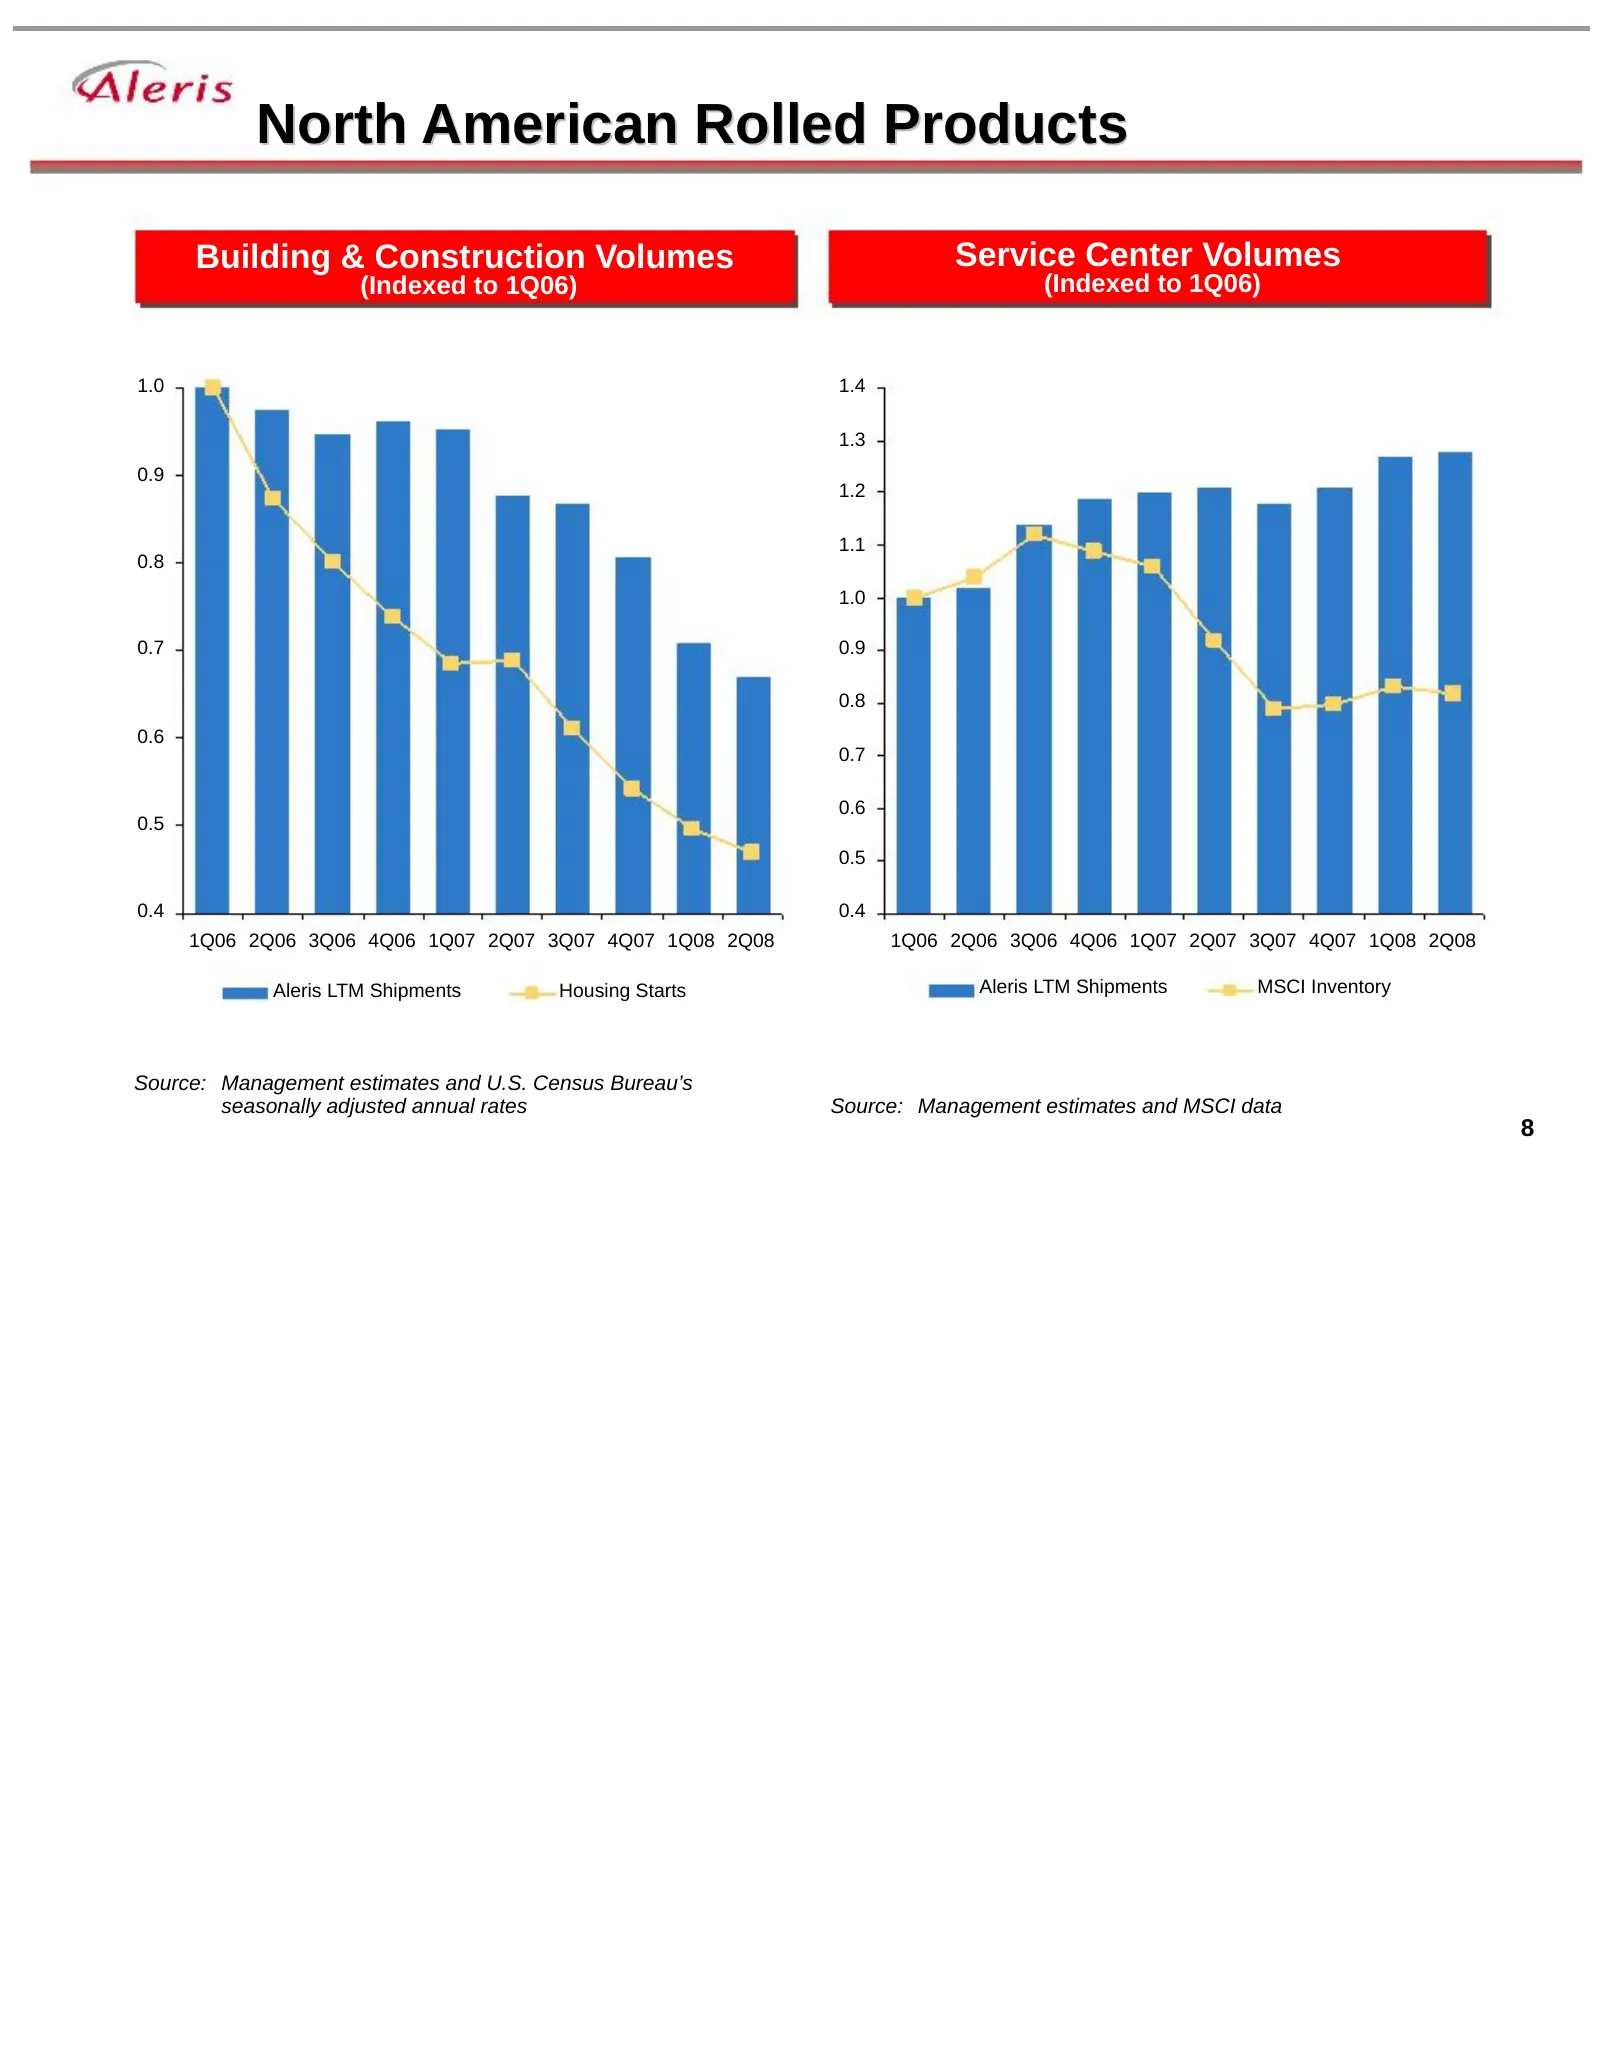
North American Rolled Products Building & Construction Volumes Service Center Volumes (Indexed to 1Q06) (Indexed to 1Q06) 1.0 1.4 1.3 0.9 1.2 1.1 0.8 1.0 0.7 0.9 0.8 0.6 0.7 0.6 0.5 0.5 0.4 0.4 1Q06 2Q06 3Q06 4Q06 1Q07 2Q07 3Q07 4Q07 1Q08 2Q08 1Q06 2Q06 3Q06 4Q06 1Q07 2Q07 3Q07 4Q07 1Q08 2Q08 Aleris
Slide 9: N.A. Rolled Products Volumes and Material Margins
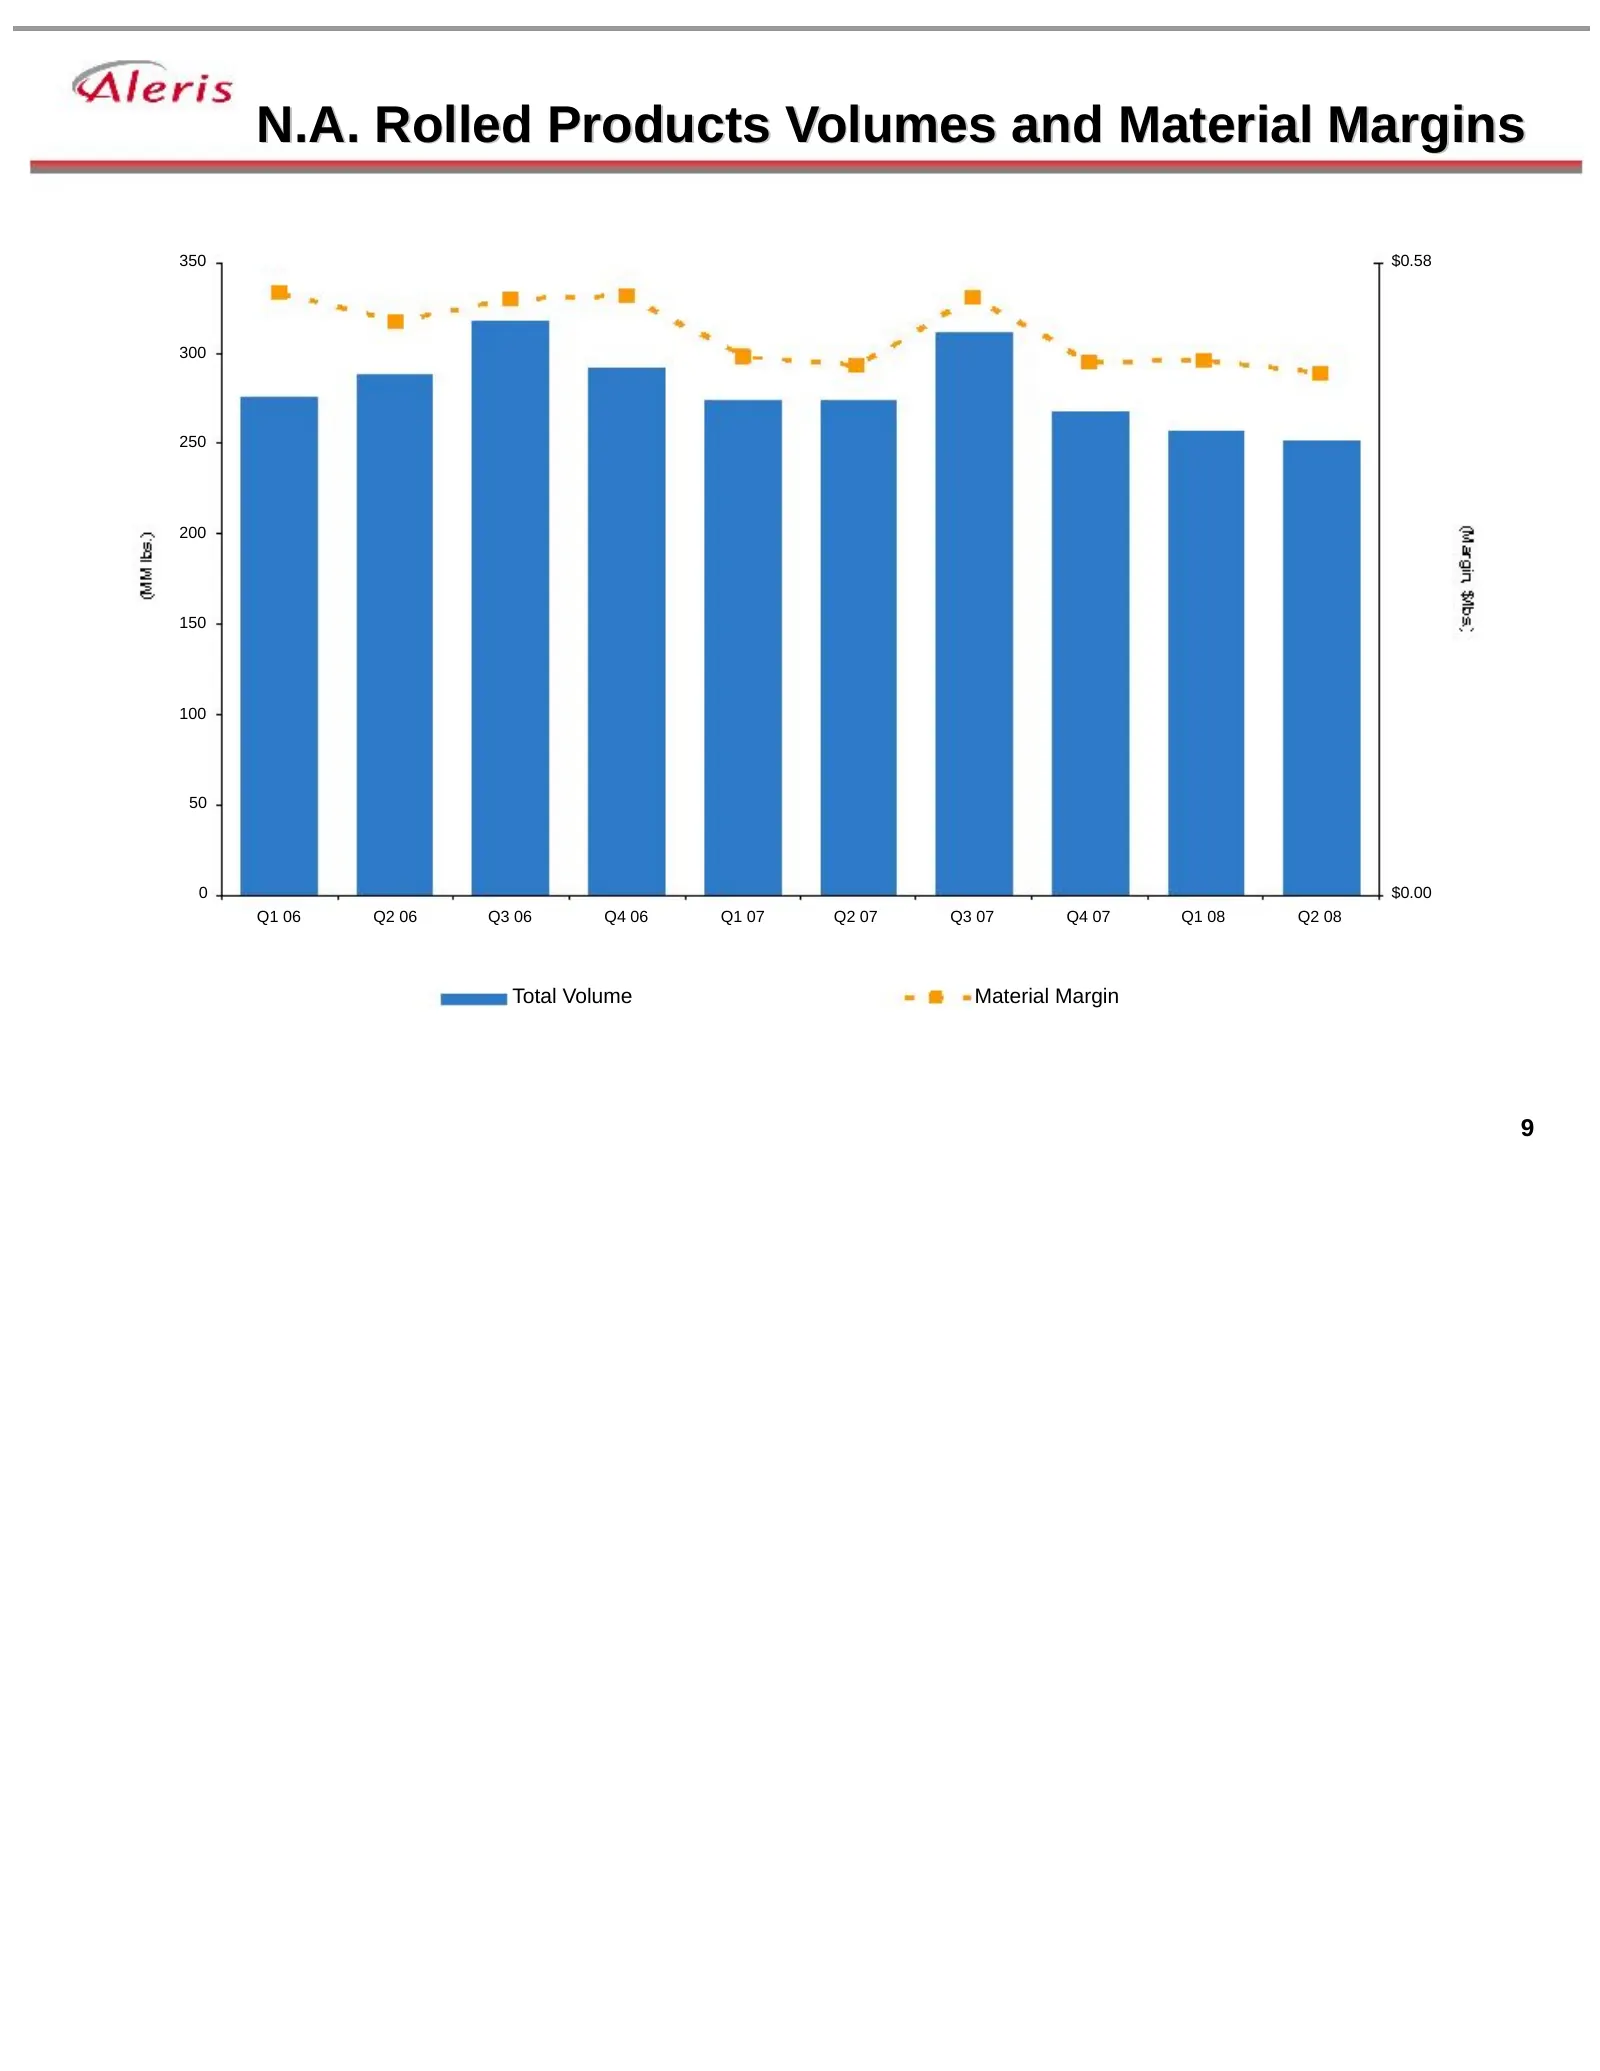
N.A. Rolled Products Volumes and Material Margins 350 $0.58 300 250 200 150 100 50 0 $0.00 Q1 06 Q2 06 Q3 06 Q4 06 Q1 07 Q2 07 Q3 07 Q4 07 Q1 08 Q2 08 Total Volume Material Margin 9
Slide 10: Commodity Inflation
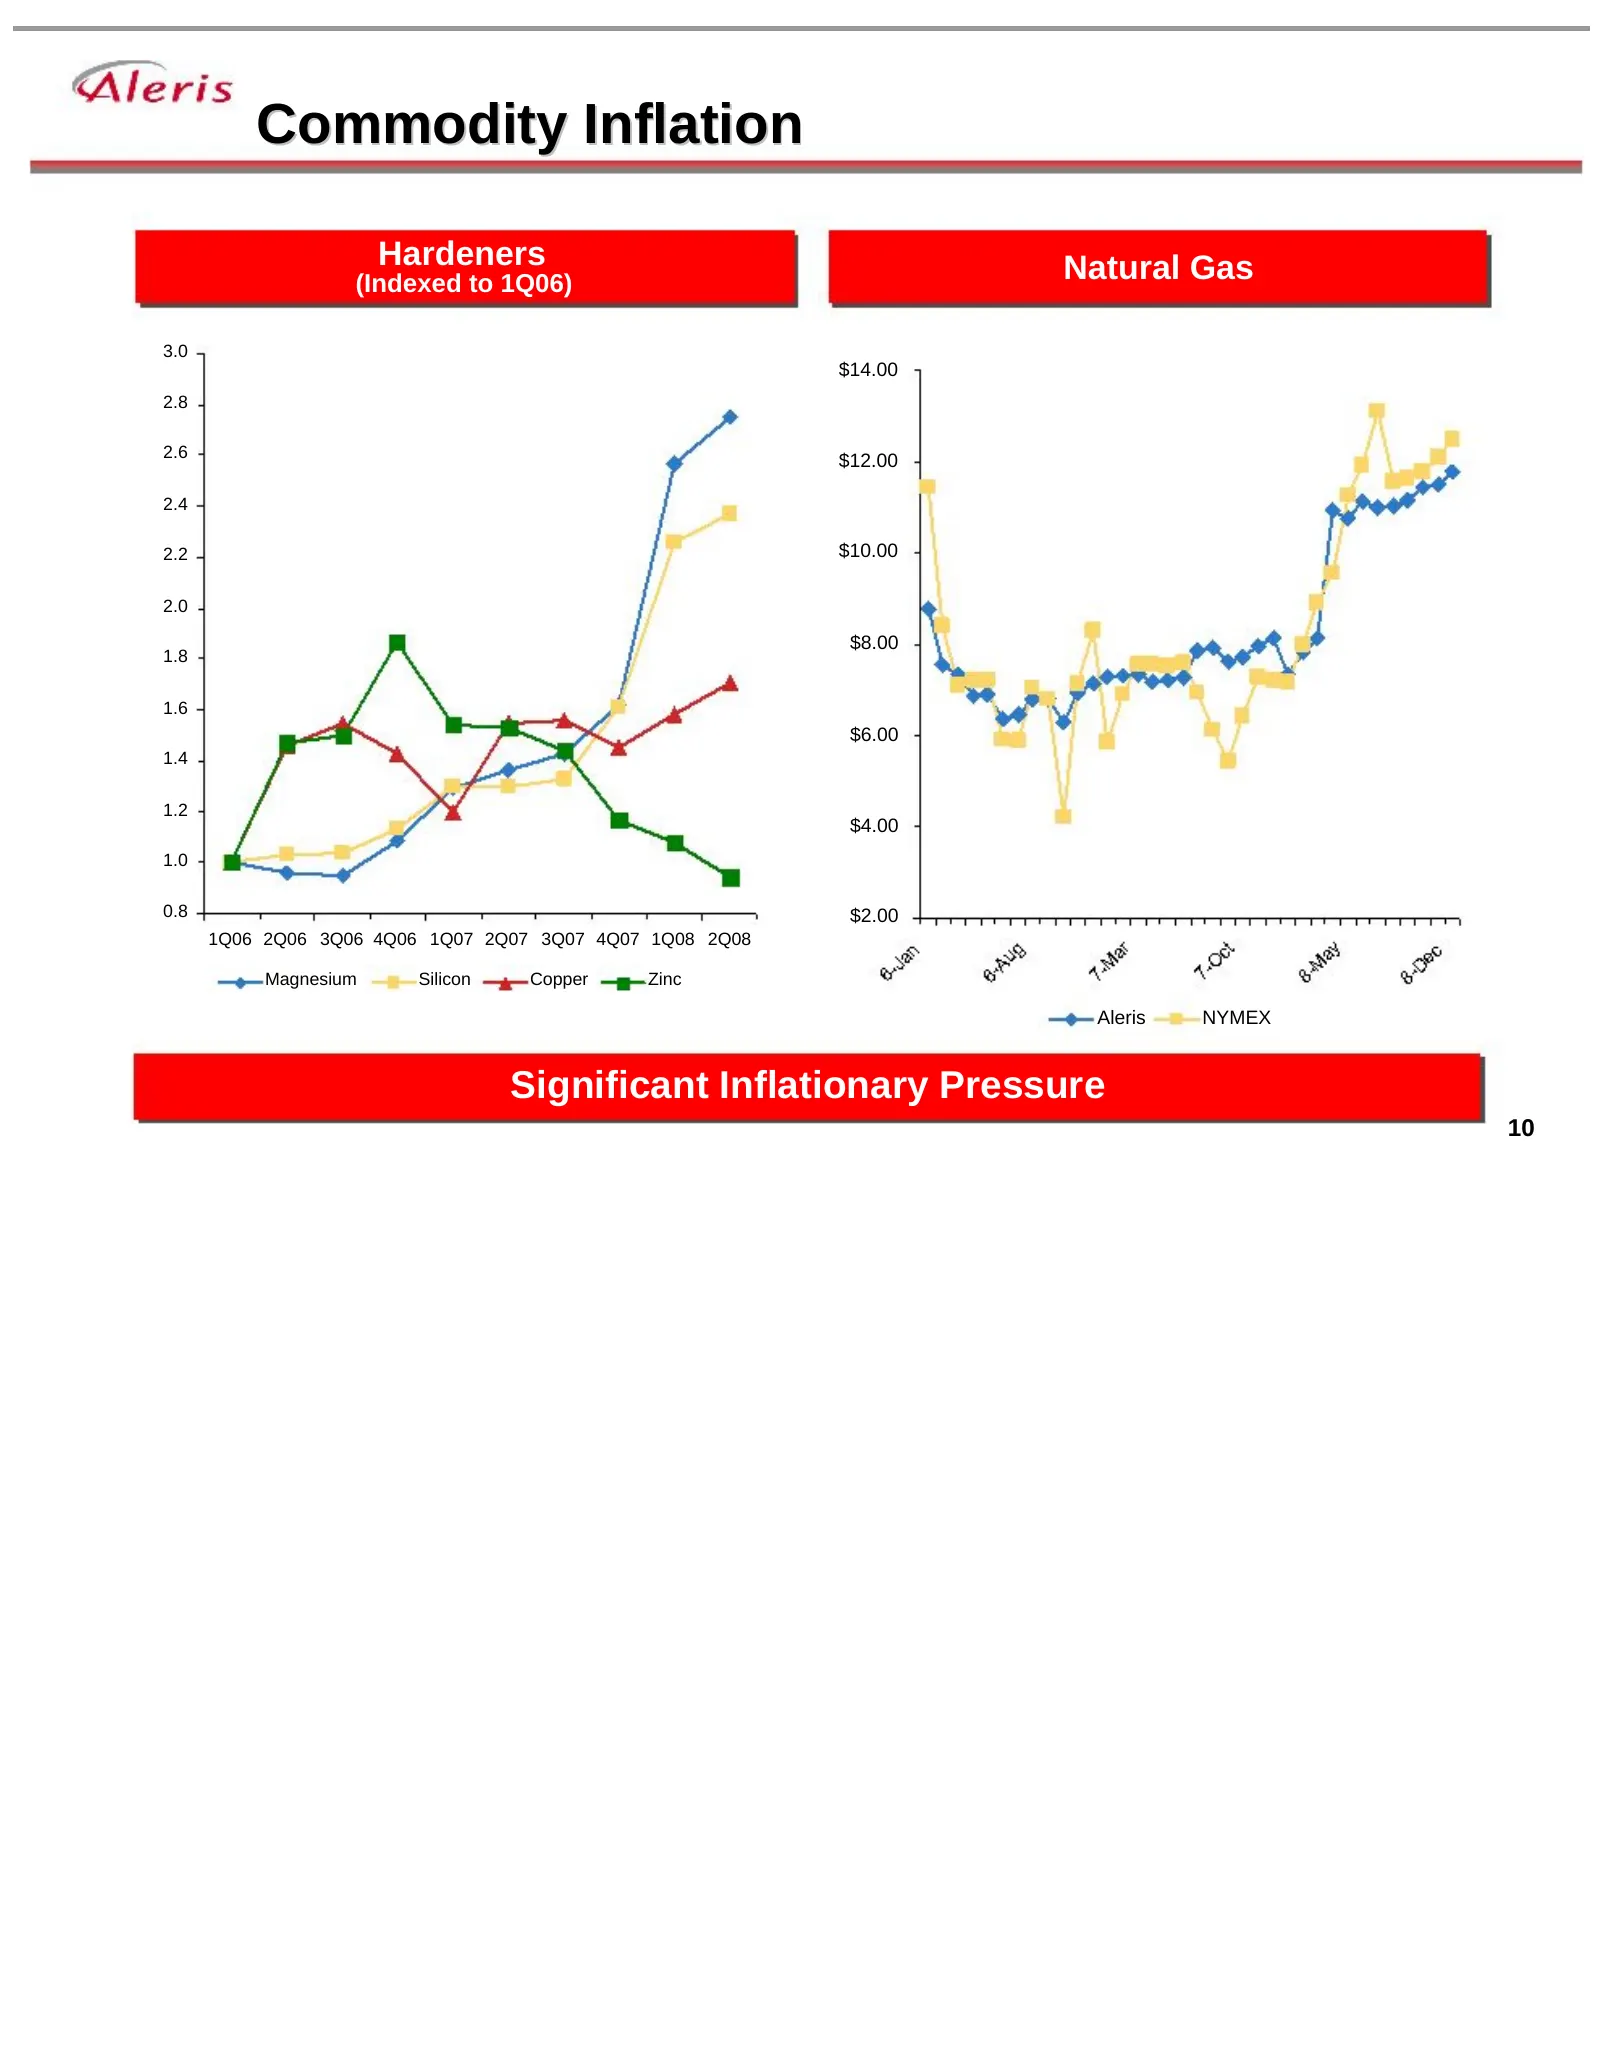
Commodity Inflation Hardeners Natural Gas (Indexed to 1Q06) 3.0 $14.00 2.8 2.6 $12.00 2.4 2.2 $10.00 2.0 $8.00 1.8 1.6 $6.00 1.4 1.2 $4.00 1.0 0.8 $2.00 1Q06 2Q06 3Q06 4Q06 1Q07 2Q07 3Q07 4Q07 1Q08 2Q08 Magnesium Silicon Copper Zinc Aleris NYMEX Significant Inflationary Pressure 10
Slide 11: Pricing Actions Completed
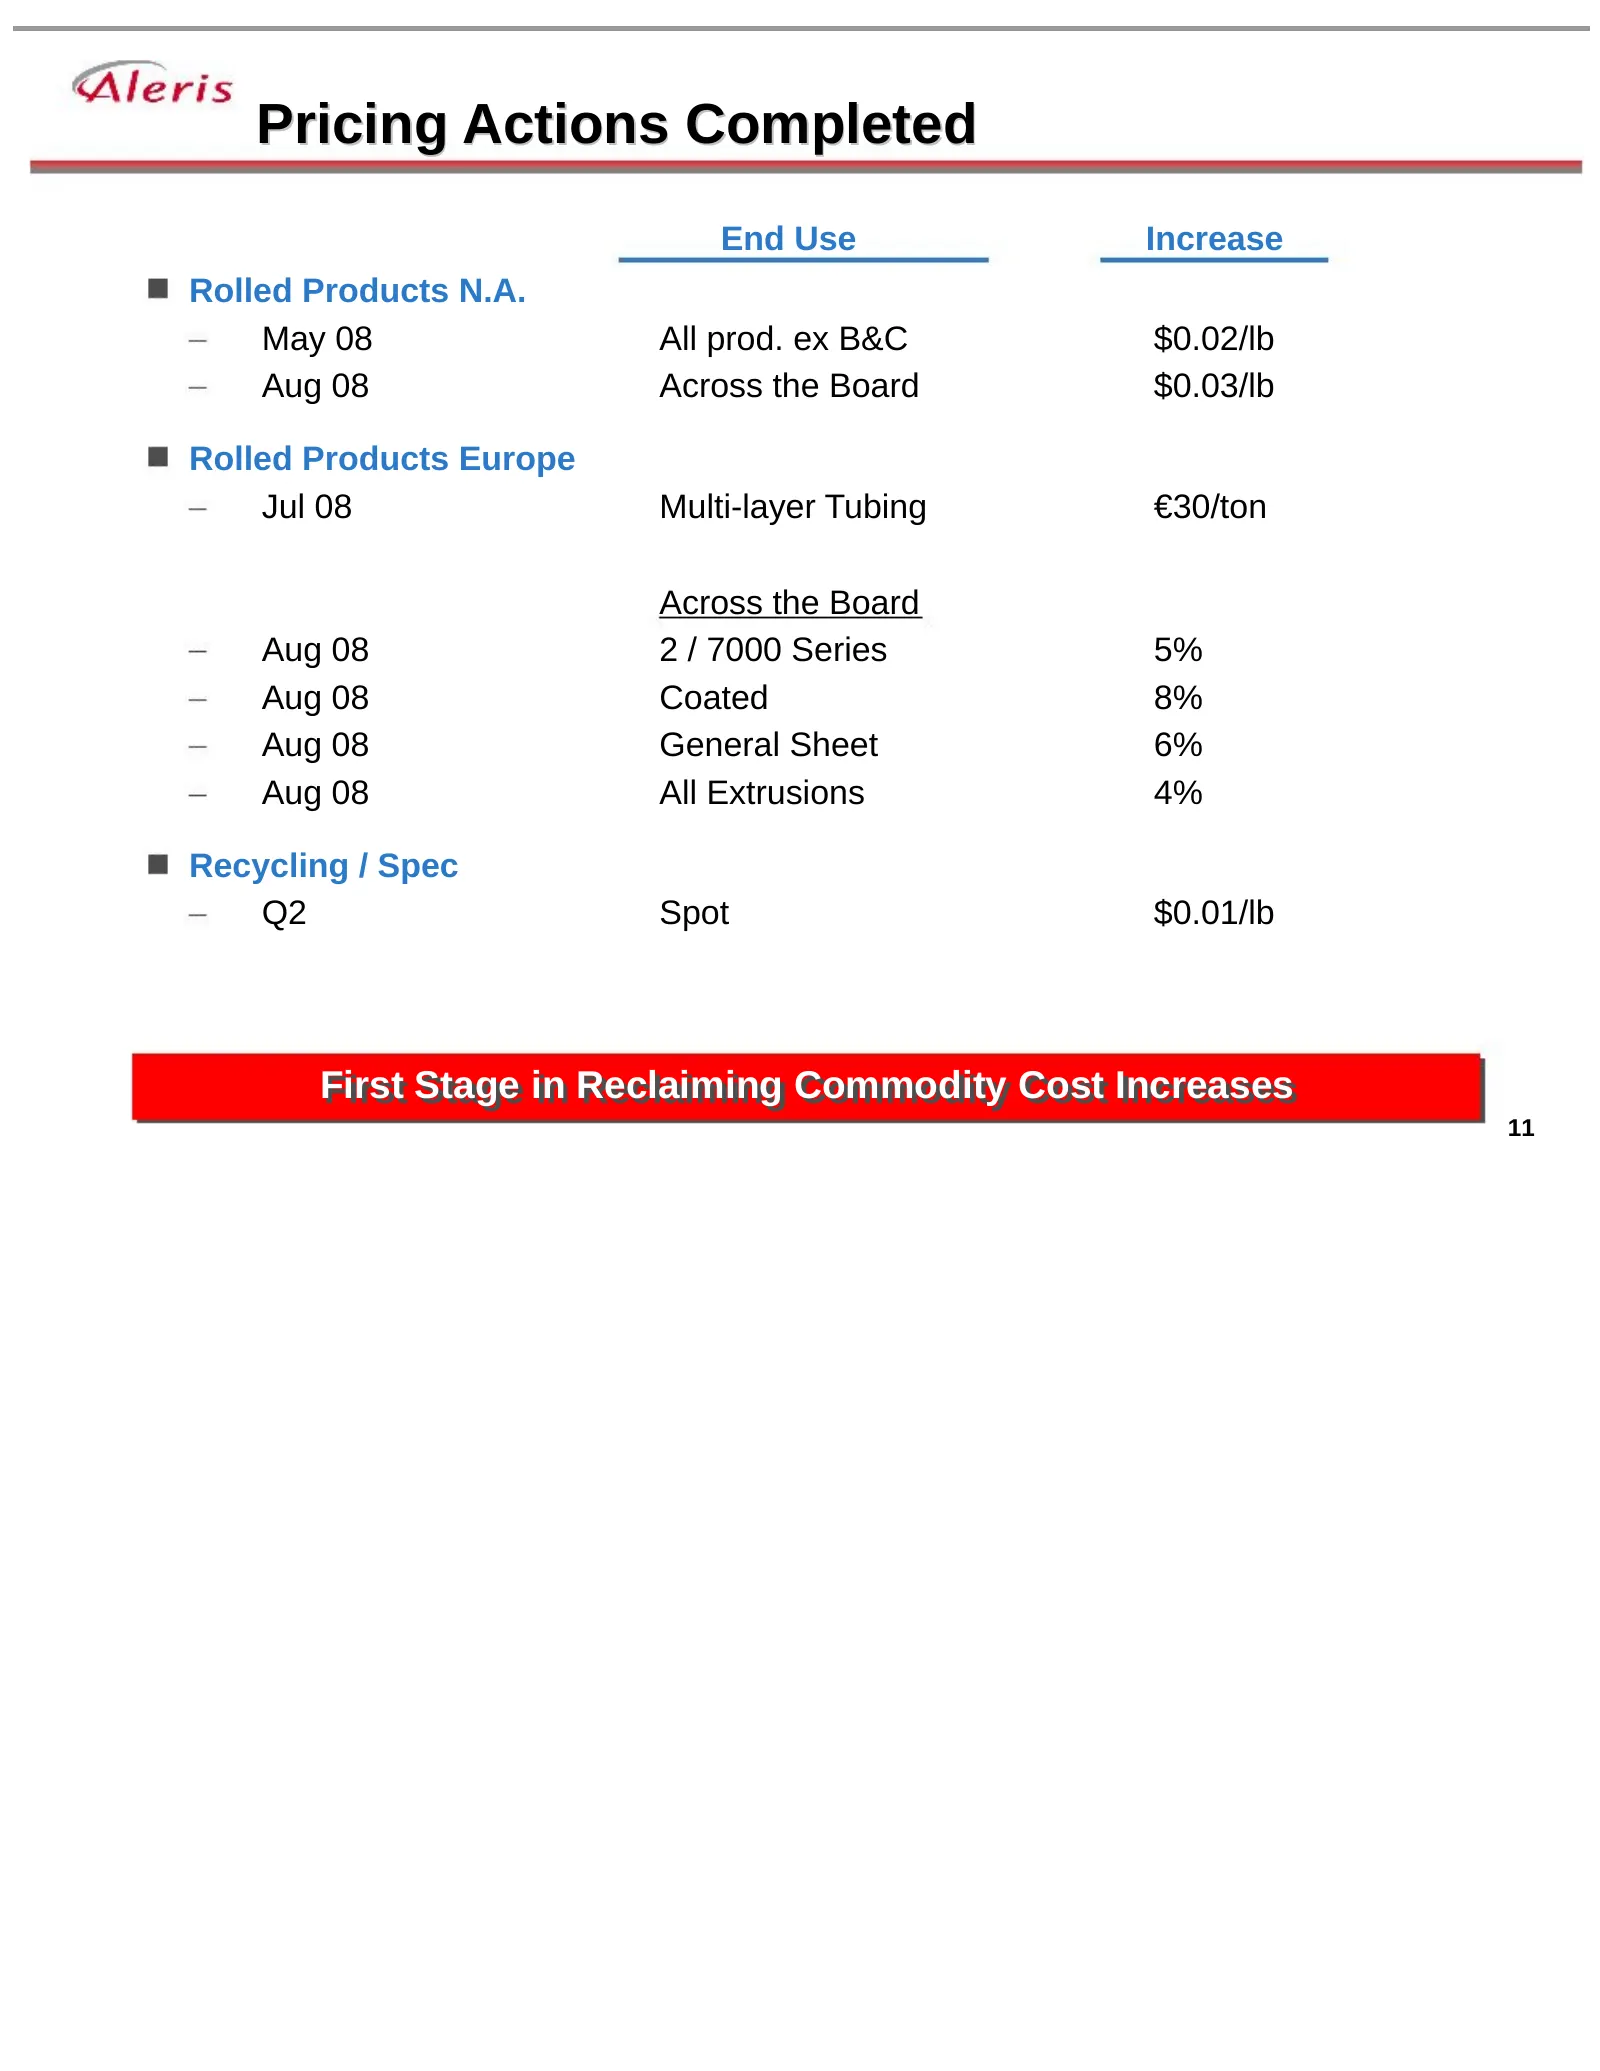
Pricing Actions Completed End Use Increase Rolled Products N.A. May 08 All prod. ex B&C $0.02/lb Aug 08 Across the Board $0.03/lb Rolled Products Europe Jul 08 Multi-layer Tubing €30/ton Across the Board Aug 08 2 / 7000 Series 5% Aug 08 Coated 8% Aug 08 General Sheet 6% Aug 08 All Extrusions 4% Recy
Slide 12: 2008 Key Initiatives
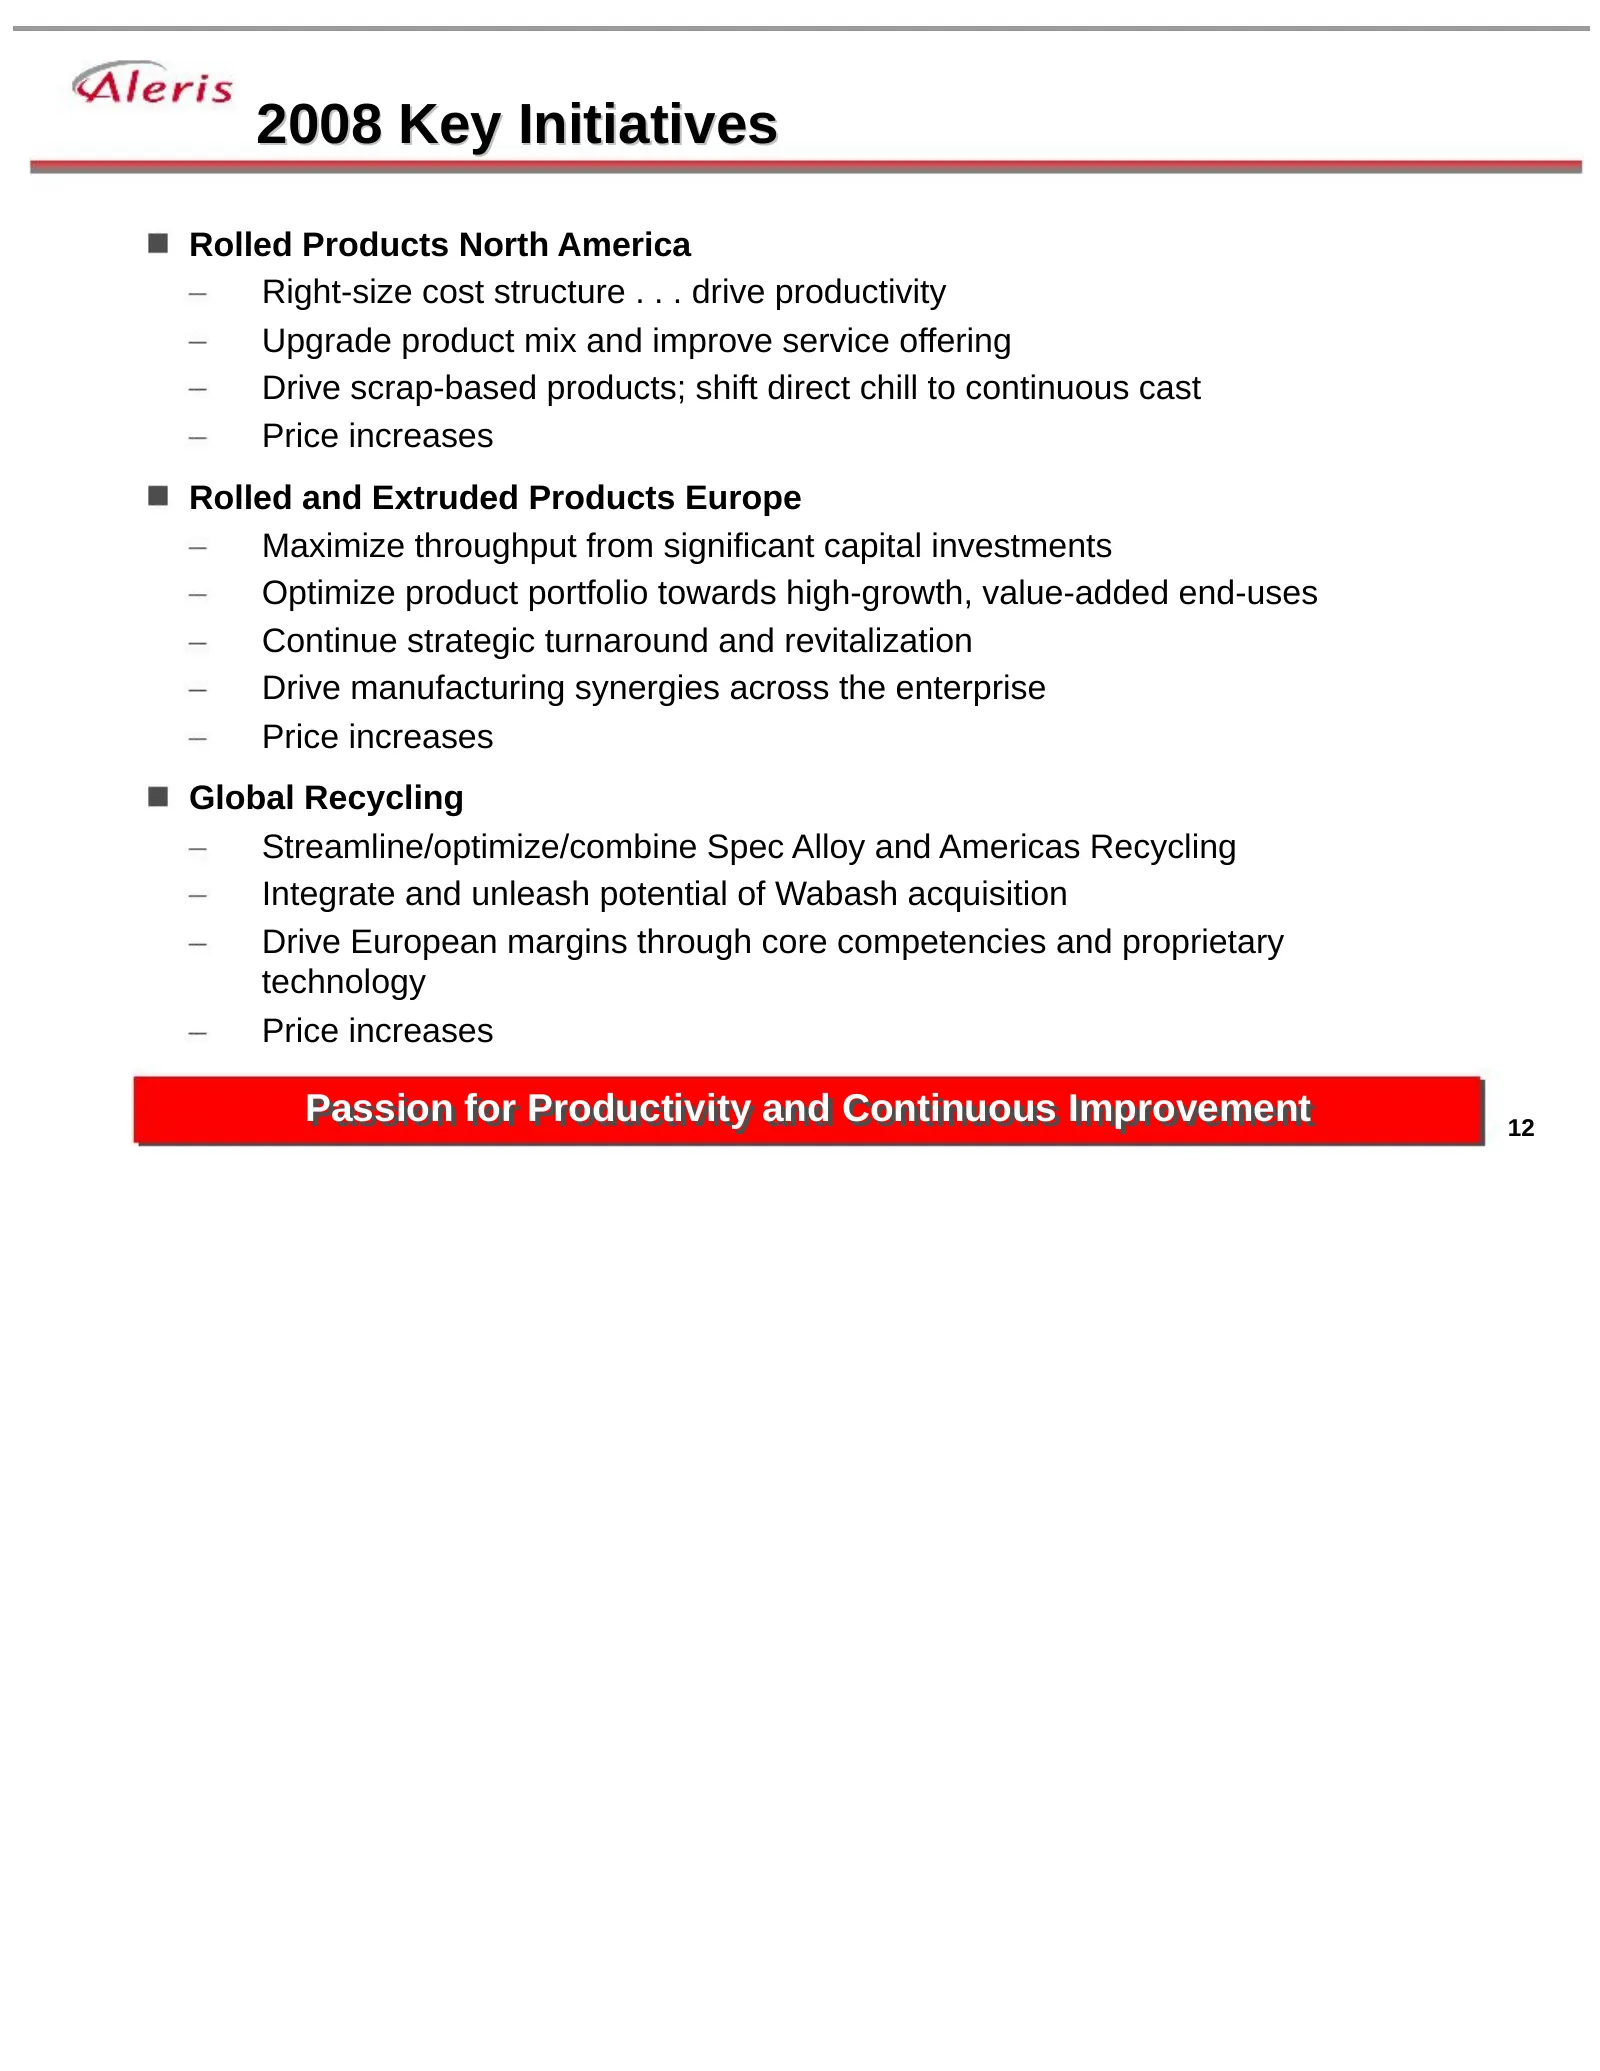
2008 Key Initiatives Rolled Products North America Right-size cost structure . . . drive productivity Upgrade product mix and improve service offering Drive scrap-based products; shift direct chill to continuous cast Price increases Rolled and Extruded Products Europe Maximize throughput from signif
Slide 13: Positioning the Cost Base
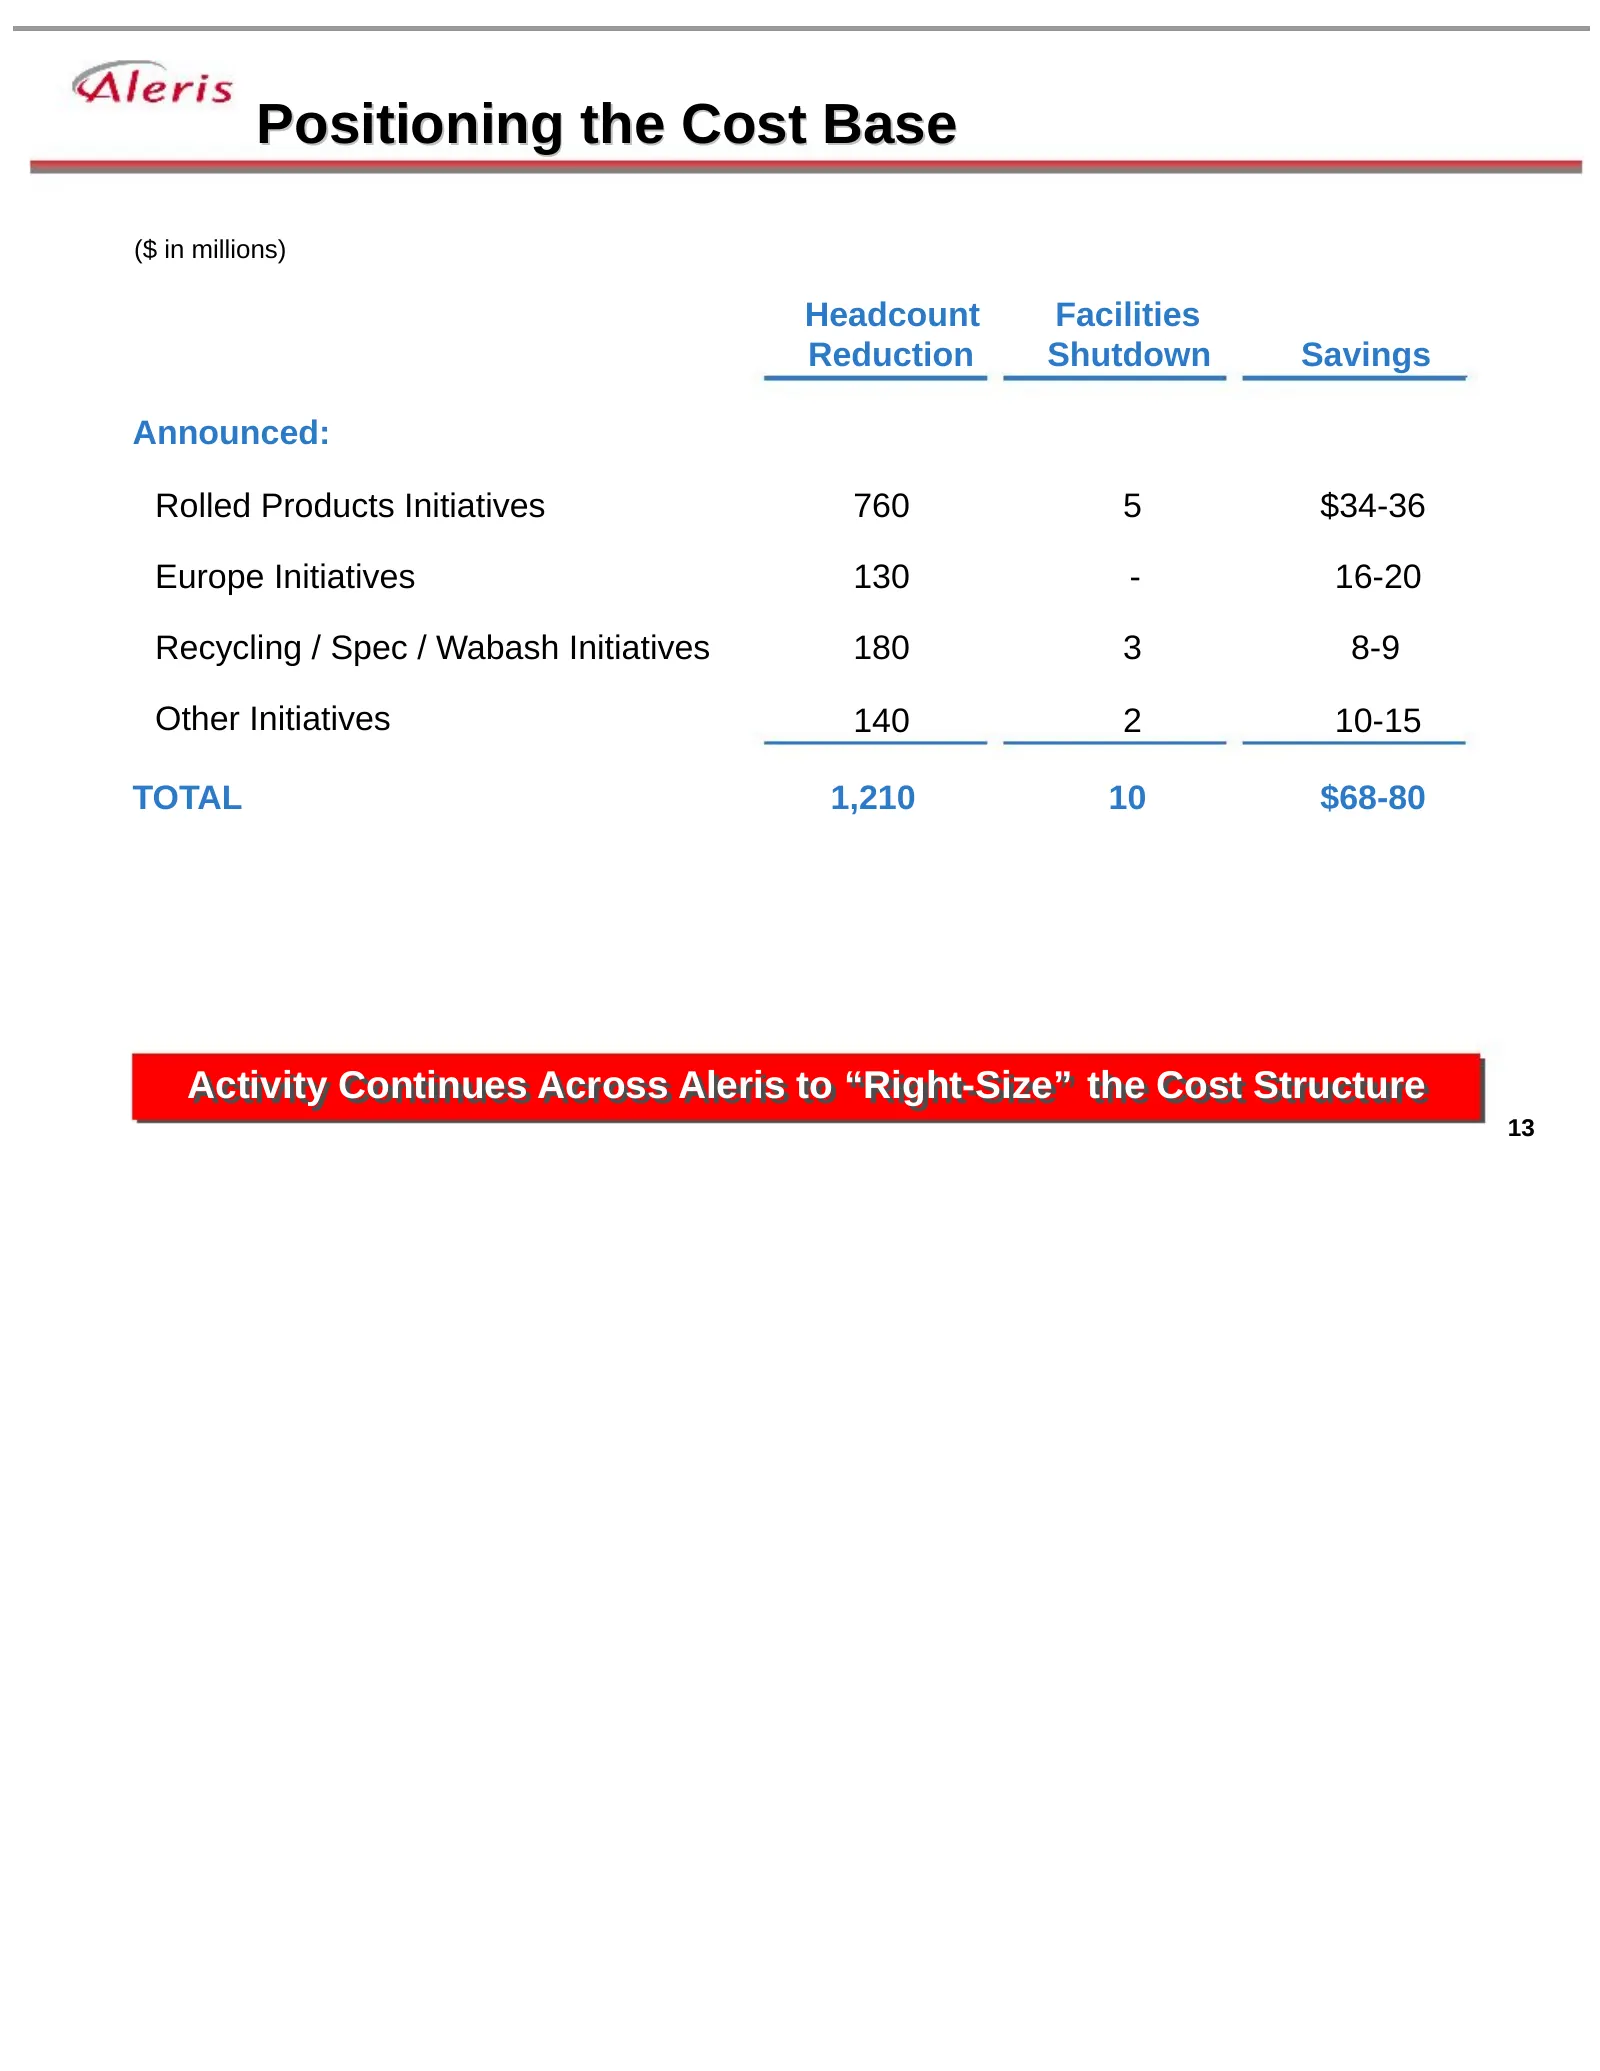
Positioning the Cost Base ($ in millions) Headcount Facilities Reduction Shutdown Savings Announced: Rolled Products Initiatives 760 5 $34-36 Europe Initiatives 130 - 16-20 Recycling / Spec / Wabash Initiatives 180 3 8-9 Other Initiatives 140 2 10-15 TOTAL 1,210 10 $68-80 Activity Activity Continues
Slide 14: Second Quarter and First Half
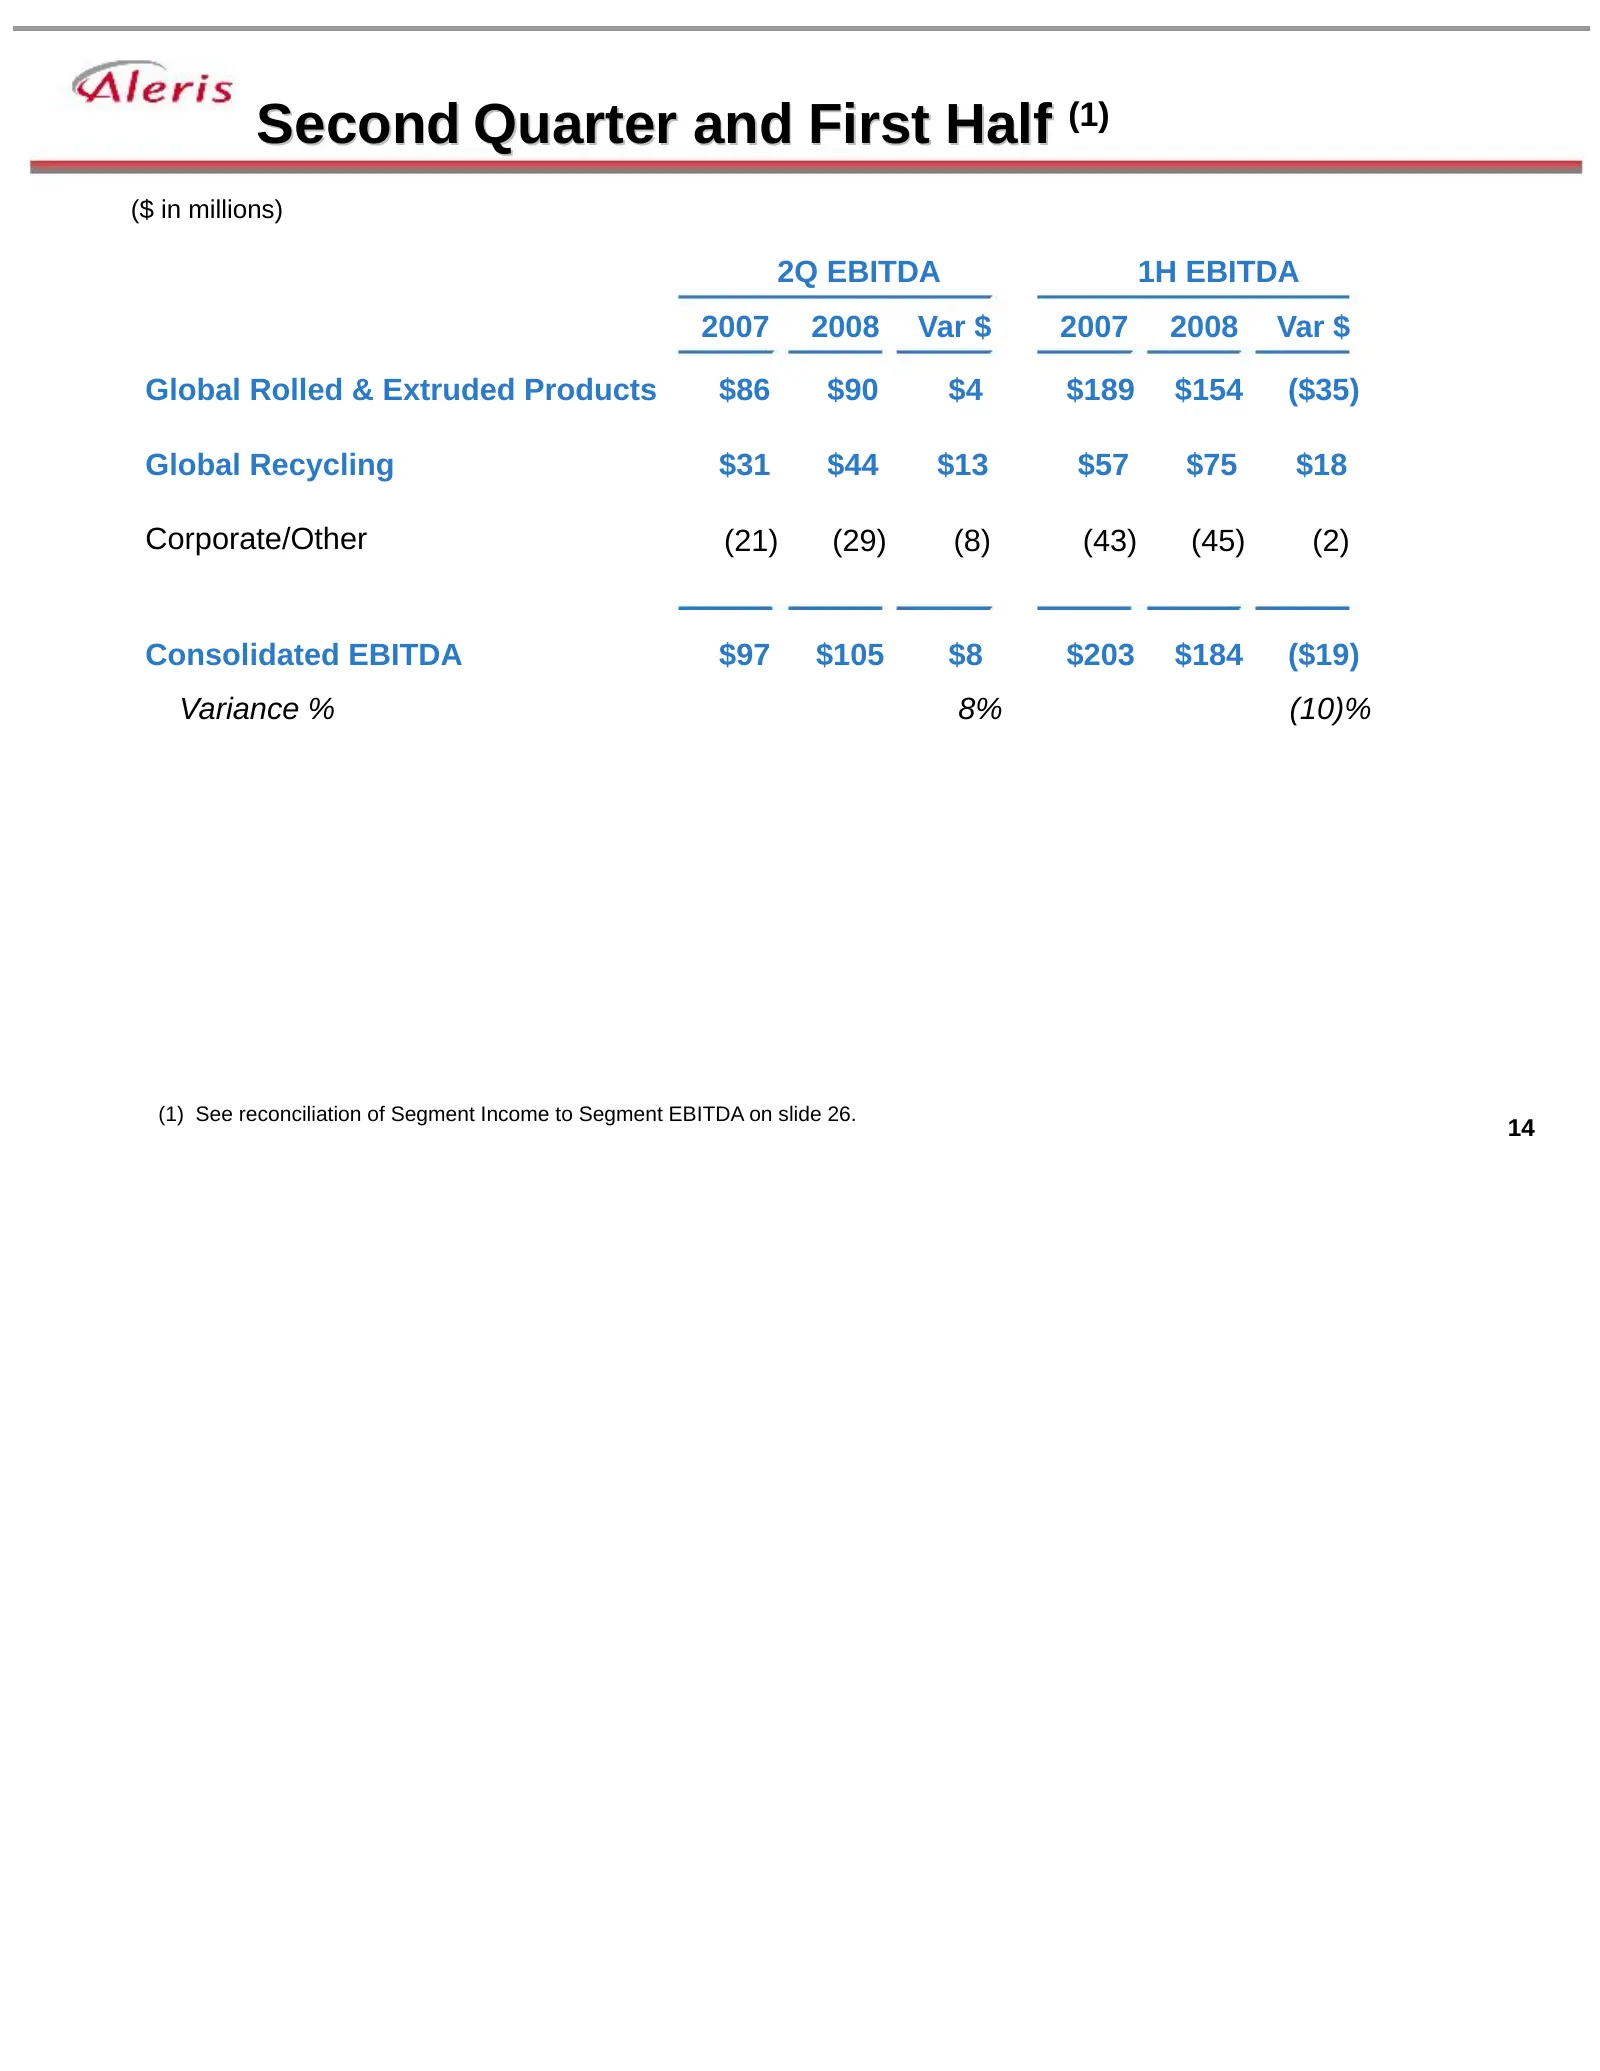
Second Quarter and First Half (1) ($ in millions) 2Q EBITDA 1H EBITDA 2007 2008 Var $ 2007 2008 Var $ Global Rolled & Extruded Products $86 $90 $4 $189 $154 ($35) Global Recycling $31 $44 $13 $57 $75 $18 Corporate/Other (21) (29) (8) (43) (45) (2) Consolidated EBITDA $97 $105 $8 $203 $184 ($19) Vari
Slide 15: EBITDA Bridge
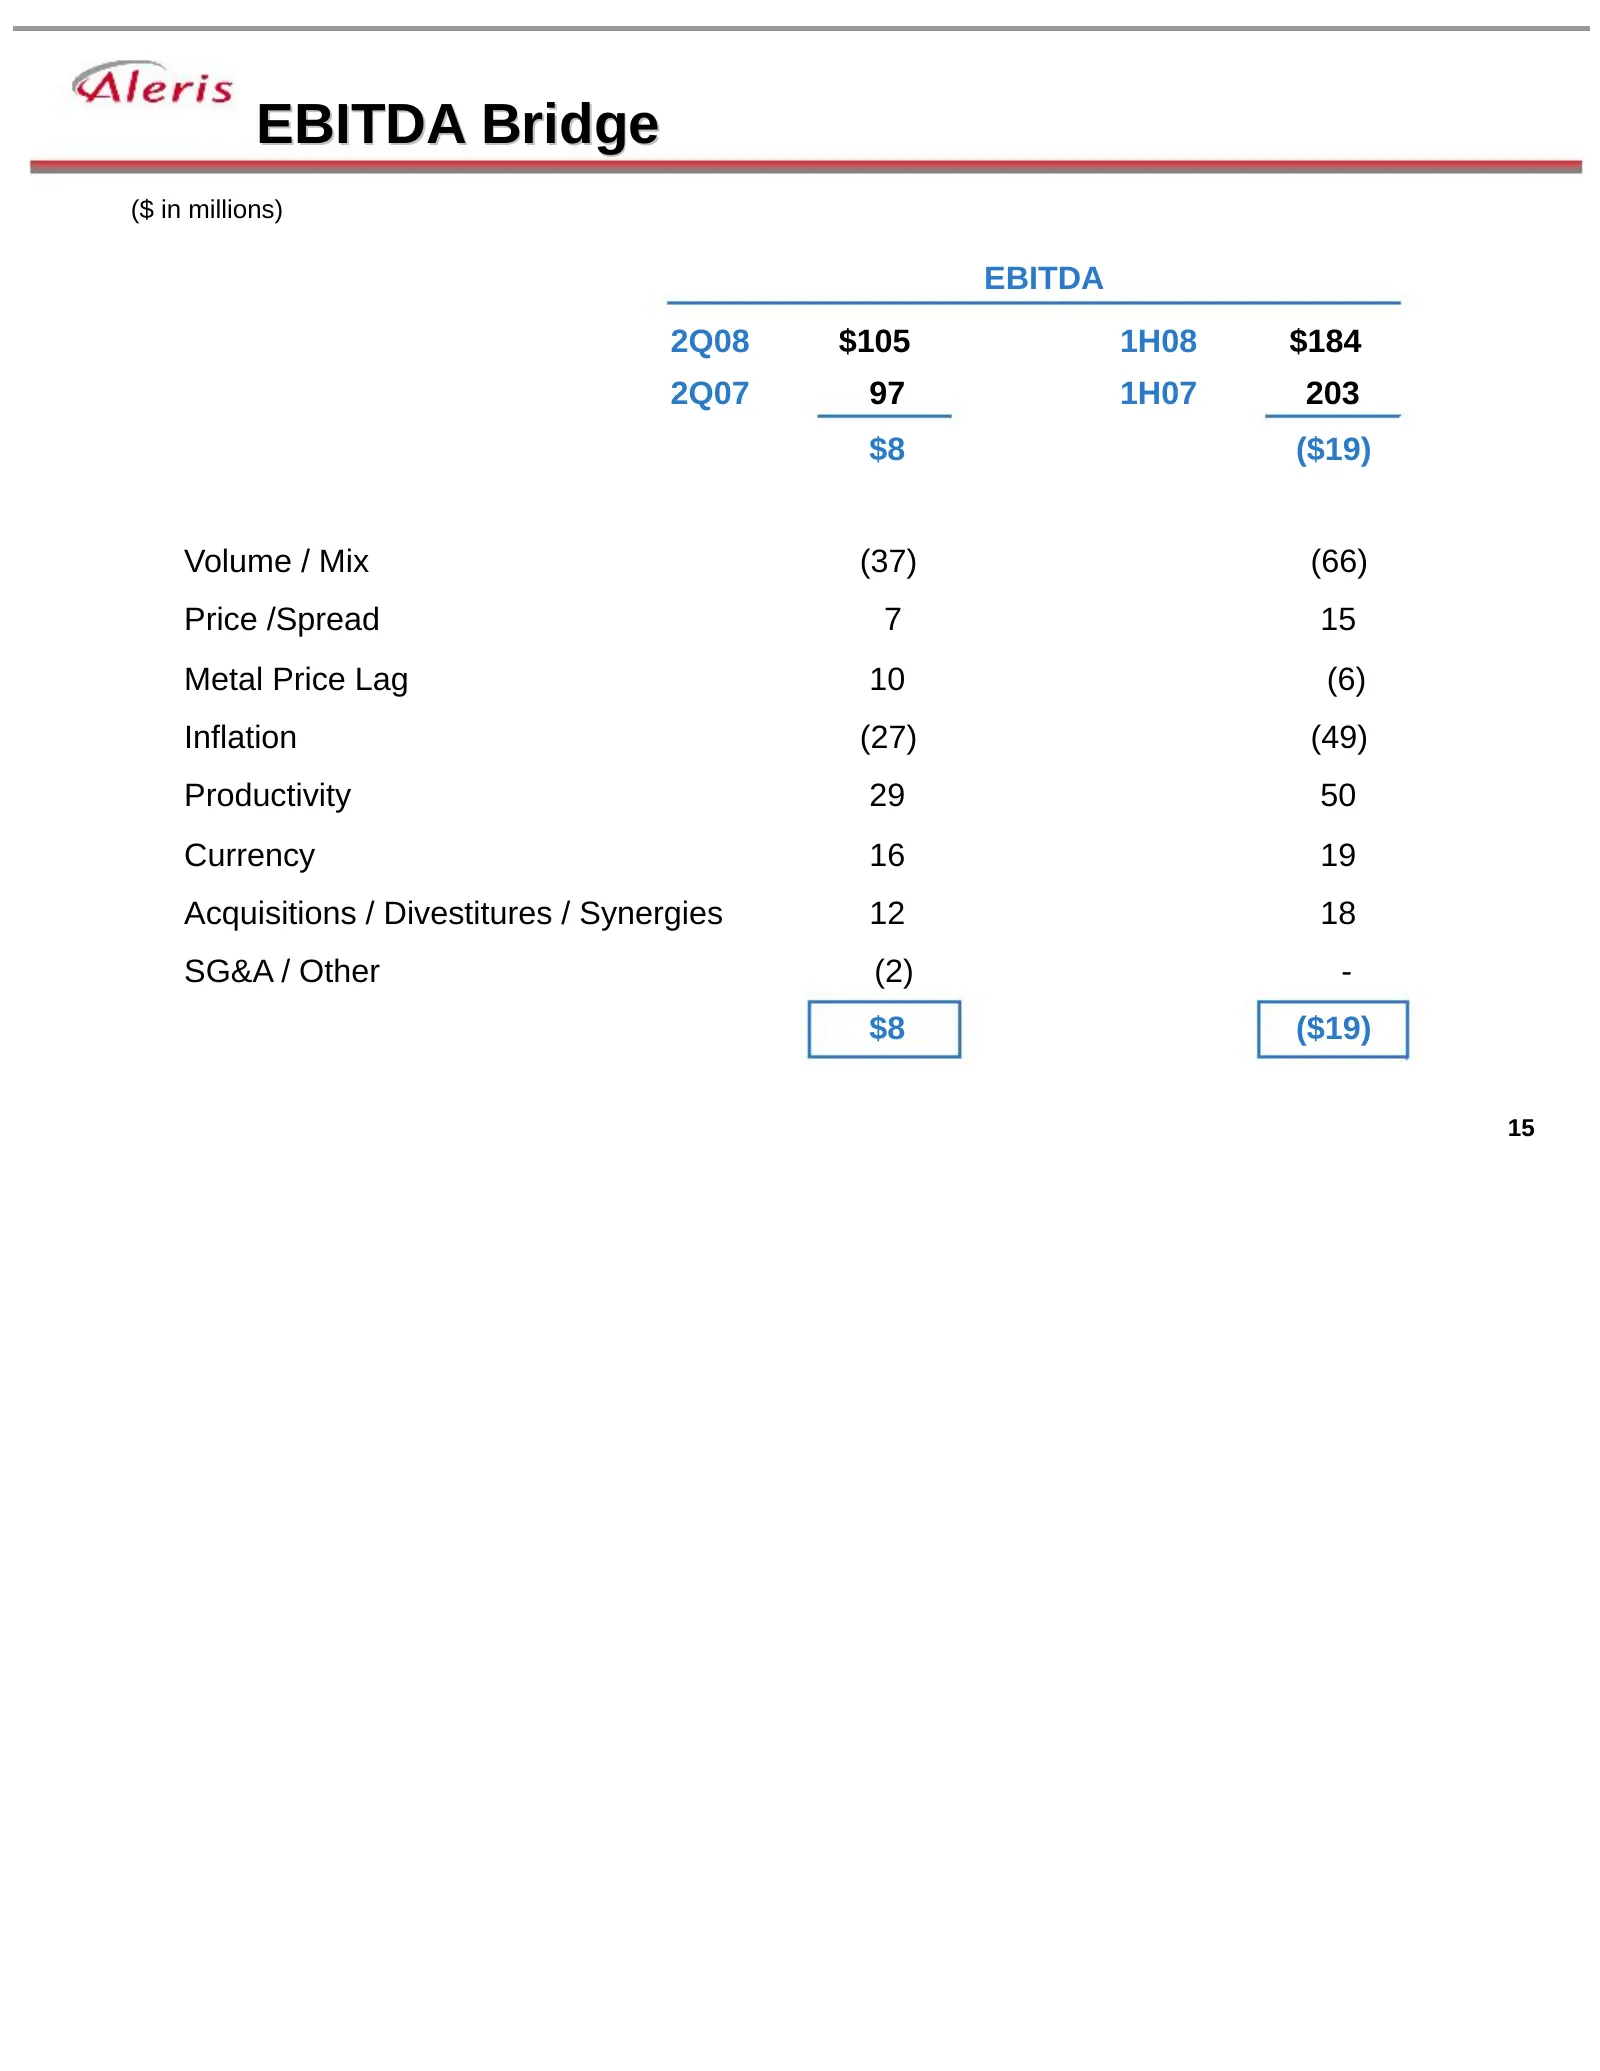
EBITDA Bridge ($ in millions) EBITDA 2Q08 $105 1H08 $184 2Q07 97 1H07 203 $8 ($19) Volume / Mix (37) (66) Price /Spread 7 15 Metal Price Lag 10 (6) Inflation (27) (49) Productivity 29 50 Currency 16 19 Acquisitions / Divestitures / Synergies 12 18 SG&A / Other (2) - $8 ($19) 15
Slide 16: 2Q08 Cash Flow vs. Prior Year
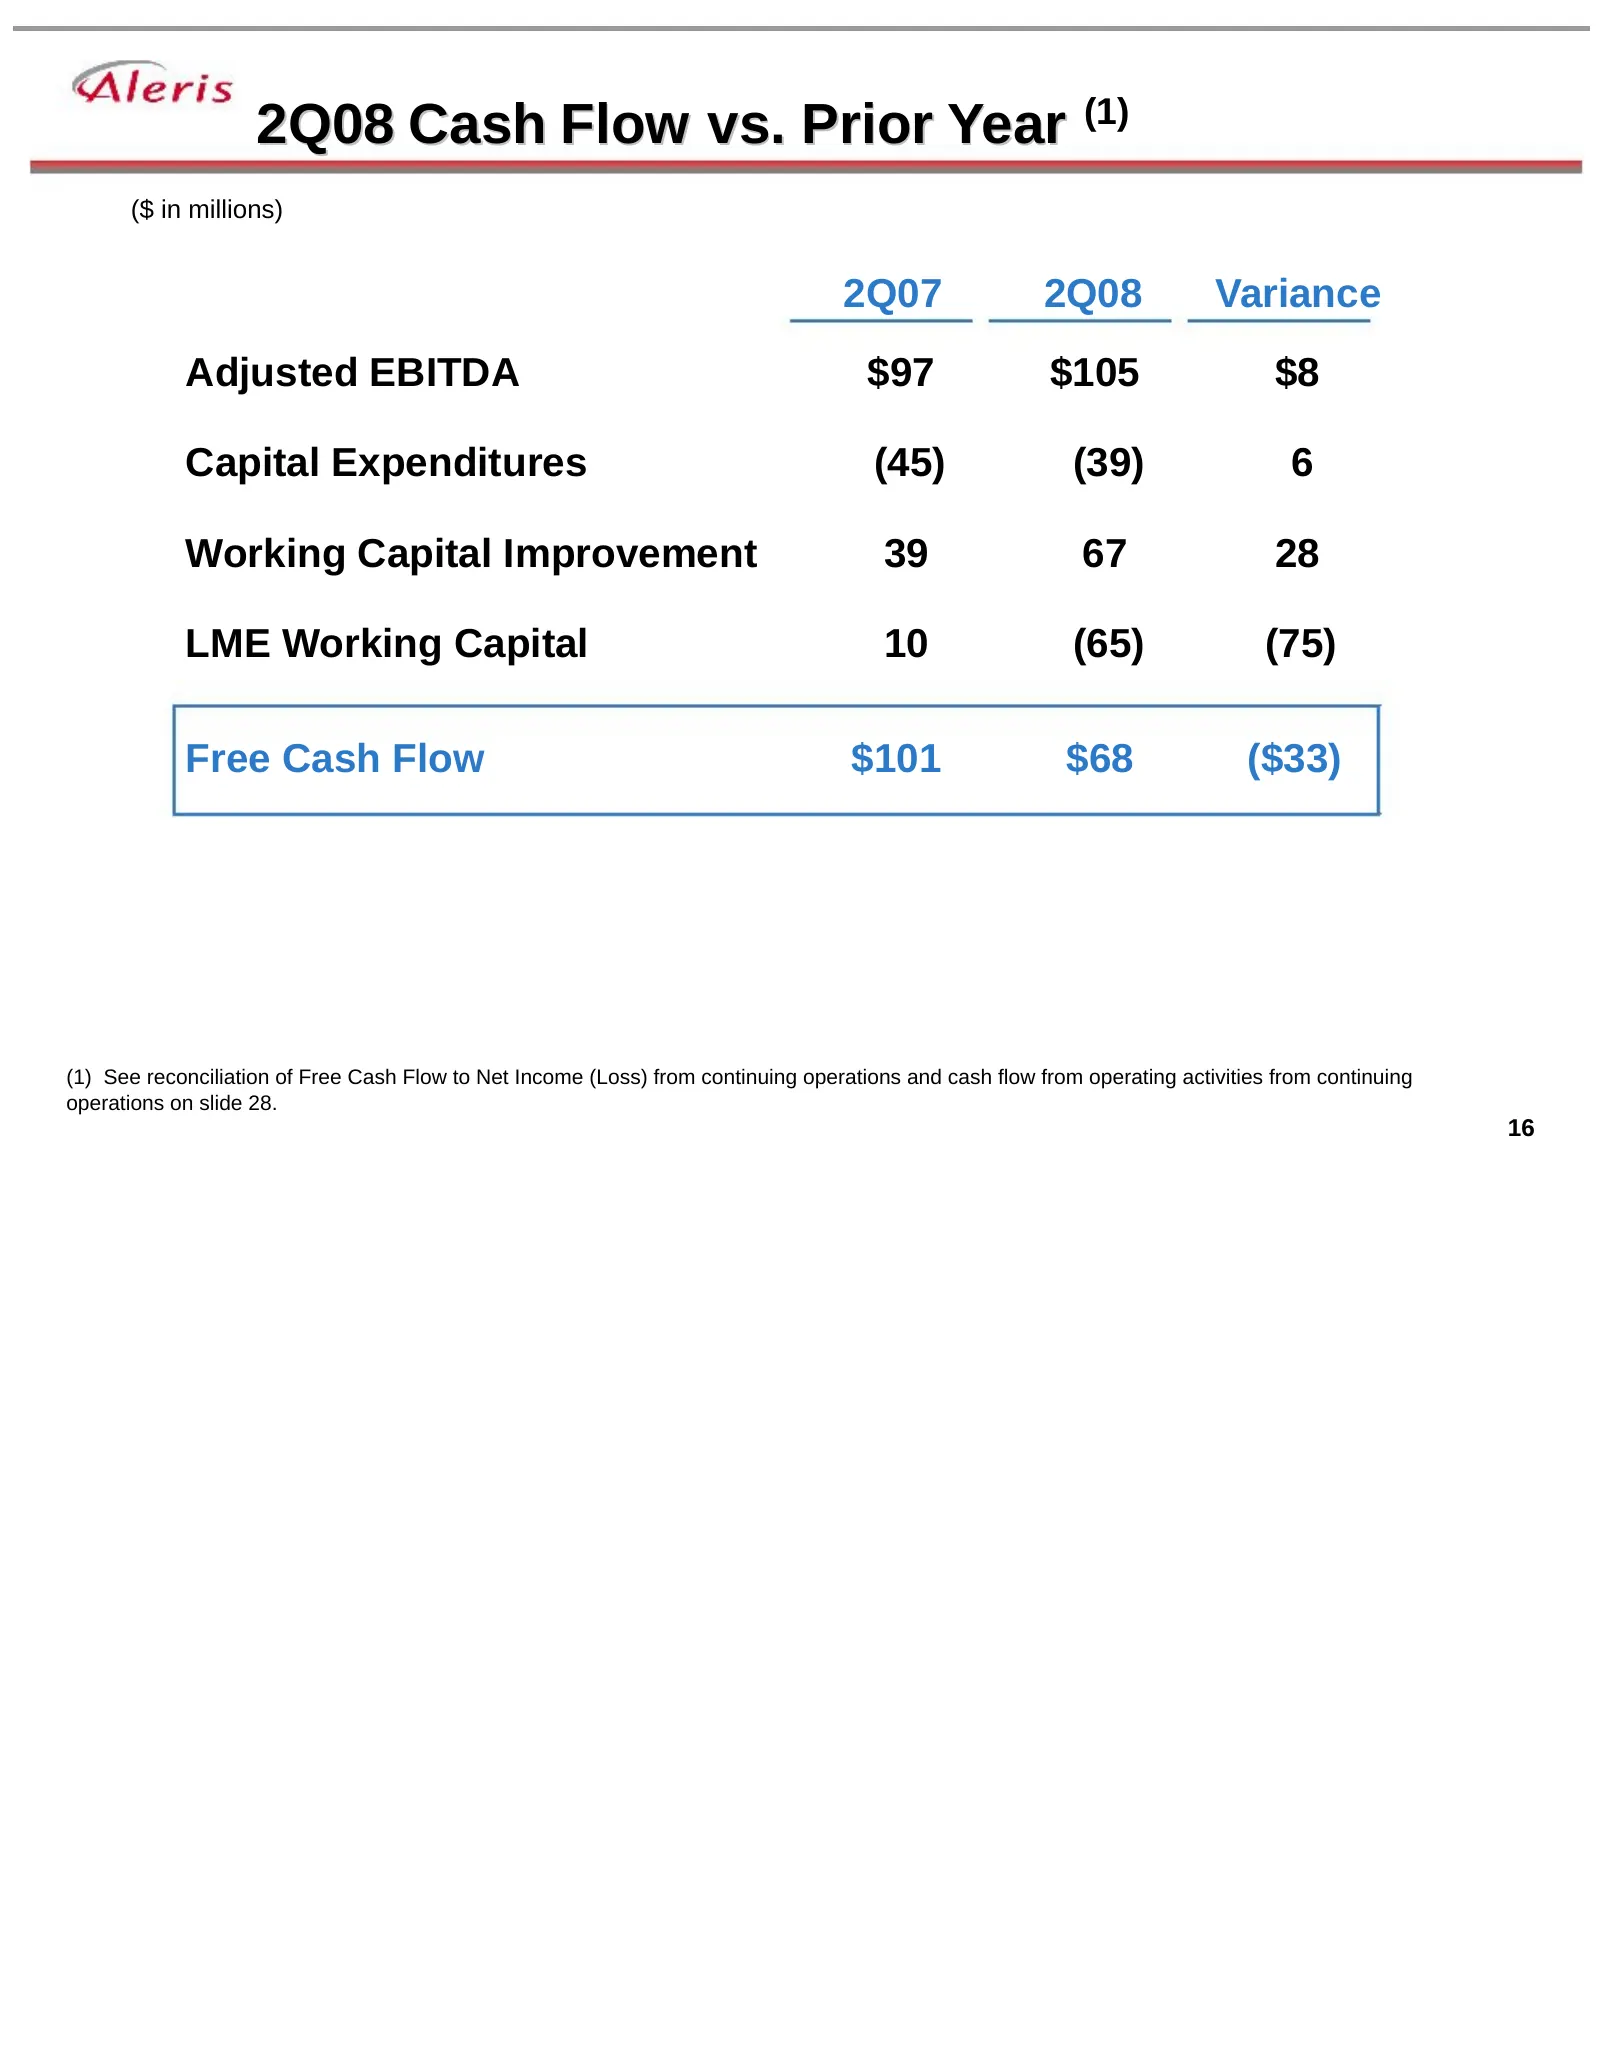
2Q08 Cash Flow vs. Prior Year (1) ($ in millions) 2Q07 2Q08 Variance Adjusted EBITDA $97 $105 $8 Capital Expenditures (45) (39) 6 Working Capital Improvement 39 67 28 LME Working Capital 10 (65) (75) Free Cash Flow $101 $68 ($33) (1) See reconciliation of Free Cash Flow to Net Income (Loss) from con
Slide 17: Performance Summary
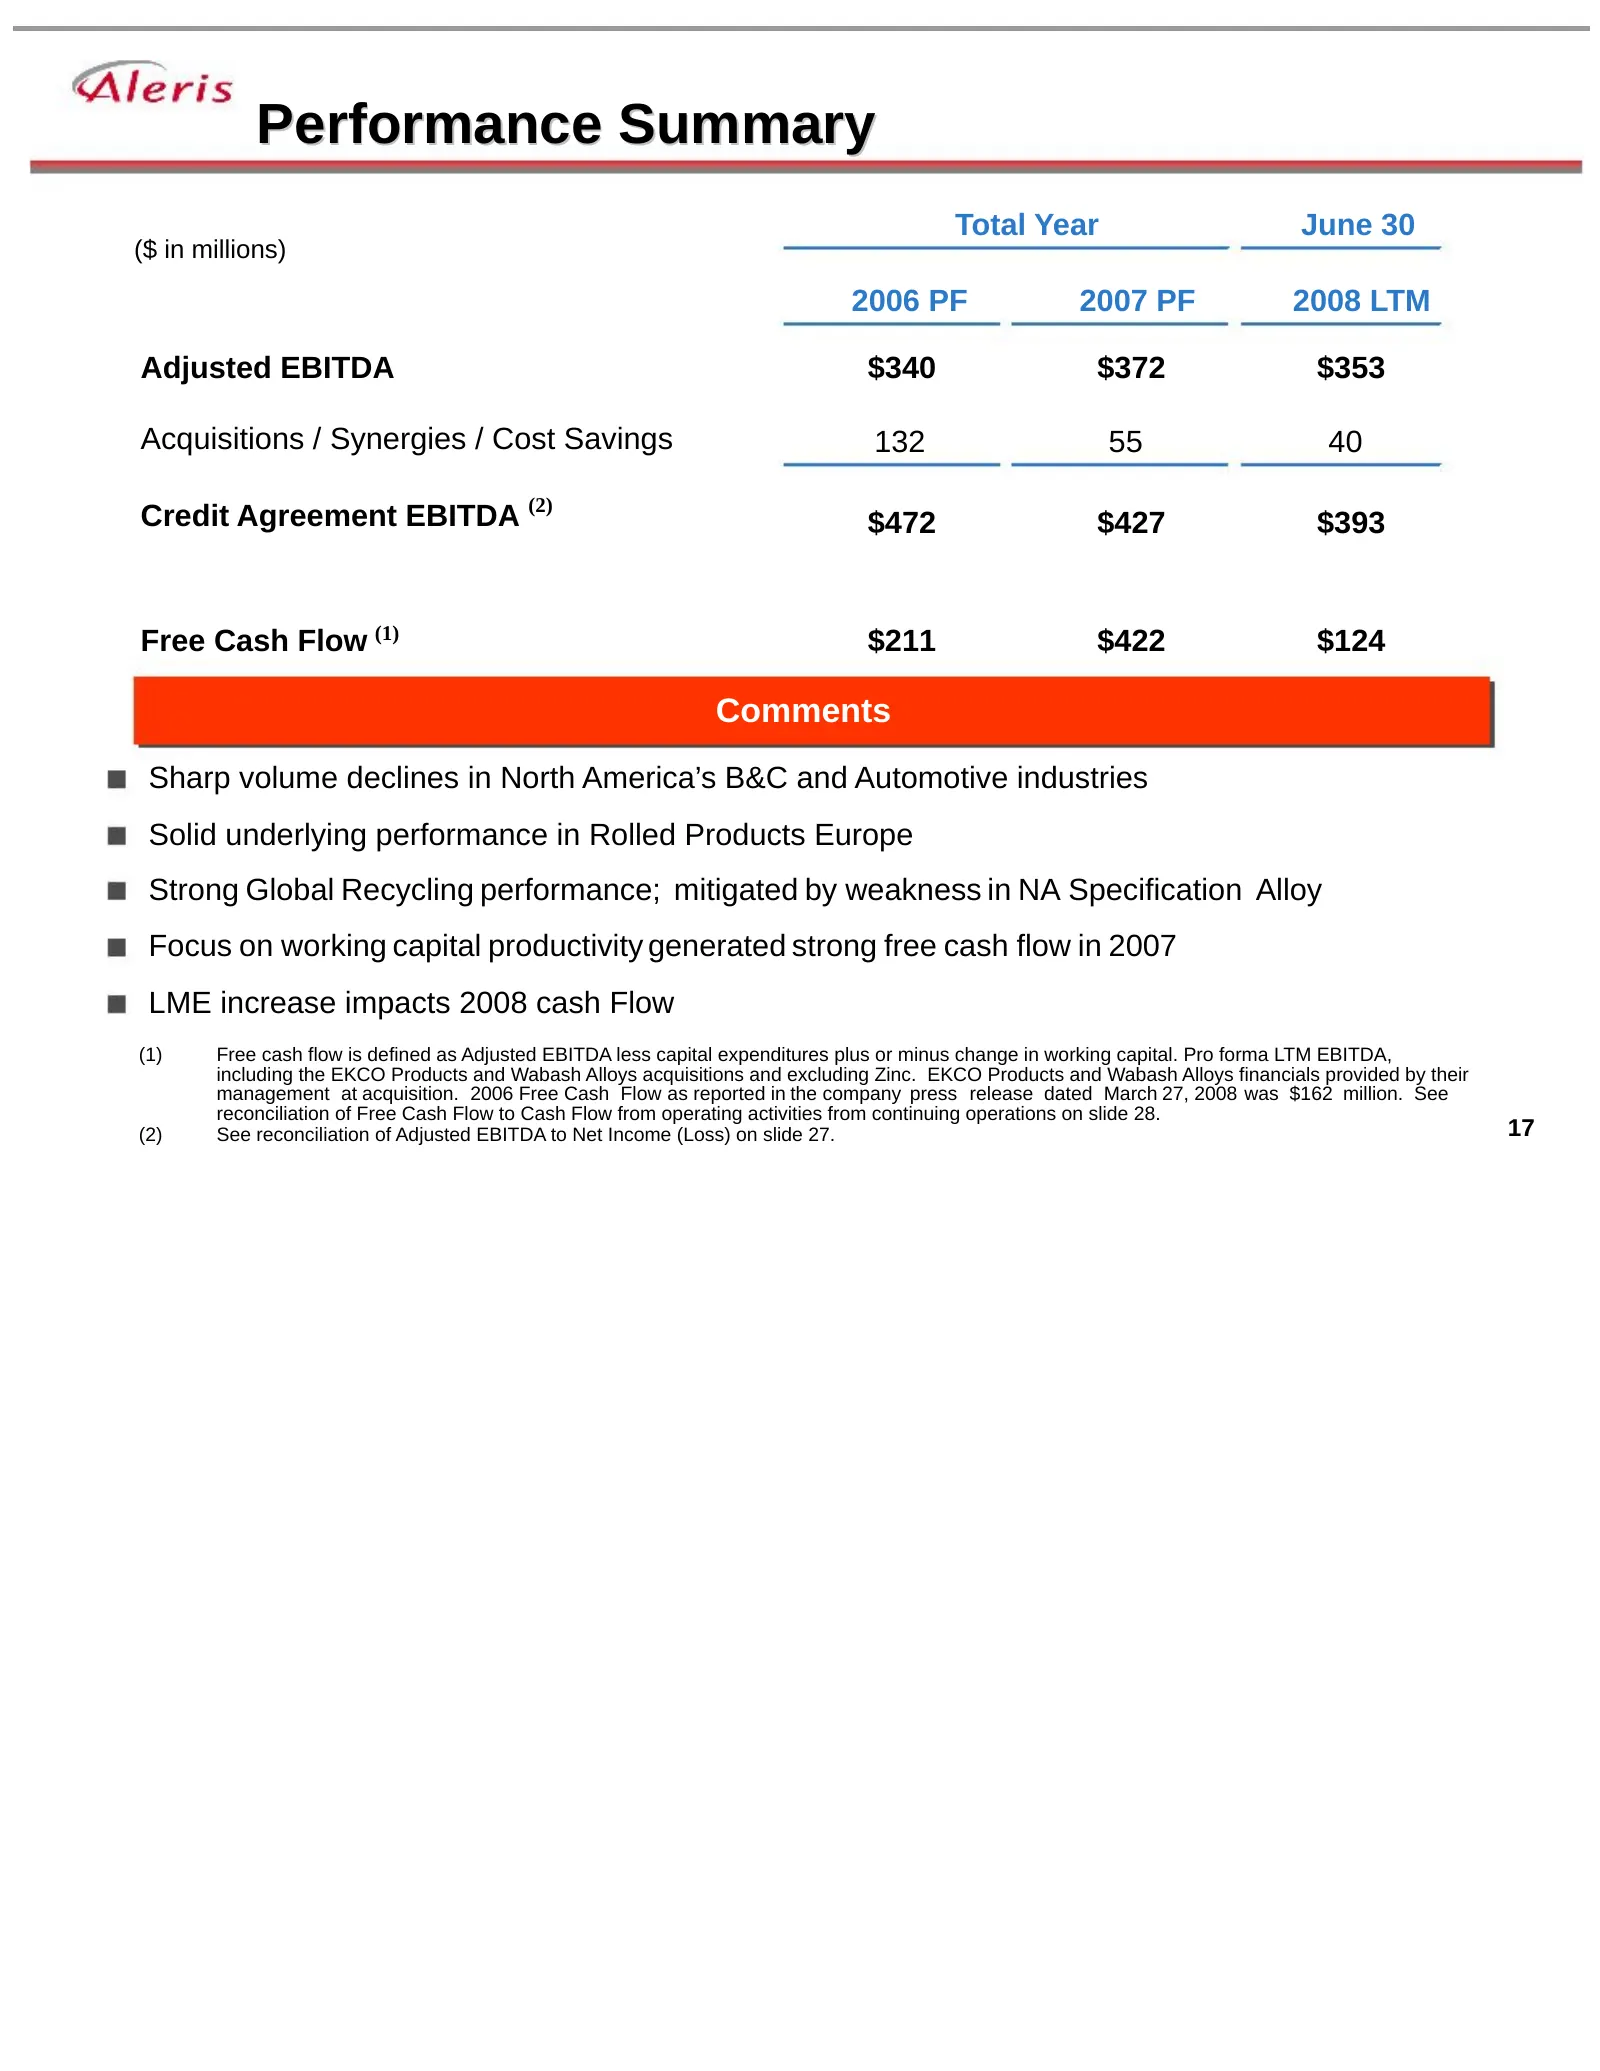
Performance Summary Total Year June 30 ($ in millions) 2006 PF 2007 PF 2008 LTM Adjusted EBITDA $340 $372 $353 Acquisitions / Synergies / Cost Savings 132 55 40 Credit Agreement EBITDA (2) $472 $427 $393 Free Cash Flow (1) $211 $422 $124 Comments Sharp volume declines in North America’s B&C and Auto
Slide 18: LTM Working Capital Performance
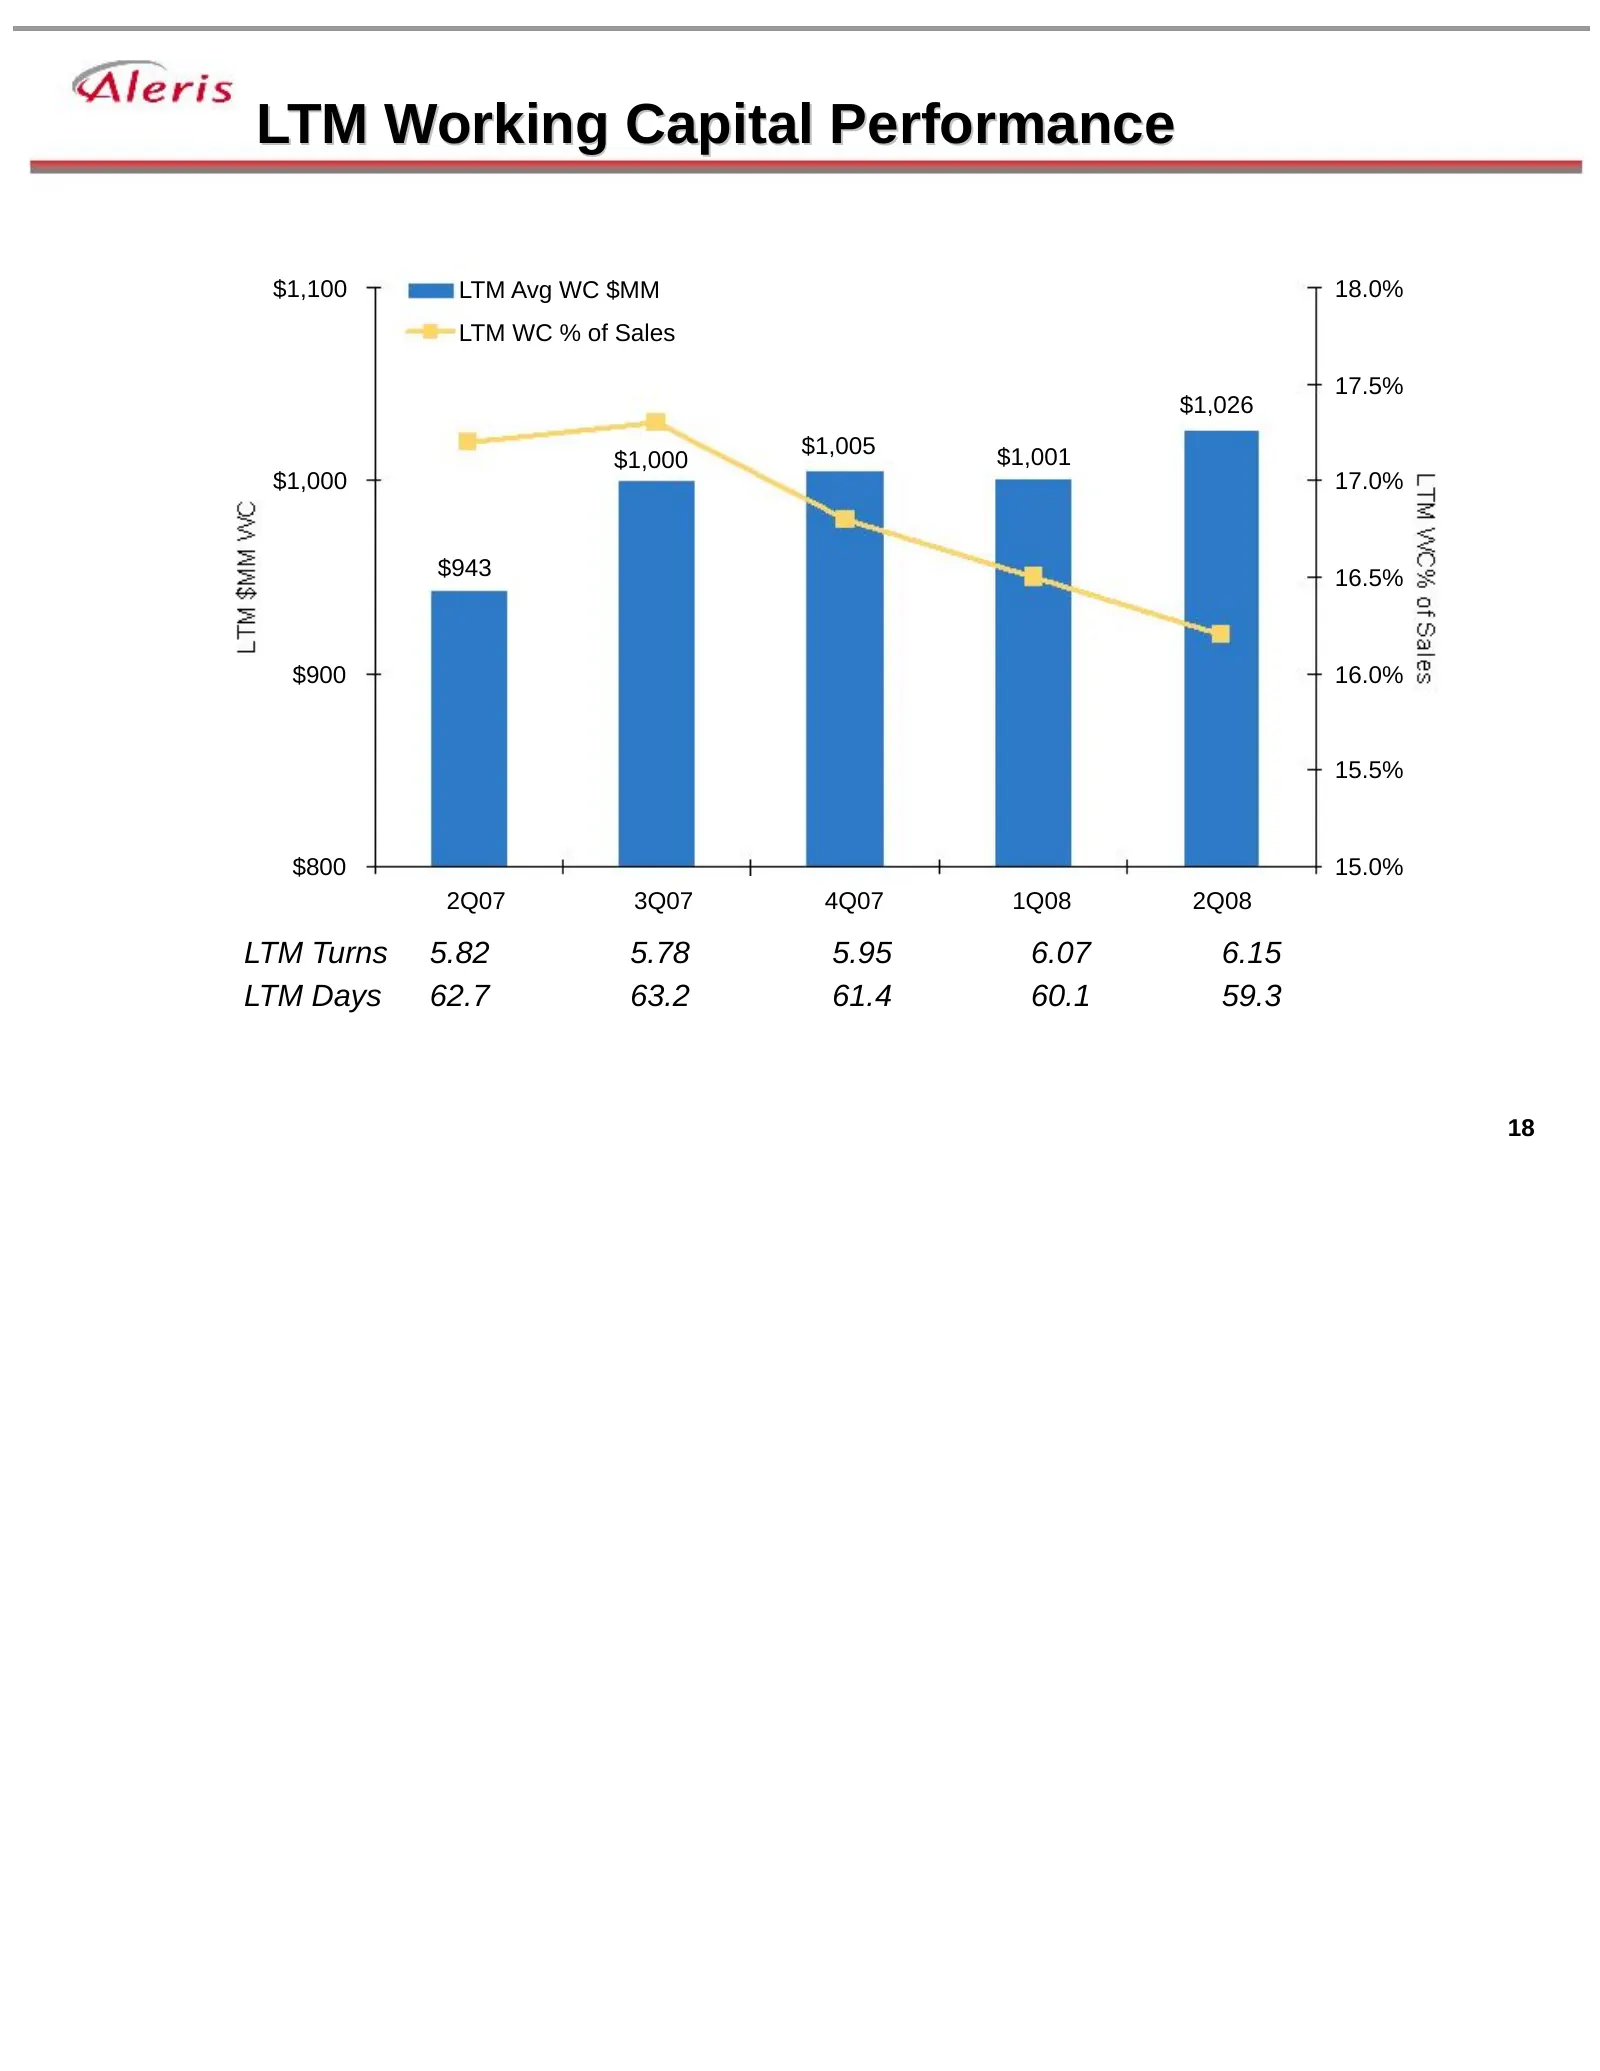
LTM Working Capital Performance $1,100 LTM Avg WC $MM 18.0% LTM WC % of Sales 17.5% $1,026 $1,005 $1,001 $1,000 $1,000 17.0% $943 16.5% $900 16.0% 15.5% $800 15.0% 2Q07 3Q07 4Q07 1Q08 2Q08 LTM Turns 5.82 5.78 5.95 6.07 6.15 LTM Days 62.7 63.2 61.4 60.1 59.3 18
Slide 19: 1st Half 2008 Working Capital Details
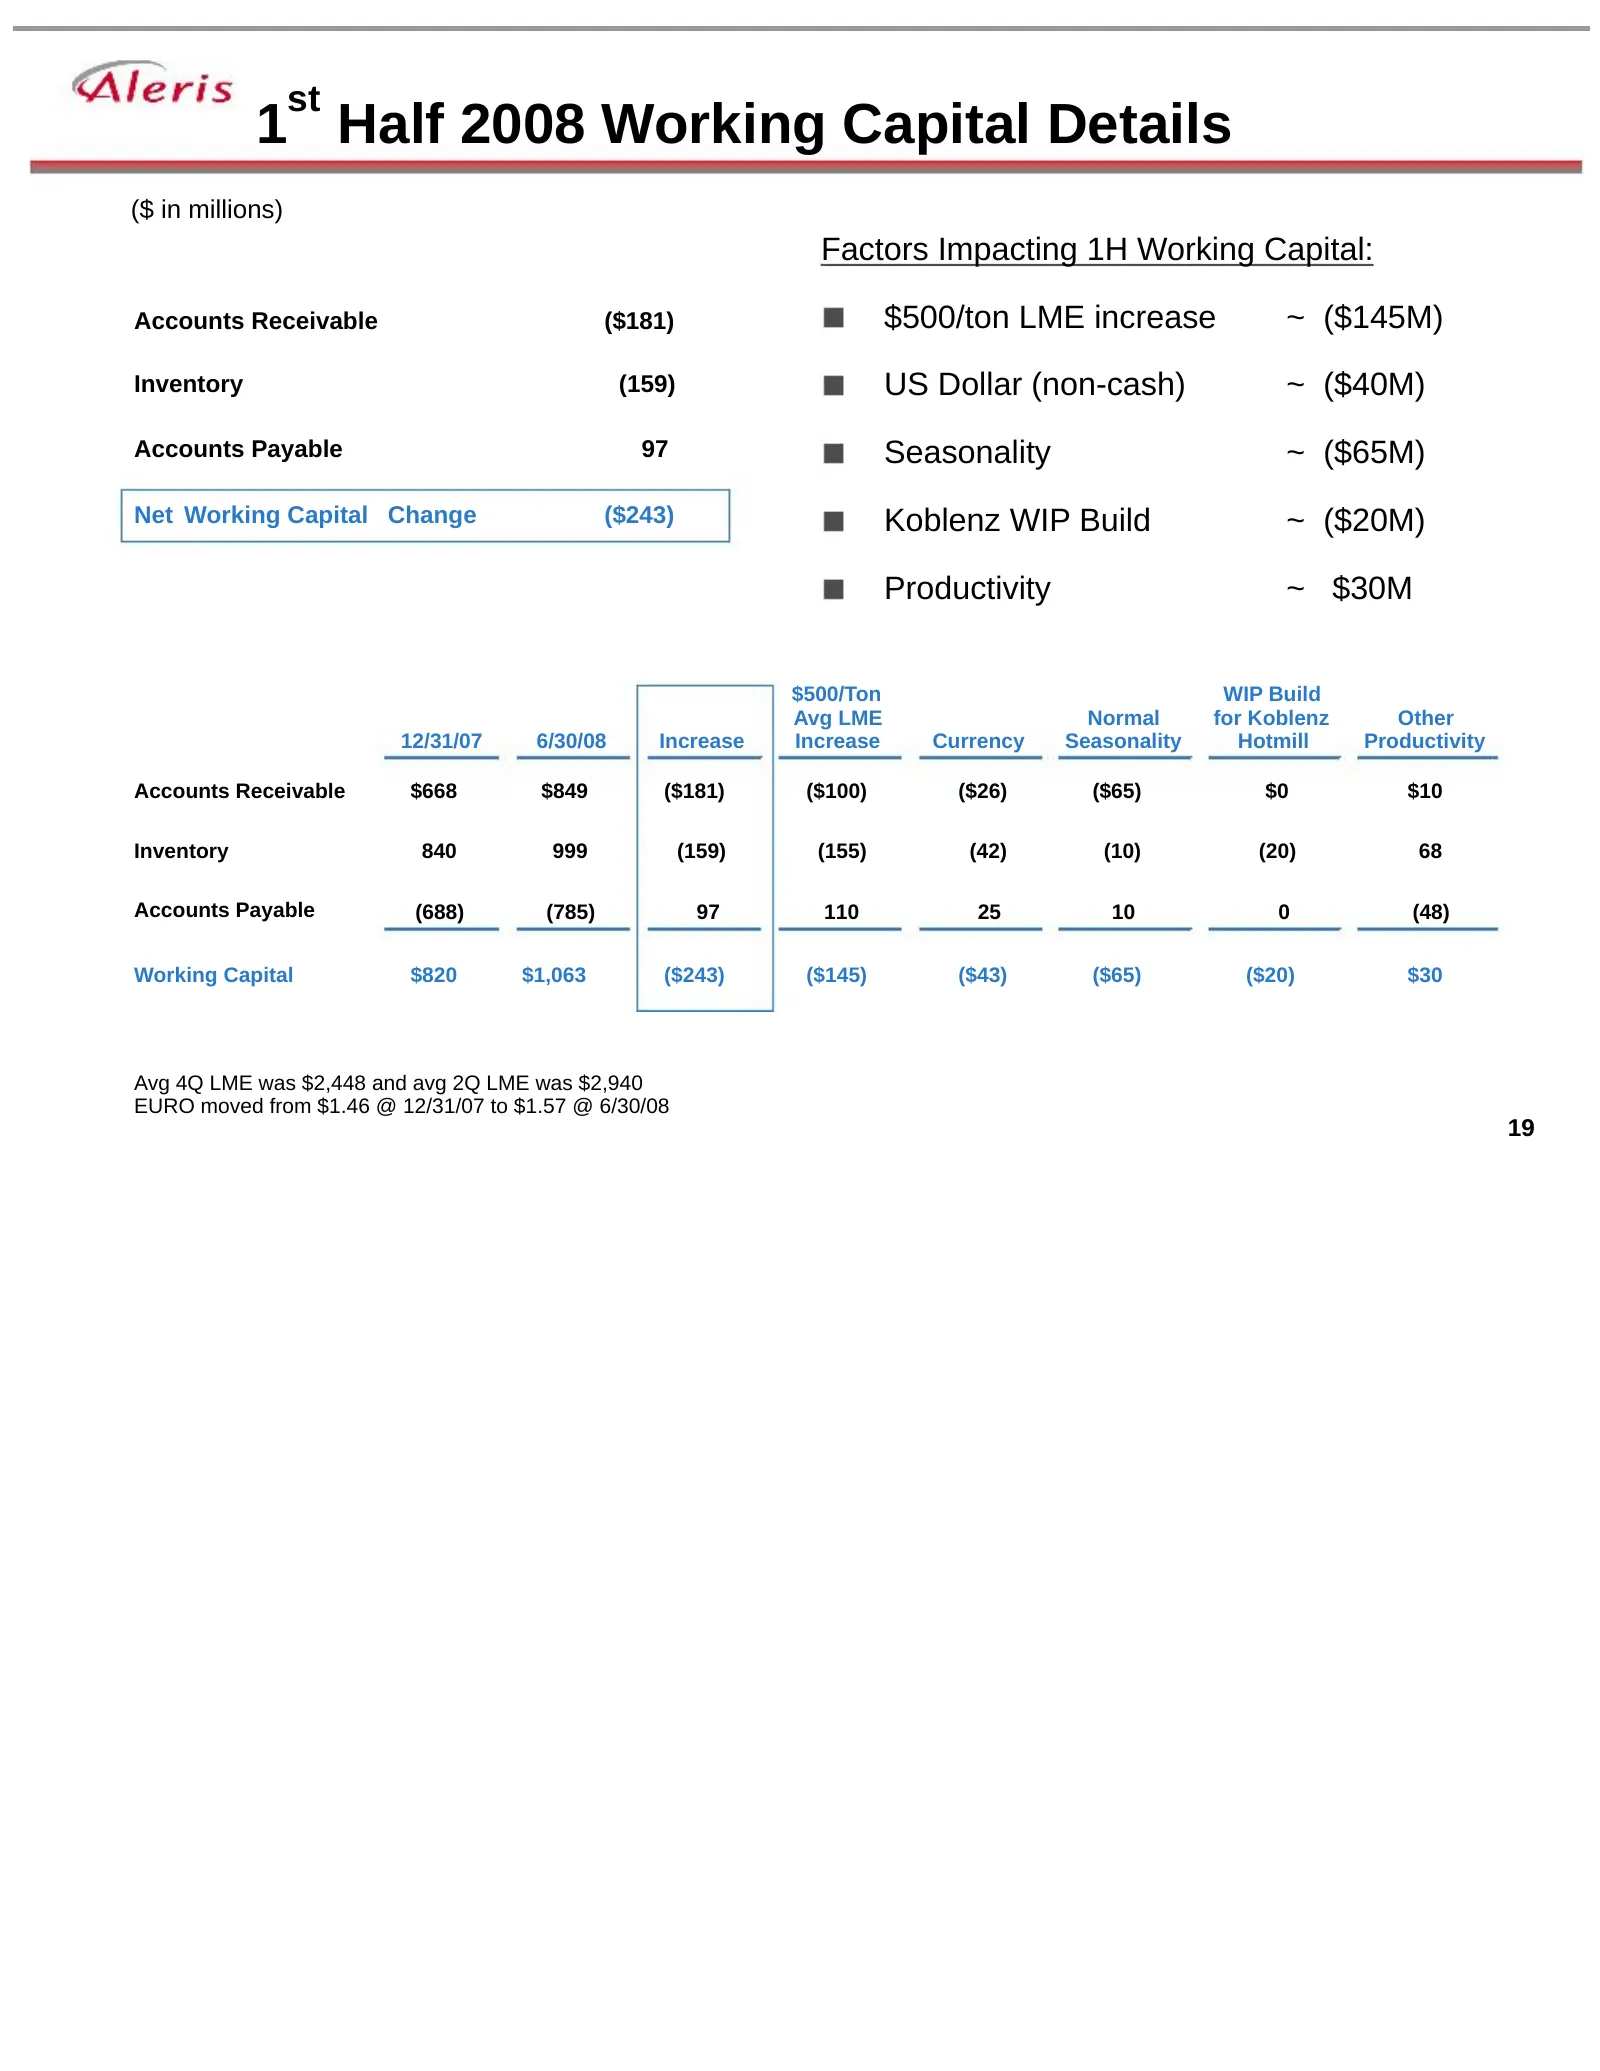
st 1 Half 2008 Working Capital Details ($ in millions) Factors Impacting 1H Working Capital: Accounts Receivable ($181) $500/ton LME increase ~ ($145M) Inventory (159) US Dollar (non-cash) ~ ($40M) Accounts Payable 97 Seasonality ~ ($65M) Net Working Capital Change ($243) Koblenz WIP Build ~ ($20M)
Slide 20: Capital Expenditures Overview
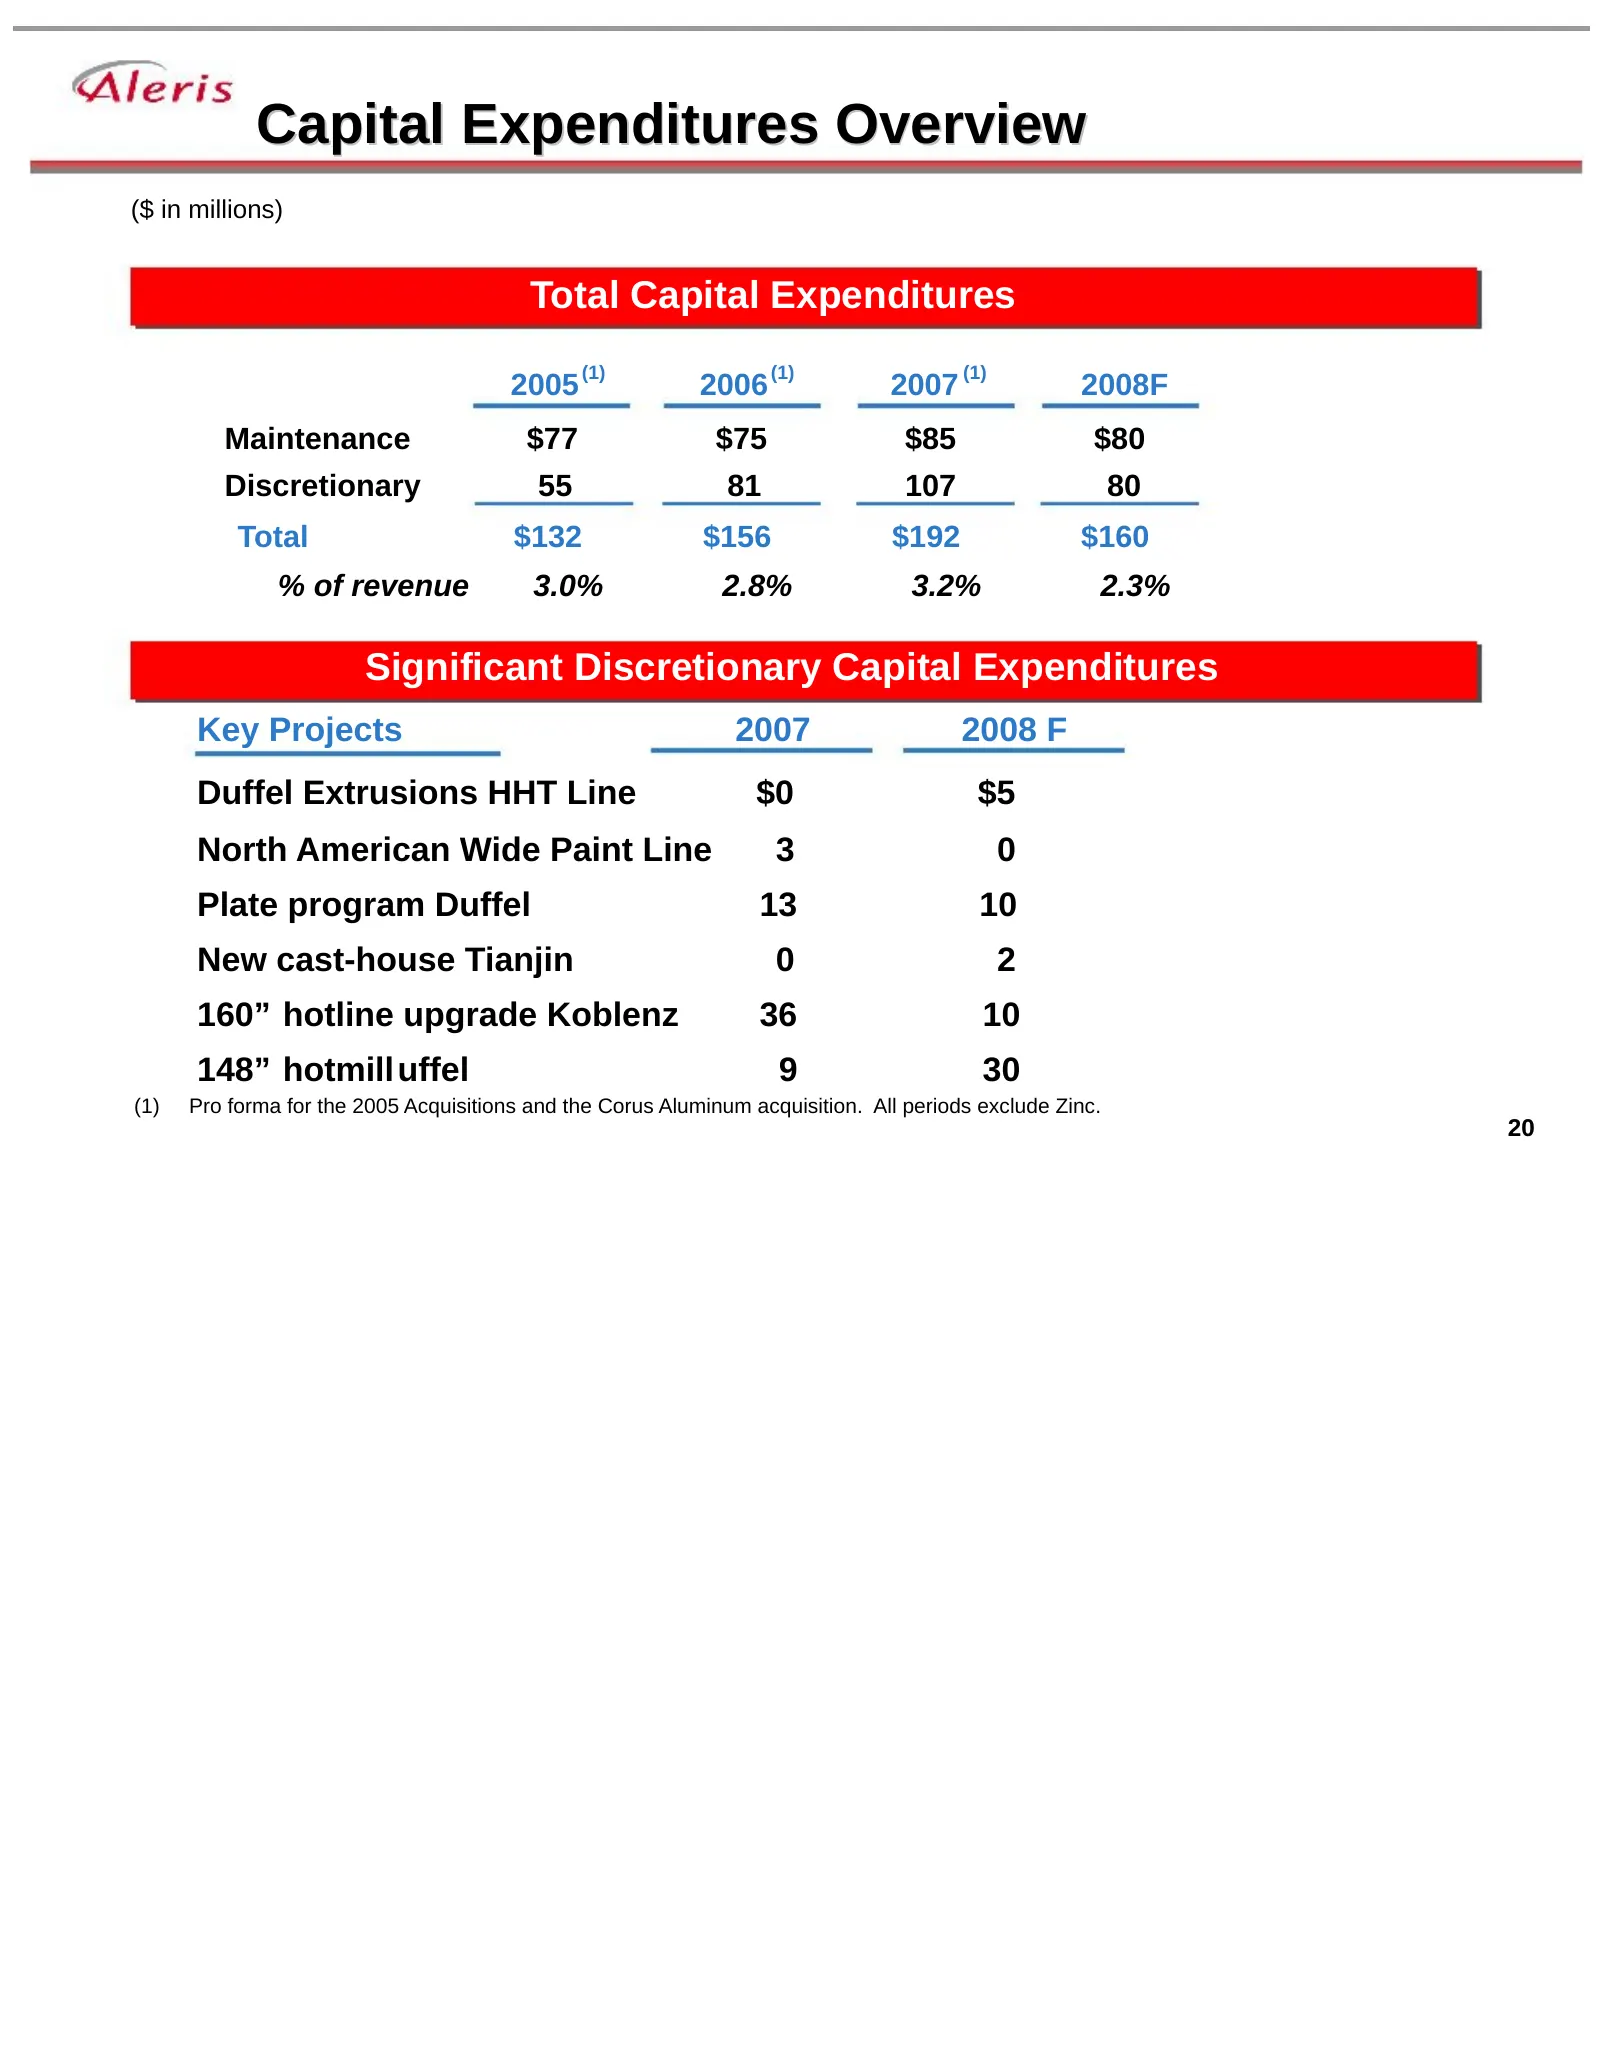
Capital Expenditures Overview ($ in millions) Total Capital Expenditures (1) (1) (1) 2005 2006 2007 2008F Maintenance $77 $75 $85 $80 Discretionary 55 81 107 80 Total $132 $156 $192 $160 % of revenue 3.0% 2.8% 3.2% 2.3% Significant Discretionary Capital Expenditures Key Projects 2007 2008 F Duffel E
Slide 21: Cash, Debt and Credit Statistics
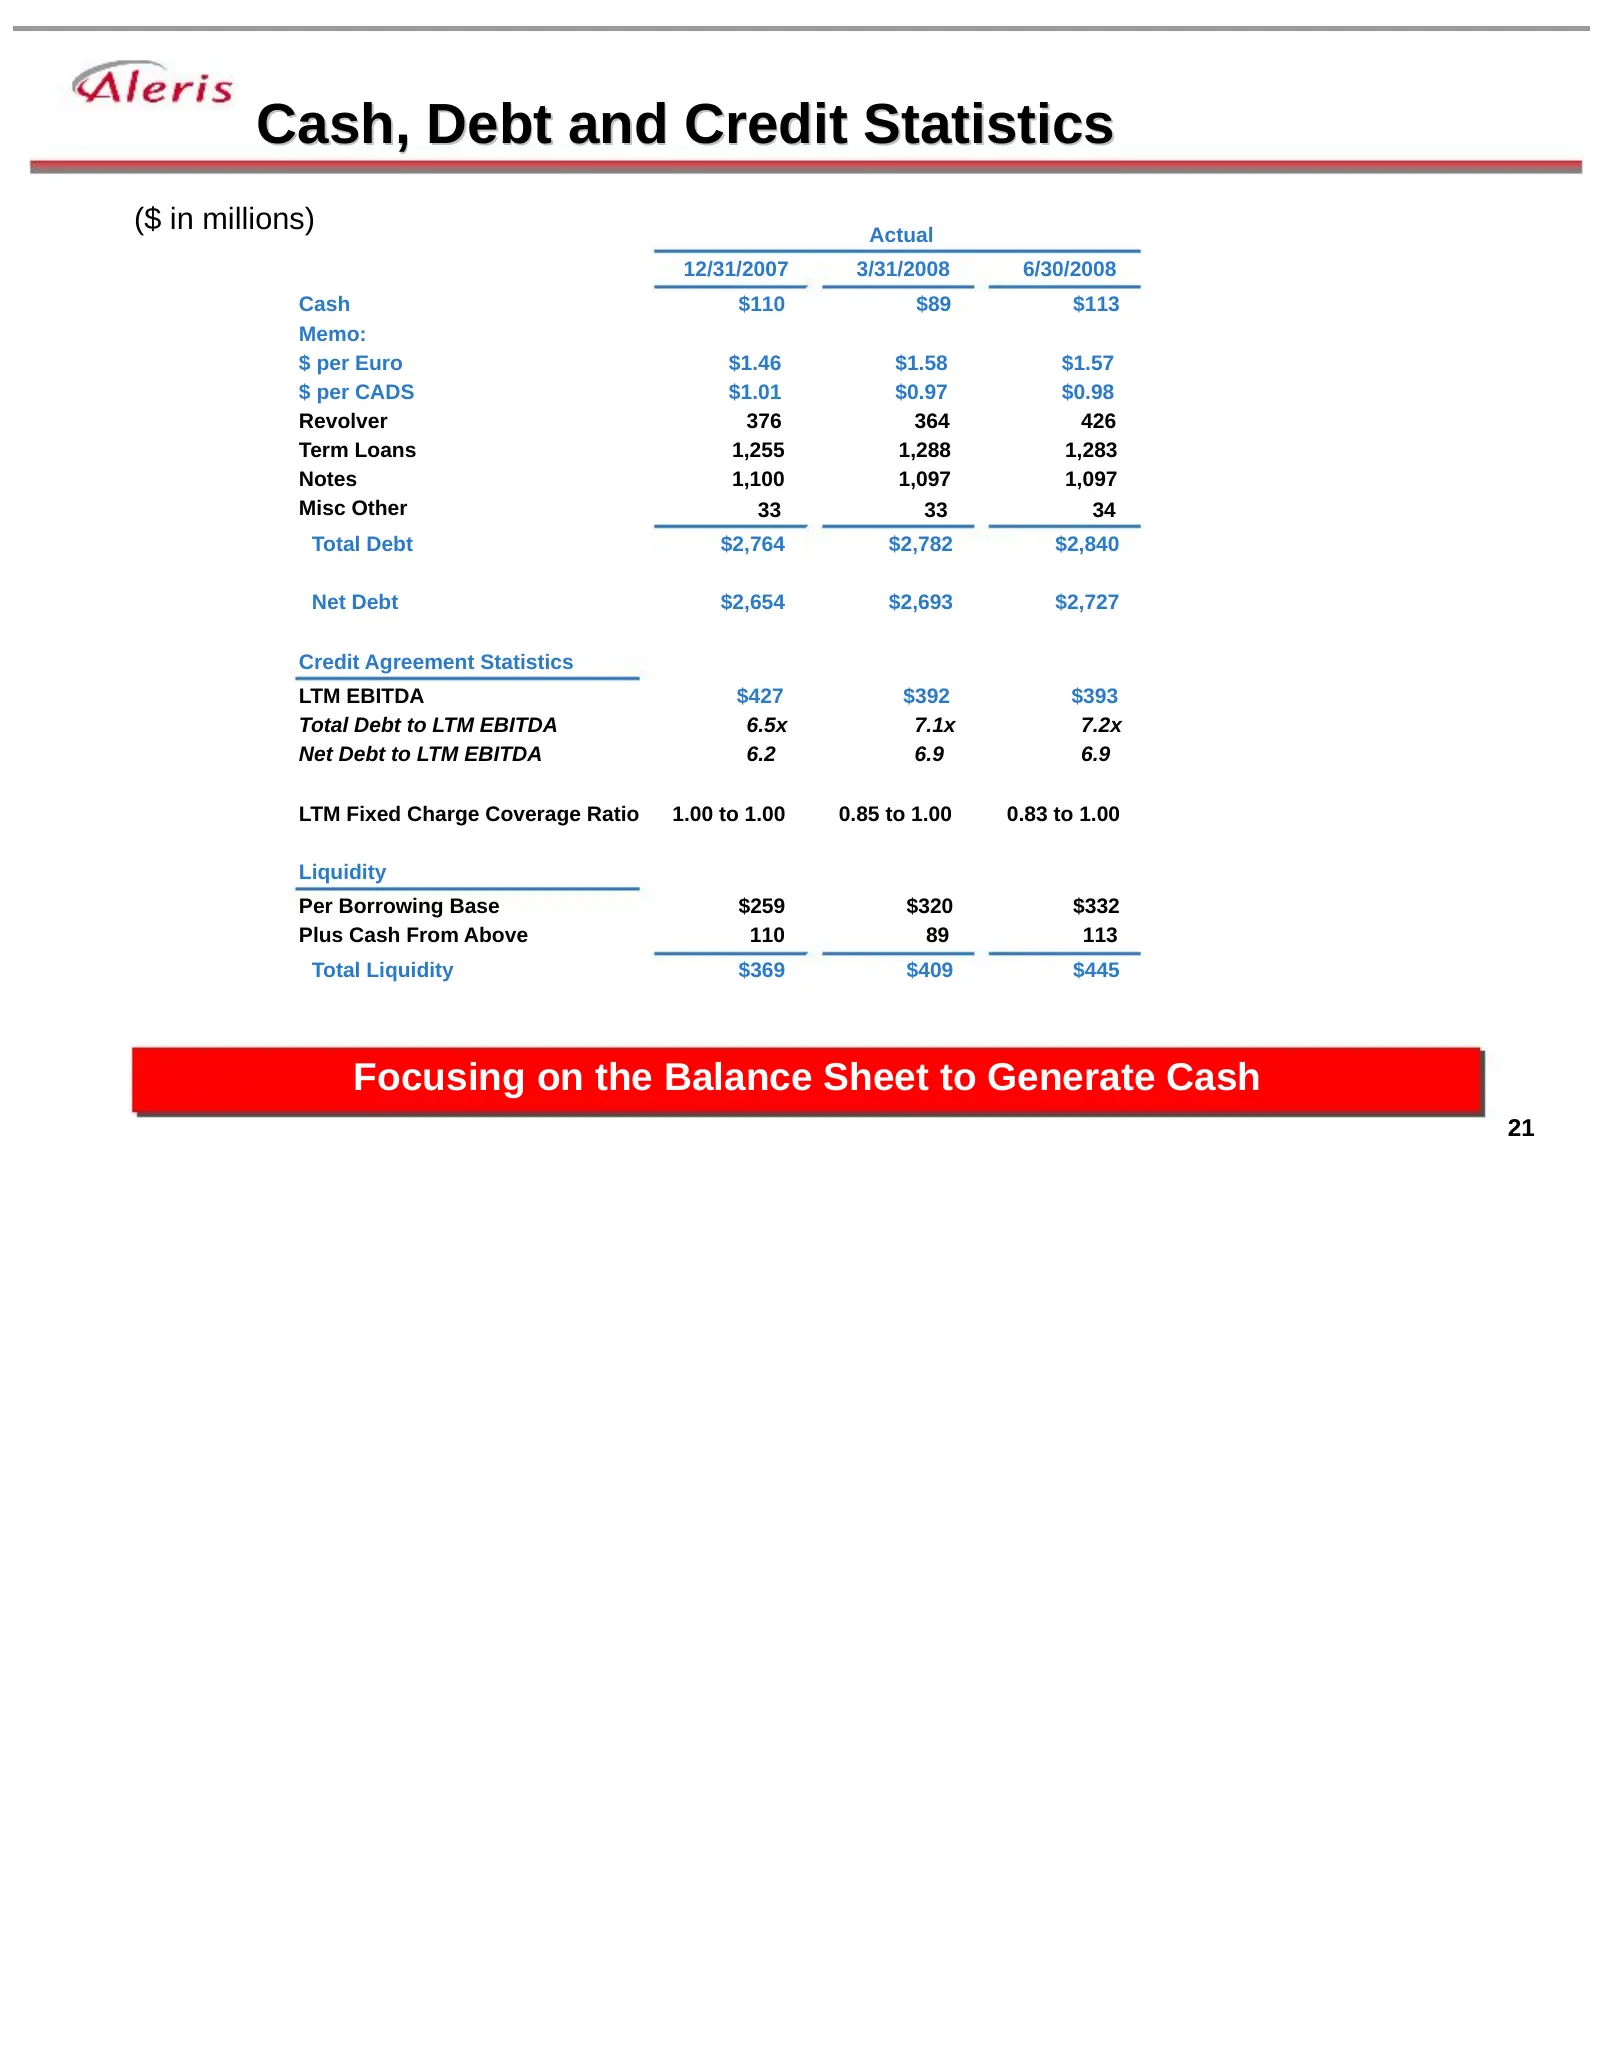
Cash, Debt and Credit Statistics ($ in millions) Actual 12/31/2007 3/31/2008 6/30/2008 Cash $110 $89 $113 Memo: $ per Euro $1.46 $1.58 $1.57 $ per CADS $1.01 $0.97 $0.98 Revolver 376 364 426 Term Loans 1,255 1,288 1,283 Notes 1,100 1,097 1,097 Misc Other 33 33 34 Total Debt $2,764 $2,782 $2,840 Net
Slide 22: LME History
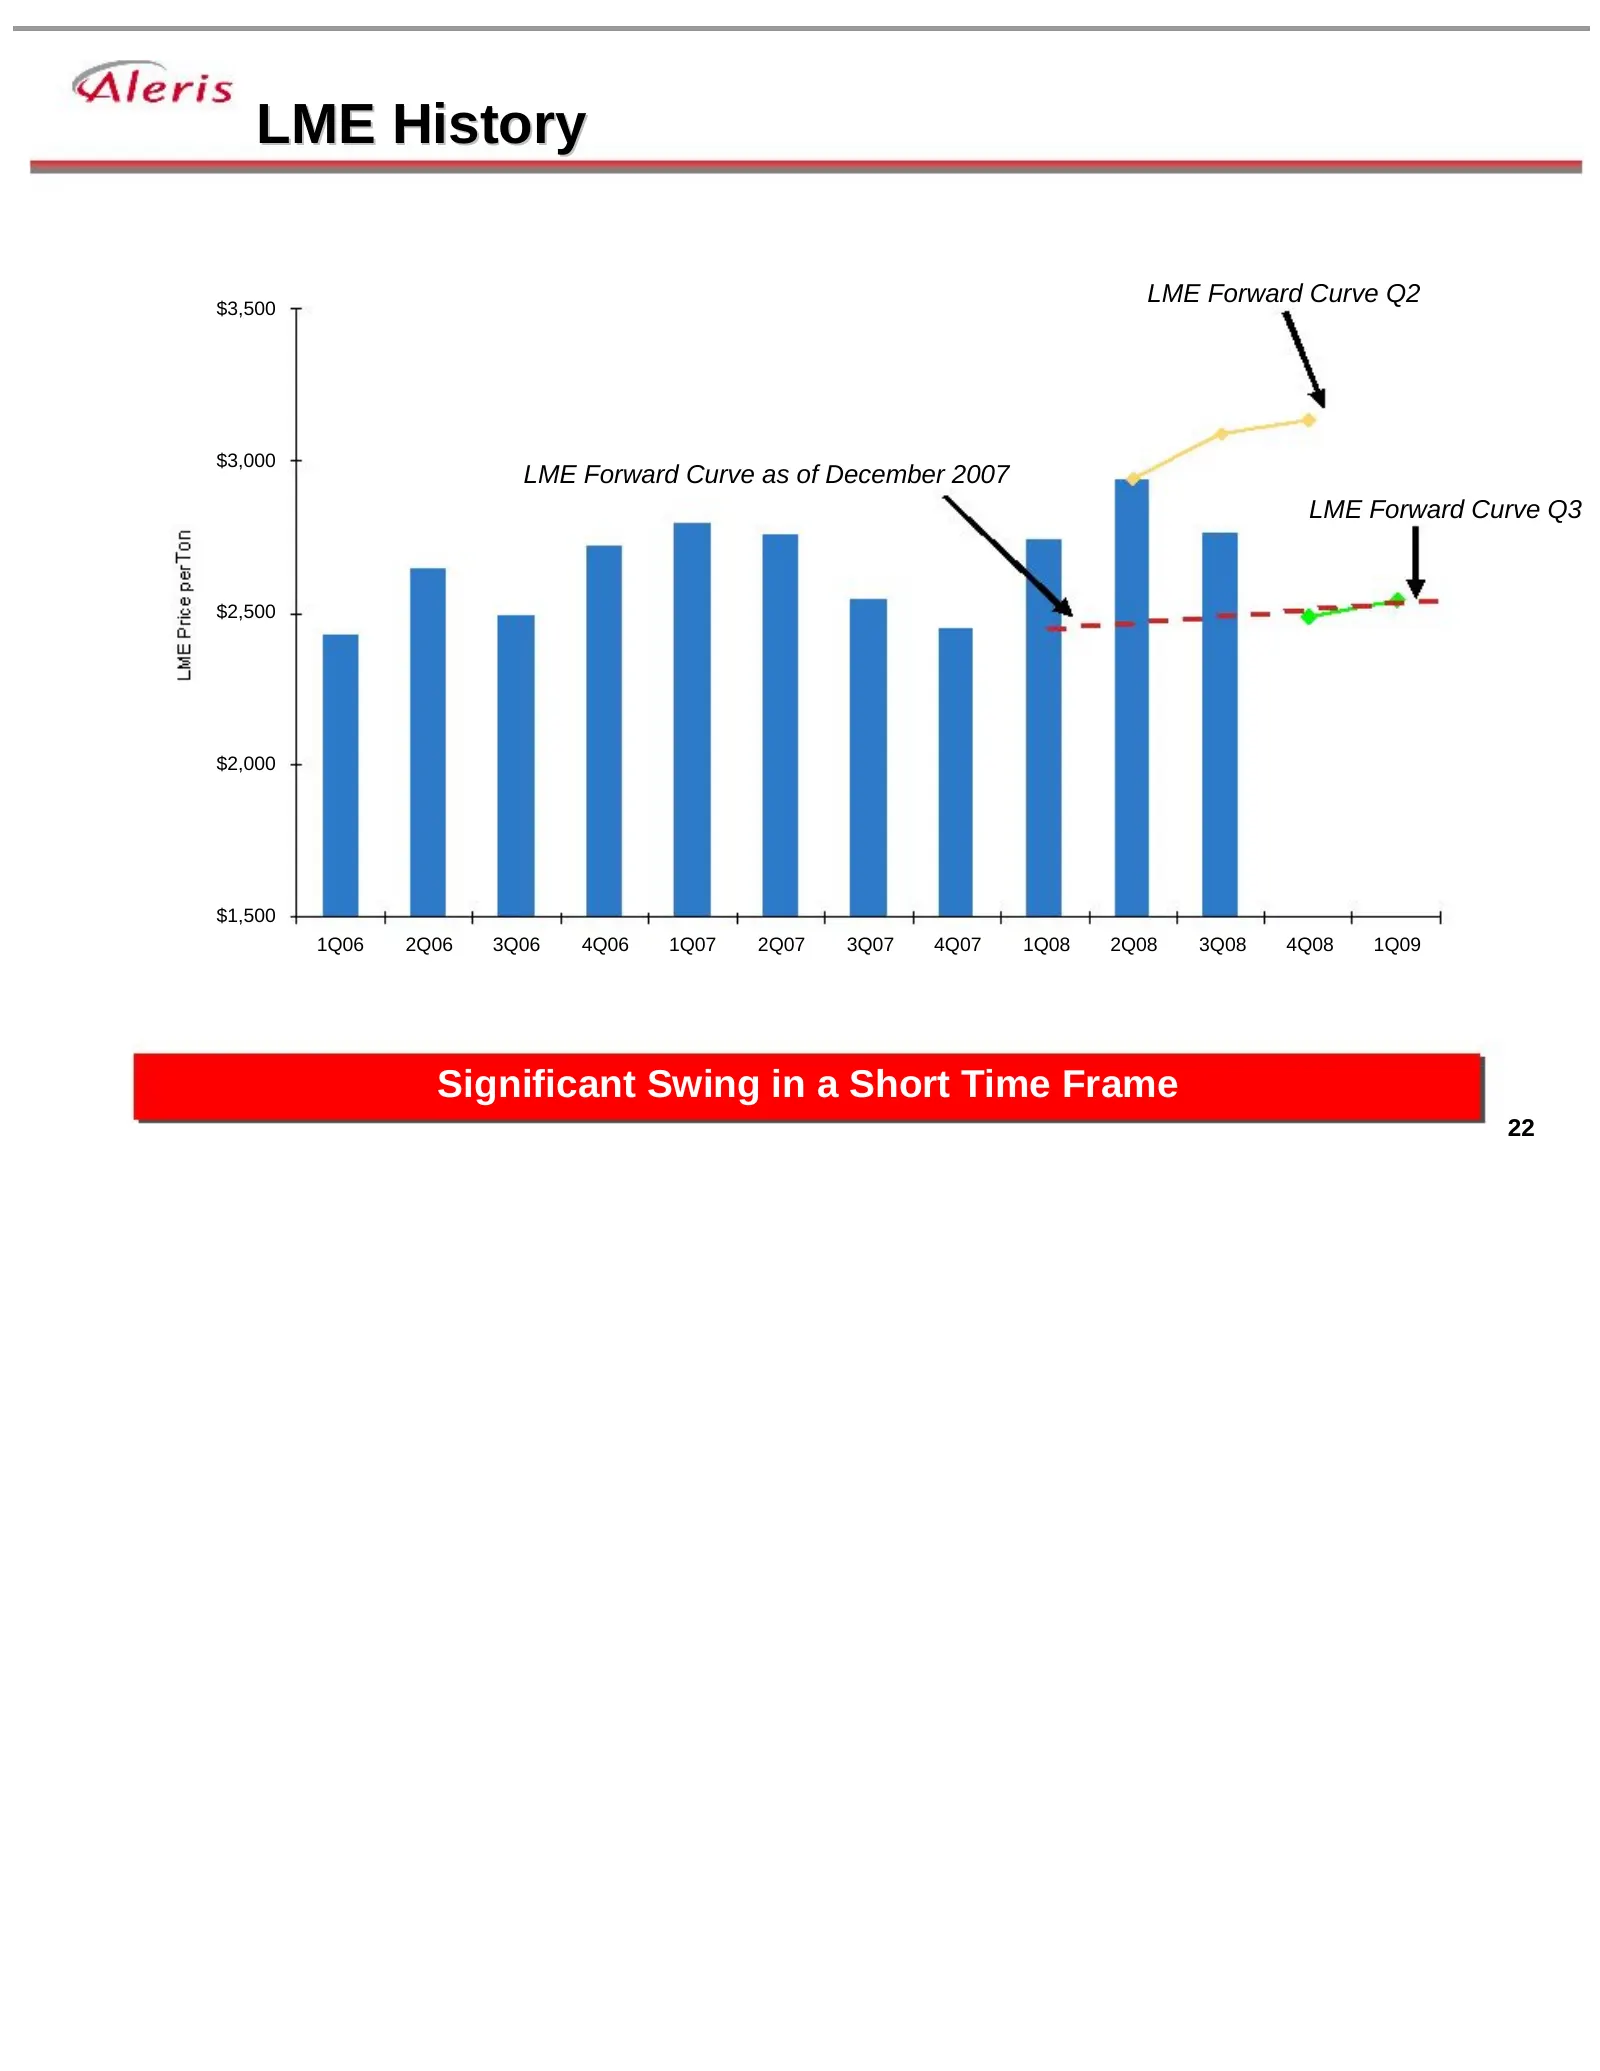
LME History $3,500 LME Forward Curve Q2 $3,000 LME Forward Curve as of December 2007 LME Forward Curve Q3 $2,500 $2,000 $1,500 1Q06 2Q06 3Q06 4Q06 1Q07 2Q07 3Q07 4Q07 1Q08 2Q08 3Q08 4Q08 1Q09 Significant Swing in a Short Time Frame 22
Slide 23: Borrowing Base Scenarios
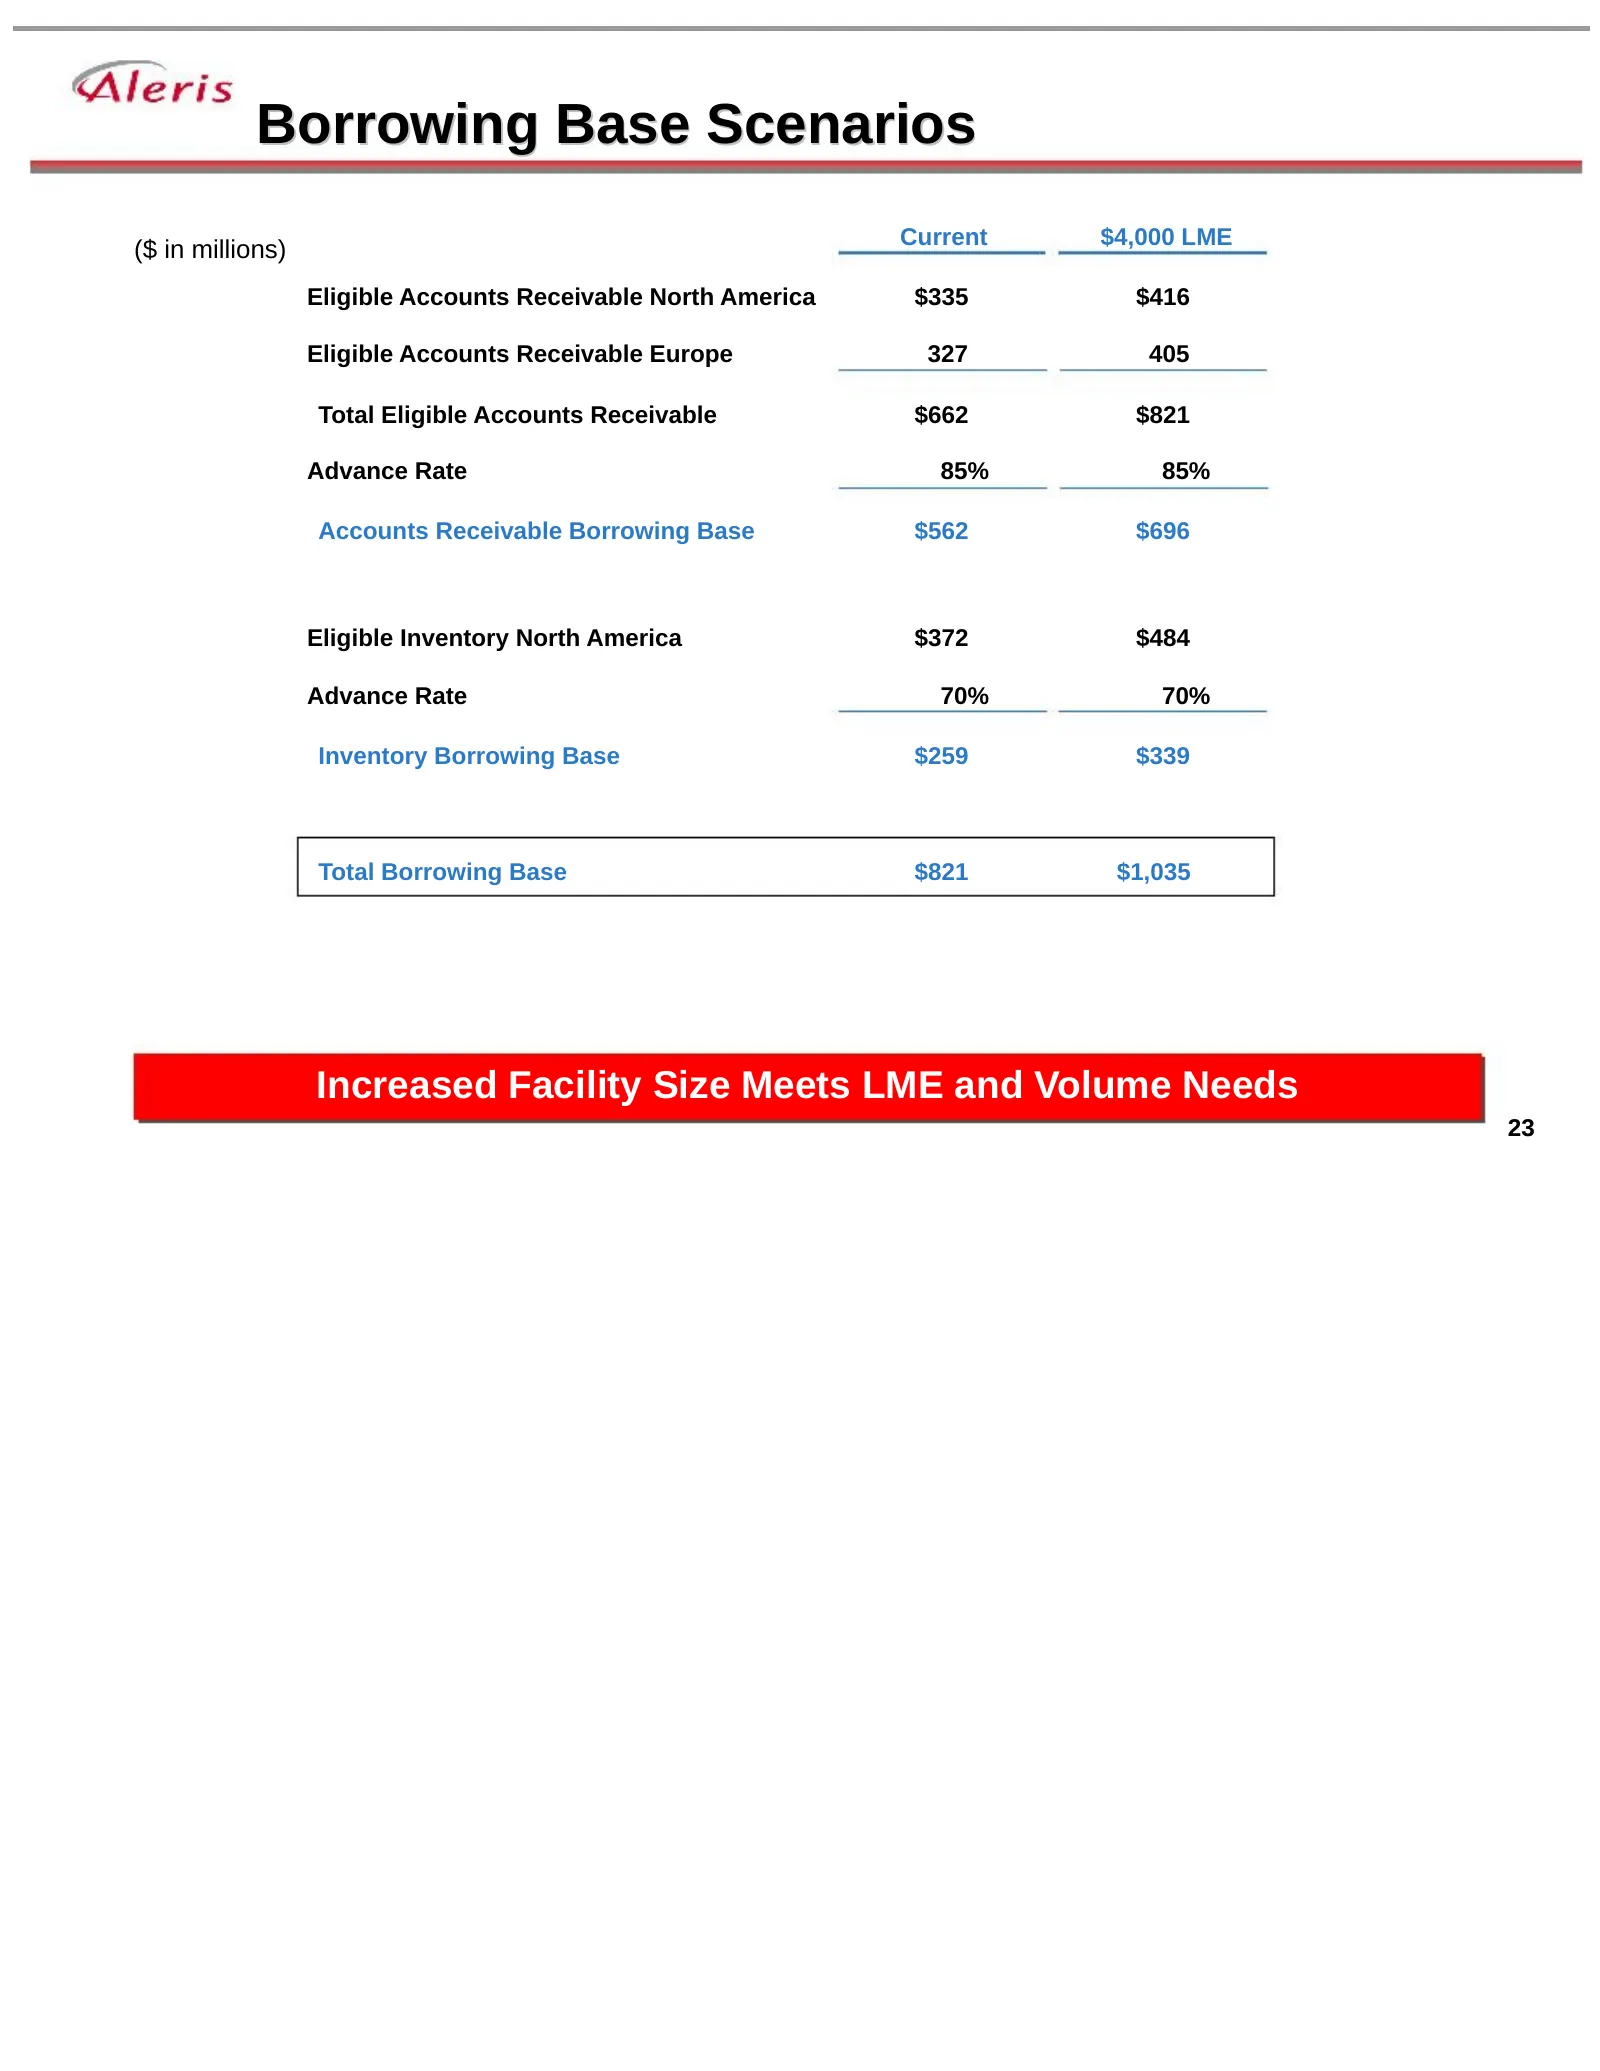
Borrowing Base Scenarios Current $4,000 LME ($ in millions) Eligible Accounts Receivable North America $335 $416 Eligible Accounts Receivable Europe 327 405 Total Eligible Accounts Receivable $662 $821 Advance Rate 85% 85% Accounts Receivable Borrowing Base $562 $696 Eligible Inventory North America
Slide 24: Summary
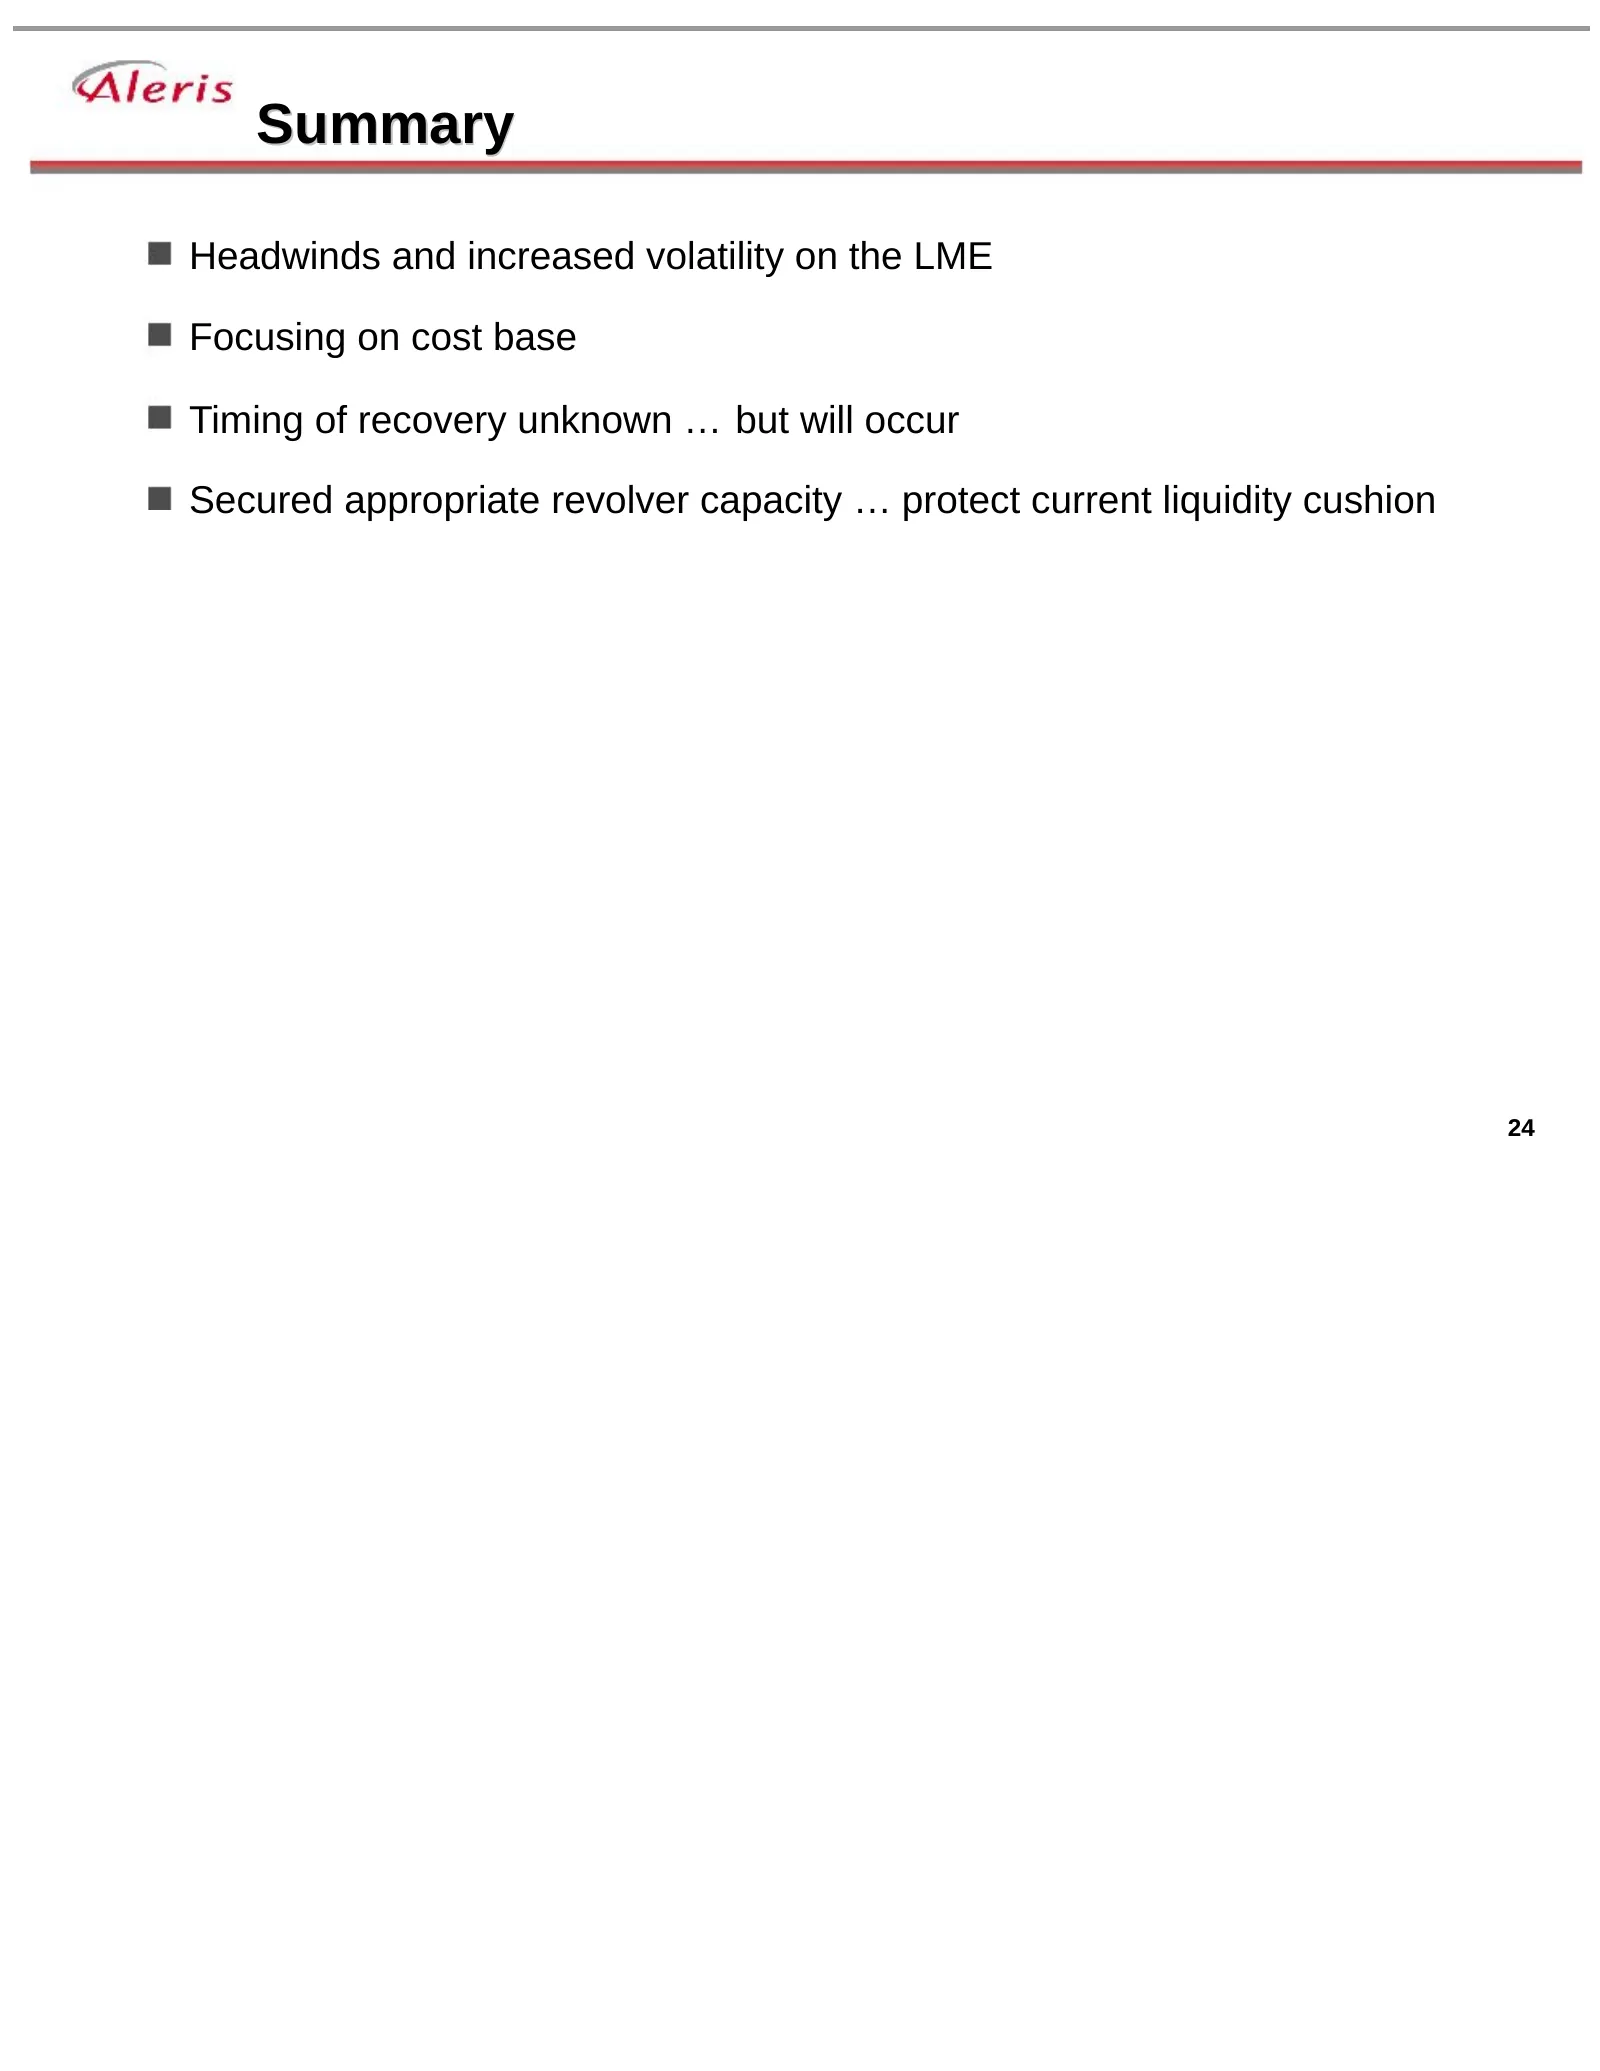
Summary Headwinds and increased volatility on the LME Focusing on cost base Timing of recovery unknown … but will occur Secured appropriate revolver capacity … protect current liquidity cushion 24

Slide 25: Questions and Answers
Aleris International, Inc.
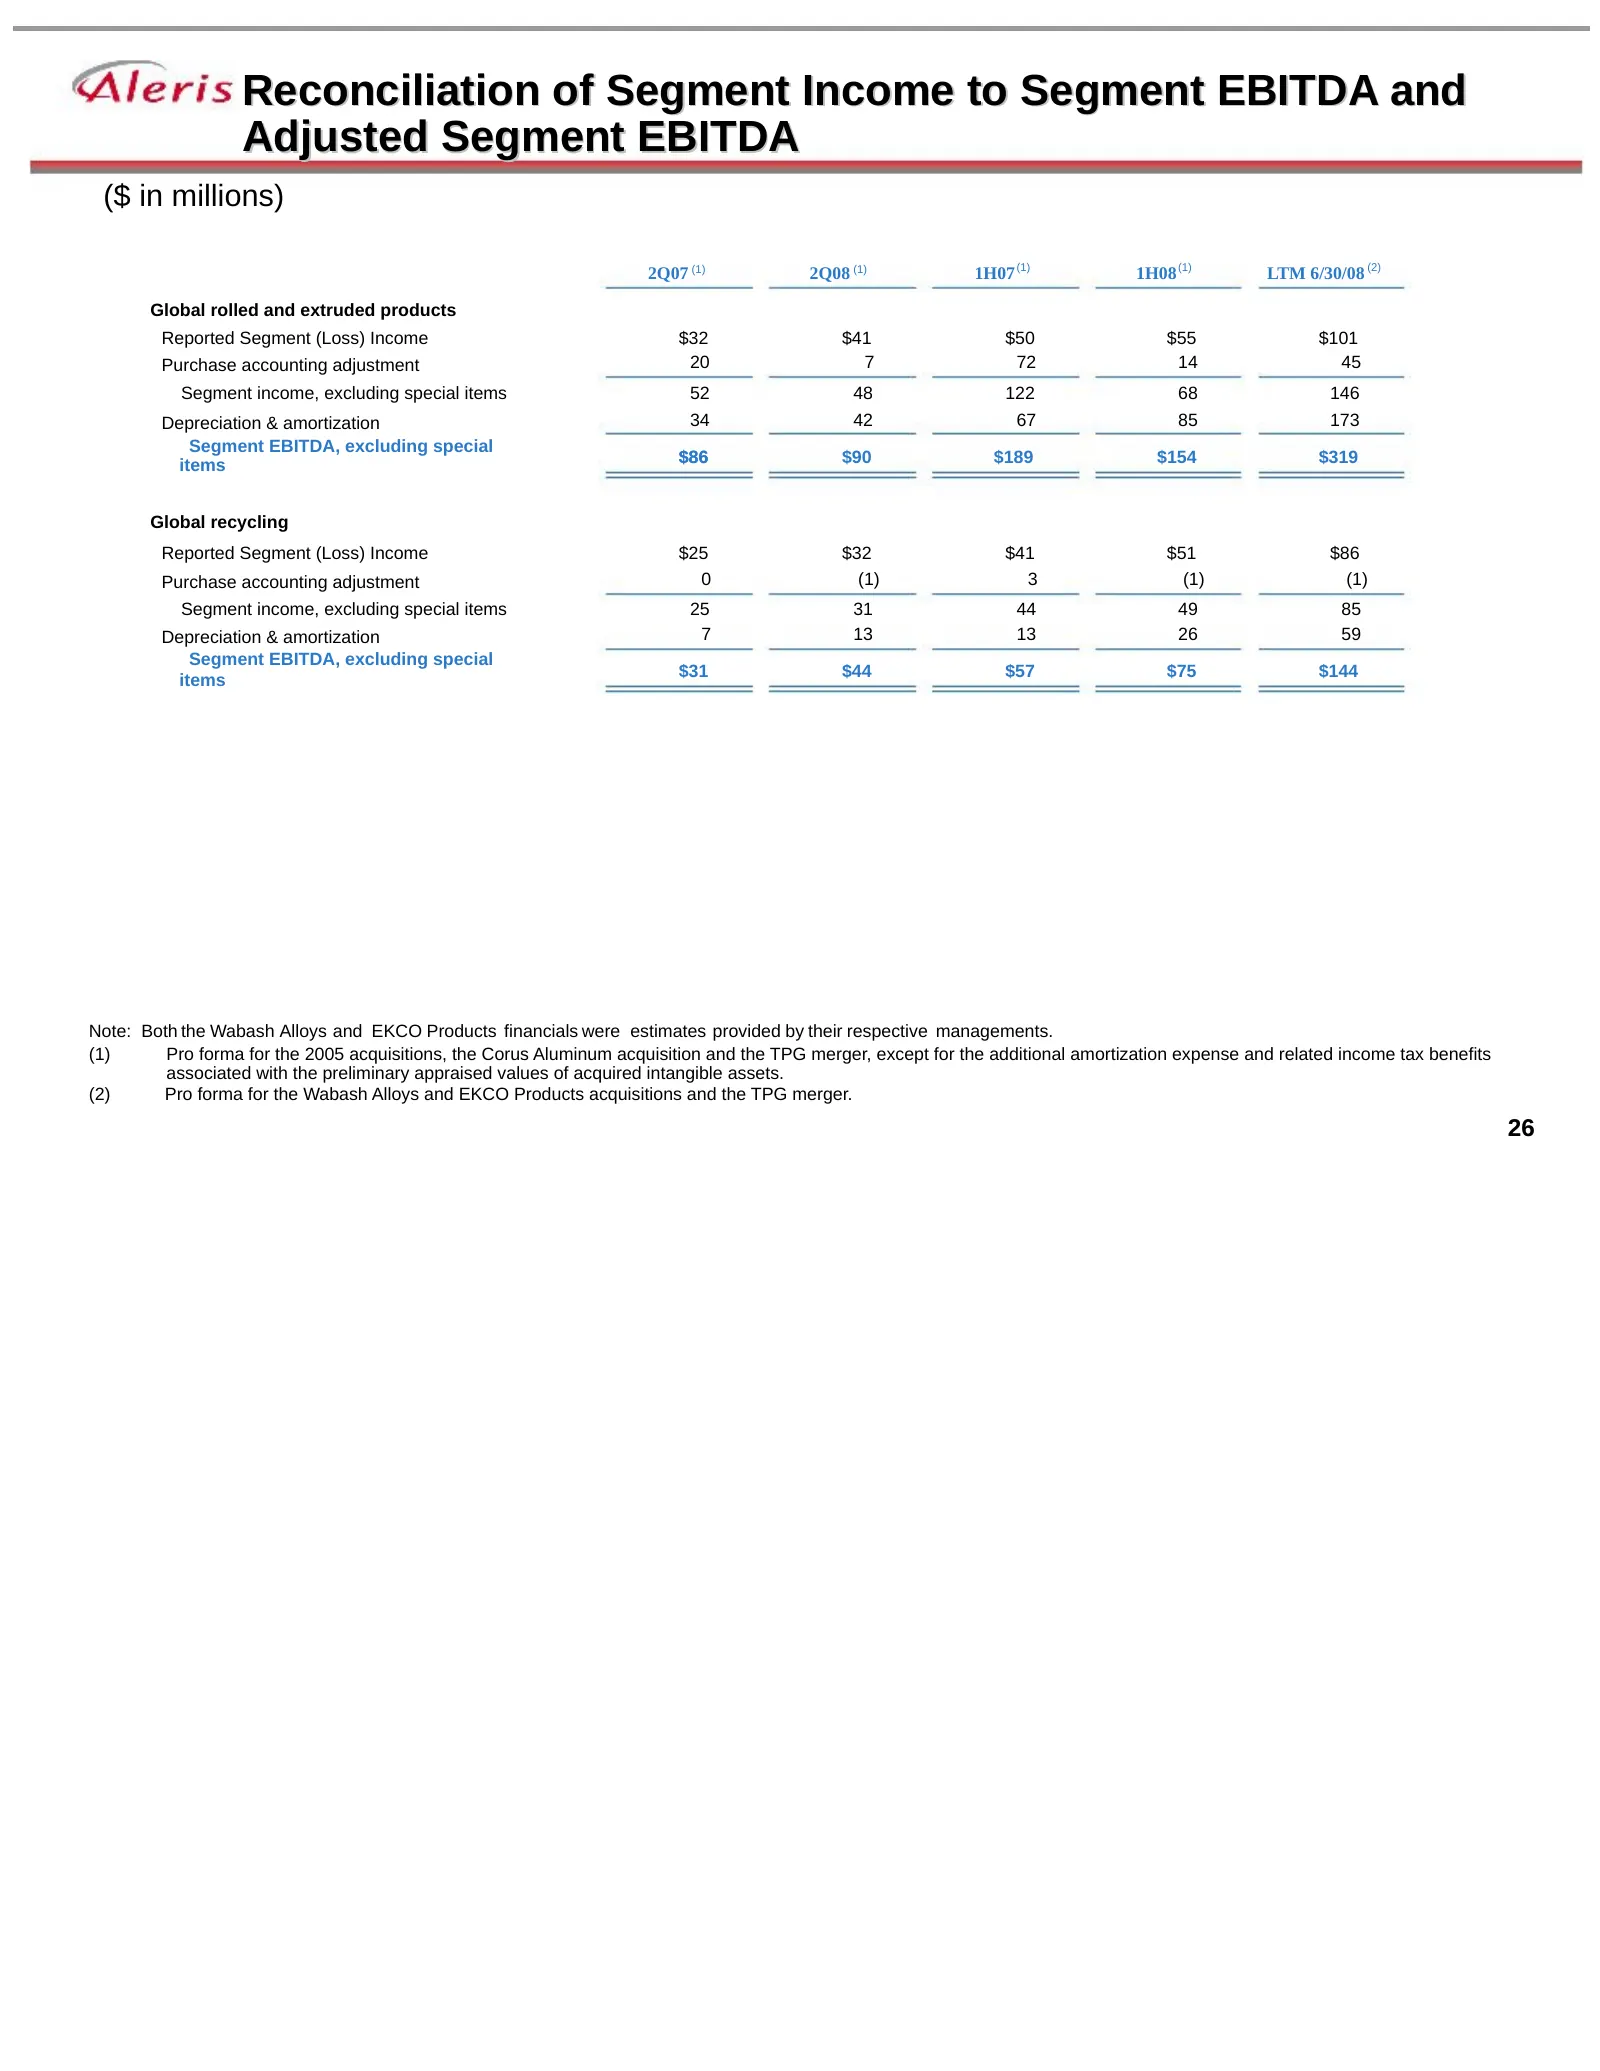
Slide 26: Reconciliation of Segment Income to Segment EBITDA and Adjusted Segment EBITDA
Reconciliation of Segment Income to Segment EBITDA and Adjusted Segment EBITDA ($ in millions) 2Q07 (1) 2Q08 (1) 1H07 (1) 1H08 (1) LTM 6/30/08 (2) Global rolled and extruded products Reported Segment (Loss) Income $32 $41 $50 $55 $101 Purchase accounting adjustment 20 7 72 14 45 Segment income, excl
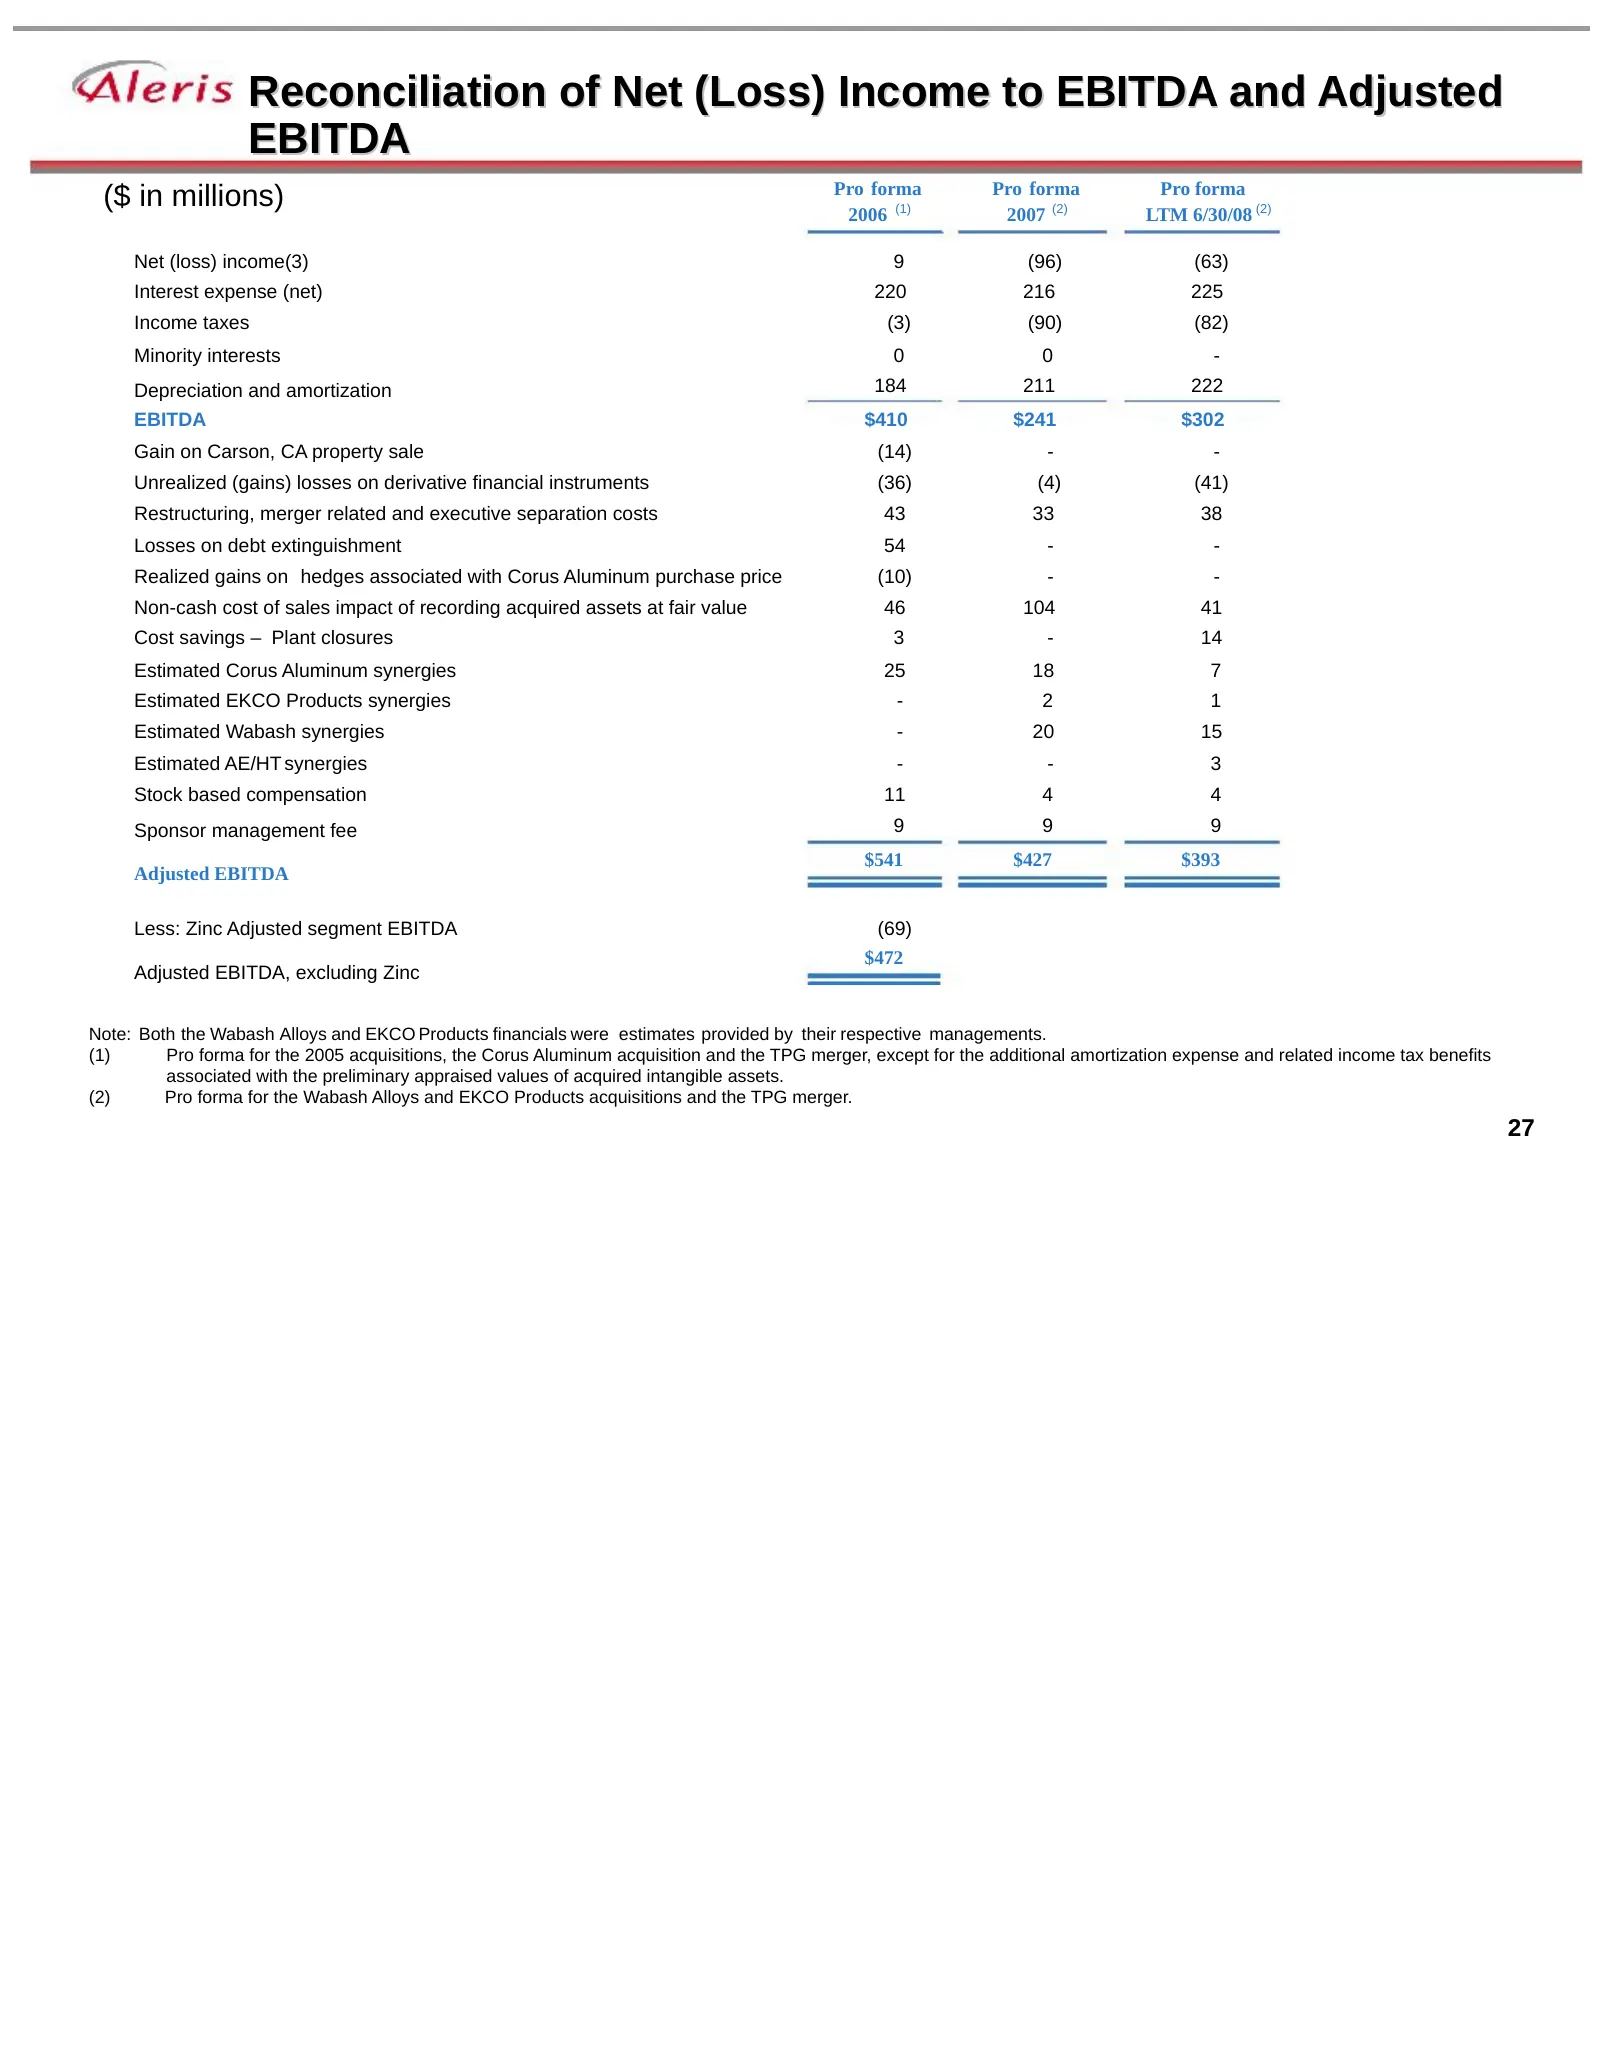
Slide 27: Reconciliation of Net (Loss) Income to EBITDA and Adjusted EBITDA
Reconciliation of Net (Loss) Income to EBITDA and Adjusted EBITDA Pro forma Pro forma Pro forma ($ in millions) 2006 (1) 2007 (2) LTM 6/30/08 (2) Net (loss) income(3) 9 (96) (63) Interest expense (net) 220 216 225 Income taxes (3) (90) (82) Minority interests 0 0 - Depreciation and amortization 184
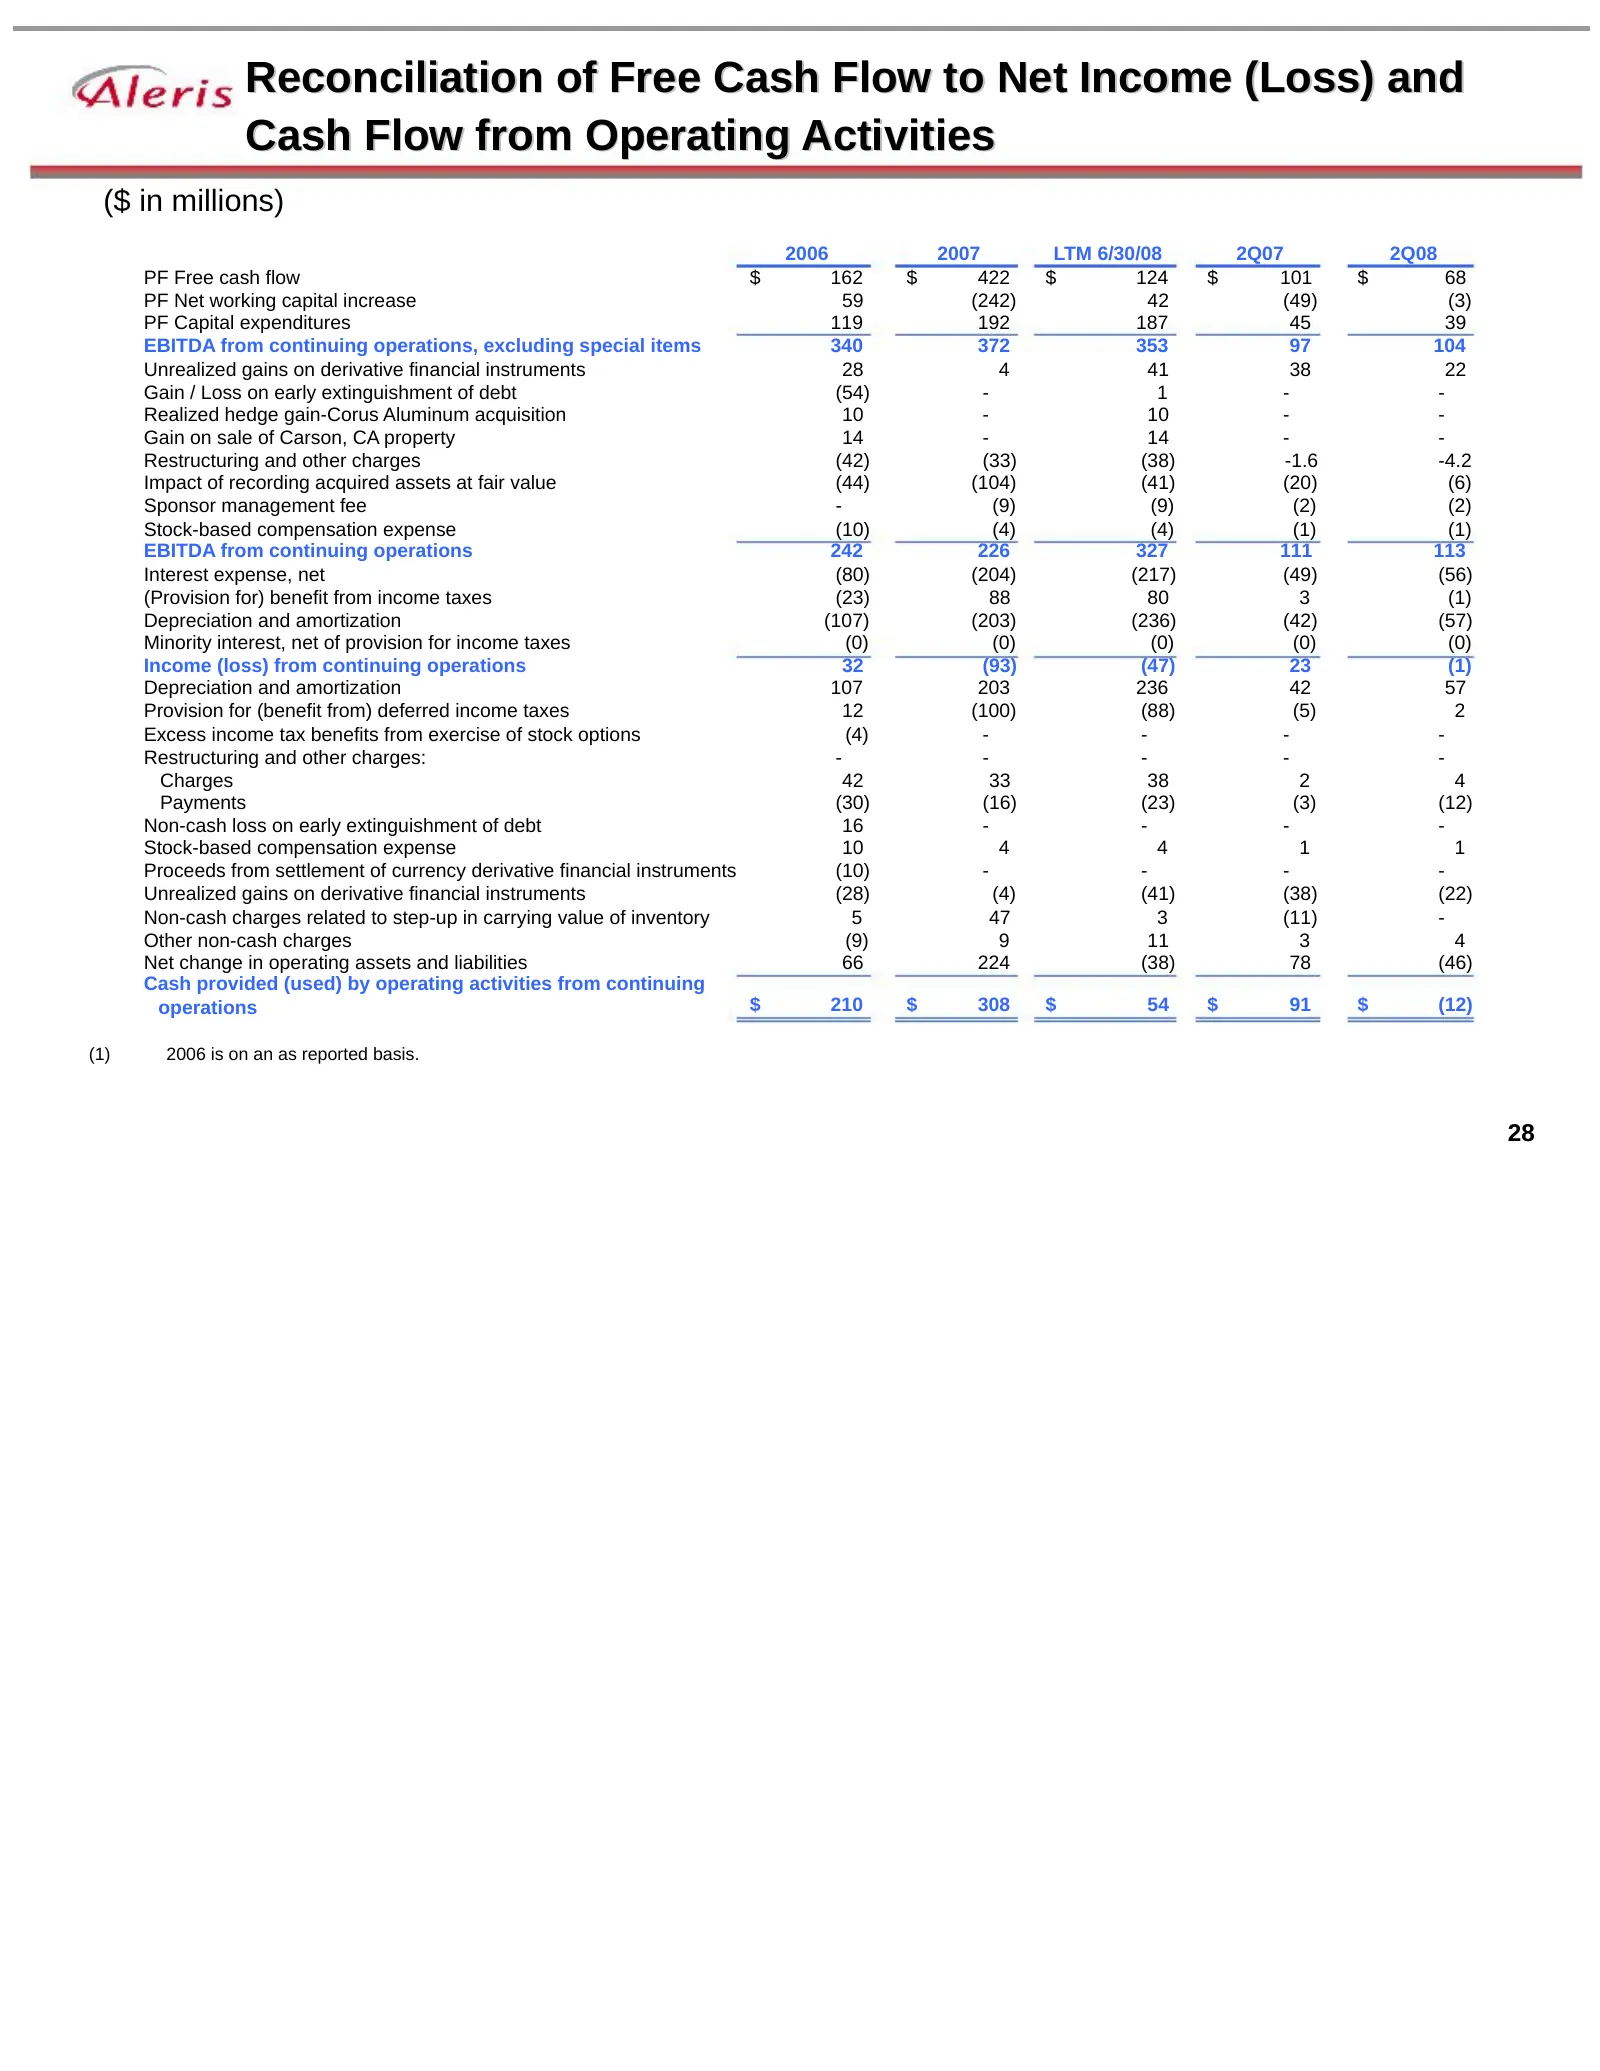
Slide 28: Reconciliation of Free Cash Flow to Net Income (Loss) and Cash Flow from Operating Activities
Reconciliation of Free Cash Flow to Net Income (Loss) and Cash Flow from Operating Activities ($ in millions) 2006 2007 LTM 6/30/08 2Q07 2Q08 PF Free cash flow $ 162 $ 422 $ 124 $ 101 $ 68 PF Net working capital increase 59 (242) 42 (49) (3) PF Capital expenditures 119 192 187 45 39 EBITDA from cont
Source: SEC EDGAR · 8-K filed Sep 25, 2008
More decks from Aleris International Inc
 2008 Bank of America Credit Conference26 slides · Nov 21, 2008
 FY2007 Earnings Presentation33 slides · Mar 31, 2008
 FY2007 Earnings Presentation33 slides · Mar 27, 2008
 Bear Stearns Commodity and Capital Goods Conference November 200723 slides · Nov 28, 2007
 Investor Presentation (October 2007)14 slides · Oct 3, 2007
 Debt Investor Presentation (March 2007)6 slides · Mar 7, 2007