Santander Holdings USA Inc · NYSE:SNUS/PH
Santander Holdings USA — Debt Investor Presentation (November 2022)
33 slides from Santander Holdings USA's debt investor presentation, Nov 14, 2022
Slide 1: Third Quarter 2022 Fixed Income Investor Presentation
November 14, 2022 SANTANDER HOLDINGS USA, INC. Third Quarter 2022 Fixed Income Investor Presentation «> Santander
Slide 2: Important Information
Important Information This presentation of Santander Holdings USA, Inc. ("SHUSA") contains “forward-looking statements" within the meaning of the Private Securities Litigation Reform Act of 1995 regarding the Financial condition, results of operations, business plans and future performance of SHUSA,
Slide 3: Index
Index At a Glance Results Capital & Appendix Liquidity
Slide 4: Santander Group
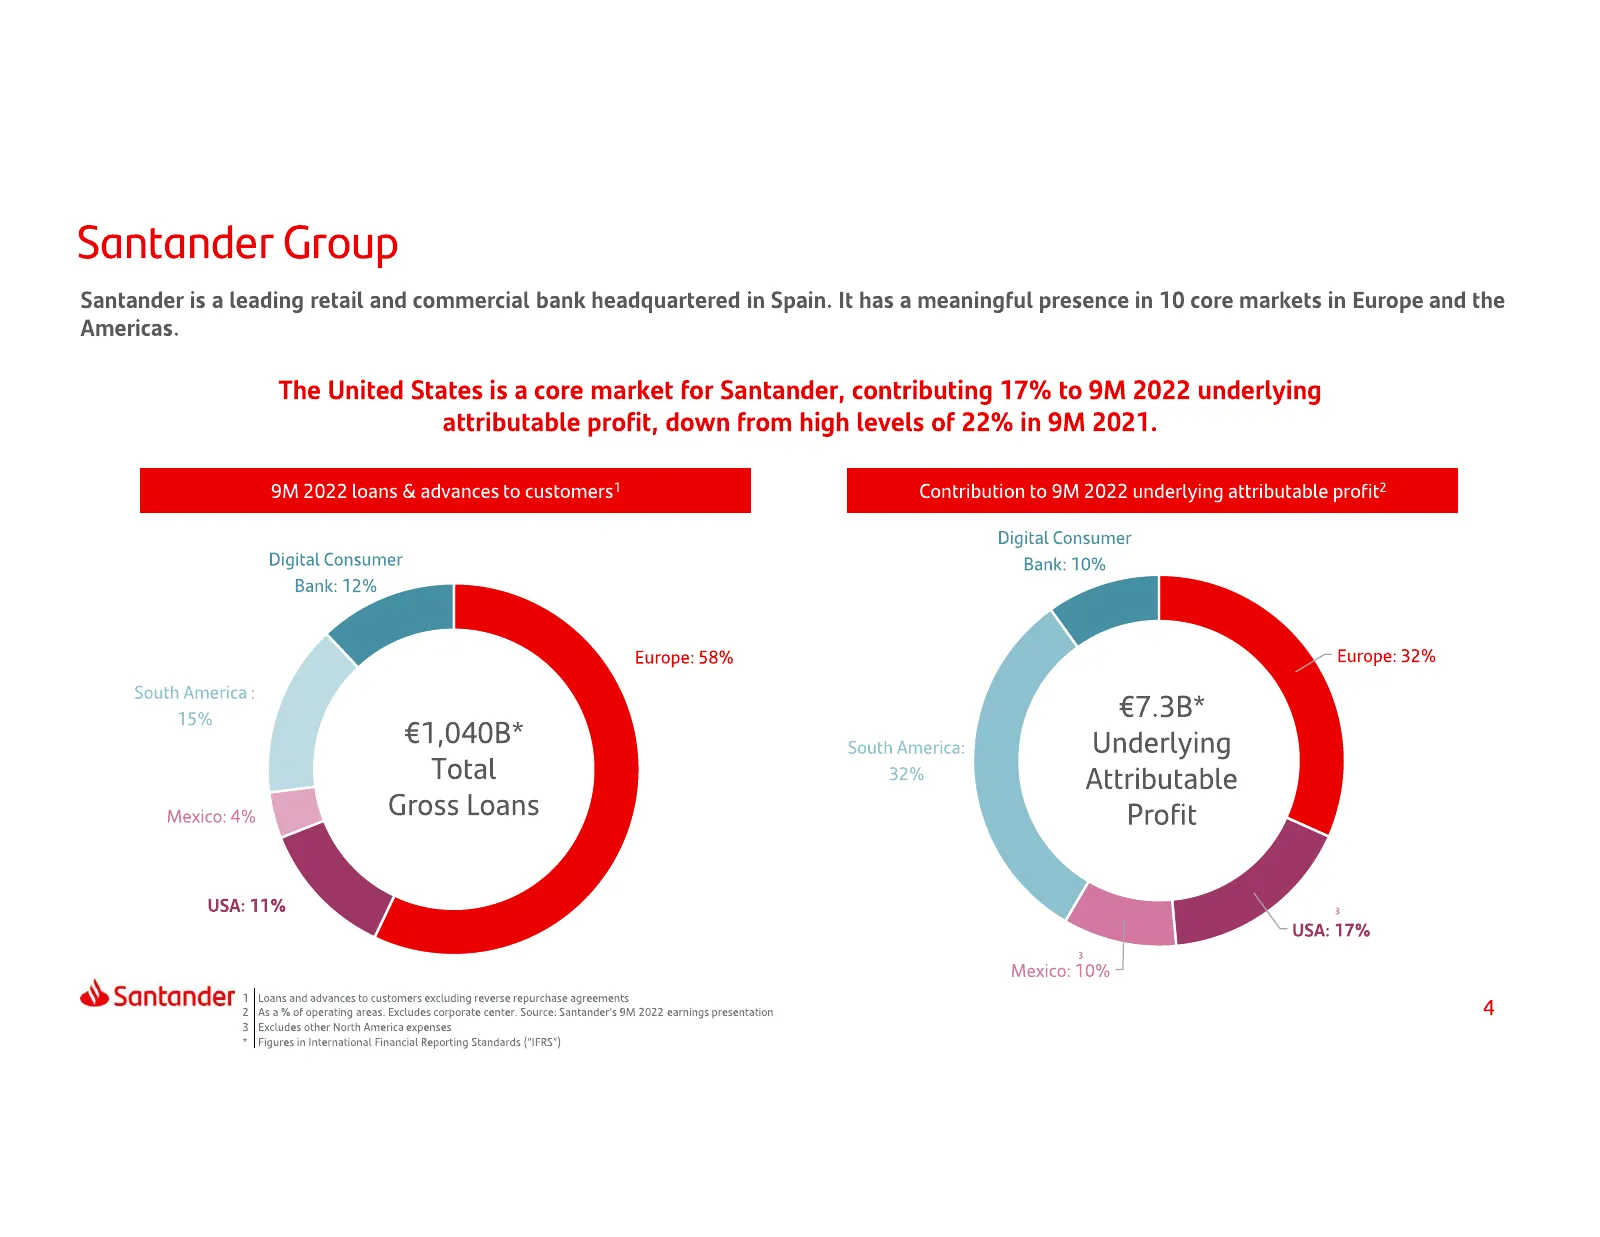
Santander Group Santander is a leading retail and commercial bank headquartered in Spain. It has a meaningful presence in 10 core markets in Europe and the Americas. The United States is a core market for Santander, contributing 17% to 9M 2022 underlying attributable profit, down from high levels of
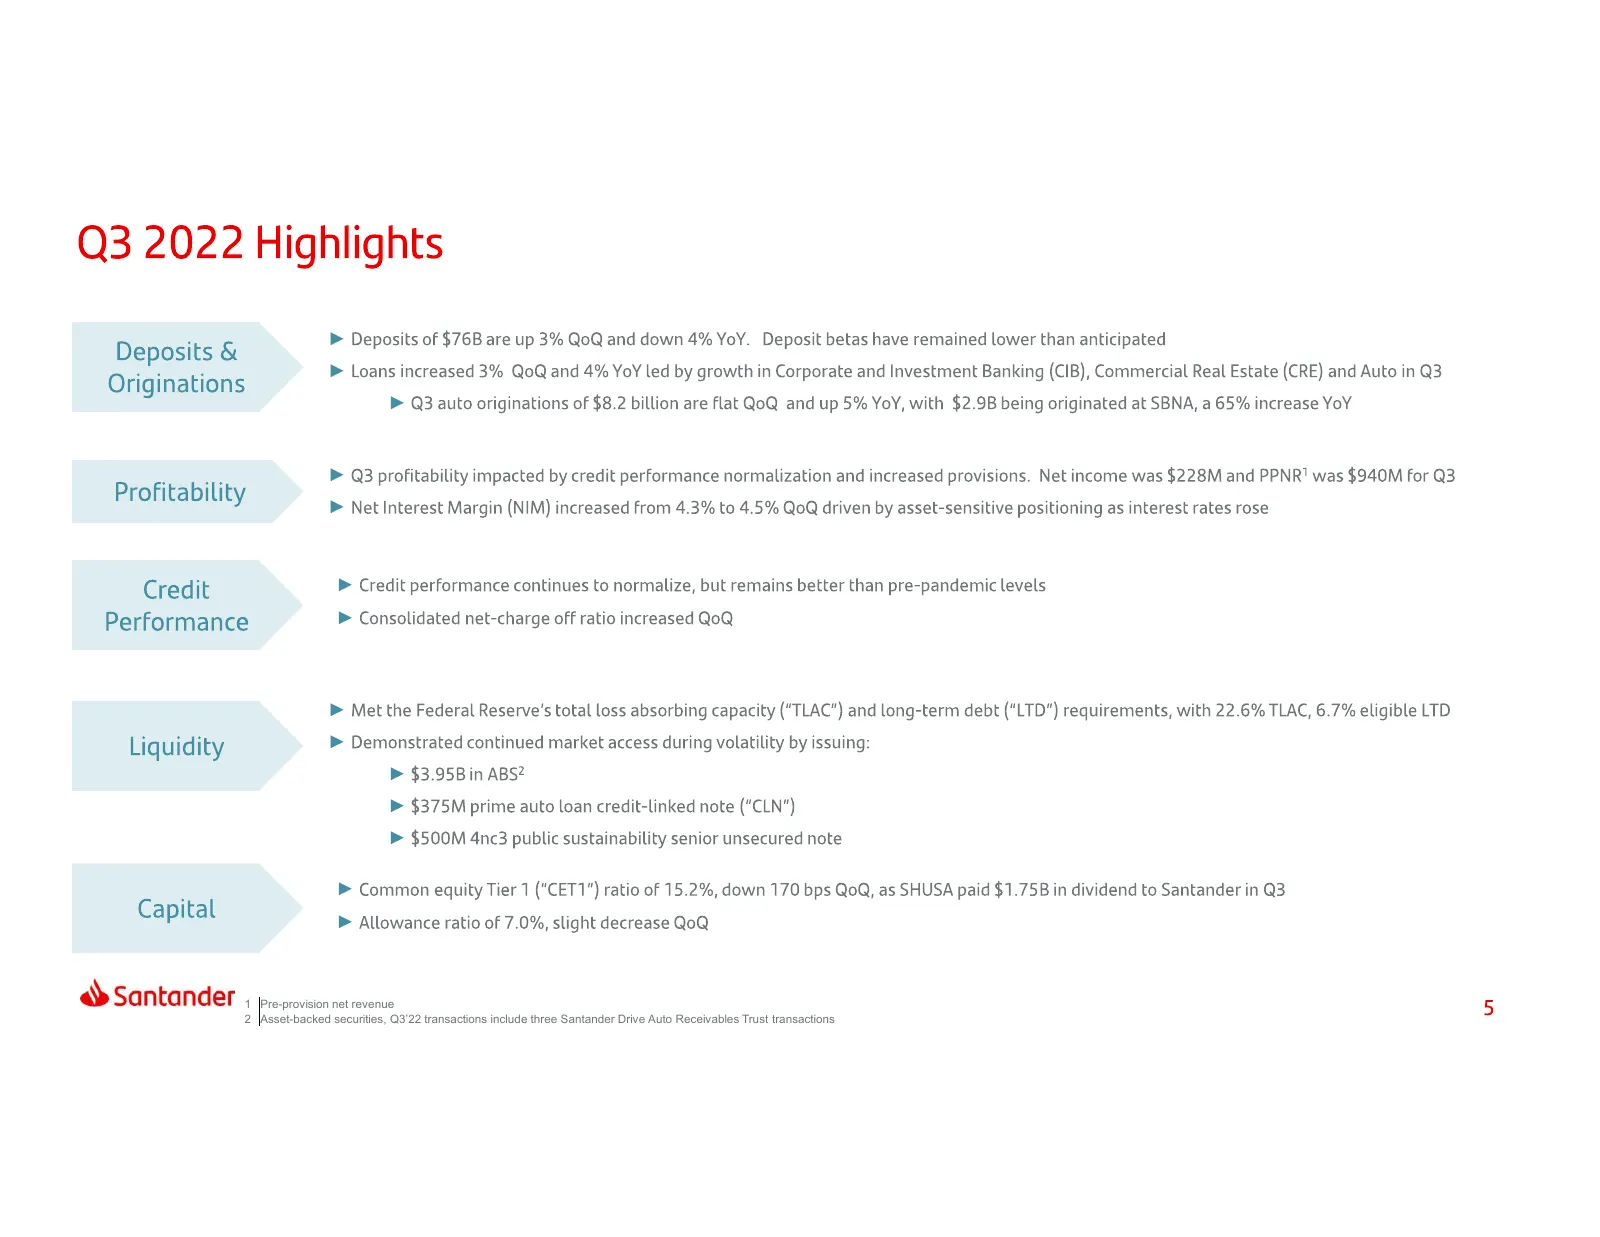
Slide 5: Third quarter highlights
► ► ► ► ► ► ► ► ► ► ► ► ► ► 1 Pre-provision net revenue 2 Asset-backed securities, Q3’22 transactions include three Santander Drive Auto Receivables Trust transactions
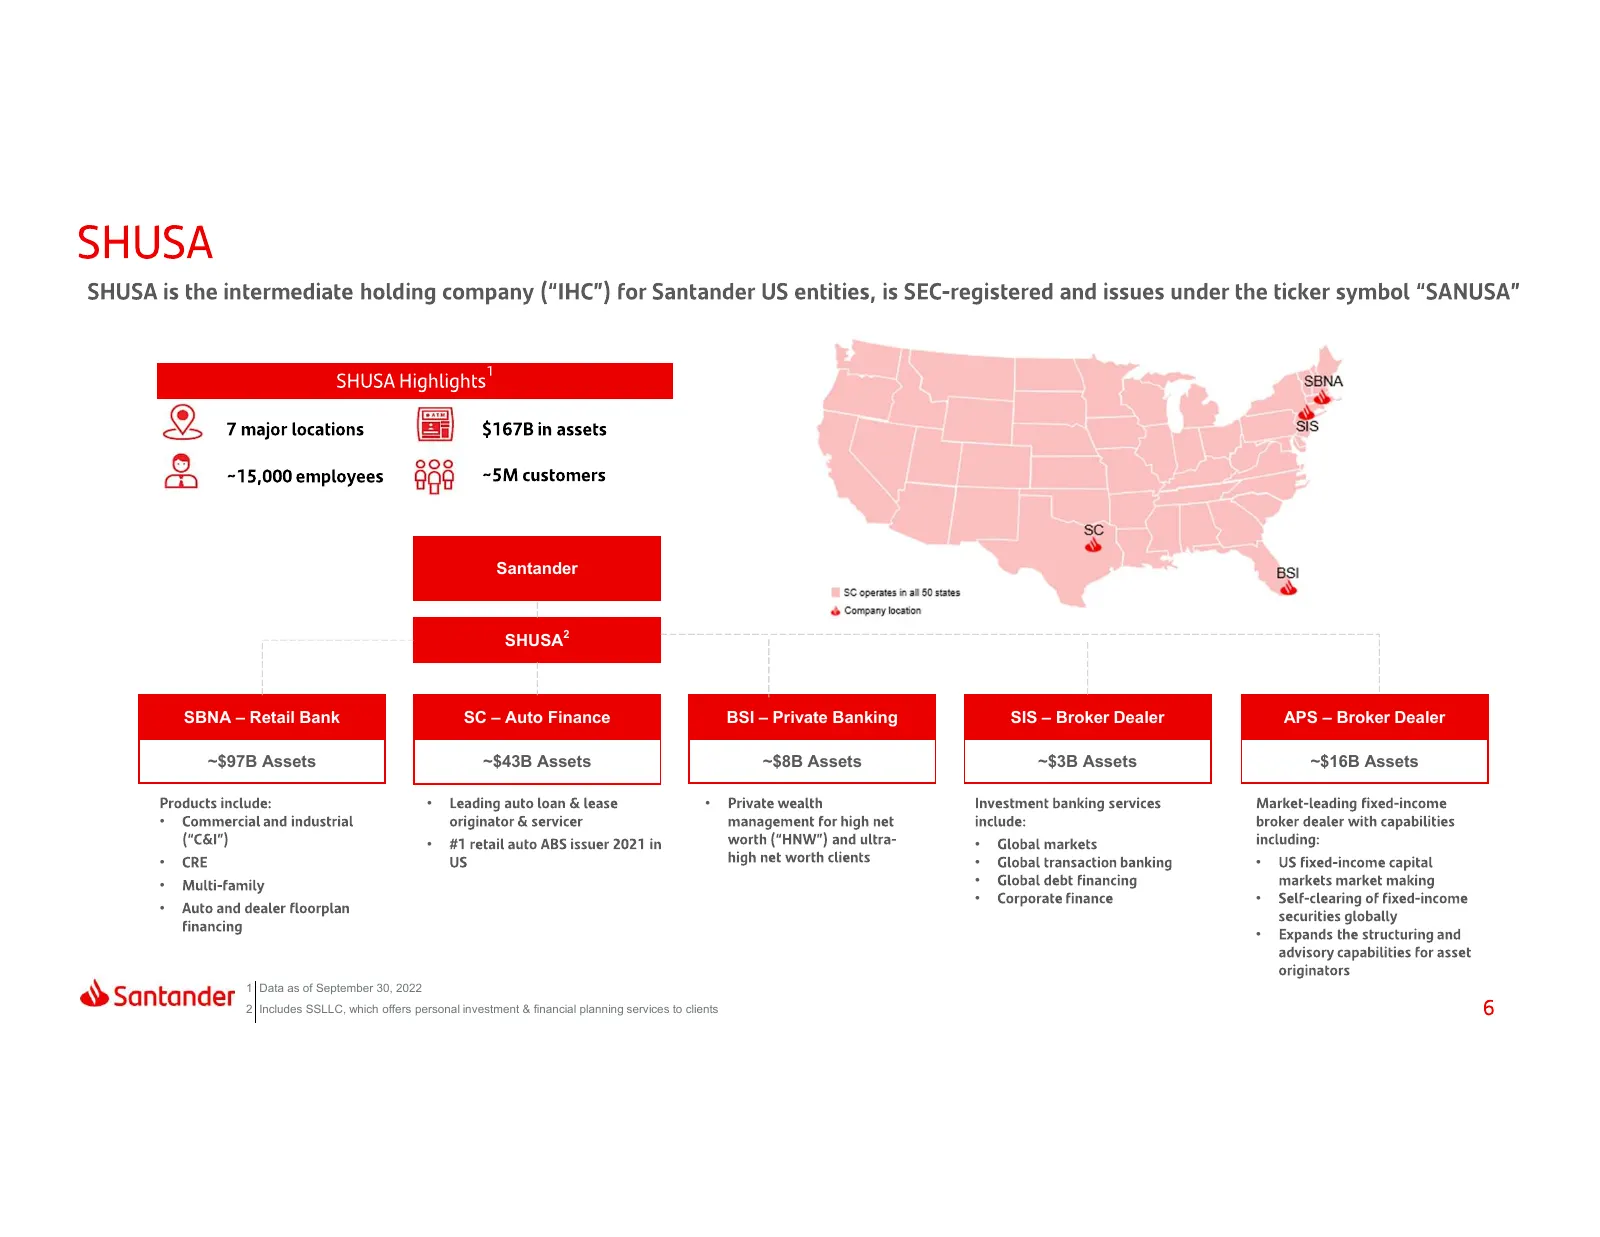
Slide 6: SHUSA structure and subsidiaries
Santander SHUSA2 SBNA – Retail Bank SC – Auto Finance BSI – Private Banking SIS – Broker Dealer APS – Broker Dealer ~$97B Assets ~$43B Assets ~$8B Assets ~$3B Assets ~$16B Assets • • • • • • • • • • • • • • 1 Data as of September 30, 2022 2 Includes SSLLC, which offers personal investment & financia
Slide 7: Index
Index At a Glance Results Capital & Appendix Liquidity
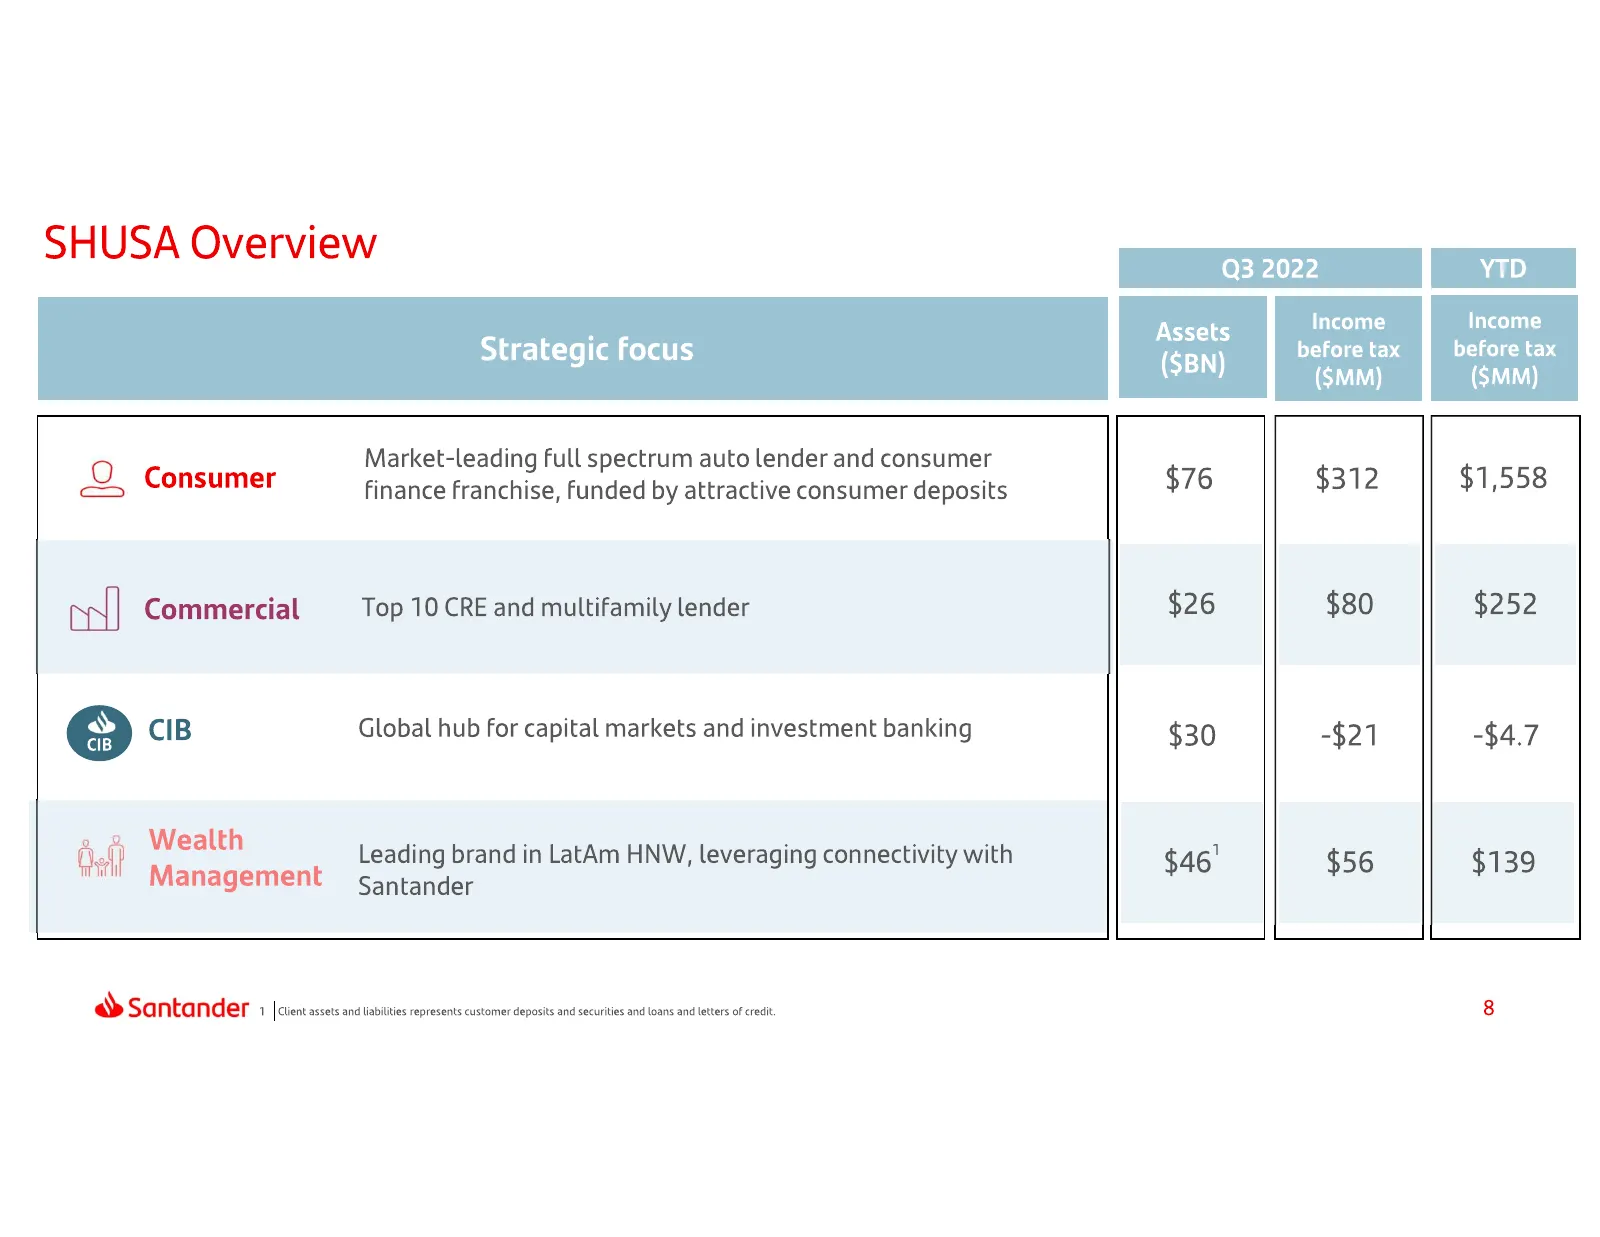
Slide 8: SHUSA Overview
SHUSA Overview Strategic focus Income before tax ($MM) Income before tax ($MM) Market-leading Full spectrum auto lender and consumer & Consumer finance franchise, Funded by attractive consumer deposits $76 $312 $1,558 ww] Commercial Top 10 CRE and multifamily lender $26 $80 $252 © CIB Global hub for
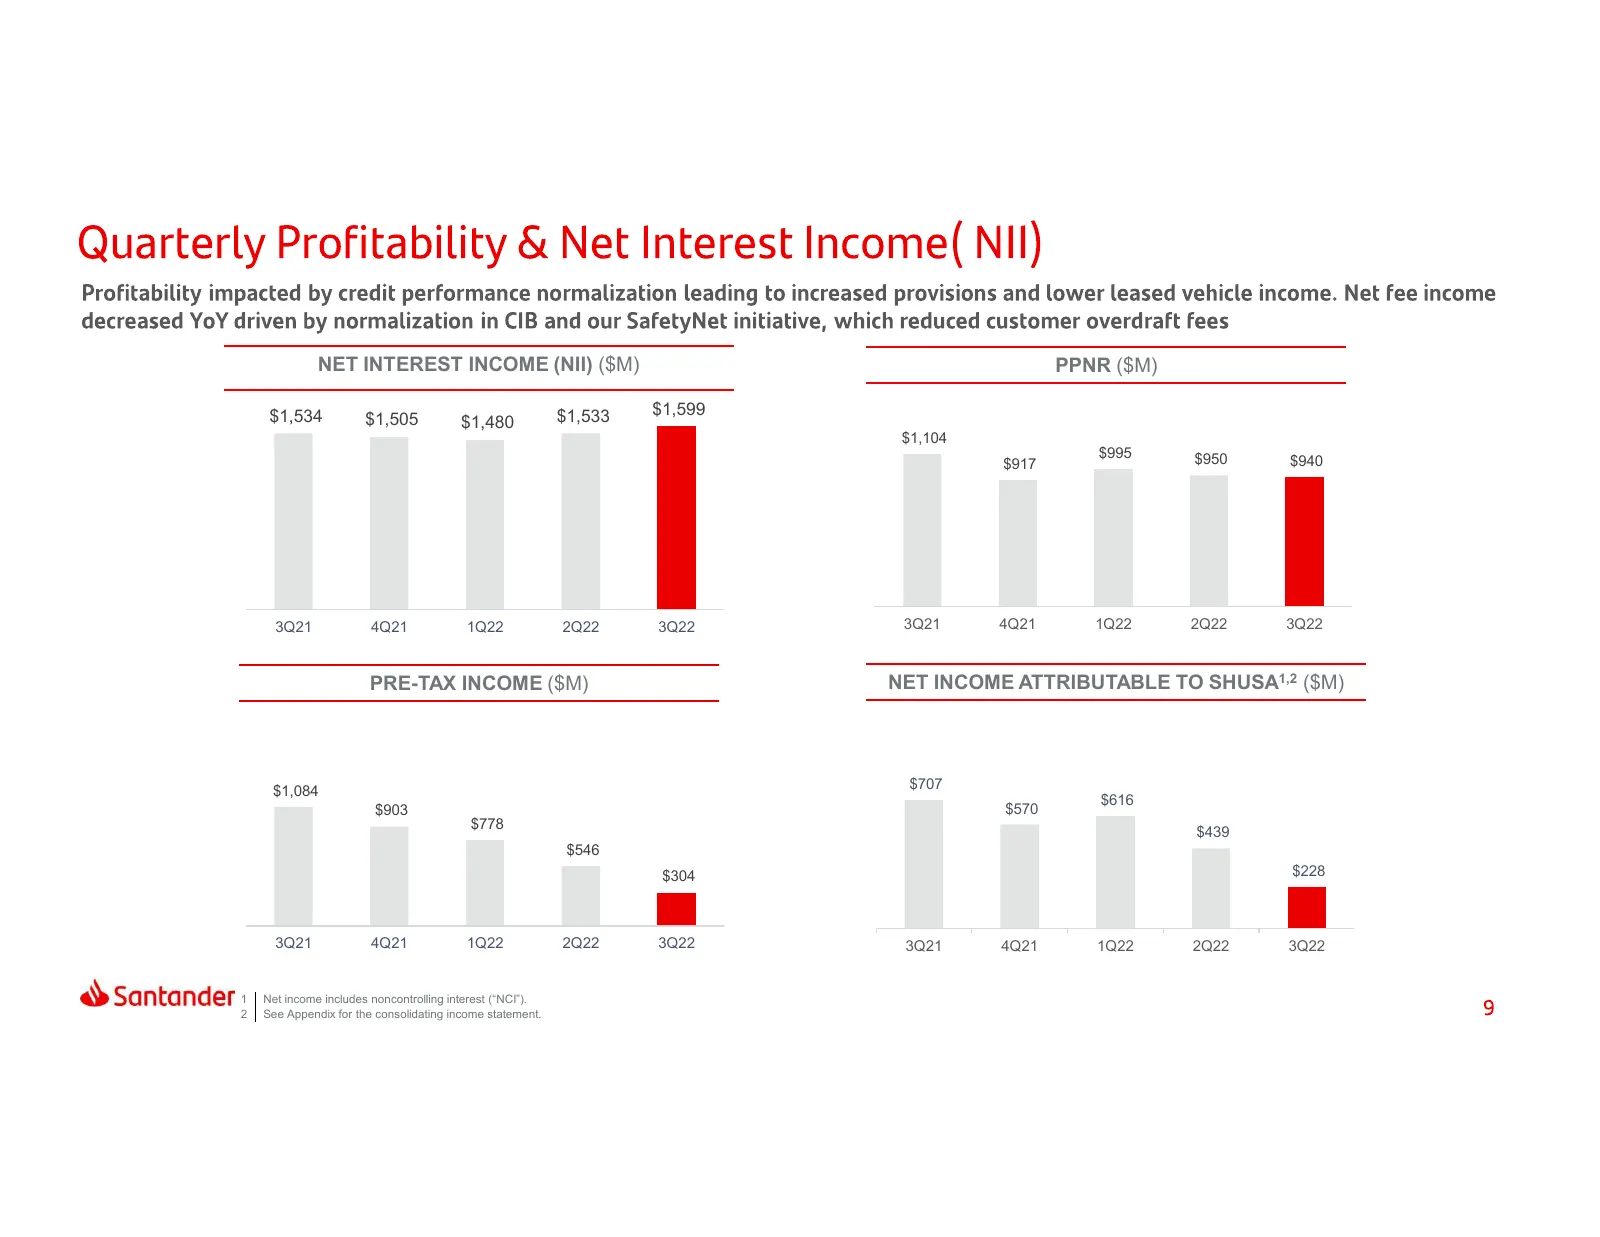
Slide 9: Net interest income, PPNR, pre-tax and net income
NET INTEREST INCOME (NII) ($M) PPNR ($M) $1,534 $1,533 $1,599 $1,505 $1,480 $1,104 $995 $950 $917 $940 3Q21 4Q21 1Q22 2Q22 3Q22 3Q21 4Q21 1Q22 2Q22 3Q22 PRE-TAX INCOME ($M) NET INCOME ATTRIBUTABLE TO SHUSA1,2 ($M) $1,084 $707 $616 $903 $570 $778 $439 $546 $304 $228 3Q21 4Q21 1Q22 2Q22 3Q22 3Q21 4Q21
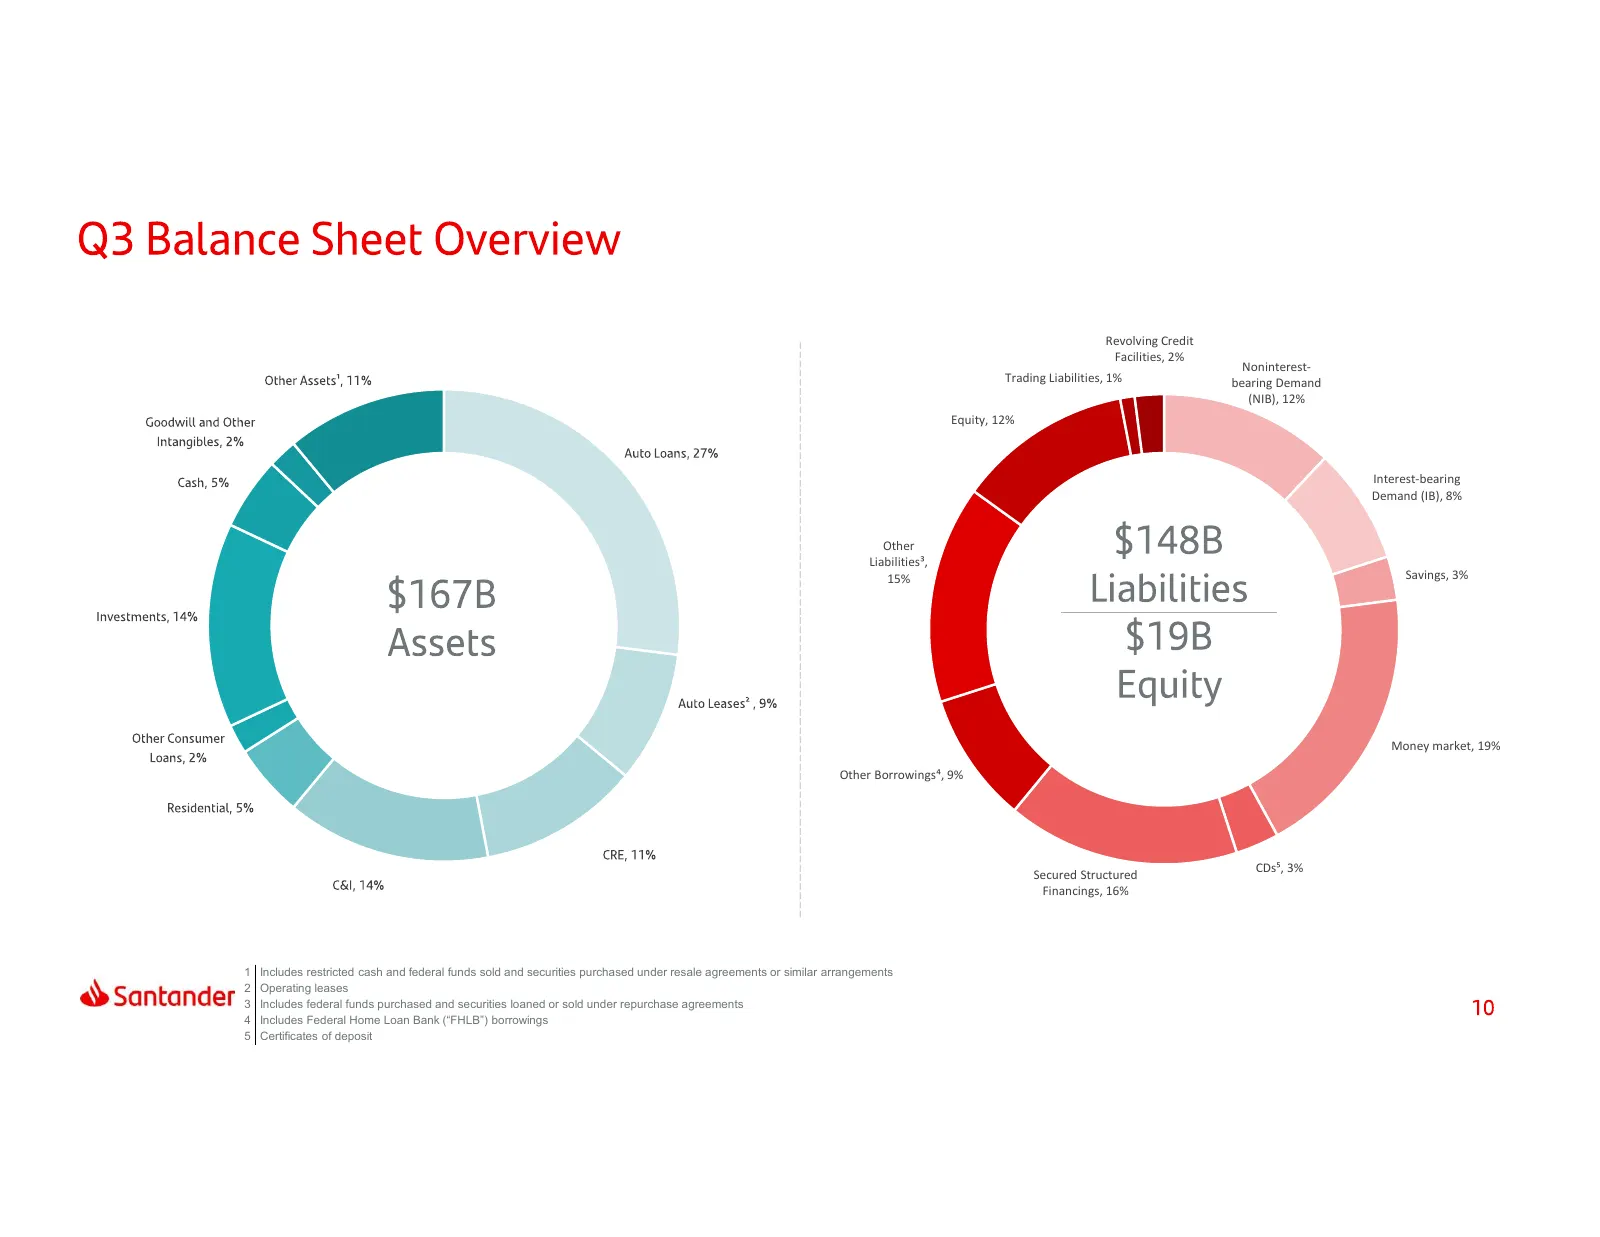
Slide 10: Funding and balance sheet composition
Revolving Credit Facilities, 2% Noninterest- Trading Liabilities, 1% bearing Demand (NIB), 12% Equity, 12% Interest-bearing Demand (IB), 8% Other Liabilities³, 15% Savings, 3% Money market, 19% Other Borrowings⁴, 9% Secured Structured CDs⁵, 3% Financings, 16% 1 Includes restricted cash and federal f
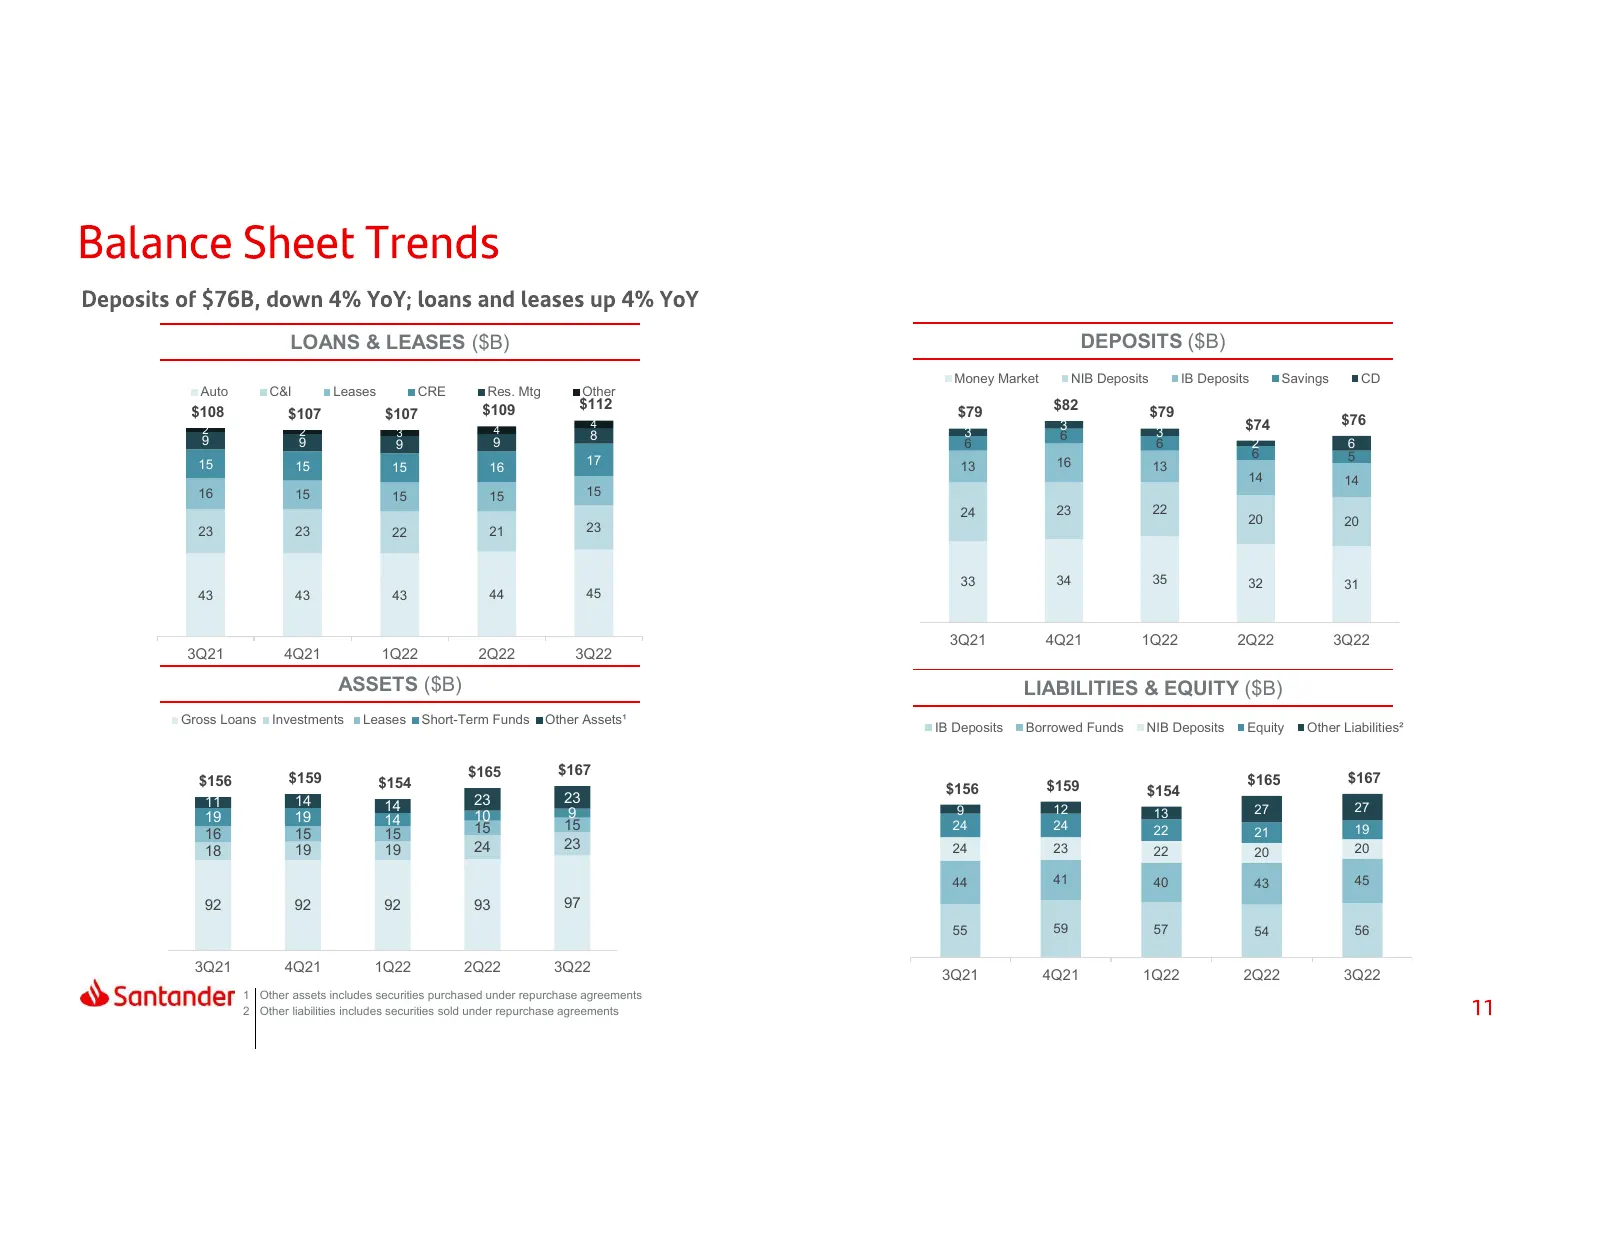
Slide 11: Deposits, loans & leases and assets
LOANS & LEASES ($B) DEPOSITS ($B) Money Market NIB Deposits IB Deposits Savings CD Auto C&I Leases CRE Res. Mtg Other $109 $112 $82 $108 $107 $107 $79 $79 4 3 $74 $76 2 2 3 4 3 3 9 8 6 9 9 9 6 6 2 6 6 5 15 15 17 13 16 13 15 16 14 14 16 15 15 15 15 24 23 22 20 20 23 23 22 21 23 33 34 35 32 31 43 43 4
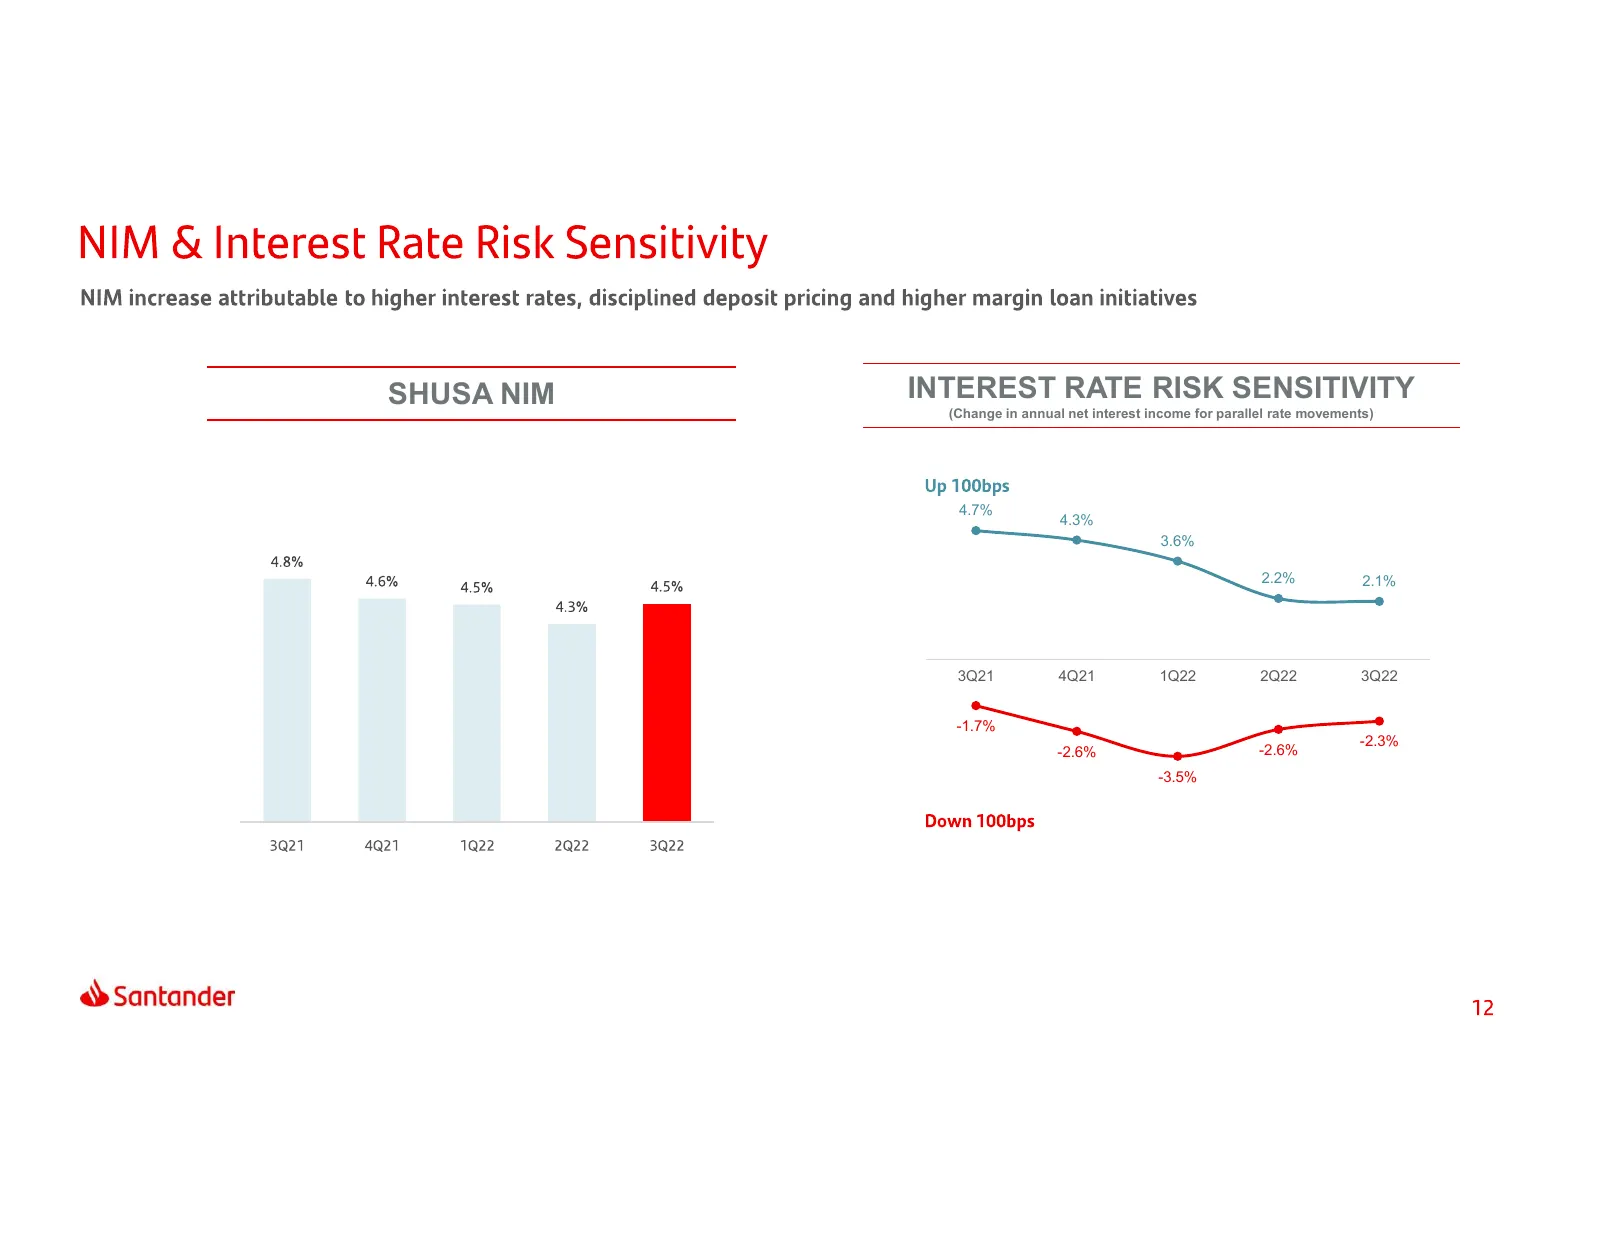
Slide 12: SHUSA NIM and interest rate risk sensitivity
SHUSA NIM INTEREST RATE RISK SENSITIVITY (Change in annual net interest income for parallel rate movements) 4.7% 4.3% 3.6% 2.2% 2.1% 3Q21 4Q21 1Q22 2Q22 3Q22 -1.7% -2.3% -2.6% -2.6% -3.5%
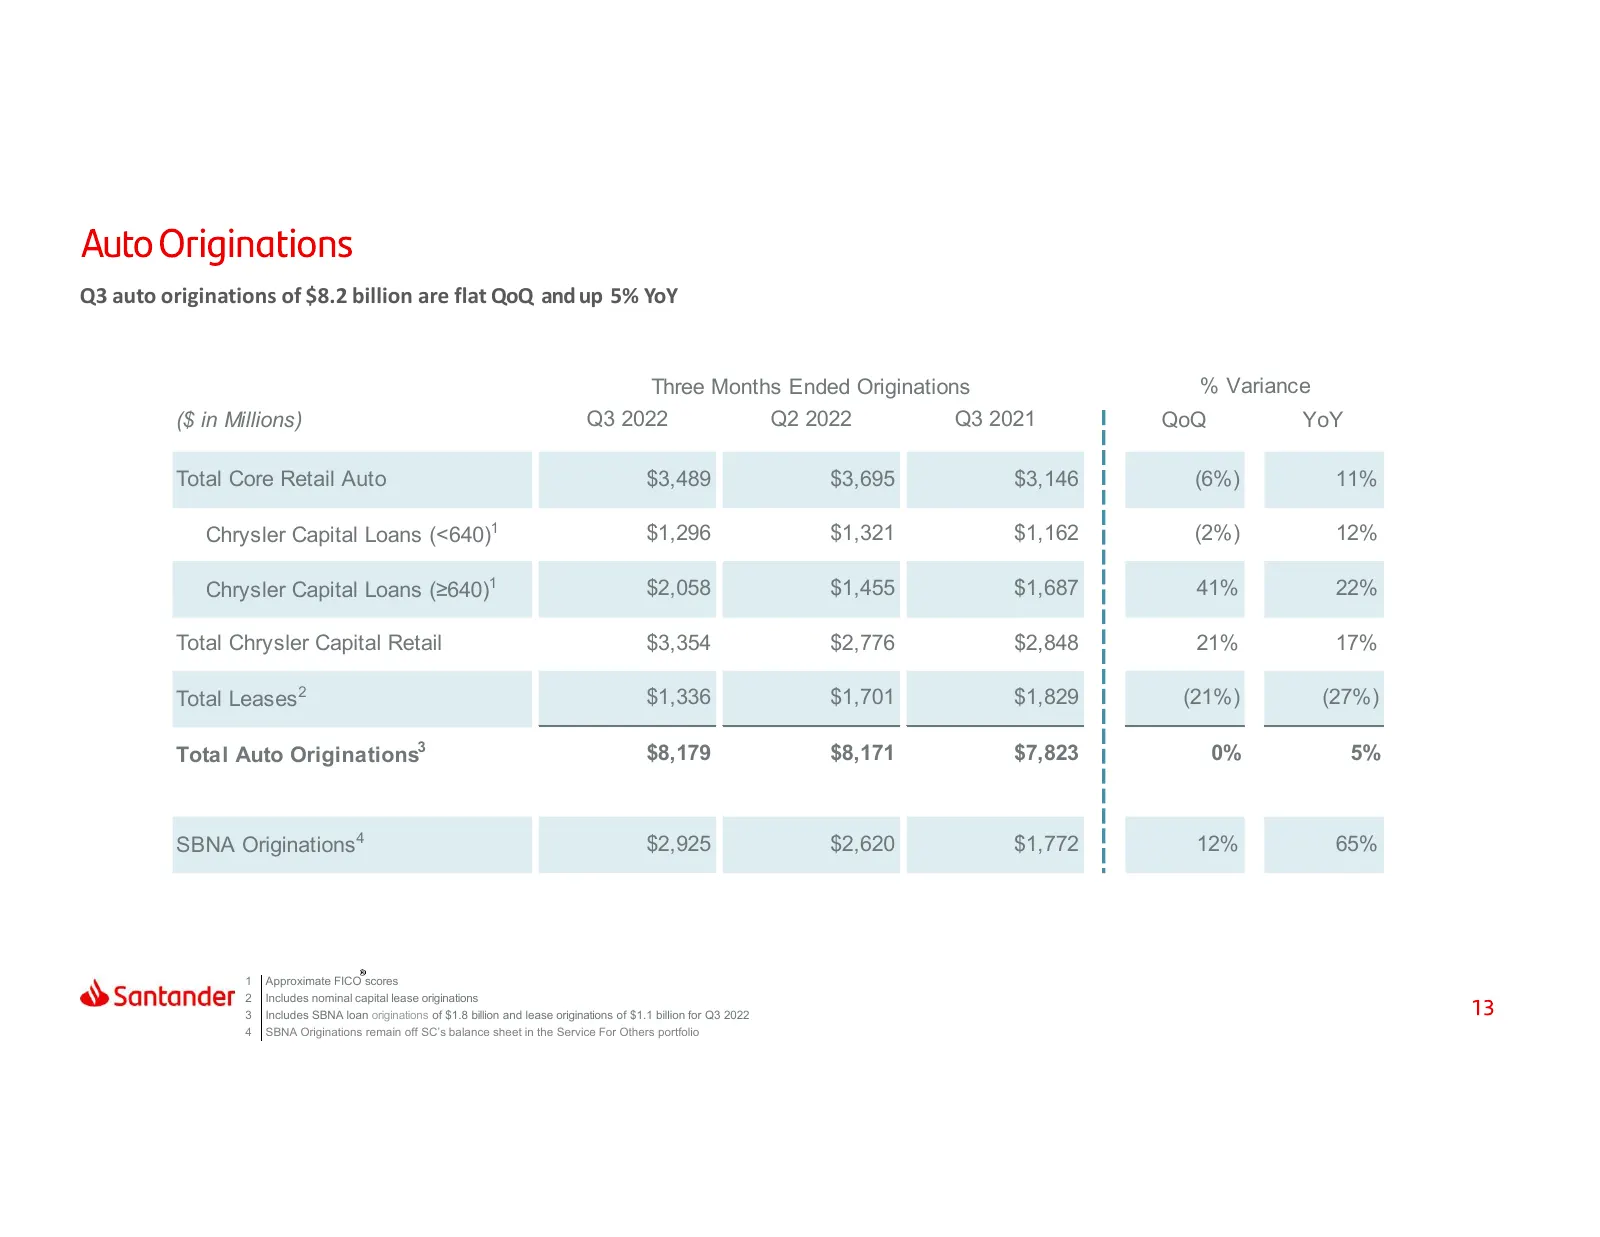
Slide 13: Q3 auto originations of $8.2 billion
Q3 auto originations of $8.2 billion are flat QoQ and up 5% YoY Three Months Ended Originations % Variance ($ in Millions) Q3 2022 Q2 2022 Q3 2021 QoQ YoY Total Core Retail Auto $3,489 $3,695 $3,146 (6%) 11% Chrysler Capital Loans (<640)1 $1,296 $1,321 $1,162 (2%) 12% Chrysler Capital Loans (≥640)1
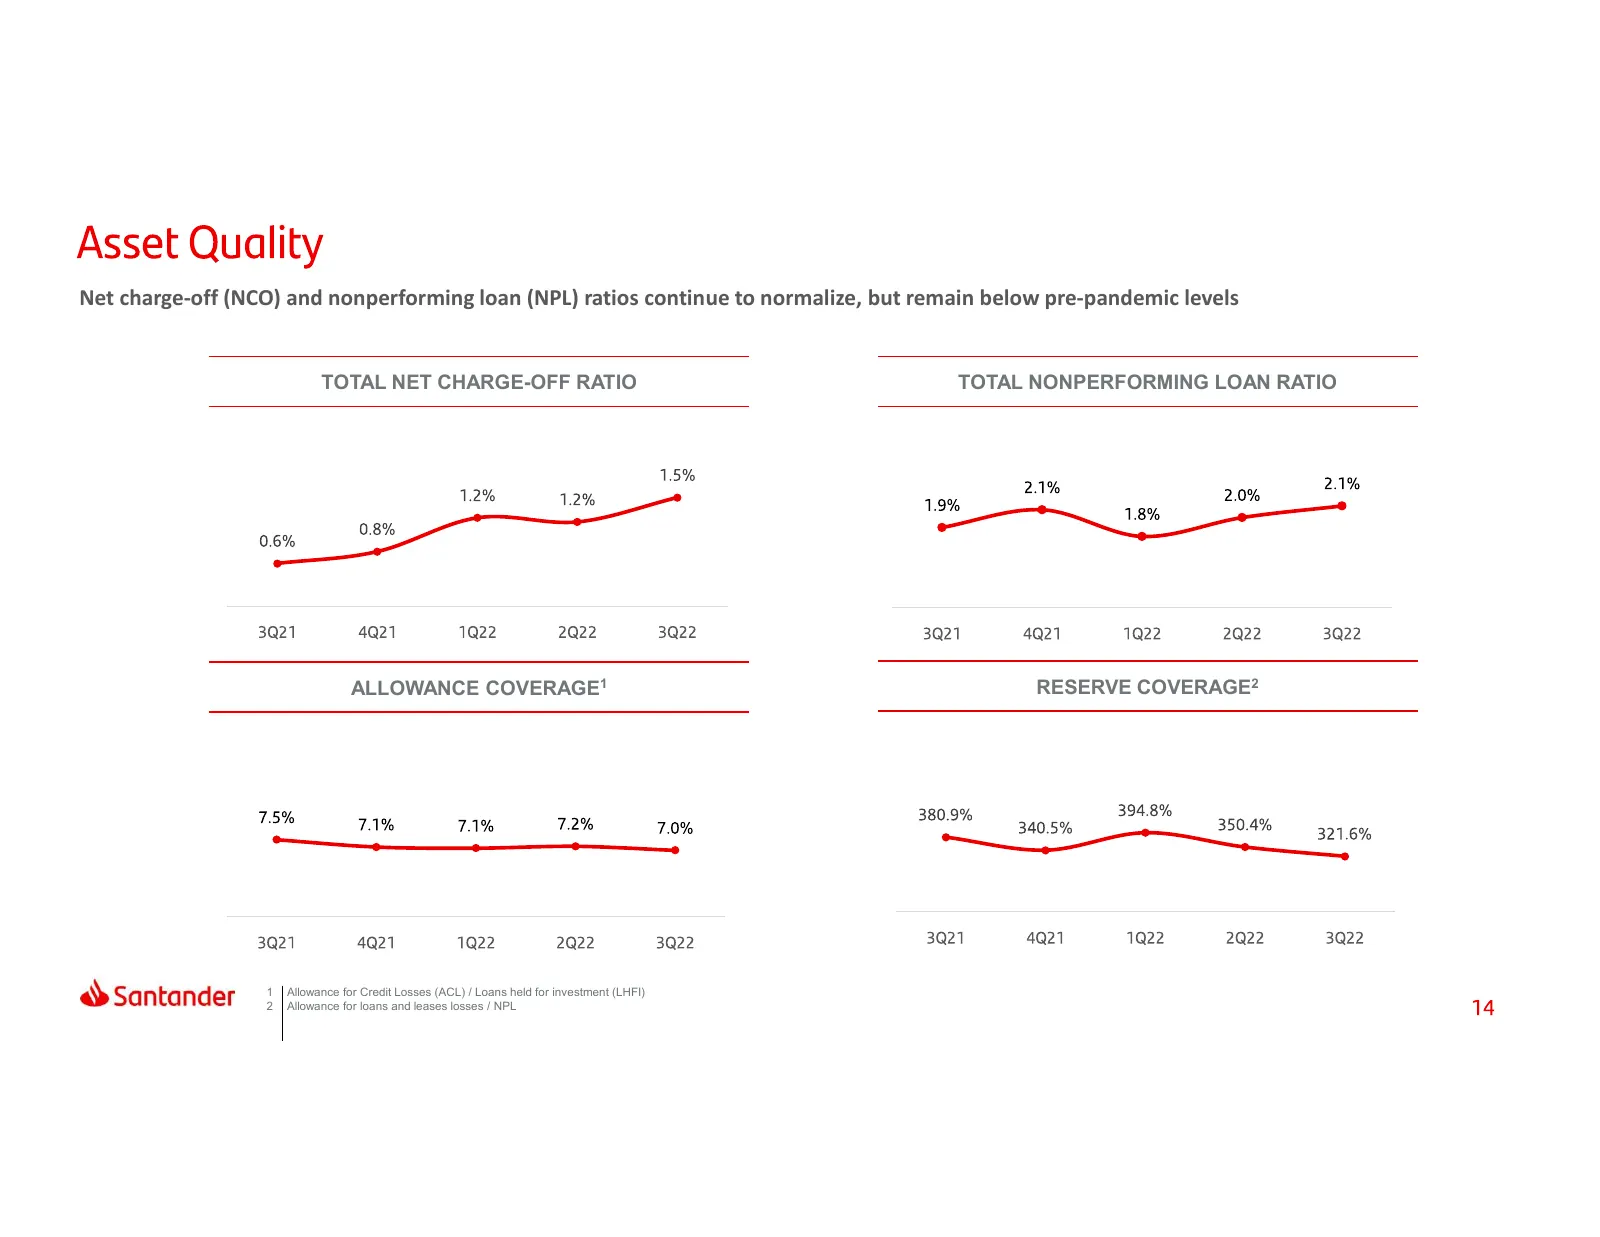
Slide 14: Net charge-off and nonperforming loan ratios
Net charge-off (NCO) and nonperforming loan (NPL) ratios continue to normalize, but remain below pre-pandemic levels TOTAL NET CHARGE-OFF RATIO TOTAL NONPERFORMING LOAN RATIO ALLOWANCE COVERAGE1 RESERVE COVERAGE2 1 Allowance for Credit Losses (ACL) / Loans held for investment (LHFI) 2 Allowance for
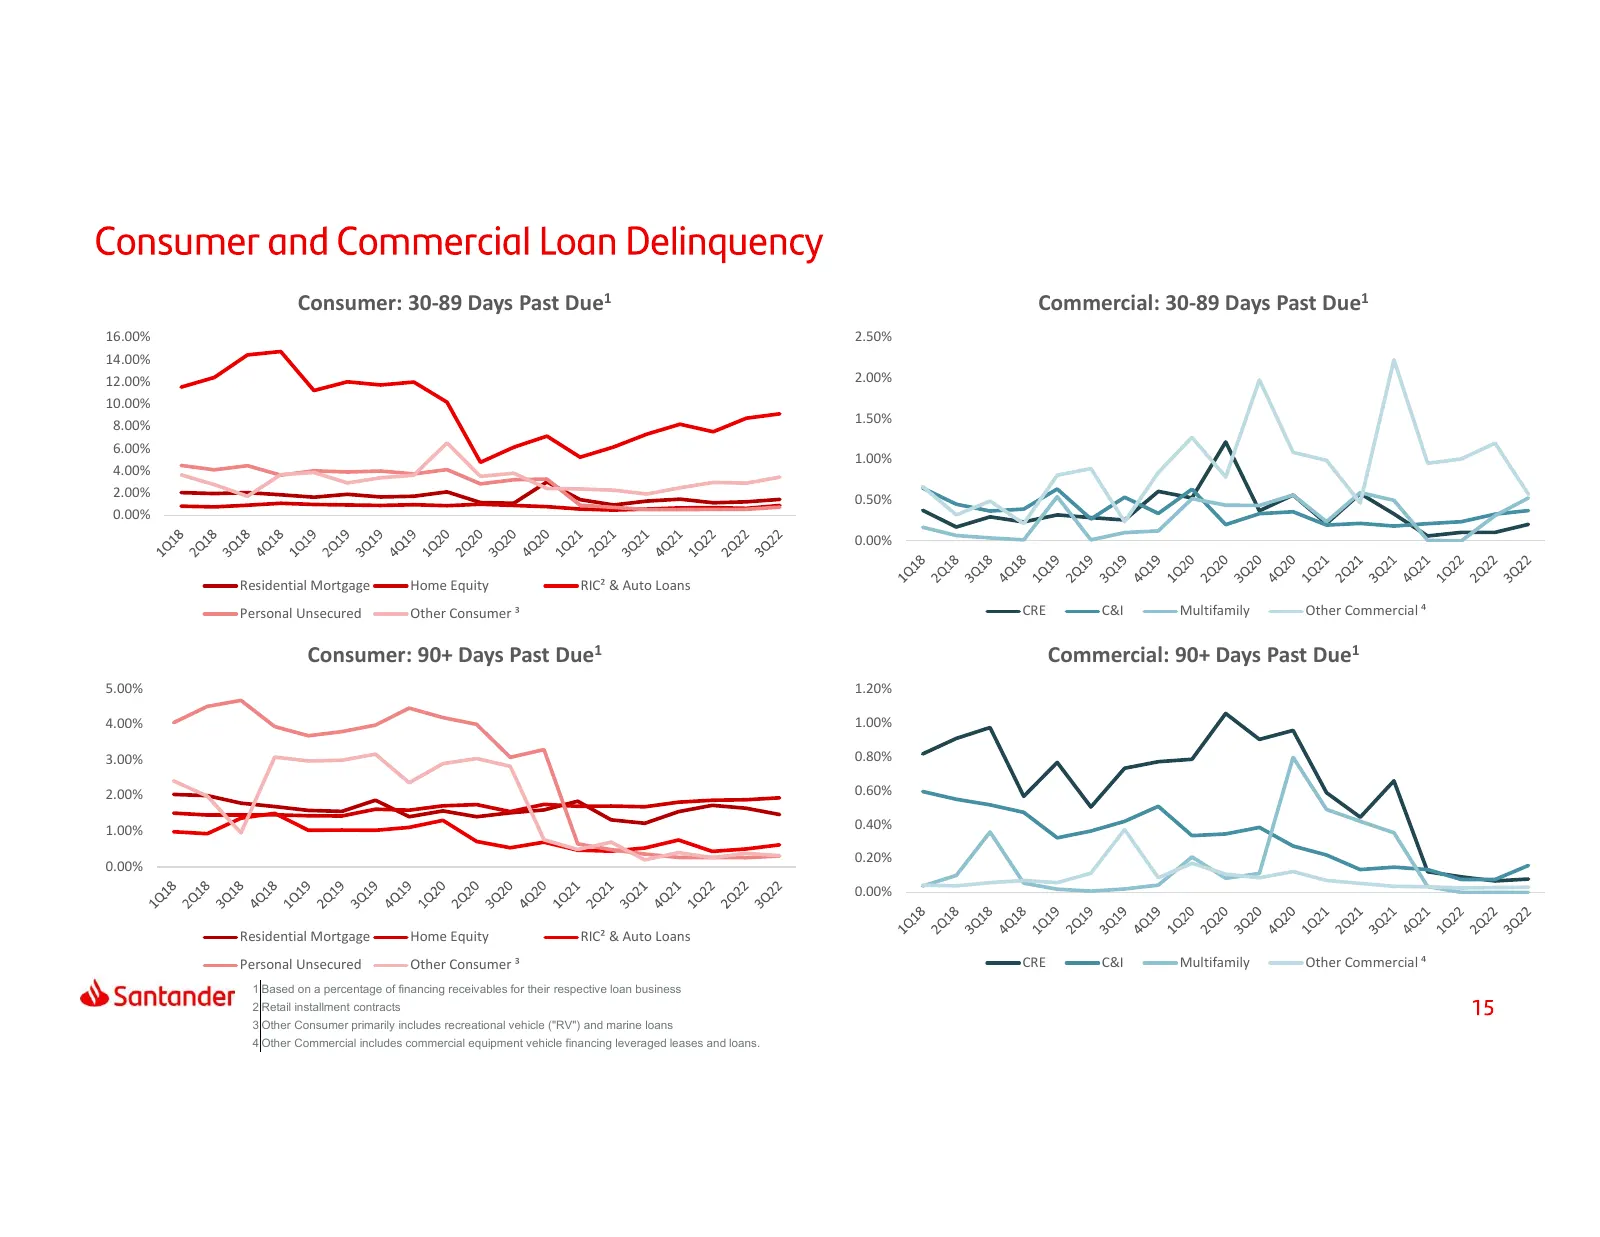
Slide 15: Past due loan ratios by category
Consumer: 30-89 Days Past Due1 Commercial: 30-89 Days Past Due1 16.00% 2.50% 14.00% 12.00% 2.00% 10.00% 8.00% 1.50% 6.00% 1.00% 4.00% 2.00% 0.50% 0.00% 0.00% Residential Mortgage Home Equity RIC² & Auto Loans Personal Unsecured Other Consumer ³ CRE C&I Multifamily Other Commercial ⁴ Consumer: 90+ Da
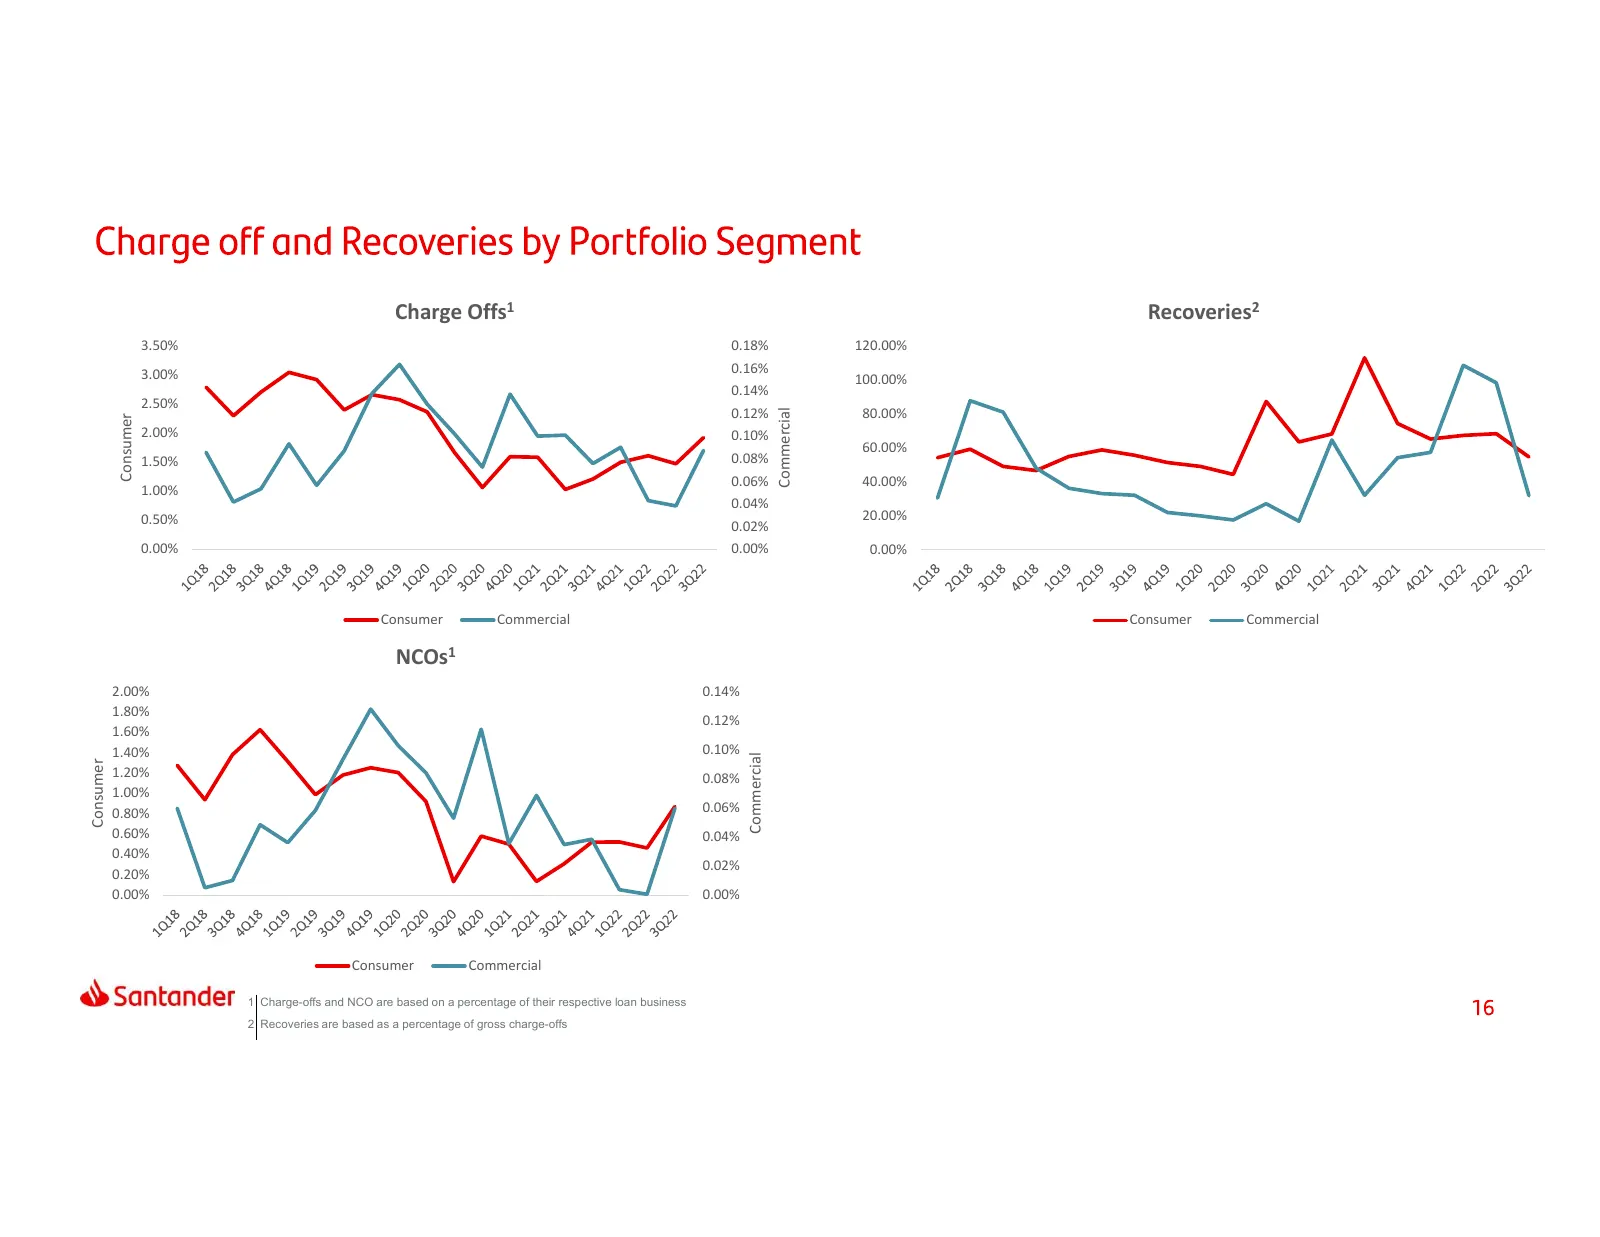
Slide 16: Charge-offs, recoveries and NCOs
Charge Offs1 Recoveries2 3.50% 0.18% 120.00% 3.00% 0.16% 100.00% 0.14% 2.50% 0.12% 80.00% Commercial Consumer 2.00% 0.10% 60.00% 1.50% 0.08% 0.06% 40.00% 1.00% 0.04% 0.50% 20.00% 0.02% 0.00% 0.00% 0.00% Consumer Commercial Consumer Commercial NCOs1 2.00% 0.14% 1.80% 0.12% 1.60% 1.40% 0.10% Commercia
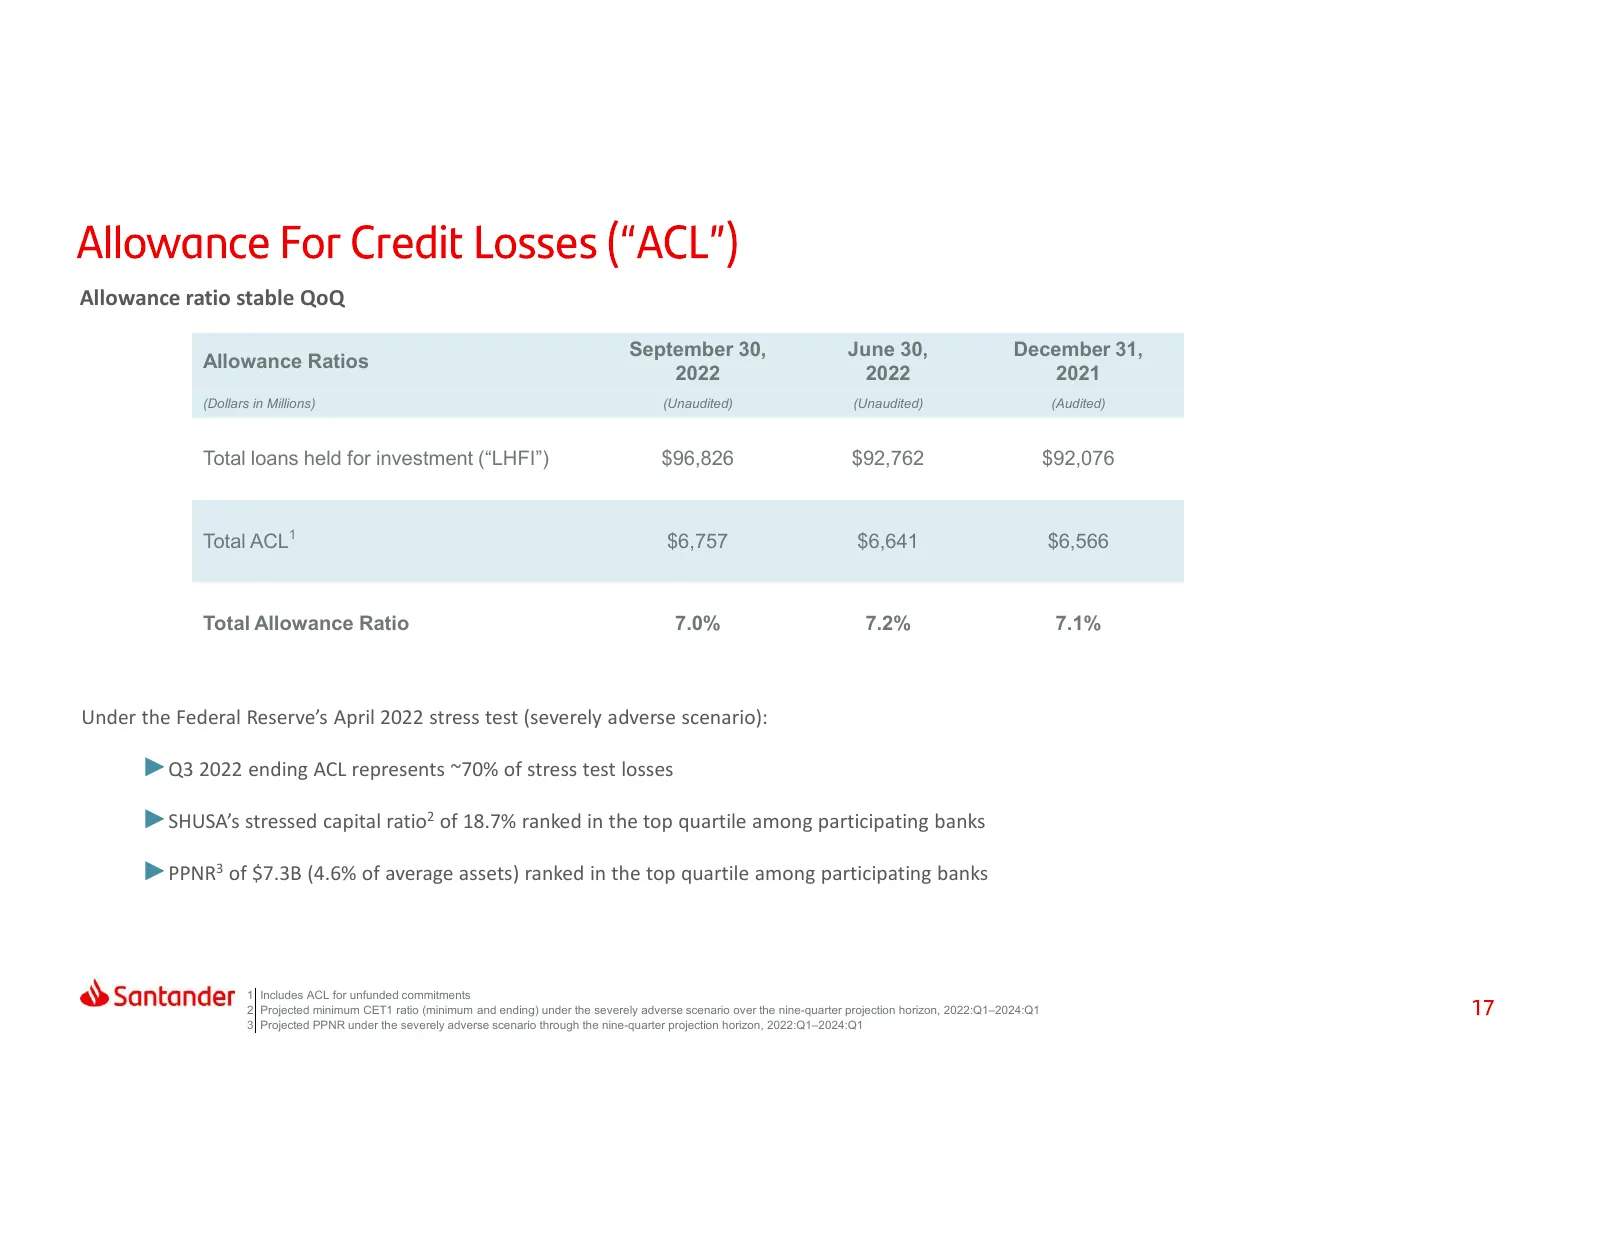
Slide 17: Allowance ratio stable QoQ
Allowance ratio stable QoQ September 30, June 30, December 31, Allowance Ratios 2022 2022 2021 (Dollars in Millions) (Unaudited) (Unaudited) (Audited) Total loans held for investment (“LHFI”) $96,826 $92,762 $92,076 Total ACL1 $6,757 $6,641 $6,566 Total Allowance Ratio 7.0% 7.2% 7.1% Under the Feder
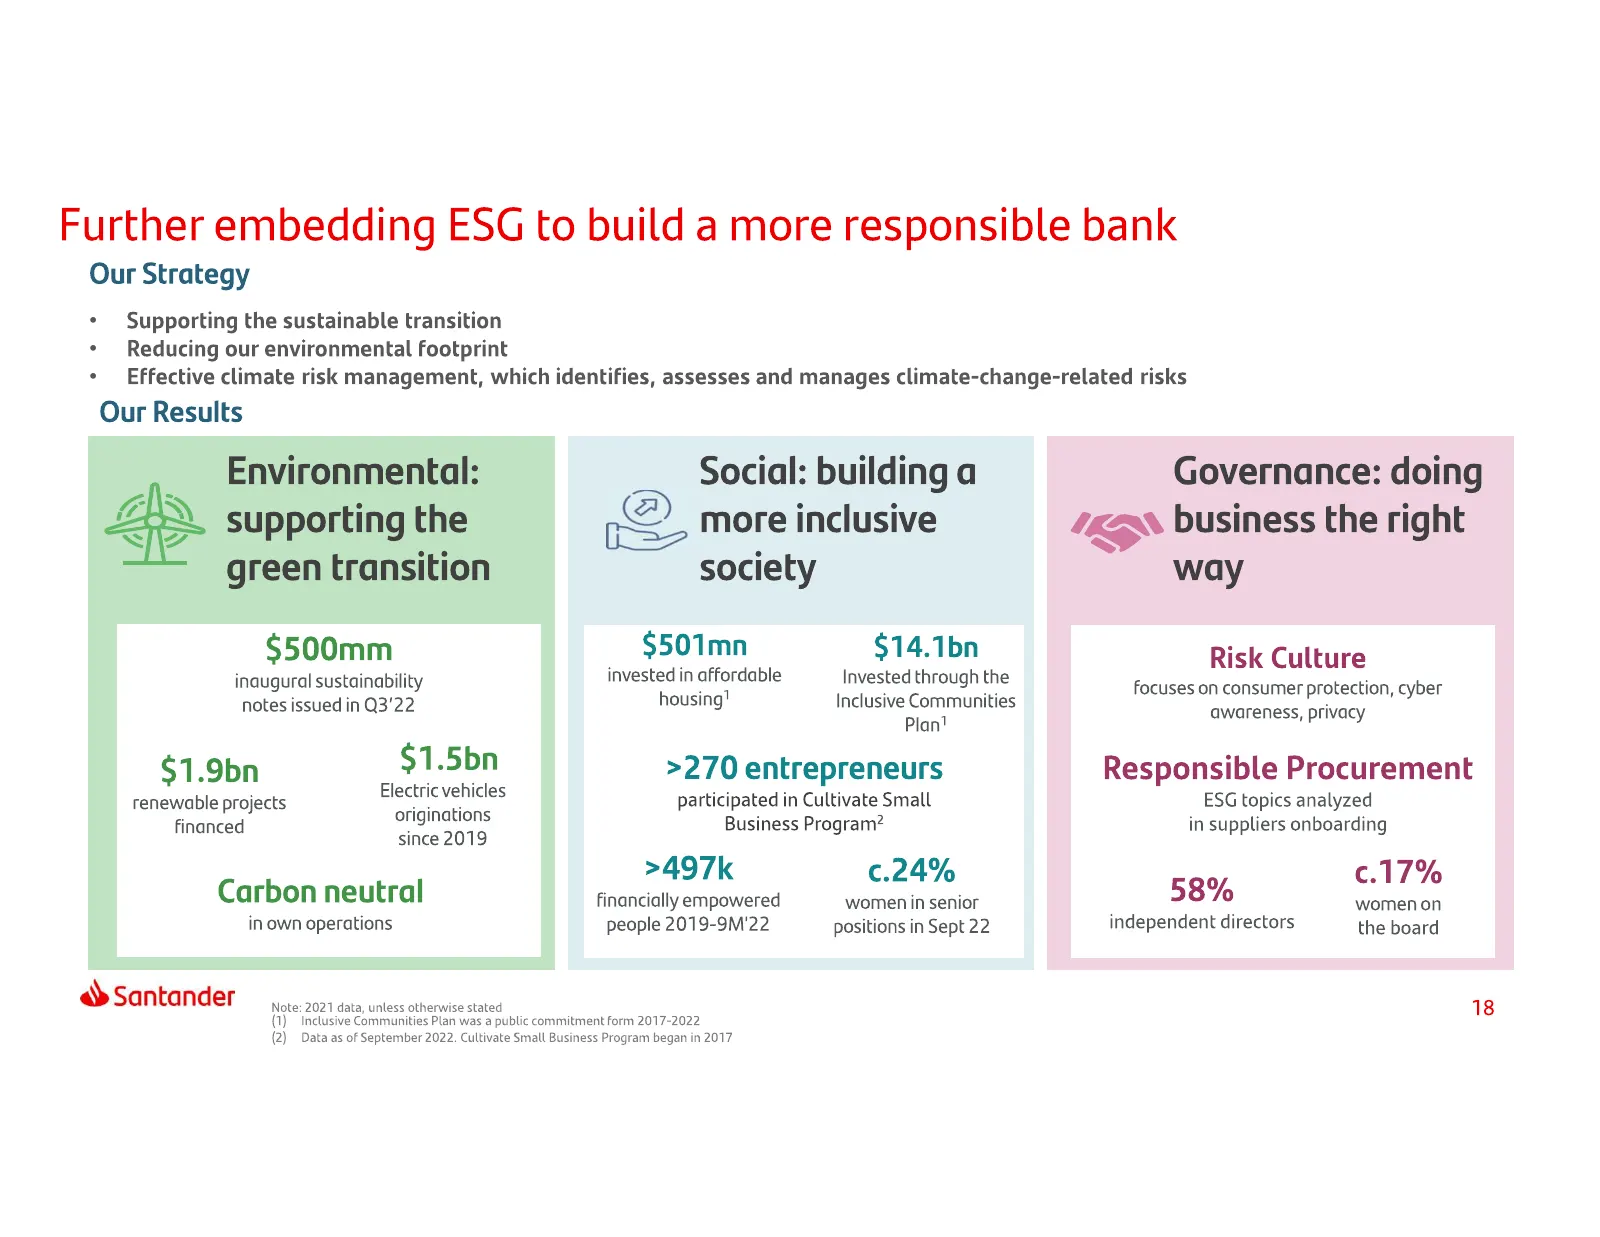
Slide 18: Further embedding ESG to build a more responsible bank
Further embedding ESG to build a more responsible bank Our Strategy + Supporting the sustainable transition + Reducing our environmental footprint + Effective climate risk management, which identifies, assesses and manages climate-change-related risks Our Results _ Environmental: +\ supporting the g
Slide 19: Index
Index At a Glance Results Capital & Appendix Liquidity
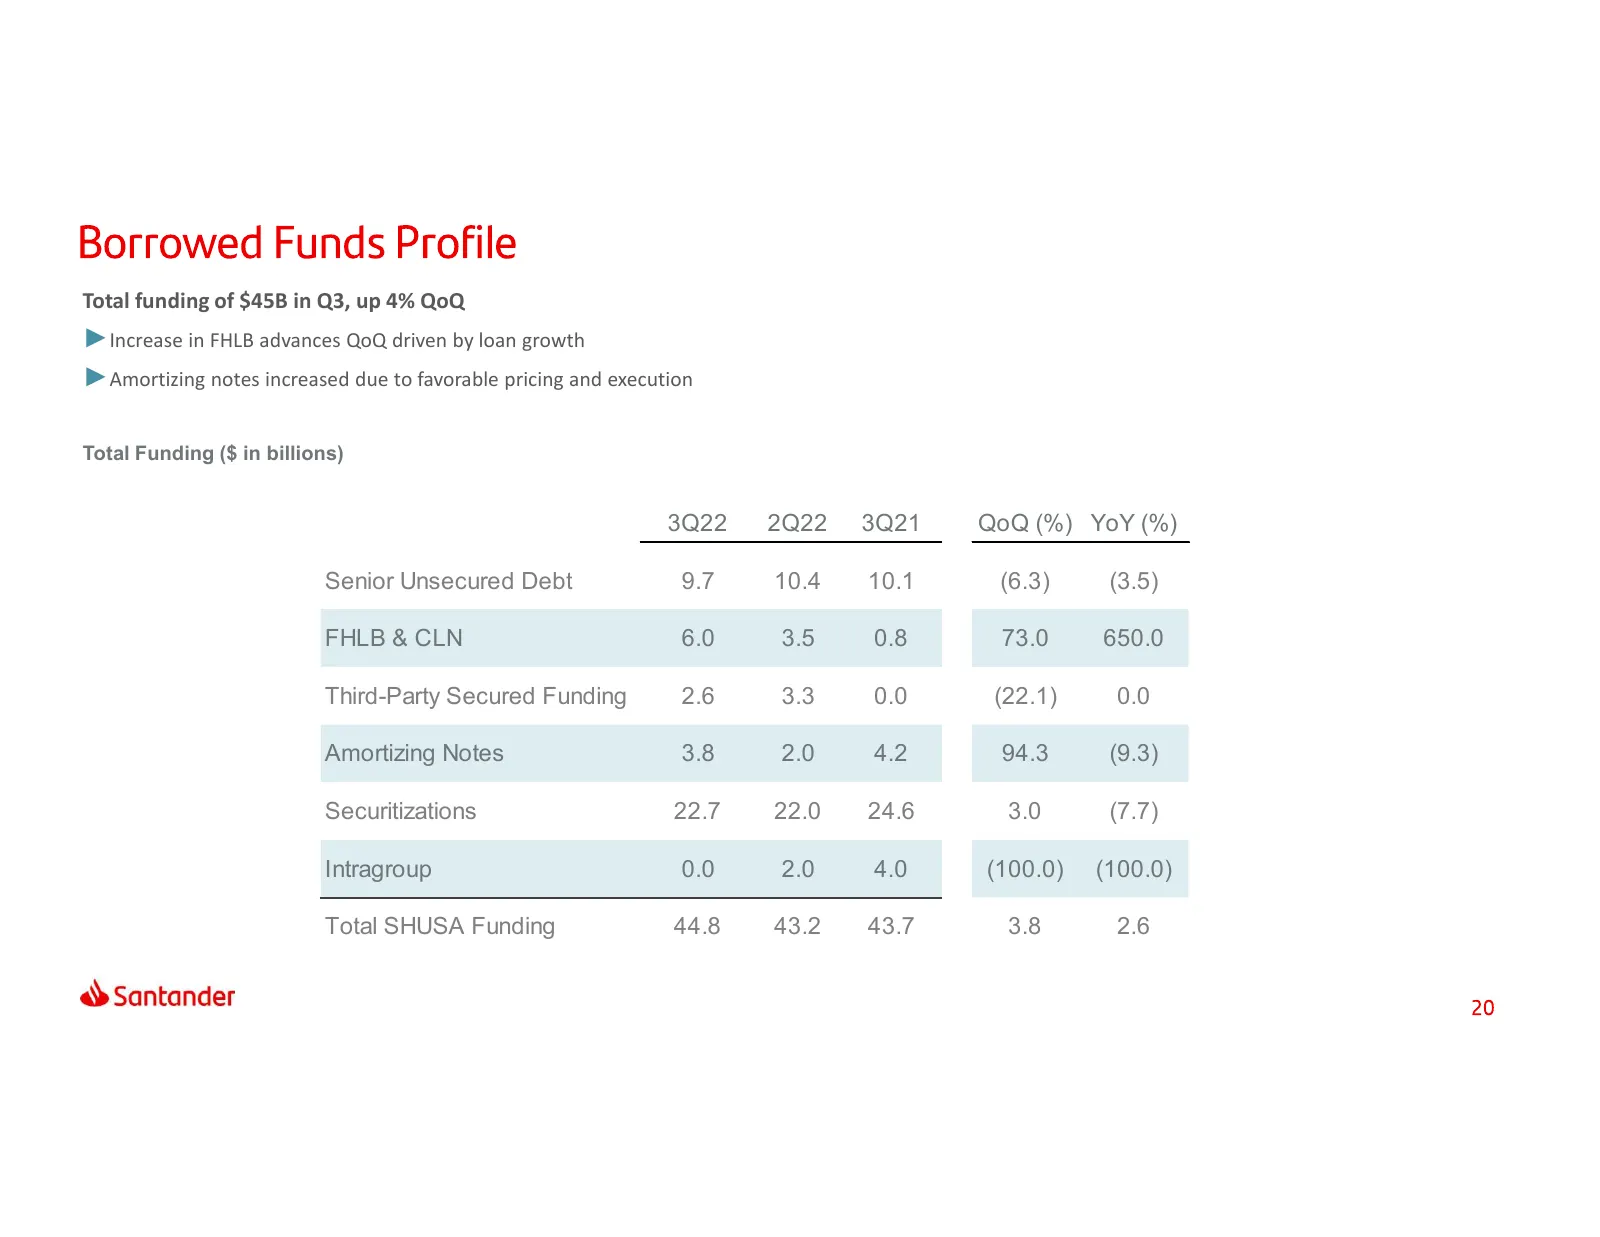
Slide 20: Total funding of $45B in Q3
Total funding of $45B in Q3, up 4% QoQ ►Increase in FHLB advances QoQ driven by loan growth ►Amortizing notes increased due to favorable pricing and execution Total Funding ($ in billions) 3Q22 2Q22 3Q21 QoQ (%) YoY (%) Senior Unsecured Debt 9.7 10.4 10.1 (6.3) (3.5) FHLB & CLN 6.0 3.5 0.8 73.0 650.
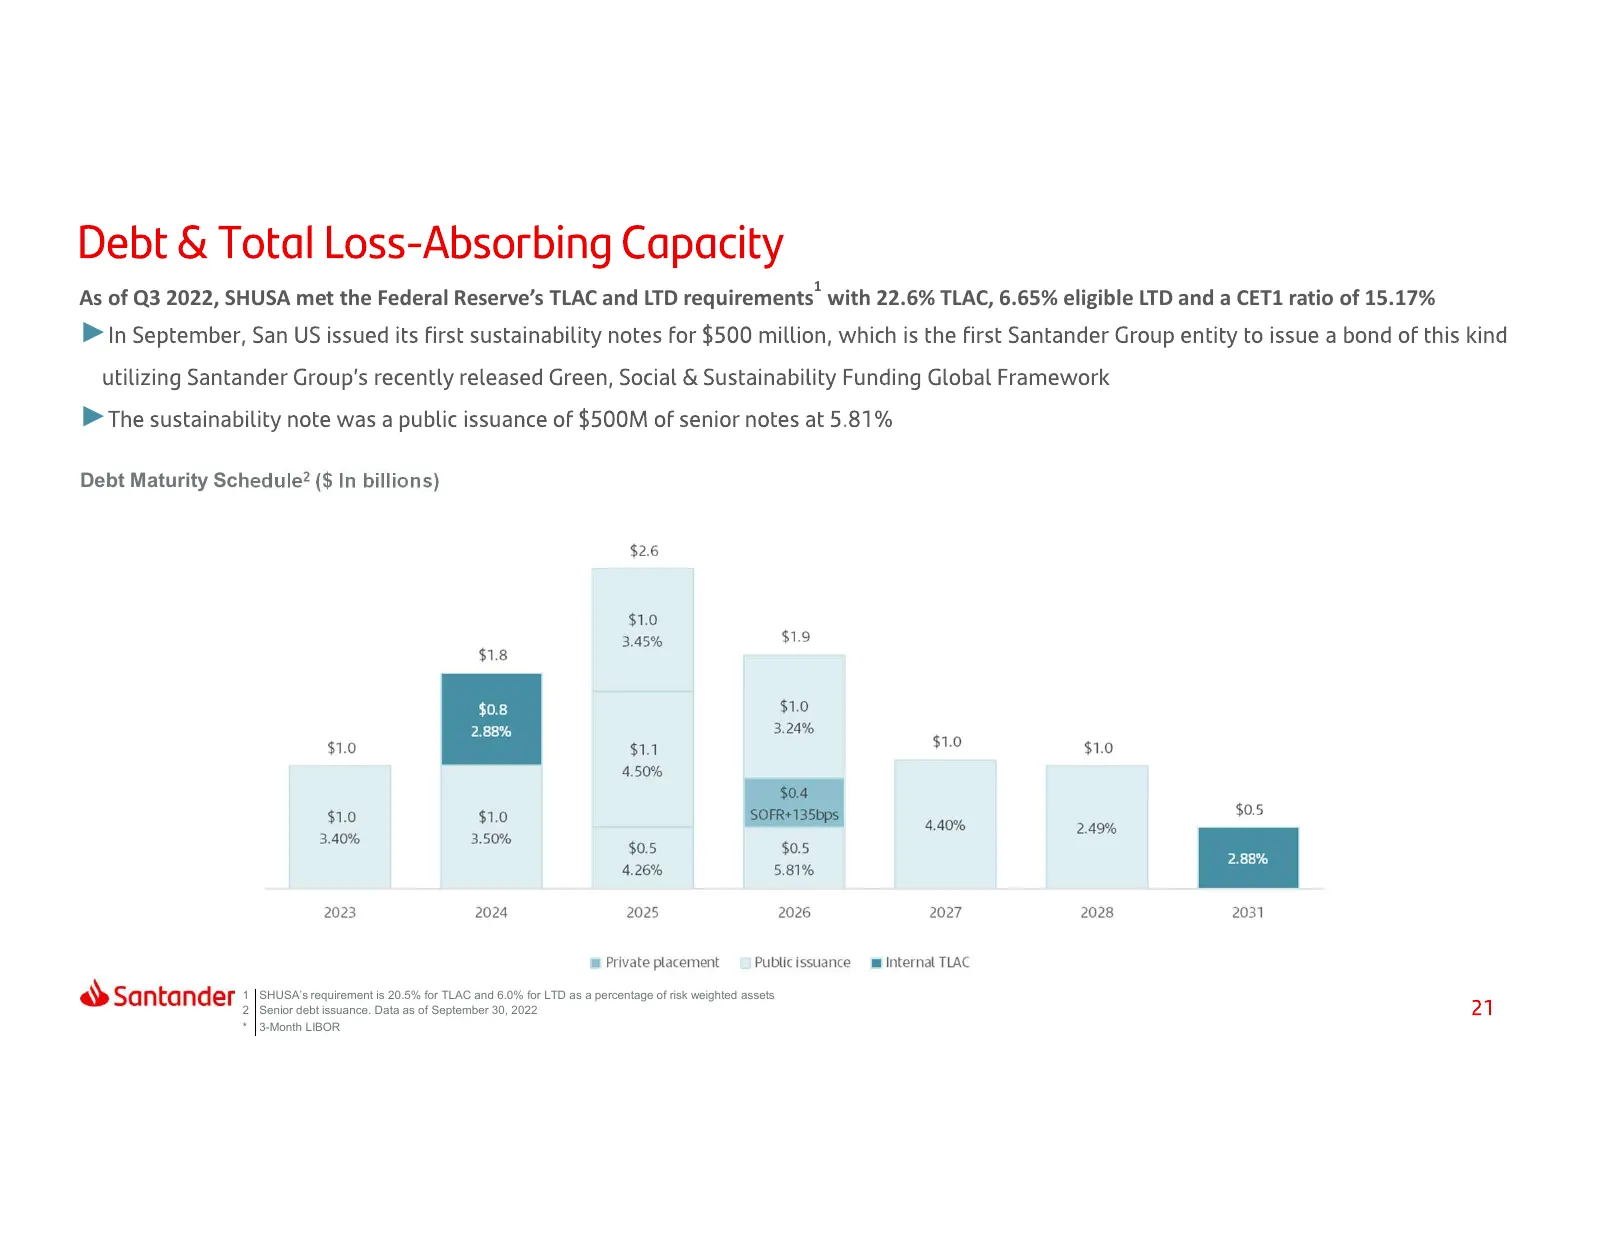
Slide 21: TLAC and LTD requirements and debt maturity schedule
1 As of Q3 2022, SHUSA met the Federal Reserve’s TLAC and LTD requirements with 22.6% TLAC, 6.65% eligible LTD and a CET1 ratio of 15.17% ► ► Debt Maturity Schedule2 ($ In billions) 1 SHUSA’s requirement is 20.5% for TLAC and 6.0% for LTD as a percentage of risk weighted assets 2 Senior debt issuanc
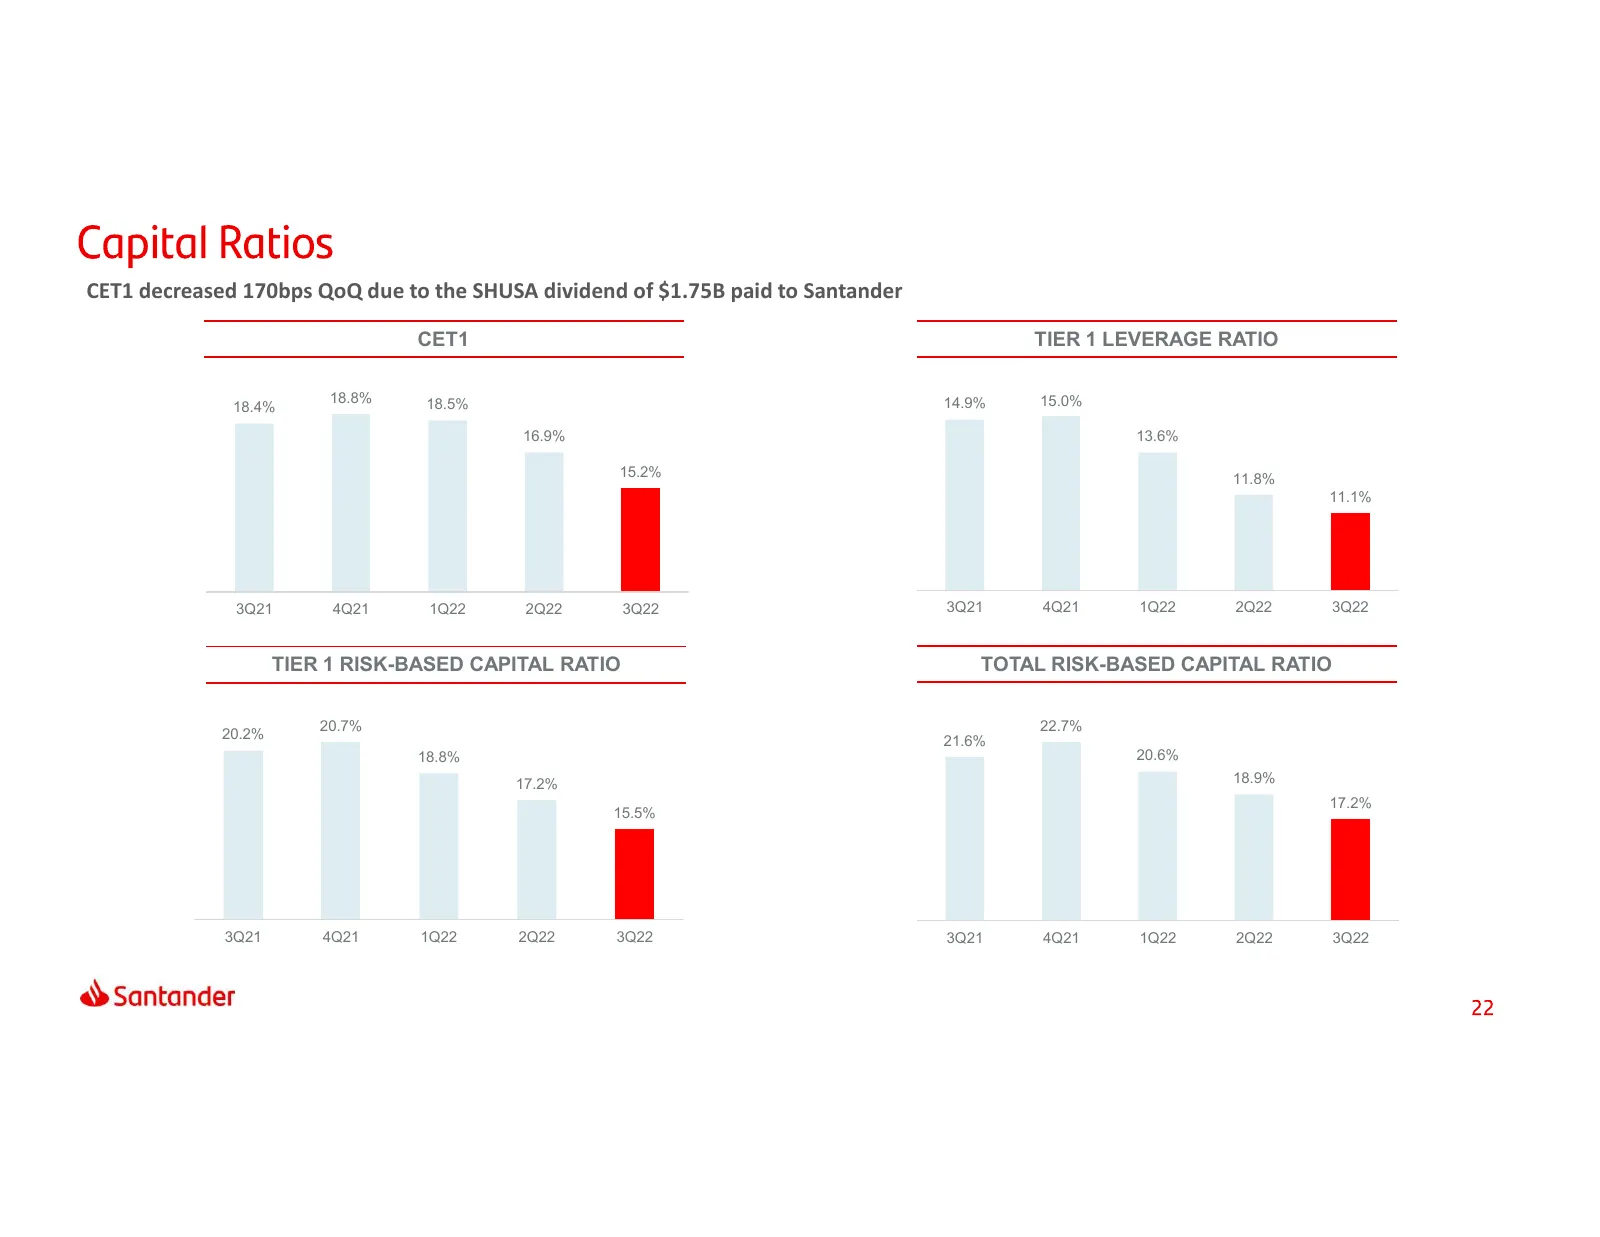
Slide 22: CET1 decreased 170bps QoQ due to dividend
CET1 decreased 170bps QoQ due to the SHUSA dividend of $1.75B paid to Santander CET1 TIER 1 LEVERAGE RATIO 18.8% 18.5% 14.9% 15.0% 18.4% 16.9% 13.6% 15.2% 11.8% 11.1% 3Q21 4Q21 1Q22 2Q22 3Q22 3Q21 4Q21 1Q22 2Q22 3Q22 TIER 1 RISK-BASED CAPITAL RATIO TOTAL RISK-BASED CAPITAL RATIO 20.7% 22.7% 20.2% 21
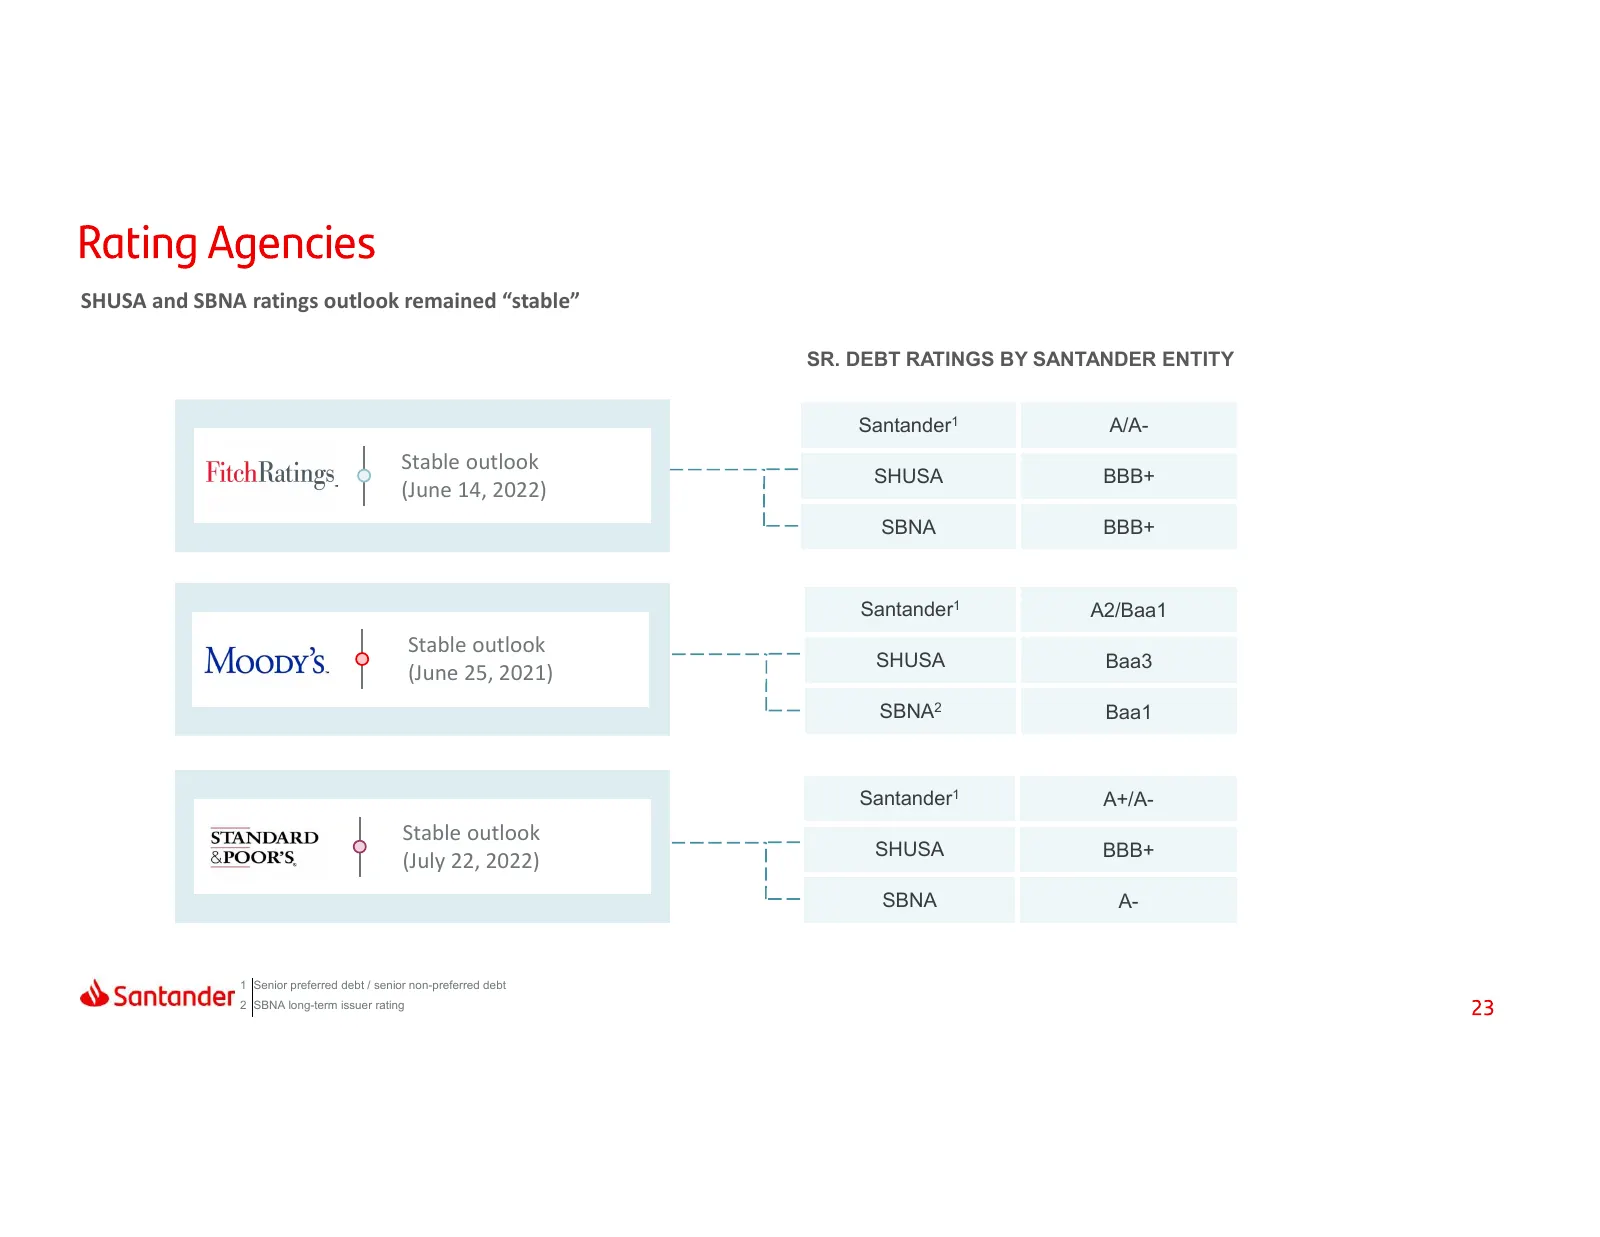
Slide 23: SHUSA and SBNA ratings outlook remained stable
SHUSA and SBNA ratings outlook remained “stable” SR. DEBT RATINGS BY SANTANDER ENTITY Santander1 A/A- Stable outlook SHUSA BBB+ (June 14, 2022) SBNA BBB+ Santander1 A2/Baa1 Stable outlook SHUSA Baa3 (June 25, 2021) SBNA2 Baa1 Santander1 A+/A- Stable outlook SHUSA BBB+ (July 22, 2022) SBNA A- 1 Senio
Slide 24: Index
Index At a Glance Results Capital & Appendix Liquidity
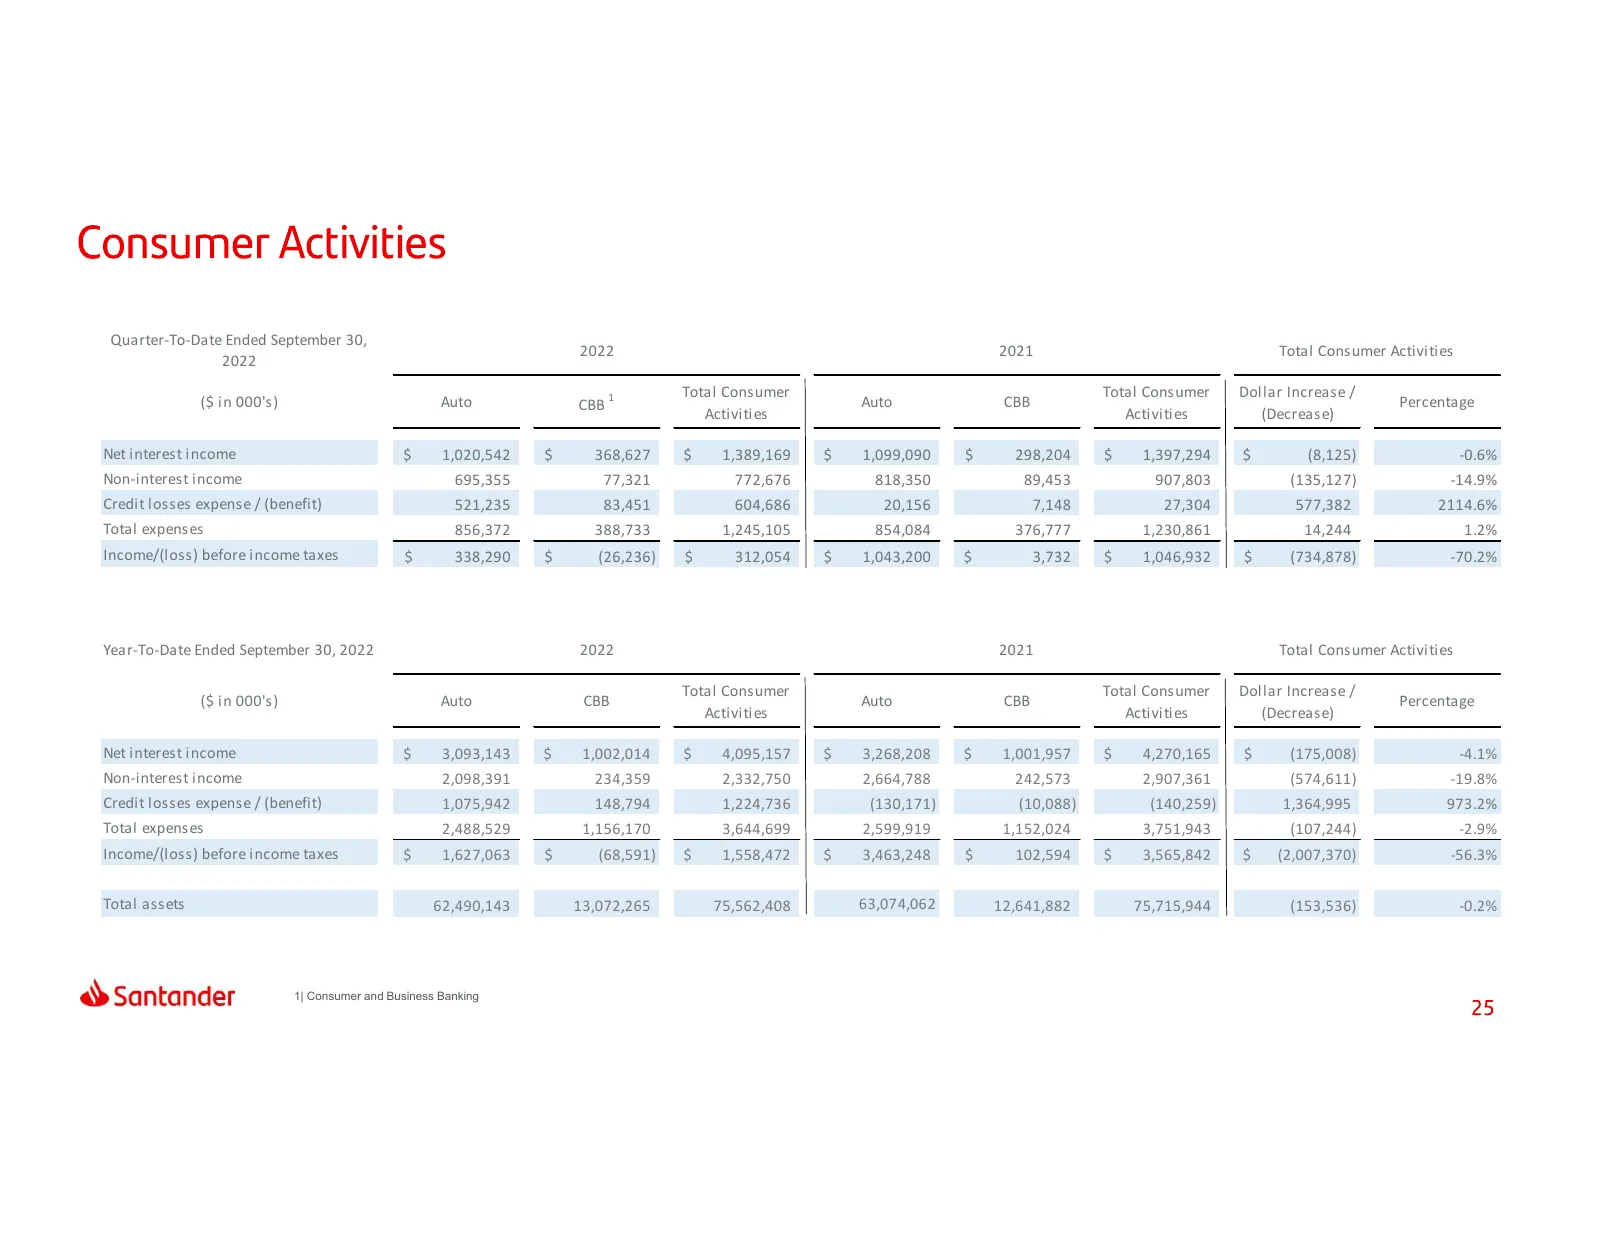
Slide 25: Consumer activities results
Quarter-To-Date Ended September 30, 2022 2021 Total Consumer Activities 2022 1 Total Consumer Total Consumer Dollar Increase / ($ in 000's) Auto CBB Auto CBB Percentage Activities Activities (Decrease) Net interest income $ 1,020,542 $ 368,627 $ 1,389,169 $ 1,099,090 $ 298,204 $ 1,397,294 $ (8,125)
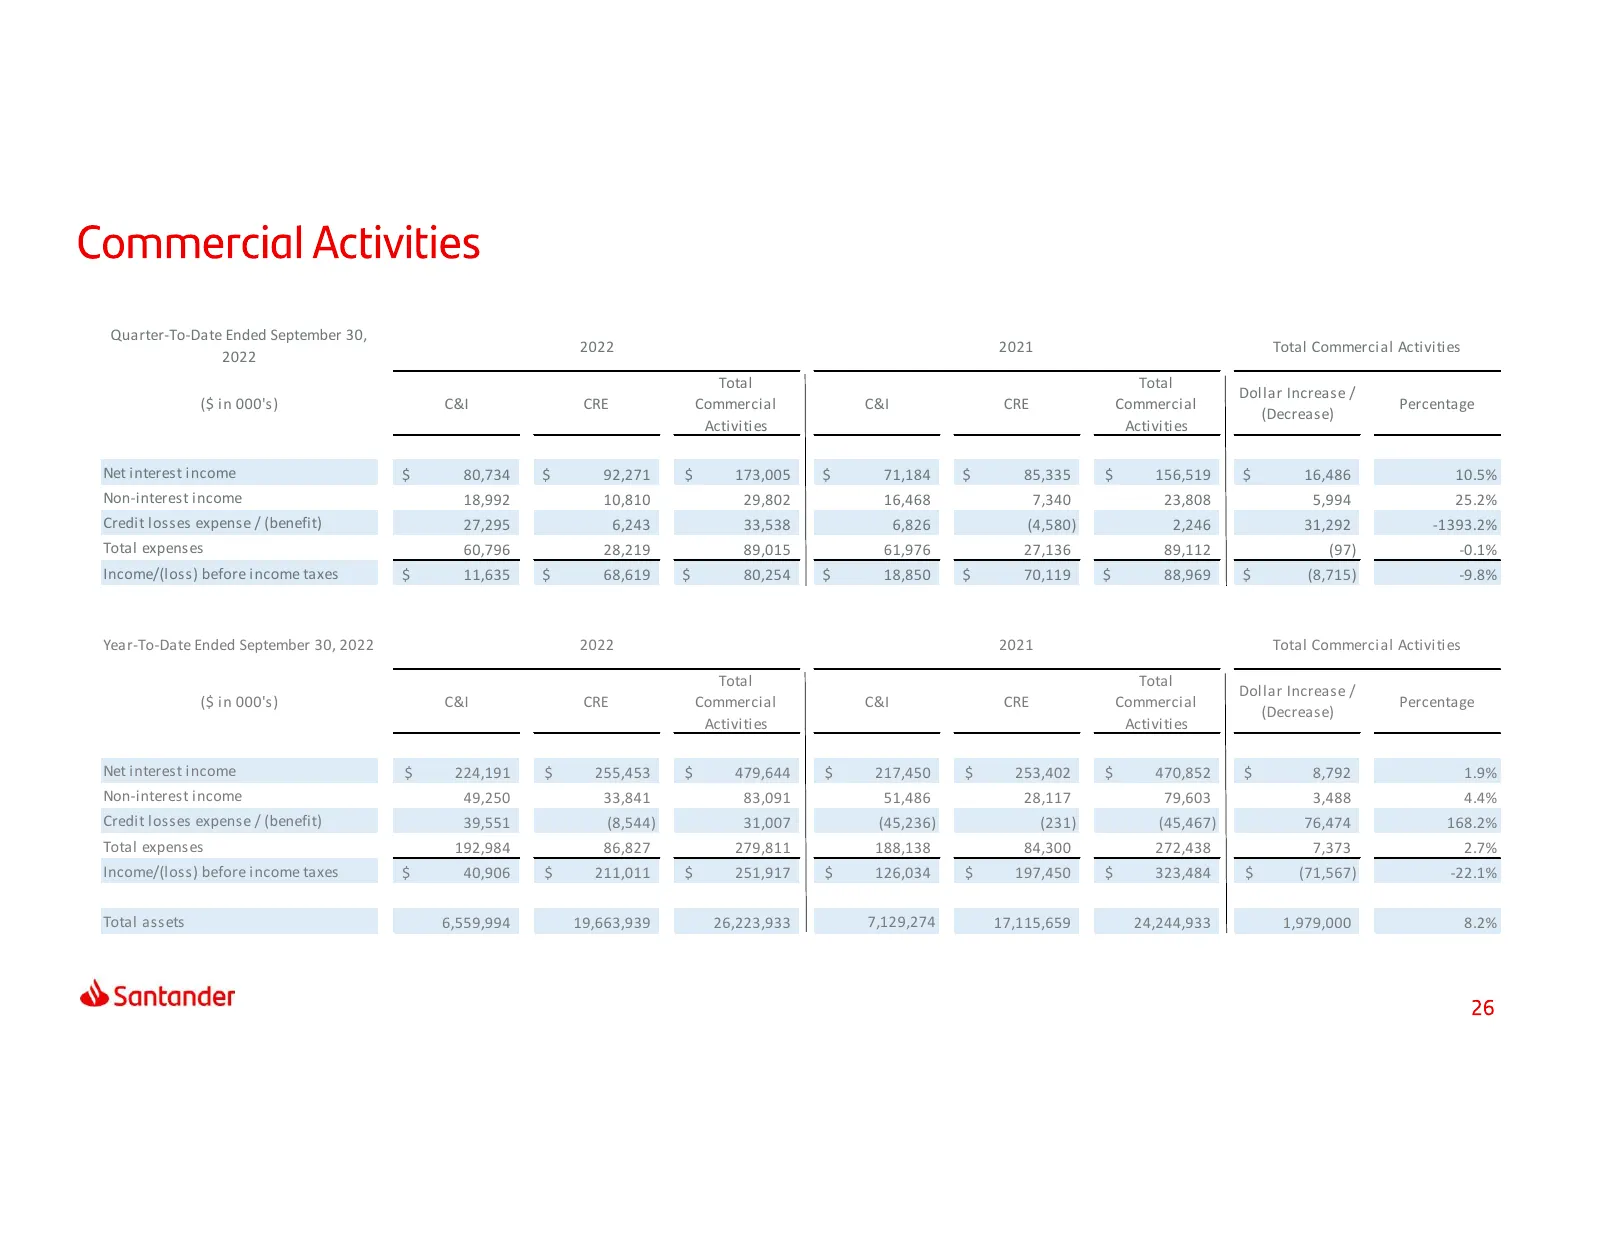
Slide 26: Commercial activities results
Quarter-To-Date Ended September 30, 2022 2021 Total Commercial Activities 2022 Total Total Dollar Increase / ($ in 000's) C&I CRE Commercial C&I CRE Commercial Percentage (Decrease) Activities Activities Net interest income $ 80,734 $ 92,271 $ 173,005 $ 71,184 $ 85,335 $ 156,519 $ 16,486 10.5% Non-i
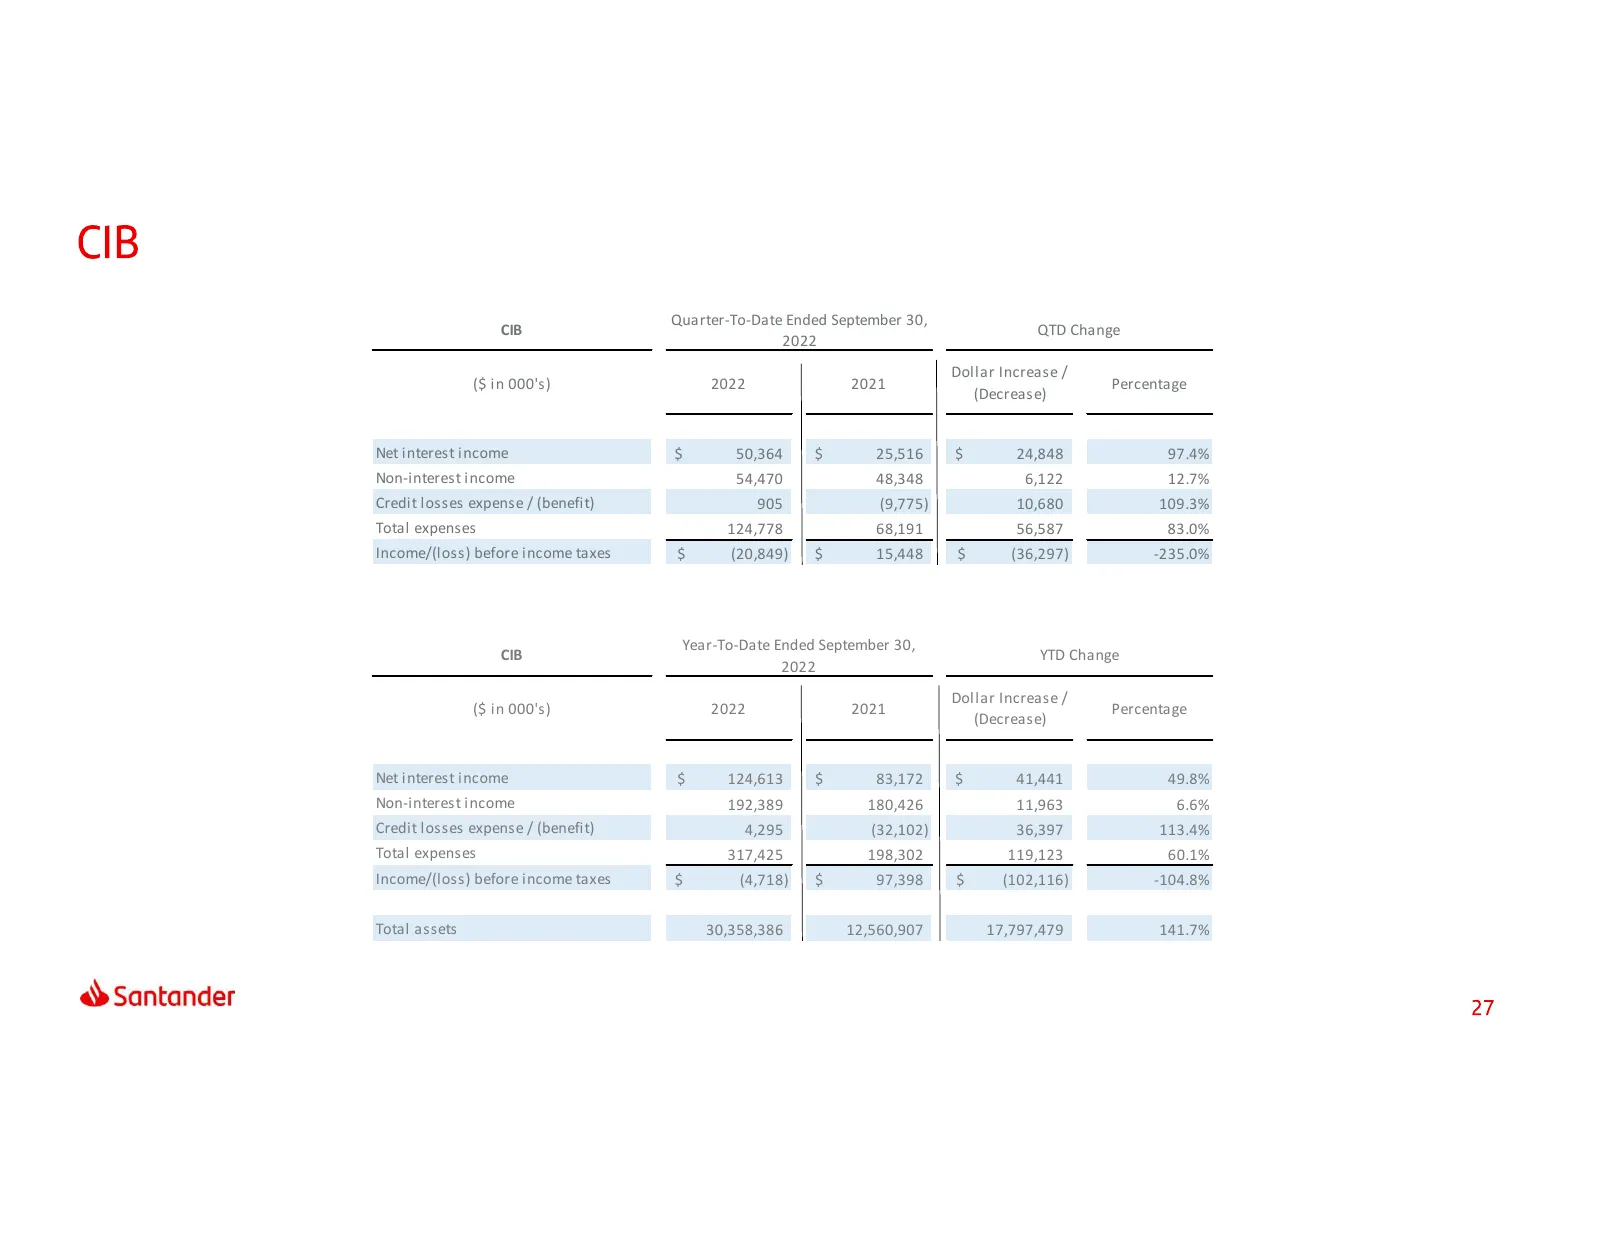
Slide 27: CIB results
Quarter-To-Date Ended September 30, CIB QTD Change 2022 Dollar Increase / ($ in 000's) 2022 2021 Percentage (Decrease) Net interest income $ 50,364 $ 25,516 $ 24,848 97.4% Non-interest income 54,470 48,348 6,122 12.7% Credit losses expense / (benefit) 905 (9,775) 10,680 109.3% Total expenses 124,778
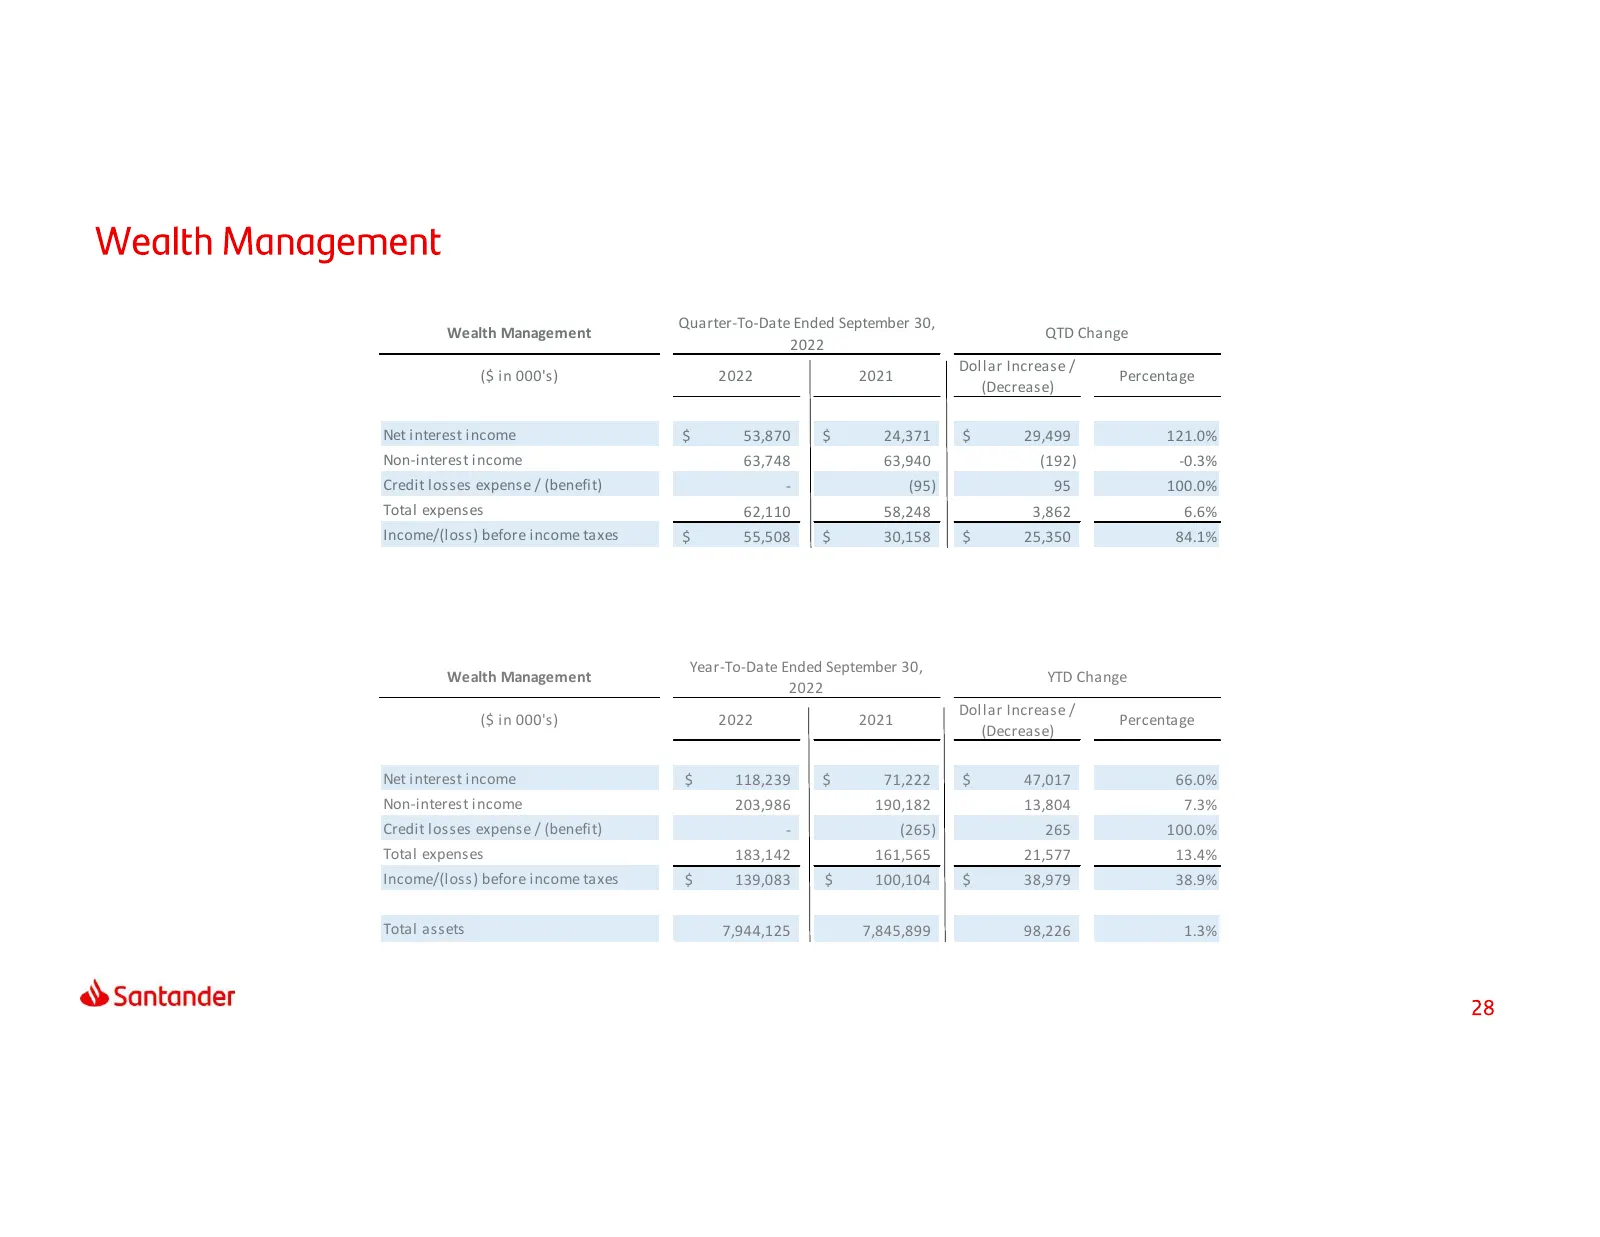
Slide 28: Wealth Management results
Quarter-To-Date Ended September 30, Wealth Management QTD Change 2022 Dollar Increase / ($ in 000's) 2022 2021 Percentage (Decrease) Net interest income $ 53,870 $ 24,371 $ 29,499 121.0% Non-interest income 63,748 63,940 (192) -0.3% Credit losses expense / (benefit) - (95) 95 100.0% Total expenses 6
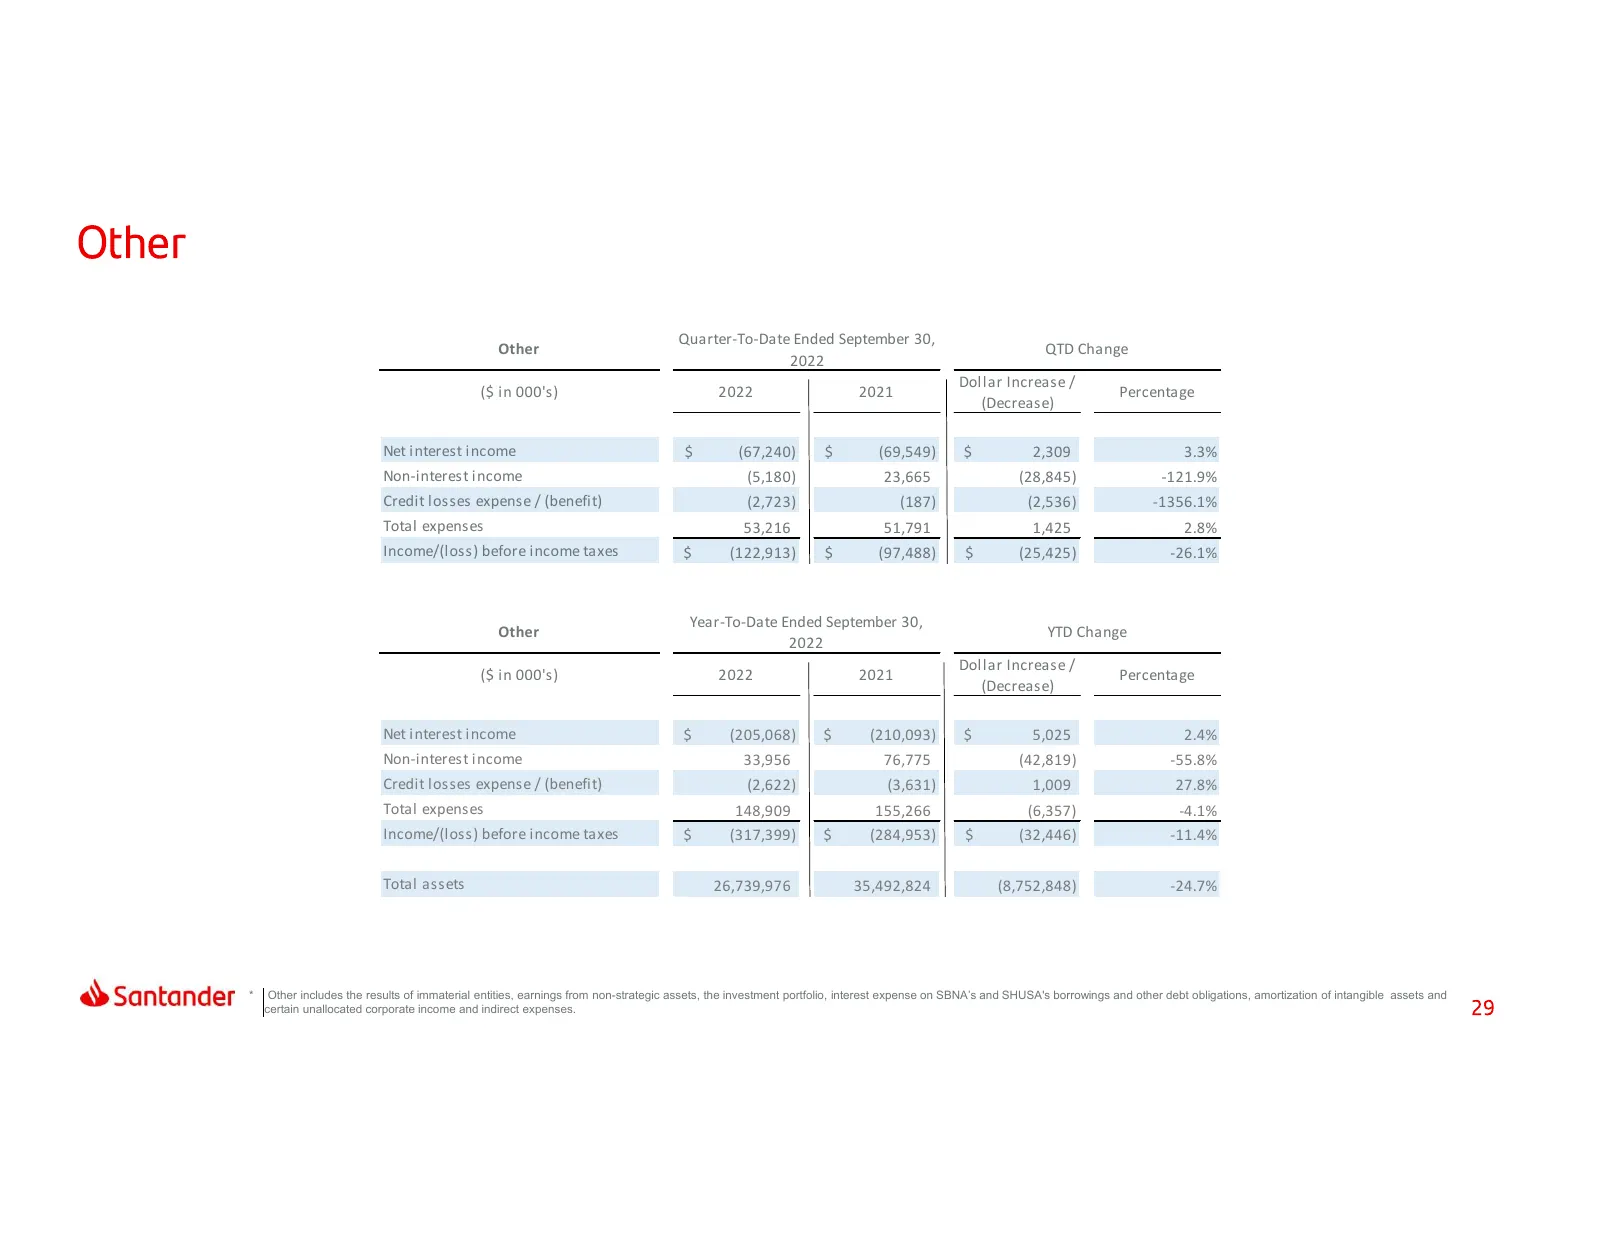
Slide 29: Other results
Quarter-To-Date Ended September 30, Other QTD Change 2022 Dollar Increase / ($ in 000's) 2022 2021 Percentage (Decrease) Net interest income $ (67,240) $ (69,549) $ 2,309 3.3% Non-interest income (5,180) 23,665 (28,845) -121.9% Credit losses expense / (benefit) (2,723) (187) (2,536) -1356.1% Total e
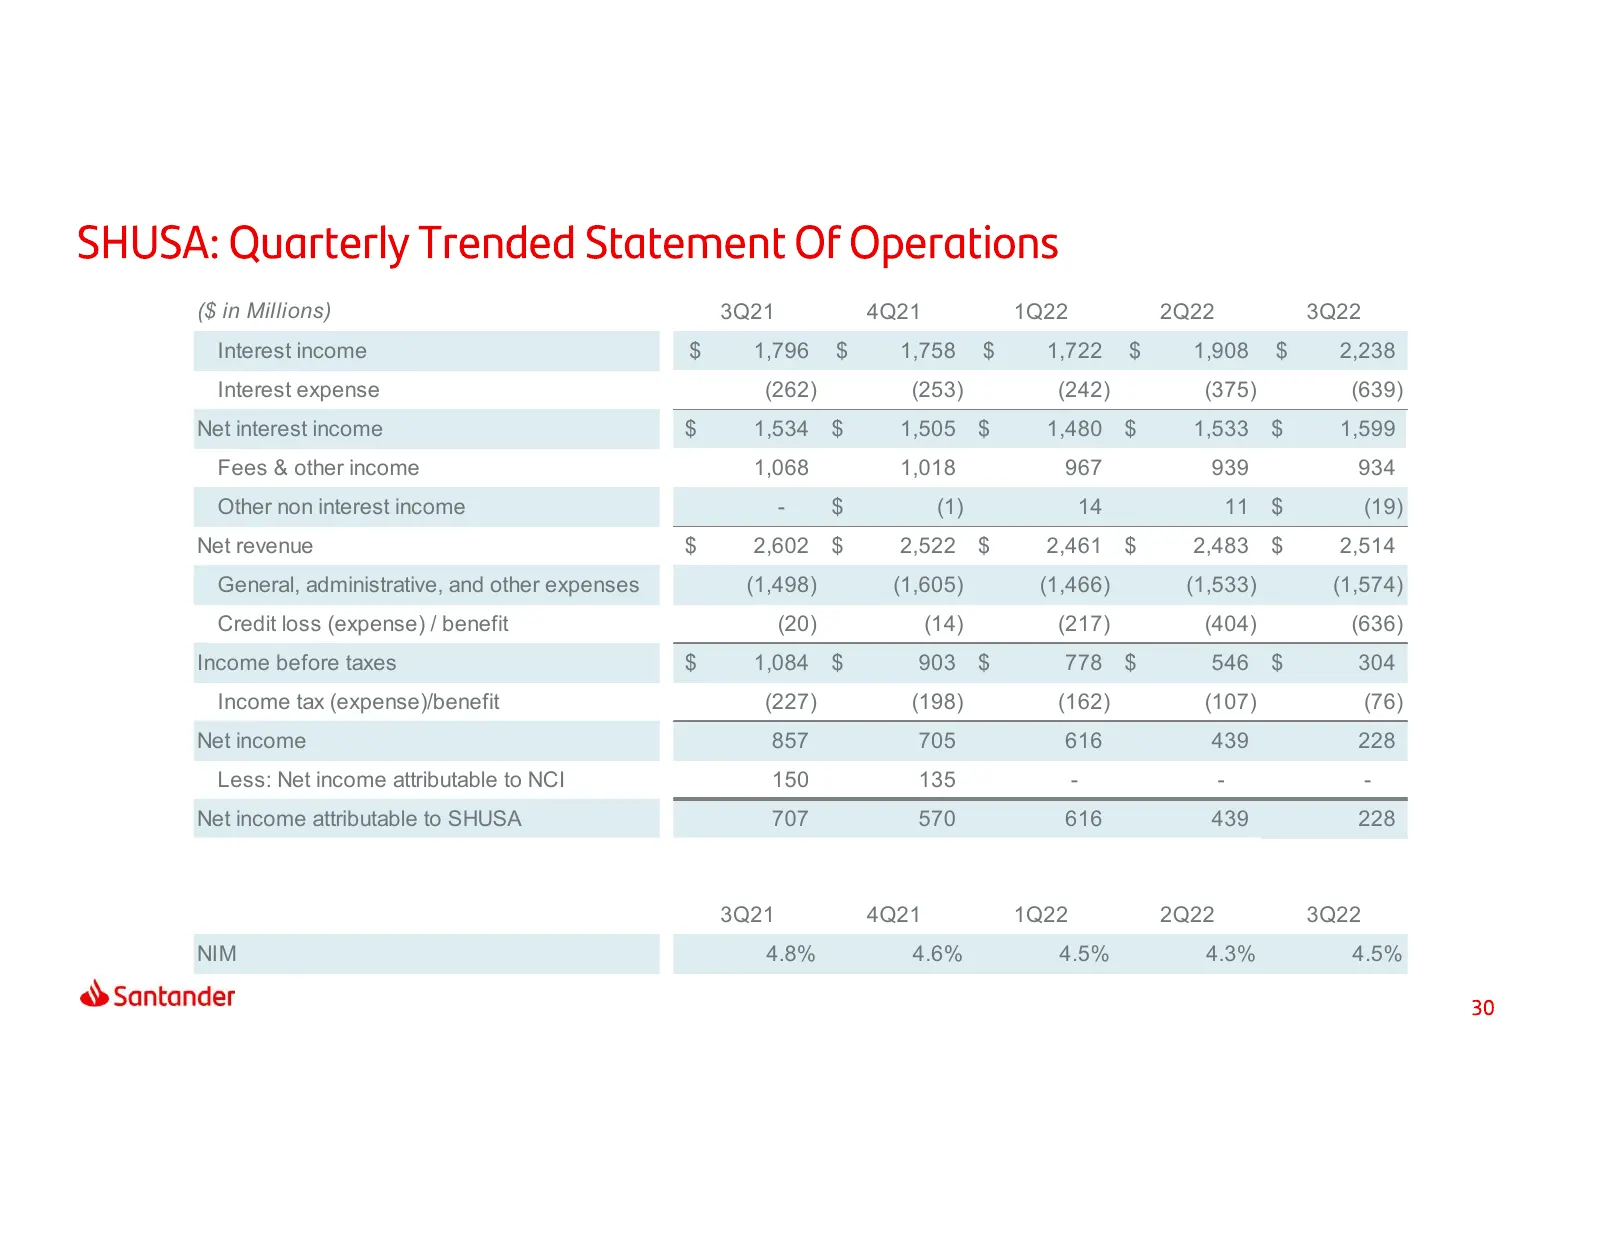
Slide 30: Consolidating income statement
($ in Millions) 3Q21 4Q21 1Q22 2Q22 3Q22 Interest income $ 1,796 $ 1,758 $ 1,722 $ 1,908 $ 2,238 Interest expense (262) (253) (242) (375) (639) Net interest income $ 1,534 $ 1,505 $ 1,480 $ 1,533 $ 1,599 Fees & other income 1,068 1,018 967 939 934 Other non interest income - $ (1) 14 11 $ (19) Net r
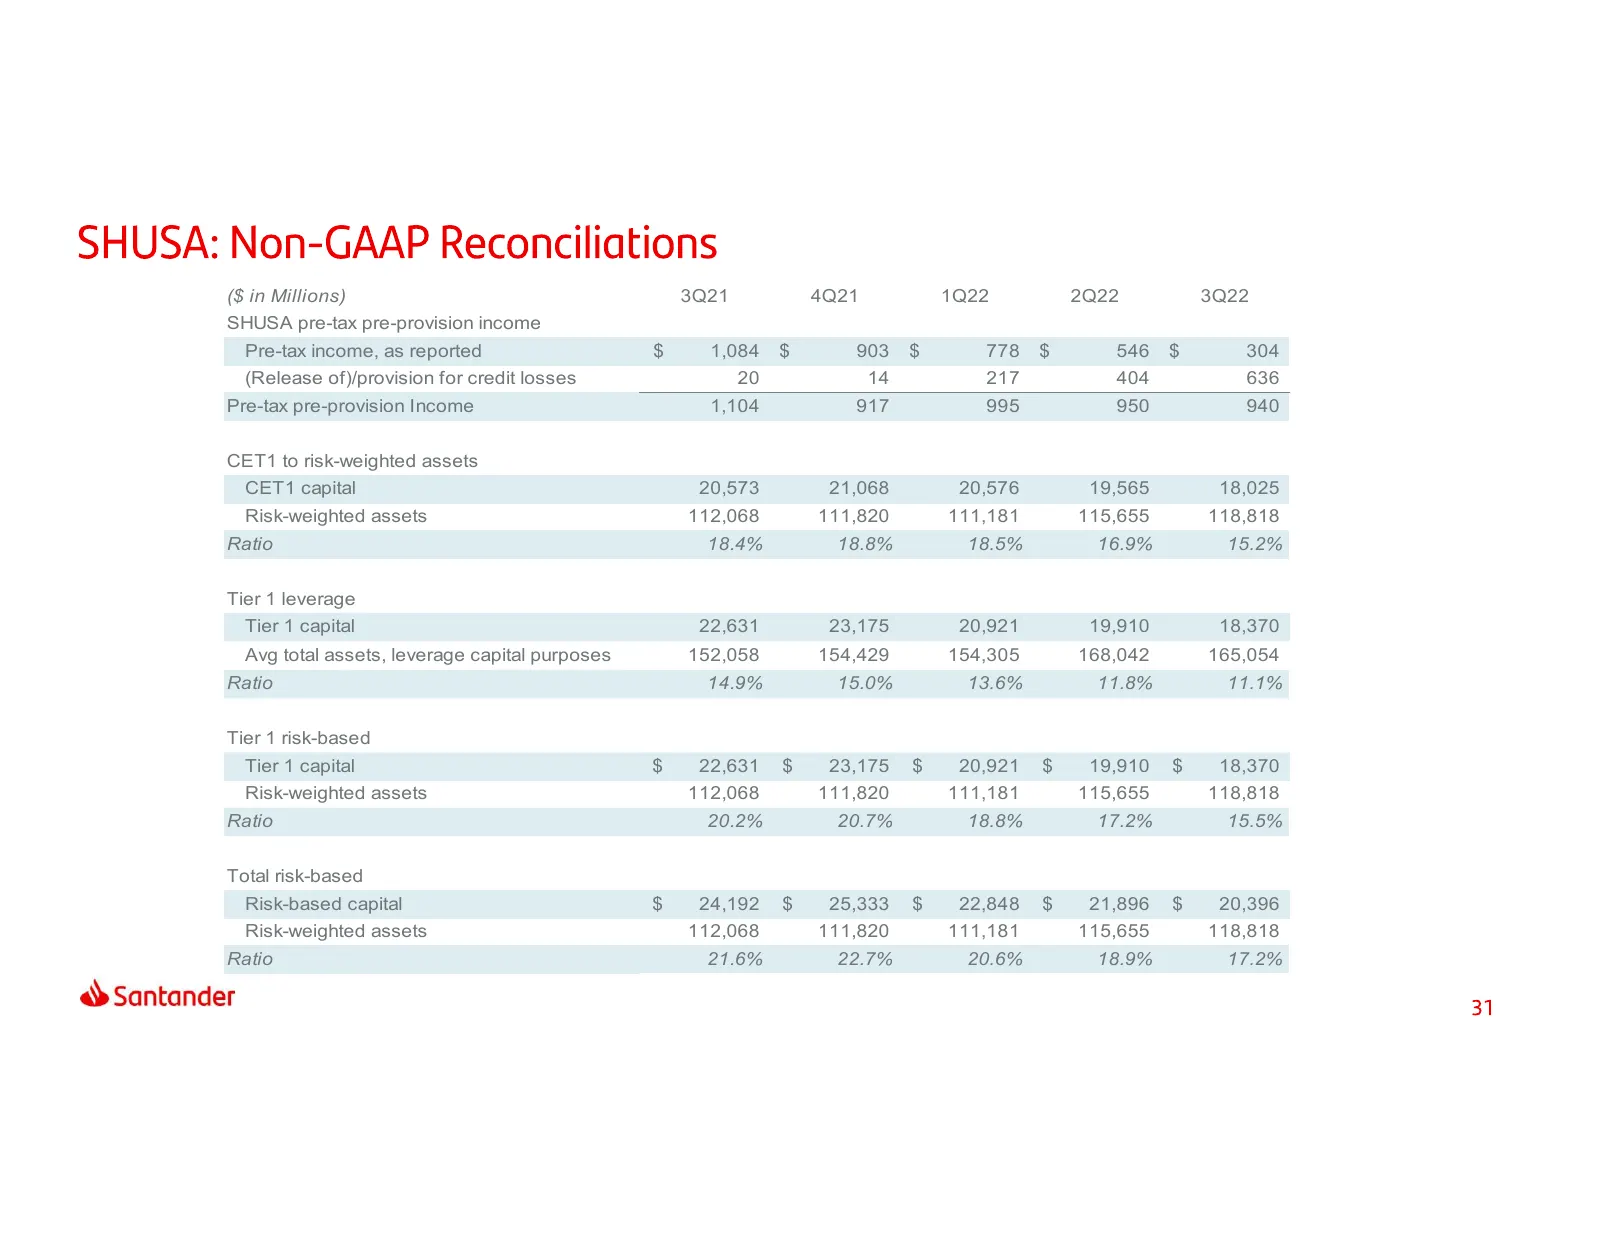
Slide 31: Non-GAAP reconciliation and capital ratios
($ in Millions) 3Q21 4Q21 1Q22 2Q22 3Q22 SHUSA pre-tax pre-provision income Pre-tax income, as reported $ 1,084 $ 903 $ 778 $ 546 $ 304 (Release of)/provision for credit losses 20 14 217 404 636 Pre-tax pre-provision Income 1,104 917 995 950 940 CET1 to risk-weighted assets CET1 capital 20,573 21,06
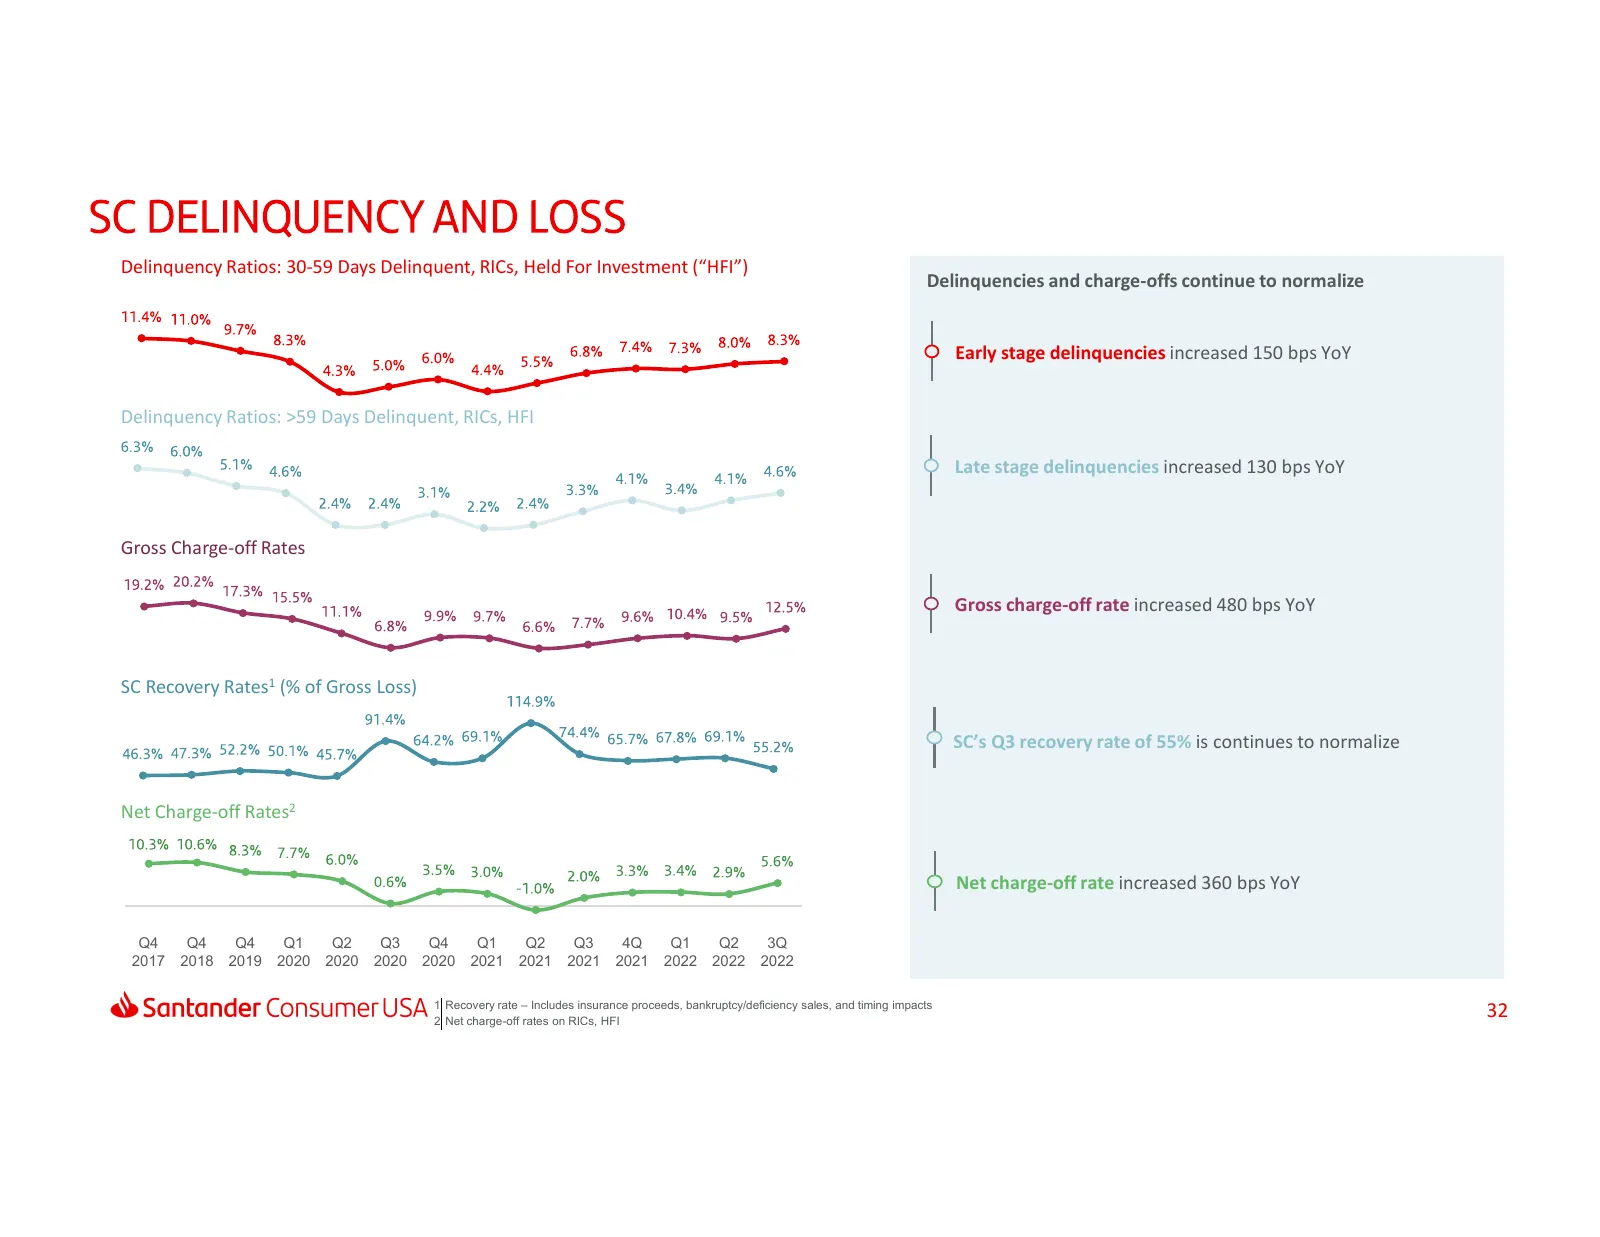
Slide 32: Delinquencies and charge-offs continue to normalize
Delinquency Ratios: 30-59 Days Delinquent, RICs, Held For Investment (“HFI”) Delinquencies and charge-offs continue to normalize Early stage delinquencies increased 150 bps YoY Delinquency Ratios: >59 Days Delinquent, RICs, HFI Late stage delinquencies increased 130 bps YoY Gross Charge-off Rates Gr
Slide 33: Thank You.
Thank You. Our purpose is to help people and businesses prosper. Our culture is based on believing that everything we do should be: Simple Personal Fair. Gow Jones, Indi @ ustainability Indices @ Santander Rie nme
Source: company website
More decks from Santander Holdings USA Inc
 Debt Investor Presentation (August 2026)30 slides · Aug 12, 2026
 Debt Investor Presentation (August 2026)30 slides · Aug 12, 2026
 Debt Investor Presentation (June 2026)29 slides · Jun 12, 2026
 Debt Investor Presentation (June 2026)29 slides · Jun 12, 2026
 Debt Investor Presentation (March 2026)36 slides · Mar 6, 2026
 Debt Investor Presentation (March 2026)36 slides · Mar 6, 2026