Santander Holdings USA Inc · NYSE:SNUS/PH
Santander Holdings USA — Debt Investor Presentation (March 2026)
36 slides from Santander Holdings USA's debt investor presentation, Mar 6, 2026
Slide 1: Fourth Quarter 2025 Fixed Income Investor Presentation
1 Confidential March 6, 2026 SANTANDER HOLDINGS USA, INC. Fourth Quarter 2025 Fixed Income Investor Presentation
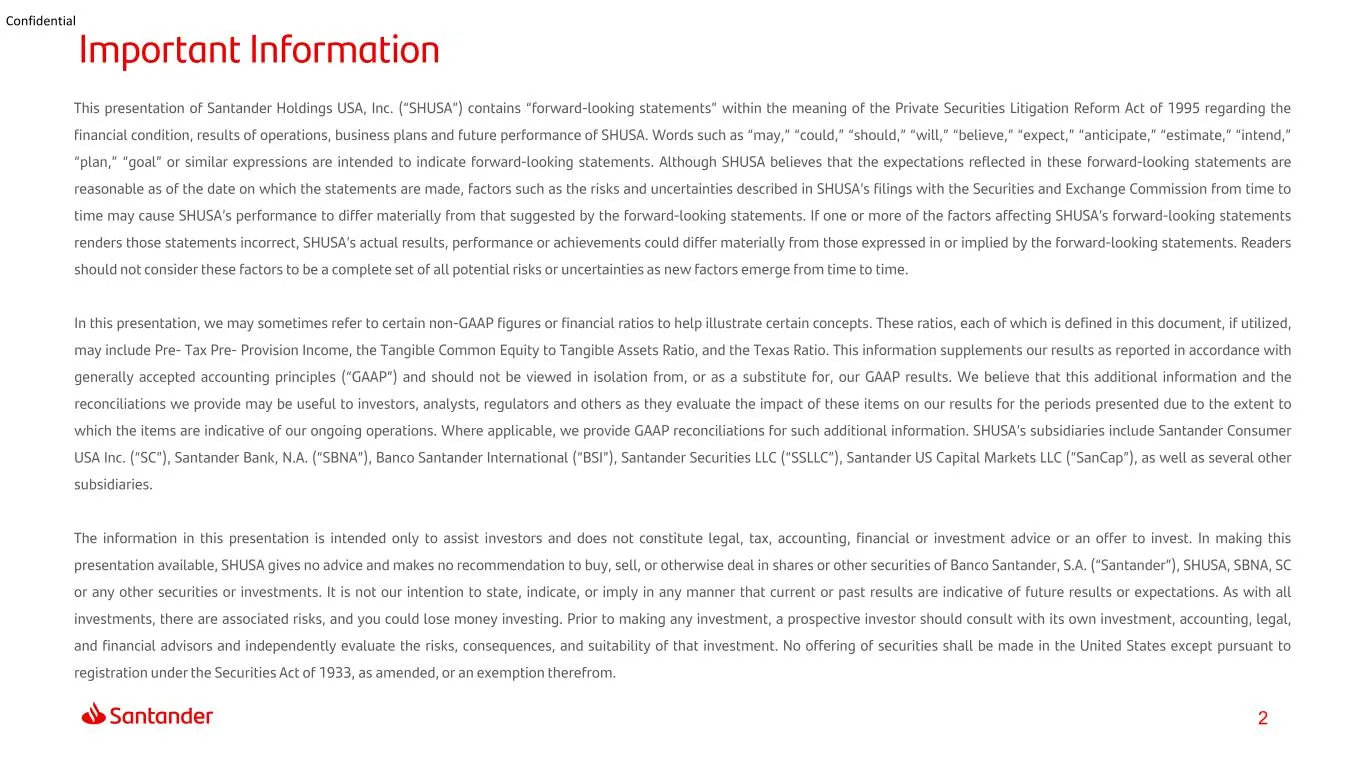
Slide 2: Forward-looking statements and non-GAAP disclaimer
2 Confidential This presentation of Santander Holdings USA, Inc. (“SHUSA”) contains “forward-looking statements” within the meaning of the Private Securities Litigation Reform Act of 1995 regarding the financial condition, results of operations, business plans and future performance of SHUSA. Words
Slide 3: Index: At a glance
3 Confidential 1 At a glance 2 Results Appendix 4 Index 3 Core Business Activities
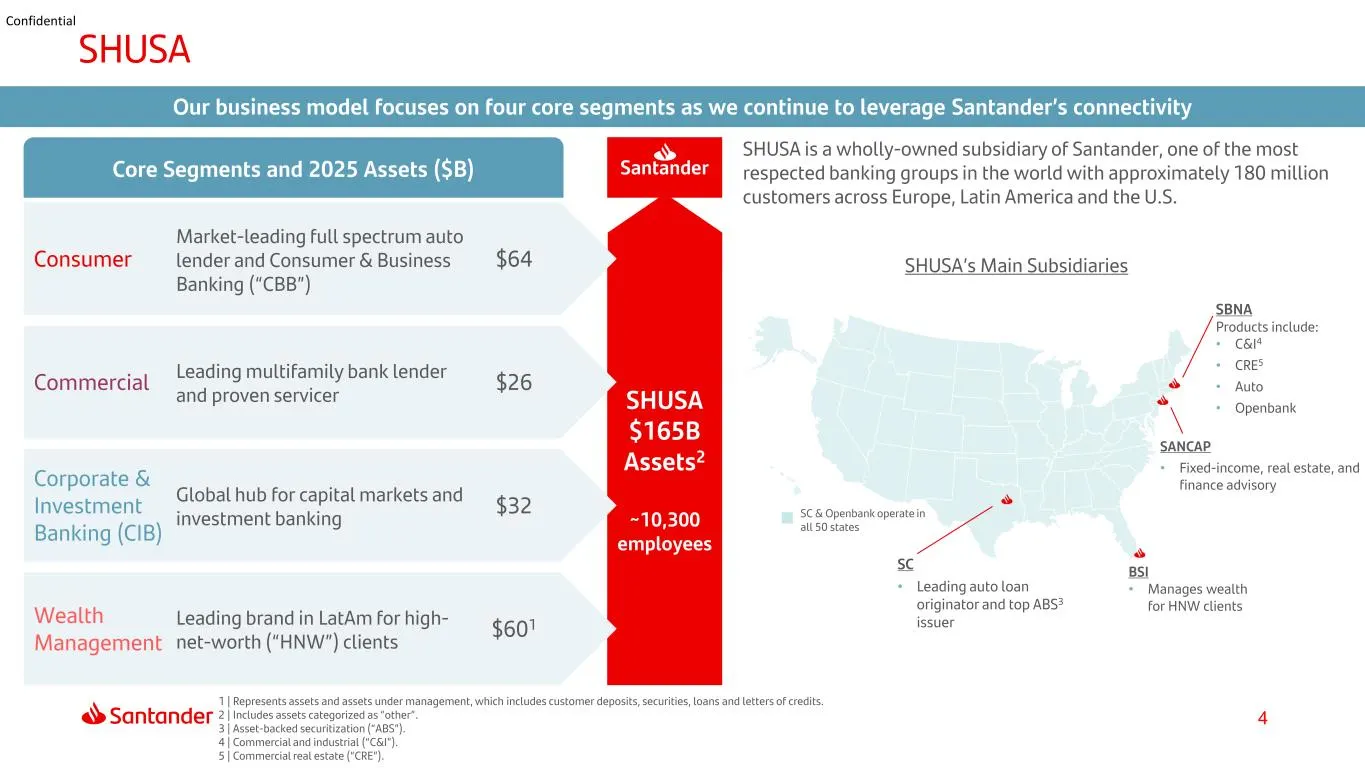
Slide 4: Business model focuses on four core segments
4 Confidential Santander SHUSA $165B Assets2 ~10,300 employees Our business model focuses on four core segments as we continue to leverage Santander’s connectivity Core Segments and 2025 Assets ($B) Consumer Market-leading full spectrum auto lender and Consumer & Business Banking (“CBB”) $64 Commerc
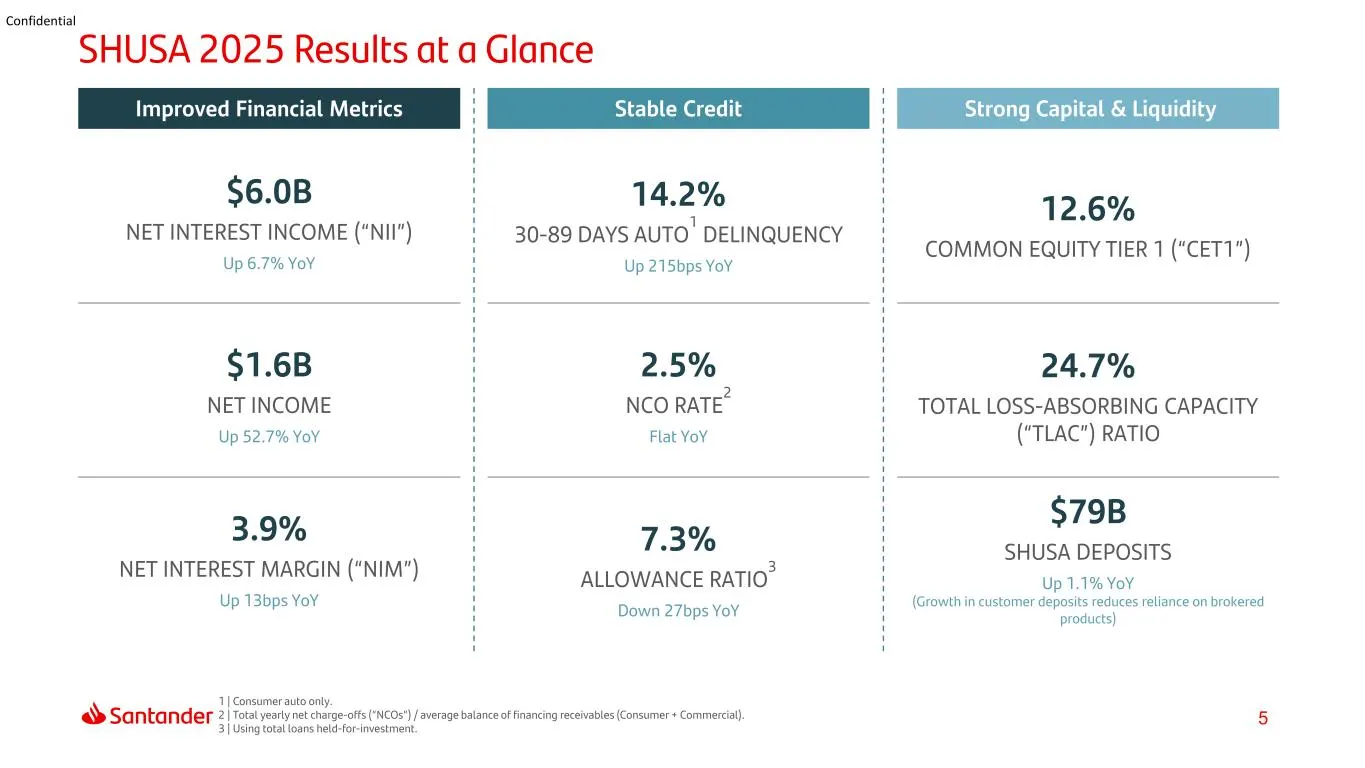
Slide 5: SHUSA 2025 Results at a Glance
5 Confidential SHUSA 2025 Results at a Glance Improved Financial Metrics Stable Credit Strong Capital & Liquidity $6.0B NET INTEREST INCOME (“NII”) Up 6.7% YoY 14.2% 30-89 DAYS AUTO1 DELINQUENCY Up 215bps YoY 12.6% COMMON EQUITY TIER 1 (“CET1”) $1.6B NET INCOME Up 52.7% YoY 2.5% NCO RATE2 Flat YoY 2
Slide 6: Results
6 Confidential 1 At a glance 2 Results Appendix 4 Index 3 Core Business Activities
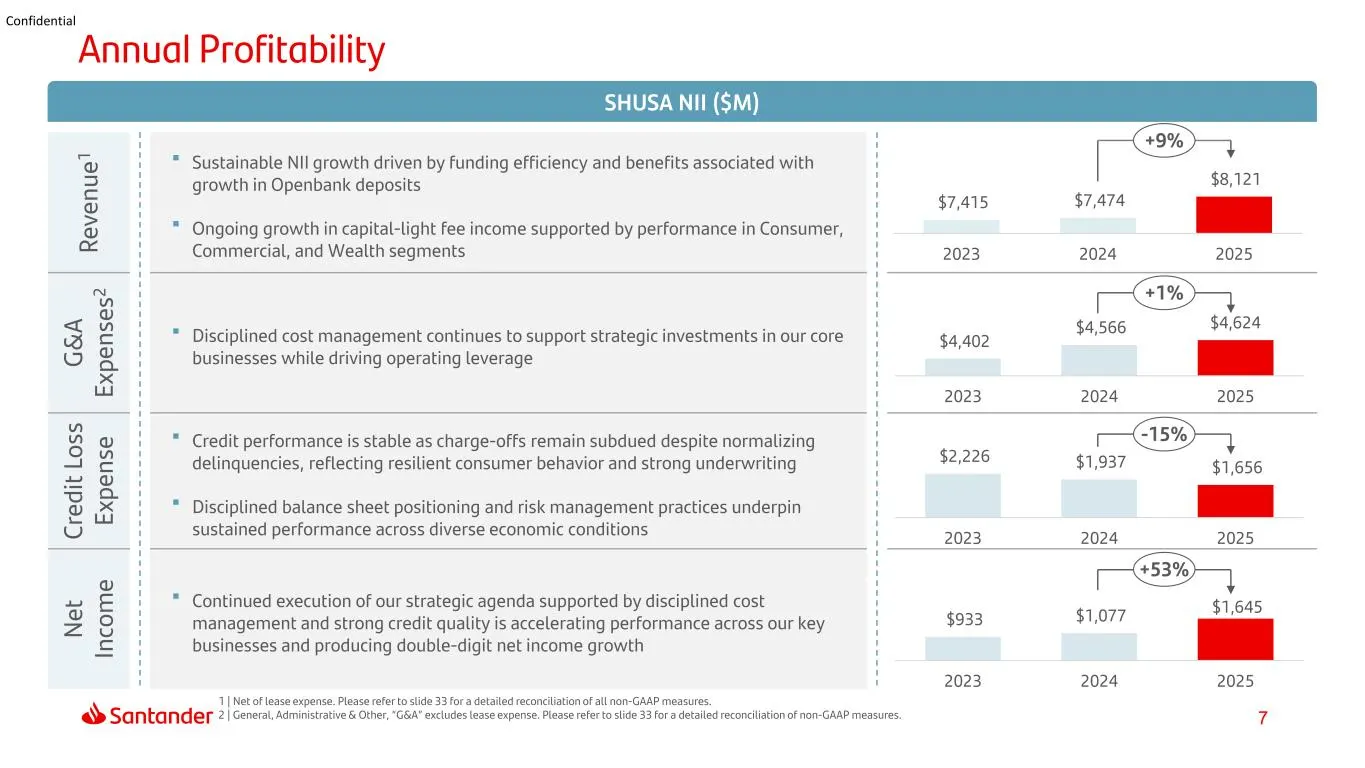
Slide 7: 2025 performance drivers
7 Confidential Re ve nu e1 Sustainable NII growth driven by funding efficiency and benefits associated with growth in Openbank deposits Ongoing growth in capital-light fee income supported by performance in Consumer, Commercial, and Wealth segments G& A Ex pe ns es 2 Disciplined cost managemen
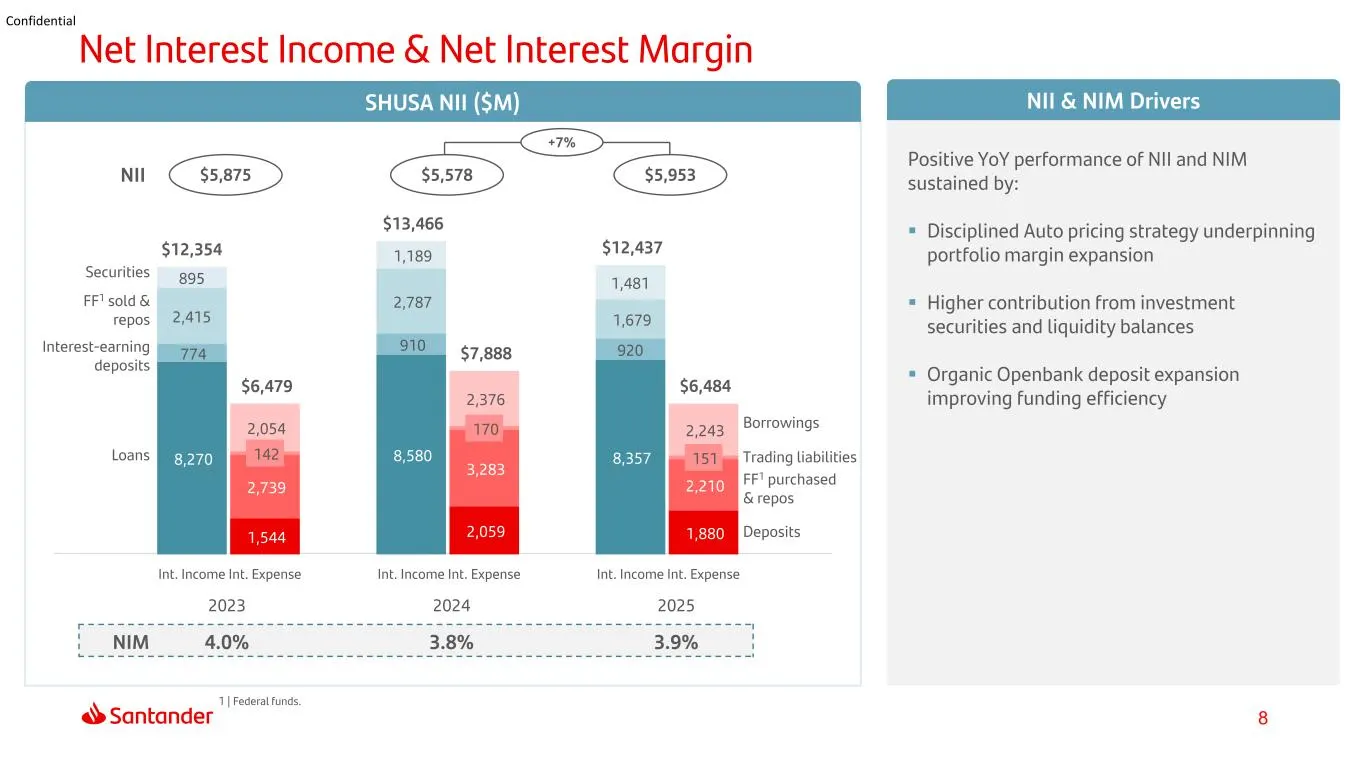
Slide 8: Net Interest Income & Net Interest Margin
8 Confidential Positive YoY performance of NII and NIM sustained by: Disciplined Auto pricing strategy underpinning portfolio margin expansion Higher contribution from investment securities and liquidity balances Organic Openbank deposit expansion improving funding efficiency NII Securities FF
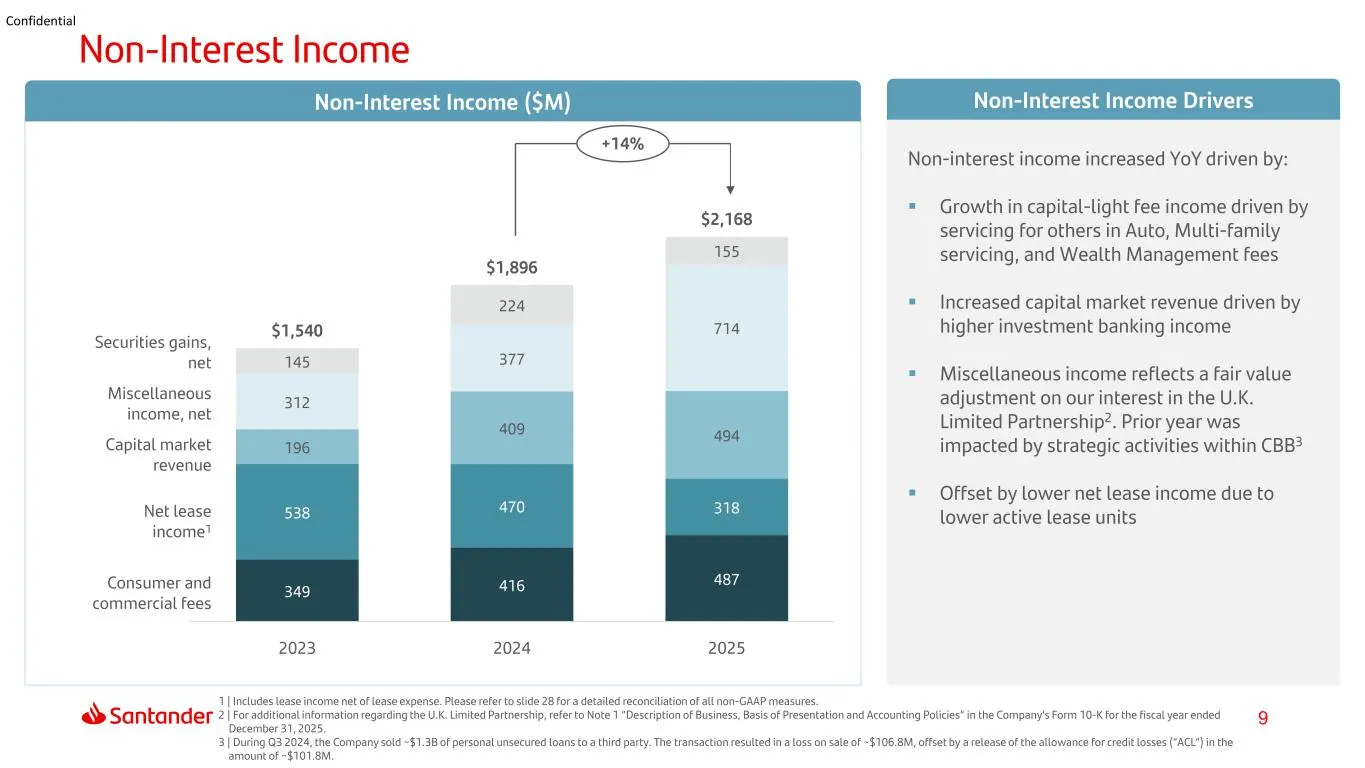
Slide 9: Non-Interest Income
9 Confidential Securities gains, net Miscellaneous income, net Capital market revenue Net lease income1 Consumer and commercial fees 349 416 487 538 470 318 196 409 494 312 377 714 145 224 155 $1,540 $1,896 $2,168 2023 2024 2025 Non-Interest Income Non-interest income increased YoY driven by: Grow
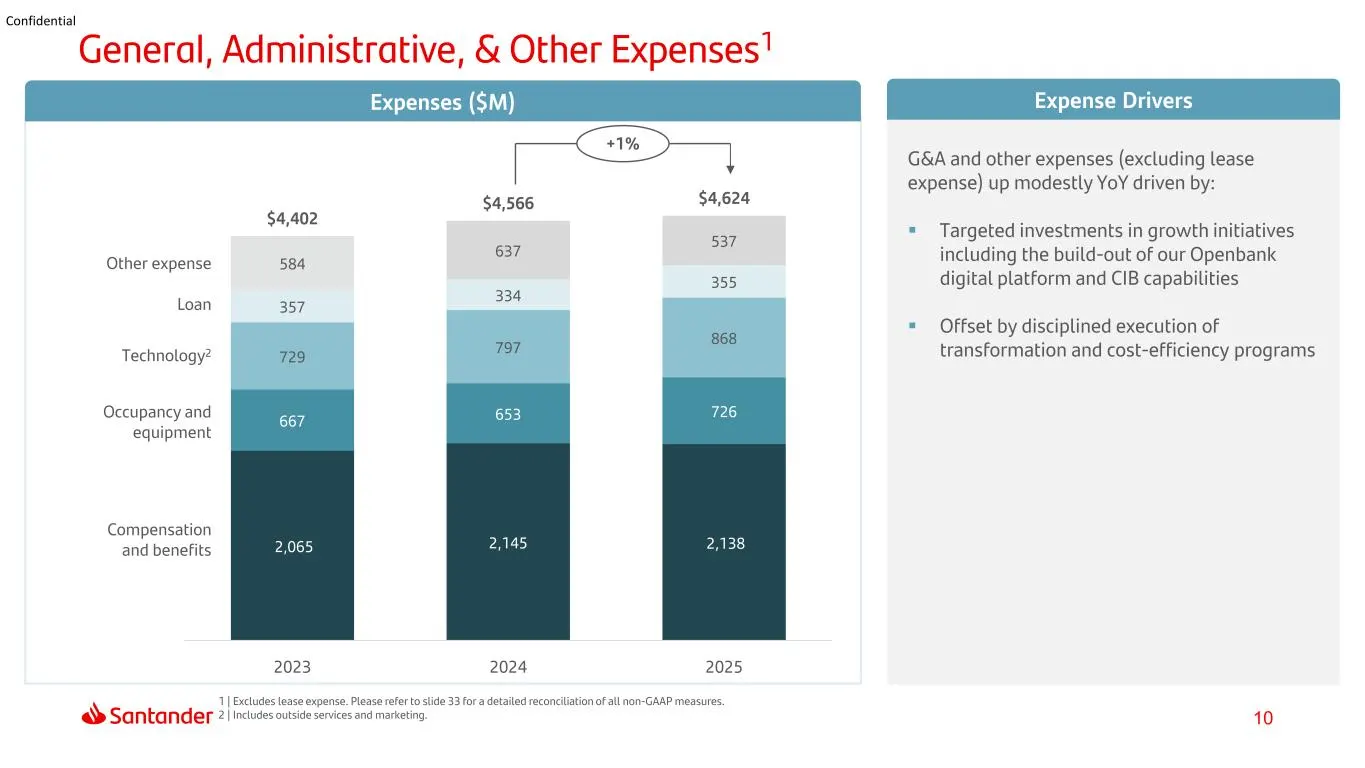
Slide 10: General, Administrative, & Other Expenses
10 Confidential 2,065 2,145 2,138 667 653 726 729 797 868 357 334 355 584 637 537 $4,402 $4,566 $4,624 2023 2024 2025 Other expense Loan Technology2 Occupancy and equipment Compensation and benefits General, Administrative, & Other Expenses1 G&A and other expenses (excluding lease expense) up modest
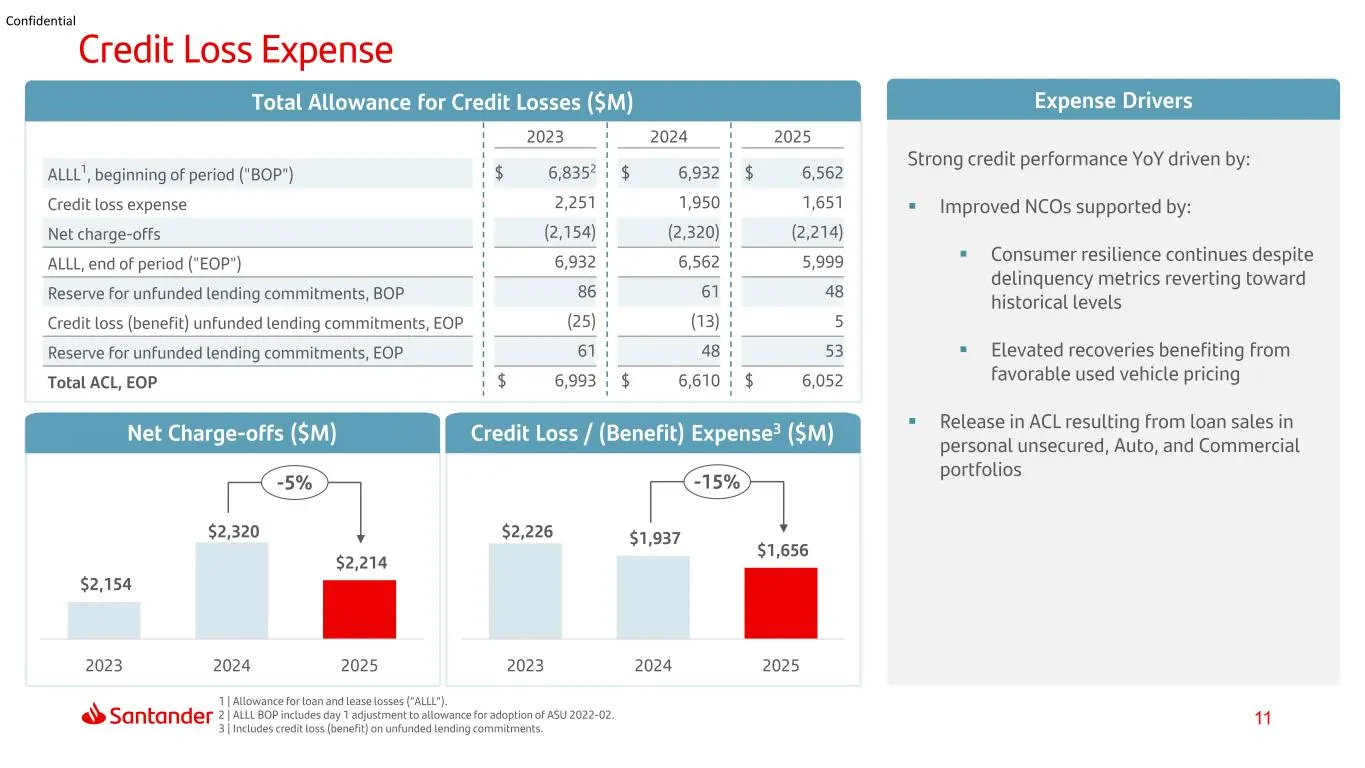
Slide 11: Credit Loss Expense and Allowance for Credit Losses
11 Confidential Strong credit performance YoY driven by: Improved NCOs supported by: Consumer resilience continues despite delinquency metrics reverting toward historical levels Elevated recoveries benefiting from favorable used vehicle pricing Release in ACL resulting from loan sales in per
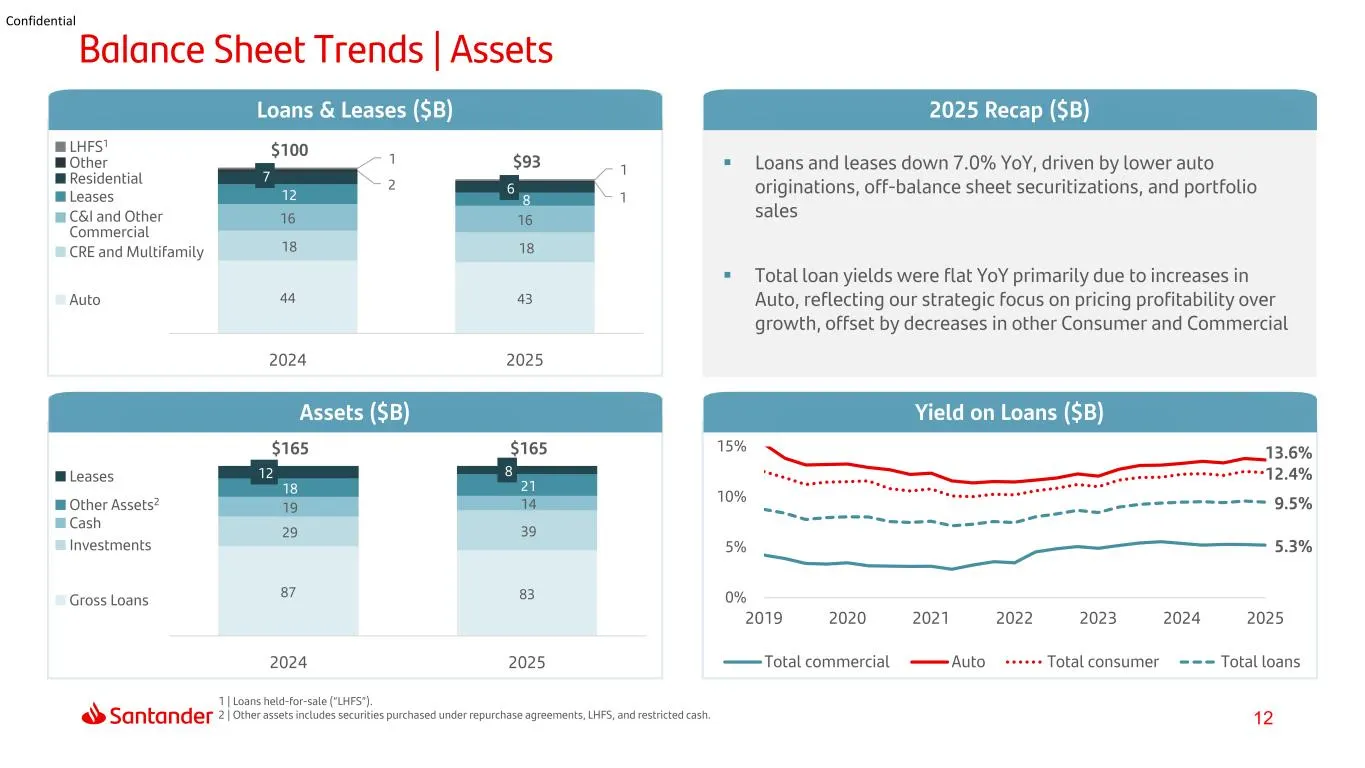
Slide 12: Balance Sheet Trends | Assets
12 Confidential 87 83 29 39 19 14 18 21 12 8 $165 $165 2024 2025 Loans and leases down 7.0% YoY, driven by lower auto originations, off-balance sheet securitizations, and portfolio sales Total loan yields were flat YoY primarily due to increases in Auto, reflecting our strategic focus on pricing
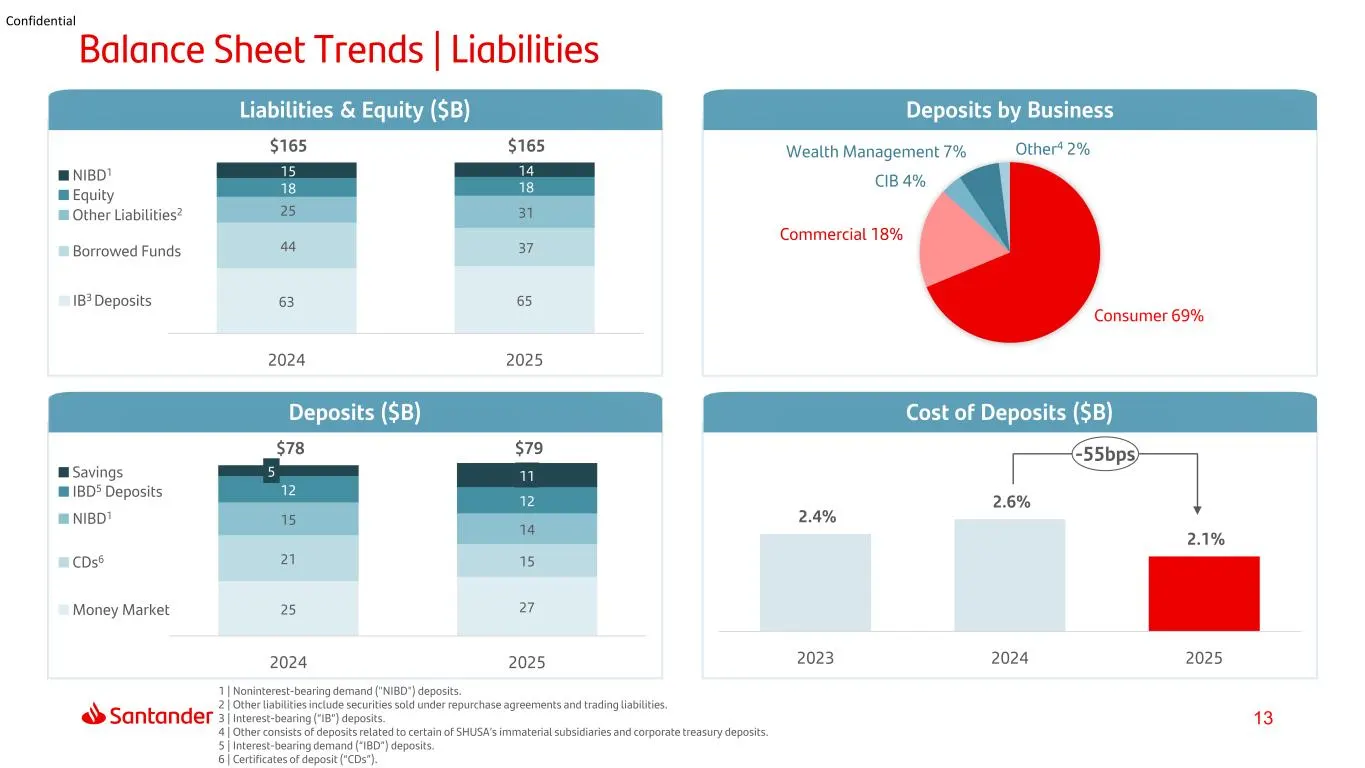
Slide 13: Balance Sheet Trends | Liabilities
13 Confidential 2.4% 2.6% 2.1% 2023 2024 2025 25 27 21 15 15 14 12 12 5 11 $78 $79 2024 2025 63 65 44 37 25 31 18 18 15 14 $165 $165 2024 2025 IBD5 Deposits Balance Sheet Trends | Liabilities Deposits ($B) Cost of Deposits ($B) Liabilities & Equity ($B) Deposits by Business Consumer 69% Commercial 1
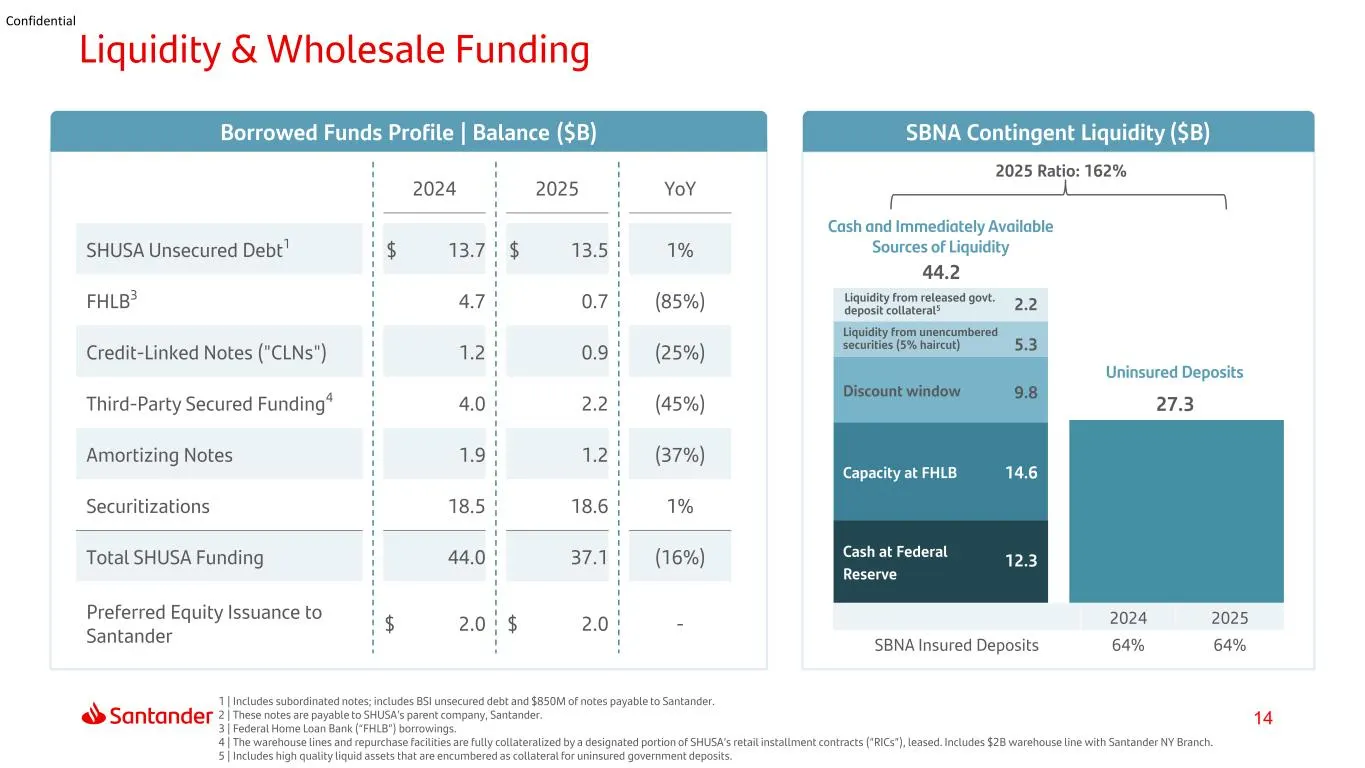
Slide 14: Liquidity & Wholesale Funding
14 Confidential Cash at Federal Reserve Capacity at FHLB Discount window Liquidity from unencumbered securities (5% haircut) Liquidity from released govt. deposit collateral5 44.2 27.3 Liquidity & Wholesale Funding Cash and Immediately Available Sources of Liquidity Uninsured Deposits 2024 2025 SBNA
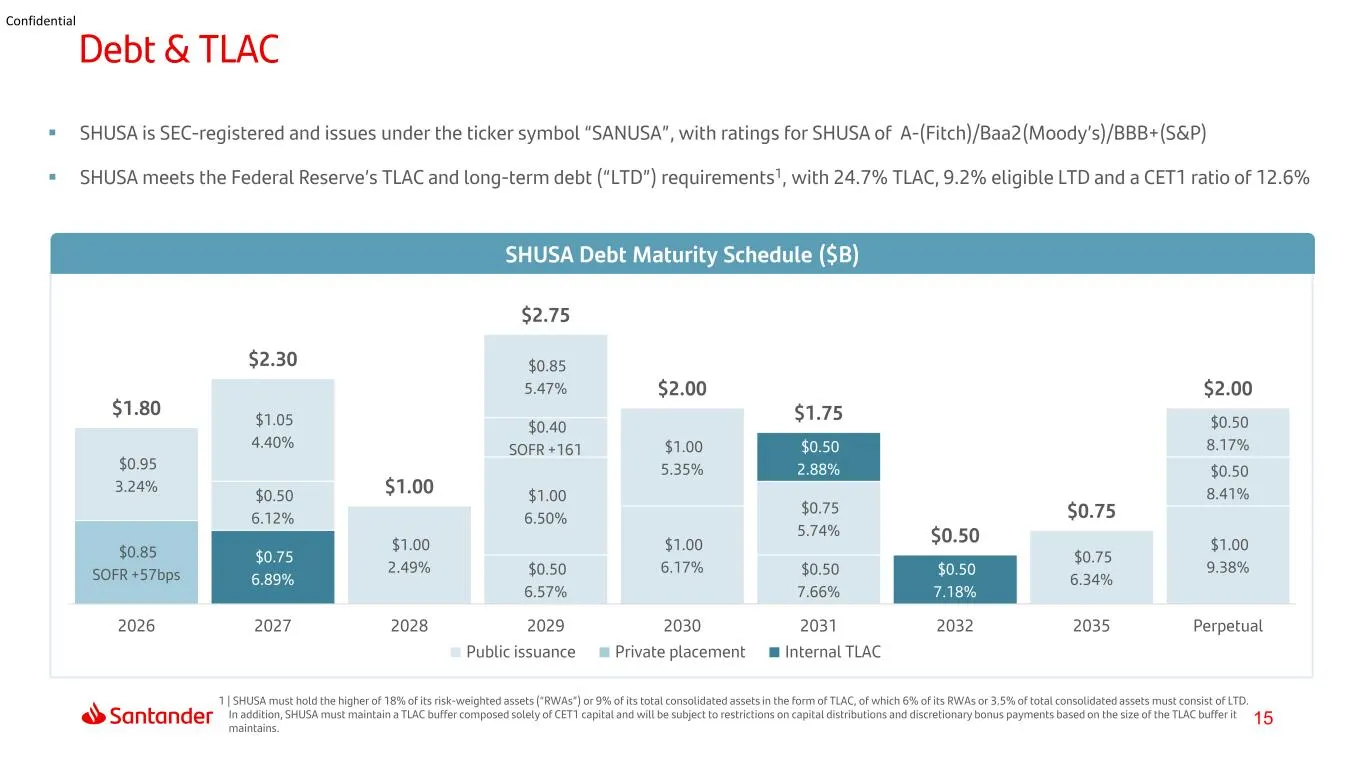
Slide 15: Debt & TLAC
15 Confidential $0.50 6.57% $0.75 6.89% $1.00 6.50% $0.50 7.66% $1.00 9.38% $0.85 SOFR +57bps $0.50 6.12% $0.40 SOFR +161 $1.00 6.17% $0.75 5.74% $0.50 8.41% $0.95 3.24% $1.05 4.40% $1.00 2.49% $0.85 5.47% $1.00 5.35% $0.50 2.88% $0.50 7.18% $0.75 6.34% $0.50 8.17% $1.80 $2.30 $1.00 $2.75 $2.00 $1.7
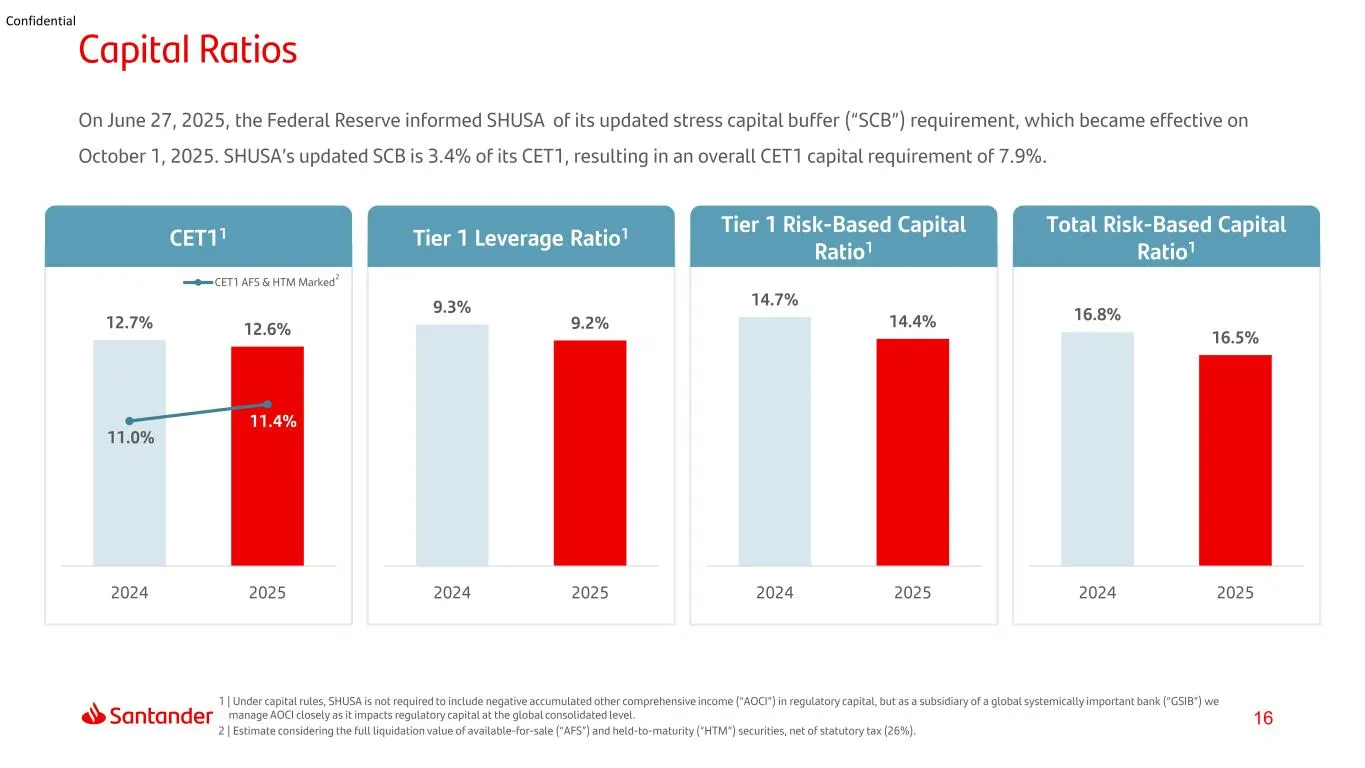
Slide 16: Capital Ratios
16 Confidential On June 27, 2025, the Federal Reserve informed SHUSA of its updated stress capital buffer (“SCB”) requirement, which became effective on October 1, 2025. SHUSA’s updated SCB is 3.4% of its CET1, resulting in an overall CET1 capital requirement of 7.9%. Capital Ratios 1 | Under capita
Slide 17: Core Business Activities
17 Confidential 1 At a glance 2 Results Appendix 4 Index 3 Core Business Activities
Slide 18: Business Activities Overview
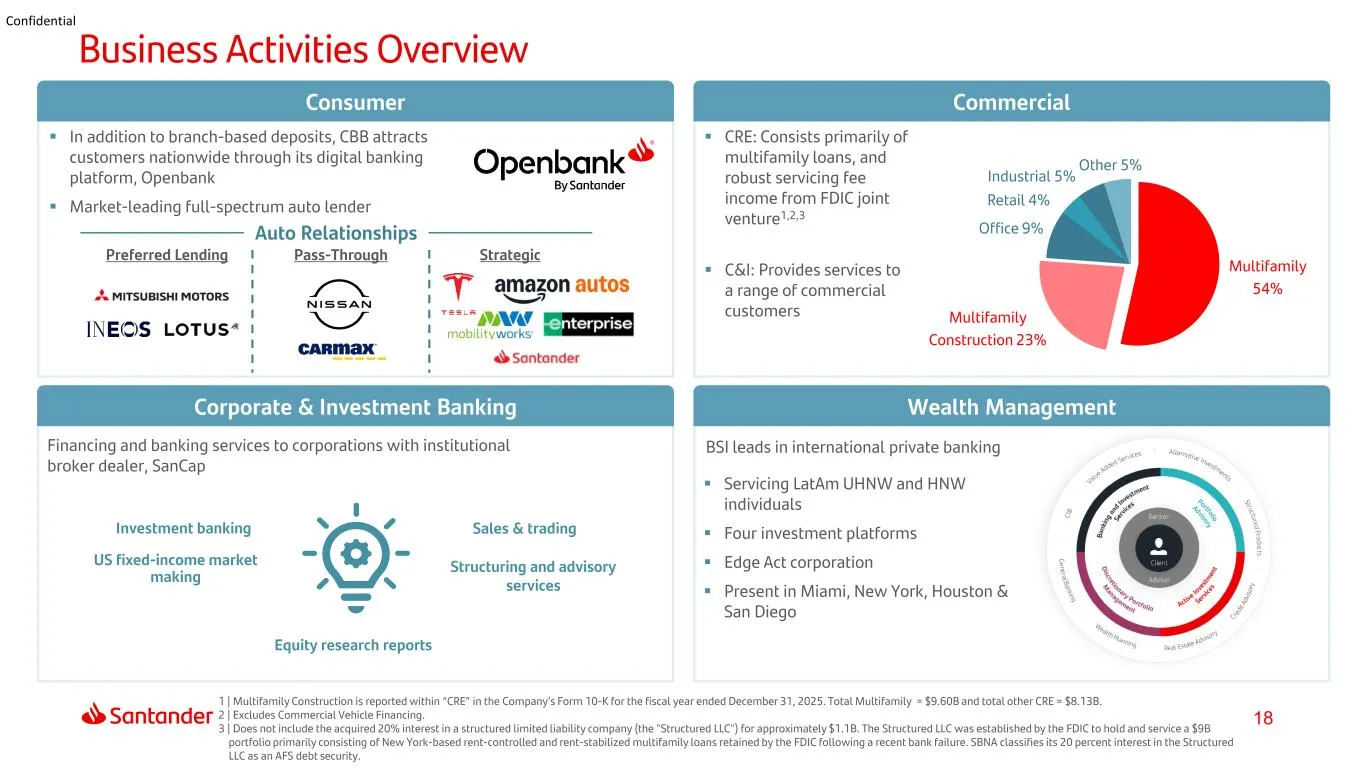
18 Confidential 1 | Multifamily Construction is reported within “CRE” in the Company’s Form 10-K for the fiscal year ended December 31, 2025. Total Multifamily = $9.60B and total other CRE = $8.13B. 2 | Excludes Commercial Vehicle Financing. 3 | Does not include the acquired 20% interest in a struct
Slide 19: Consumer Activities | Auto & CBB
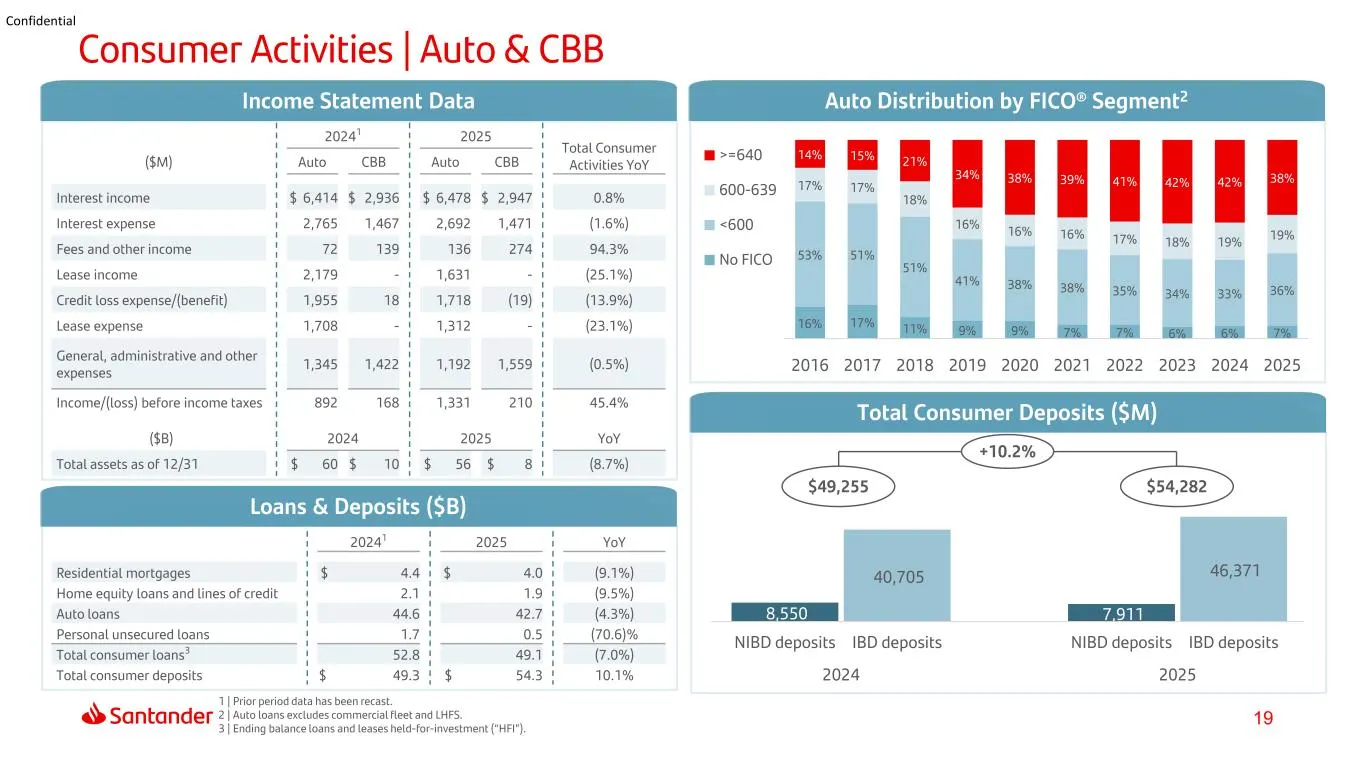
19 Confidential Consumer Activities | Auto & CBB 1 | Prior period data has been recast. 2 | Auto loans excludes commercial fleet and LHFS. 3 | Ending balance loans and leases held-for-investment (“HFI”). Loans & Deposits ($B) Income Statement Data Total Consumer Deposits ($M) Auto Distribution by FI
Slide 20: Commercial Activities | CRE, Multifamily, and C&I
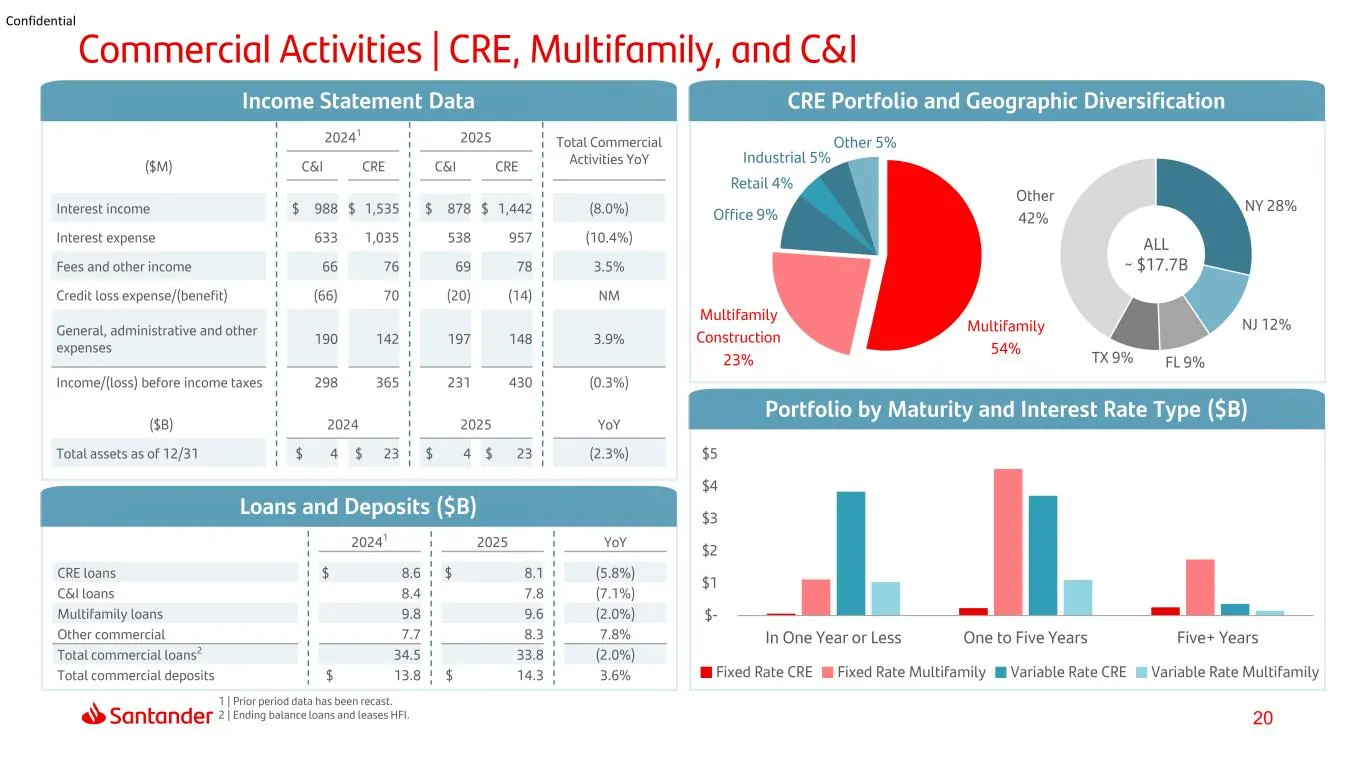
20 Confidential Commercial Activities | CRE, Multifamily, and C&I Loans and Deposits ($B) Income Statement Data Portfolio by Maturity and Interest Rate Type ($B) CRE Portfolio and Geographic Diversification 20241 2025 Total Commercial Activities YoY($M) C&I CRE C&I CRE Interest income $ 988 $ 1,535
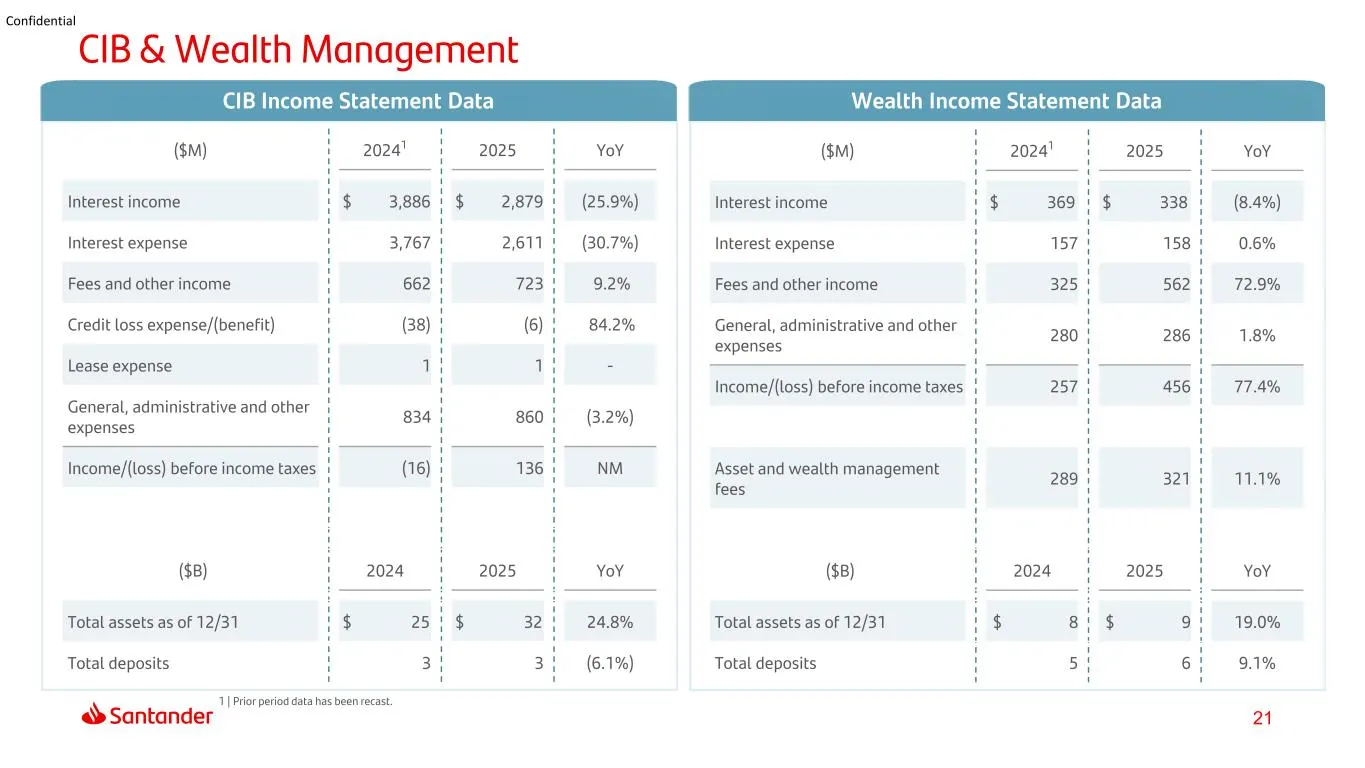
Slide 21: CIB & Wealth Management
21 Confidential CIB & Wealth Management CIB Income Statement Data Wealth Income Statement Data 1 | Prior period data has been recast. ($M) 20241 2025 YoY Interest income $ 3,886 $ 2,879 (25.9%) Interest expense 3,767 2,611 (30.7%) Fees and other income 662 723 9.2% Credit loss expense/(benefit) (38)
Slide 22: Appendix
22 Confidential 1 At a glance 2 Results Appendix 4 Index 3 Core Business Activities
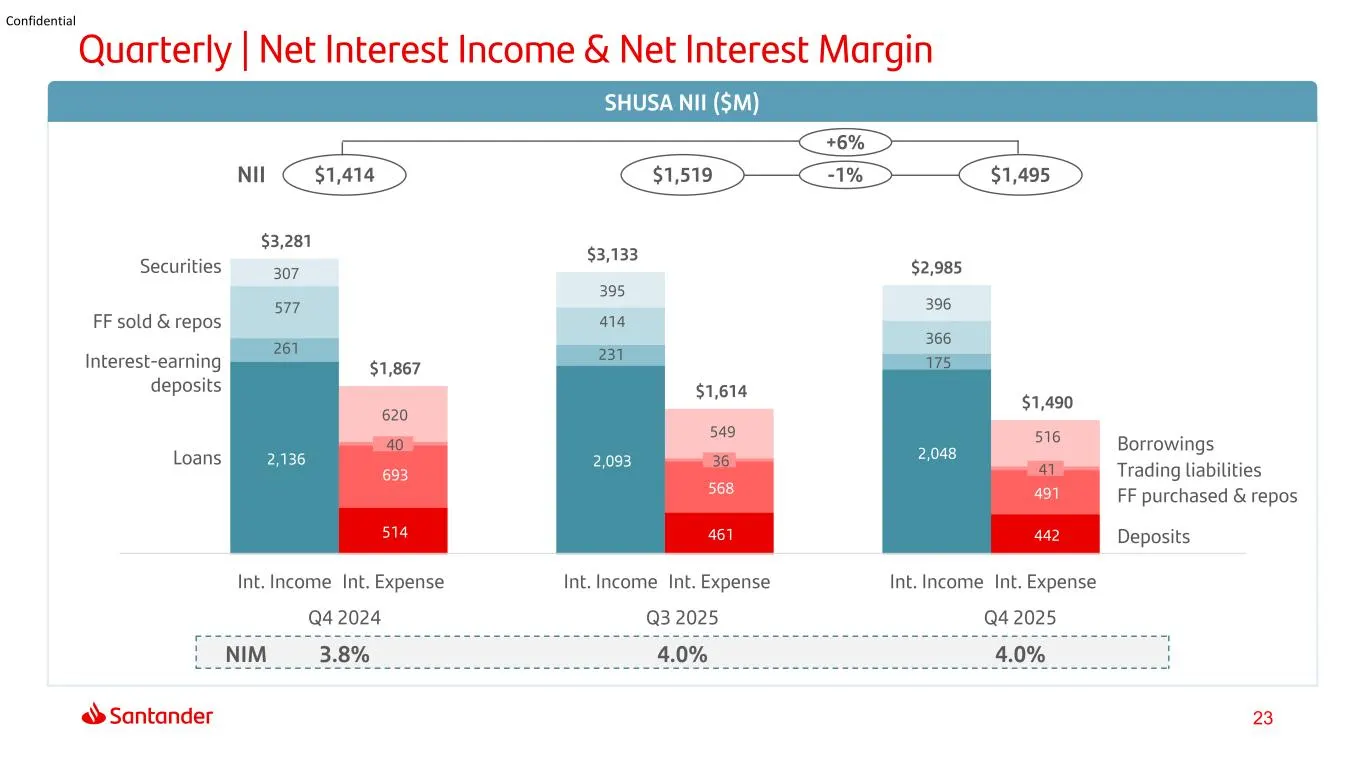
Slide 23: Quarterly Net Interest Income & Net Interest Margin
23 Confidential 2,136 2,093 2,048 261 231 175 577 414 366 307 395 396 514 461 442 693 568 491 40 36 41 620 549 516 $3,281 $1,867 $3,133 $1,614 $2,985 $1,490 Int. Income Int. Expense Int. Income Int. Expense Int. Income Int. Expense Q4 2024 Q3 2025 Q4 2025 NII Securities FF sold & repos Interest-earn
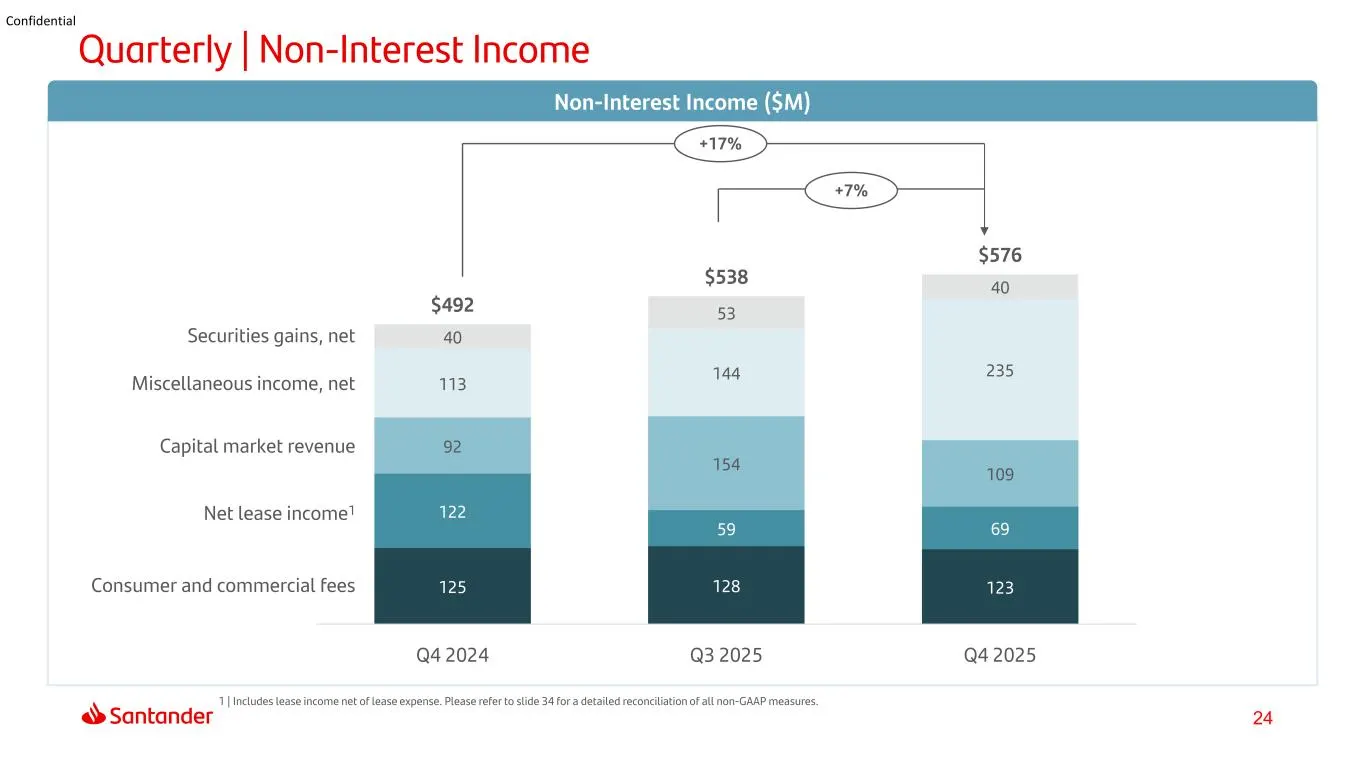
Slide 24: Quarterly Non-Interest Income
24 Confidential 125 128 123 122 59 69 92 154 109 113 144 235 40 53 40 $492 $538 $576 Q4 2024 Q3 2025 Q4 2025 Quarterly | Non-Interest Income 1 | Includes lease income net of lease expense. Please refer to slide 34 for a detailed reconciliation of all non-GAAP measures. Non-Interest Income ($M) +7% +
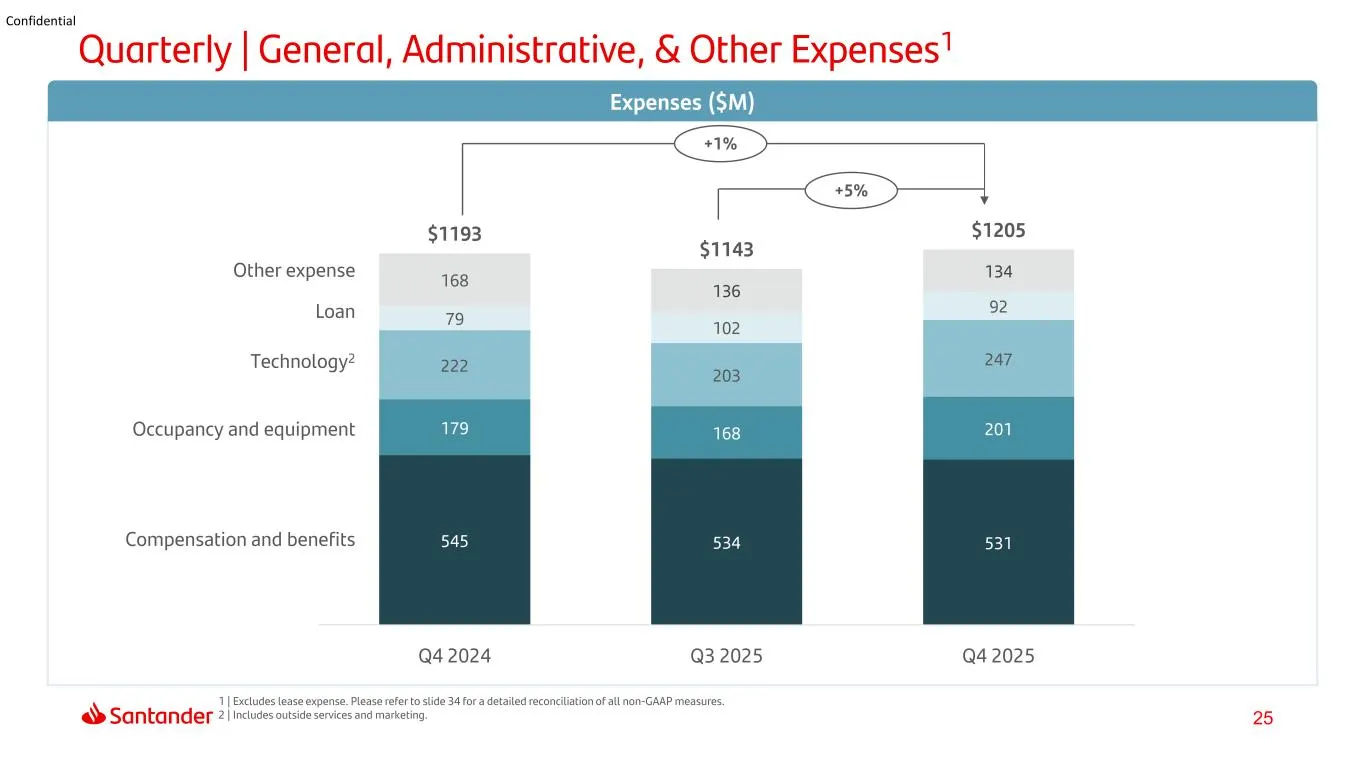
Slide 25: Quarterly General, Administrative, & Other Expenses
25 Confidential 545 534 531 179 168 201 222 203 247 79 102 92 168 136 134 $1193 $1143 $1205 Q4 2024 Q3 2025 Q4 2025 Expenses ($M) +5% +1% Other expense Loan Technology2 Occupancy and equipment Compensation and benefits Quarterly | General, Administrative, & Other Expenses1 1 | Excludes lease expense
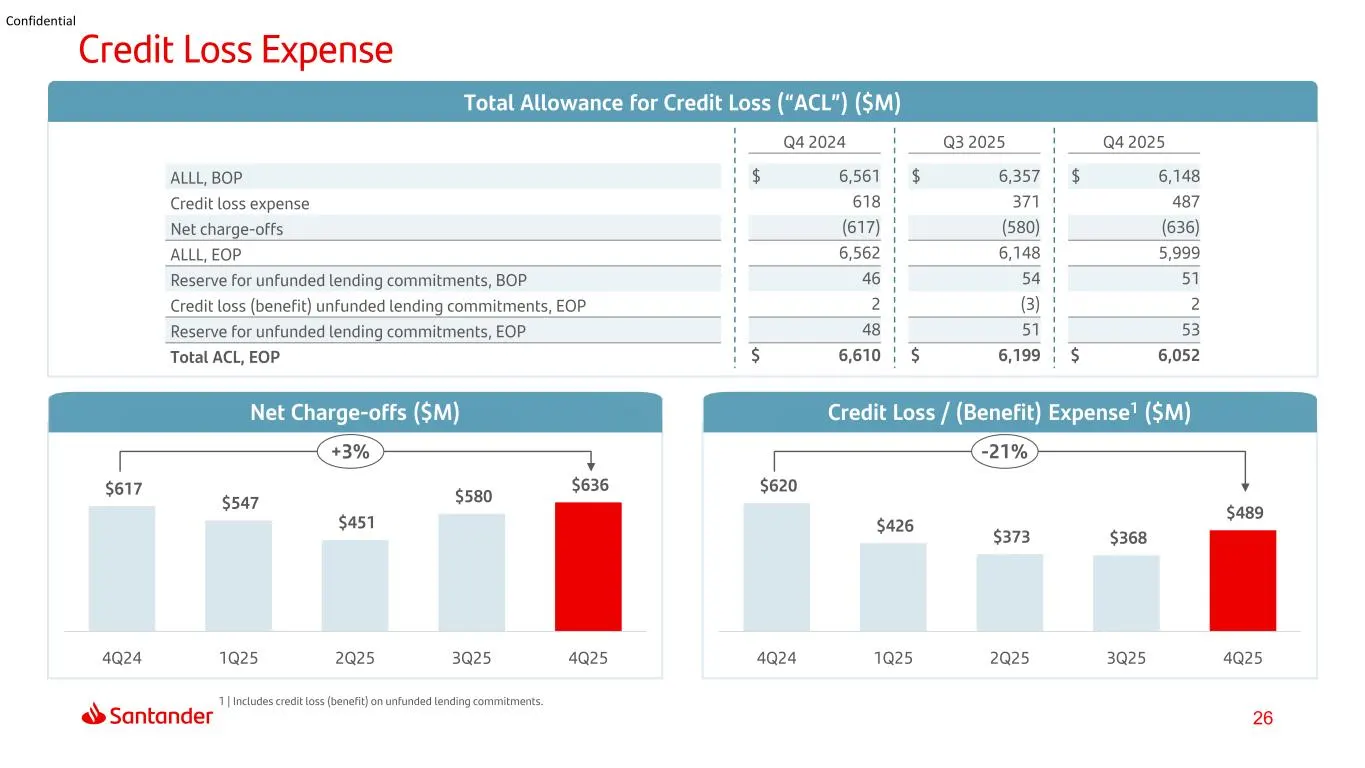
Slide 26: Quarterly Credit Loss Expense and Net Charge-offs
26 Confidential Net Charge-offs ($M) Credit Loss / (Benefit) Expense1 ($M) Credit Loss Expense Total Allowance for Credit Loss (“ACL”) ($M) Q4 2024 Q3 2025 Q4 2025 ALLL, BOP $ 6,561 $ 6,357 $ 6,148 Credit loss expense 618 371 487 Net charge-offs (617) (580) (636) ALLL, EOP 6,562 6,148 5,999 Reserve
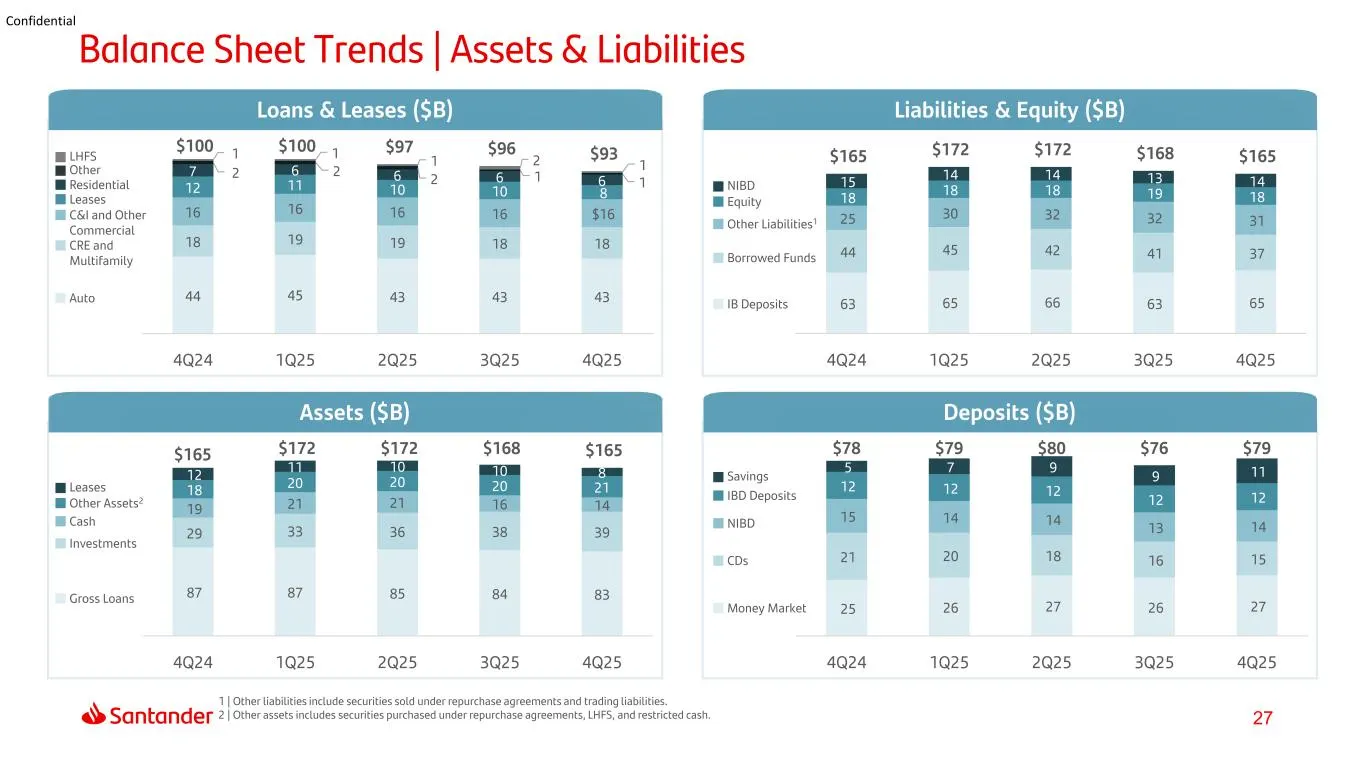
Slide 27: Balance Sheet Trends | Assets & Liabilities
27 Confidential 87 87 85 84 83 29 33 36 38 39 19 21 21 16 14 18 20 20 20 21 12 11 10 10 8 $165 $172 $172 $168 $165 4Q24 1Q25 2Q25 3Q25 4Q25 Balance Sheet Trends | Assets & Liabilities 1 | Other liabilities include securities sold under repurchase agreements and trading liabilities. 2 | Other assets
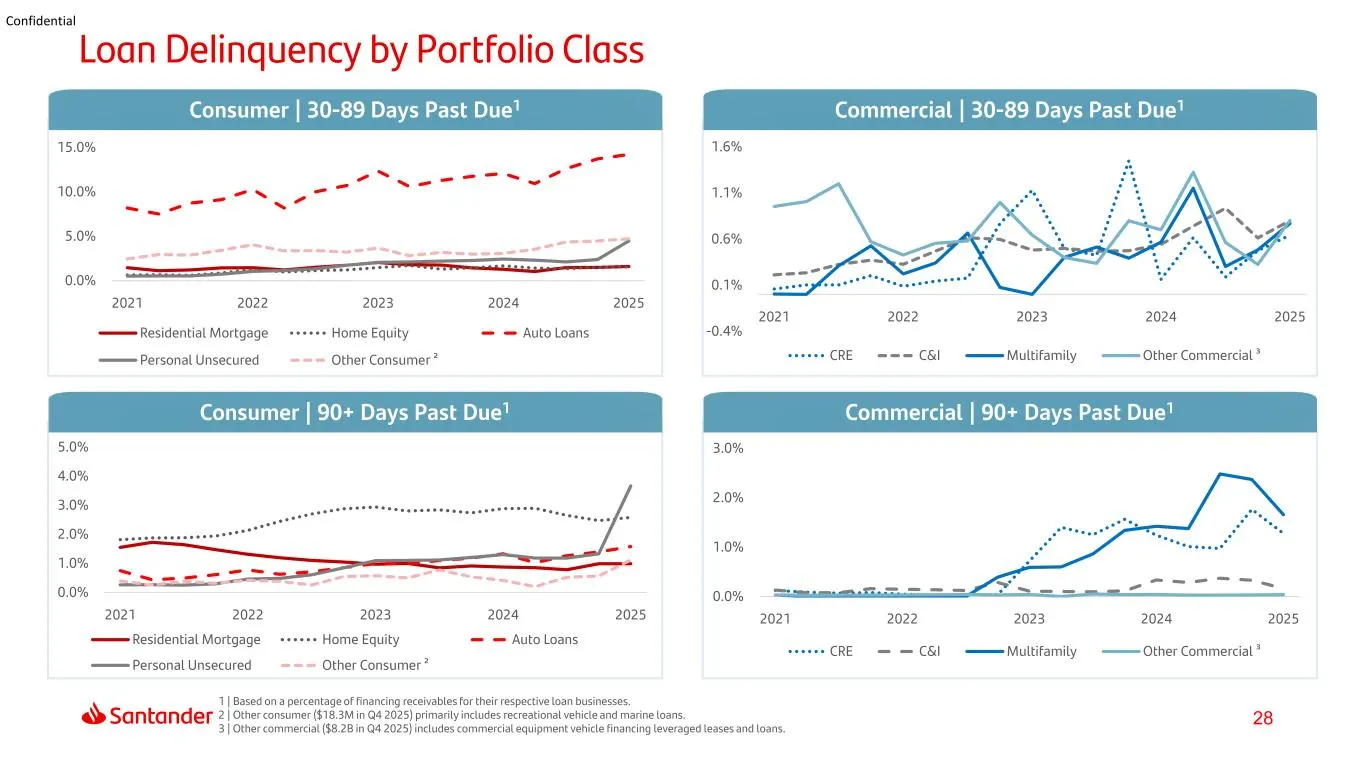
Slide 28: Loan Delinquency by Portfolio Class
28 Confidential Loan Delinquency by Portfolio Class Consumer | 90+ Days Past Due1 Commercial | 90+ Days Past Due1 Consumer | 30-89 Days Past Due1 Commercial | 30-89 Days Past Due1 1 | Based on a percentage of financing receivables for their respective loan businesses. 2 | Other consumer ($18.3M in Q
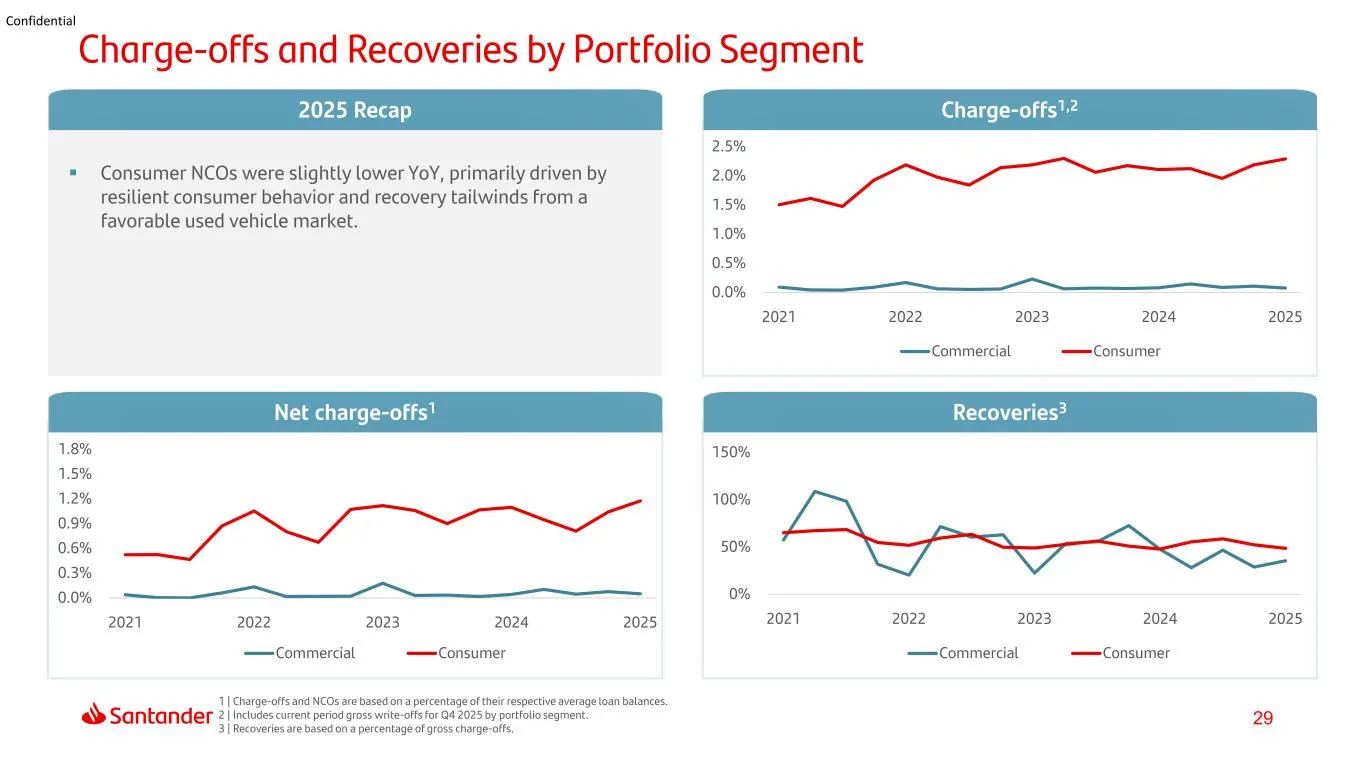
Slide 29: Charge-offs and Recoveries by Portfolio Segment
29 Confidential Consumer NCOs were slightly lower YoY, primarily driven by resilient consumer behavior and recovery tailwinds from a favorable used vehicle market. Charge-offs and Recoveries by Portfolio Segment Net charge-offs1 Recoveries3 2025 Recap Charge-offs1,2 1 | Charge-offs and NCOs are ba
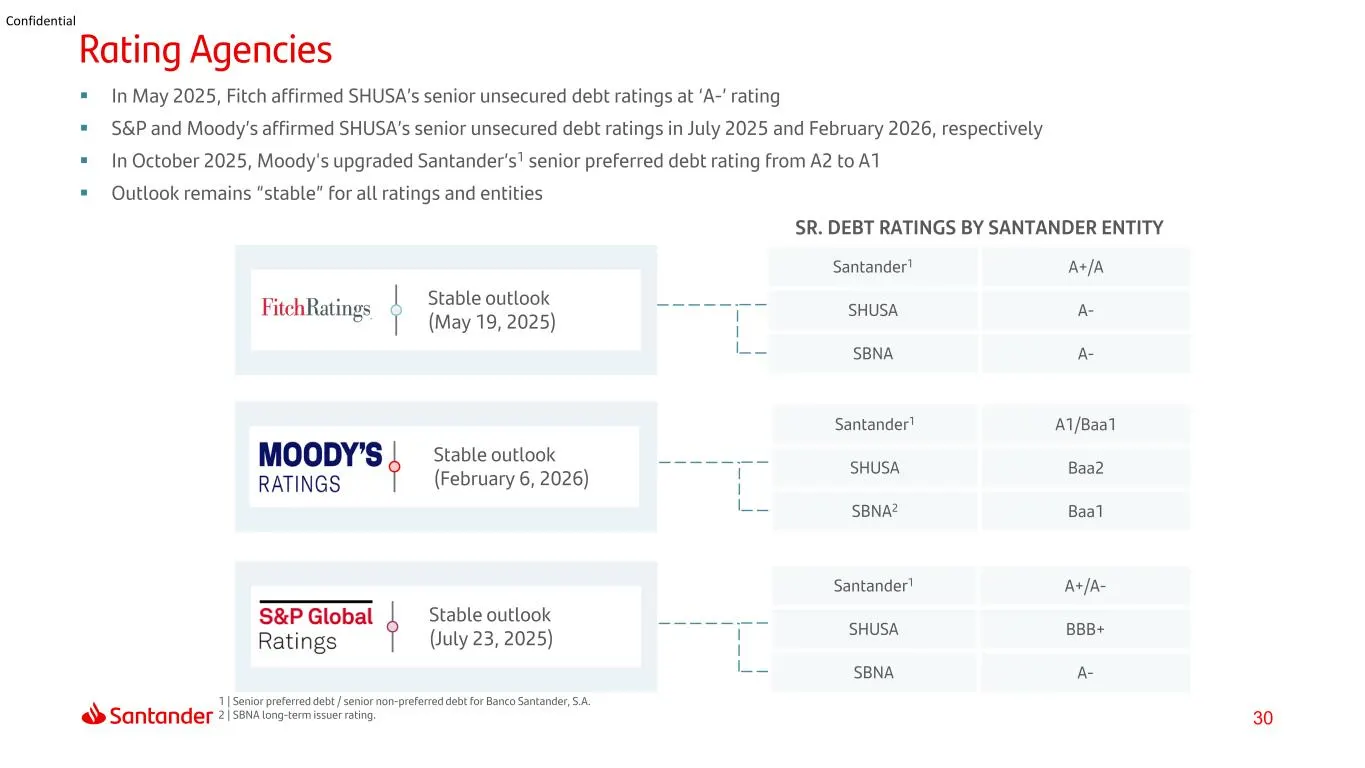
Slide 30: Rating Agencies
30 Confidential Santander1 A1/Baa1 SHUSA Baa2 SBNA2 Baa1 Santander1 A+/A- SHUSA BBB+ SBNA A- Stable outlook (May 19, 2025) In May 2025, Fitch affirmed SHUSA’s senior unsecured debt ratings at ‘A-’ rating S&P and Moody’s affirmed SHUSA’s senior unsecured debt ratings in July 2025 and February 202
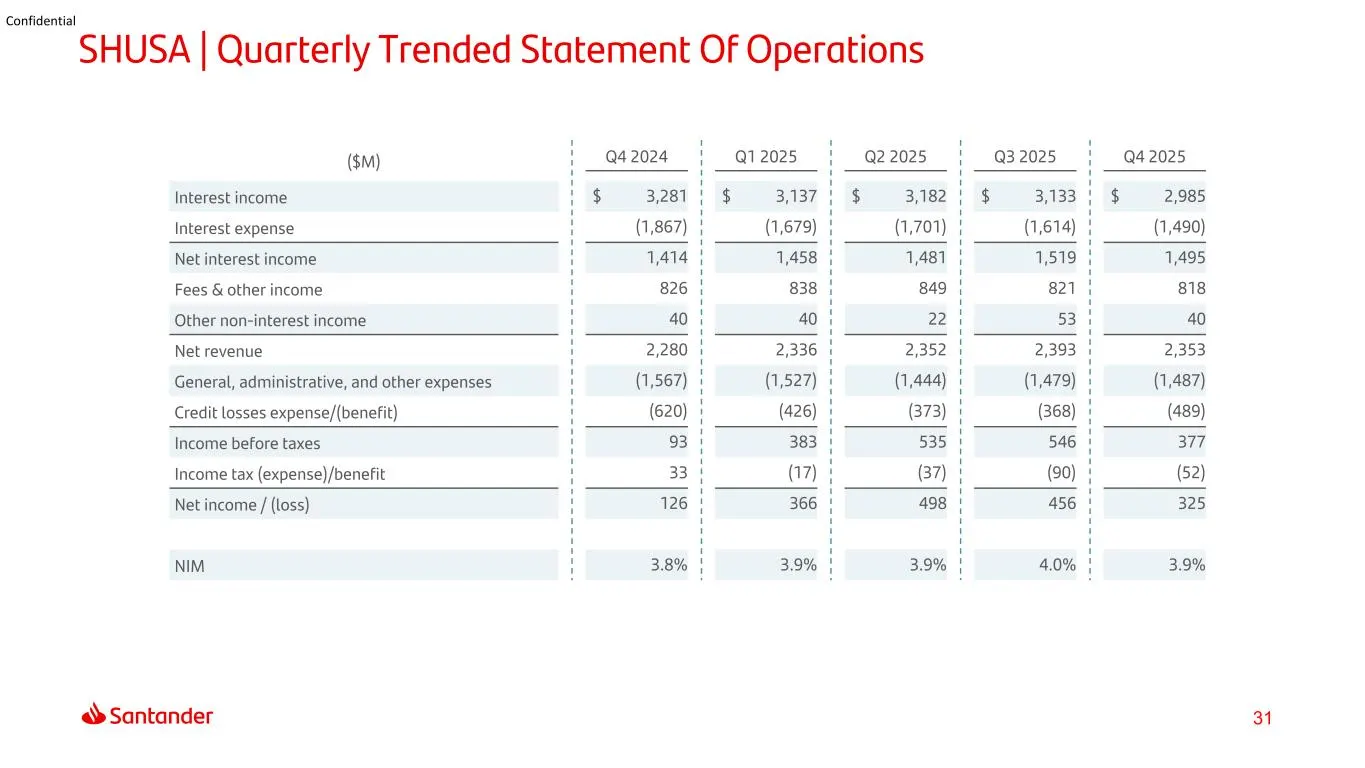
Slide 31: Quarterly Trended Statement Of Operations
31 Confidential SHUSA | Quarterly Trended Statement Of Operations ($M) Q4 2024 Q1 2025 Q2 2025 Q3 2025 Q4 2025 Interest income $ 3,281 $ 3,137 $ 3,182 $ 3,133 $ 2,985 Interest expense (1,867) (1,679) (1,701) (1,614) (1,490) Net interest income 1,414 1,458 1,481 1,519 1,495 Fees & other income 826 83
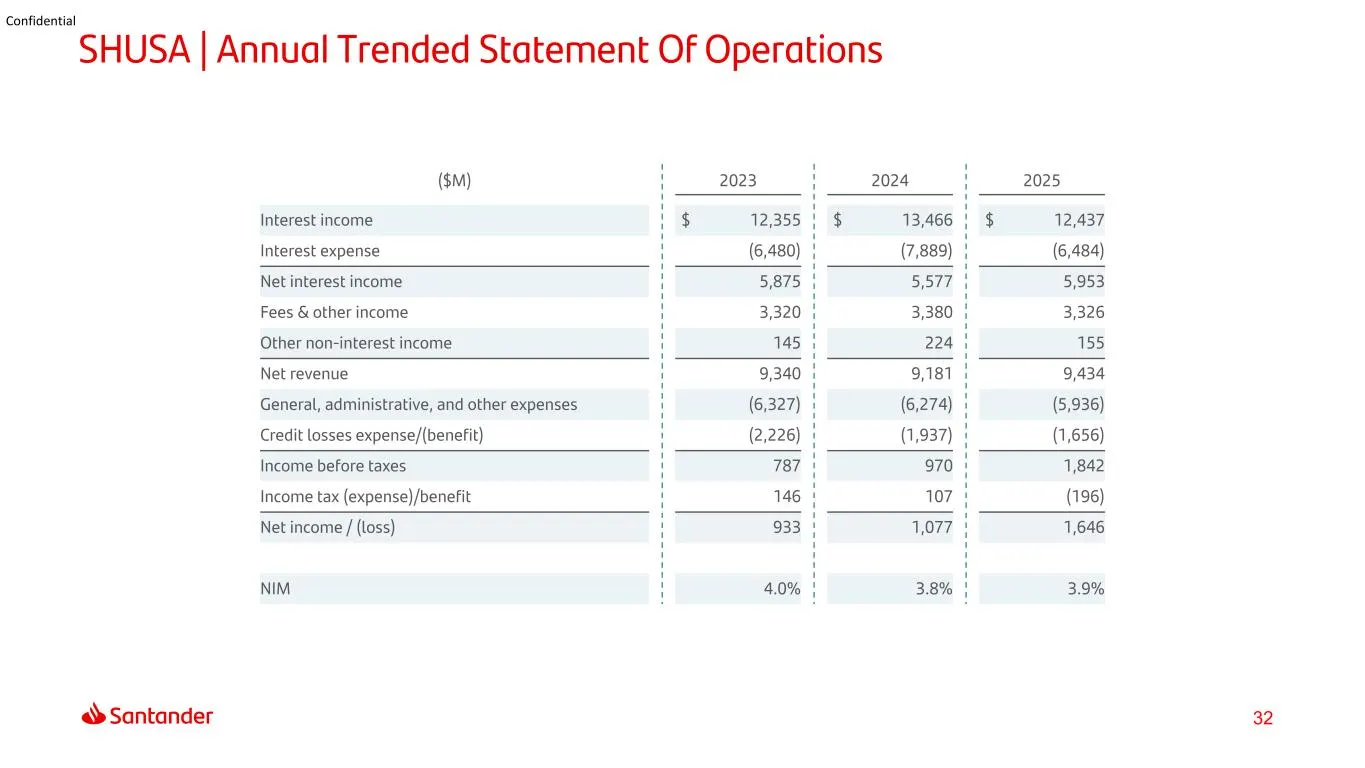
Slide 32: Annual Trended Statement Of Operations
32 Confidential SHUSA | Annual Trended Statement Of Operations ($M) 2023 2024 2025 Interest income $ 12,355 $ 13,466 $ 12,437 Interest expense (6,480) (7,889) (6,484) Net interest income 5,875 5,577 5,953 Fees & other income 3,320 3,380 3,326 Other non-interest income 145 224 155 Net revenue 9,340 9
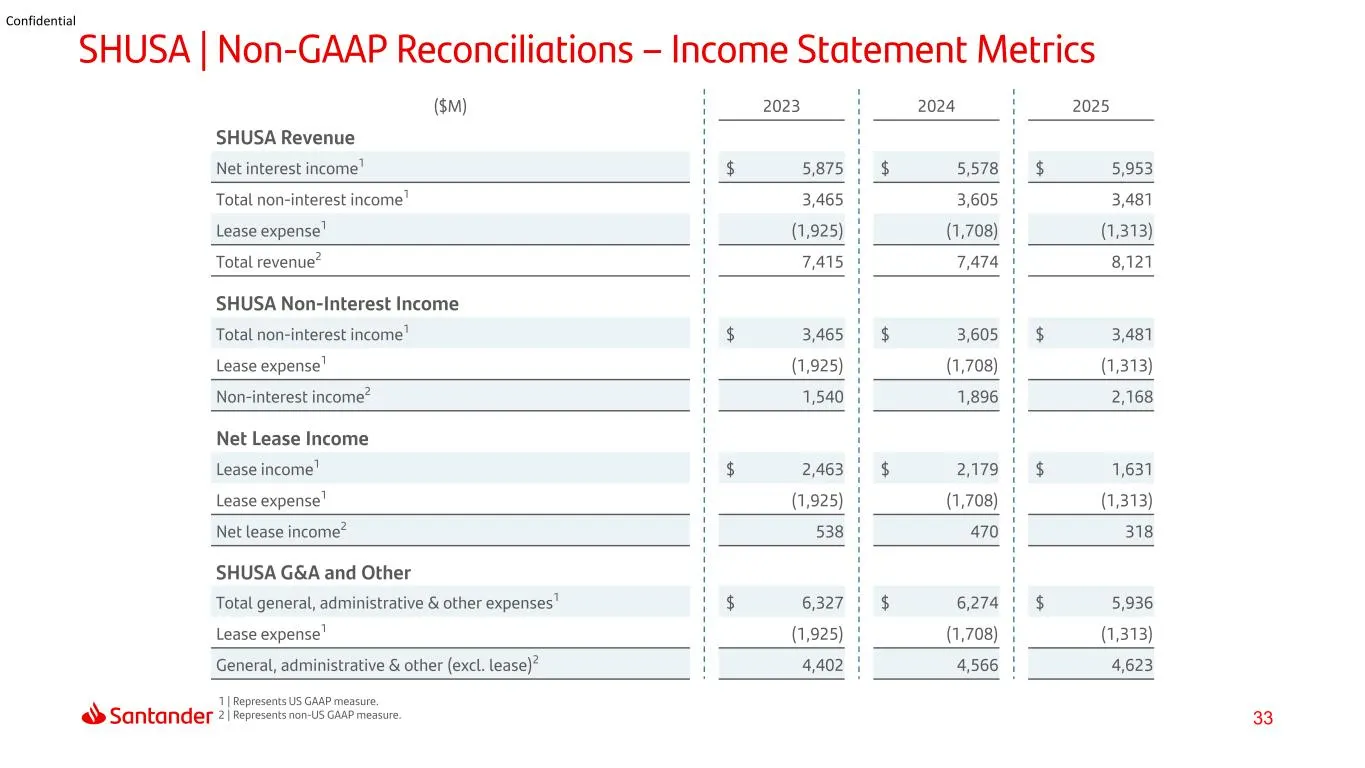
Slide 33: Non-GAAP Reconciliations – Income Statement Metrics
33 Confidential SHUSA | Non-GAAP Reconciliations – Income Statement Metrics 1 | Represents US GAAP measure. 2 | Represents non-US GAAP measure. ($M) 2023 2024 2025 SHUSA Revenue Net interest income1 $ 5,875 $ 5,578 $ 5,953 Total non-interest income1 3,465 3,605 3,481 Lease expense1 (1,925) (1,708) (
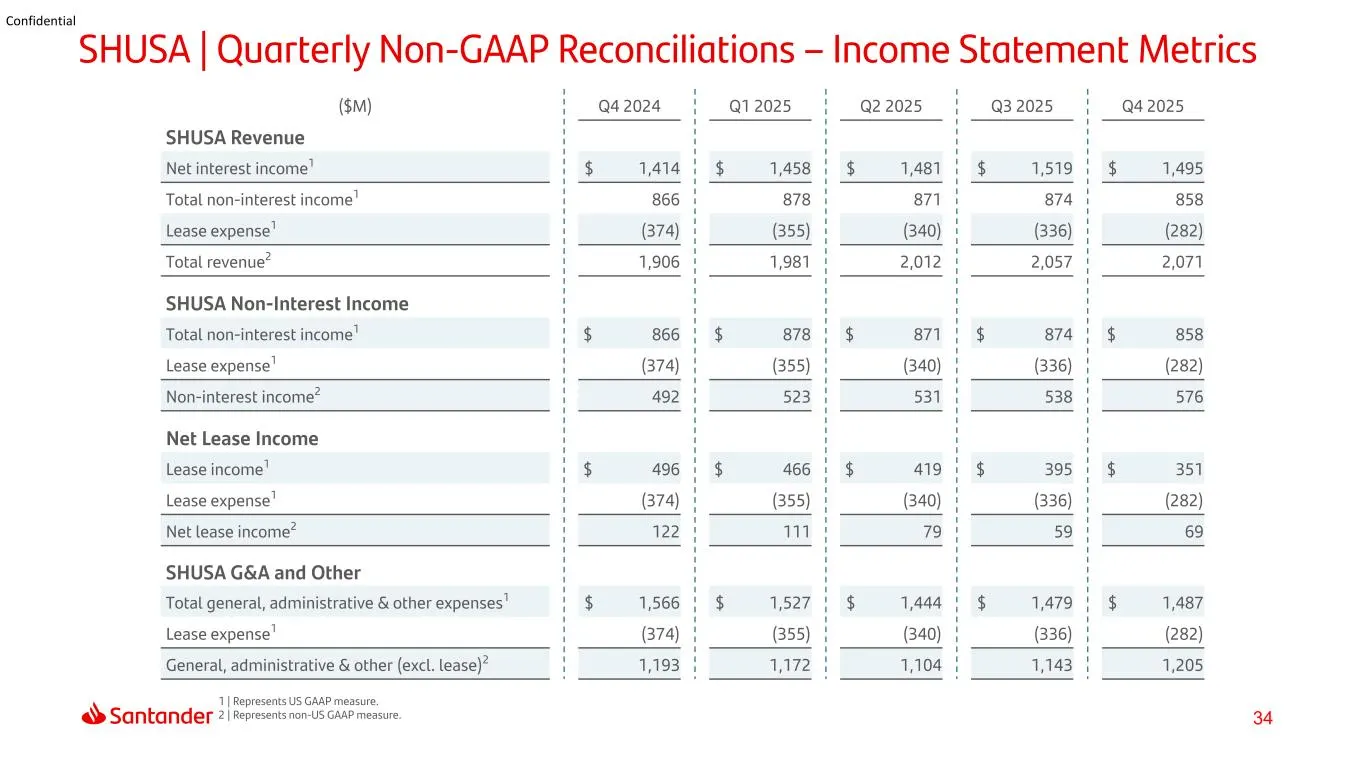
Slide 34: Quarterly Non-GAAP Reconciliations – Income Statement Metrics
34 Confidential SHUSA | Quarterly Non-GAAP Reconciliations – Income Statement Metrics 1 | Represents US GAAP measure. 2 | Represents non-US GAAP measure. ($M) Q4 2024 Q1 2025 Q2 2025 Q3 2025 Q4 2025 SHUSA Revenue Net interest income1 $ 1,414 $ 1,458 $ 1,481 $ 1,519 $ 1,495 Total non-interest income1
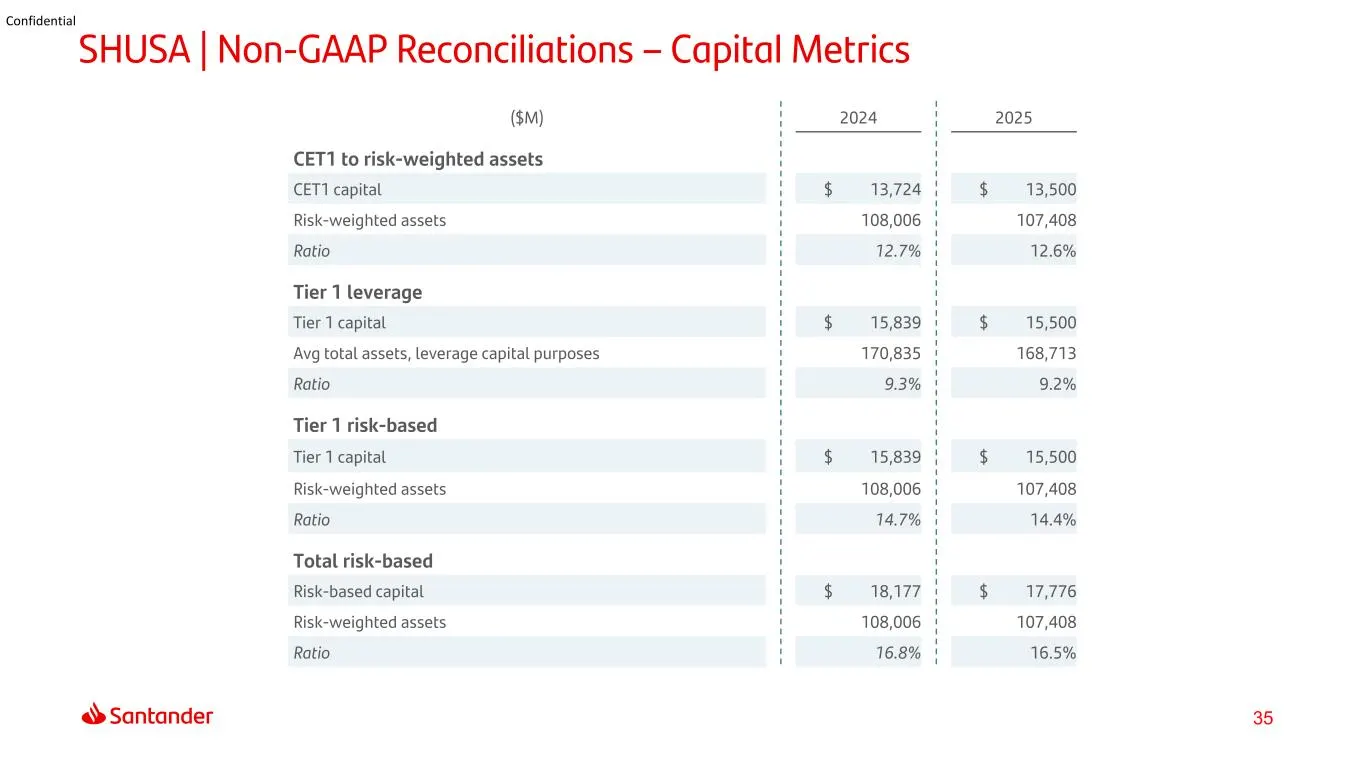
Slide 35: Non-GAAP Reconciliations – Capital Metrics
35 Confidential SHUSA | Non-GAAP Reconciliations – Capital Metrics ($M) 2024 2025 CET1 to risk-weighted assets CET1 capital $ 13,724 $ 13,500 Risk-weighted assets 108,006 107,408 Ratio 12.7% 12.6% Tier 1 leverage Tier 1 capital $ 15,839 $ 15,500 Avg total assets, leverage capital purposes 170,835 16

Slide 36: Thank You
Thank You. Our purpose is to help people and businesses prosper. Our culture is based on believing that everything we do should be:
Source: SEC EDGAR · 8-K filed Mar 6, 2026
More decks from Santander Holdings USA Inc
 Debt Investor Presentation (August 2026)30 slides · Aug 12, 2026
 Debt Investor Presentation (August 2026)30 slides · Aug 12, 2026
 Debt Investor Presentation (June 2026)29 slides · Jun 12, 2026
 Debt Investor Presentation (June 2026)29 slides · Jun 12, 2026
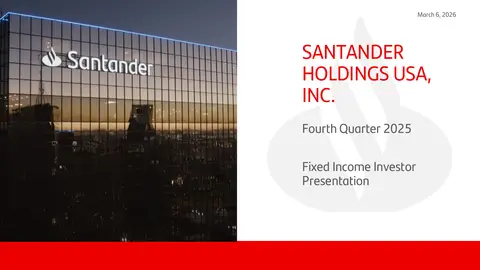 Debt Investor Presentation (March 2026)36 slides · Mar 6, 2026
 Debt Investor Presentation (November 2025)30 slides · Nov 4, 2025