Santander Holdings USA Inc · NYSE:SNUS/PH
Santander Holdings USA — Debt Investor Presentation (November 2025)
30 slides from Santander Holdings USA's debt investor presentation, Nov 4, 2025
Slide 1: Third Quarter 2025 Fixed Income Investor Presentation
November 3, 2025 Third Quarter 2025 Fixed Income Investor Presentation
Slide 2: Important Information
Confidential Important Information This presentation of Santander Holdings USA, Inc. (“SHUSA") contains “forward-looking statements" within the meaning of the Private Securities Litigation Reform Act of 1995 regarding the Financial condition, results of operations, business plans and future performa
Slide 3: Index: At a glance
Index At aglance
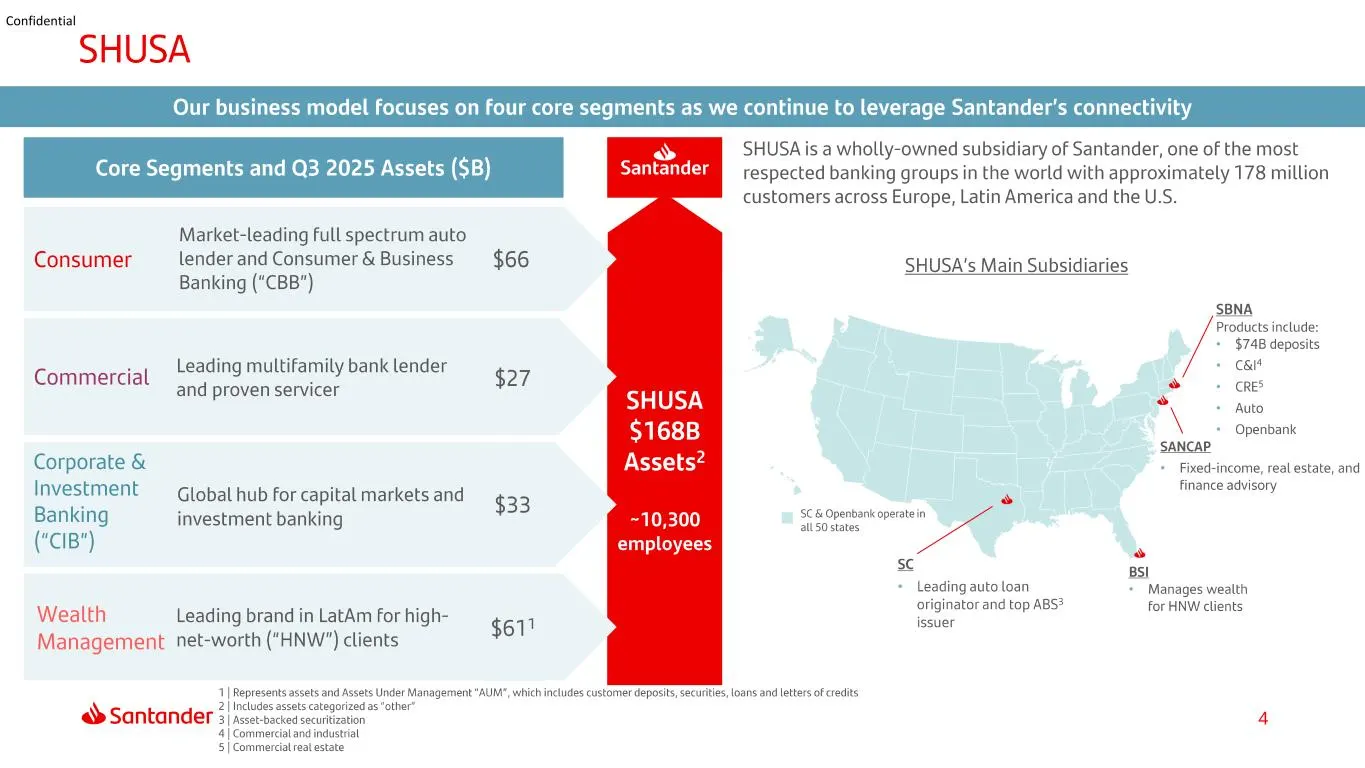
Slide 4: SHUSA
Confidential SHUSA Our business model focuses on four core segments as we continue to leverage Santander's connectivity o SHUSA is a wholly-owned subsidiary of Santander, one of the most ts and Q3 2025 Assets ($B) Soe ttCm respected banking groups in the world with approximately 178 million customer
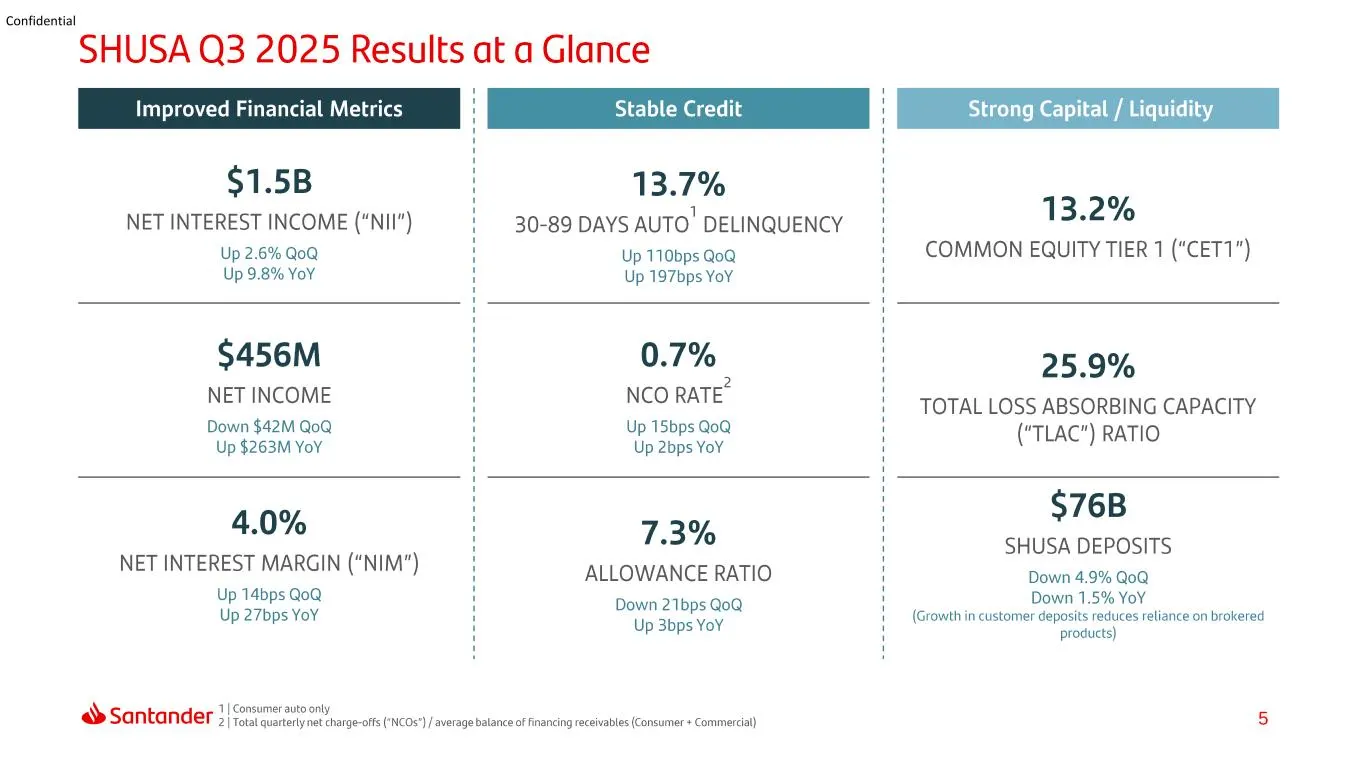
Slide 5: SHUSA Q3 2025 Results at a Glance
Confidential SHUSA Q3 2025 Results at a Glance products) $1.5B 13.7% 13.2% NET INTEREST INCOME ("NII") | 30-89 DAYS AUTO" DELINQUENCY | ian Up 2.6% QoQ ' up staan ' COMMON EQUITY TIER 1 (“CET1") Up 9.8% YoY ' Up 197bps YoY ' 9 $456M 0.7% 25.9% NET vee NCO RATE | TOTAL LOSS ABSORBING CAPACITY Down $4
Slide 6: 6 Confidential
6 Confidential
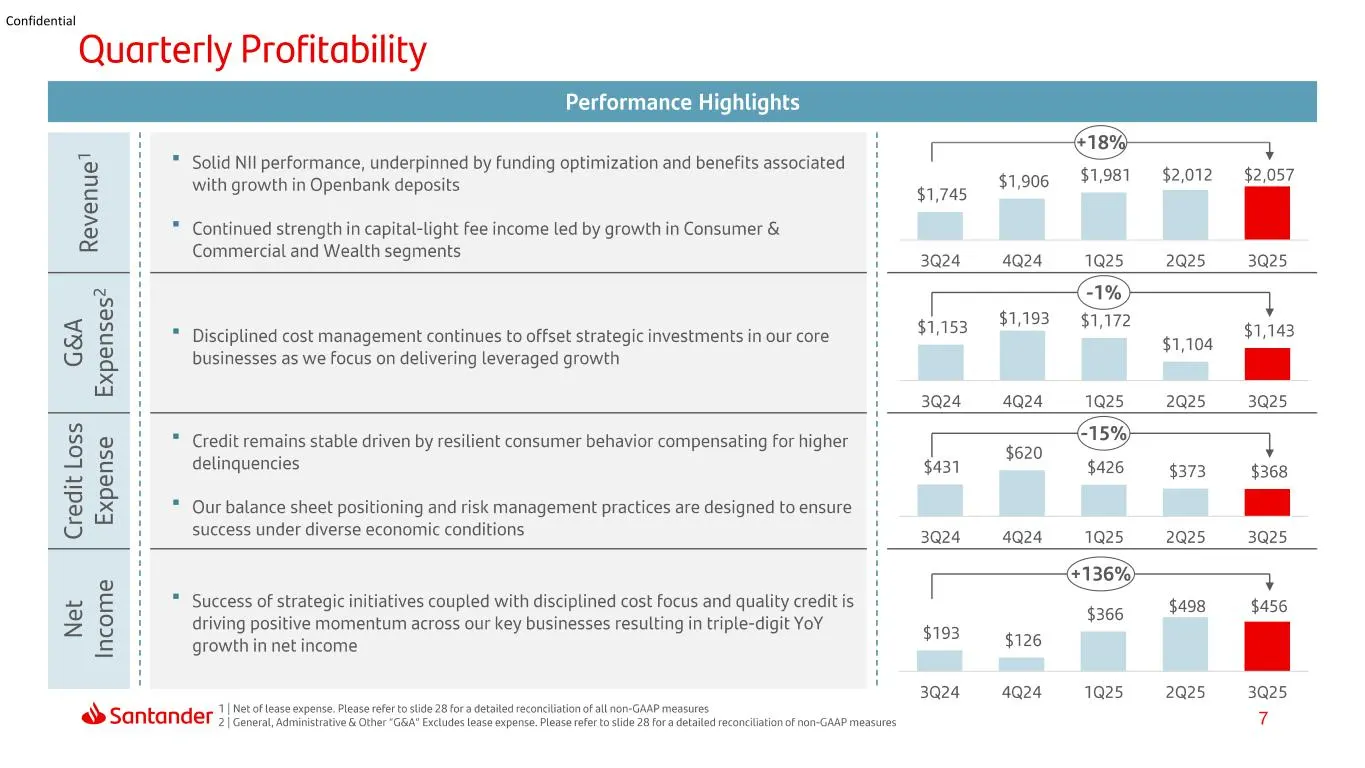
Slide 7: Quarterly Profitability
Confidential Quarterly Profitability <8 ’ $1,906 $1,981 $2,012 $2,057 3Q24 4Q24 1Q25 2Q25 3Q25 -1% 1 $1,153 $1,193 $1,172 $1,143 Solid NII performance, underpinned by funding optimization and benefits associated with growth in Openbank deposits $1,745 Continued strength in capital-light fee income l
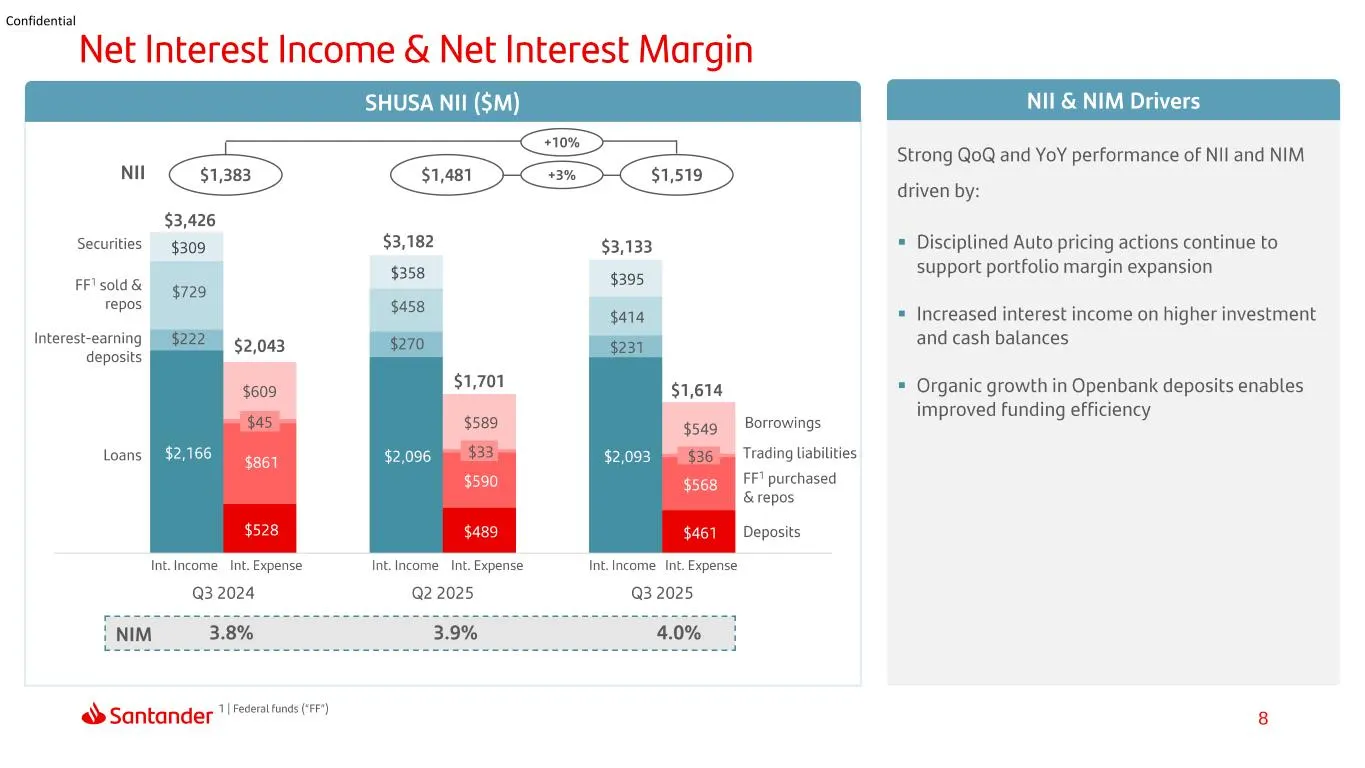
Slide 8: Net Interest Income & Net Interest Margin
Confidential Net Interest Income & Net Interest Margin SHUSA NII ($M) Nil & NIM Drivers +10% Strong QoQ and YoY performance of NIl and NIM Nil $3,426 Securities $399 $3,133 = Disciplined Auto pricing actions continue to support portfolio margin expansion FFisold& — §799 a $414 = Increased interest i
Slide 9: Non-Interest Income
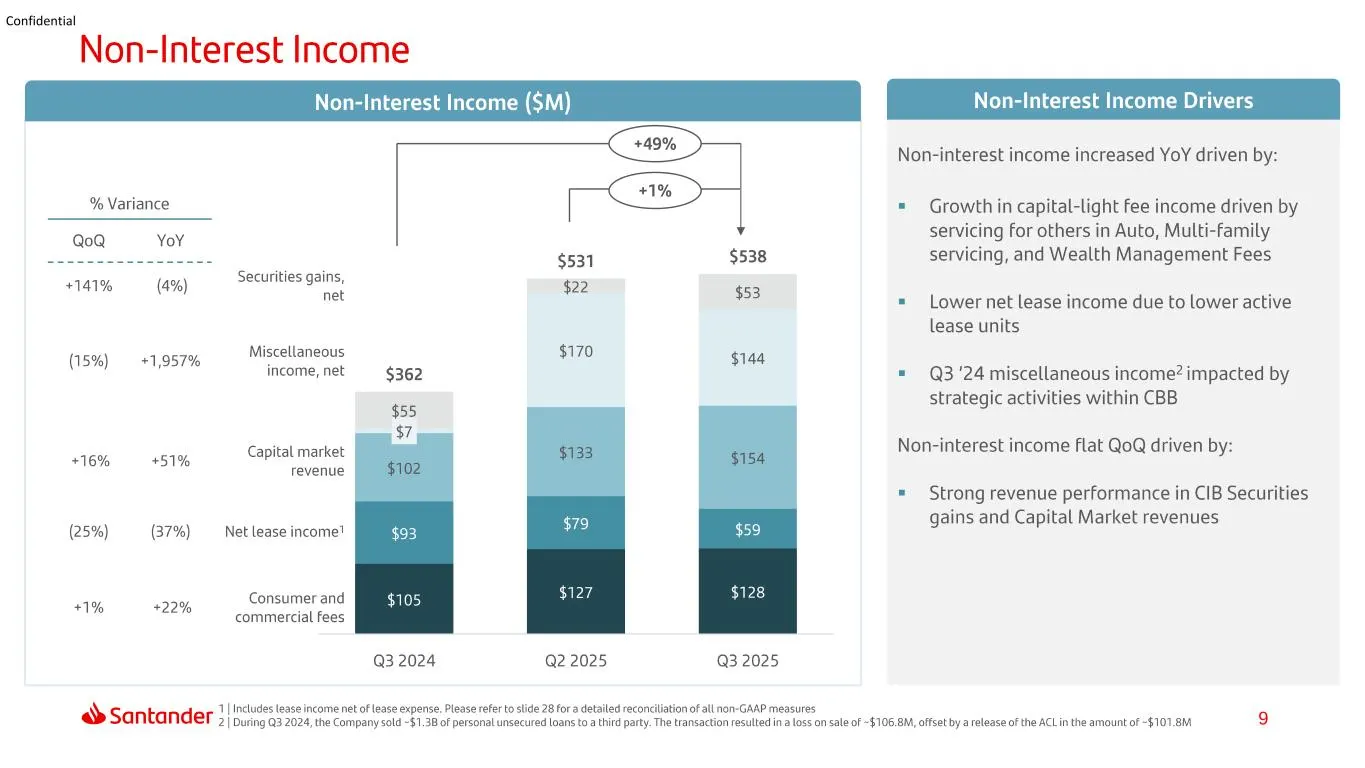
Confidential Non-Interest Income Non-Interest Income ($M) Non-Interest Inco! vers +49% Non-interest income increased YoY driven by: % Variance Gm) = Growth in capital-light fee income driven by QoQ YoY v servicing for others in Auto, Multi-Family spanccsereraccaanisata $531 $538 servicing, and Wealt
Slide 10: General, Administrative, & Other Expenses
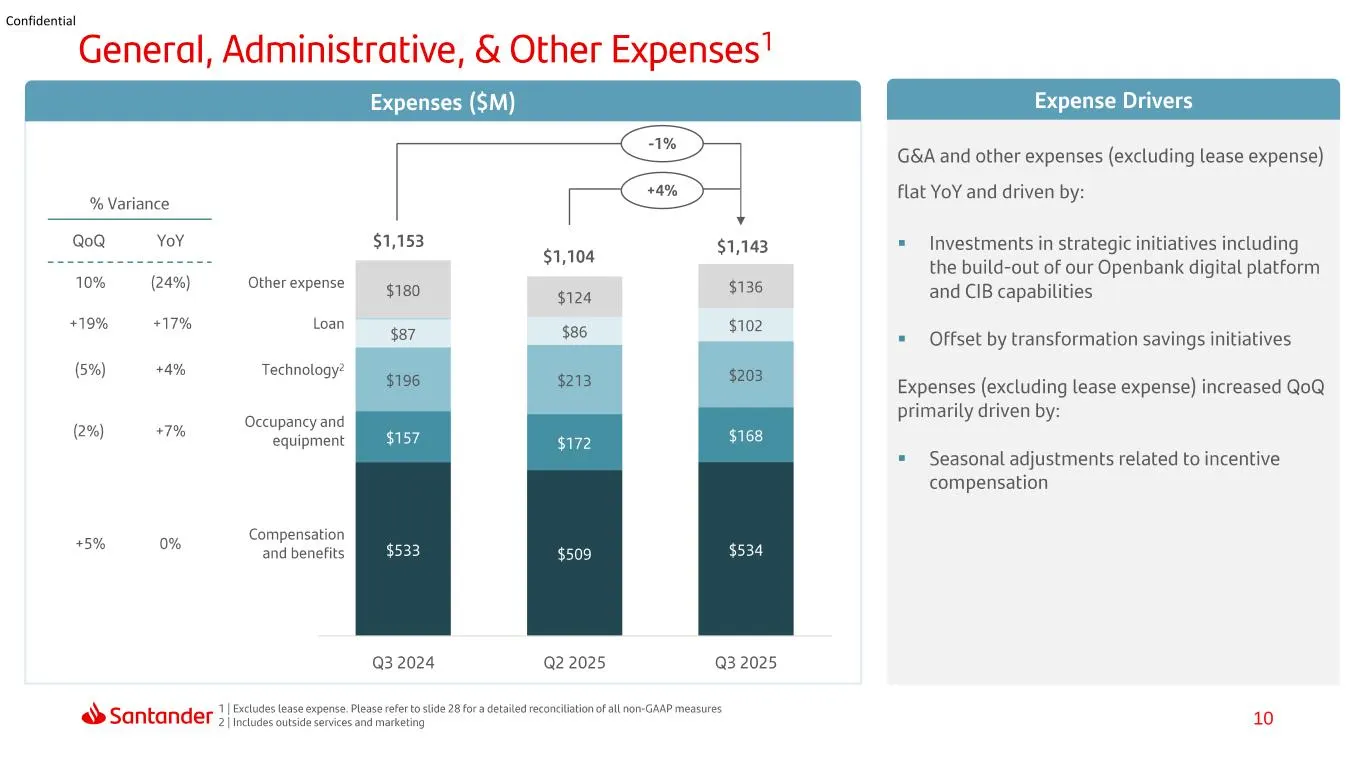
Confidential General, Administrative, & Other Expenses! bese (M G&A and other expenses (excluding lease expense) Flat YoY and driven by: % Variance QoQ YoY = Investments in strategic initiatives including —— a the build-out of our Openbank digital platform 10% (2446) Other expense and CIB capabiliti
Slide 11: Credit Loss Expense
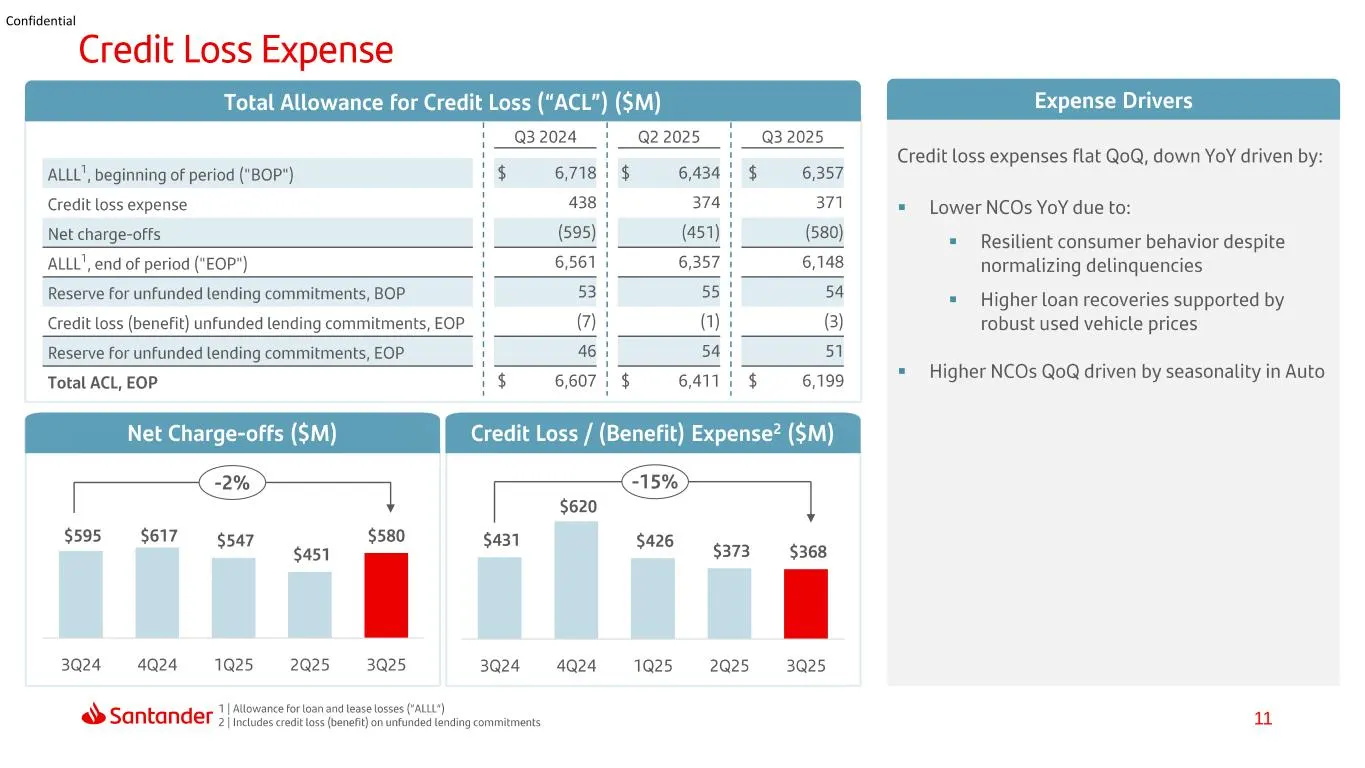
Confidential Credit Loss Expense Total Allowance for Credit Loss (“ACL”) ($M) 1 @32024 | Q22025 Q3 2025 ALLL’, beginning of period ("BOP") 1g 6718} $ $ 6,357 Credit loss expense ' 438 | 371 Net charge-offs ' (595) | (580) ALLL", end of period ("EOP") ' 6,561 | 6,148 Reserve for unfunded lending comm
Slide 12: Q3 Balance Sheet Overview
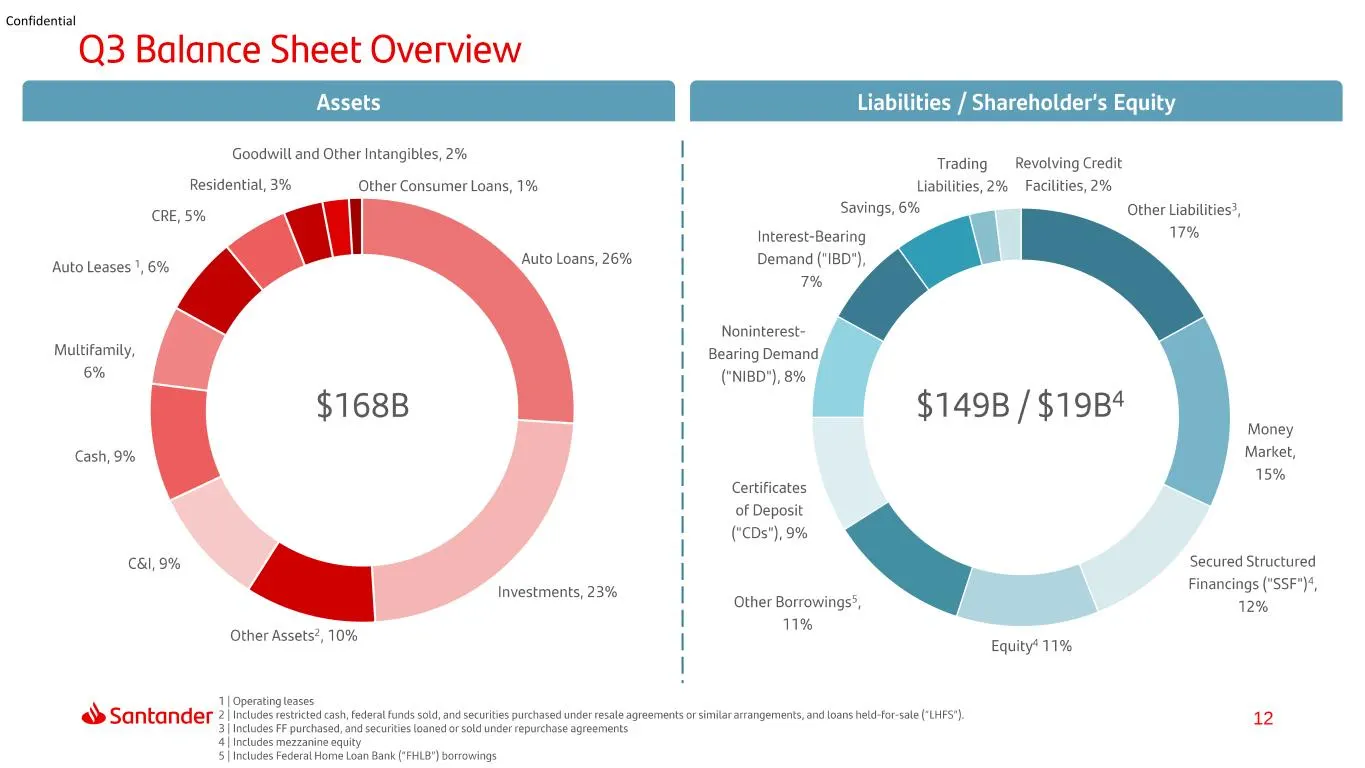
Confidential Q3 Balance Sheet Overview ities / Shareholder’s Equity Goodwill and Other Intangibles, 2% Trading Revolving Credit Liabilities, 2% Facilities, 2% Savings, 6% J Residential, 3% Other Consumer Loans, 1% CRE, 5% \| Auto Leases ', 6% Multifamily, 6% Other Liabilities?, 17% Interest-Bearing
Slide 13: Balance Sheet Trends | Assets
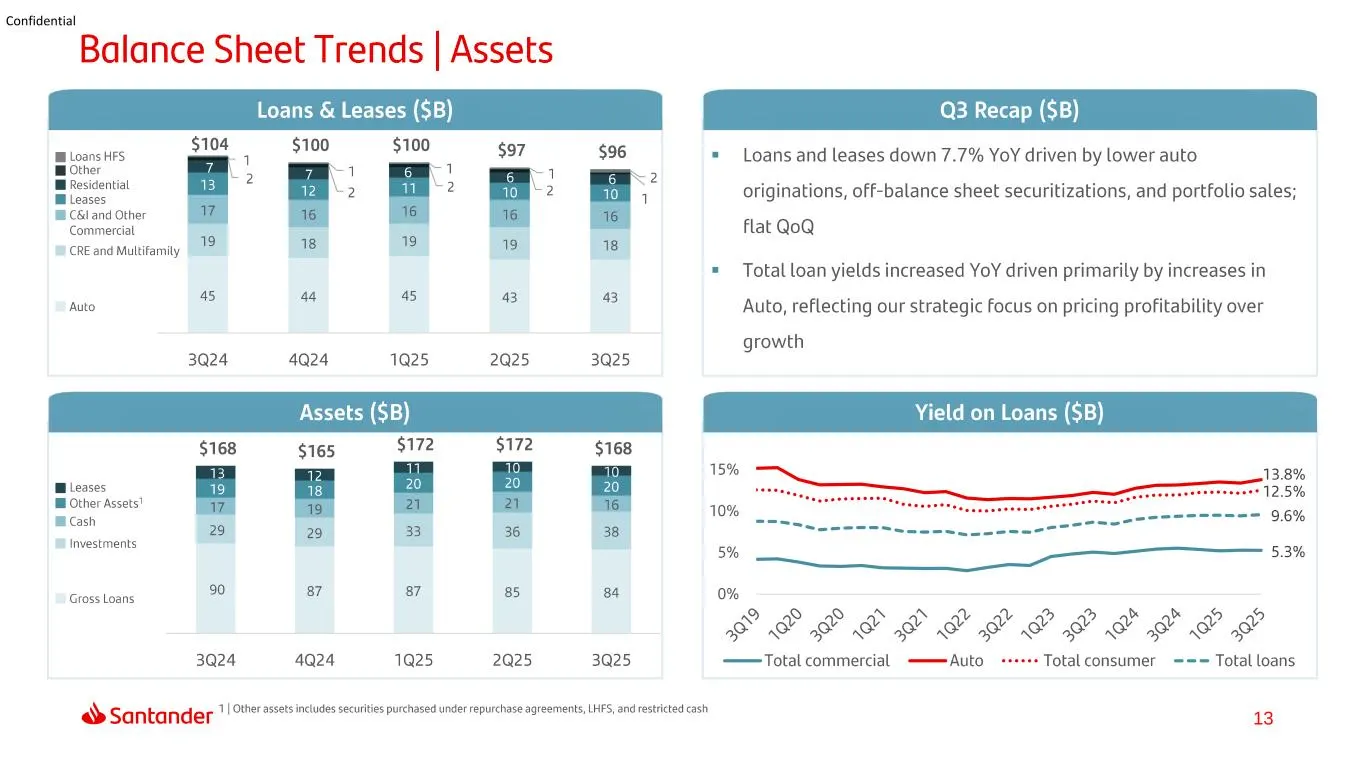
Confidential Balance Sheet Trends | Assets a3 Rea (8) 3108 100 a $97 $96 Loans and leases down 7.7% YoY driven by lower auto Loans HFS other me pssienita. in i a originations, off-balance sheet securitizations, and portfolio sales; IB CBI and Other Commercial Flat QoQ CRE and Multifamily = Total loa
Slide 14: Balance Sheet Trends | Liabilities
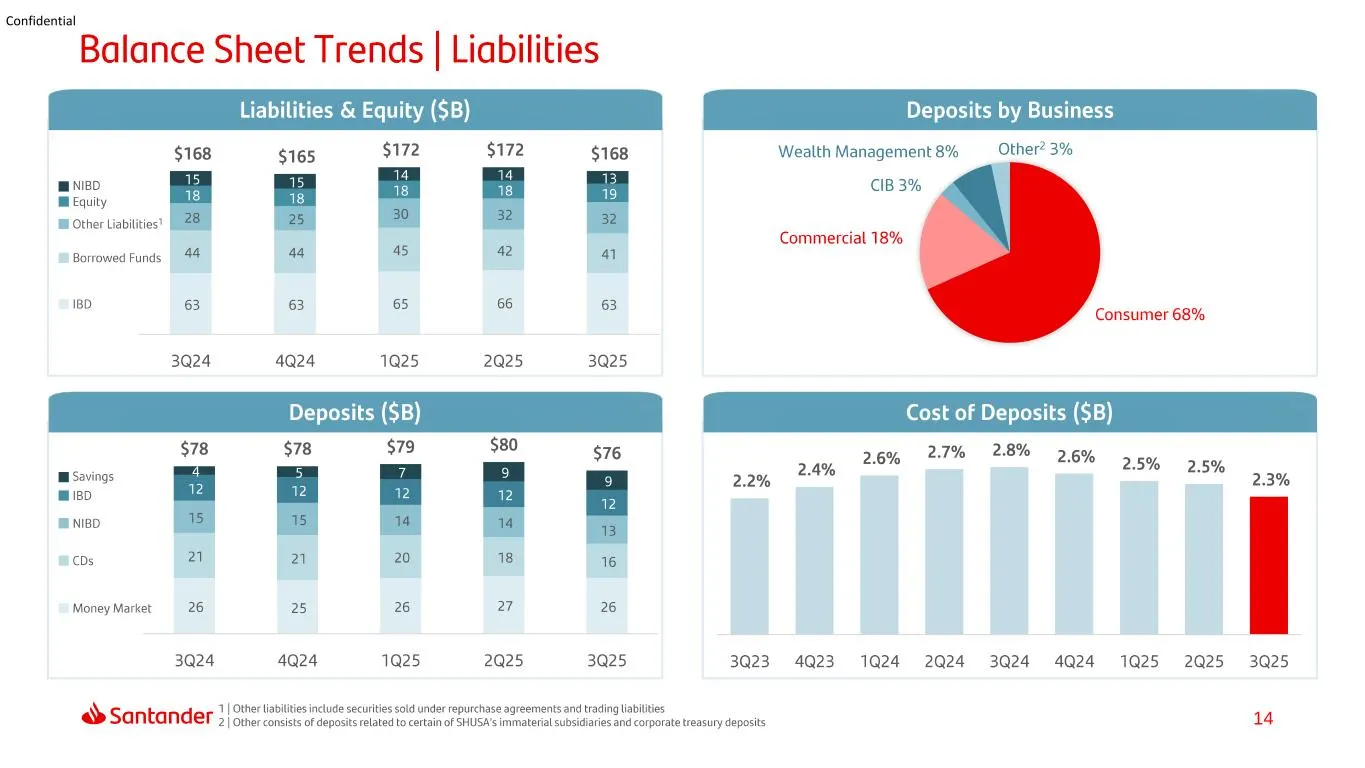
Confidential Balance Sheet Trends | Liabilities Liabilities & Equity ($B) Deposits by Business lis $165 $172 $172 $168 Wealth Management 8% Other? 3% : 14 miso 15 ‘i CIB 3% Equity Other Liabilities! Commercial 18% Borrowed Funds 180 63 63 65 Ge $3 Consumer 68% 3024 4024 1025 2025 3025 Deposits ($B)
Slide 15: Liquidity & Wholesale Funding
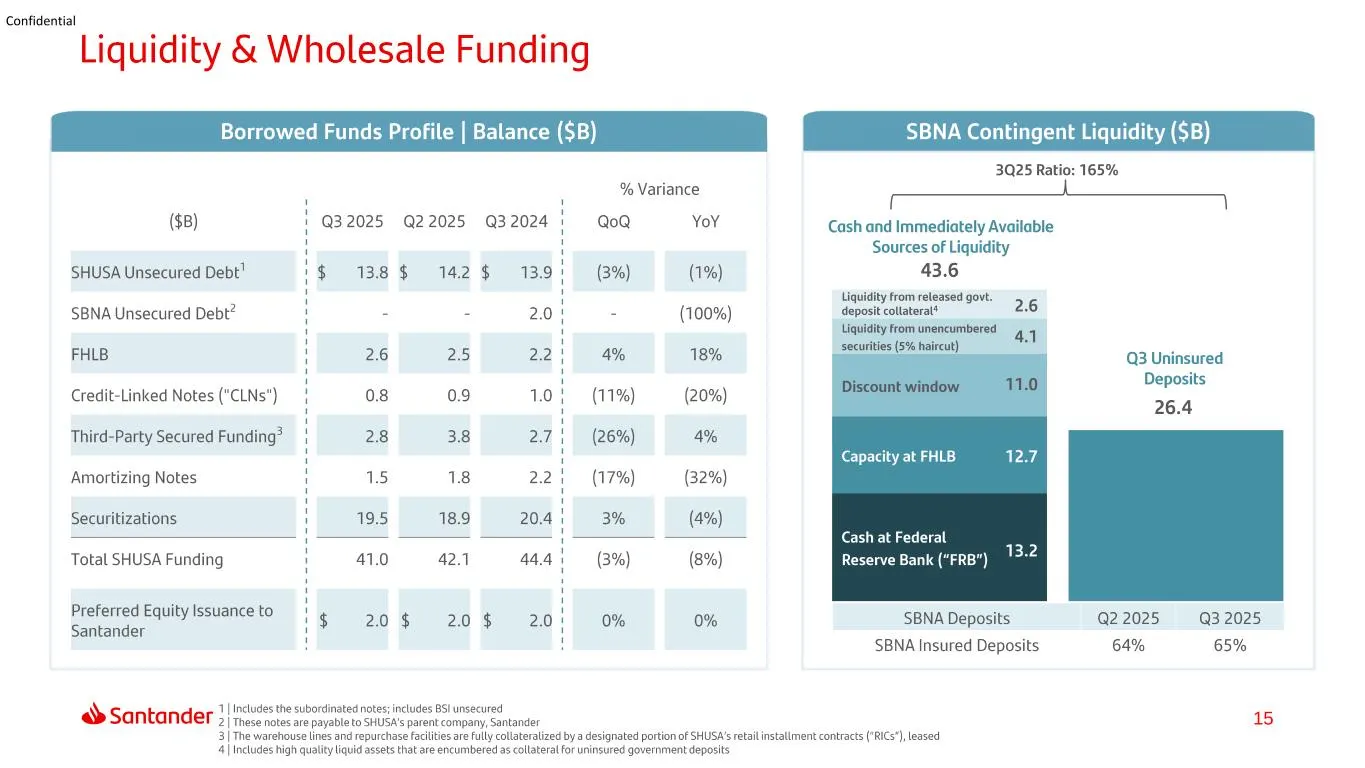
Confidential Liquidity & Wholesale Funding Borrowed Funds Profile | Balance ($B) 3Q25 Ratio: 165% A % Variance f . ($B) ' Q32025 Q22025 @32024} QoQ YoY Cash and Immediately Available Sources of Liquidity SHUSA Unsecured Debt! '$ 138 $ 142$ 139! (3%) (1%) 43.6 H H Liquidity trom released govt SBNA Un
Slide 16: Debt & TLAC
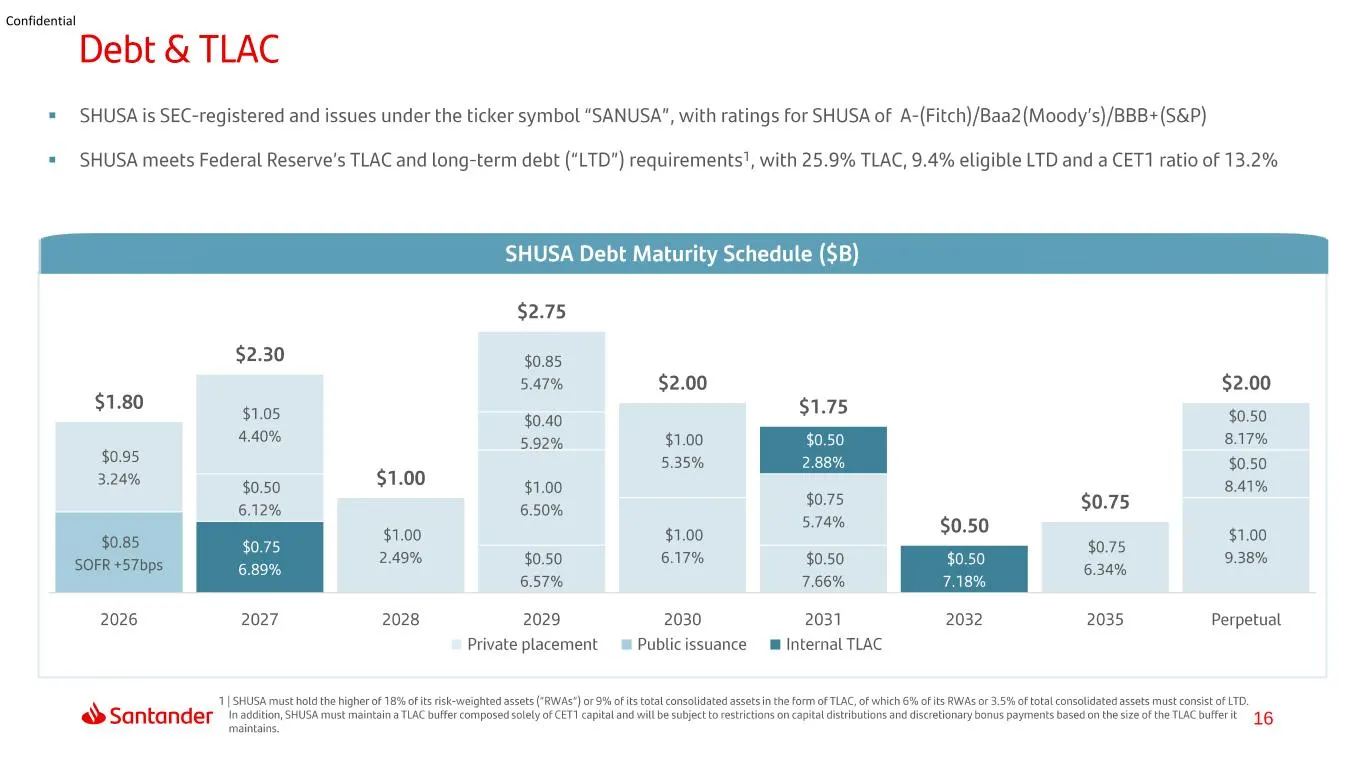
Confidential Debt & TLAC = SHUSA is SEC-registered and issues under the ticker symbol “SANUSA", with ratings for SHUSA of A-(Fitch)/Baa2(Moody's)/BBB+(S&P) = SHUSA meets Federal Reserve's TLAC and long-term debt ("LTD") requirements’, with 25.9% TLAC, 9.4% eligible LTD and a CET1 ratio of 13.2% SHUS
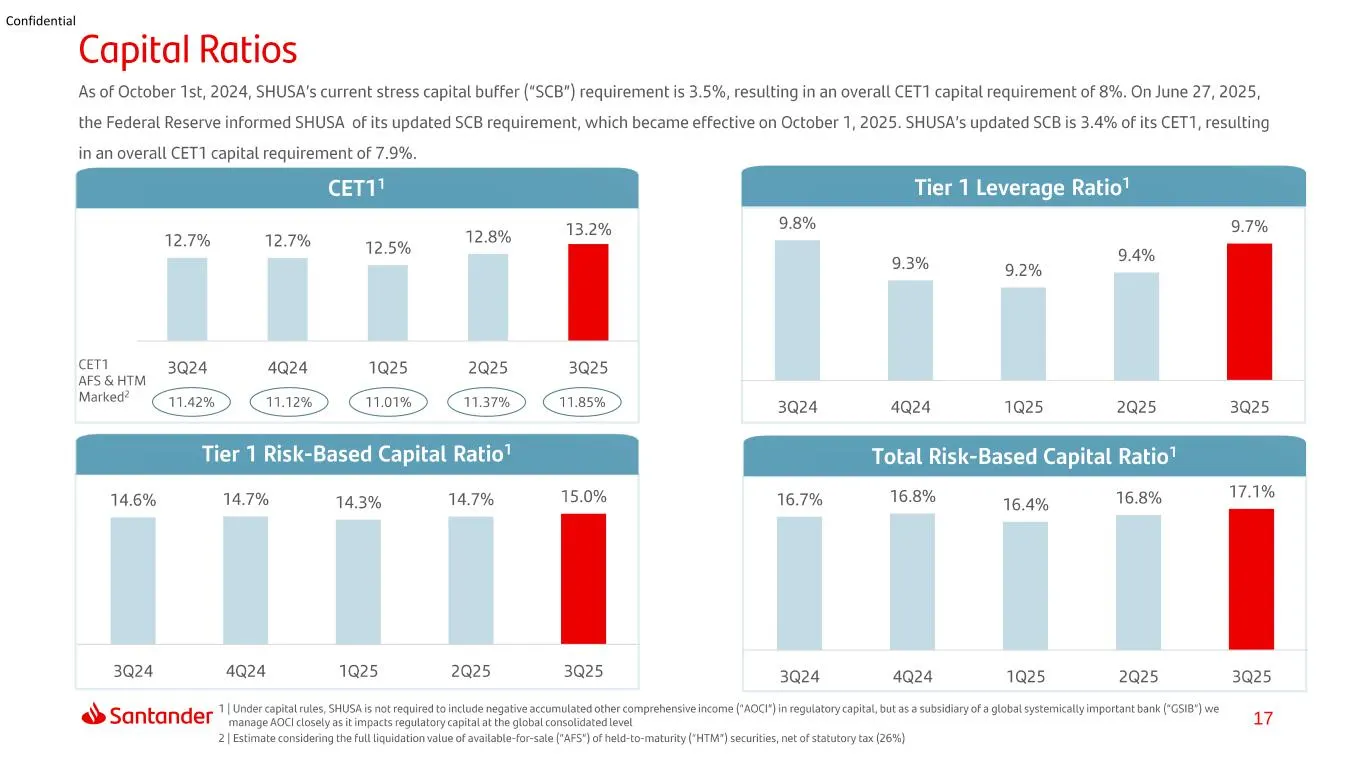
Slide 17: Capital Ratios
Confidential Capital Ratios As of October 1st, 2024, SHUSA’s current stress capital buffer ("SCB") requirement is 3.5%, resulting in an overall CET1 capital requirement of 8%. On June 27, 2025, the Federal Reserve informed SHUSA of its updated SCB requirement, which became effective on October 1, 20
Slide 18: Index: Core Business Activities
Index Core Business Activities
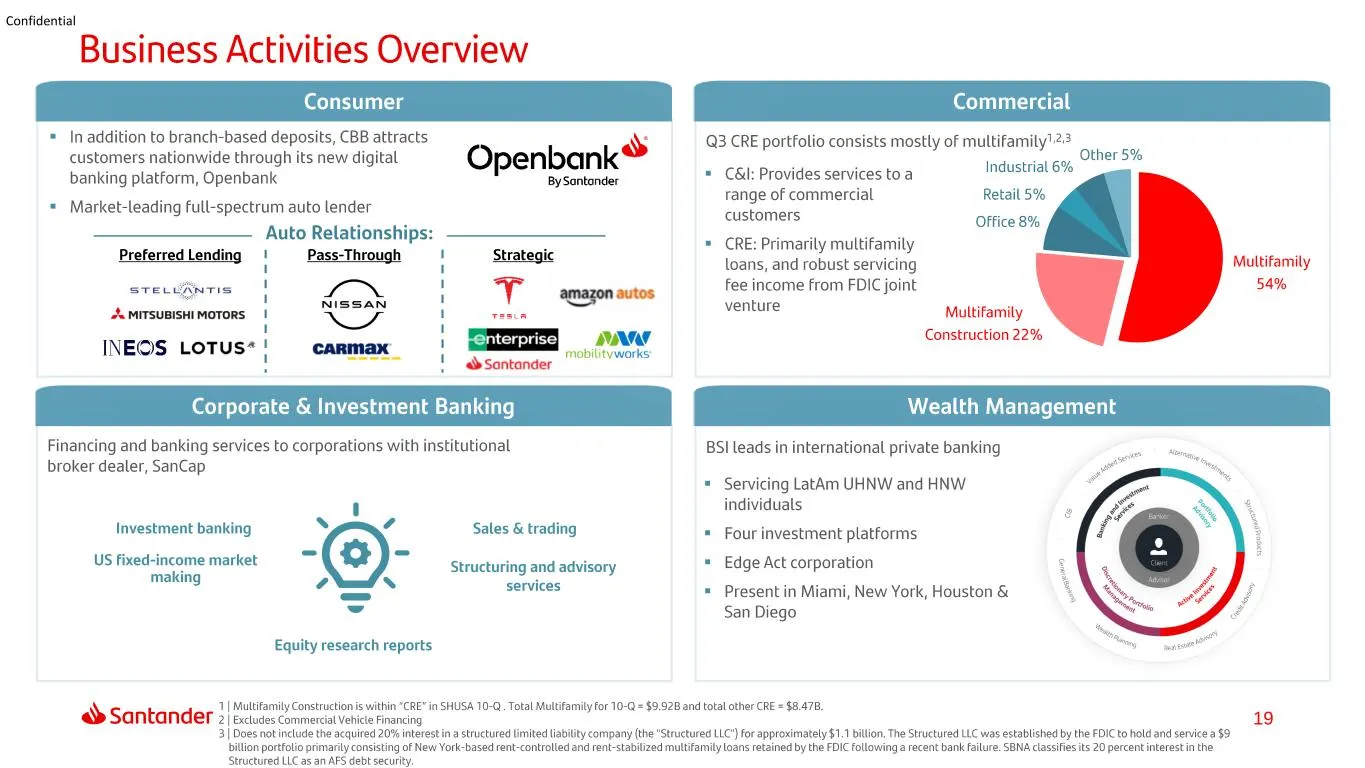
Slide 19: Business Activities Overview
Confidential Business Activities Overview Consumer Commercial = In addition to branch-based deposits, CBB attracts AG Q3 CRE portfolio consists mostly of multifamity’:22 customers nationwide through its new digital Openbank : : industriat 6% Cnet 5% banking platform, Openbank Byeutinie, = C&il: Prov
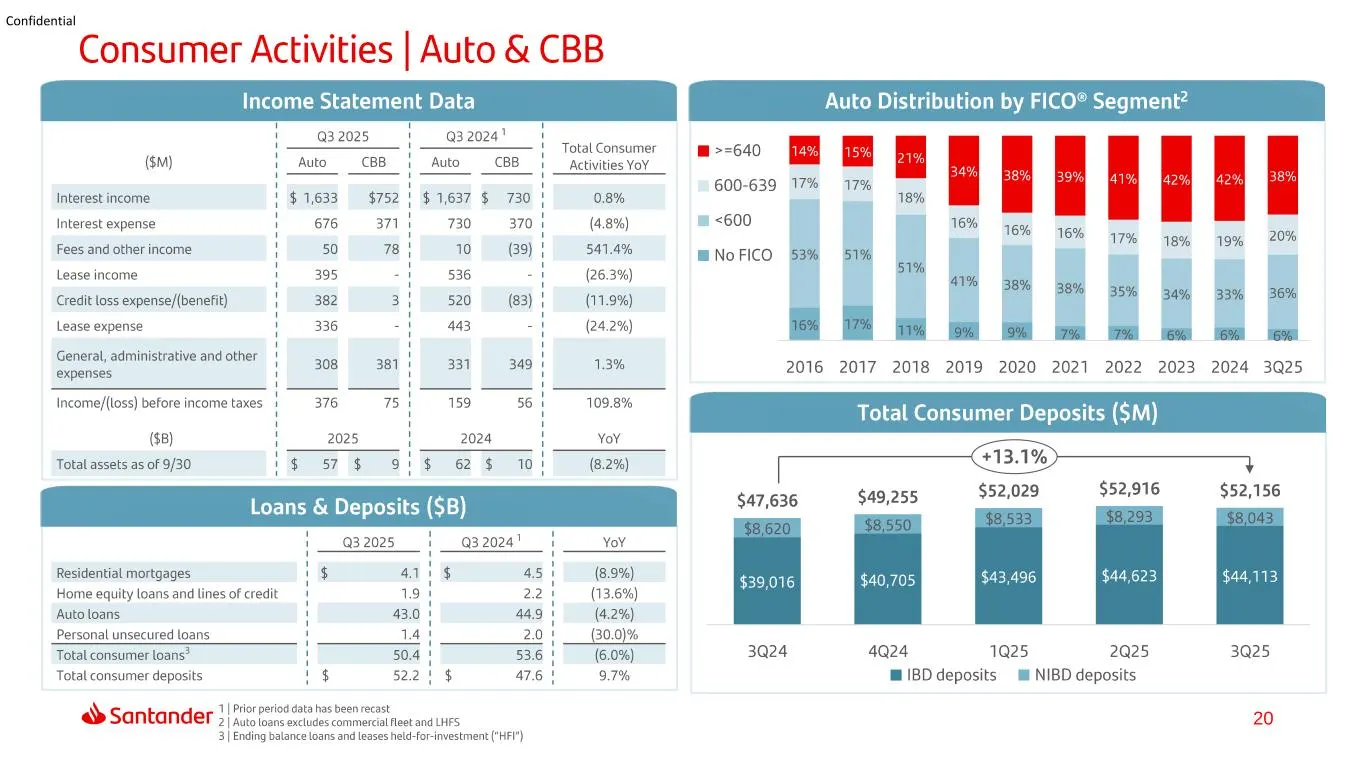
Slide 20: Consumer Activities | Auto & CBB
Confidential Consumer Activities | Auto & CBB Income Statement Data Auto Distribution by FICO® Segment? a3 2025 TotalConsumer om o=640 AR B Activities YoY 600-639 17% 17% i 0.8% 18% 6 (sm) Auto CBB Interest income Interest expense | 676 3711 730 37014 (4.8%) ™ <600 i ee H H ' 16% 17% 18% 19% 20% Fee
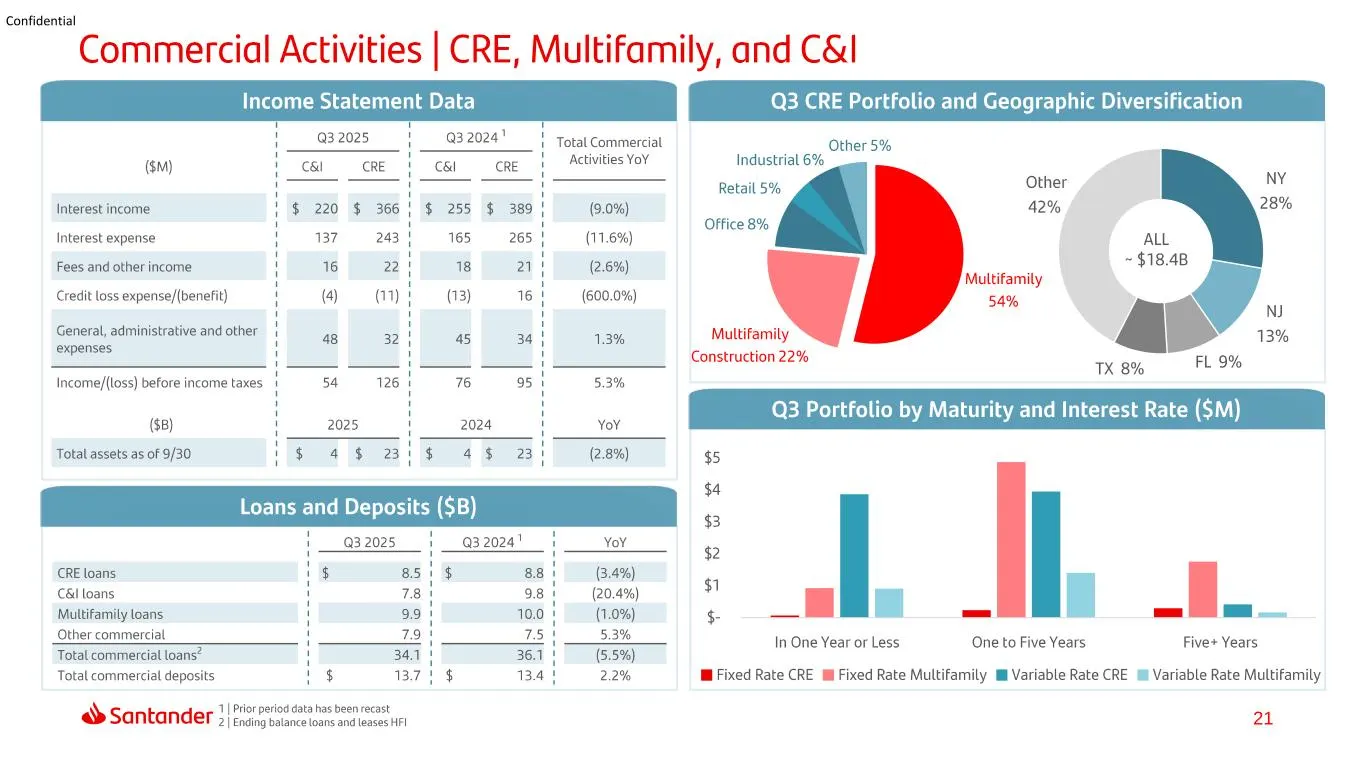
Slide 21: Commercial Activities | CRE, Multifamily, and C&I
Confidential Commercial Activities | CRE, Multifamily, and C&I Income Statement Data i Q3 2025 H 3.2024" | Total Commercial (sm) ‘cel RE} calc Ativities YoY Interest income 1 $ 220 $ 366! $ 255 $ 389! (9.0%) ' ' ' Interest expense 1437243! 165 265! (17.6%) Fees and other income 1 96 22! B26 %) Credi
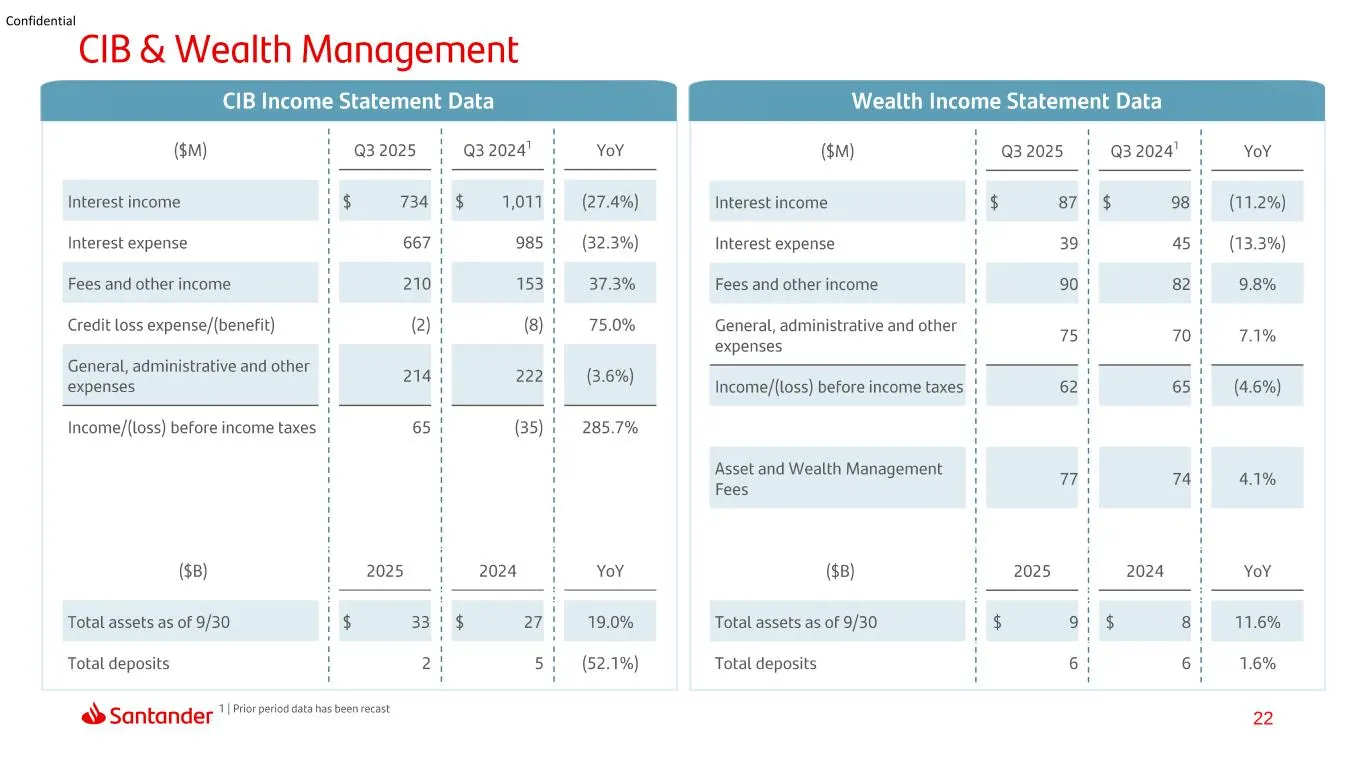
Slide 22: CIB & Wealth Management
Confidential CIB & Wealth Management CIB Income Statement Data Wealth Income Statement Data ($m) | 32025 | @32024' | — YoY Interest income '$ 7341 $ 1,011! (27.4%) Interest expense ' 667 | 985! (32.3%) Fees and other income ' 210! 153! 37.3% Credit loss expense/(benefit) ' (2) | (8)! 75.0% j | } ue
Slide 23: 23 Confidential
23 Confidential
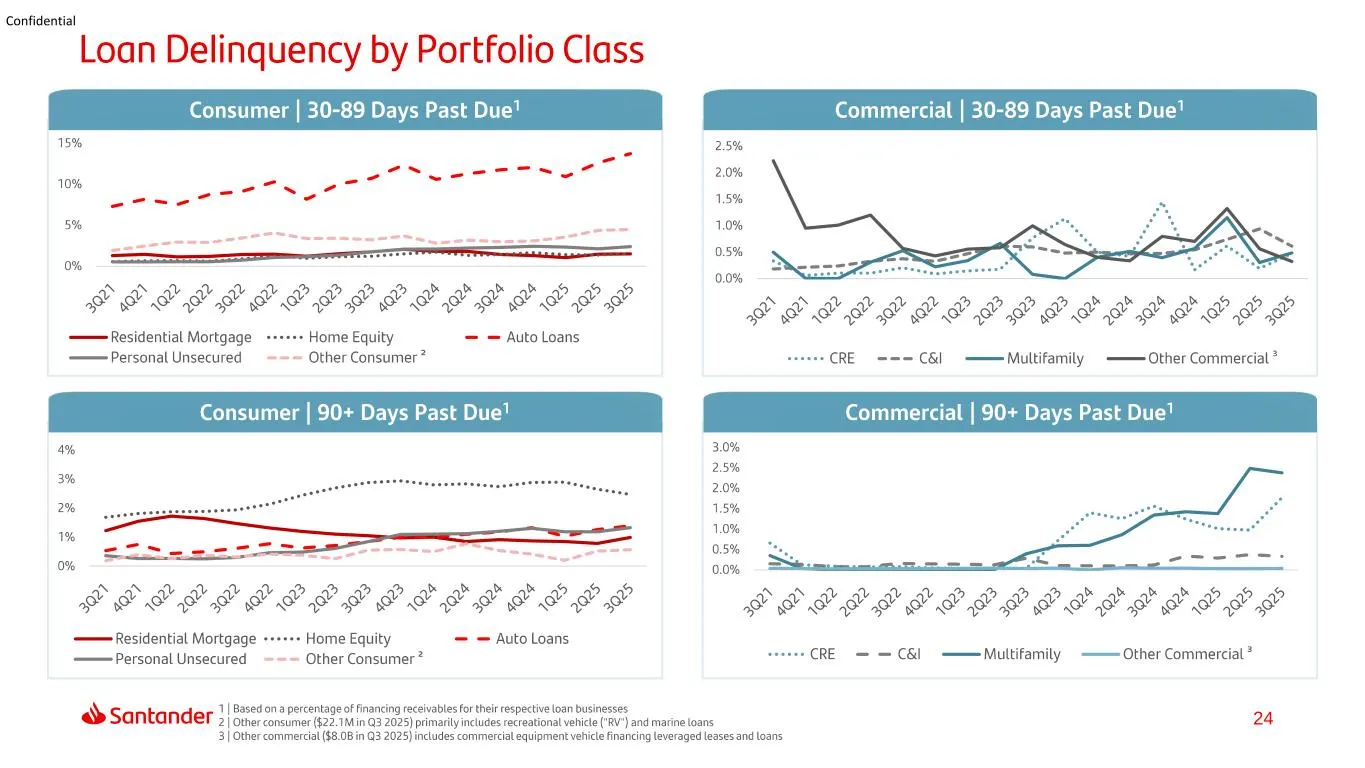
Slide 24: Loan Delinquency by Portfolio Class
Confidential Loan Delinquency by Portfolio Class Consumer | 30-89 Days Past Due’ Commercial | 30-89 Days Past Due’ 15% 25% 25, oon ge 2.0% 10% - - 1.5% 1.0% 0.5% 0.0% Home Equity — — Auto Loans = Other Consumer? — Residential Mortgage —Personal Unsecured = Consumer | 90+ Days Past Due! Commercial |
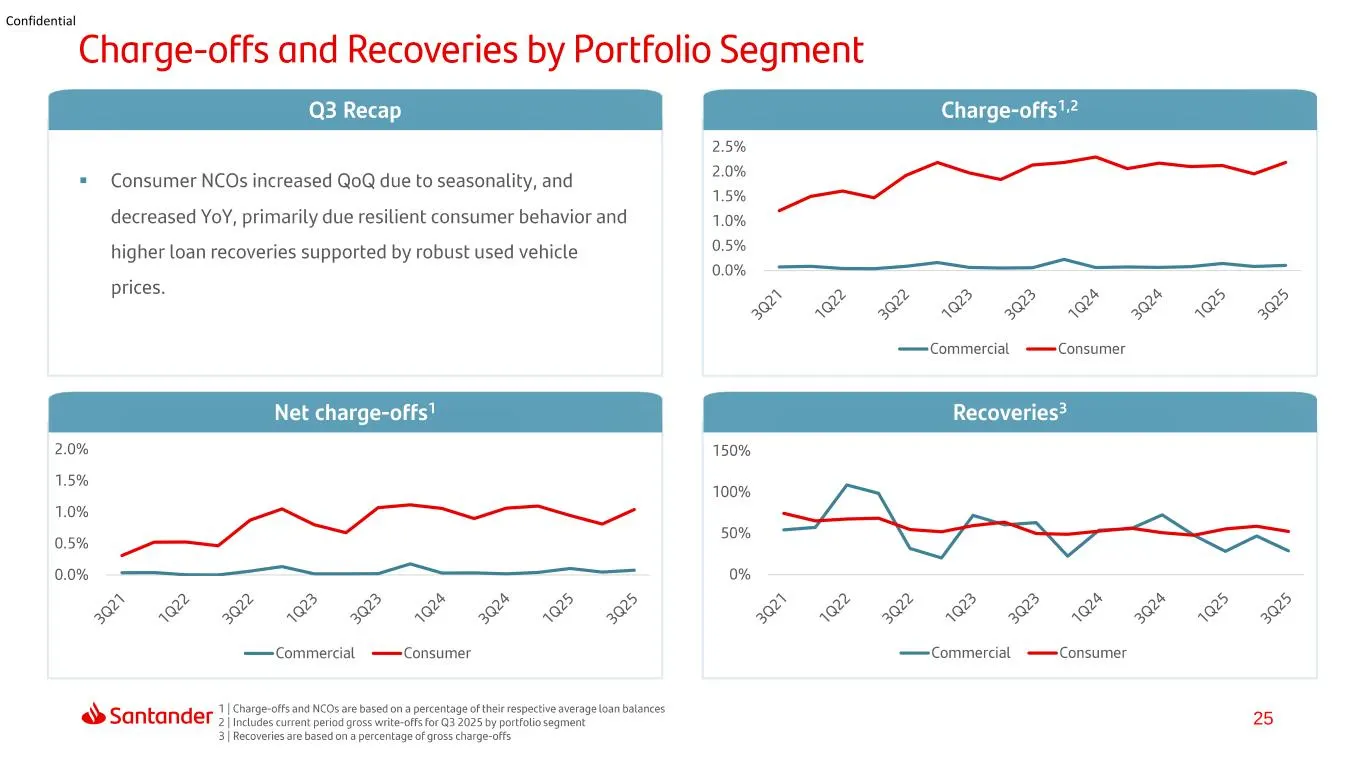
Slide 25: Charge-offs and Recoveries by Portfolio Segment
Confidential Charge-offs and Recoveries by Portfolio Segment Q3 Recap = Consumer NCOs increased QoQ due to seasonality, and decreased YoY, primarily due resilient consumer behavior and higher loan recoveries supported by robust used vehicle prices. Net charge-offs! 2.0% 1.5% 1.0% 0.5% 0.0% — Commerc
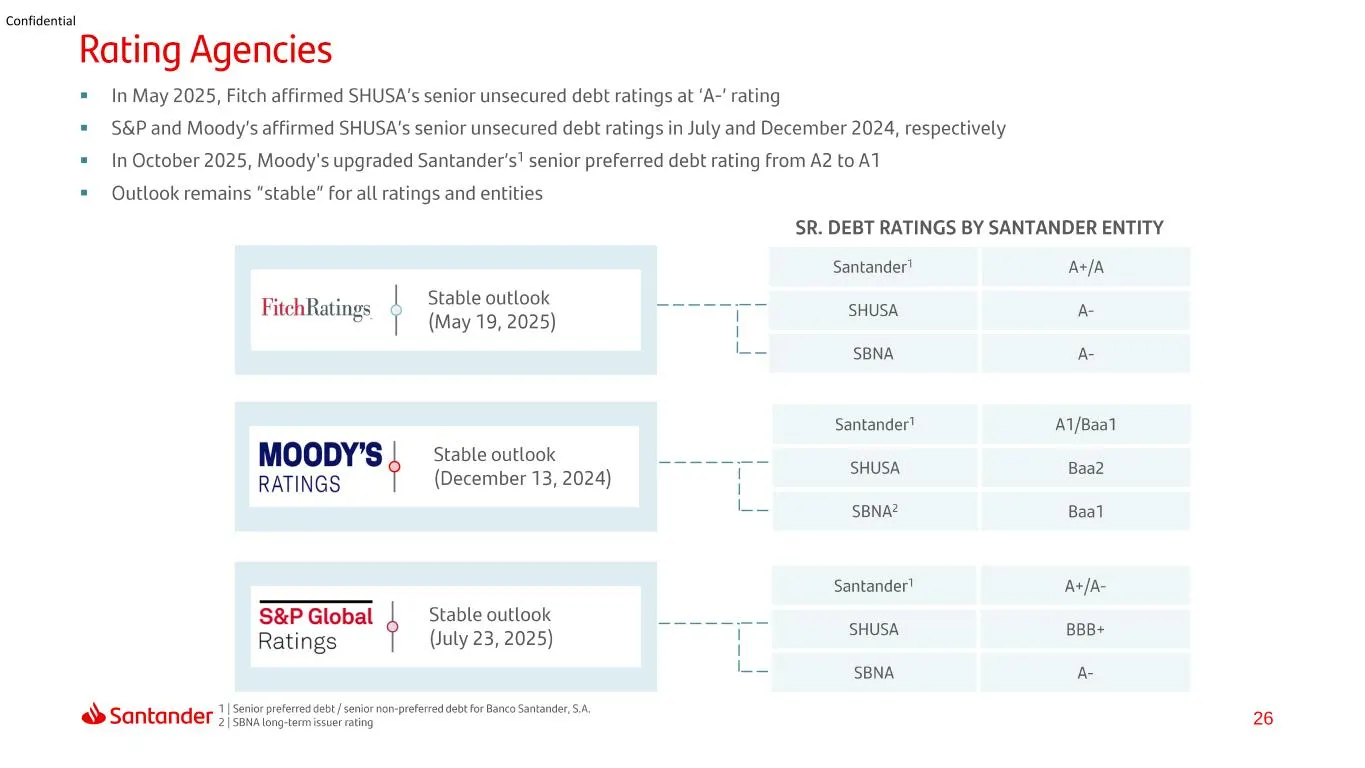
Slide 26: Rating Agencies
Confidential Rating Agencies = In May 2025, Fitch affirmed SHUSA's senior unsecured debt ratings at ‘A-' rating = S&P and Moody's affirmed SHUSA's senior unsecured debt ratings in July and December 2024, respectively = In October 2025, Moody's upgraded Santander's! senior preferred debt rating from
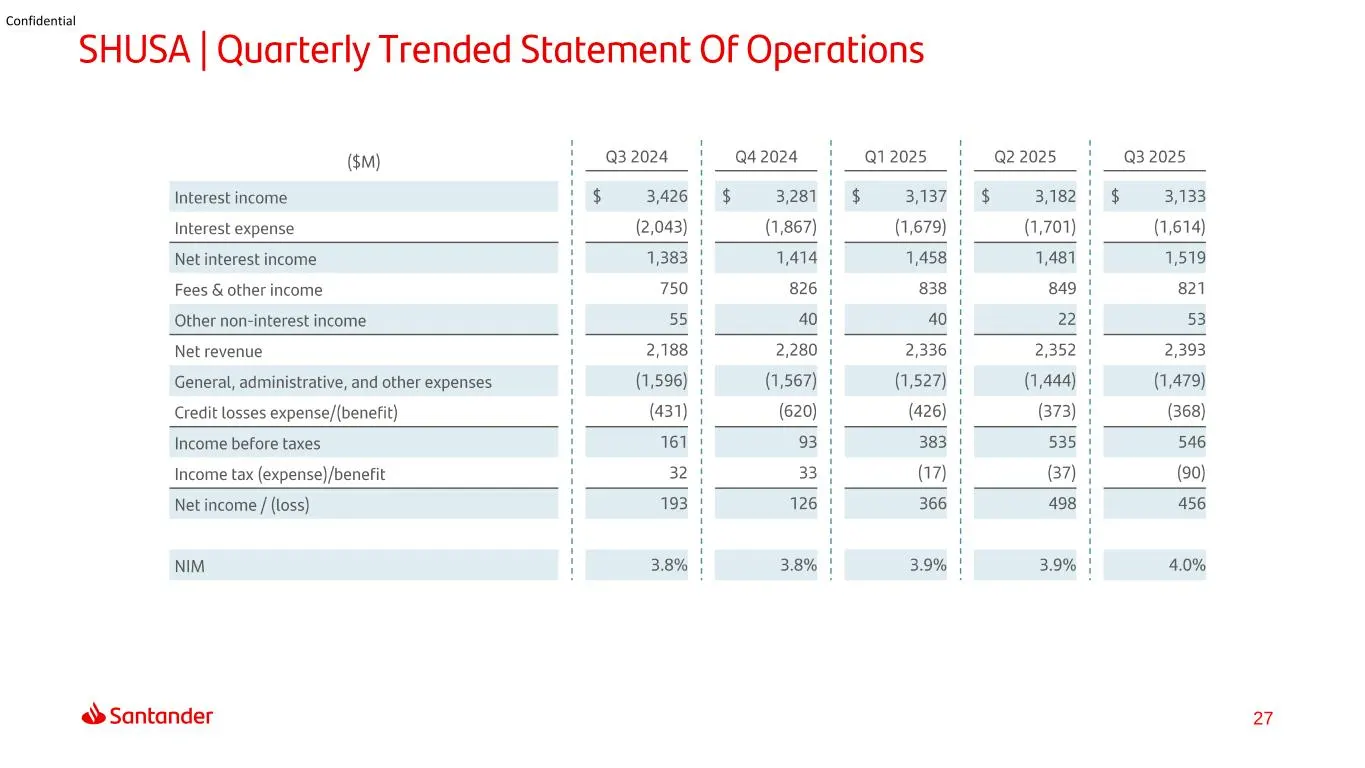
Slide 27: SHUSA | Quarterly Trended Statement Of Operations
Confidential SHUSA | Quarterly Trended Statement Of Operations (sm) | 932024 | _a42024_ | ai20z5 | _aaz02s_ | 932025 Interest income ' $ 3,426 ' $ 3,281 ' $ 3,137 ' 3,182 H $ 3,133 Interest expense { (2043); (1,867) } 9,679) | zon) }_—_t.614) Net interest income H 1,383 7414 | 7,458 | 7481 | 7,519 F
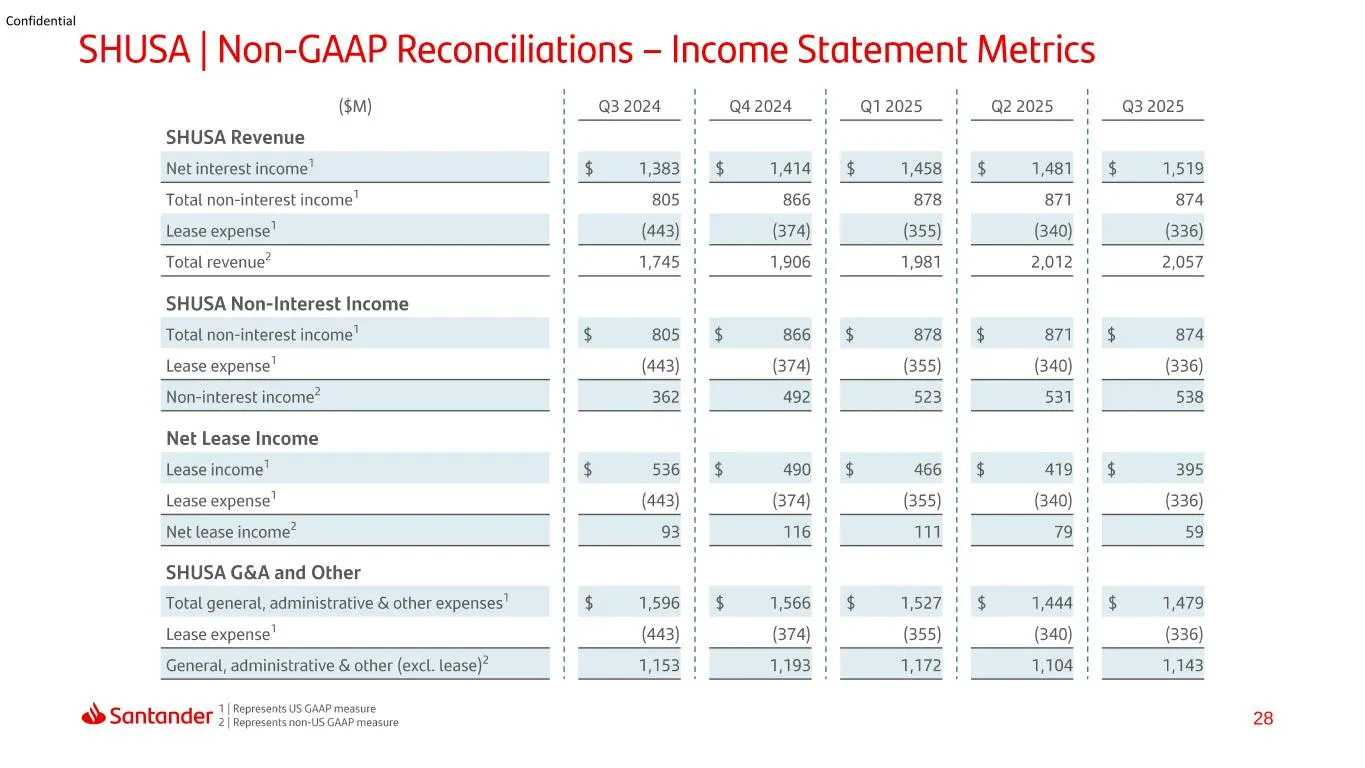
Slide 28: SHUSA | Non-GAAP Reconciliations — Income Statement Metrics
Confidential SHUSA | Non-GAAP Reconciliations — Income Statement Metrics ($m) ' Q3 2024 ' Q4 2024 ' Q1 2025 ' Q2 2025 ' Q3 2025 SHUSA Revenue Net interest income! '$ 1,383 | $ 1414 | $ 1458 | $ 1,481 + 1,519 Total non-interest income! H 805 | 866 | 878} 871} 874 Lease expense! : (443) | (374) | (355
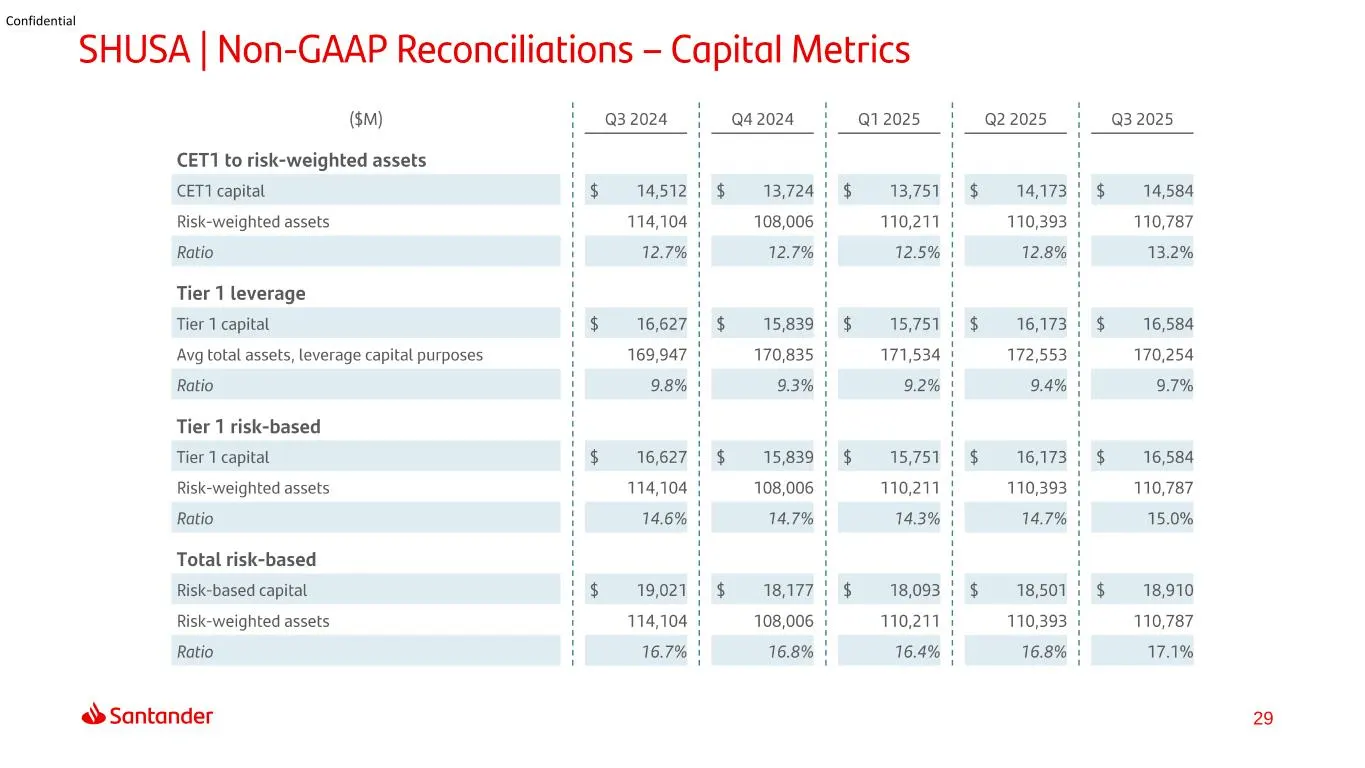
Slide 29: SHUSA | Non-GAAP Reconciliations - Capital Metrics
Confidential ($m) CET1 to risk-weighted assets CET1 capital Risk-weighted assets Ratio Tier 1 leverage Tier 1 capital Avg total assets, leverage capital purposes Ratio Tier 1 risk-based Tier 1 capital Risk-weighted assets Ratio Total risk-based Risk-based capital Risk-weighted assets Ratio «> Santan
Slide 30: Thank You.
Thank You. Our purpose is to help people and businesses prosper. Our culture is based on believing that everything we do should be: Simple Personal Fair «> Santander Dow Jones Sustainability Indices In Collaboration with RobecoSAM « FTSE4Good
Source: SEC EDGAR · 8-K filed Nov 4, 2025
More decks from Santander Holdings USA Inc
 Debt Investor Presentation (August 2026)30 slides · Aug 12, 2026
 Debt Investor Presentation (August 2026)30 slides · Aug 12, 2026
 Debt Investor Presentation (June 2026)29 slides · Jun 12, 2026
 Debt Investor Presentation (June 2026)29 slides · Jun 12, 2026
 Debt Investor Presentation (March 2026)36 slides · Mar 6, 2026
 Debt Investor Presentation (March 2026)36 slides · Mar 6, 2026