Astoria Financial — Merger or Acquisition (November 2015)
42 slides from Astoria Financial's merger presentation, Nov 10, 2015
Slide 1: Re-Launching our Growth Strategy; Growing Earnings, Building Capital, and Creating Value
Exhibit 99.1 Re-Launching our Growth Strategy; Growing Earnings, Building Capital, and Creating Value Investor Presentation November 2015
Slide 2: Cautionary Statements
Cautionary Statements Additional Information and Where to Find It These materials do not constitute an offer to sell or a solicitation of an offer to buy any securities or a solicitation of any vote or approval. New York Community Bancorp, Inc. (“NYCB”) will file a registration statement on Form S-4
Slide 3: Cautionary Statements
Cautionary Statements Forward-Looking Information The information presented herein, on the webcast, and in other related communications may contain certain “forward-looking statements” within the meaning of the Private Securities Litigation Reform Act of 1995. These statements include, but are not l
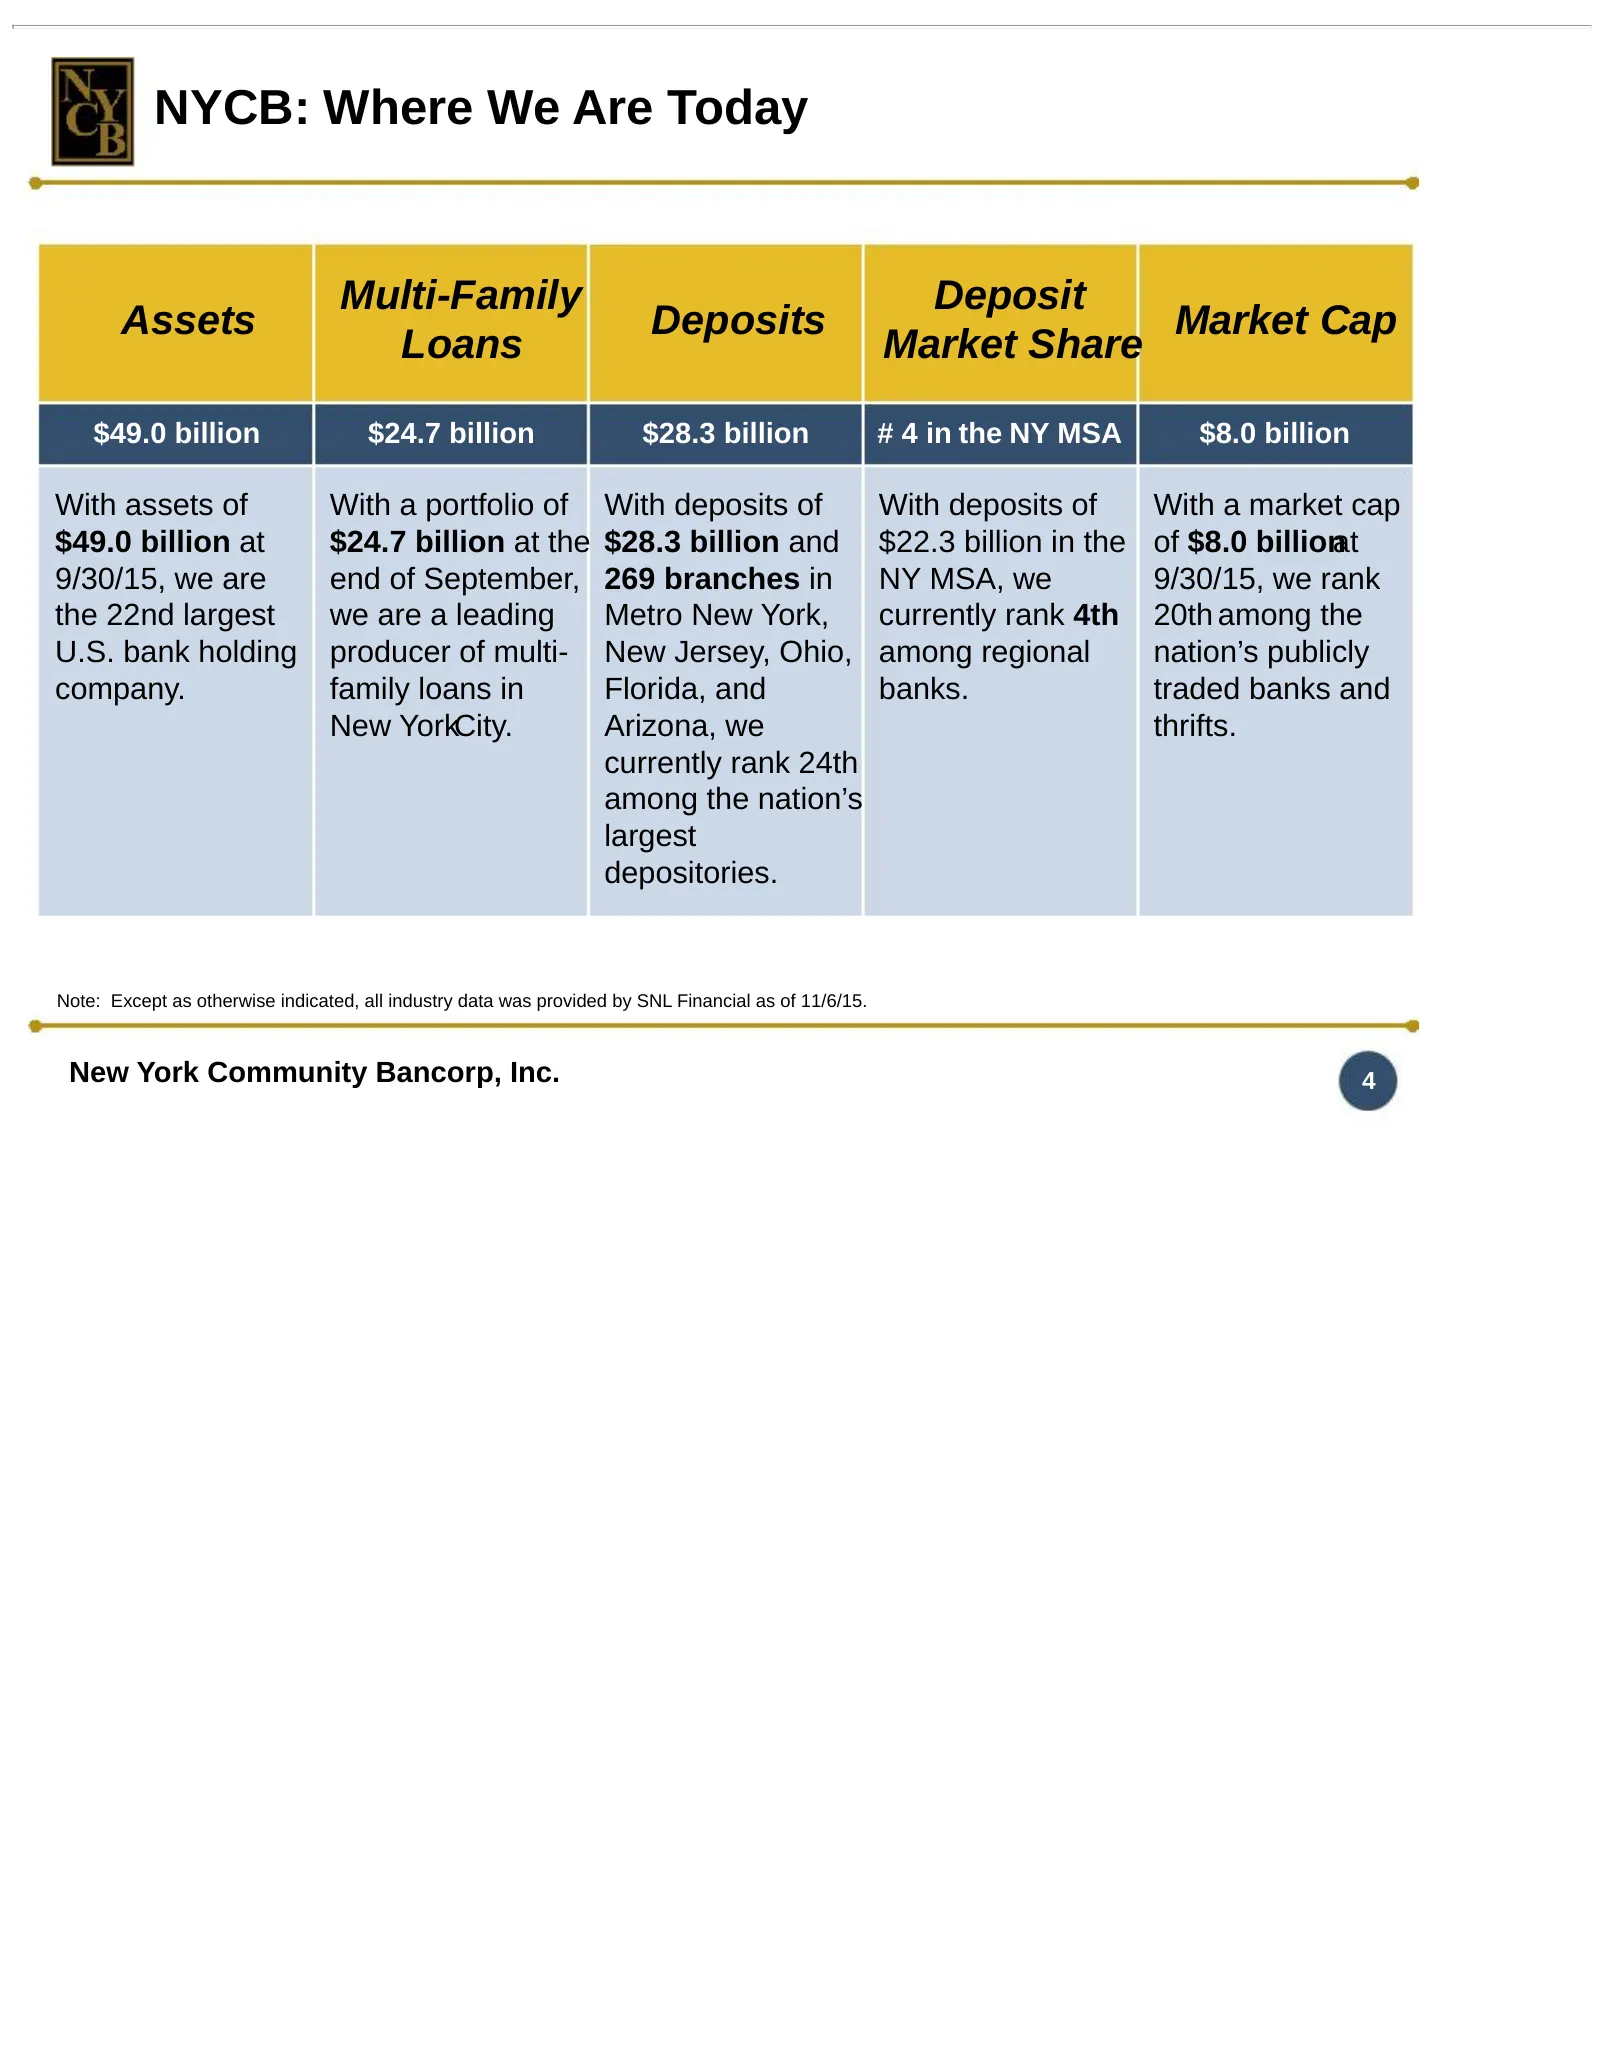
Slide 4: NYCB: Where We Are Today
NYCB: Where We Are Today Multi-Family Deposit Assets Deposits Market Cap Loans Market Share $49.0 billion $24.7 billion $28.3 billion # 4 in the NY MSA $8.0 billion With assets of With a portfolio of With deposits of With deposits of With a market cap $49.0 billion at $24.7 billion at the $28.3 bill
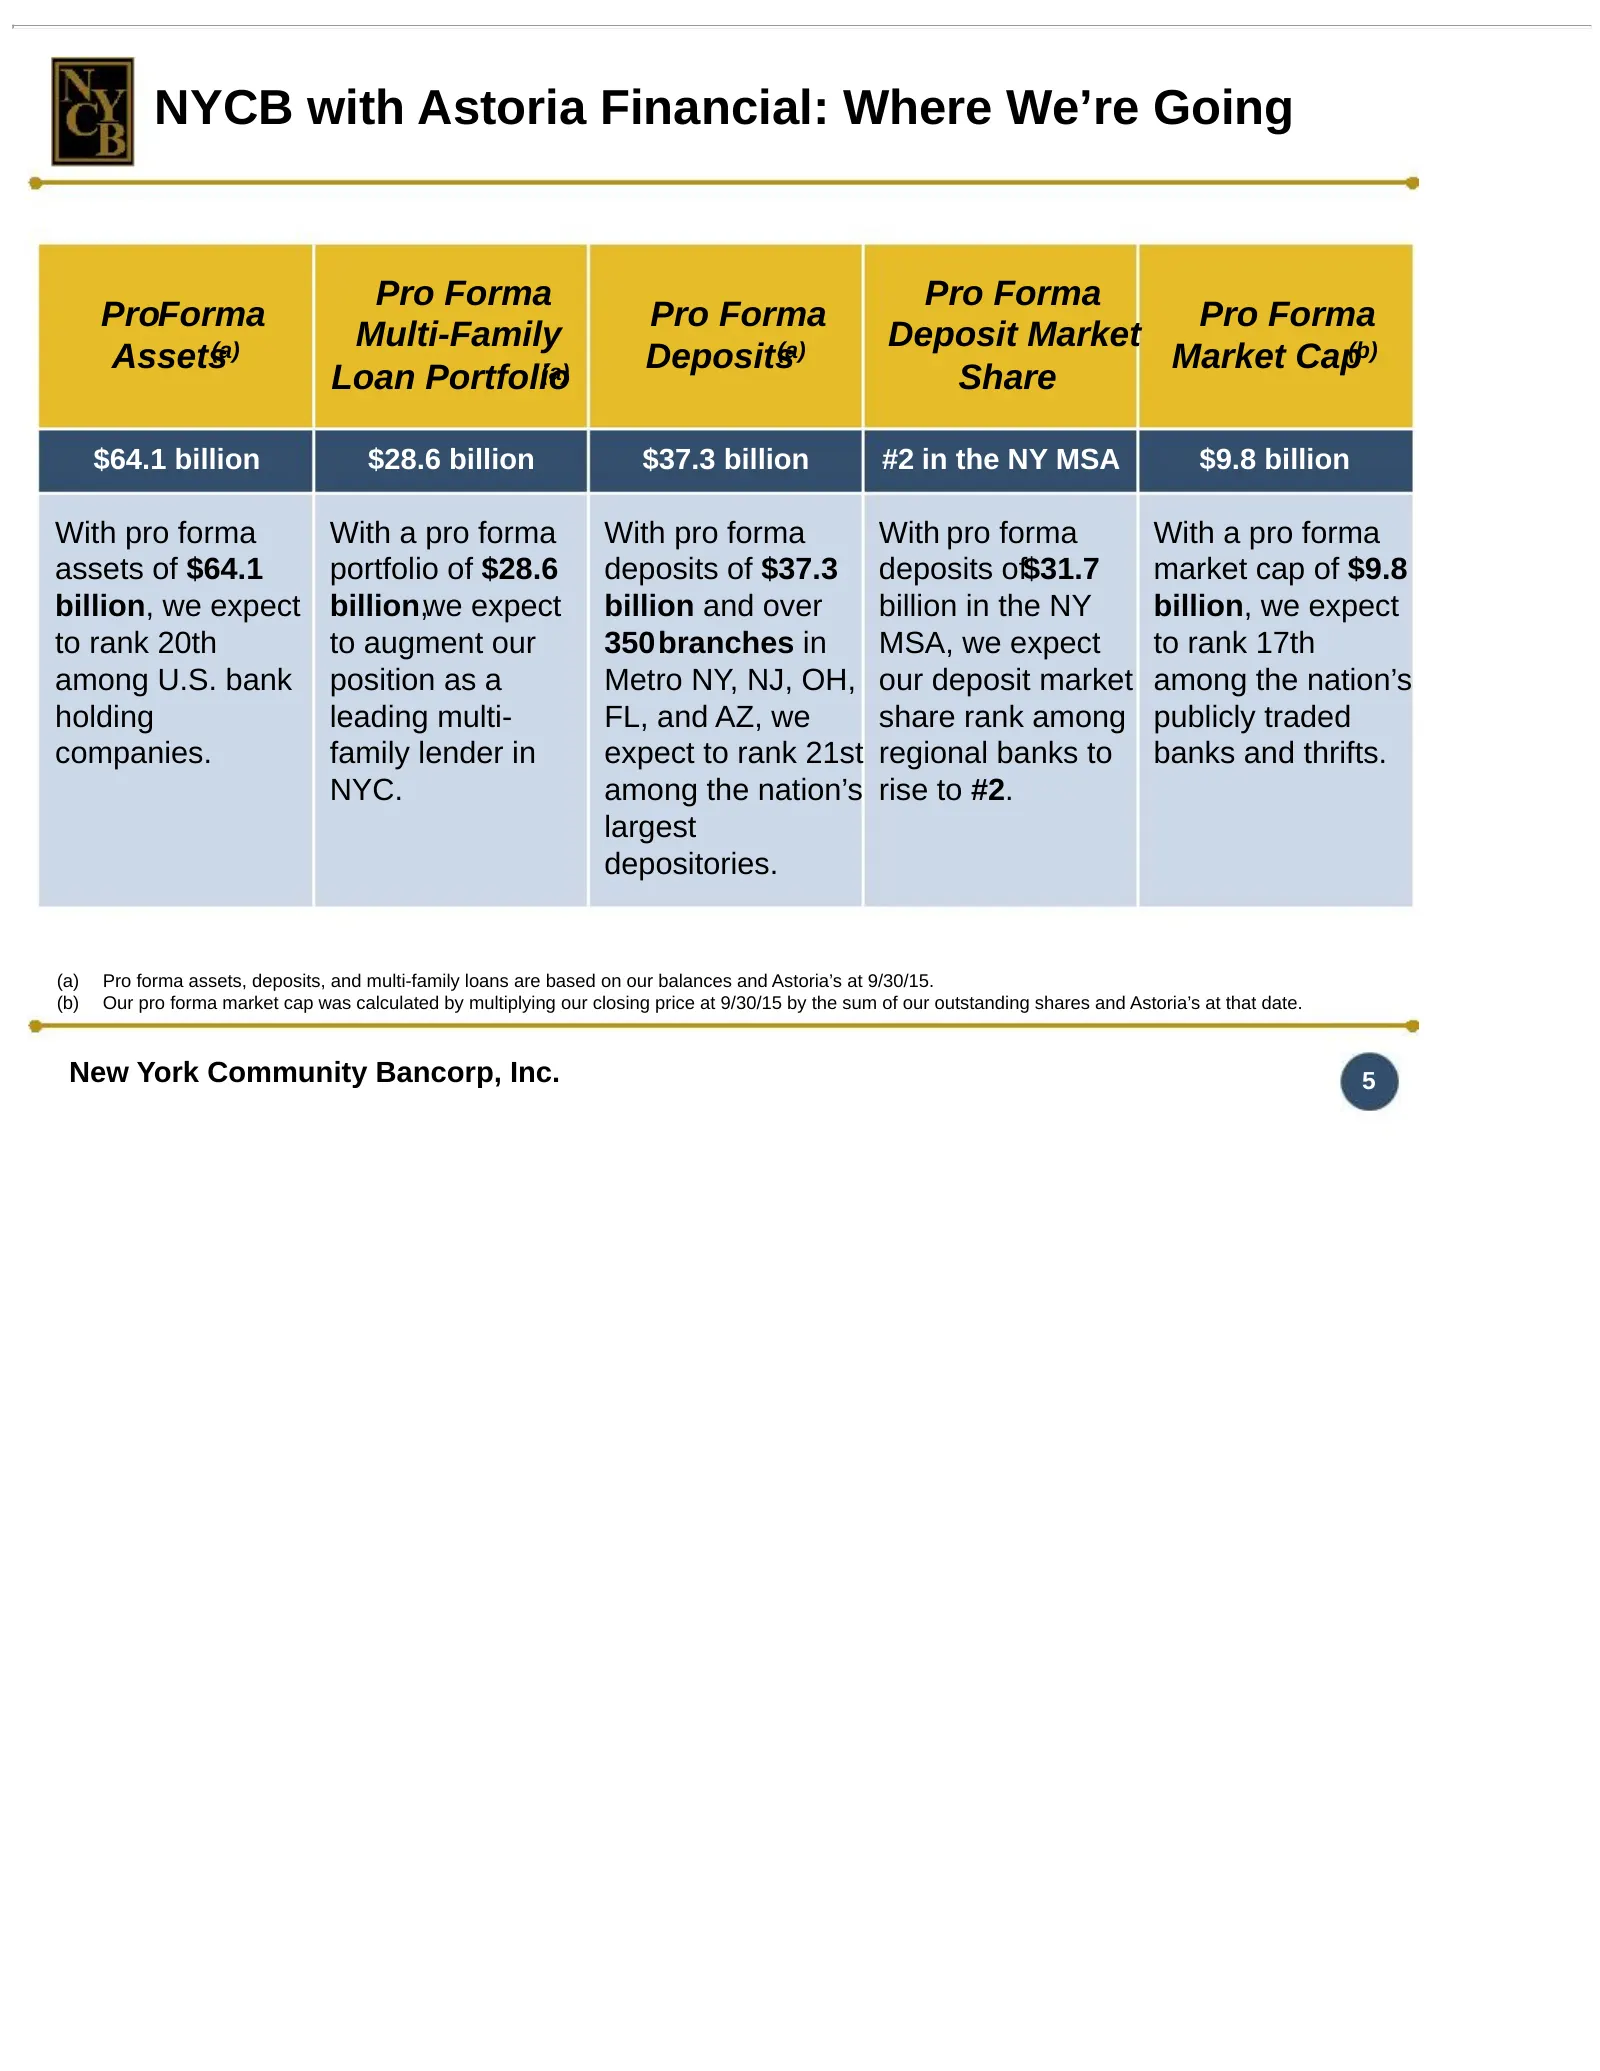
Slide 5: NYCB with Astoria Financial: Where We're Going
NYCB with Astoria Financial: Where We’re Going Pro Forma Pro Forma ProForma Pro Forma Pro Forma Multi-Family Deposit Market Assets(a) Deposits(a) Market Cap(b) Loan Portfolio (a) Share $64.1 billion $28.6 billion $37.3 billion #2 in the NY MSA $9.8 billion With pro forma With a pro forma With pro fo
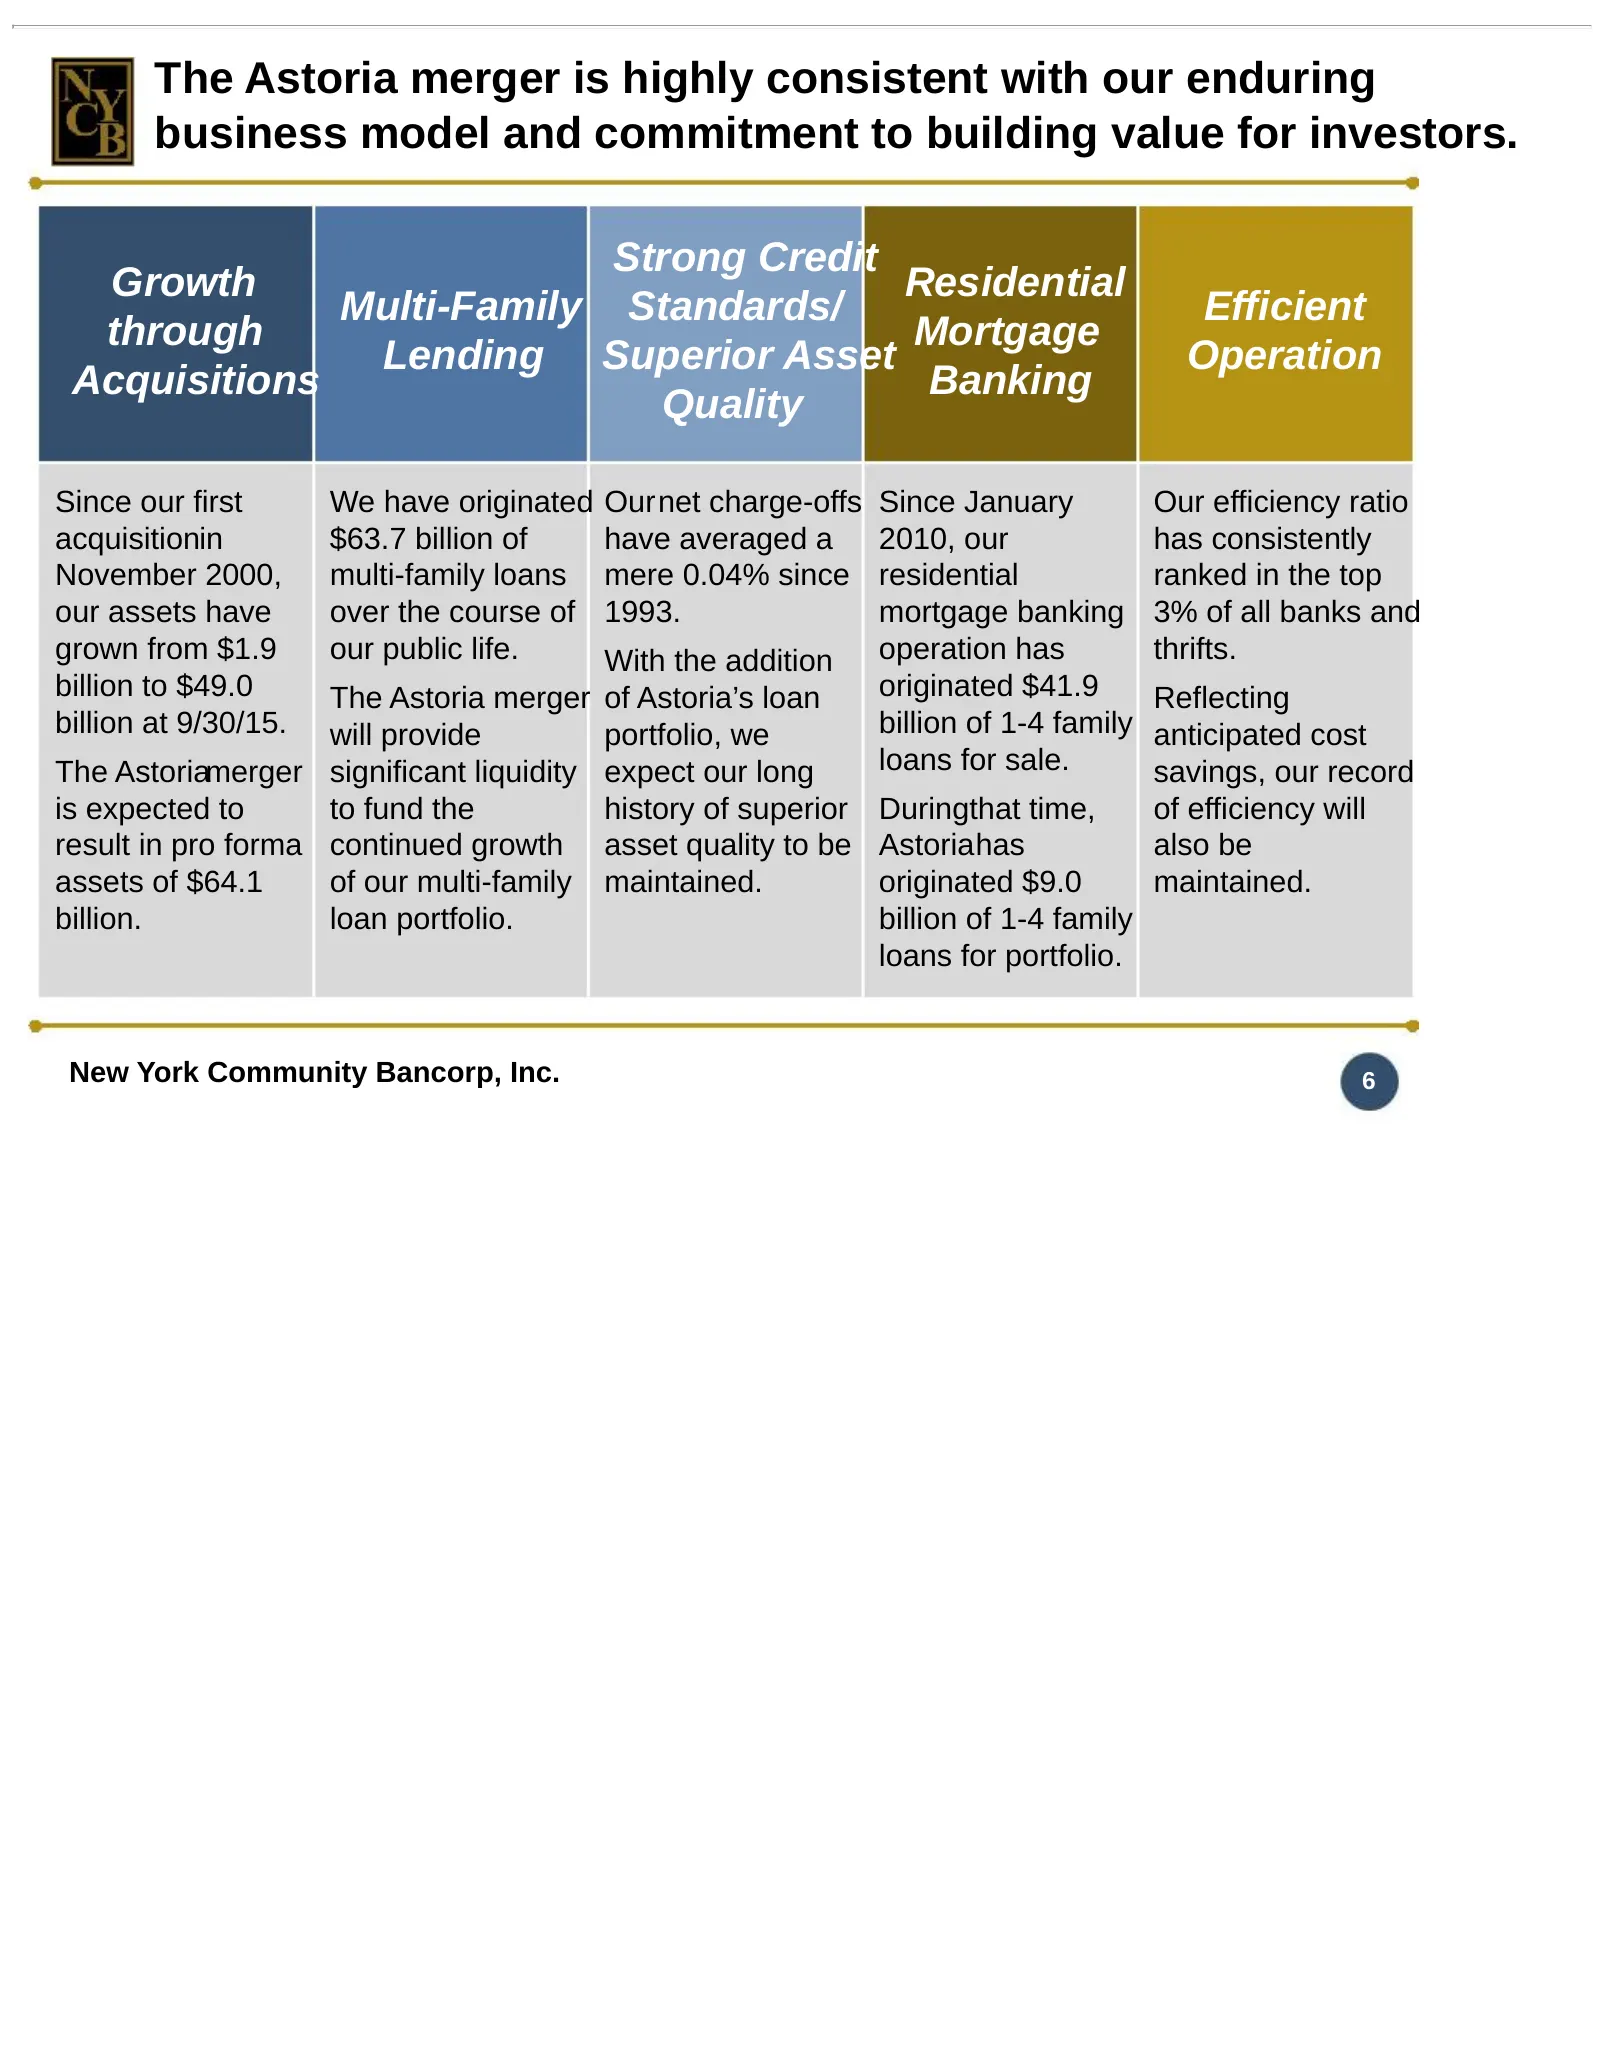
Slide 6: The Astoria merger is highly consistent with our enduring business model
The Astoria merger is highly consistent with our enduring business model and commitment to building value for investors. Strong Credit Growth Residential Multi-Family Standards/ Efficient through Mortgage Lending Superior Asset Operation Acquisitions Banking Quality Since our first We have originate
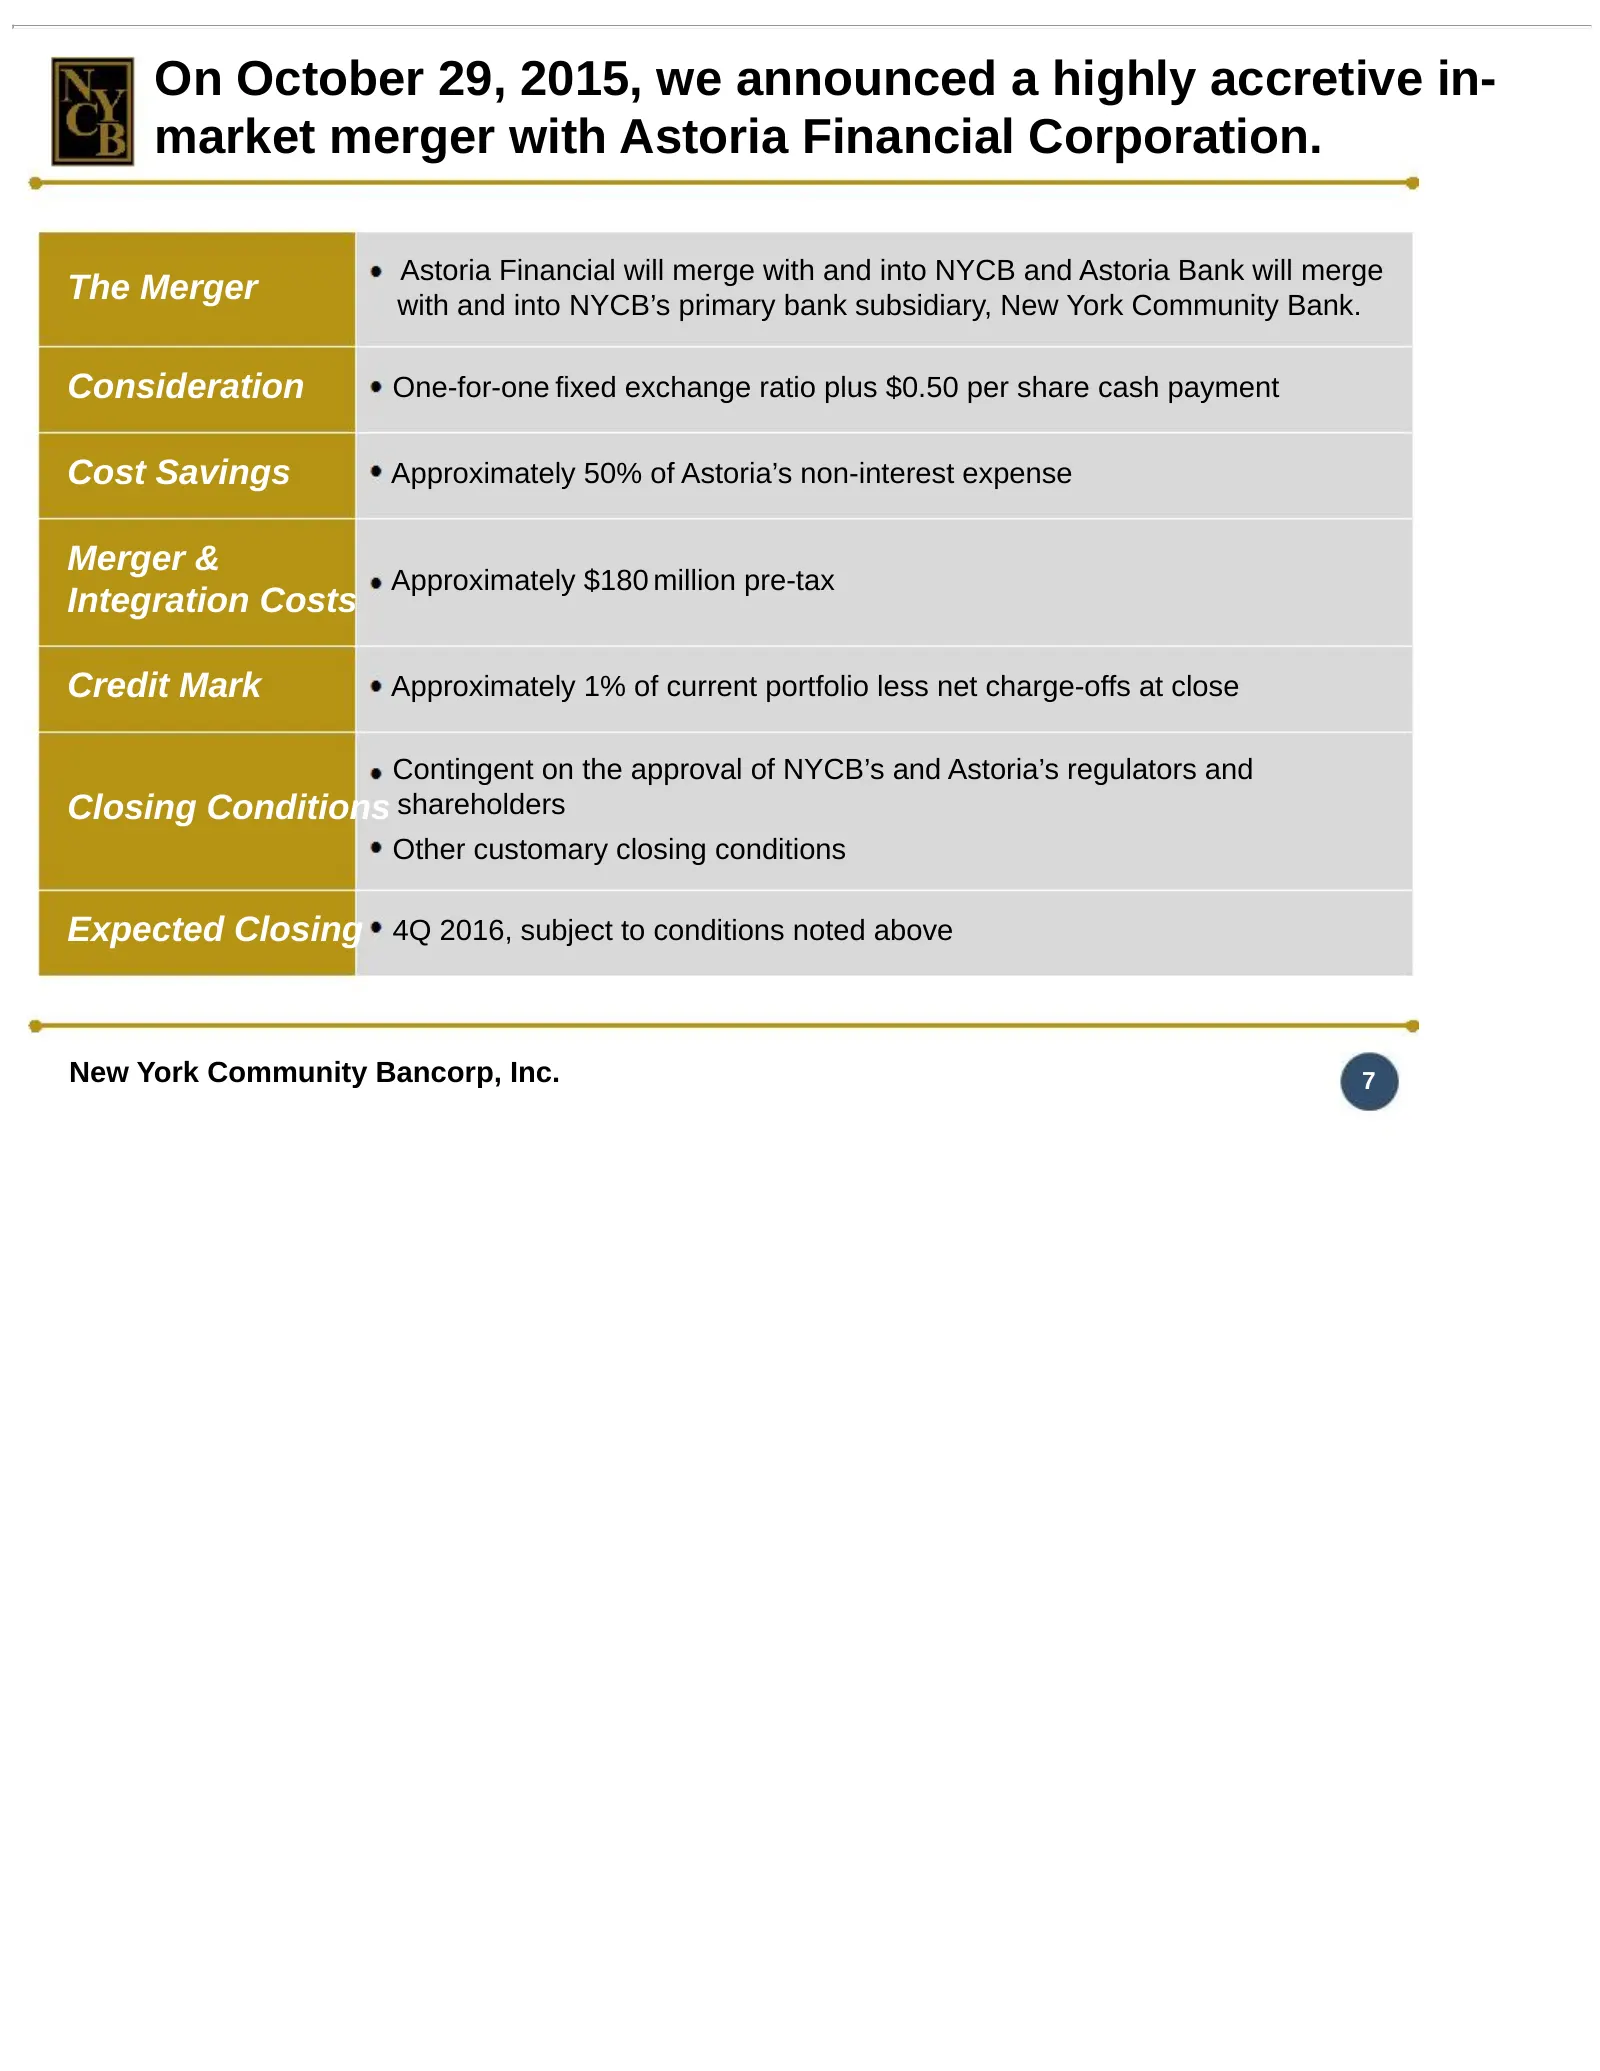
Slide 7: On October 29, 2015, we announced a highly accretive in-market merger with Astoria
On October 29, 2015, we announced a highly accretive in- market merger with Astoria Financial Corporation. Astoria Financial will merge with and into NYCB and Astoria Bank will merge The Merger with and into NYCB’s primary bank subsidiary, New York Community Bank. Consideration One-for-one fixed exc
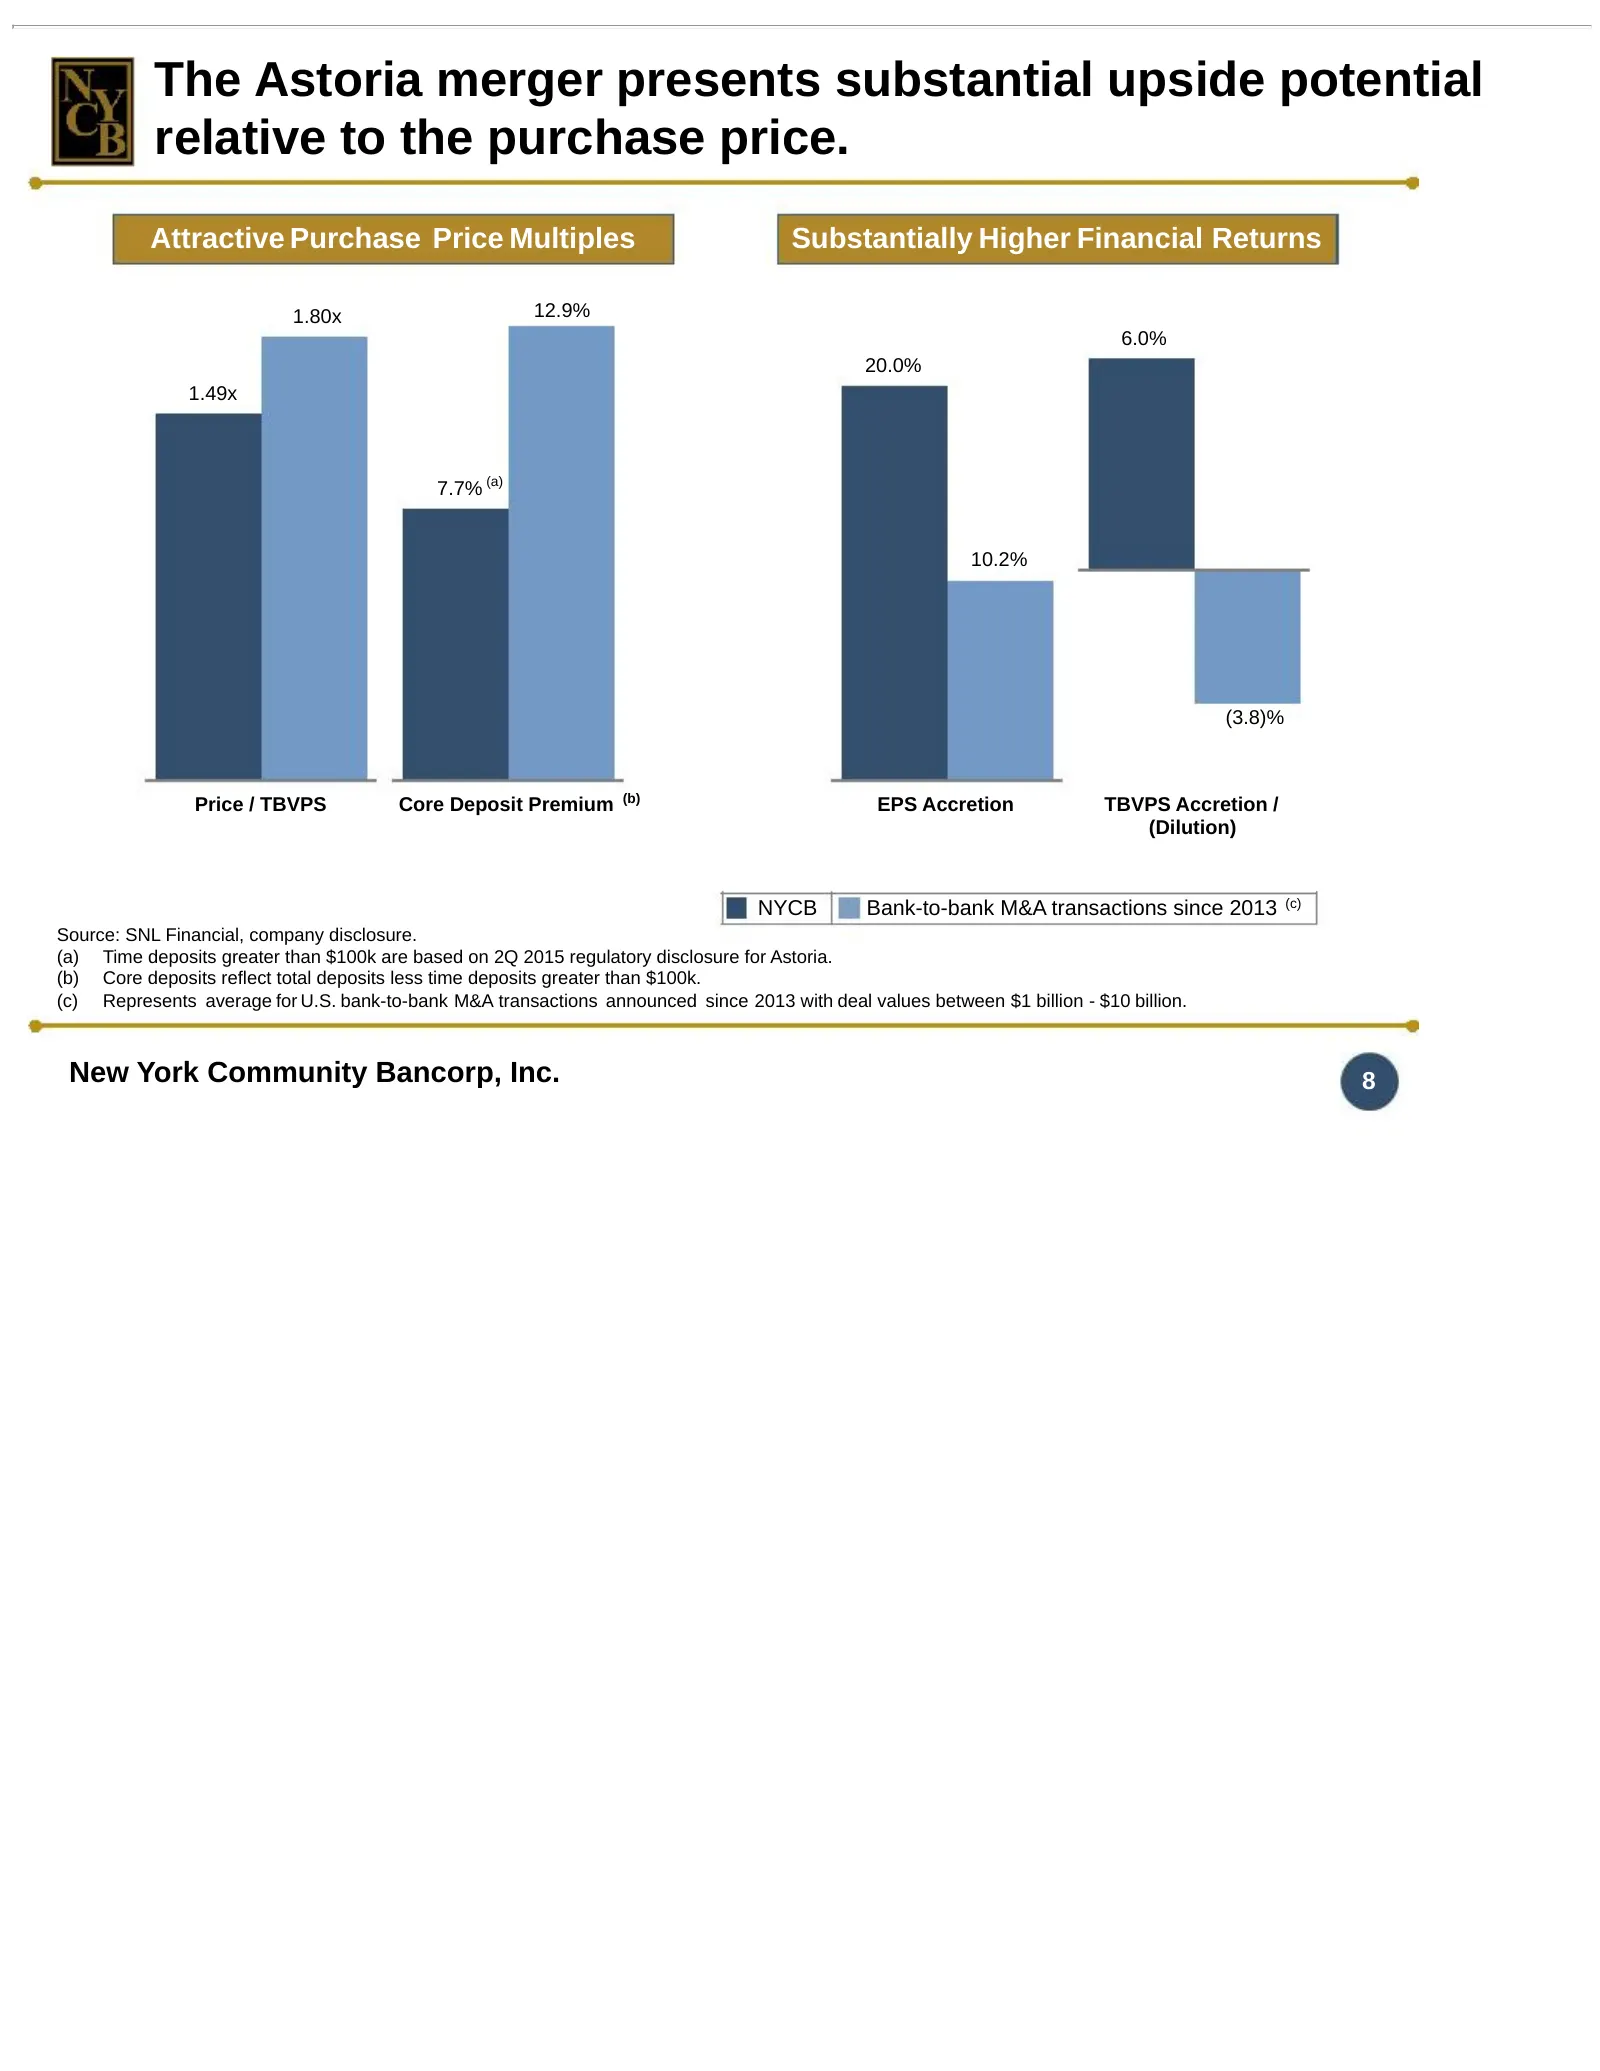
Slide 8: The Astoria merger presents substantial upside potential relative to the purchase price
The Astoria merger presents substantial upside potential relative to the purchase price. Attractive Purchase Price Multiples Substantially Higher Financial Returns 1.80x 12.9% 6.0% 20.0% 1.49x 7.7% (a) 10.2% (3.8)% Price / TBVPS Core Deposit Premium (b) EPS Accretion TBVPS Accretion / (Dilution) NYC
Slide 9: Growth Through Acquisitions
Growth Through Acquisitions
Slide 10: The Astoria merger represents the re-launch of our growth strategy
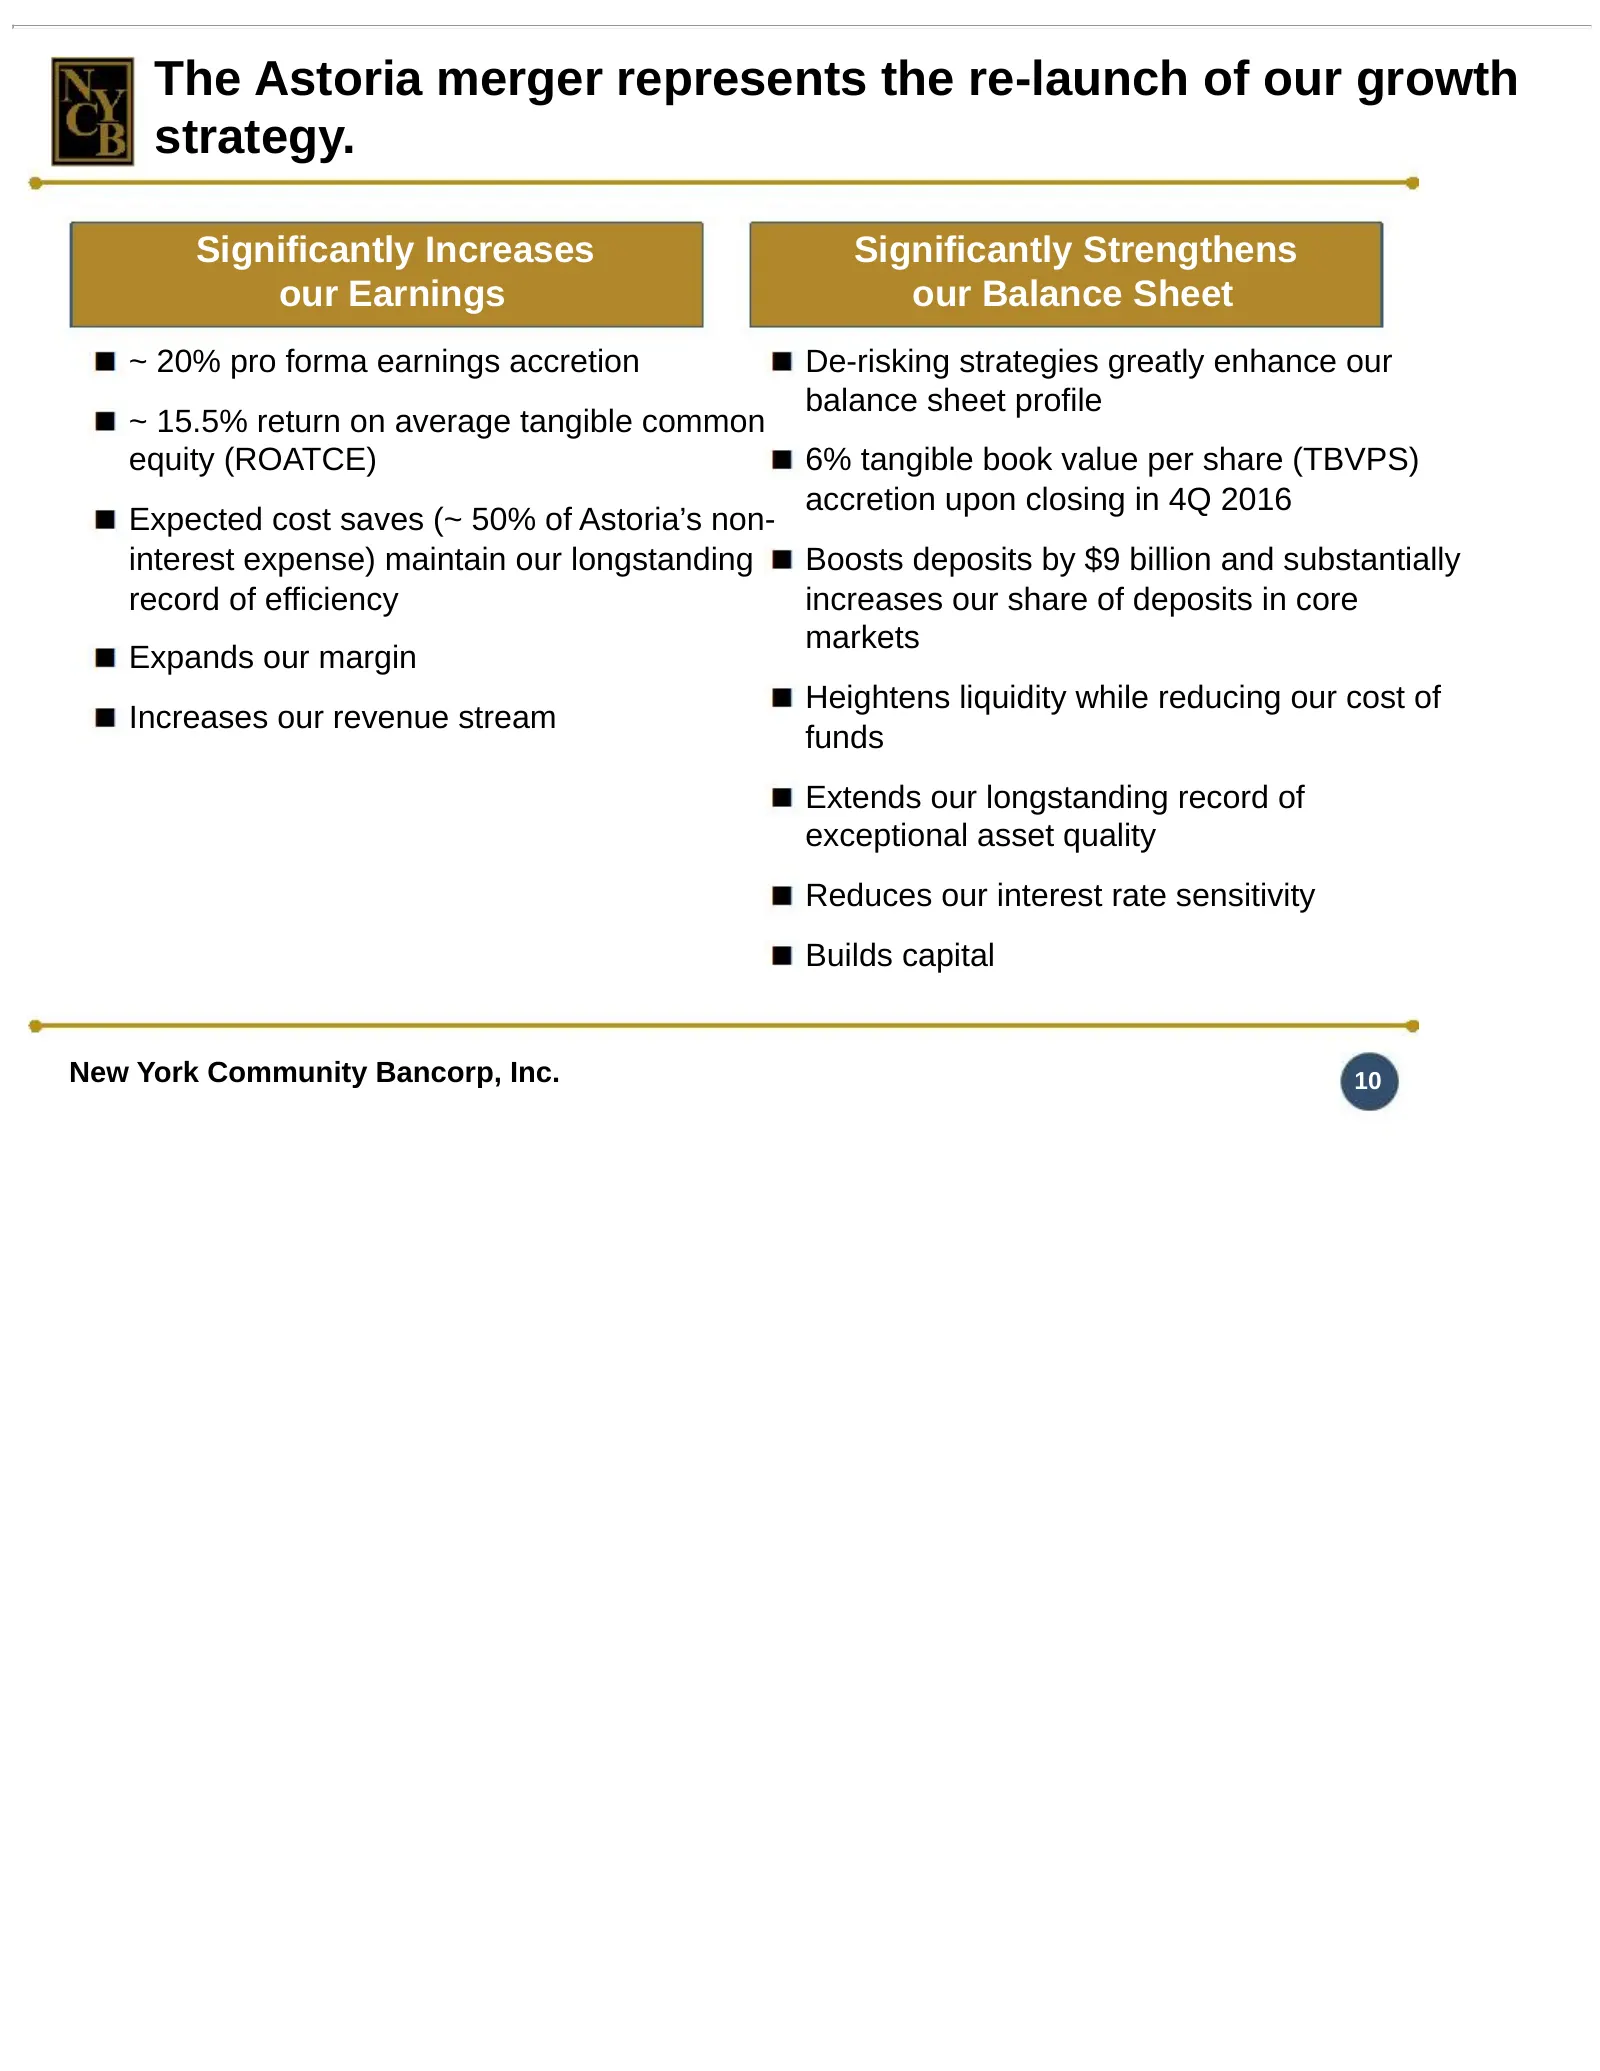
The Astoria merger represents the re-launch of our growth strategy. Significantly Increases Significantly Strengthens our Earnings our Balance Sheet ~ 20% pro forma earnings accretion De-risking strategies greatly enhance our balance sheet profile ~ 15.5% return on average tangible common equity (RO
Slide 11: The Astoria merger creates New York's pre-eminent community bank
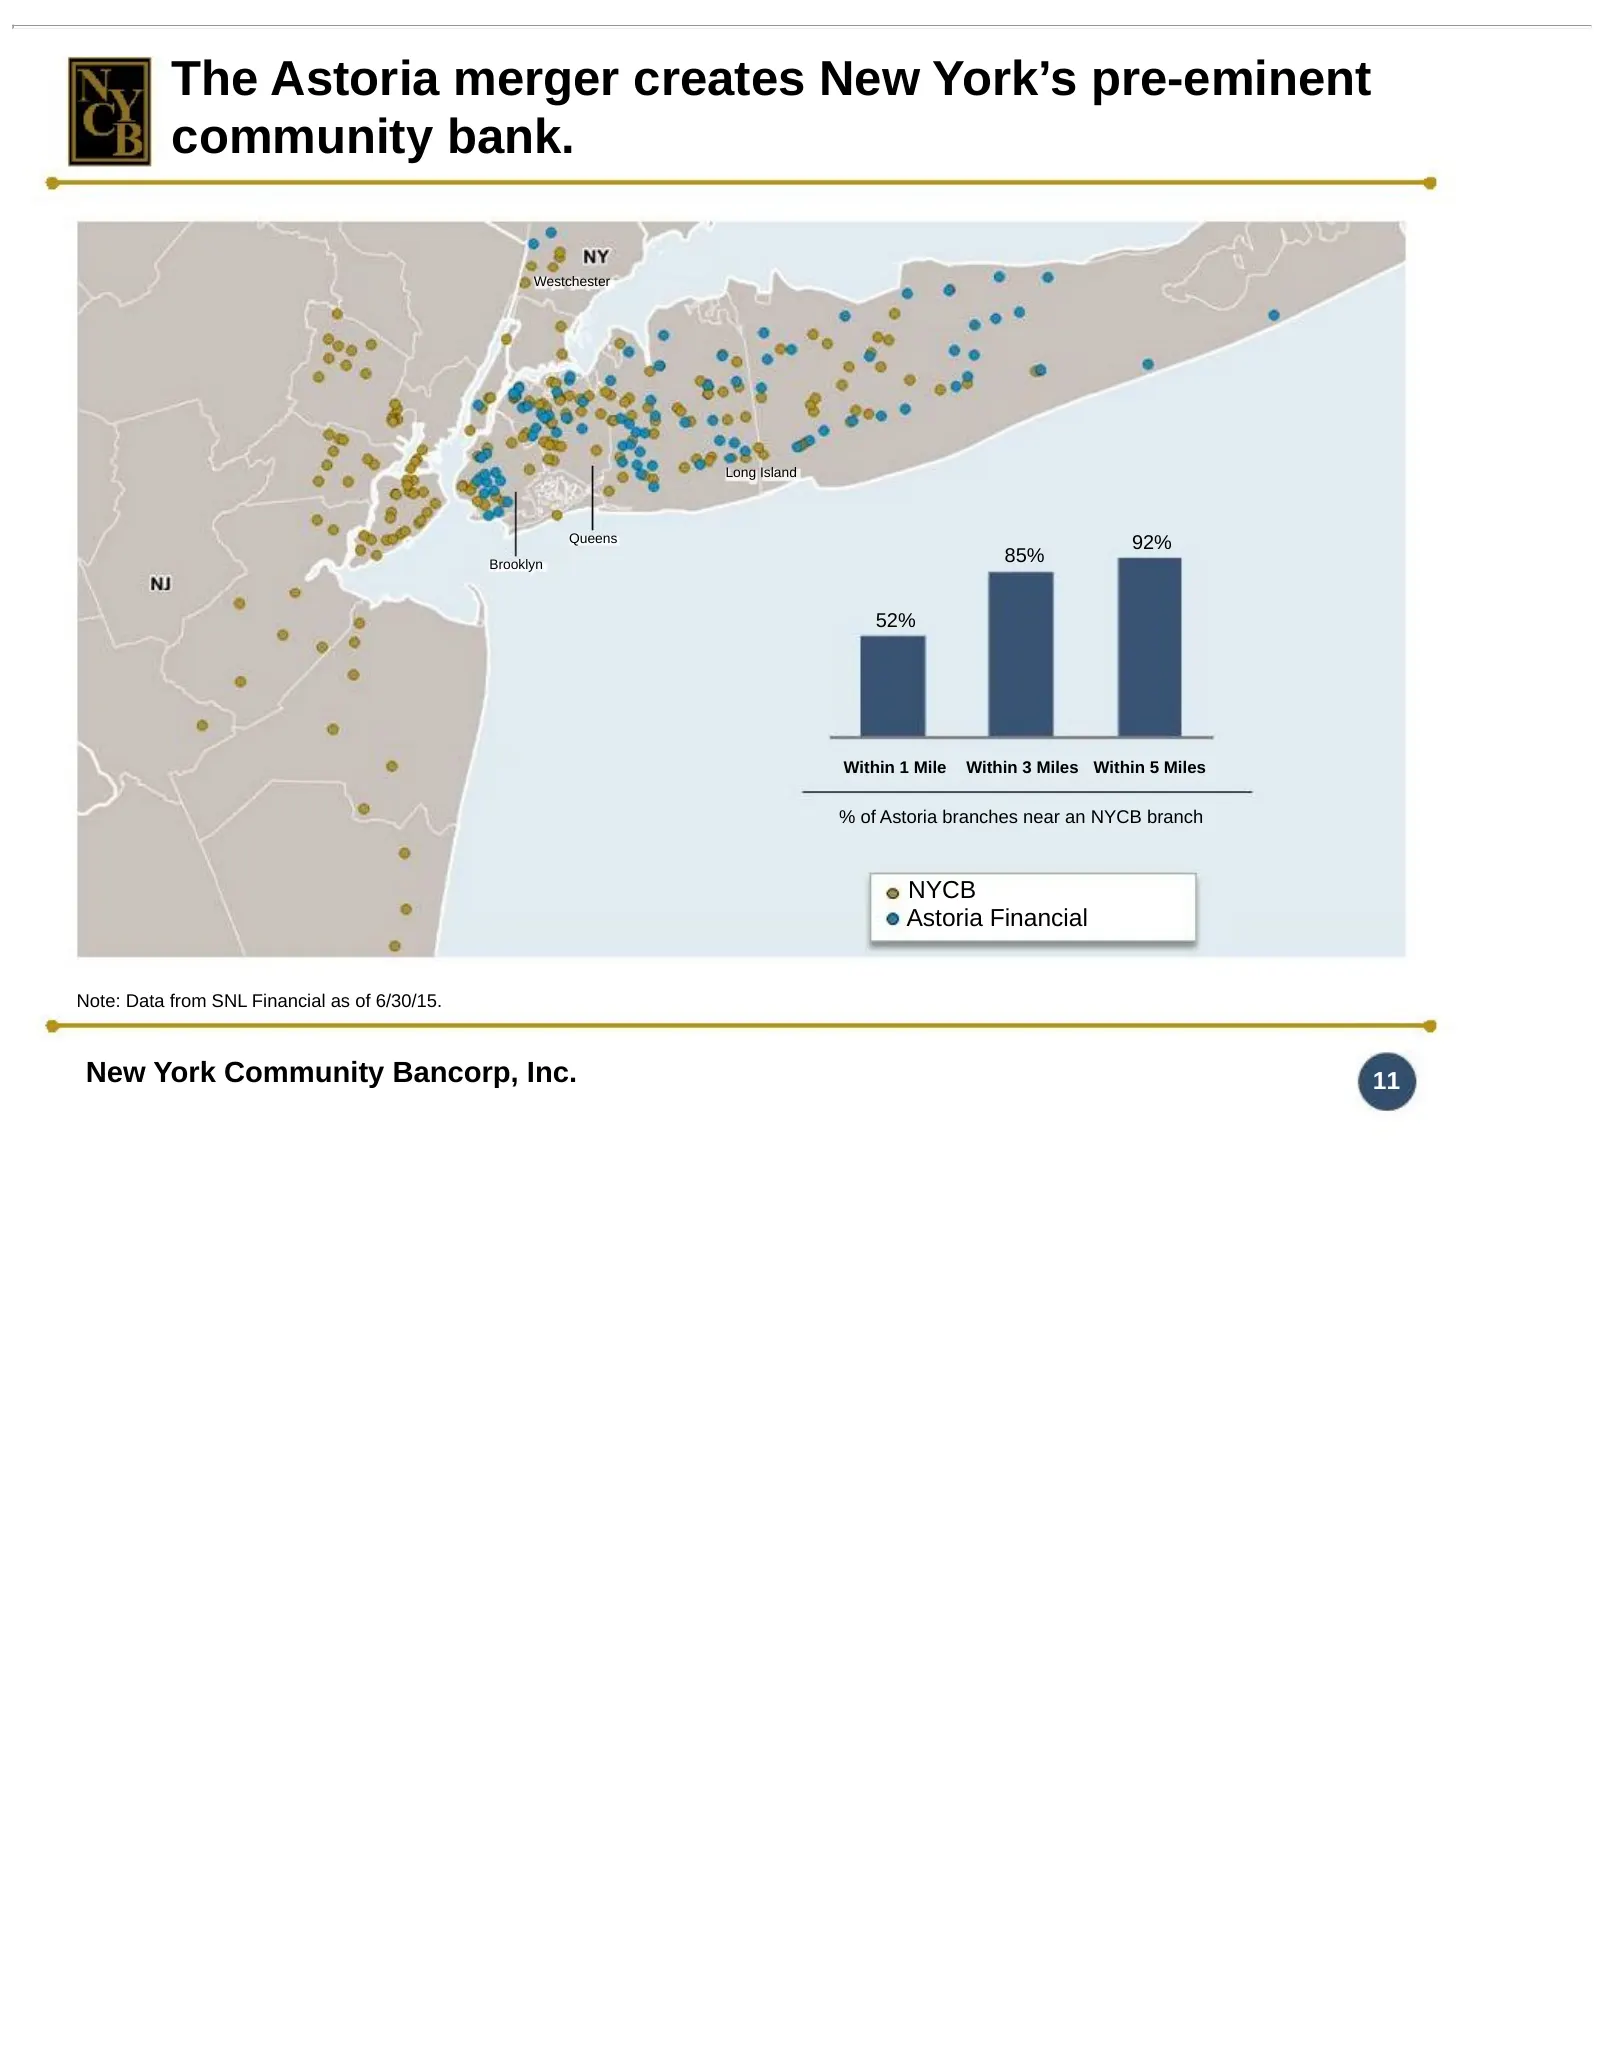
The Astoria merger creates New York’s pre-eminent community bank. Westchester Long Island Queens 92% Brooklyn 85% 52% Within 1 Mile Within 3 Miles Within 5 Miles % of Astoria branches near an NYCB branch NYCB Astoria Financial Note: Data from SNL Financial as of 6/30/15. New York Community Bancorp,
Slide 12: The Astoria merger significantly increases our share of deposits in the NY MSA
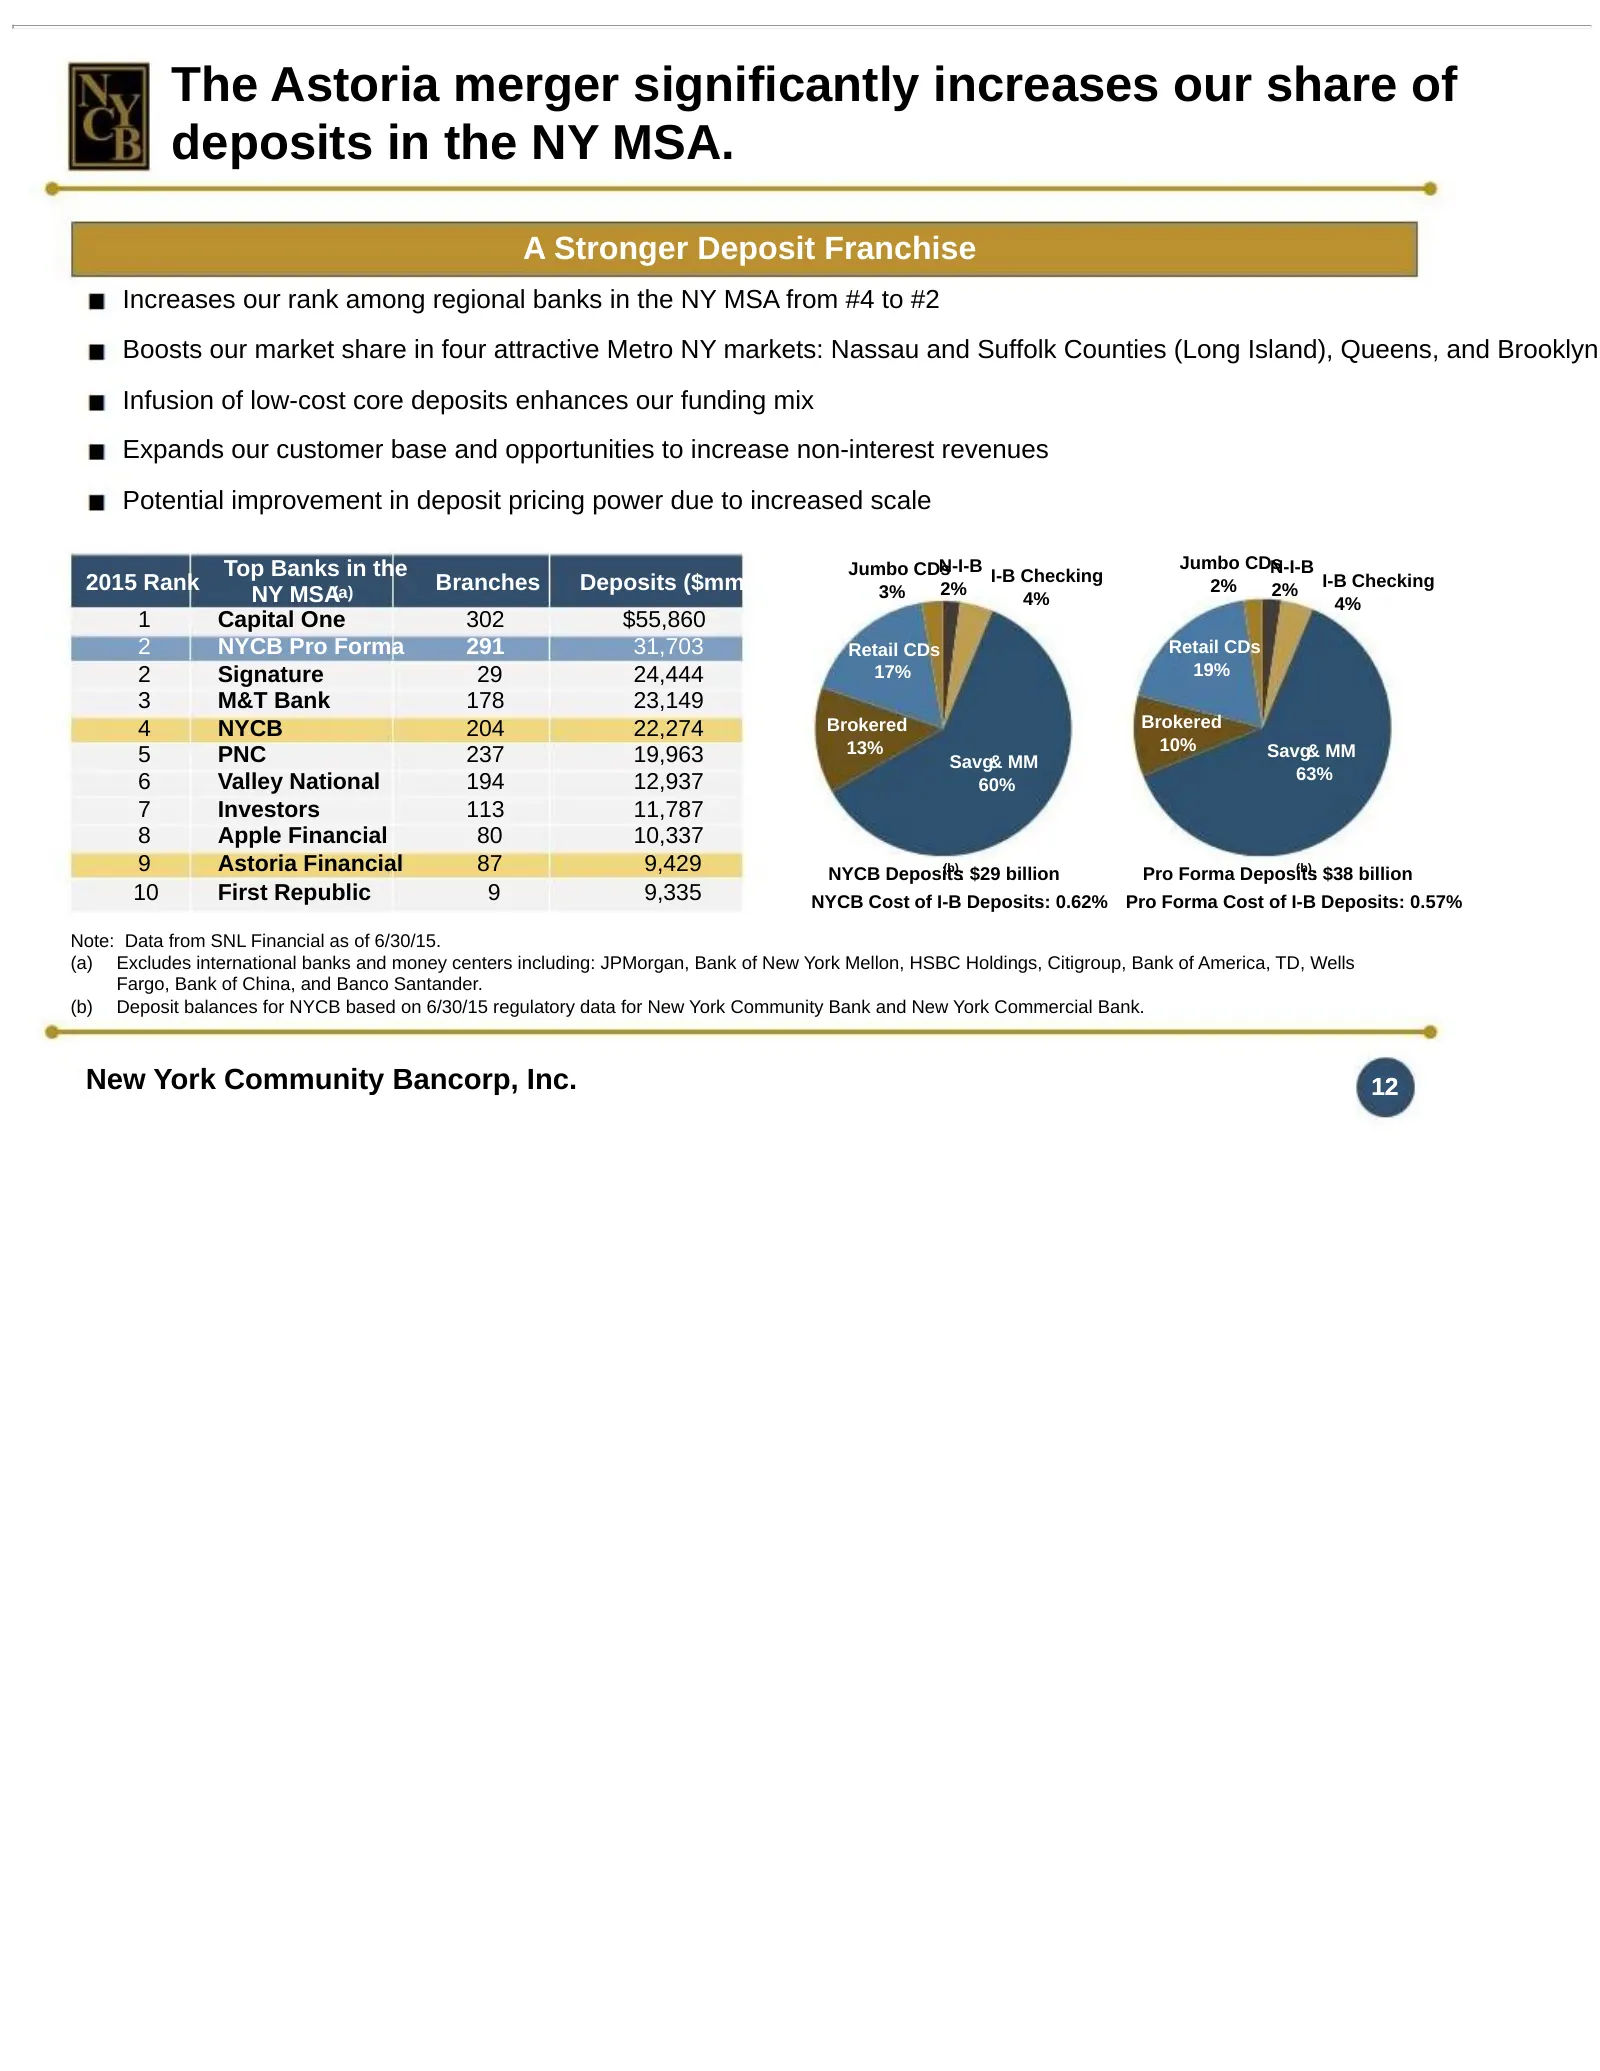
The Astoria merger significantly increases our share of deposits in the NY MSA. A Stronger Deposit Franchise Increases our rank among regional banks in the NY MSA from #4 to #2 Boosts our market share in four attractive Metro NY markets: Nassau and Suffolk Counties (Long Island), Queens, and Brookly
Slide 13: Increased share of deposits in four highly attractive markets
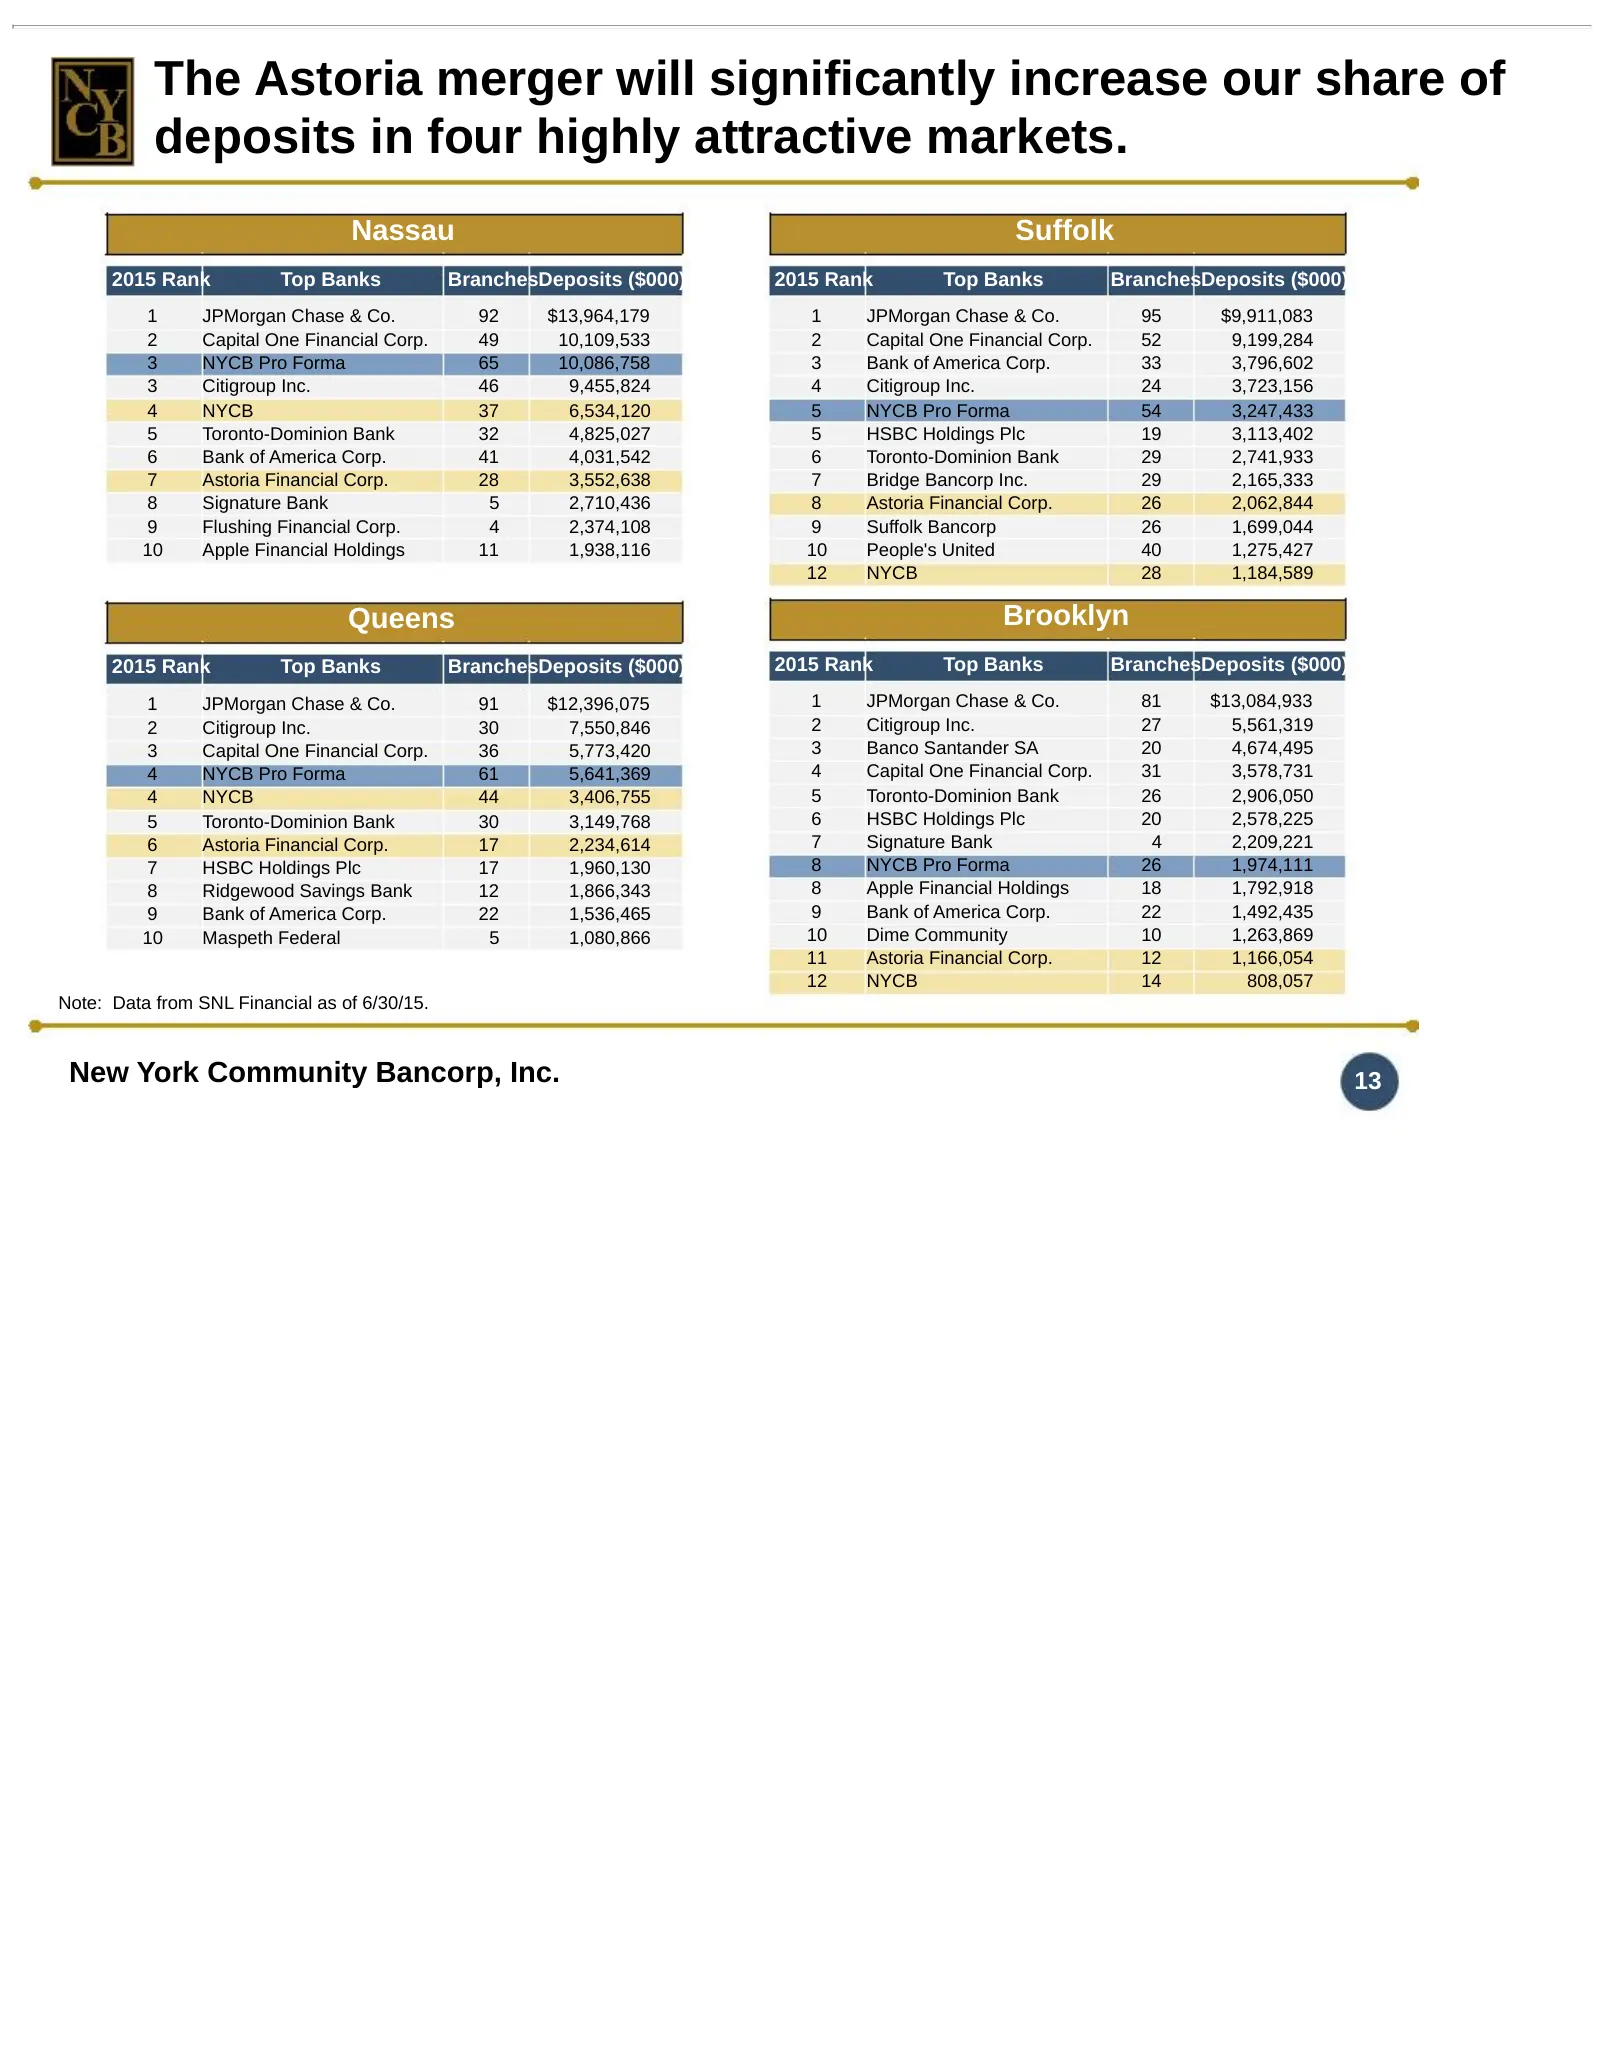
The Astoria merger will significantly increase our share of deposits in four highly attractive markets. Nassau Suffolk 2015 Rank Top Banks BranchesDeposits ($000) 2015 Rank Top Banks BranchesDeposits ($000) 1 JPMorgan Chase & Co. 92 $13,964,179 1 JPMorgan Chase & Co. 95 $9,911,083 2 Capital One Fina
Slide 14: Maximal opportunities for revenue enhancement while minimizing risk
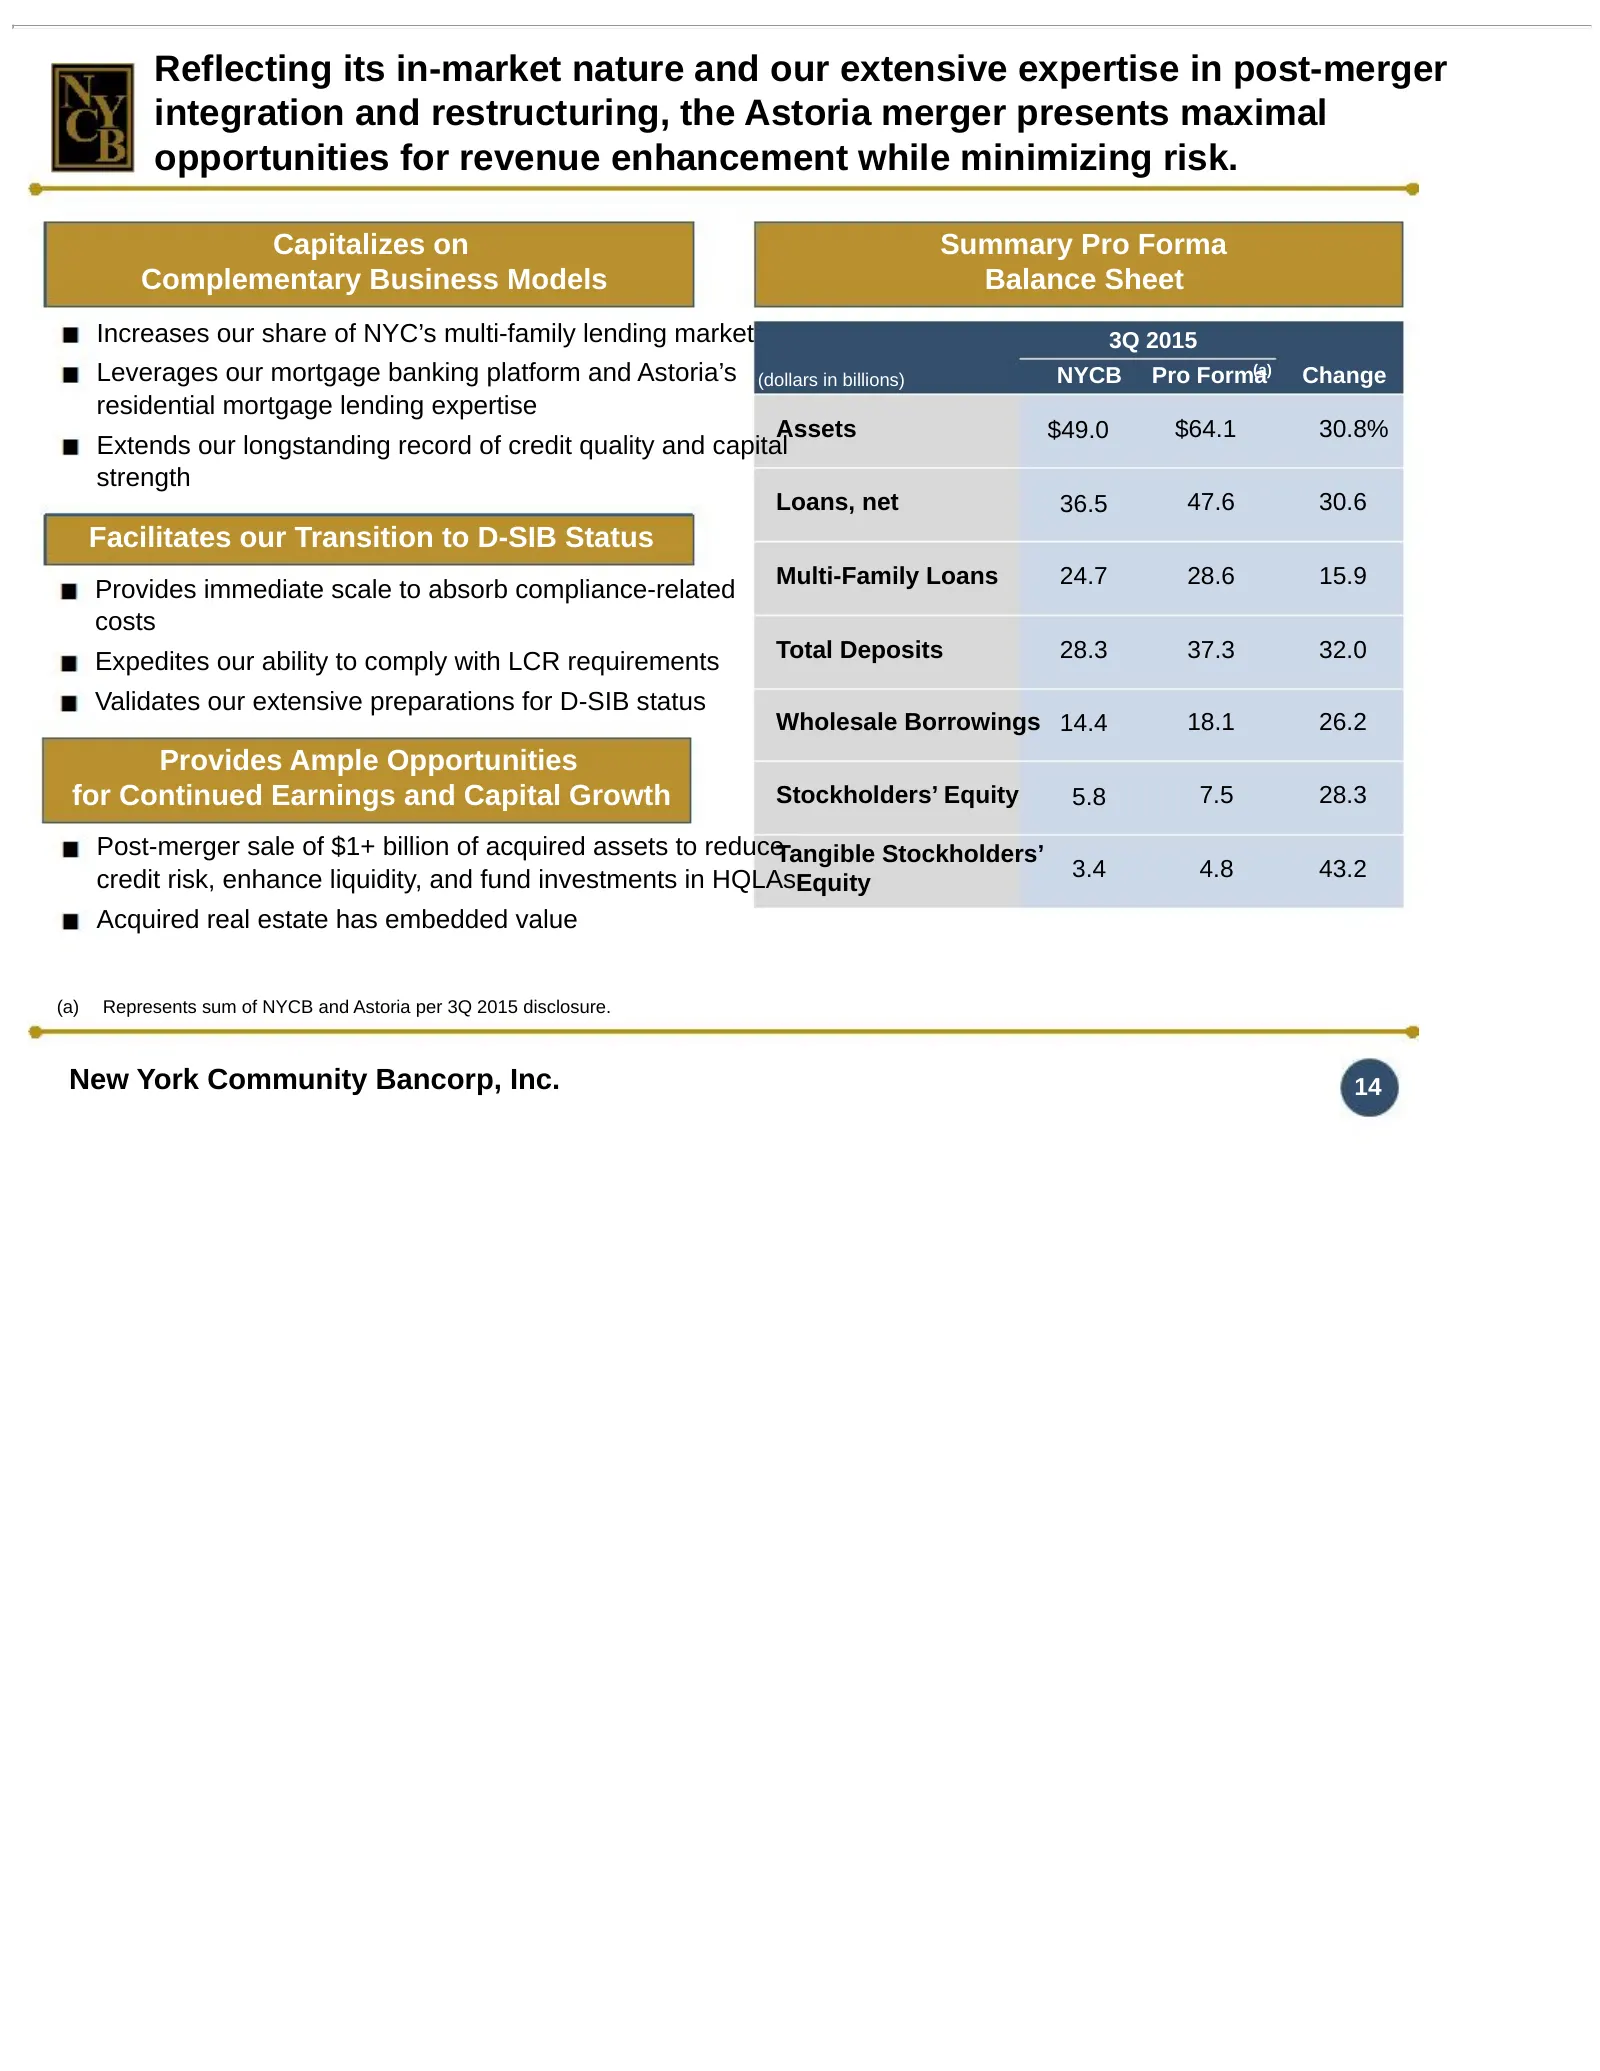
Reflecting its in-market nature and our extensive expertise in post-merger integration and restructuring, the Astoria merger presents maximal opportunities for revenue enhancement while minimizing risk. Capitalizes on Summary Pro Forma Complementary Business Models Balance Sheet Increases our share
Slide 15: The Astoria merger enhances our asset and funding mix
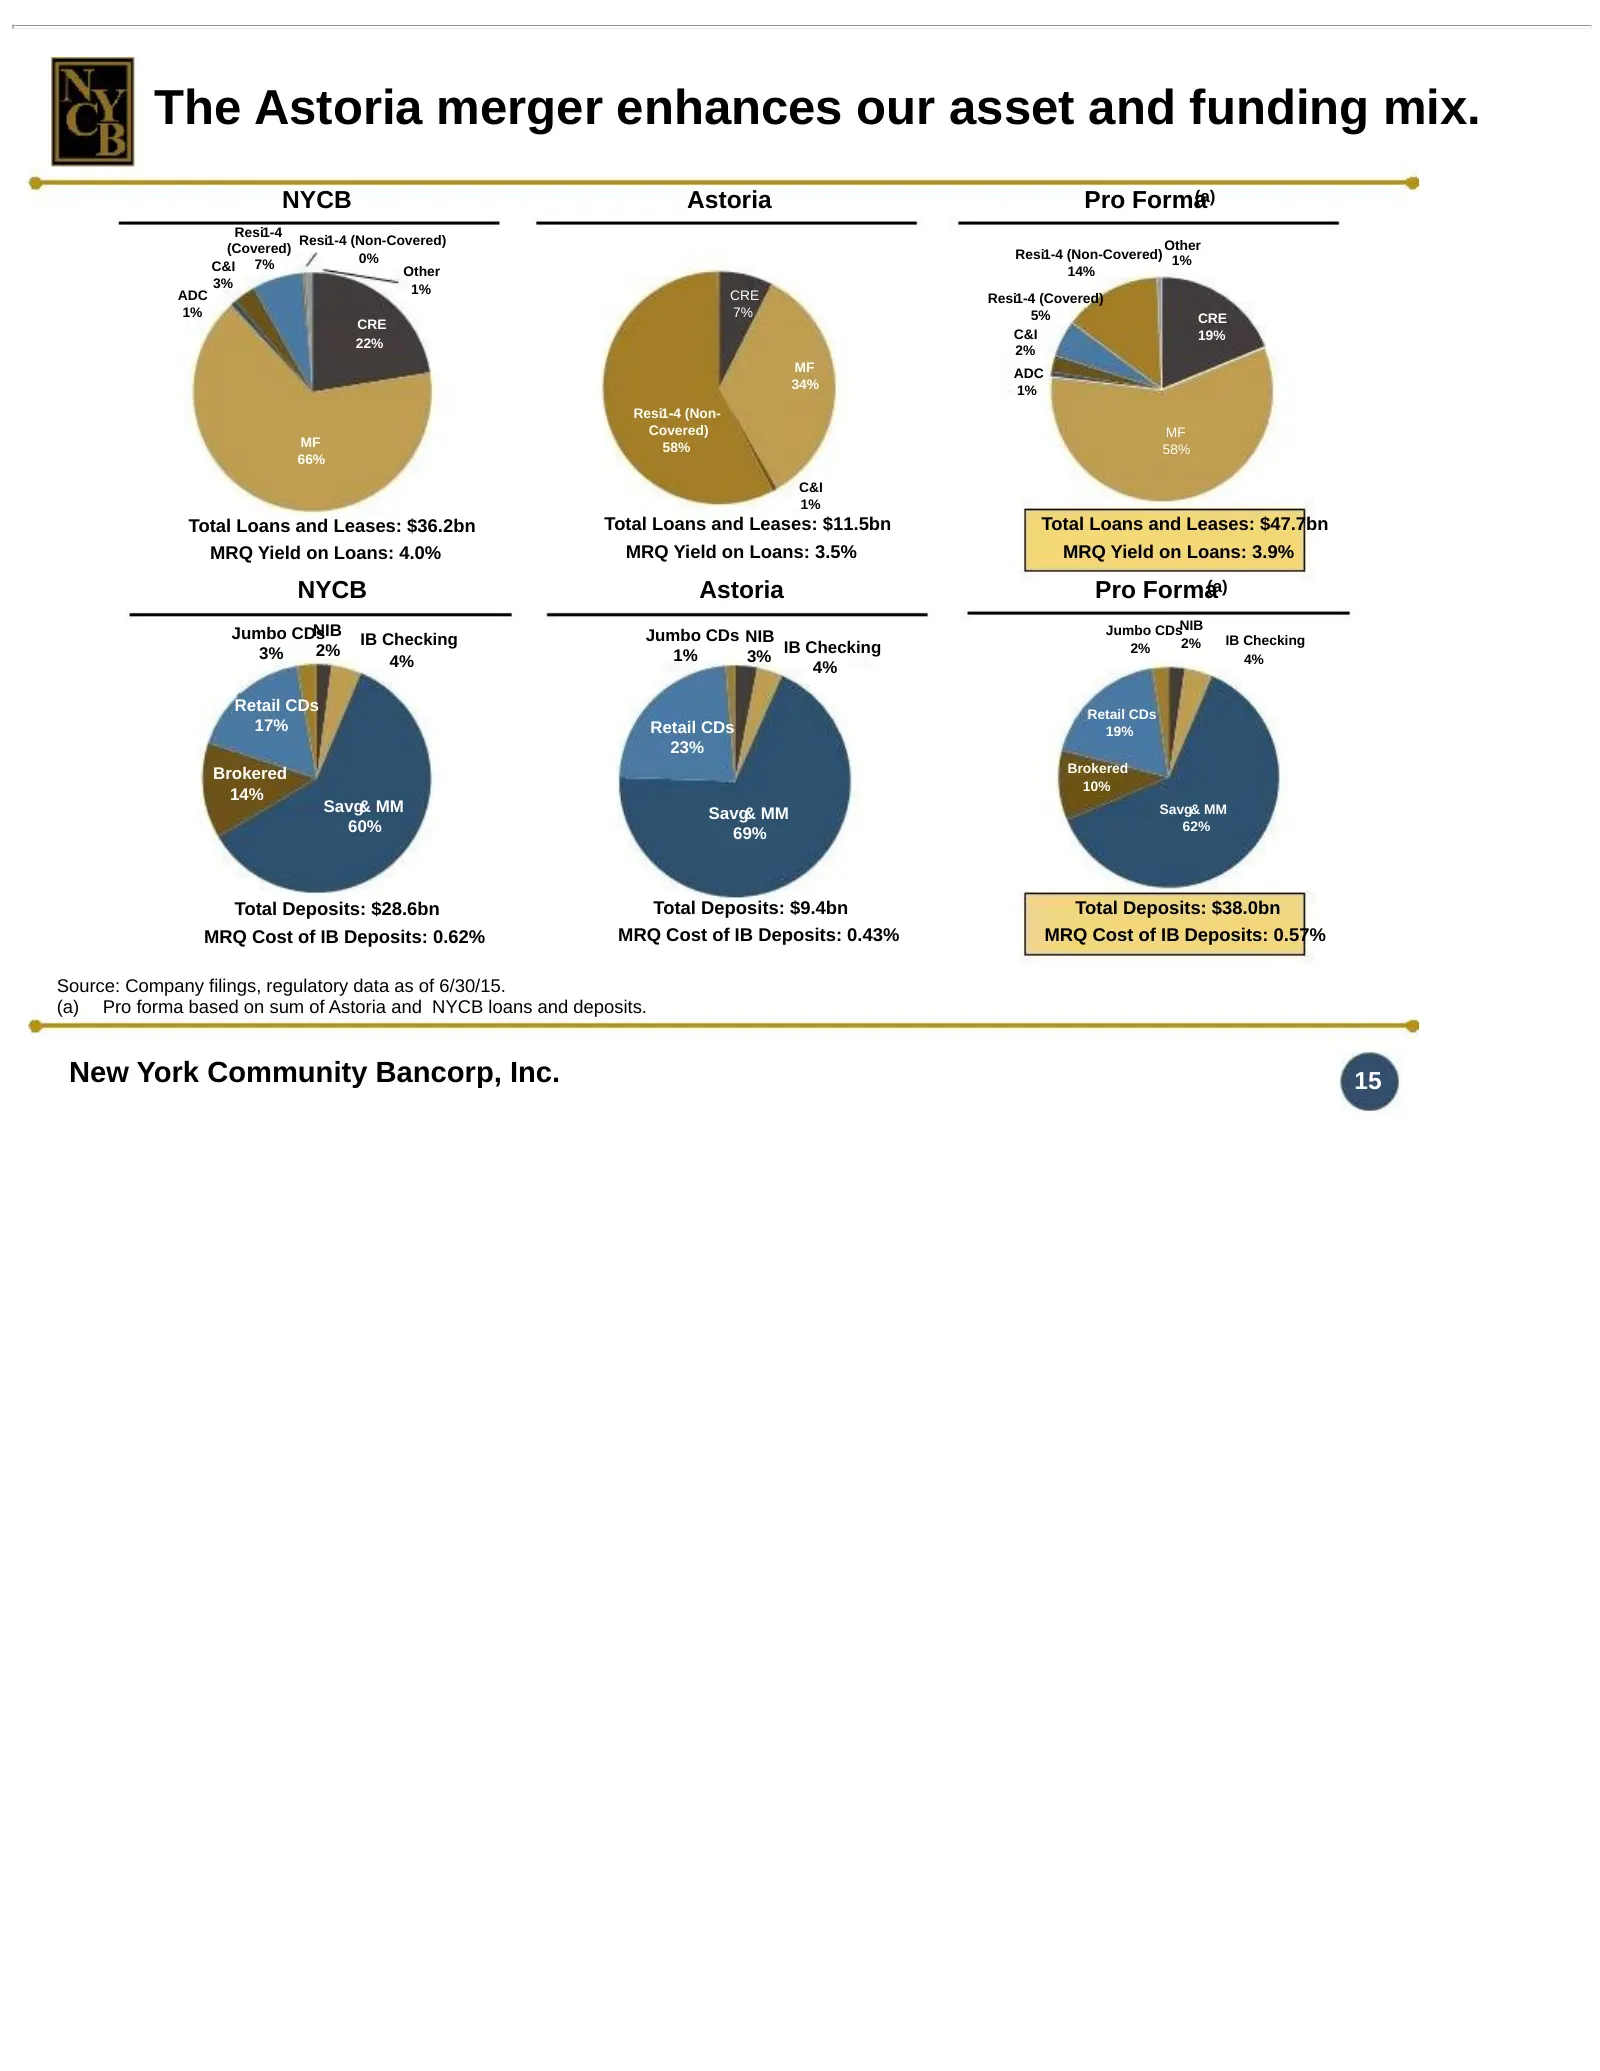
The Astoria merger enhances our asset and funding mix. NYCB Astoria Pro Forma (a) Resi1-4 Resi1-4 (Non-Covered) Other (Covered) Resi1-4 (Non-Covered) 1% 0% C&I 7% Other 14% 3% 1% ADC CRE Resi1-4 (Covered) 1% 7% 5% CRE CRE C&I 19% 22% 2% MF ADC 34% 1% Resi1-4 - (Non- Covered) MF MF 58% 58% 66% C&I 1%
Slide 16: Opportunities to drive profitable, sustainable, long-term asset growth
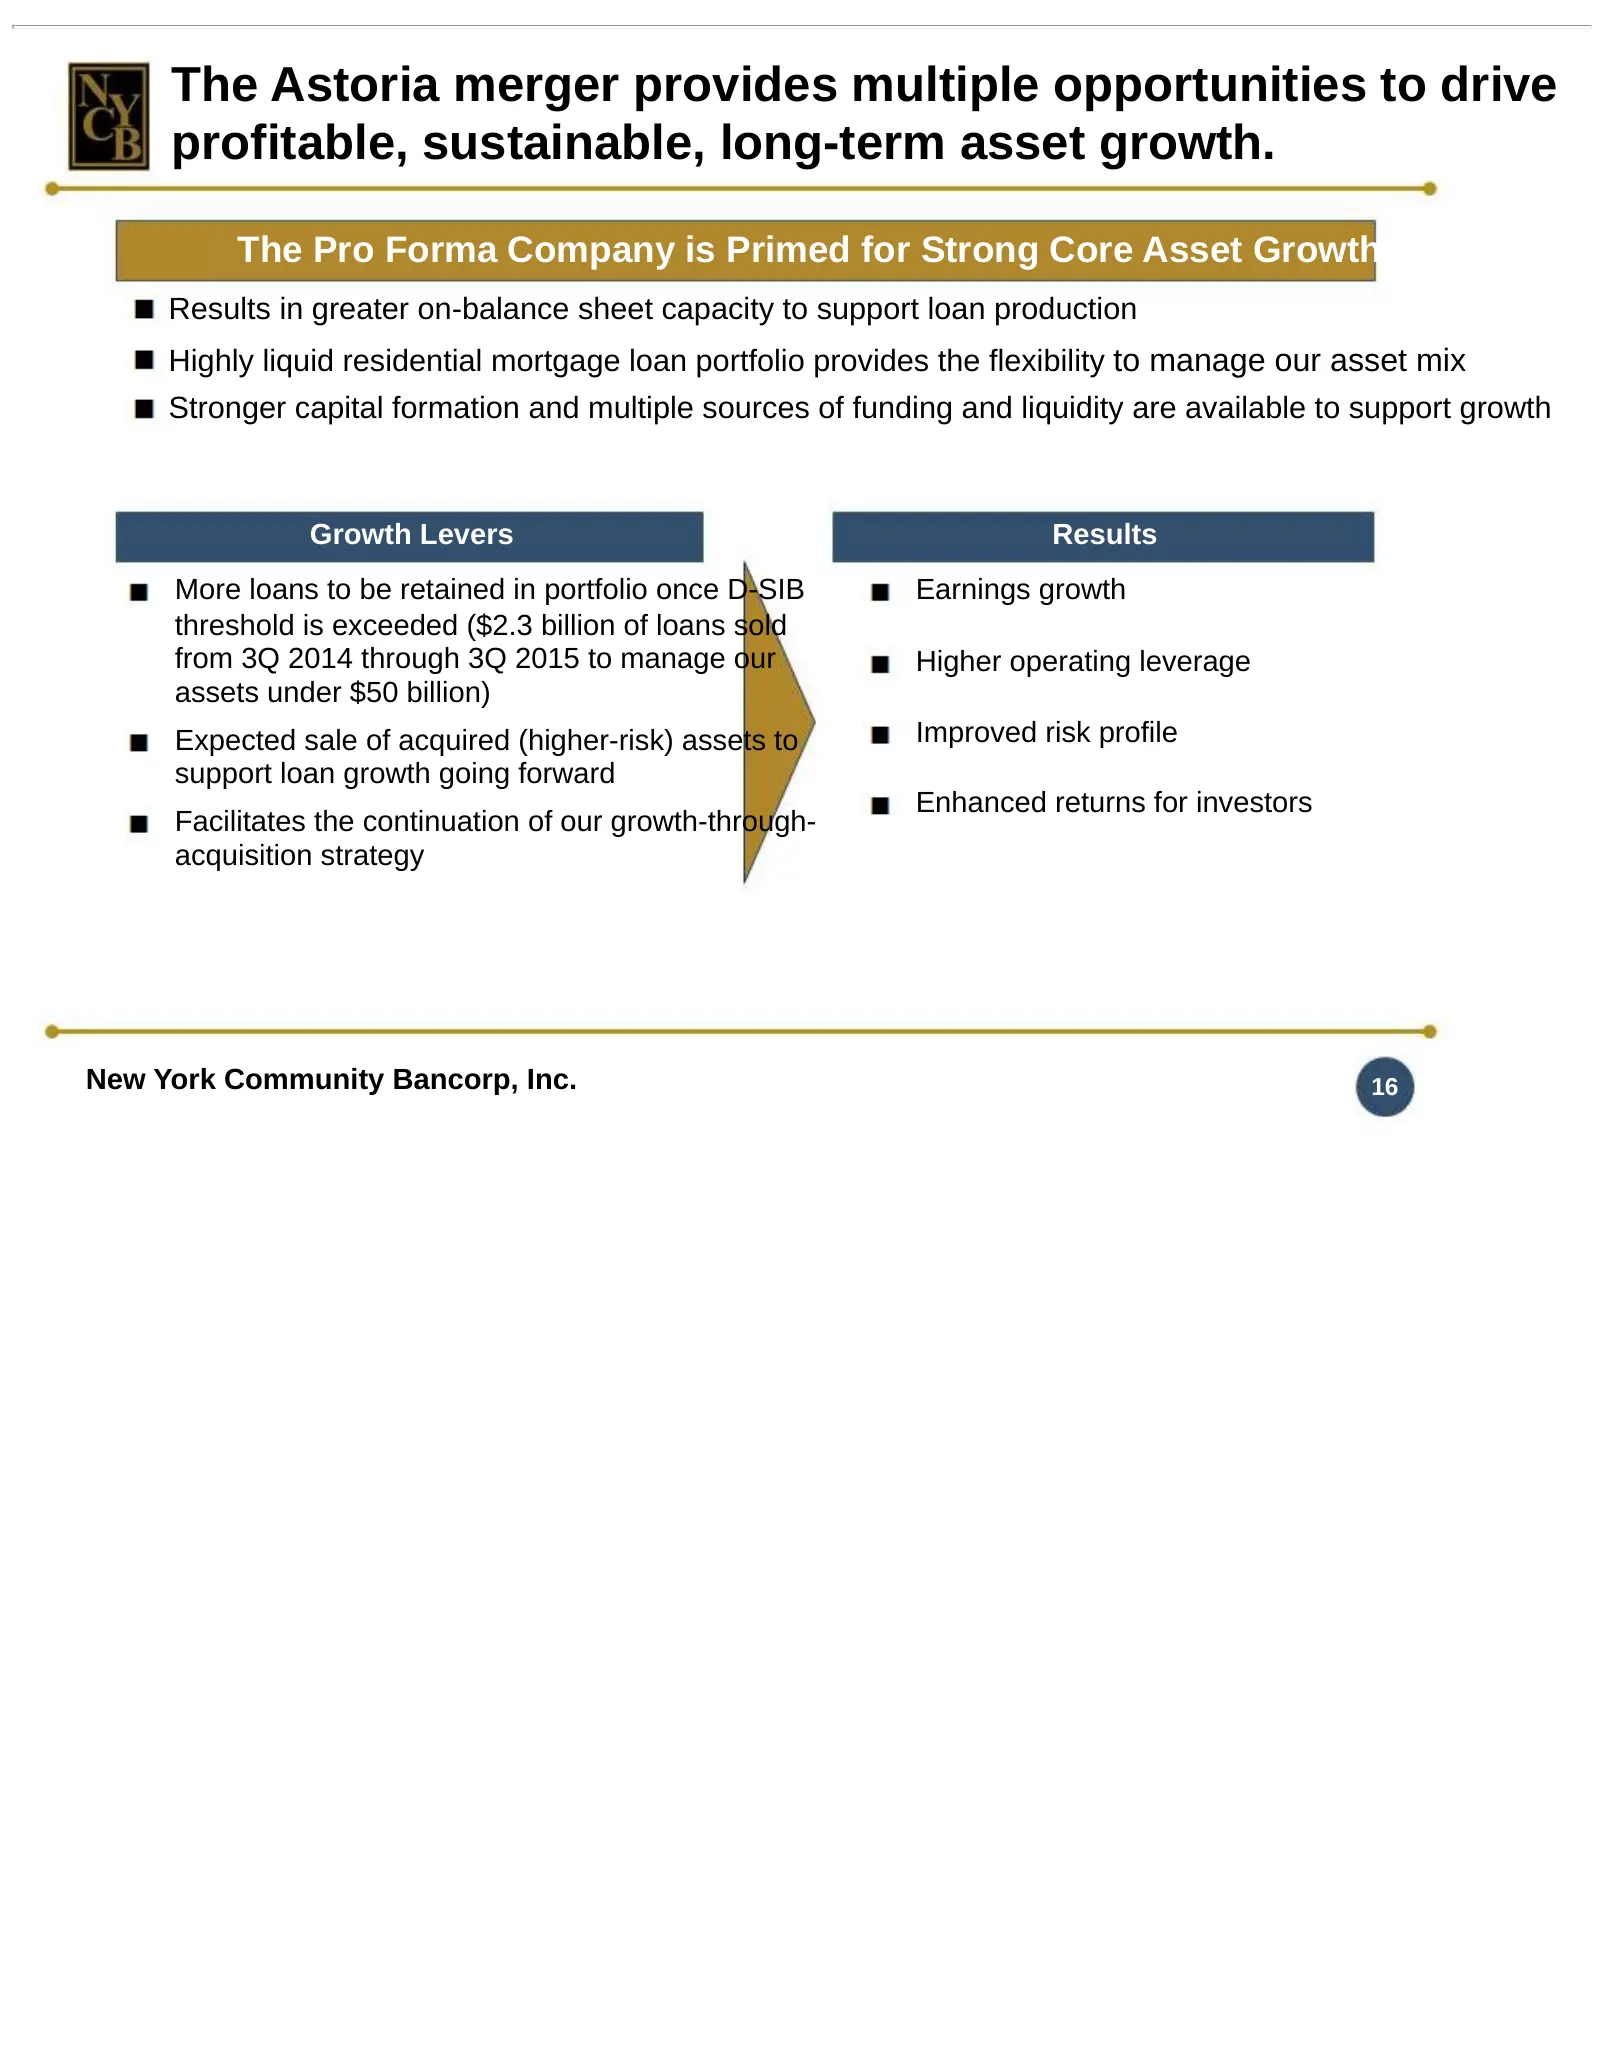
The Astoria merger provides multiple opportunities to drive profitable, sustainable, long-term asset growth. The Pro Forma Company is Primed for Strong Core Asset Growth Results in greater on-balance sheet capacity to support loan production Highly liquid residential mortgage loan portfolio provides
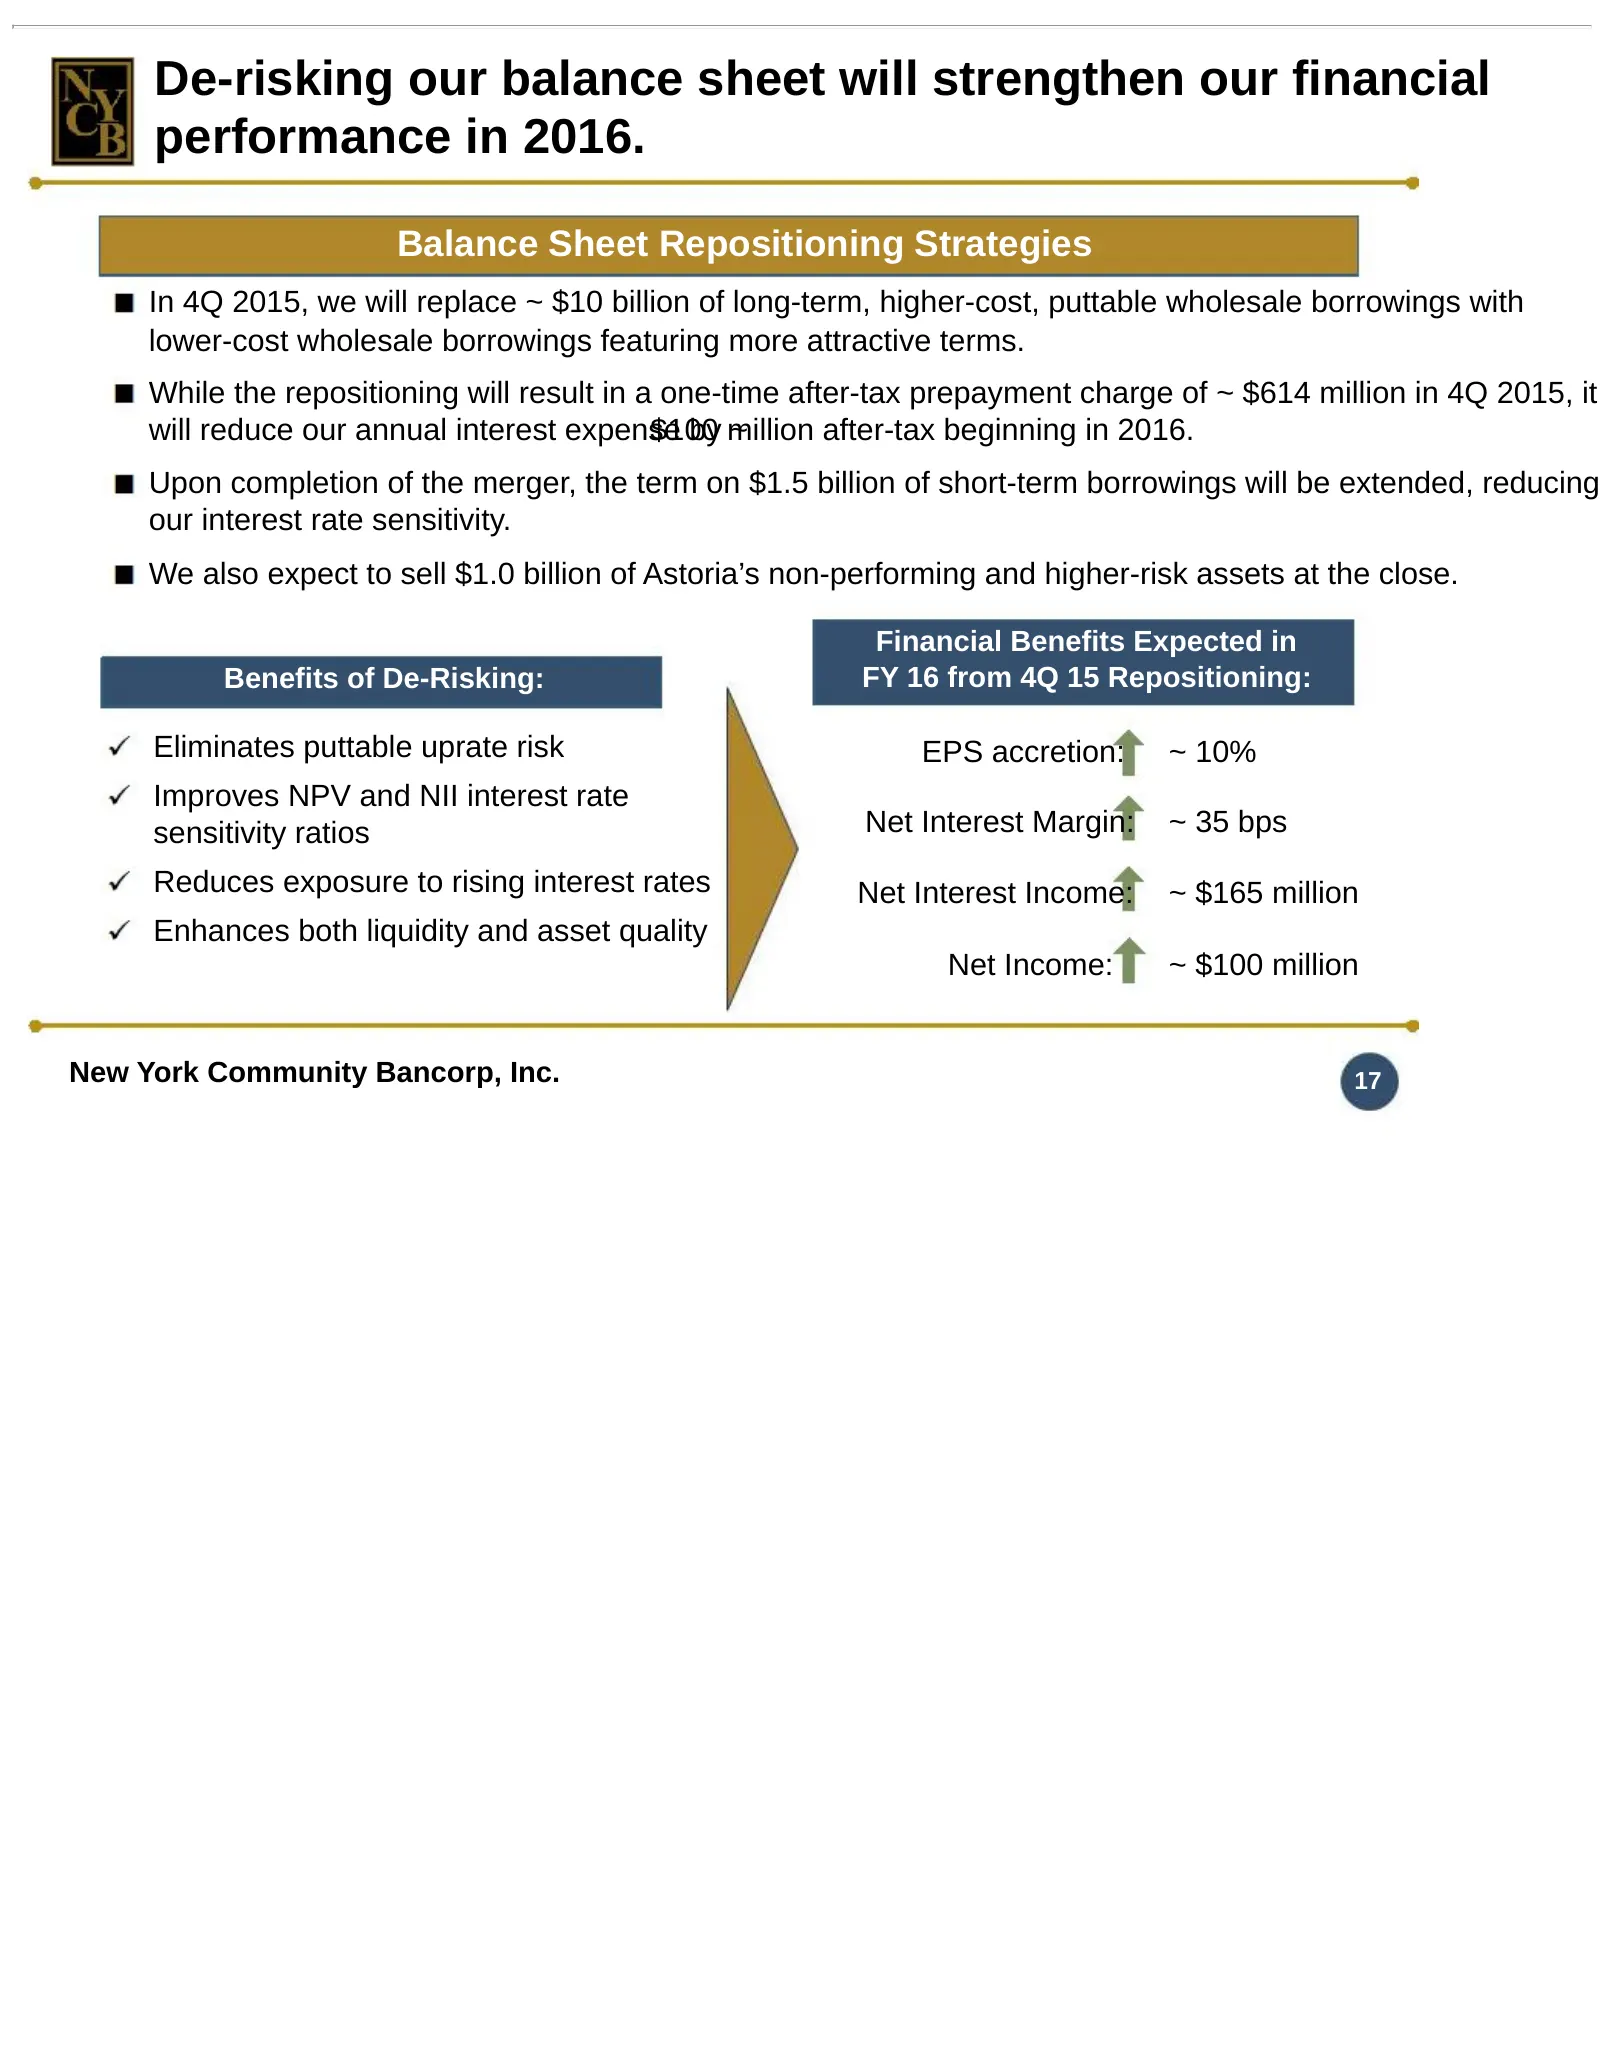
Slide 17: De-risking our balance sheet will strengthen our financial performance in 2016
De-risking our balance sheet will strengthen our financial performance in 2016. Balance Sheet Repositioning Strategies In 4Q 2015, we will replace ~ $10 billion of long-term, higher-cost, puttable wholesale borrowings with lower-cost wholesale borrowings featuring more attractive terms. While the re
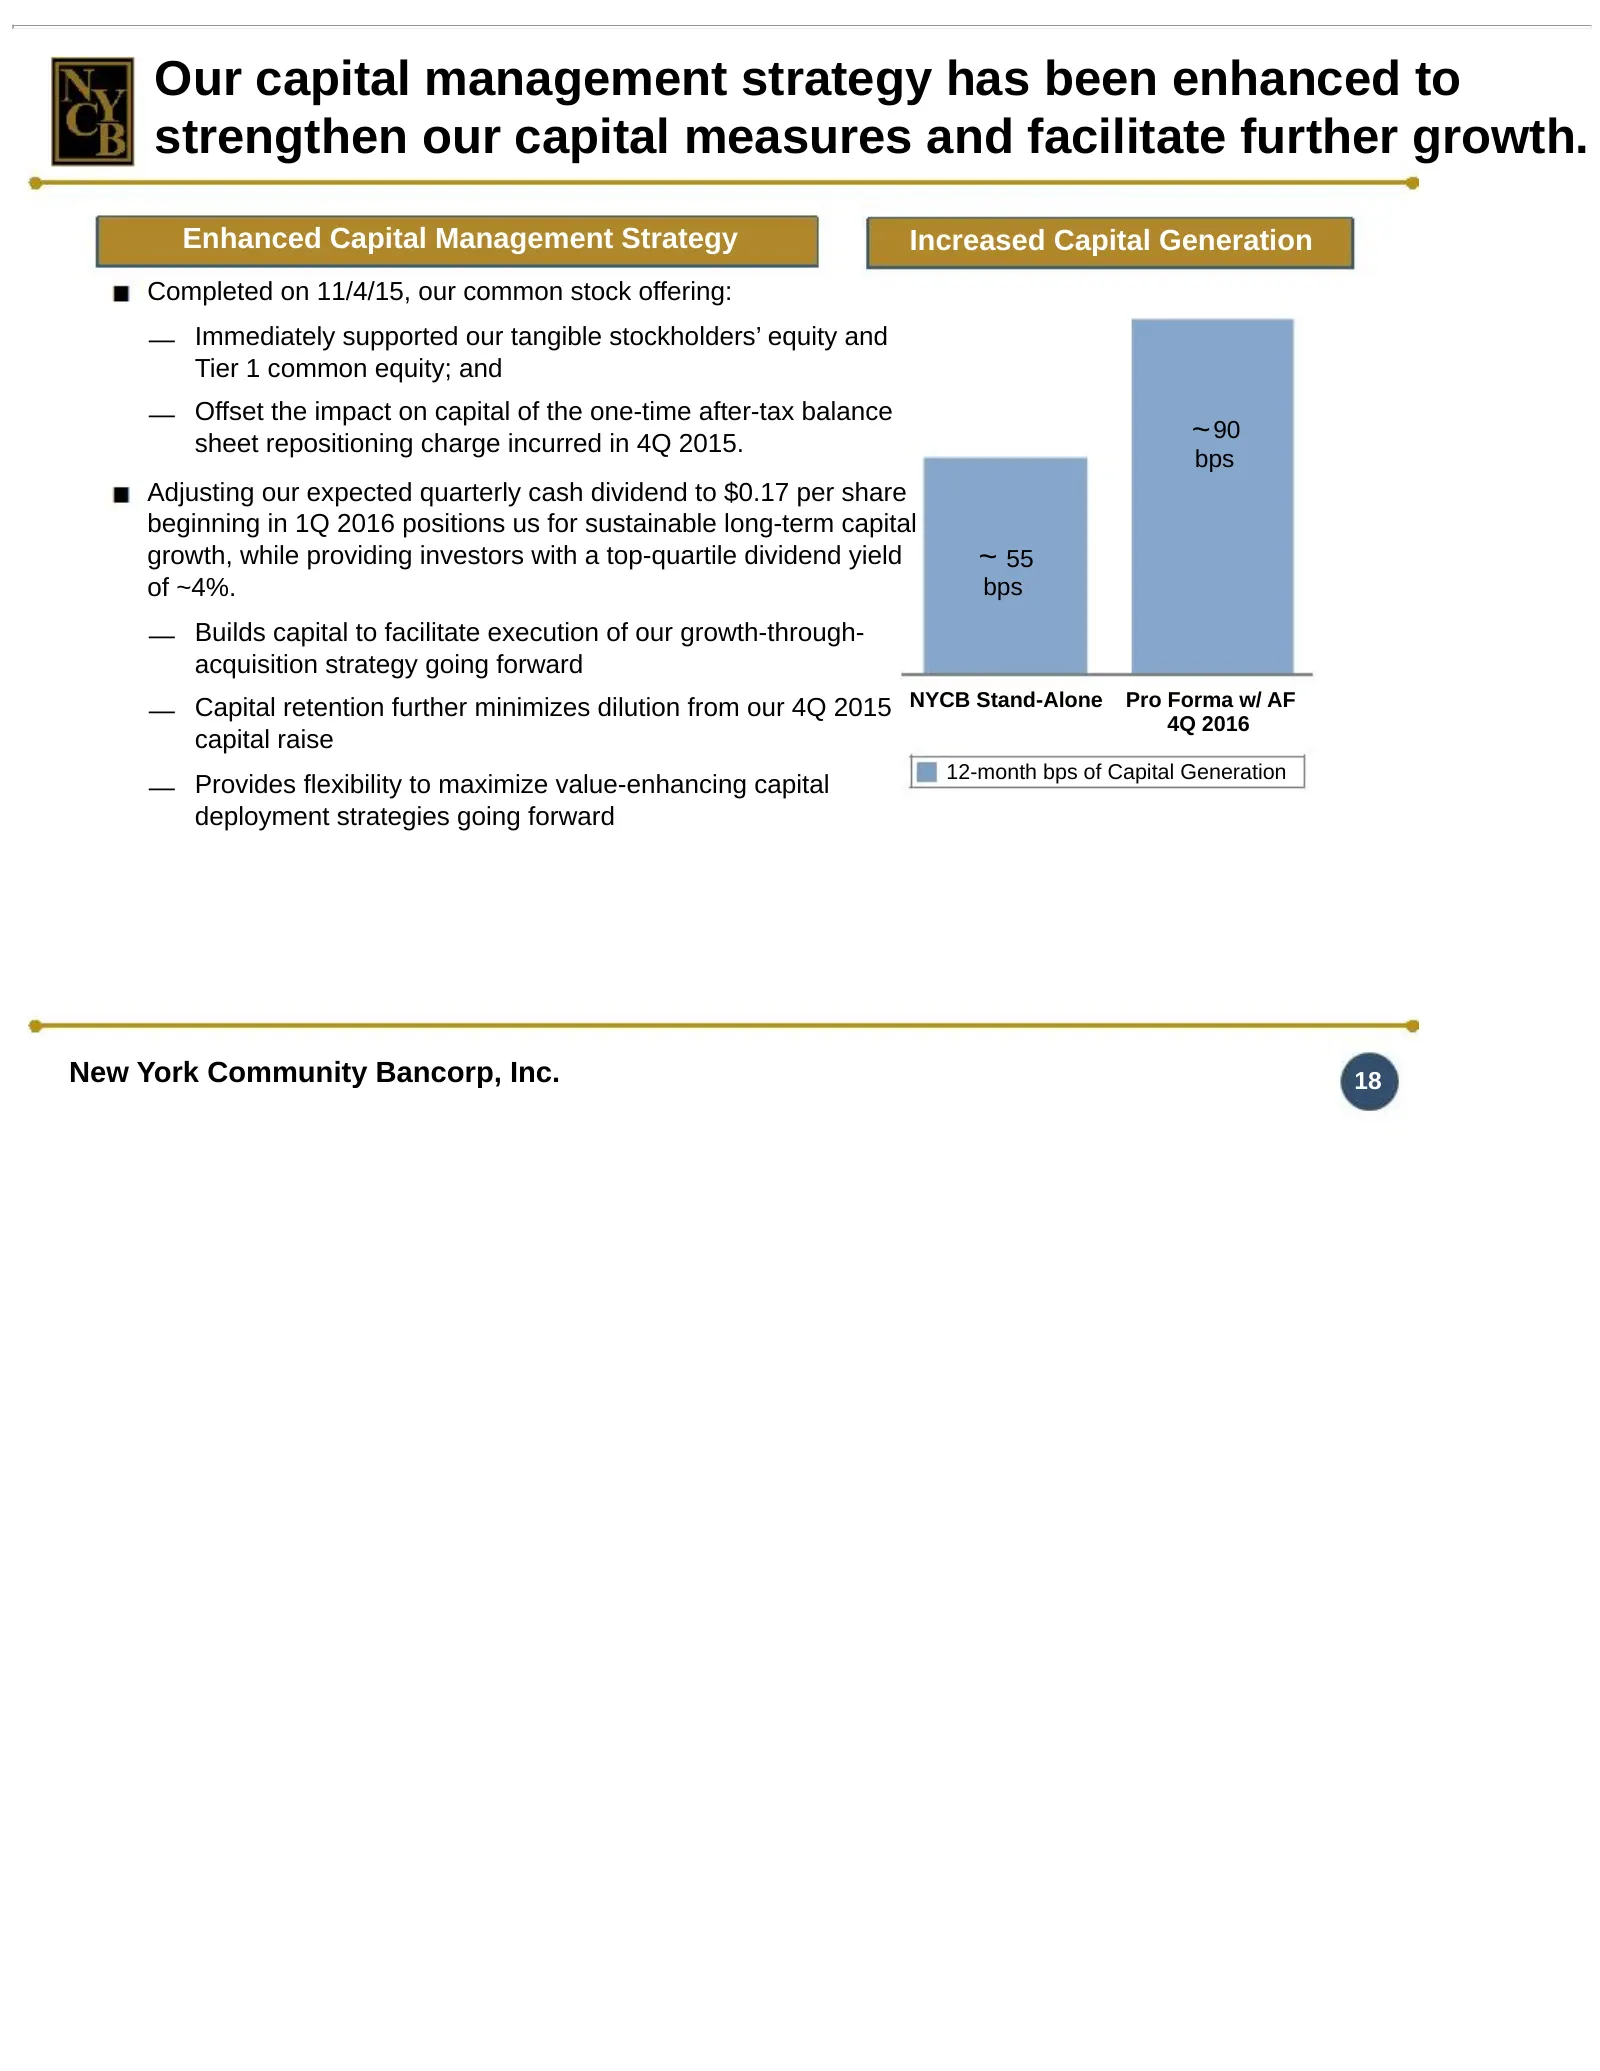
Slide 18: Enhanced capital management strategy
Our capital management strategy has been enhanced to strengthen our capital measures and facilitate further growth. Enhanced Capital Management Strategy Increased Capital Generation Completed on 11/4/15, our common stock offering: — Immediately supported our tangible stockholders’ equity and Tier 1
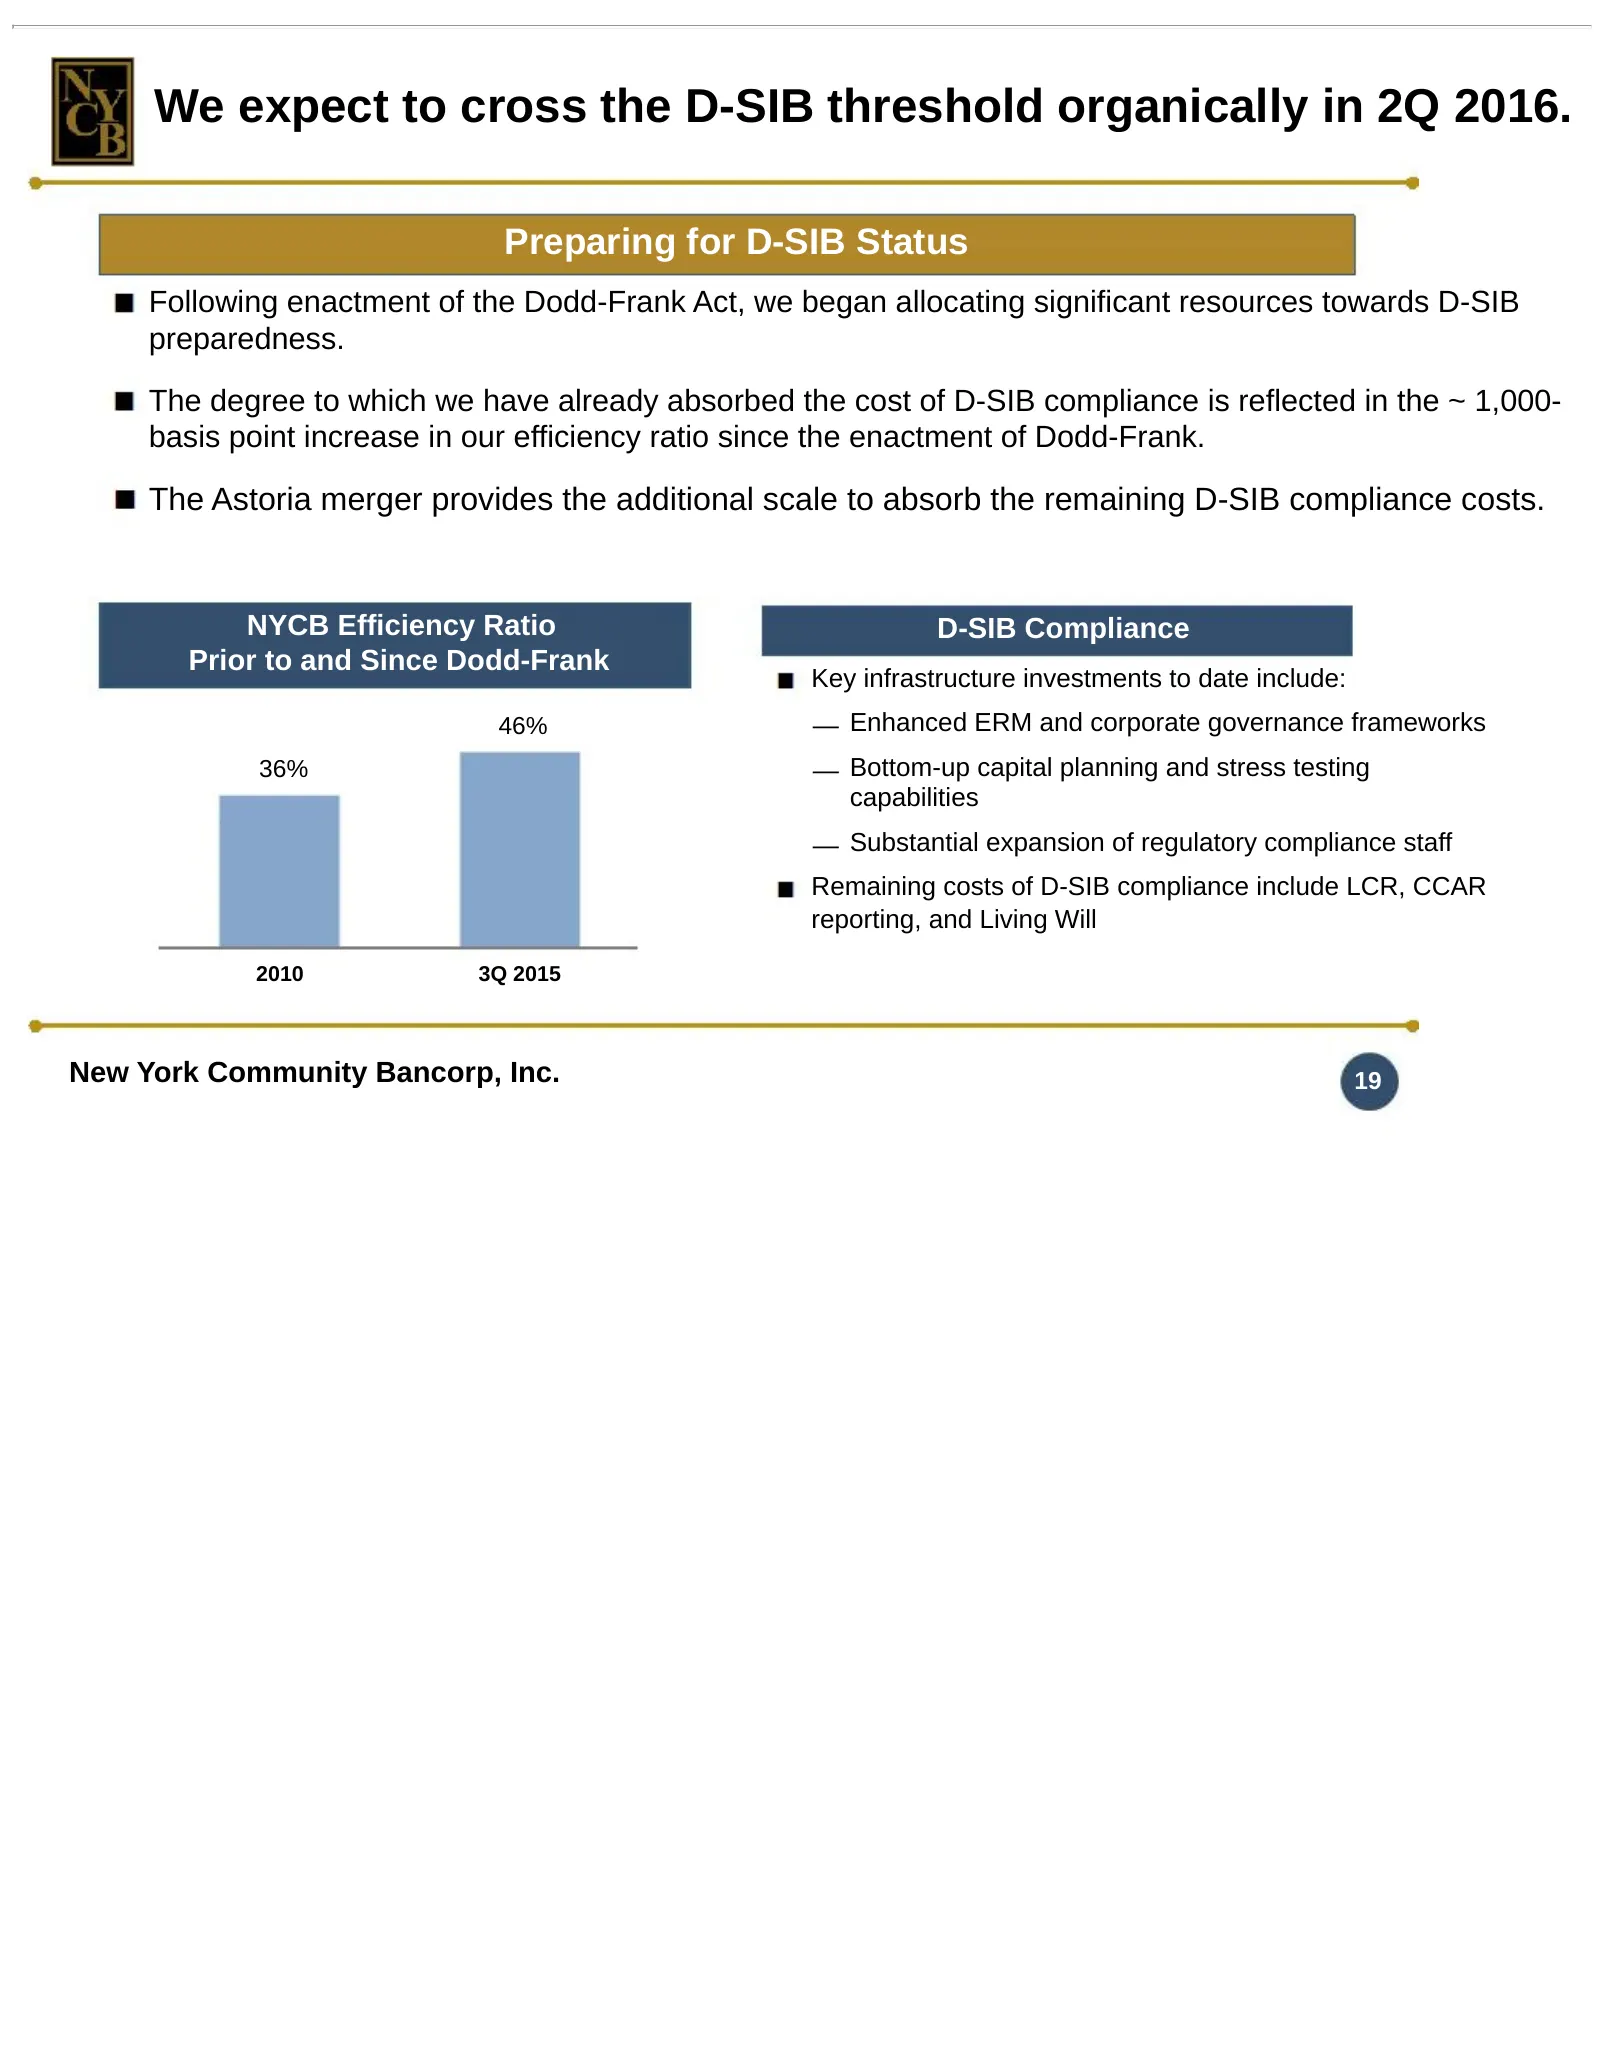
Slide 19: We expect to cross the D-SIB threshold organically in 2Q 2016
We expect to cross the D-SIB threshold organically in 2Q 2016. Preparing for D-SIB Status Following enactment of the Dodd-Frank Act, we began allocating significant resources towards D-SIB preparedness. The degree to which we have already absorbed the cost of D-SIB compliance is reflected in the ~ 1
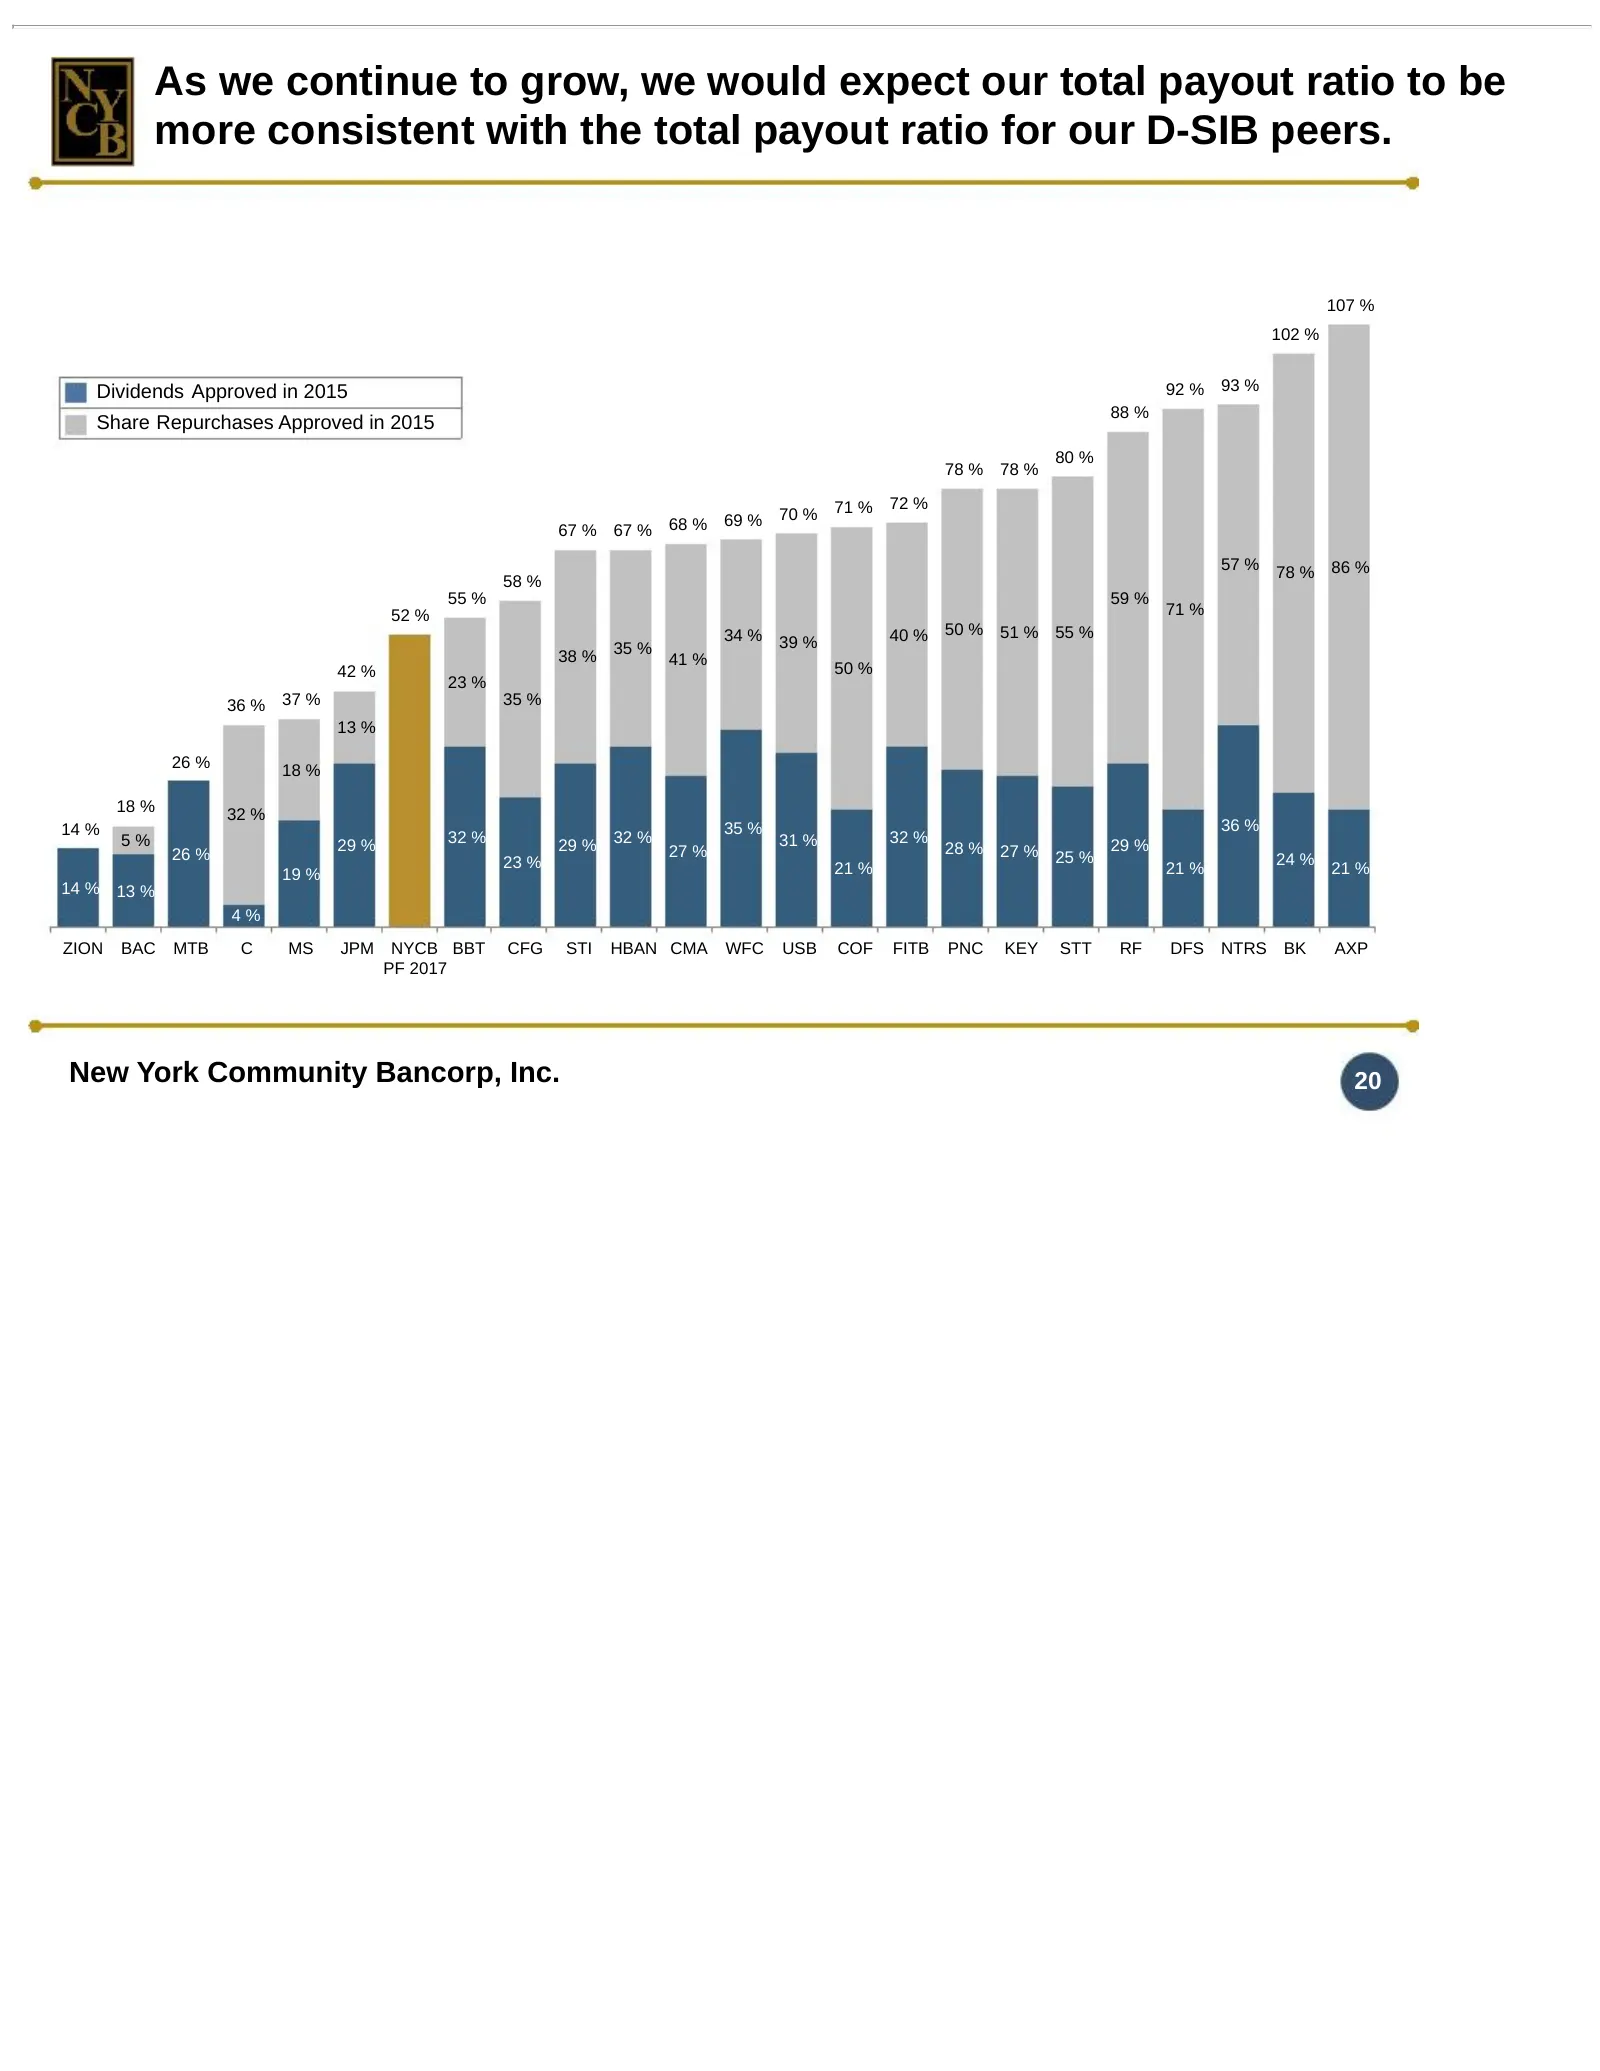
Slide 20: Total payout ratio consistent with D-SIB peers
As we continue to grow, we would expect our total payout ratio to be more consistent with the total payout ratio for our D-SIB peers. 107 % 102 % Dividends Approved in 2015 92 % 93 % 88 % Share Repurchases Approved in 2015 80 % 78 % 78 % 71 % 72 % 69 % 70 % 67 % 67 % 68 % 57 % 78 % 86 % 58 % 55 % 59
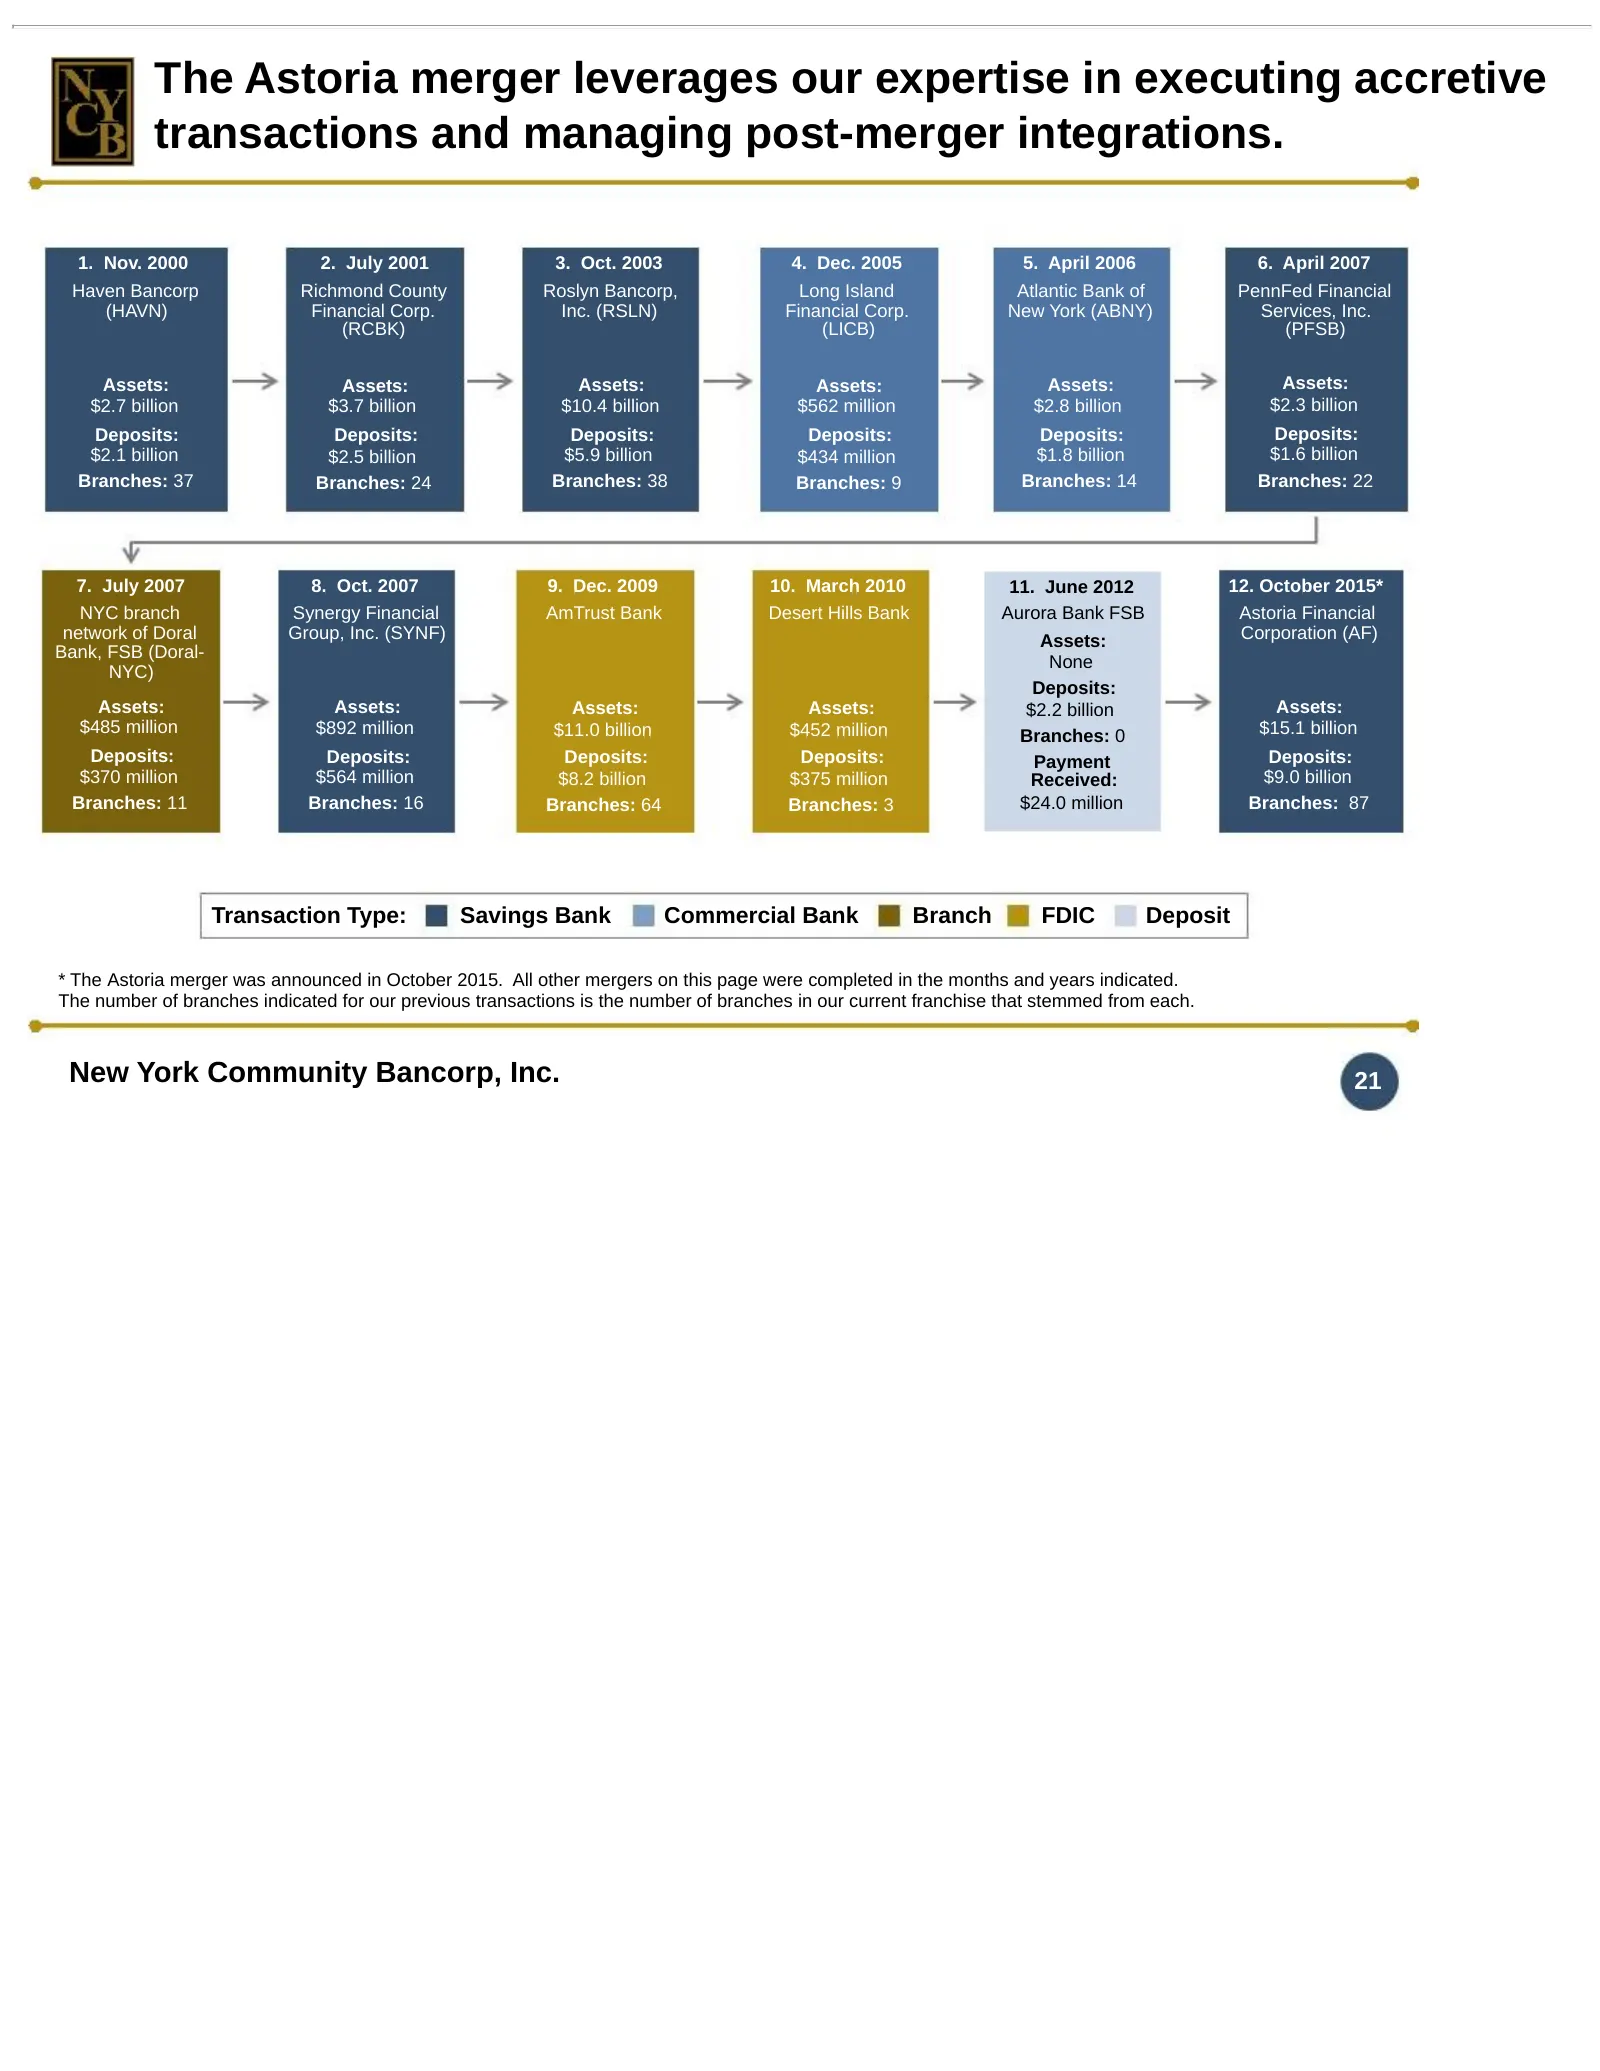
Slide 21: Expertise in executing accretive transactions and post-merger integrations
The Astoria merger leverages our expertise in executing accretive transactions and managing post-merger integrations. 1. Nov. 2000 2. July 2001 3. Oct. 2003 4. Dec. 2005 5. April 2006 6. April 2007 Haven Bancorp Richmond County Roslyn Bancorp, Long Island Atlantic Bank of PennFed Financial (HAVN) Fi
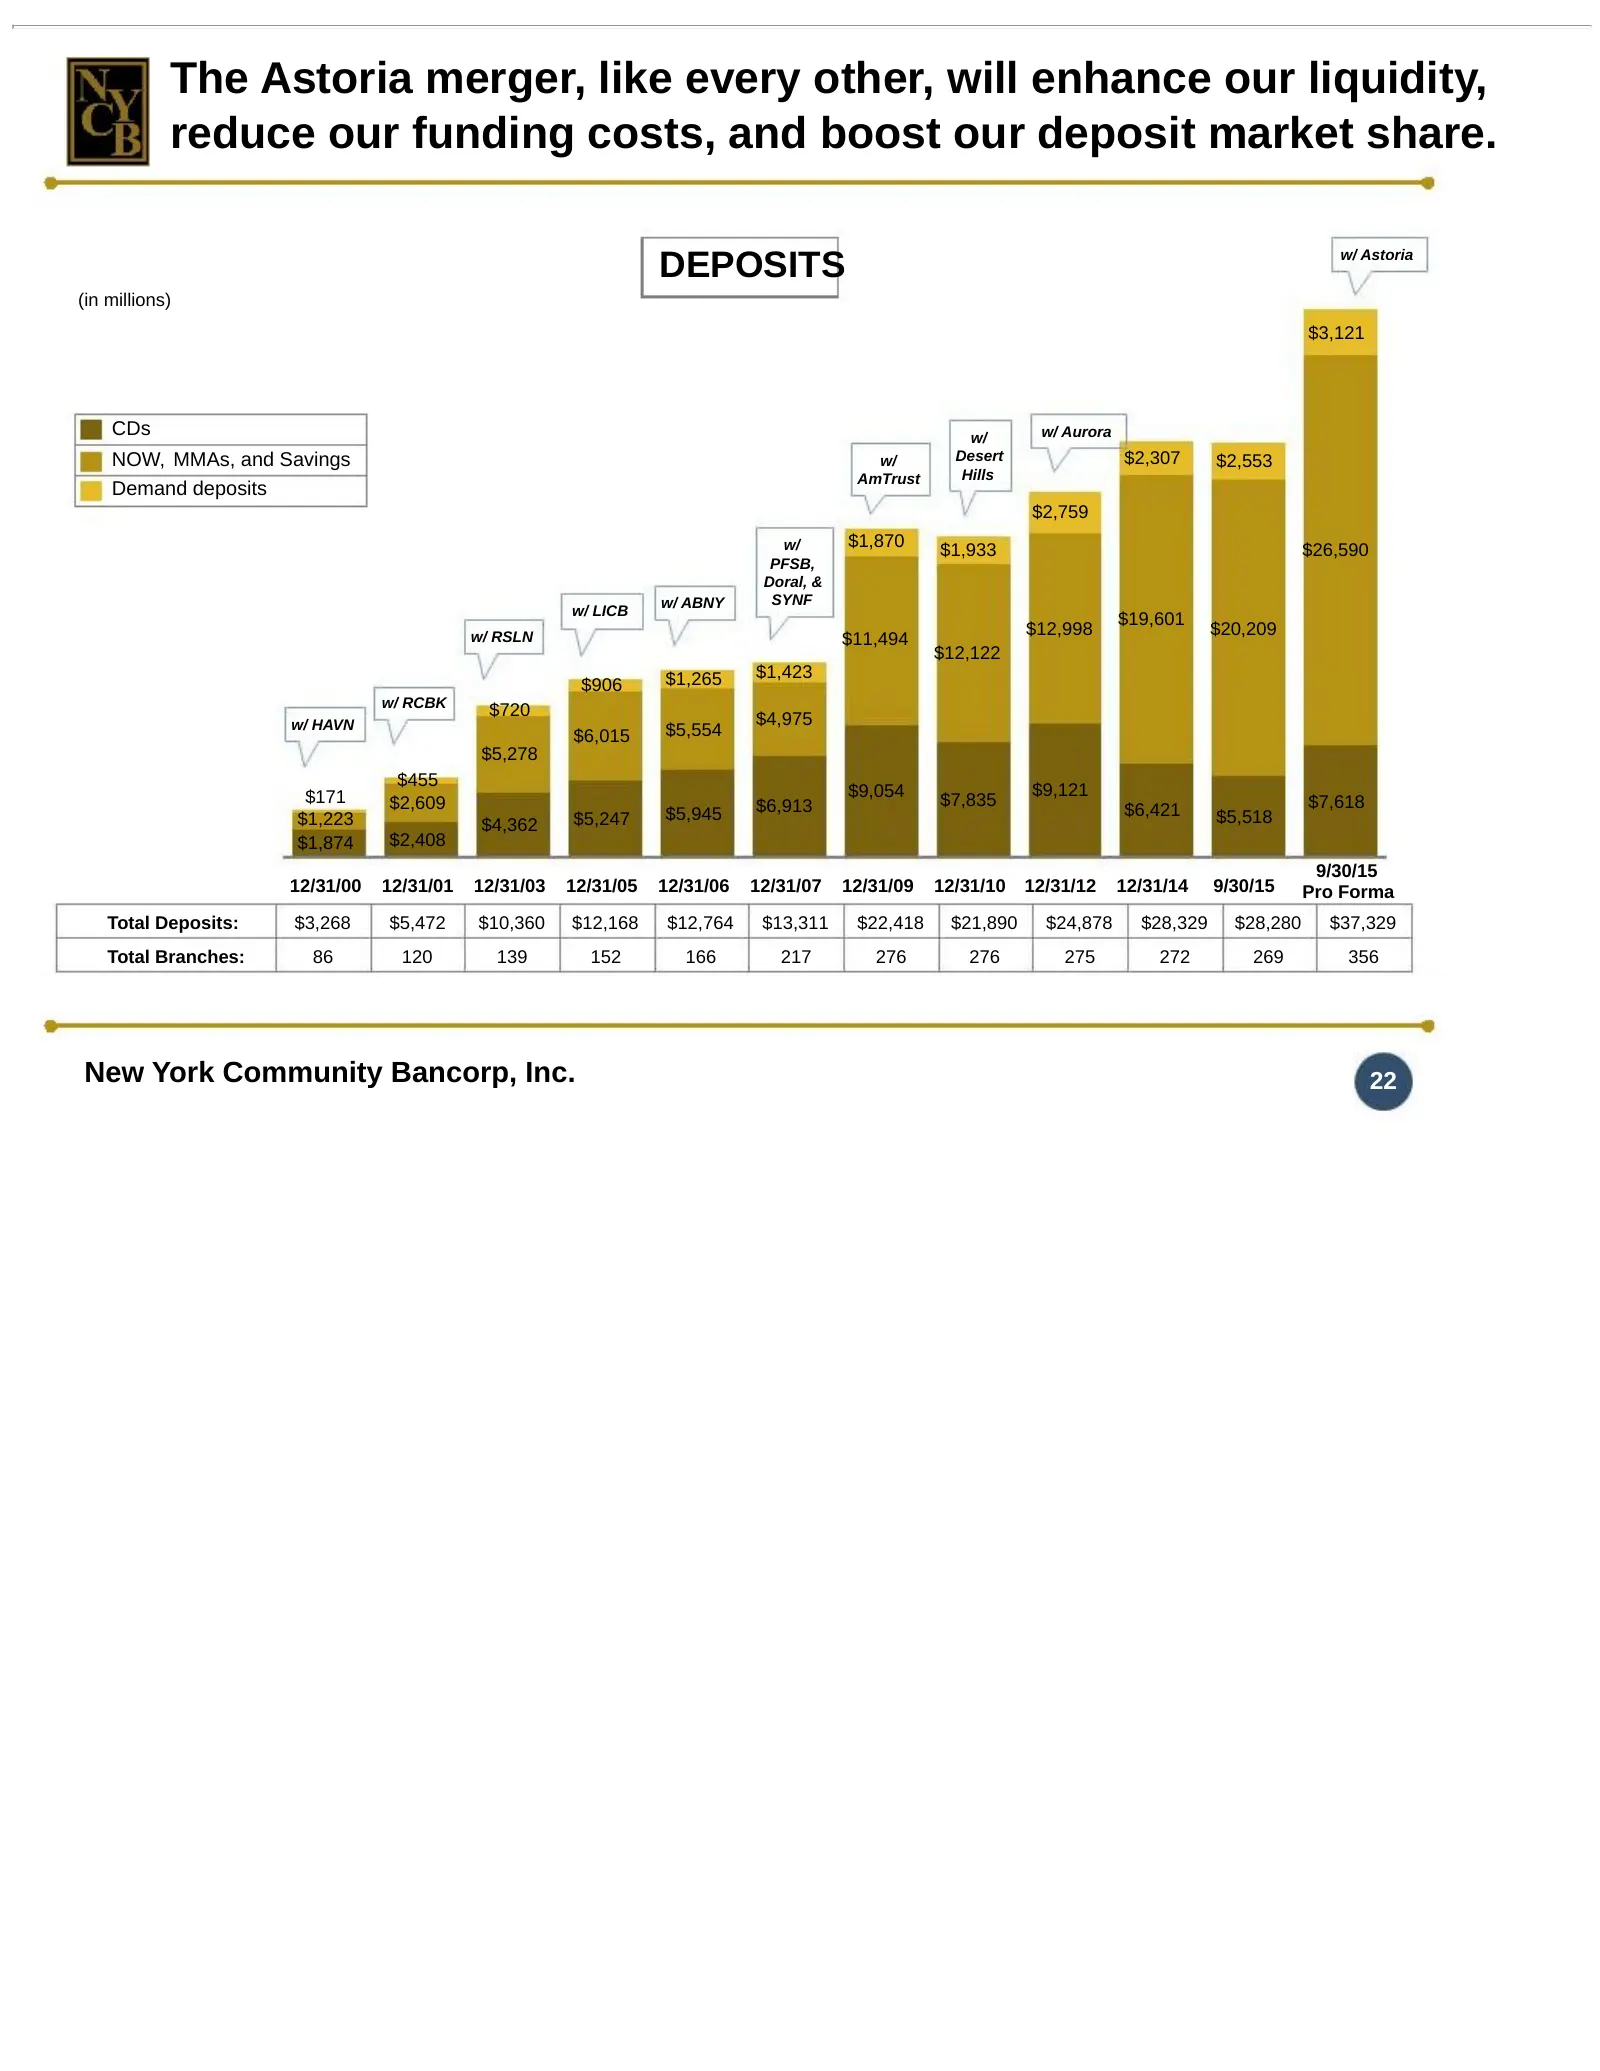
Slide 22: Every merger enhances liquidity, reduces funding costs, boosts deposit share
The Astoria merger, like every other, will enhance our liquidity, reduce our funding costs, and boost our deposit market share. DEPOSITS w/ Astoria (in millions) $3,121 CDs w/ w/ Aurora NOW, MMAs, and Savings w/ Desert $2,307 $2,553 AmTrust Hills Demand deposits $2,759 w/ $1,870 $1,933 $26,590 PFSB,
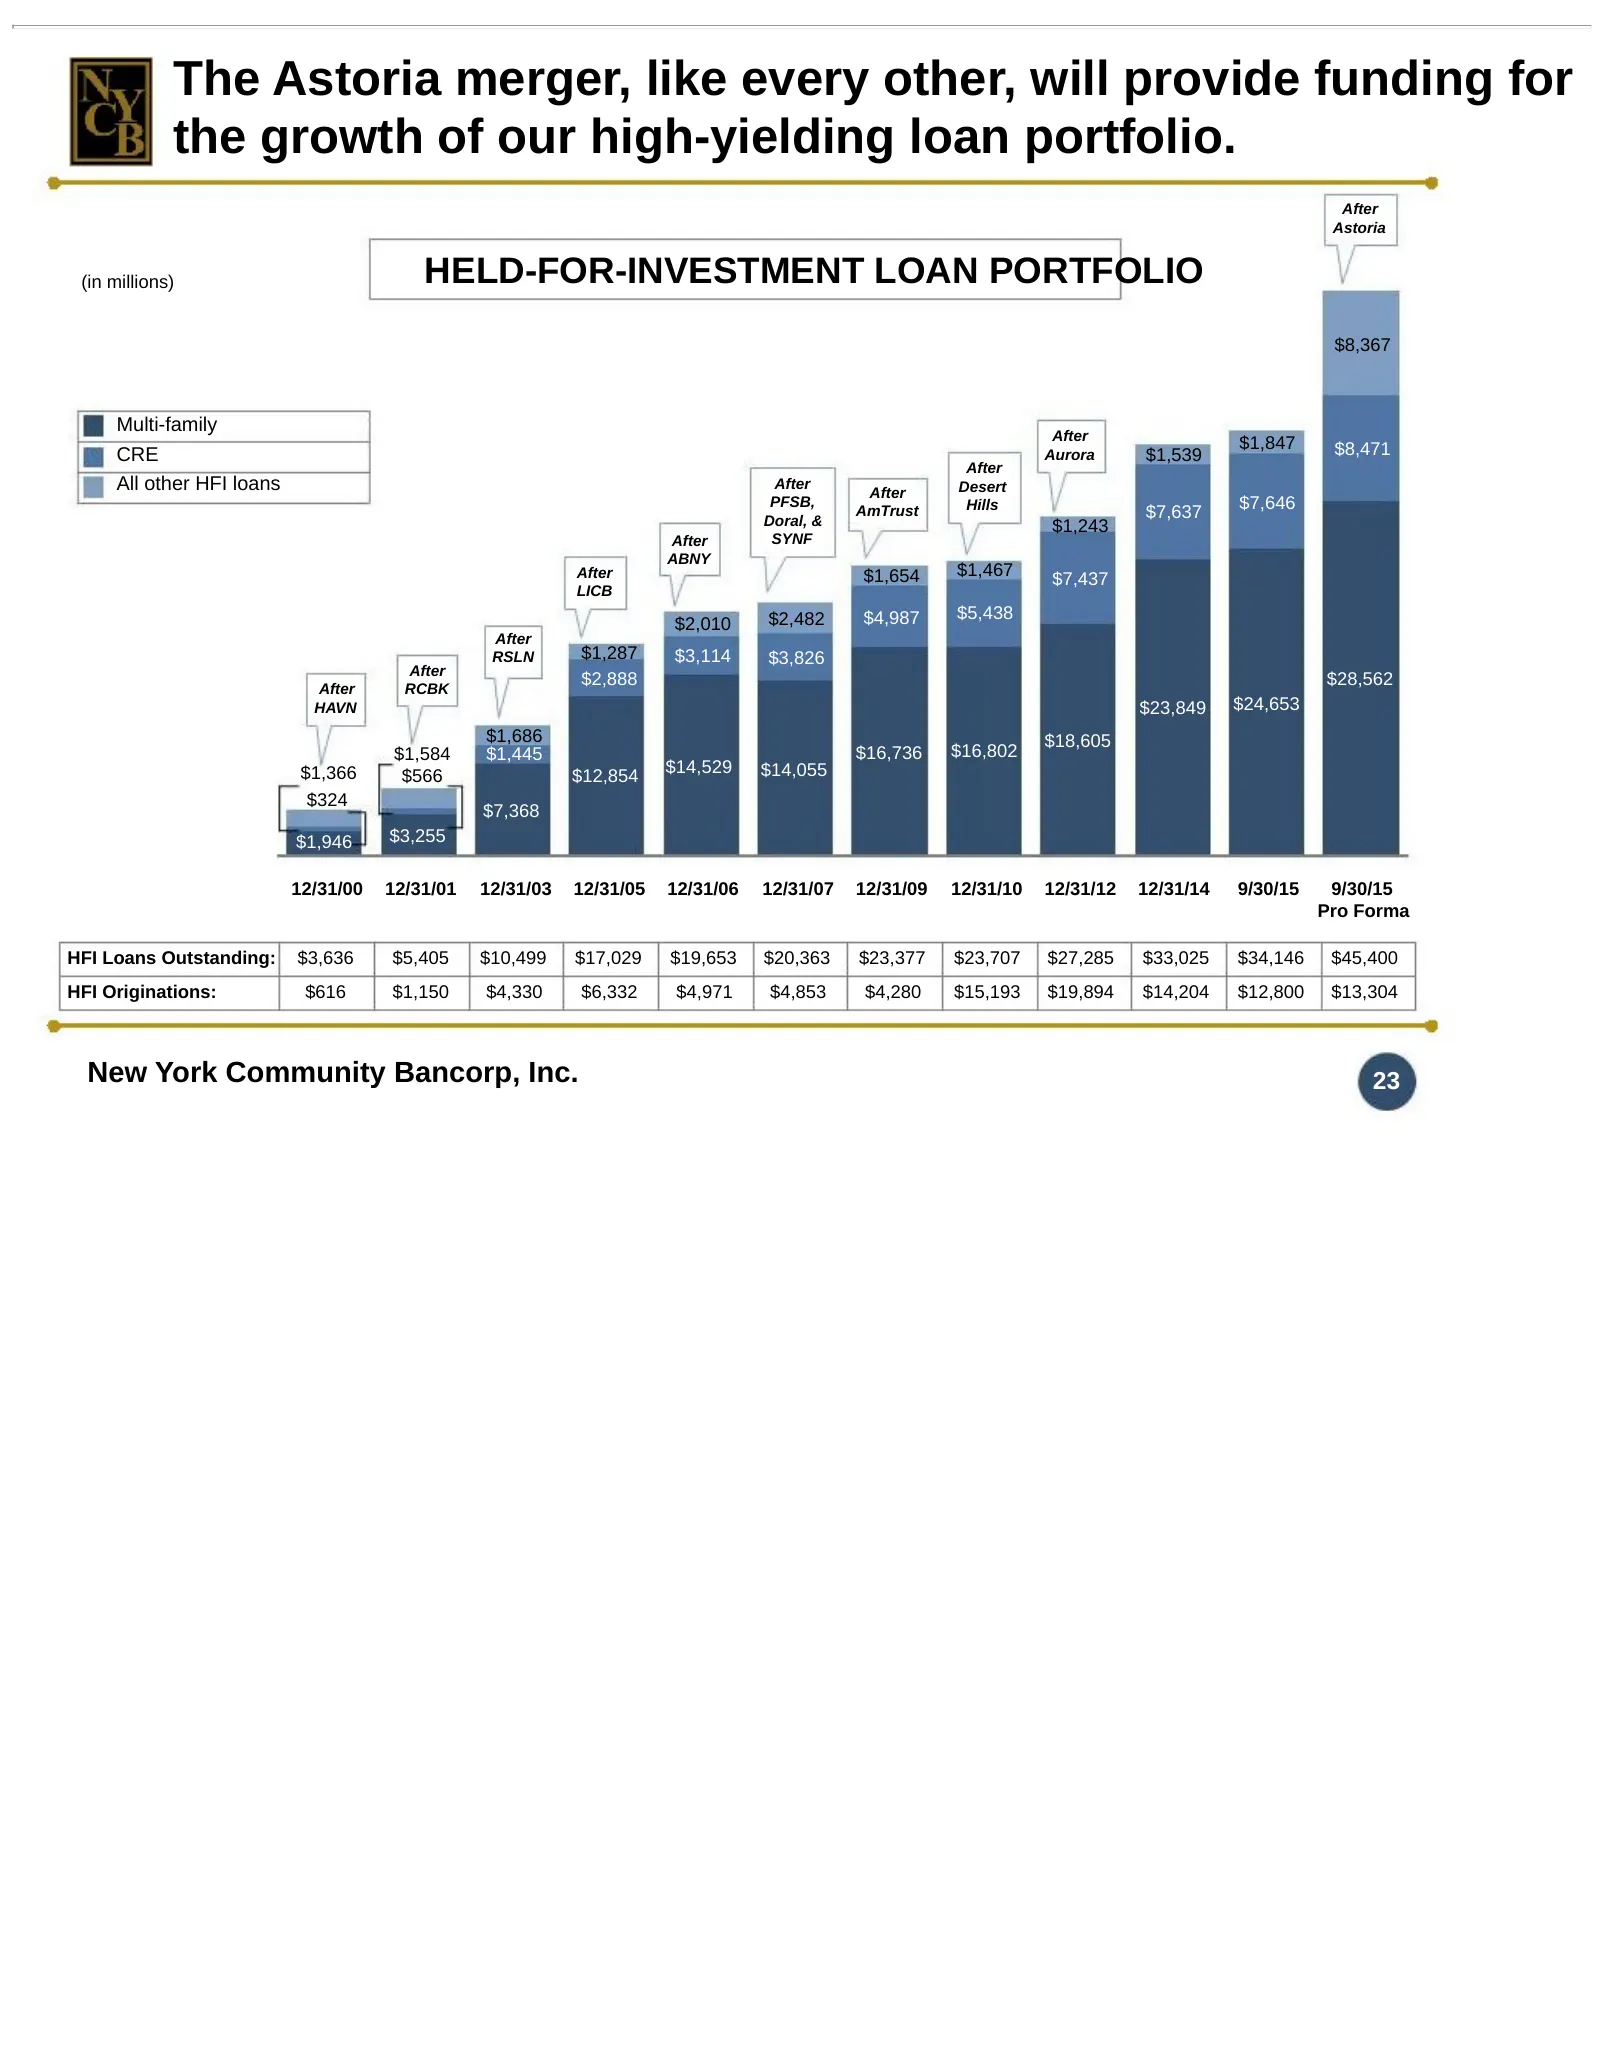
Slide 23: Funding for growth of our high-yielding loan portfolio
The Astoria merger, like every other, will provide funding for the growth of our high-yielding loan portfolio. After Astoria (in millions) HELD-FOR-INVESTMENT LOAN PORTFOLIO $8,367 Multi-family After $1,847 $8,471 CRE Aurora $1,539 After All other HFI loans After After Desert PFSB, Hills $7,646 Dora
Slide 24: Multi-Family Loan Production
Multi-Family Loan Production
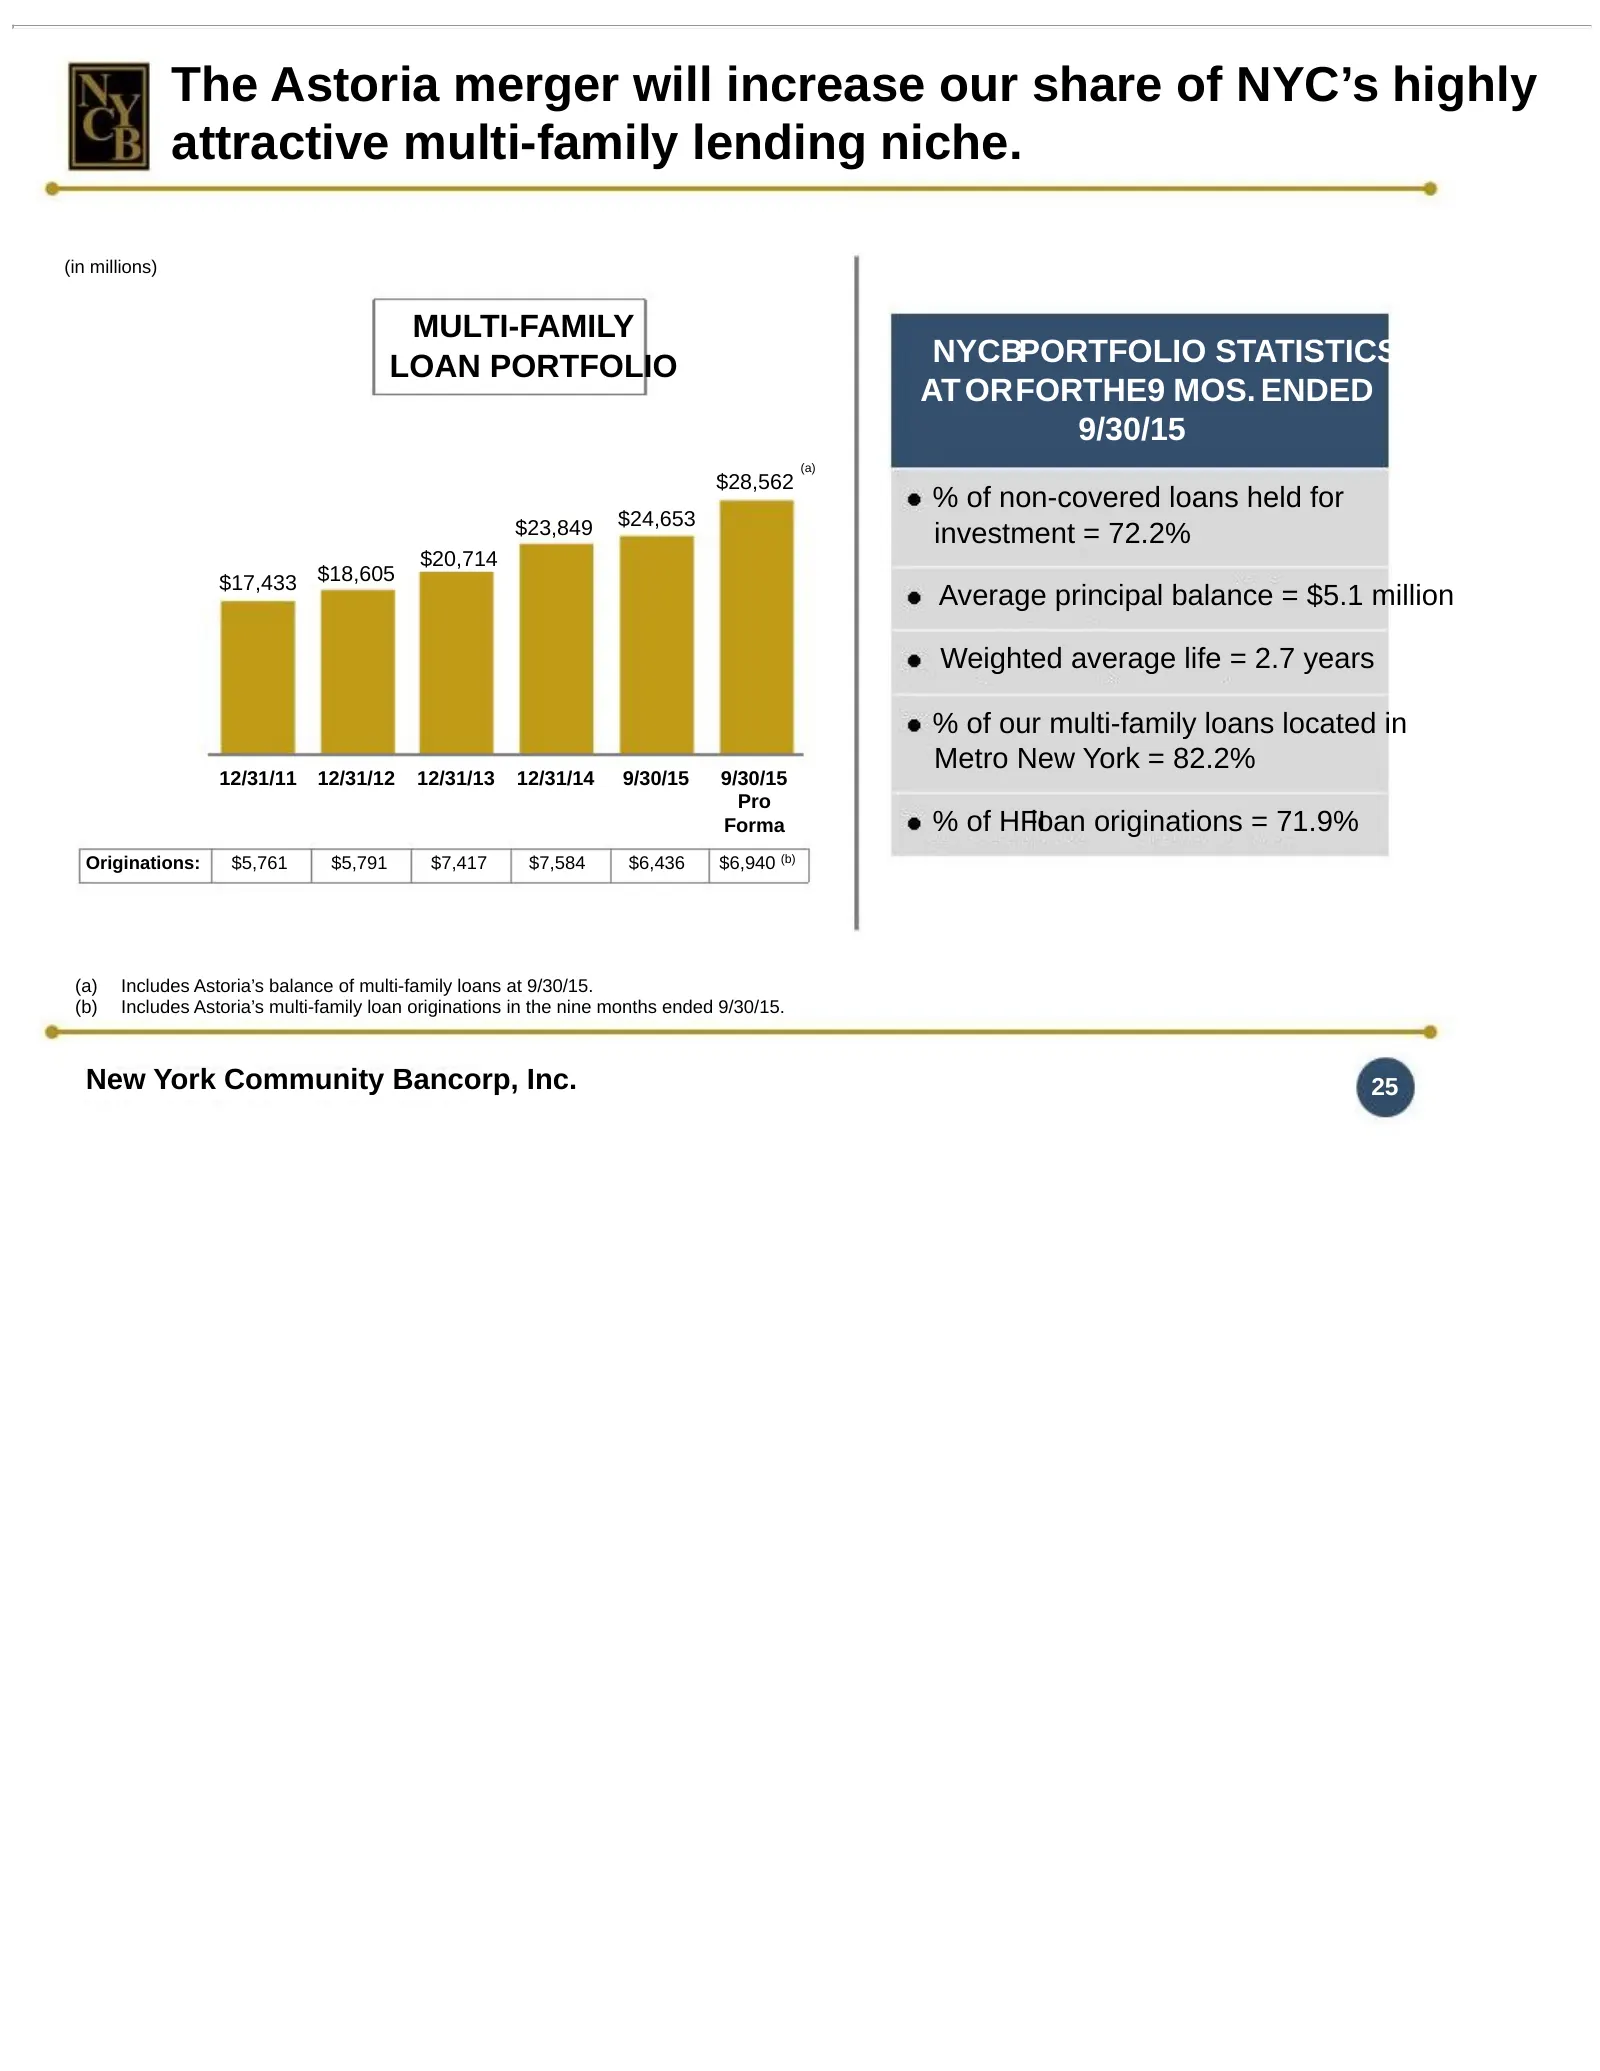
Slide 25: Increased share of NYC's multi-family lending niche
The Astoria merger will increase our share of NYC’s highly attractive multi-family lending niche. (in millions) MULTI-FAMILY LOAN PORTFOLIO NYCBPORTFOLIO STATISTICS AT ORFORTHE9 MOS. ENDED 9/30/15 (a) $28,562 % of non-covered loans held for $23,849 $24,653 investment = 72.2% $20,714 $17,433 $18,605
Slide 26: Asset Quality
Asset Quality
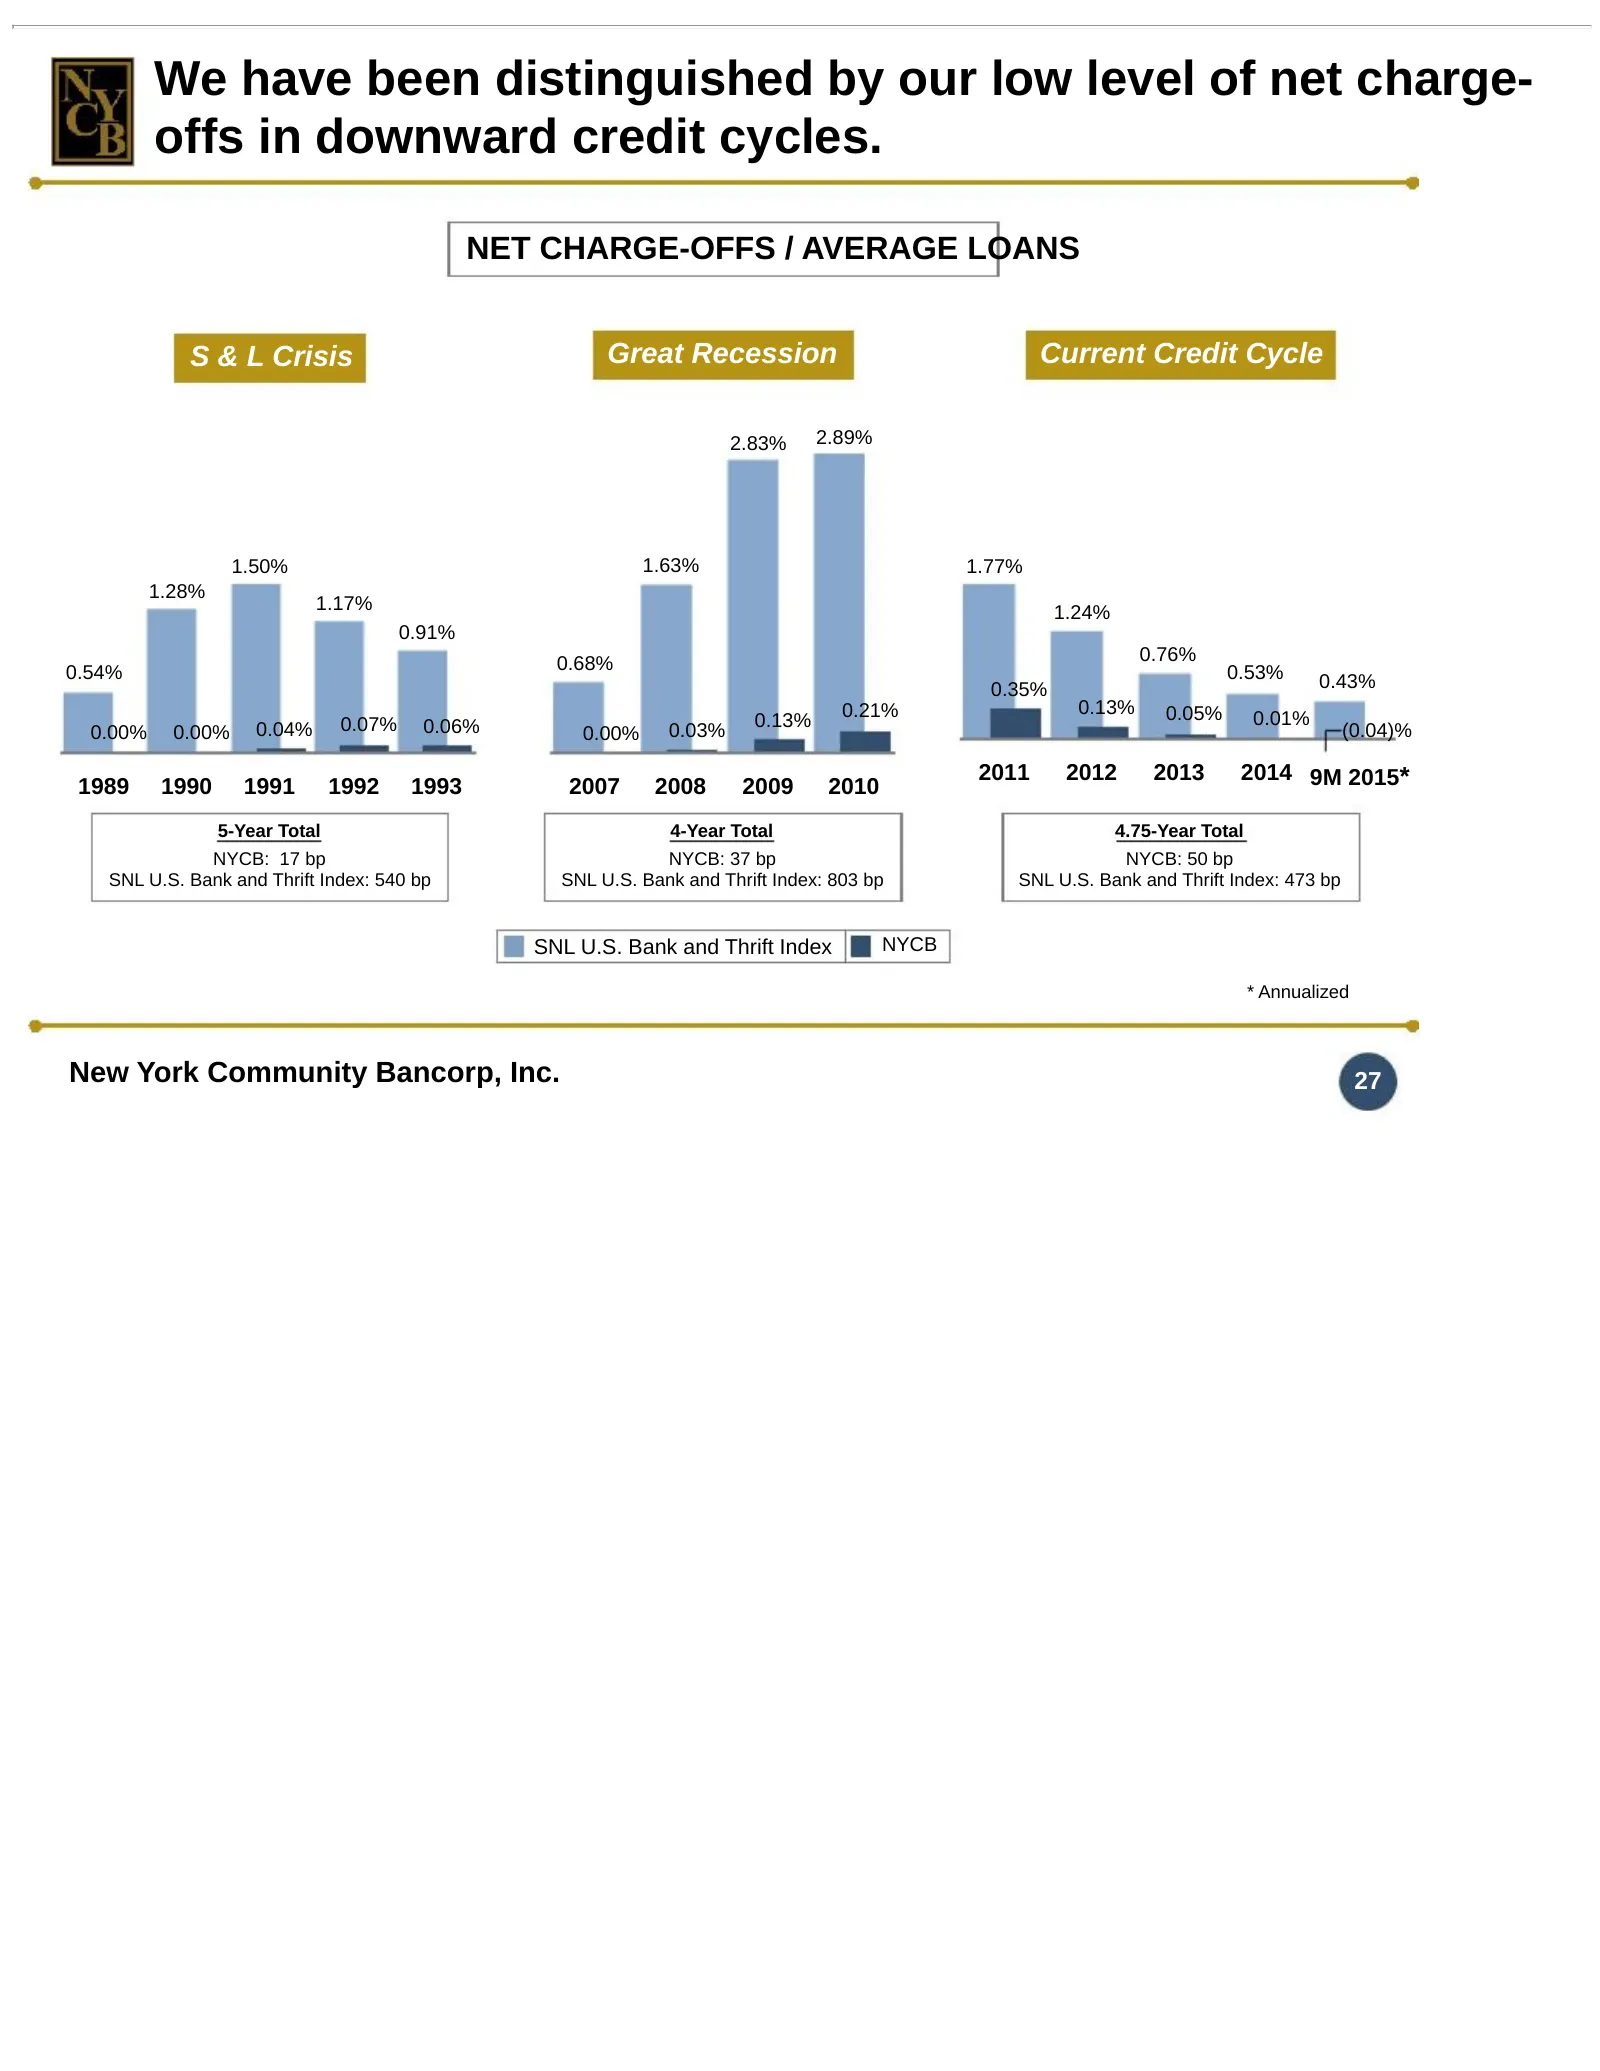
Slide 27: Low level of net charge-offs in downward credit cycles
We have been distinguished by our low level of net charge- offs in downward credit cycles. NET CHARGE-OFFS / AVERAGE LOANS S & L Crisis Great Recession Current Credit Cycle 2.83% 2.89% 1.50% 1.63% 1.77% 1.28% 1.17% 1.24% 0.91% 0.68% 0.76% 0.54% 0.53% 0.43% 0.35% 0.21% 0.13% 0.05% 0.07% 0.06% 0.13% 0
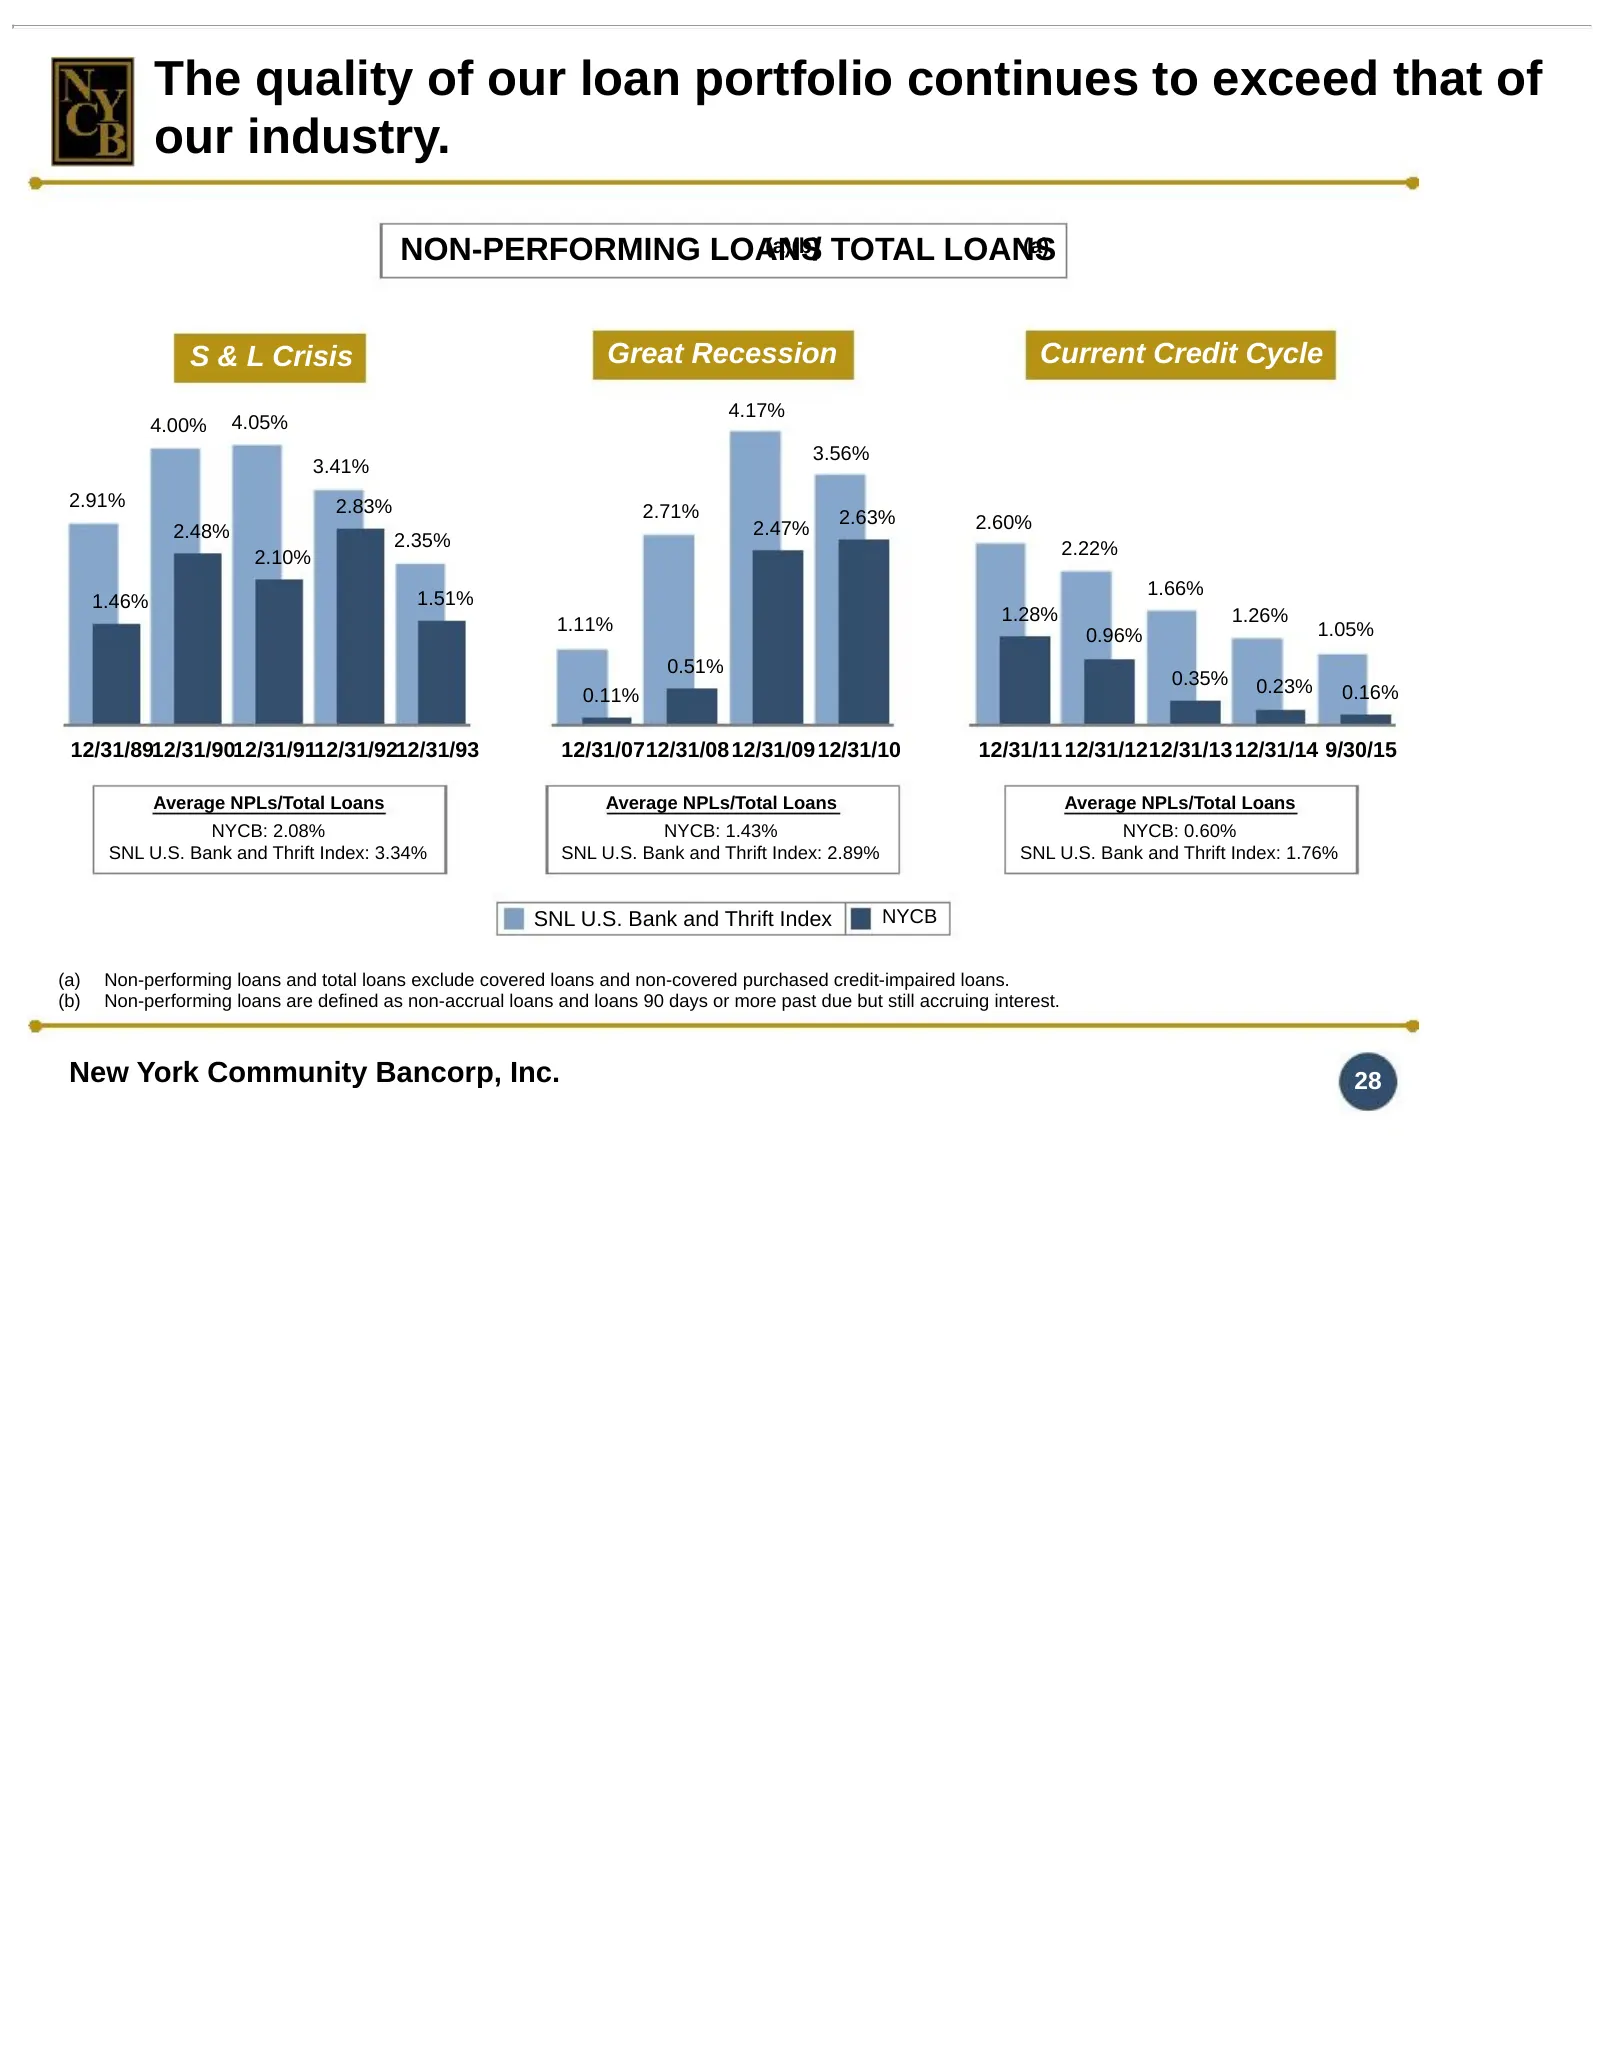
Slide 28: Loan portfolio quality continues to exceed that of our industry
The quality of our loan portfolio continues to exceed that of our industry. NON-PERFORMING LOANS (a)(b)/ TOTAL LOANS (a) S & L Crisis Great Recession Current Credit Cycle 4.17% 4.00% 4.05% 3.56% 3.41% 2.91% 2.83% 2.71% 2.63% 2.48% 2.47% 2.60% 2.35% 2.22% 2.10% 1.66% 1.46% 1.51% 1.28% 1.26% 1.11% 1.0
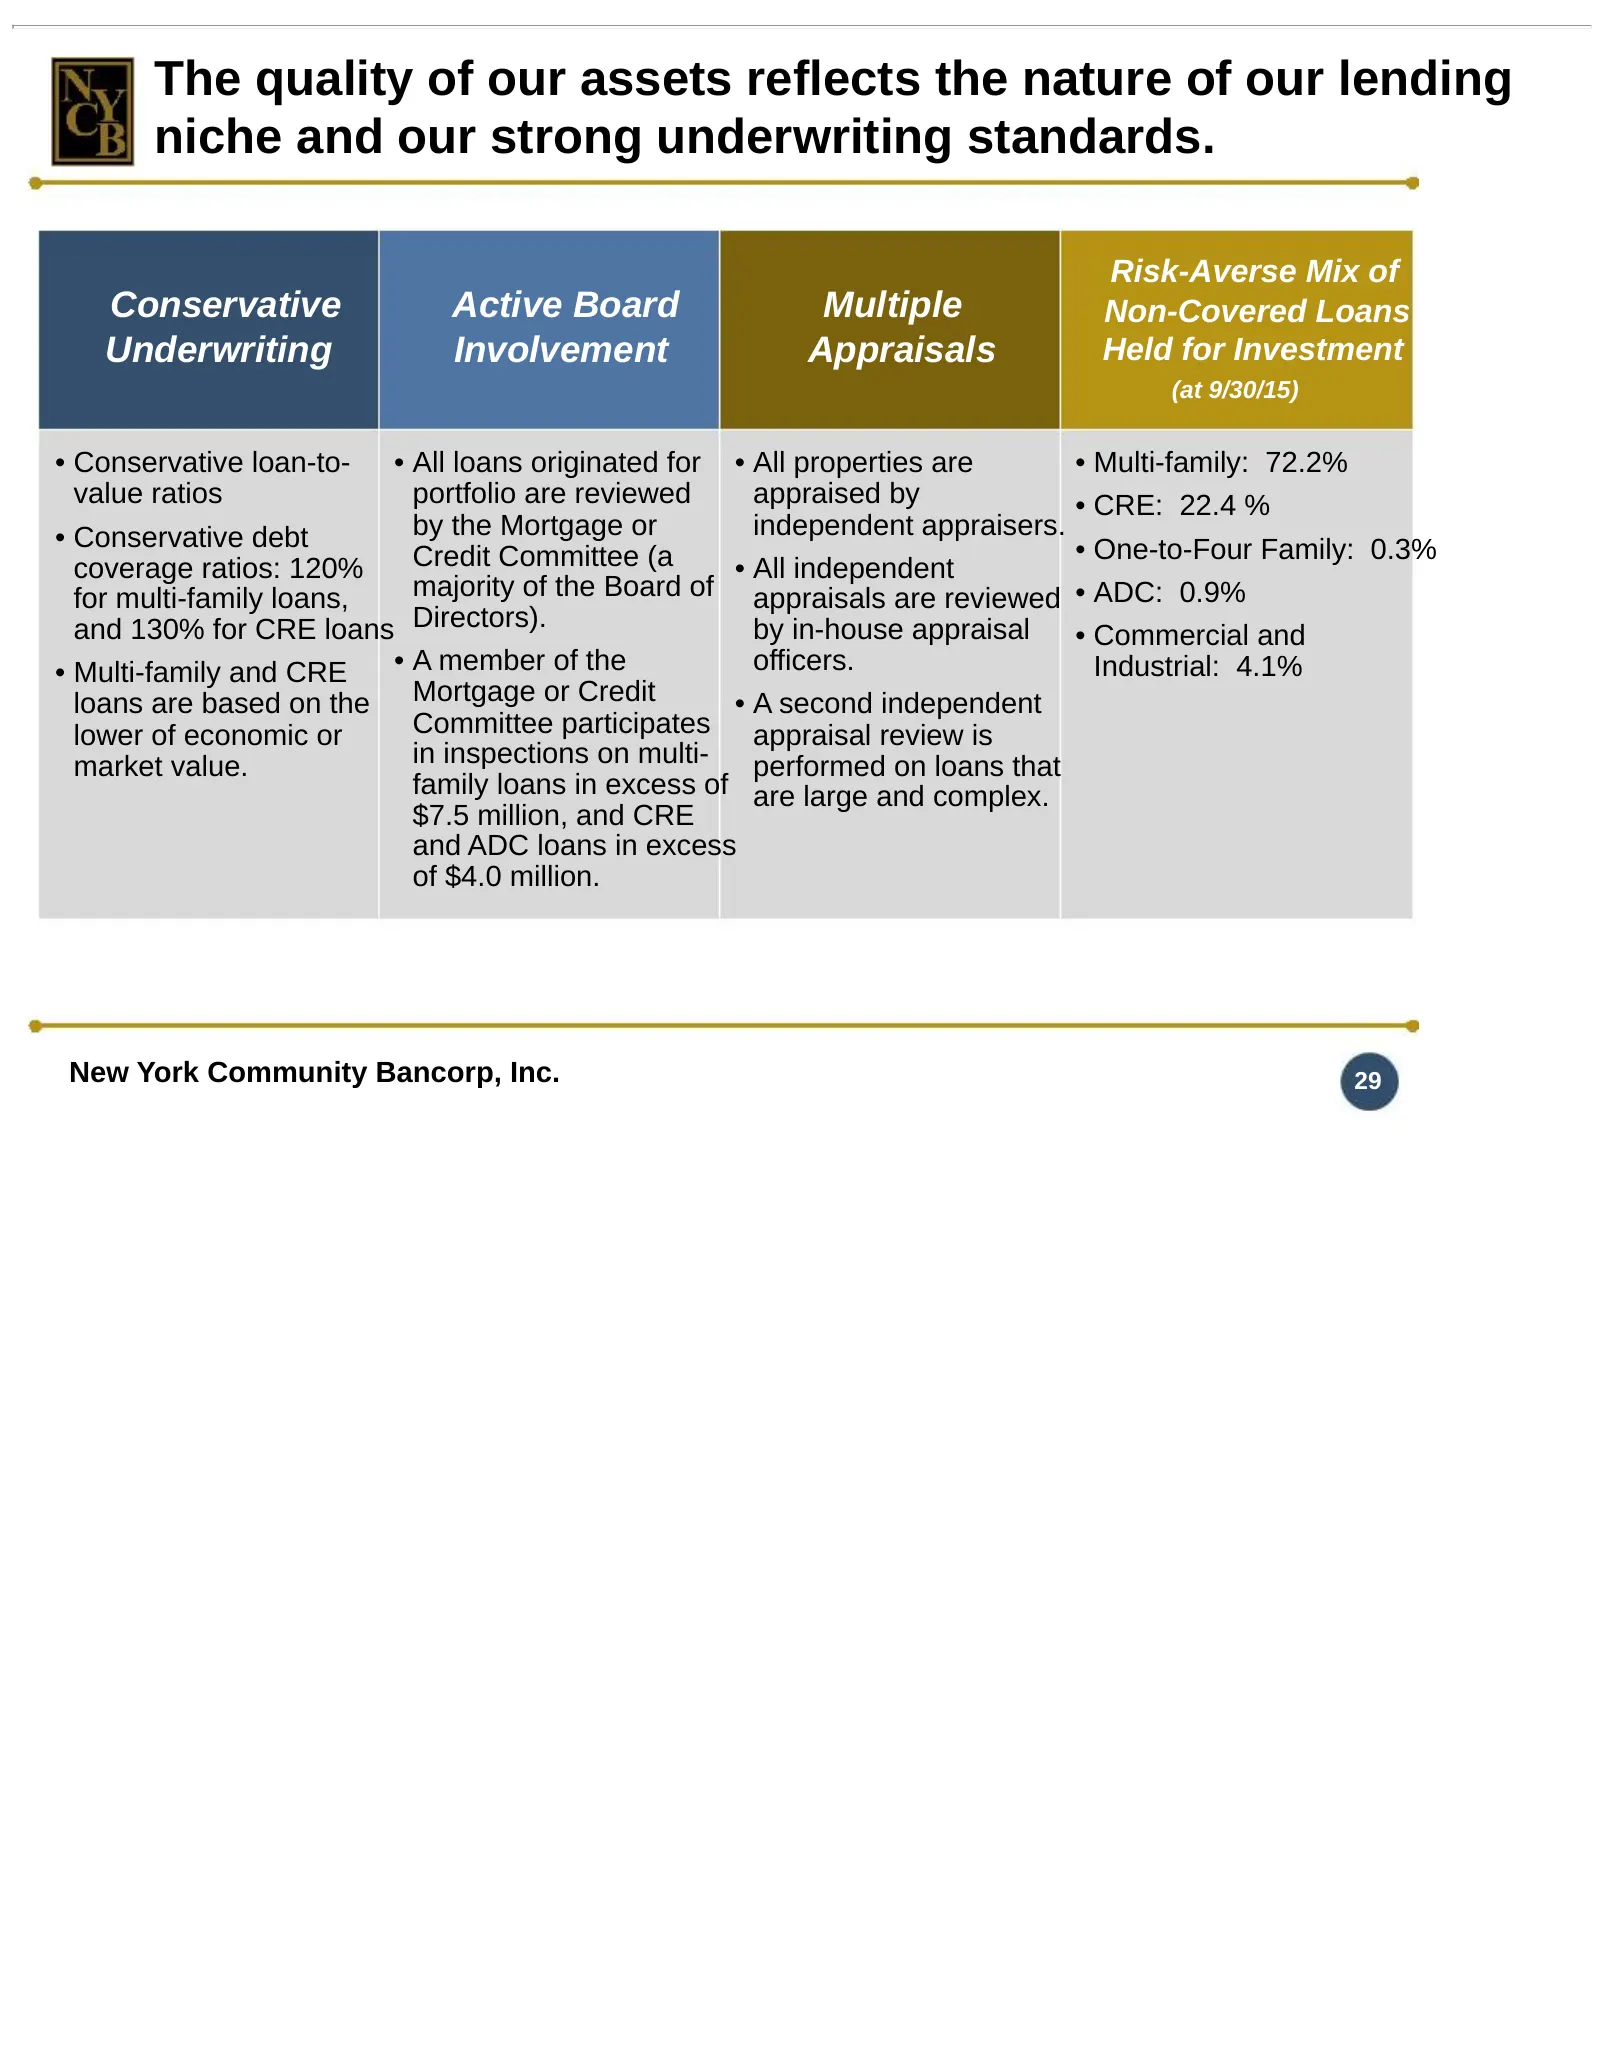
Slide 29: Asset quality reflects our lending niche and strong underwriting standards
The quality of our assets reflects the nature of our lending niche and our strong underwriting standards. Risk-Averse Mix of Conservative Active Board Multiple Non-Covered Loans Underwriting Involvement Appraisals Held for Investment (at 9/30/15) • Conservative loan-to- • All loans originated for •
Slide 30: Residential Mortgage Banking
Residential Mortgage Banking
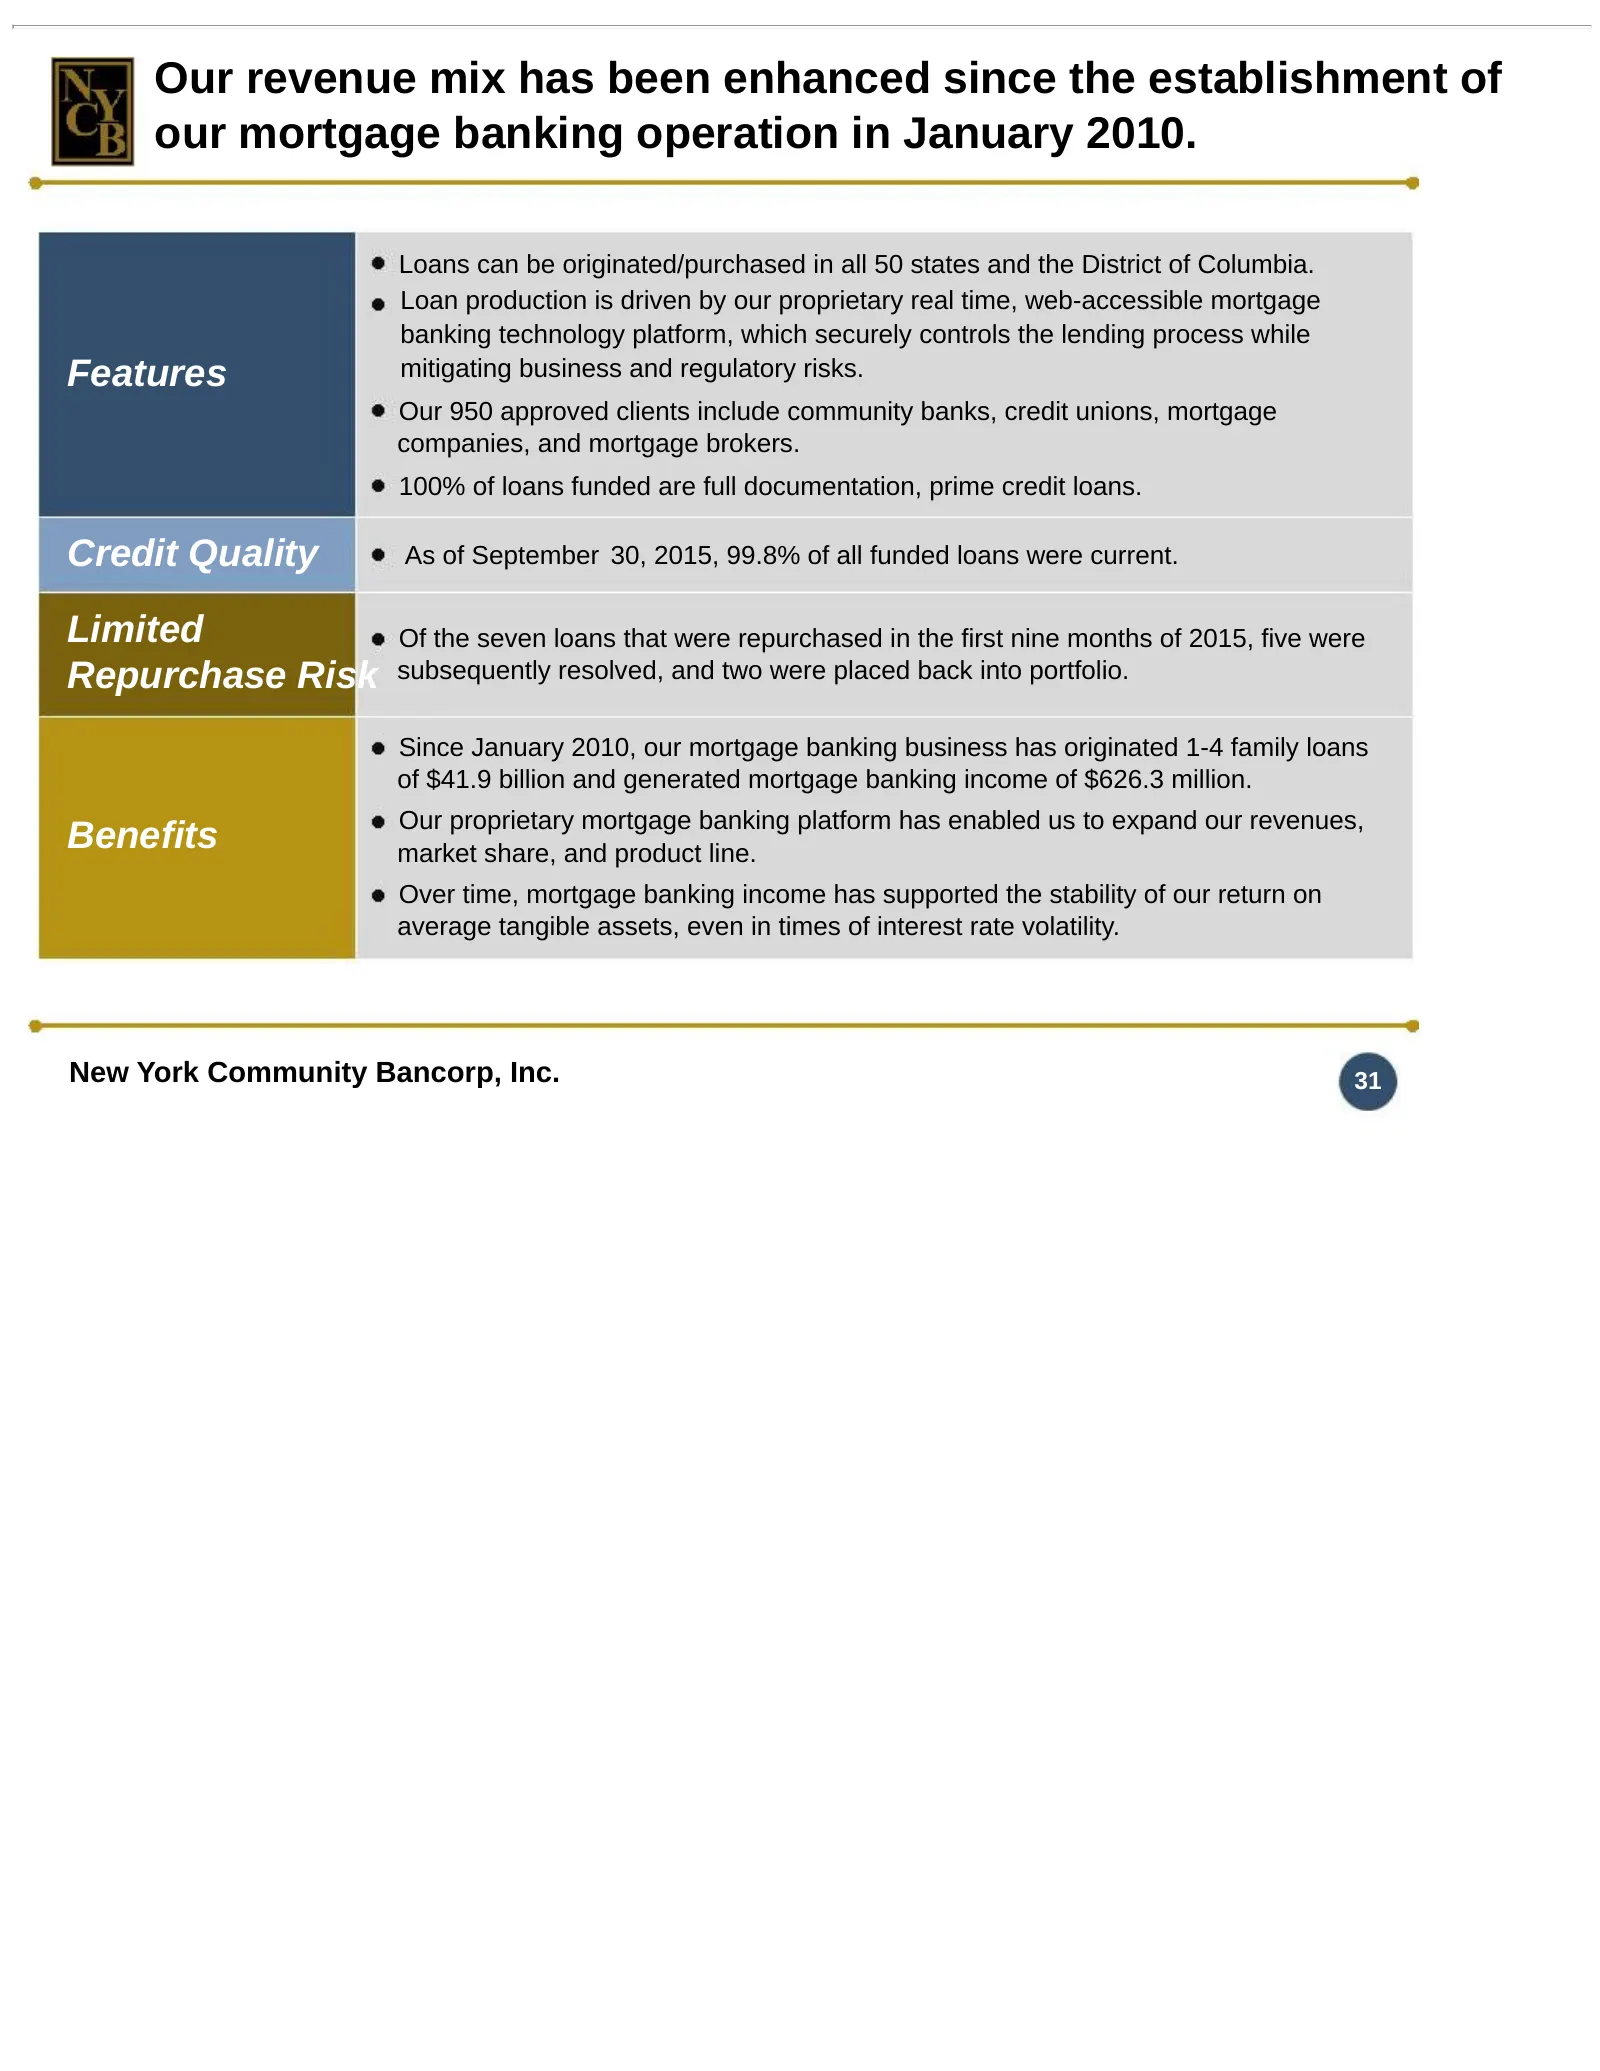
Slide 31: Revenue mix enhanced since establishment of mortgage banking operation
Our revenue mix has been enhanced since the establishment of our mortgage banking operation in January 2010. Loans can be originated/purchased in all 50 states and the District of Columbia. Loan production is driven by our proprietary real time, web-accessible mortgage banking technology platform, w
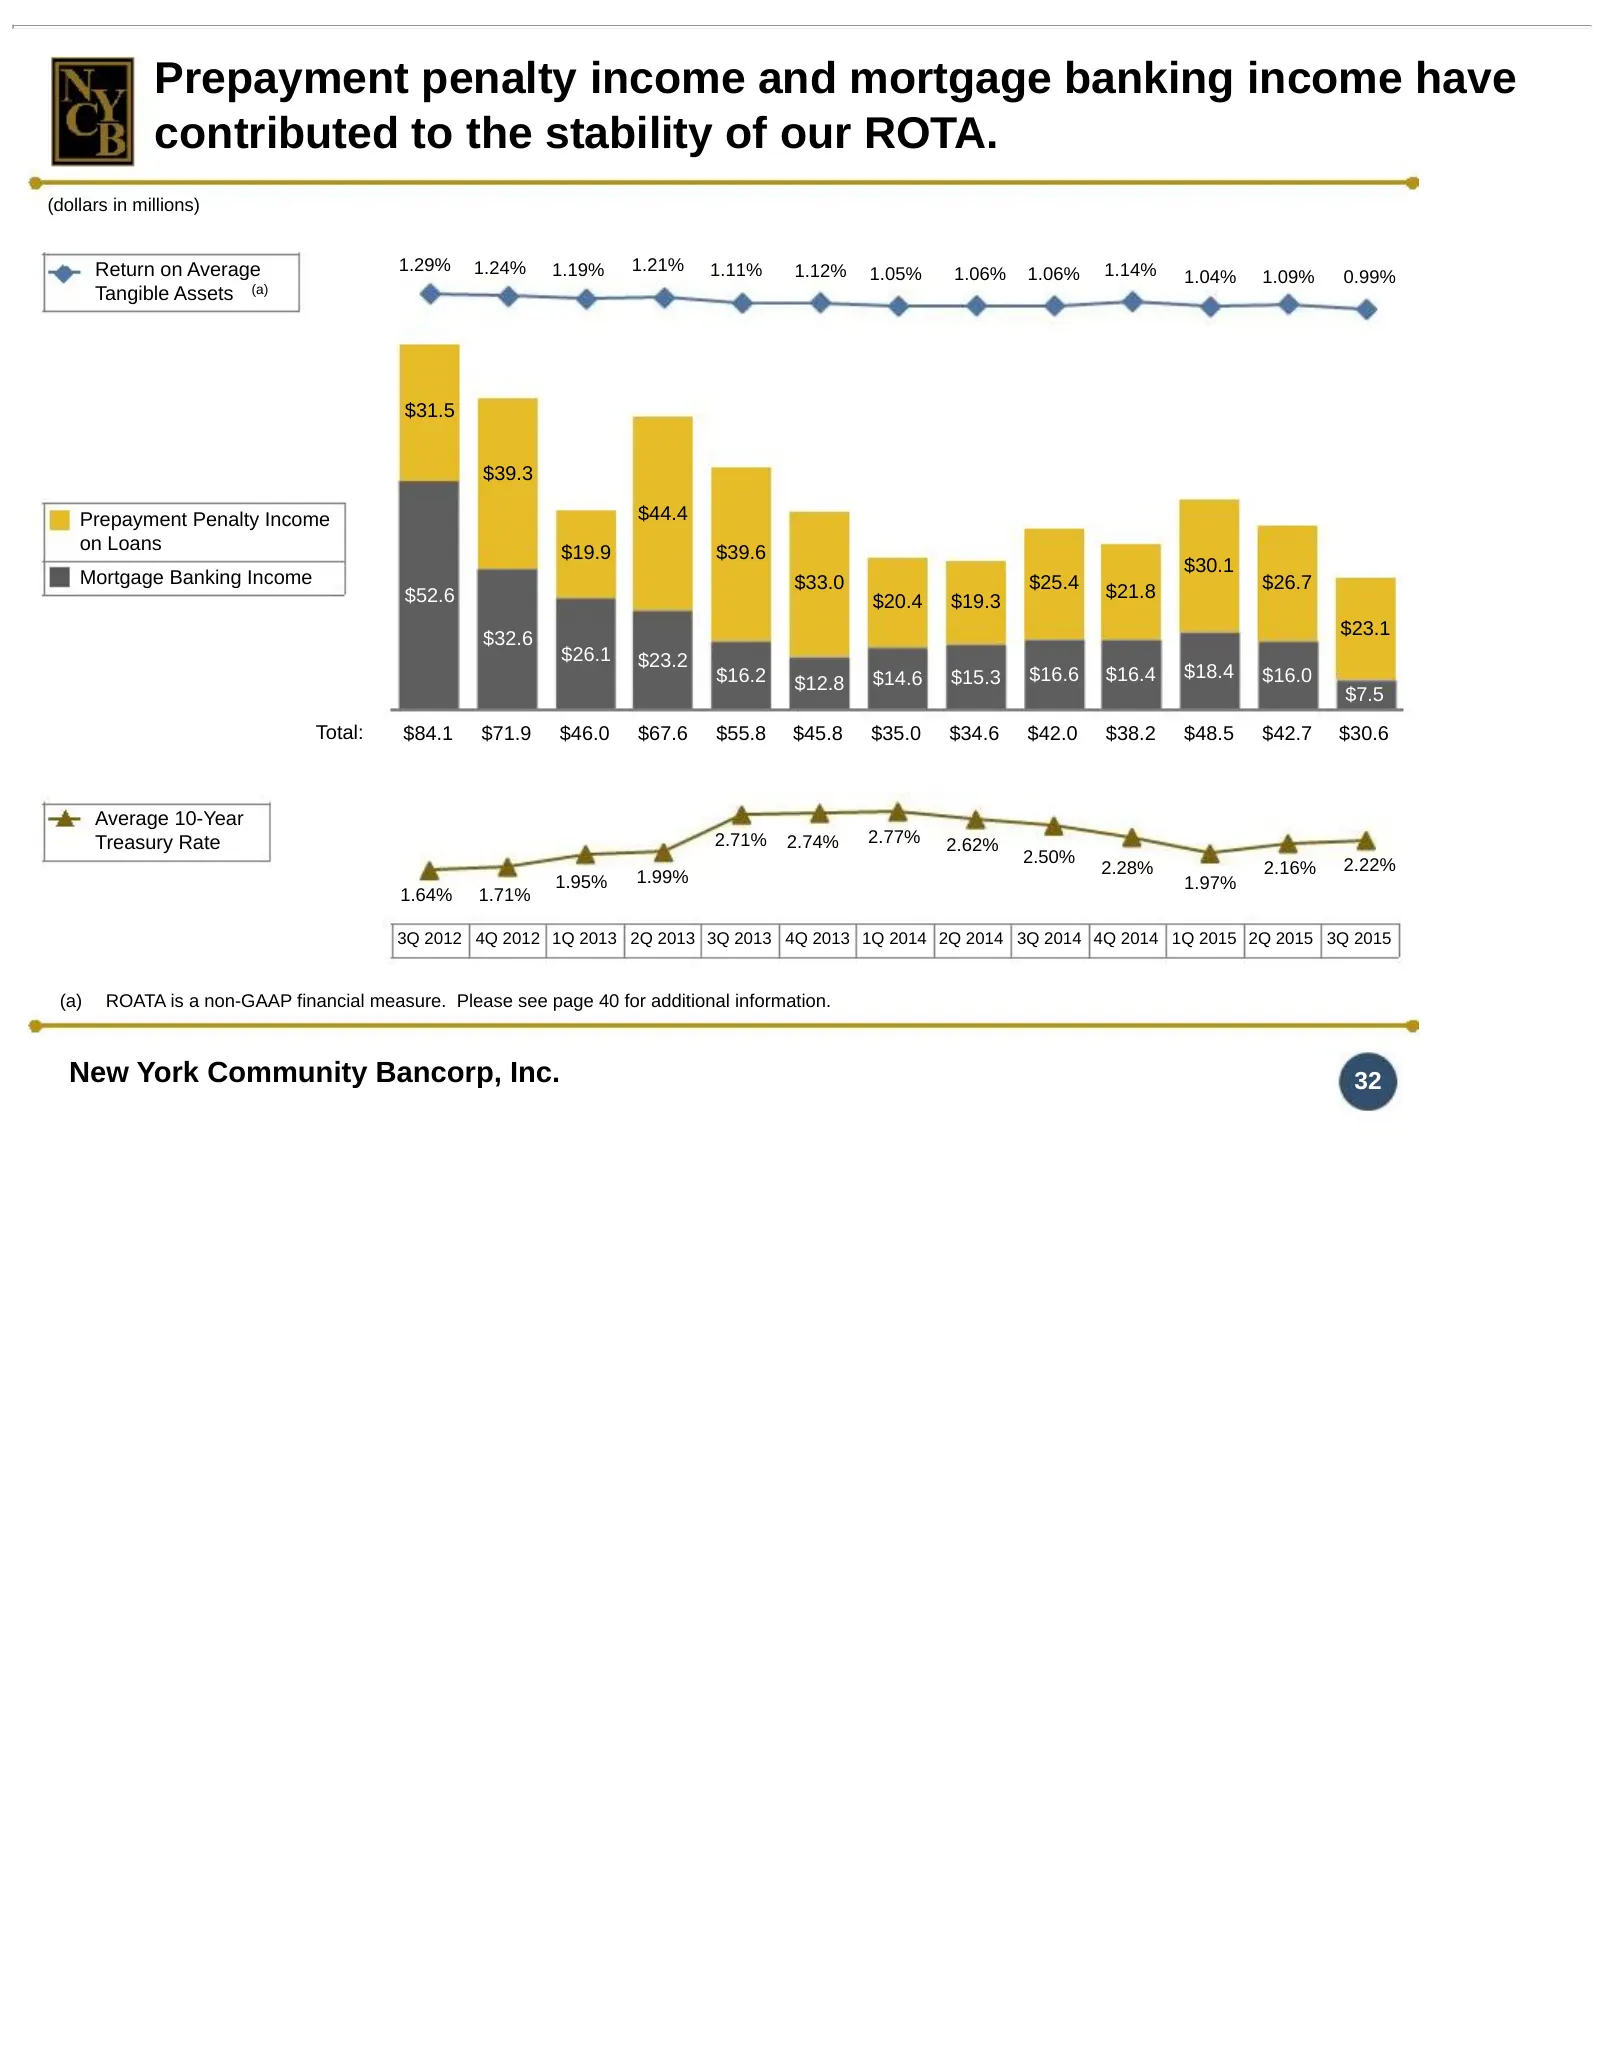
Slide 32: Prepayment penalty and mortgage banking income contributed to ROTA stability
Prepayment penalty income and mortgage banking income have contributed to the stability of our ROTA. (dollars in millions) Return on Average 1.29% 1.24% 1.19% 1.21% 1.11% 1.12% 1.14% 1.05% 1.06% 1.06% 1.04% 1.09% 0.99% Tangible Assets (a) $31.5 $39.3 Prepayment Penalty Income $44.4 on Loans $19.9 $3
Slide 33: Efficiency
Efficiency
Slide 34: The Astoria merger will maintain our record of superior efficiency
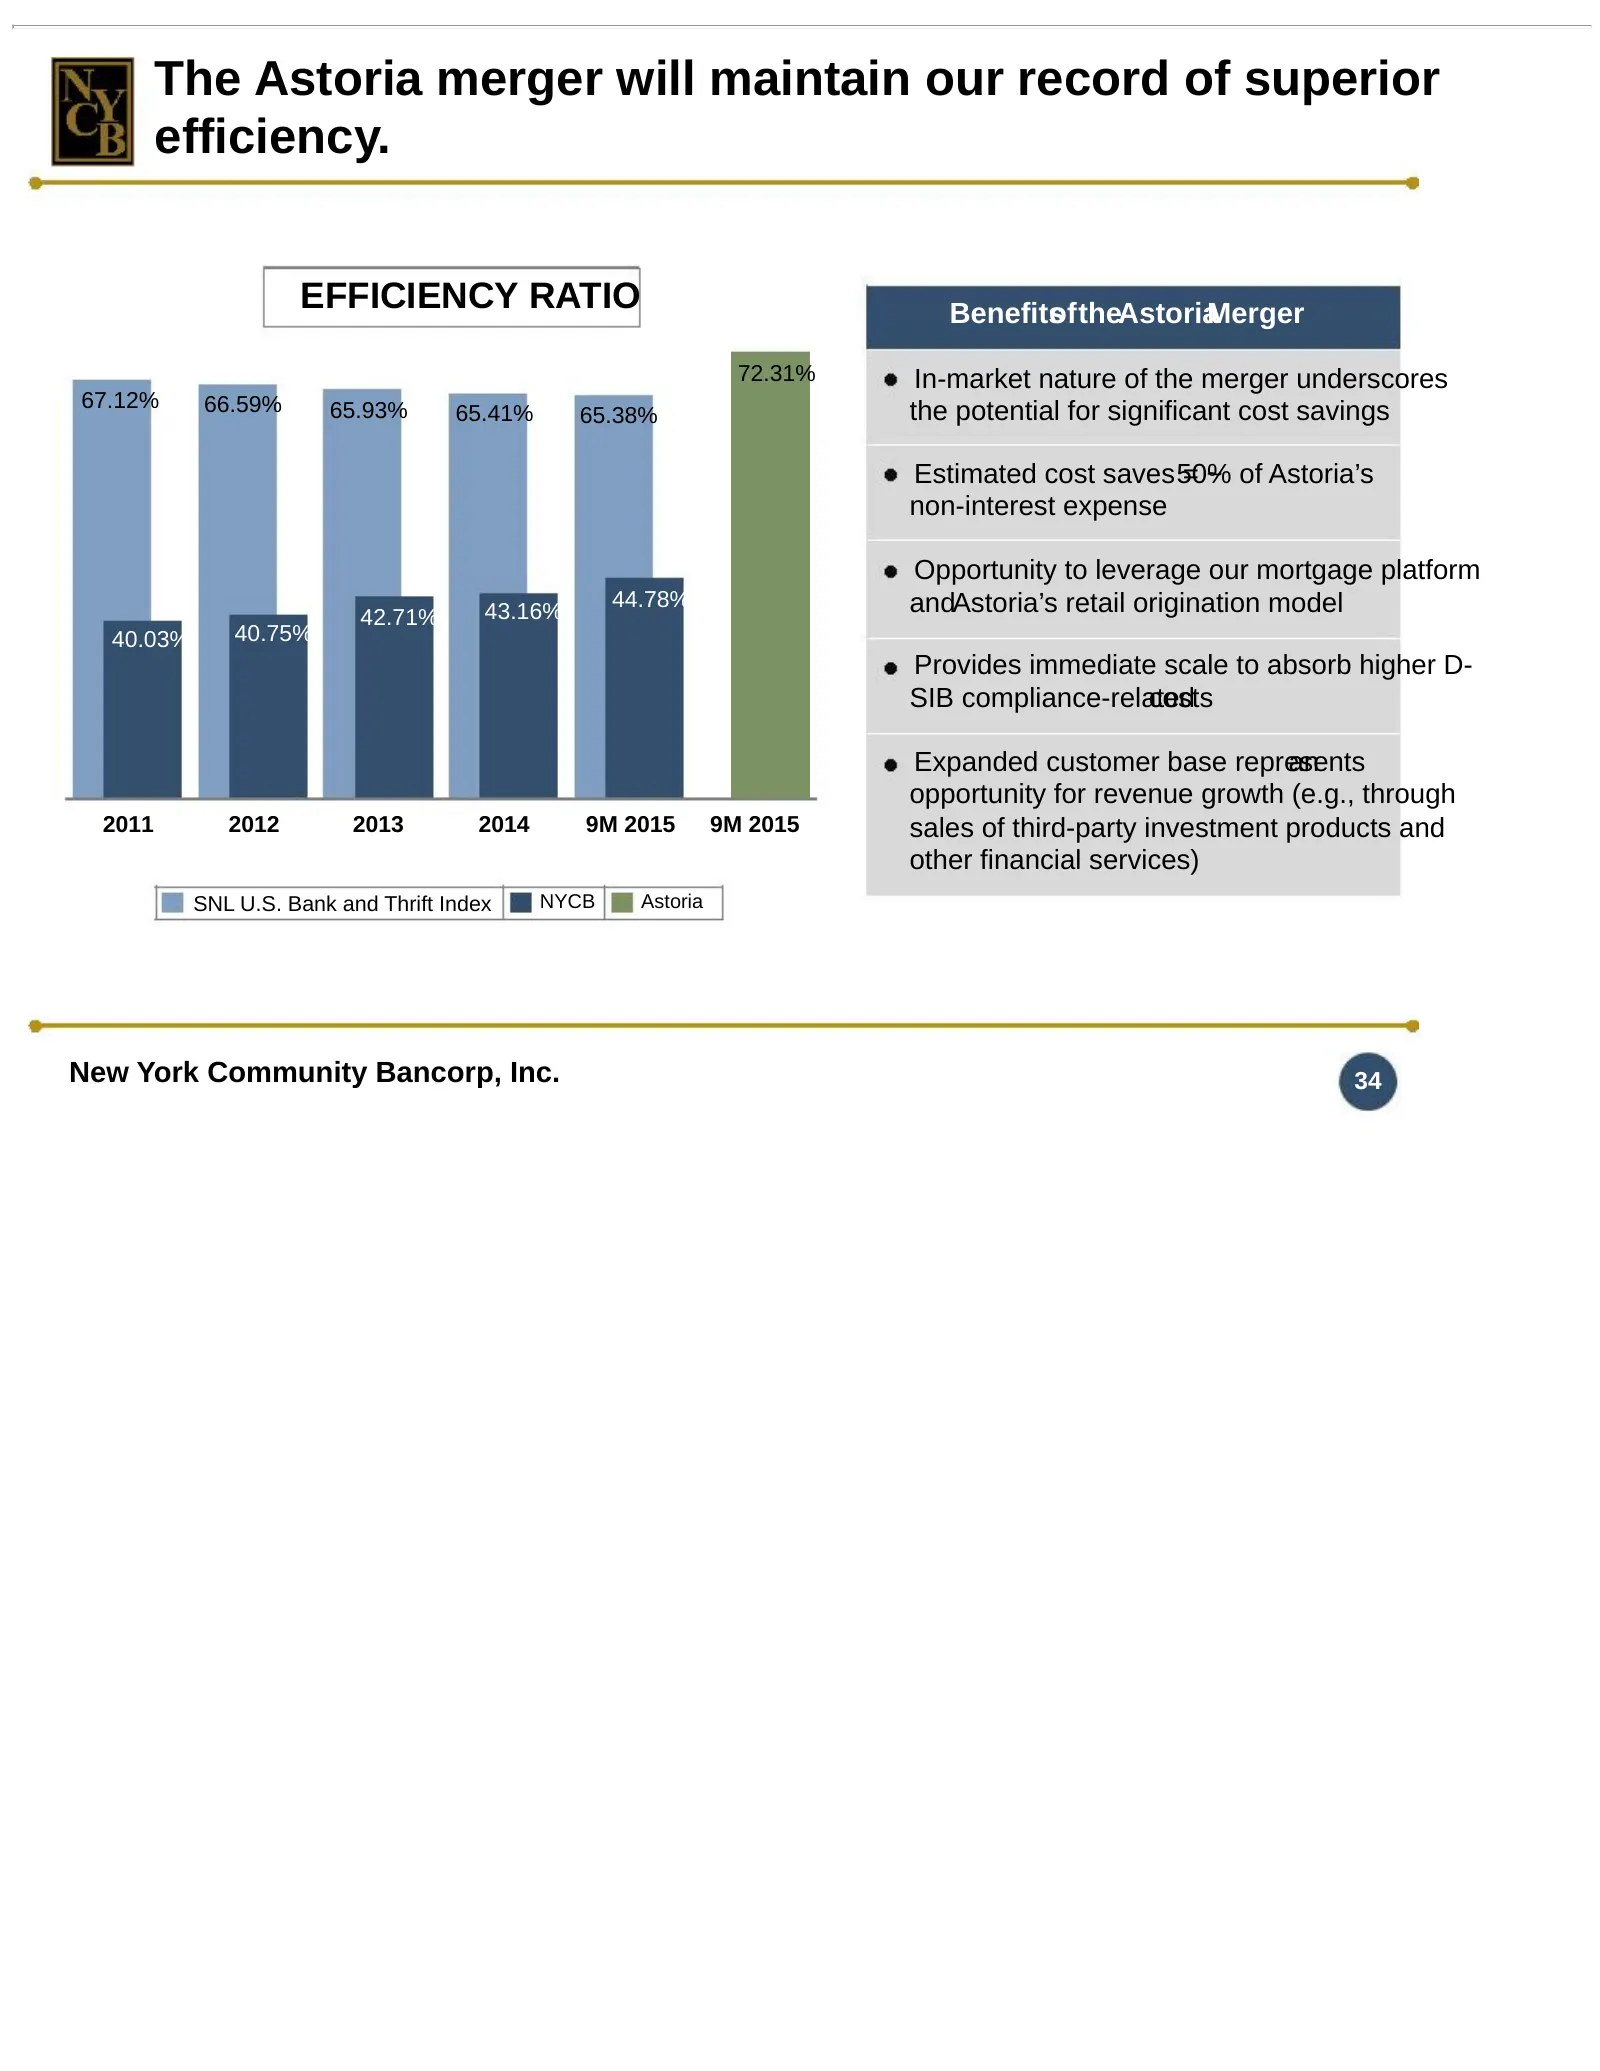
The Astoria merger will maintain our record of superior efficiency. EFFICIENCY RATIO Benefits oftheAstoriaMerger 72.31% In-market nature of the merger underscores 67.12% 66.59% 65.93% 65.41% 65.38% the potential for significant cost savings Estimated cost saves 50% = ~ of Astoria’s non-interest expe
Slide 35: Total Return on Investment
Total Return on Investment
Slide 36: Commitment to building value reflected in our total returns
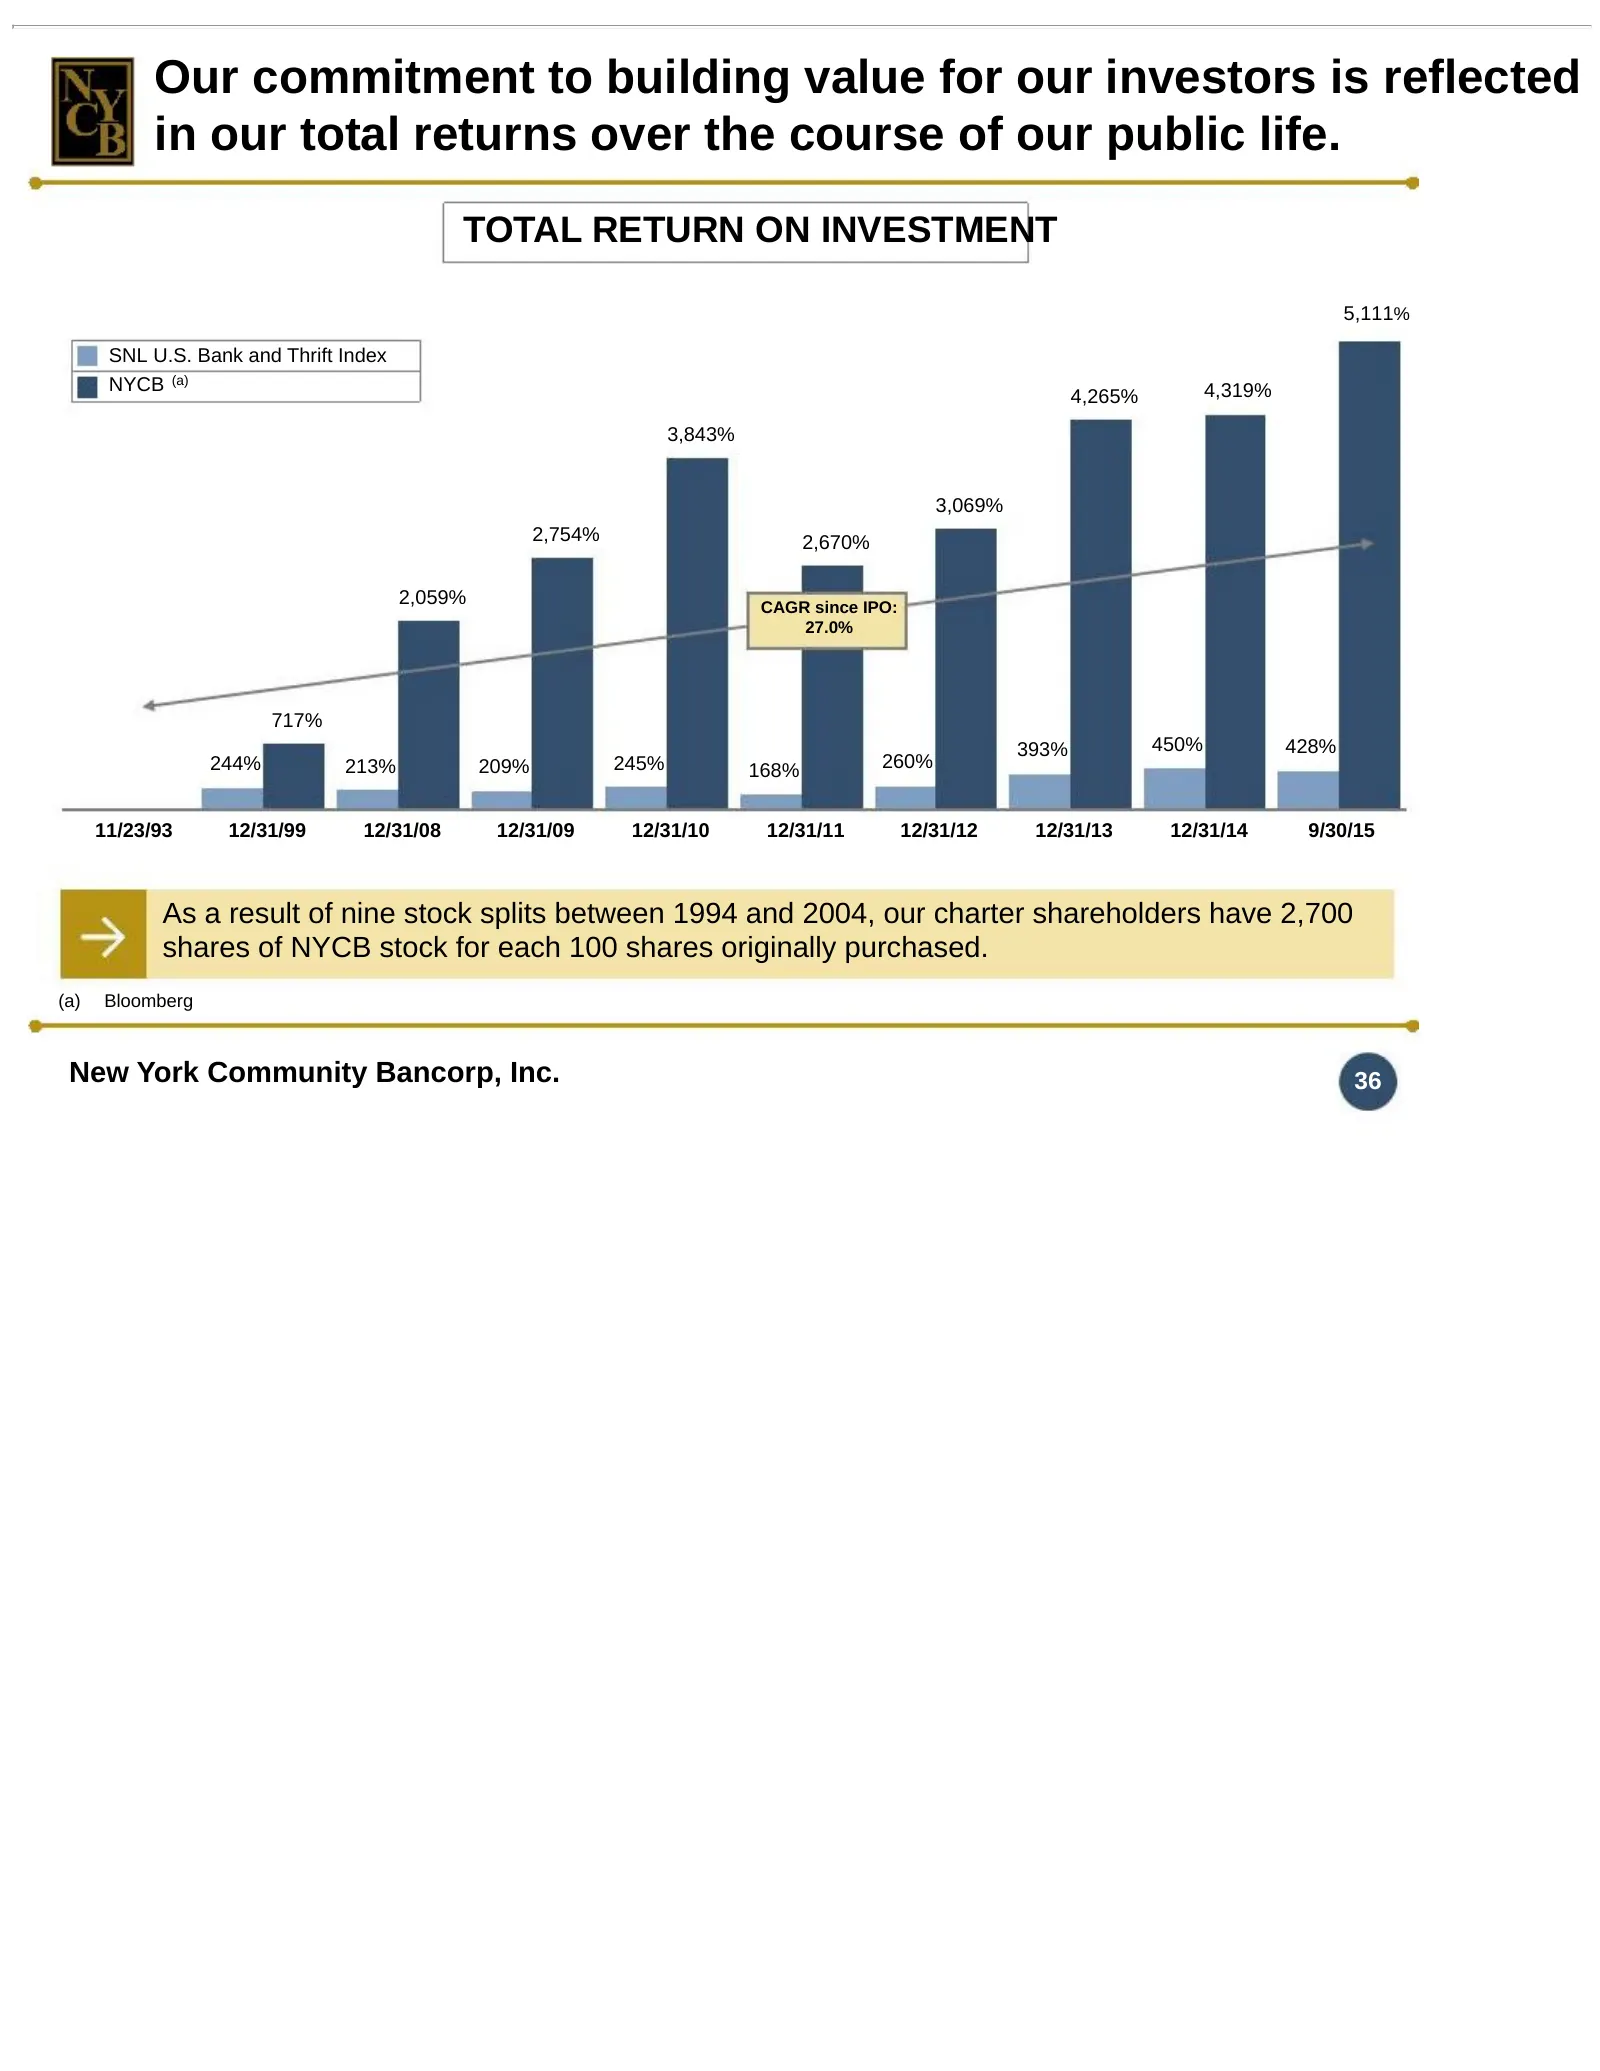
Our commitment to building value for our investors is reflected in our total returns over the course of our public life. TOTAL RETURN ON INVESTMENT 5,111% SNL U.S. Bank and Thrift Index NYCB (a) 4,319% 4,265% 3,843% 3,069% 2,754% 2,670% 2,059% CAGR since IPO: 27.0% 717% 393% 450% 428% 244% 213% 209%
Slide 37: Appendix
Appendix
Slide 38: NYCB and Astoria Financial at a Glance
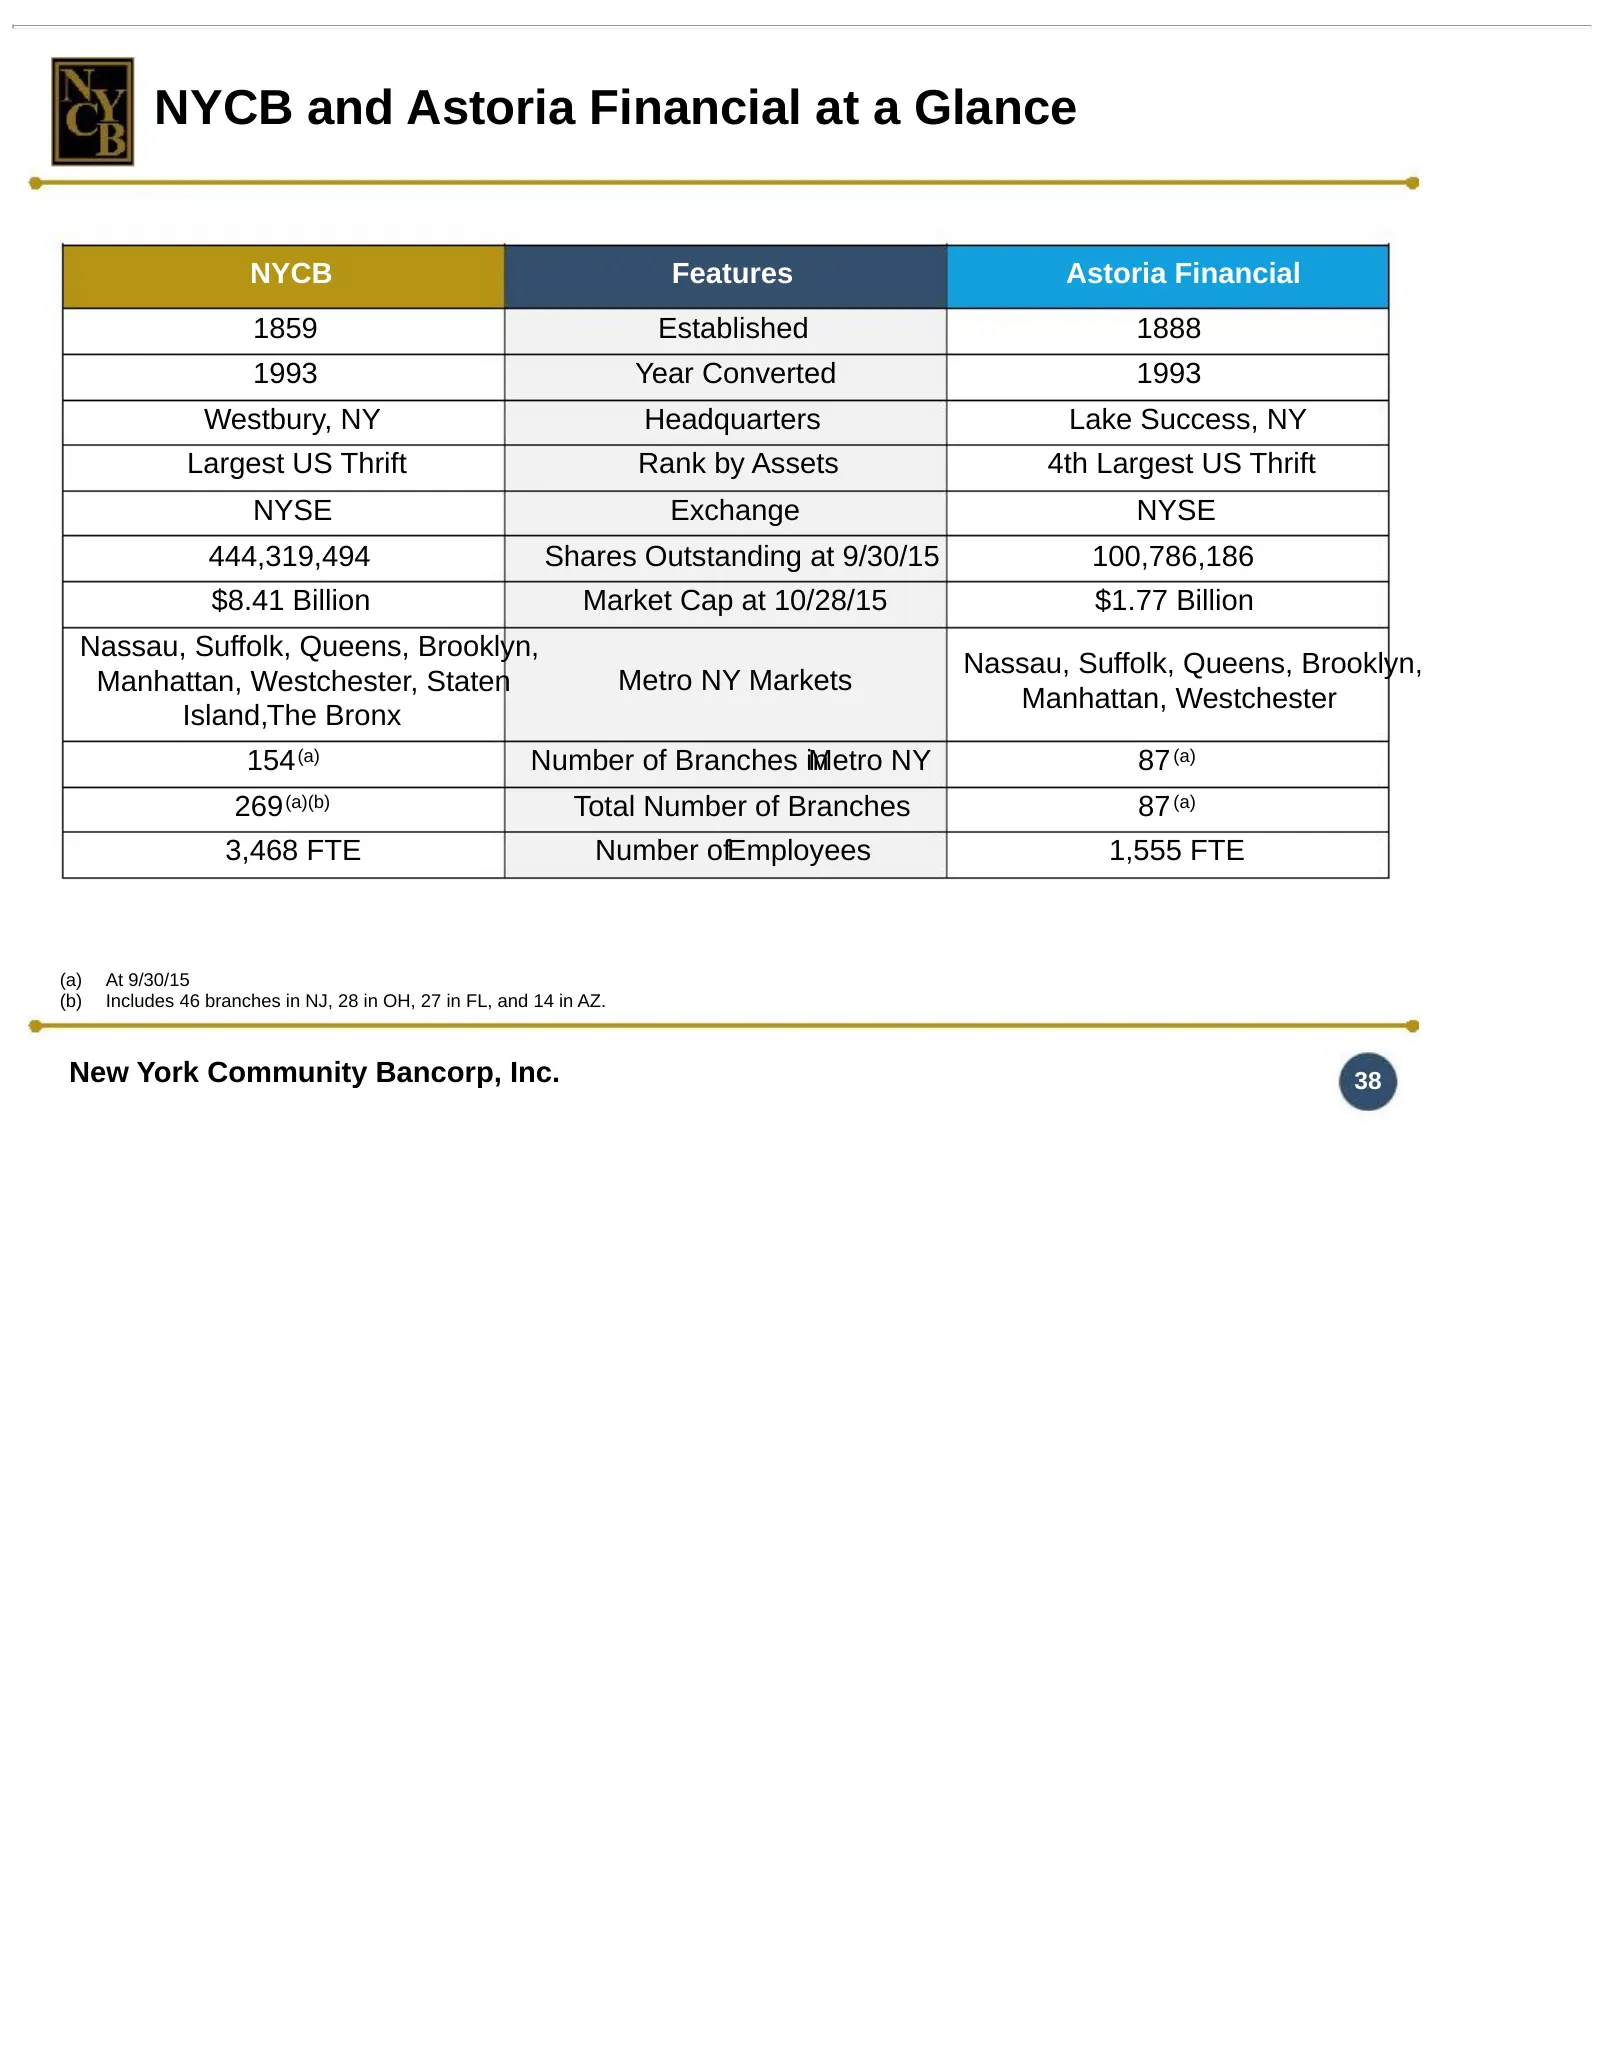
NYCB and Astoria Financial at a Glance NYCB Features Astoria Financial 1859 Established 1888 1993 Year Converted 1993 Westbury, NY Headquarters Lake Success, NY Largest US Thrift Rank by Assets 4th Largest US Thrift NYSE Exchange NYSE 444,319,494 Shares Outstanding at 9/30/15 100,786,186 $8.41 Billi
Slide 39: NYCB and Astoria Financial: Earnings Summary
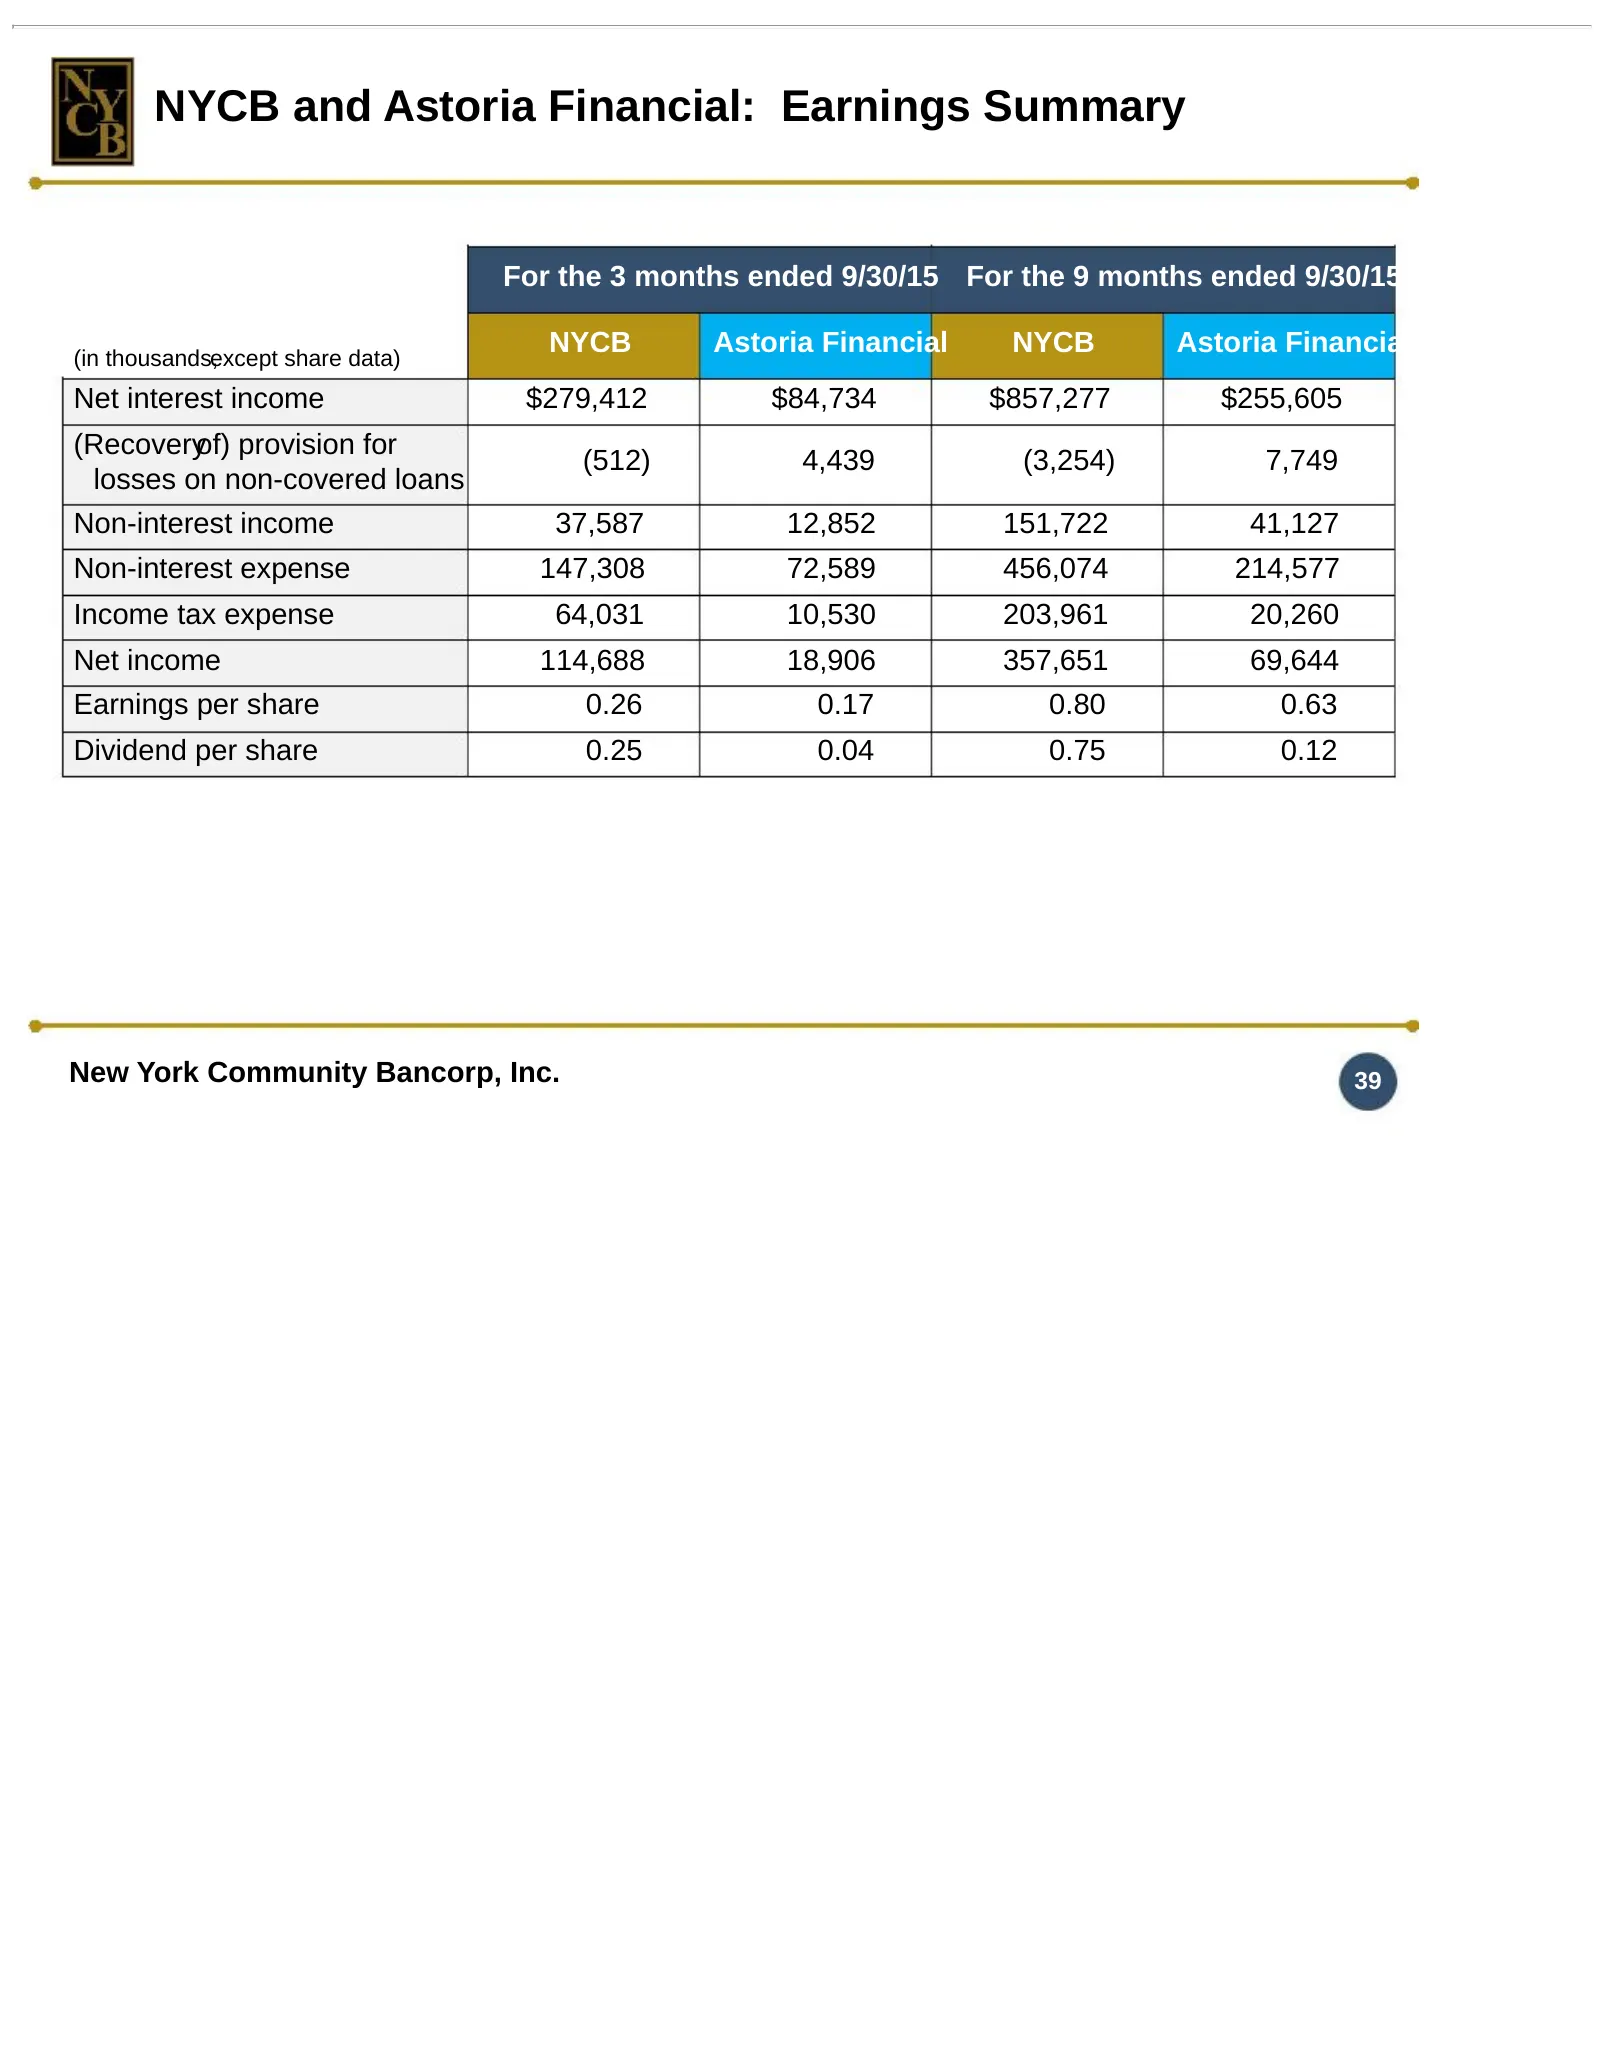
NYCB and Astoria Financial: Earnings Summary For the 3 months ended 9/30/15 For the 9 months ended 9/30/15 (in thousands,except share data) NYCB Astoria Financial NYCB Astoria Financial Net interest income $279,412 $84,734 $857,277 $255,605 (Recoveryof) provision for (512) 4,439 (3,254) 7,749 losses
Slide 40: Profitability, Asset Quality, and Capital Measures
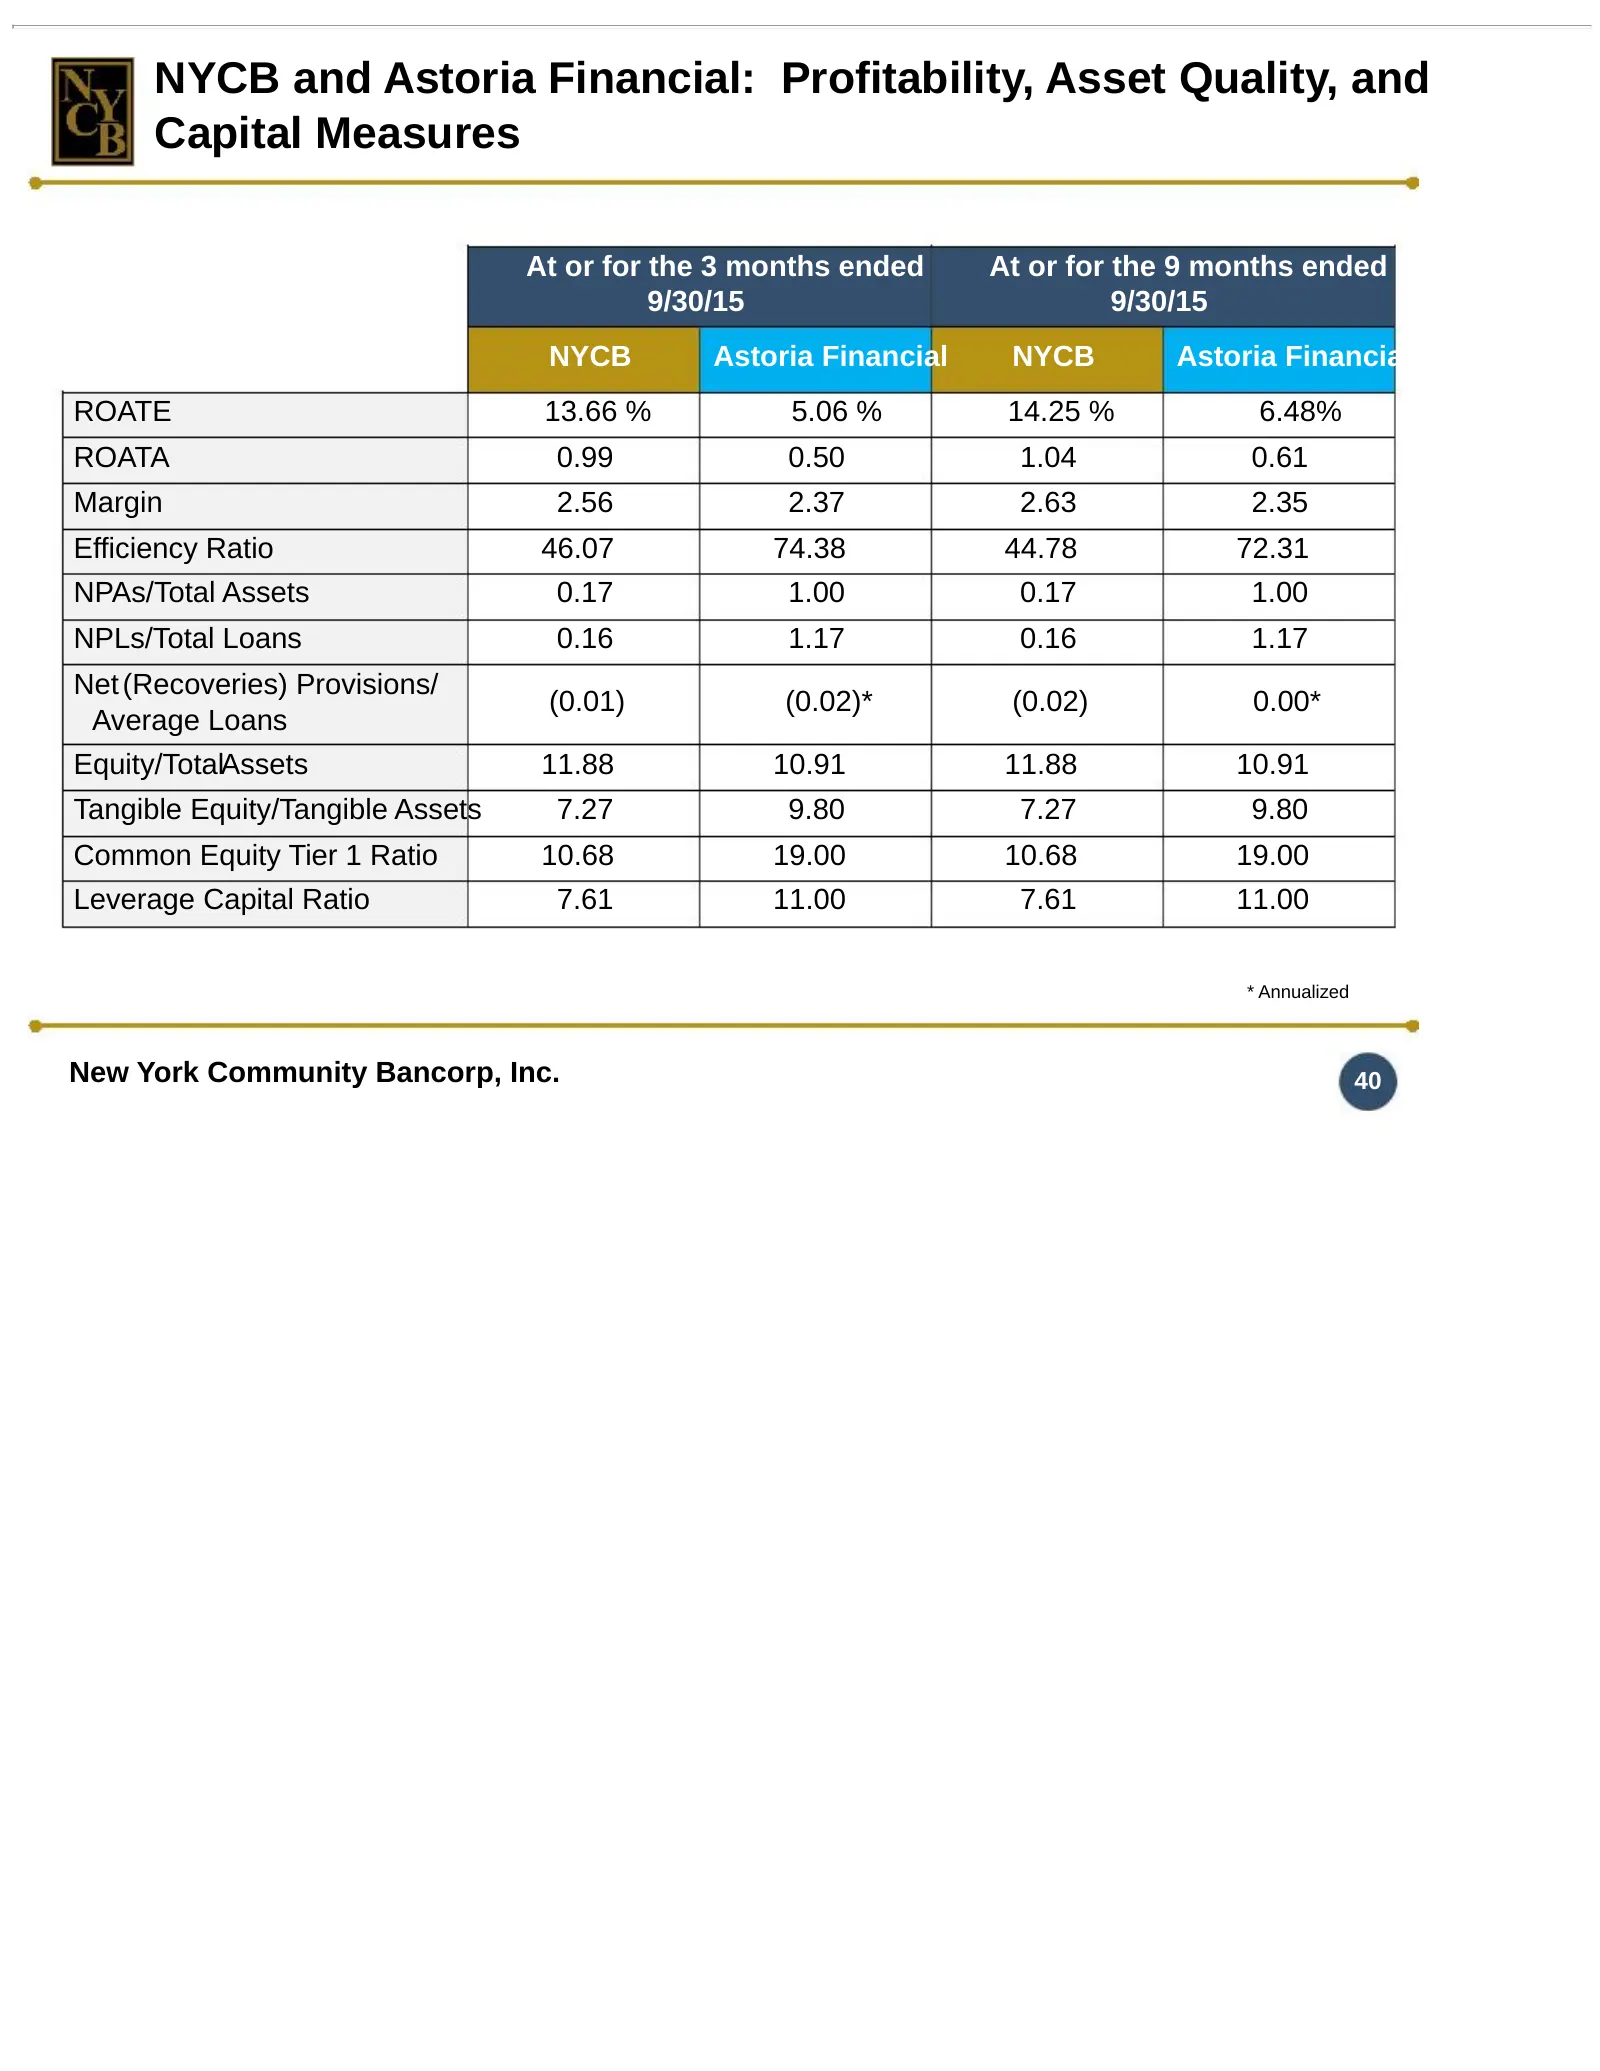
NYCB and Astoria Financial: Profitability, Asset Quality, and Capital Measures At or for the 3 months ended At or for the 9 months ended 9/30/15 9/30/15 NYCB Astoria Financial NYCB Astoria Financial ROATE 13.66 % 5.06 % 14.25 % 6.48% ROATA 0.99 0.50 1.04 0.61 Margin 2.56 2.37 2.63 2.35 Efficiency Ra
Slide 41: Reconciliations of GAAP and Non-GAAP Financial Measures
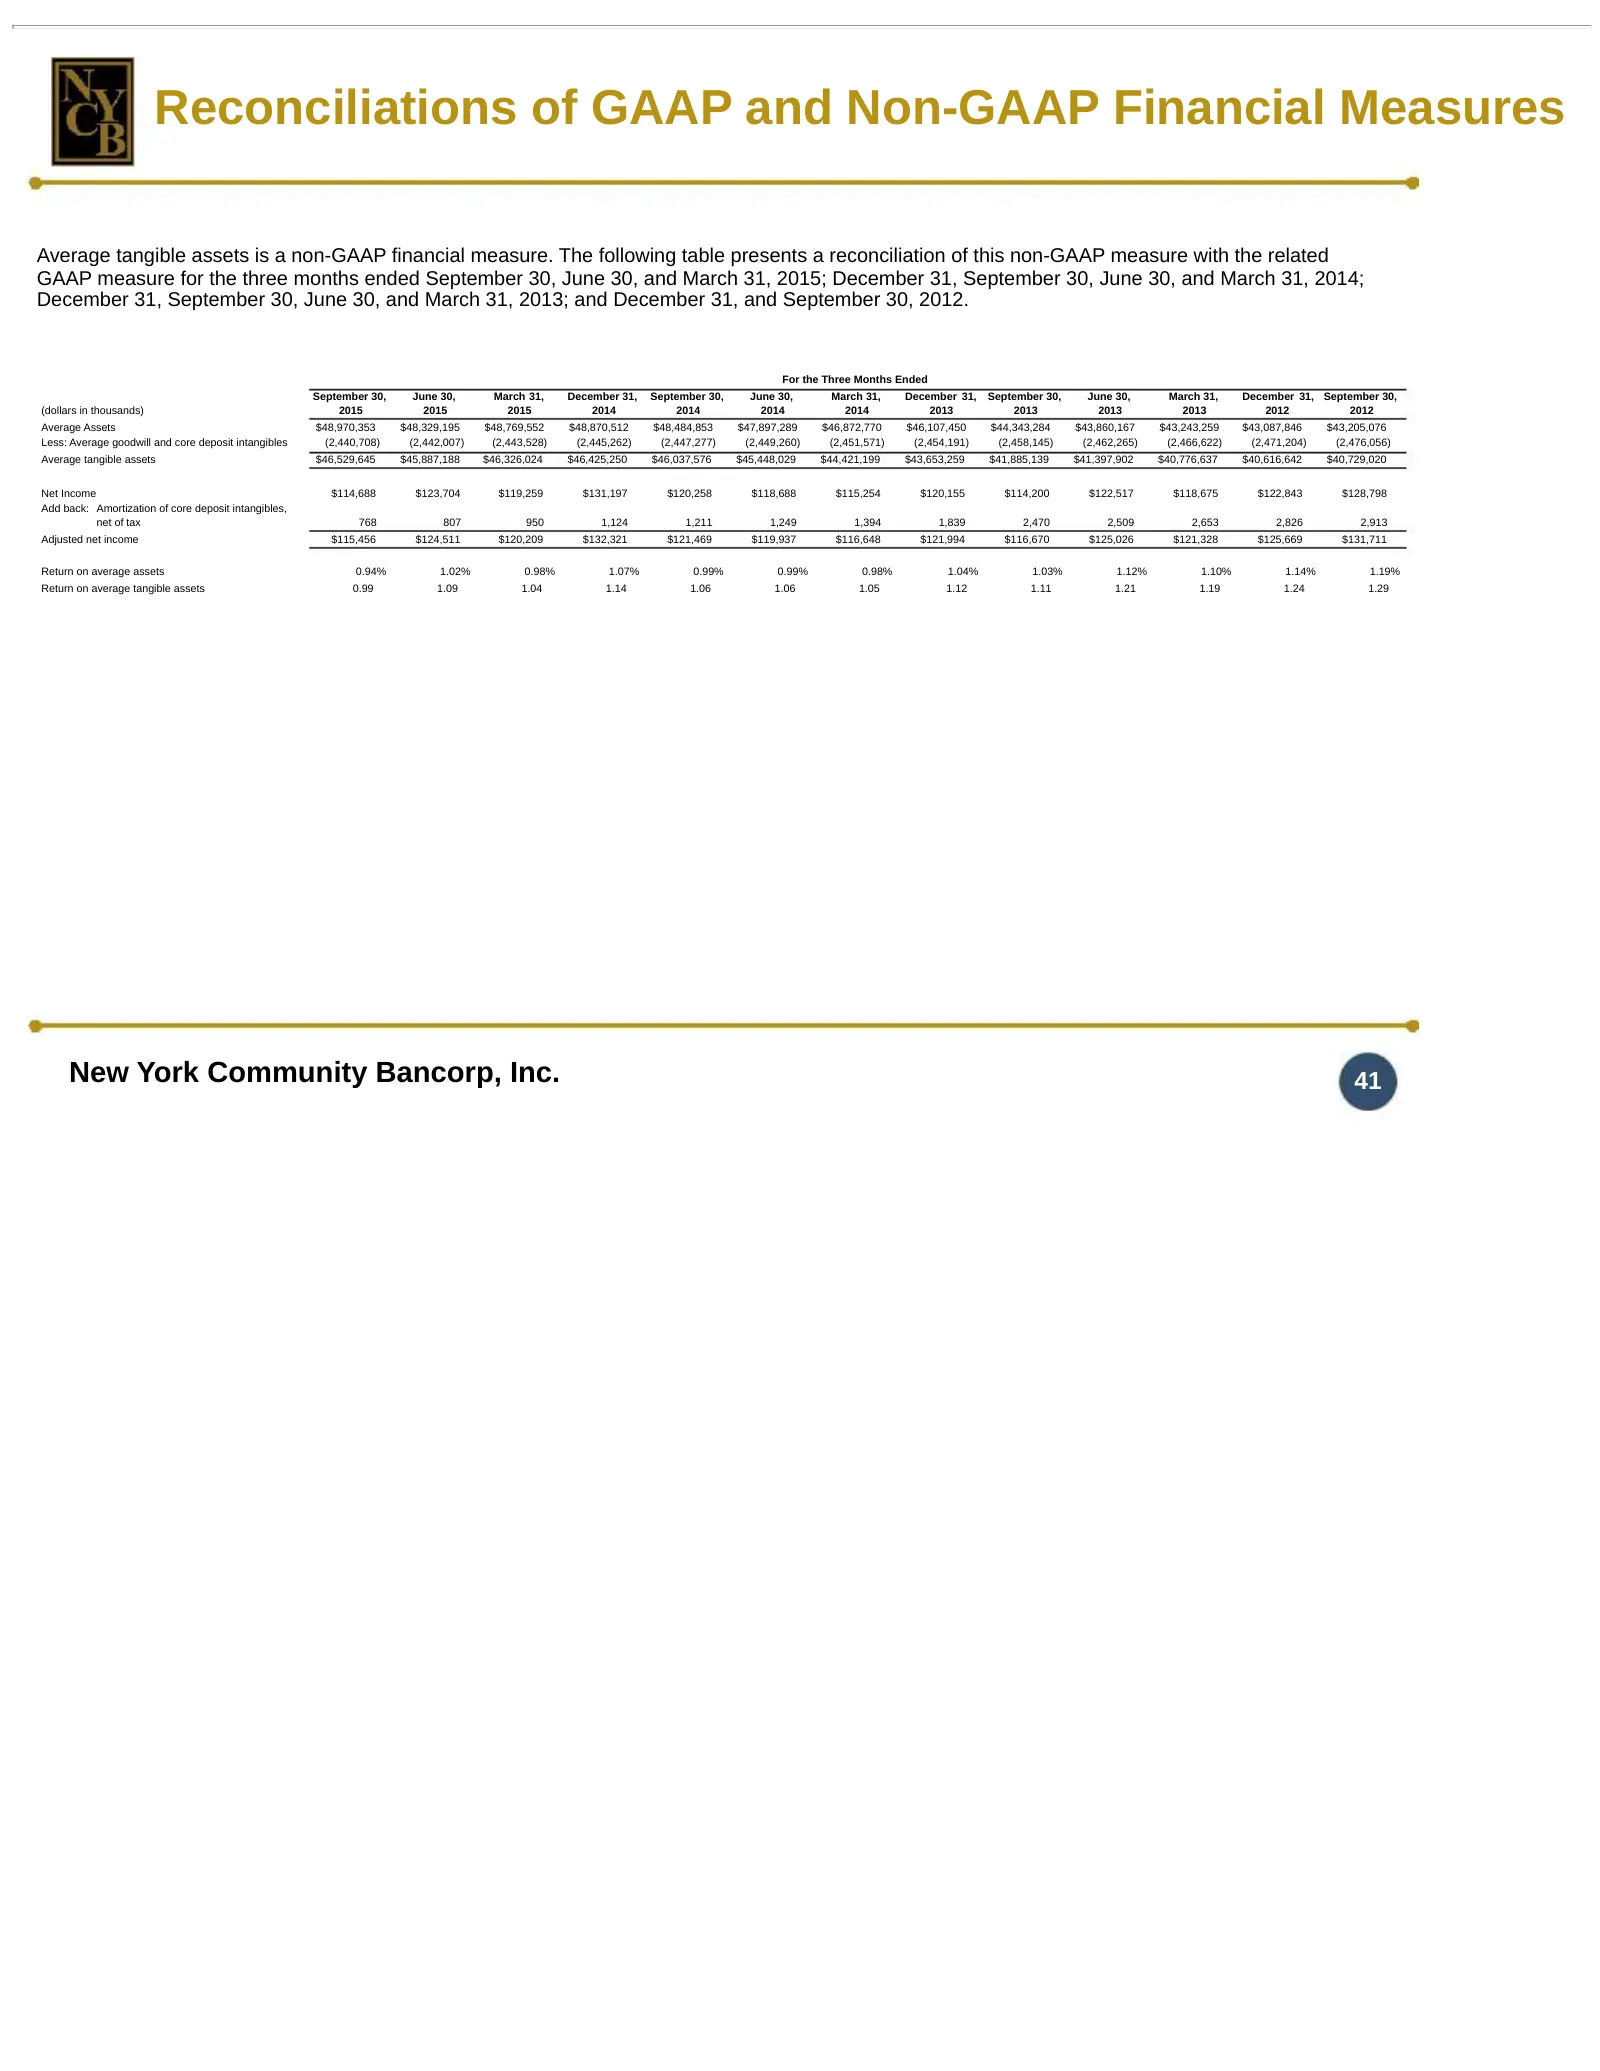
Reconciliations of GAAP and Non-GAAP Financial Measures Average tangible assets is a non-GAAP financial measure. The following table presents a reconciliation of this non-GAAP measure with the related GAAP measure for the three months ended September 30, June 30, and March 31, 2015; December 31, Sep
Slide 42: For More Information
For More Information Visit our website: ir.myNYCB.com E-mail requests to: [email protected] Call Investor Relations at:(516) 683-4420 Investor Relations New York Community Bancorp, Inc. Write to: 615 Merrick Avenue Westbury, NY 11590 New York Community Bancorp, Inc. 11/10/15 42
Source: SEC EDGAR · 425 filed Nov 10, 2015
More decks from Astoria Financial Corp
 Q2 2017 Earnings Presentation33 slides · Aug 14, 2017
 IPO Roadshow (June 2017)26 slides · Jun 5, 2017
 Shareholder Meeting (May 2017)14 slides · May 23, 2017
 Q1 2017 Earnings Presentation33 slides · May 10, 2017
 Merger or Acquisition (March 2017)25 slides · Mar 7, 2017
 Q4 2016 Earnings Presentation32 slides · Feb 17, 2017