Astoria Financial — IPO Roadshow (June 2017)
26 slides from Astoria Financial's IPO roadshow presentation, Jun 5, 2017
Slide 1: Astoria Financial Corporation Senior Unsecured Notes Offering June 2017
Astoria Financial Corporation Senior Unsecured Notes Offering June 2017 NYSE : AF Issuer Free Writing Prospectus Filed pursuant to Rule 433 Registration No. 333 - 204555 Dated June 5, 2017
Slide 2: Forward Looking Statements
Forward Looking Statements 2 Cautionary Statements Regarding Forward - Looking Information This presentation contains a number of forward - looking statements within the meaning of Section 27A of the Securities Act of 193 3, as amended, and Section 21E of the Securities Exchange Act of 1934, as amen
Slide 3: Forward Looking Statements (continued)
Forward Looking Statements (continued) 3 changes in the monetary and fiscal policies of the U.S. Government, including policies of the U.S. Department of the Treasury an d the Board of Governors of the Federal Reserve System; changes in interest rates, which may affect Sterling’s or Astoria’s net in
Slide 4: Offering Summary
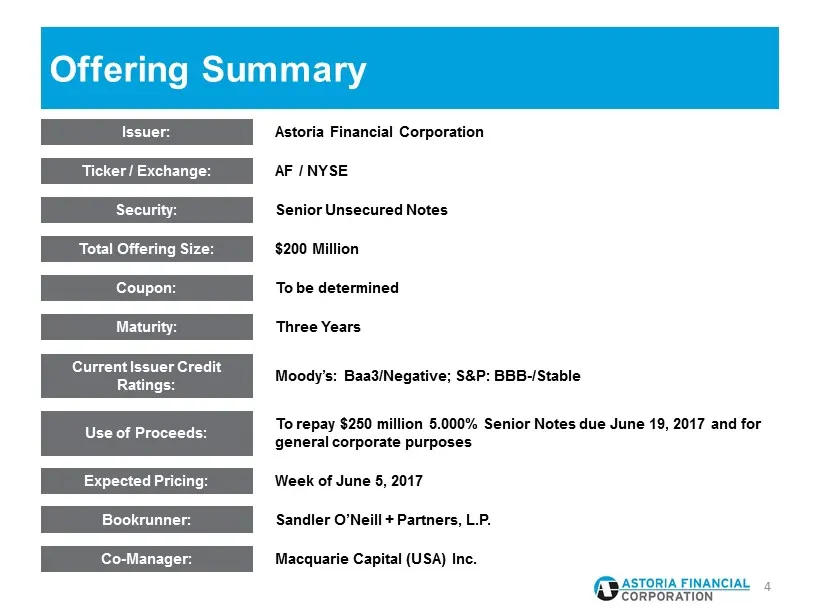
Offering Summary 4 Issuer : Ticker / Exchange: Security: Total Offering Size: Maturity: Current Issuer Credit Ratings: Coupon: Use of Proceeds: Expected Pricing: Bookrunner : Co - Manager: Astoria Financial Corporation Senior Unsecured Notes AF / NYSE To be determined Three Years $200 Million Moody’
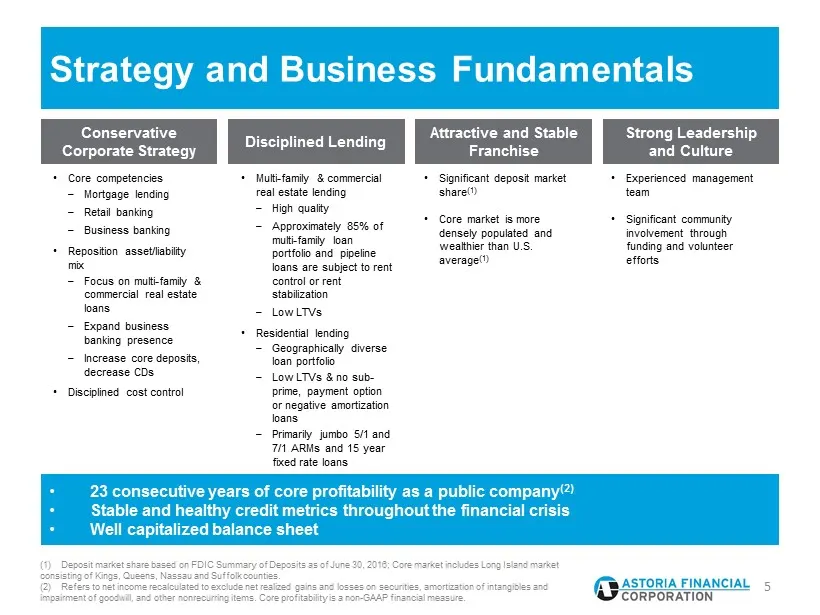
Slide 5: Strategy and Business Fundamentals
Attractive and Stable Franchise Disciplined Lending Conservative Corporate Strategy Strategy and Business Fundamentals 5 ( 1) Deposit market share based on FDIC Summary of Deposits as of June 30, 2016; Core market includes Long Island market consisting of Kings, Queens, Nassau and Suffolk counties.
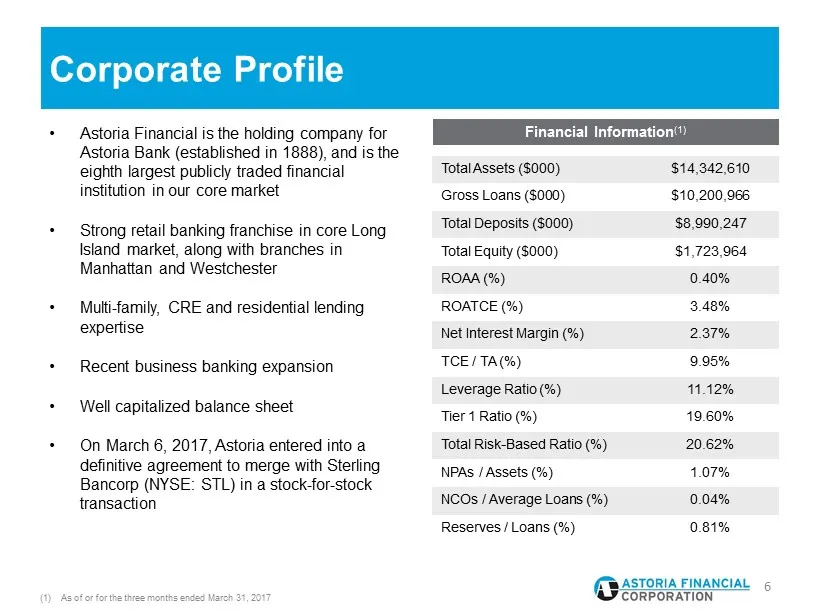
Slide 6: Corporate Profile and Financial Information
Financial Information (1) Corporate Profile 6 Total Assets ($000) $14,342,610 Gross Loans ($000) $10,200,966 Total Deposits ($000) $8,990,247 Total Equity ($000) $1,723,964 ROAA (%) 0.40% ROATCE (%) 3.48% Net Interest Margin (%) 2.37% TCE / TA (%) 9.95% Leverage Ratio (%) 11.12% Tier 1 Ratio (%) 19.
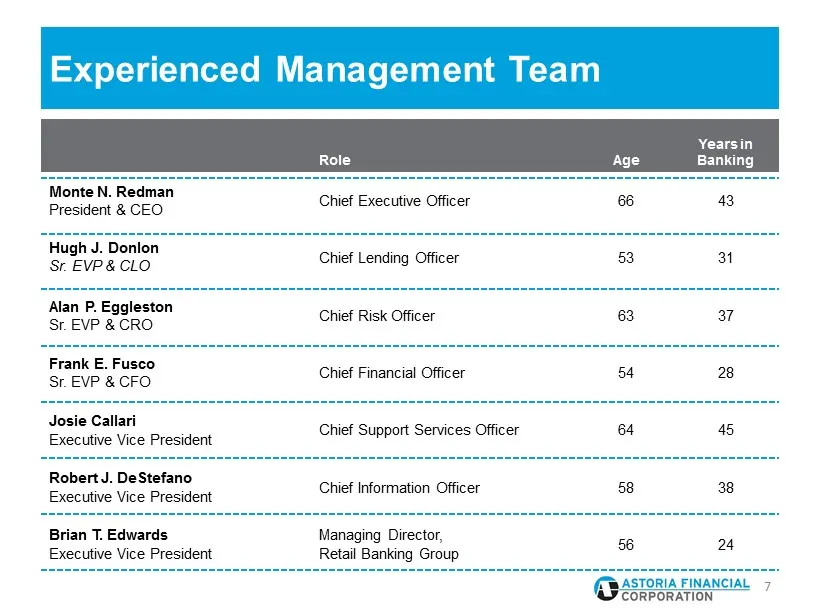
Slide 7: Experienced Management Team
Experienced Management Team 7 Role Age Years in Banking Monte N. Redman President & CEO Chief Executive Officer 66 43 Hugh J. Donlon Sr. EVP & CLO Chief Lending Officer 53 31 Alan P. Eggleston Sr. EVP & CRO Chief Risk Officer 63 37 Frank E. Fusco Sr. EVP & CFO Chief Financial Officer 54 28 Josie Cal
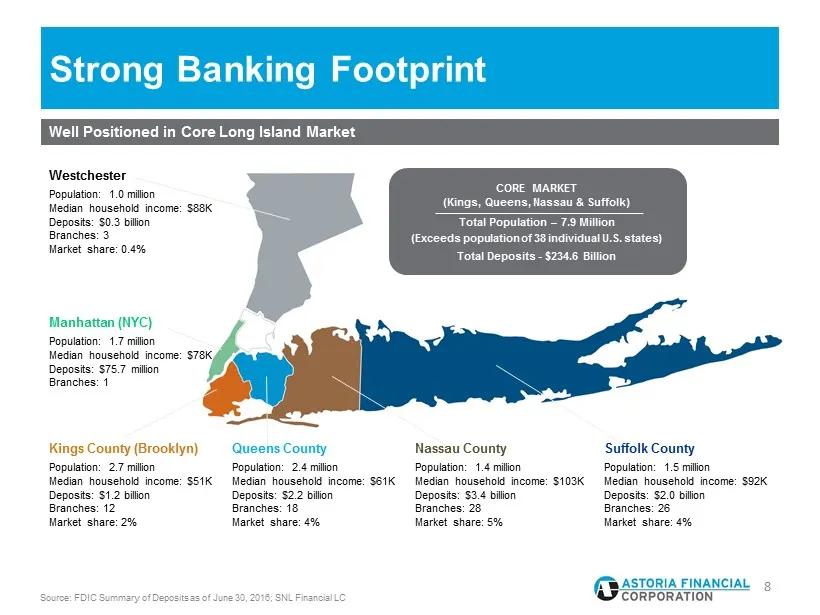
Slide 8: Strong Banking Footprint
Strong Banking Footprint 8 Source: FDIC Summary of Deposits as of June 30, 2016; SNL Financial LC CORE MARKET (Kings, Queens, Nassau & Suffolk) Total Population – 7.9 Million (Exceeds population of 38 individual U.S. states) Total Deposits - $234.6 Billion Kings County (Brooklyn) Population: 2.7 mil
Slide 9: Significant Market Share Penetration
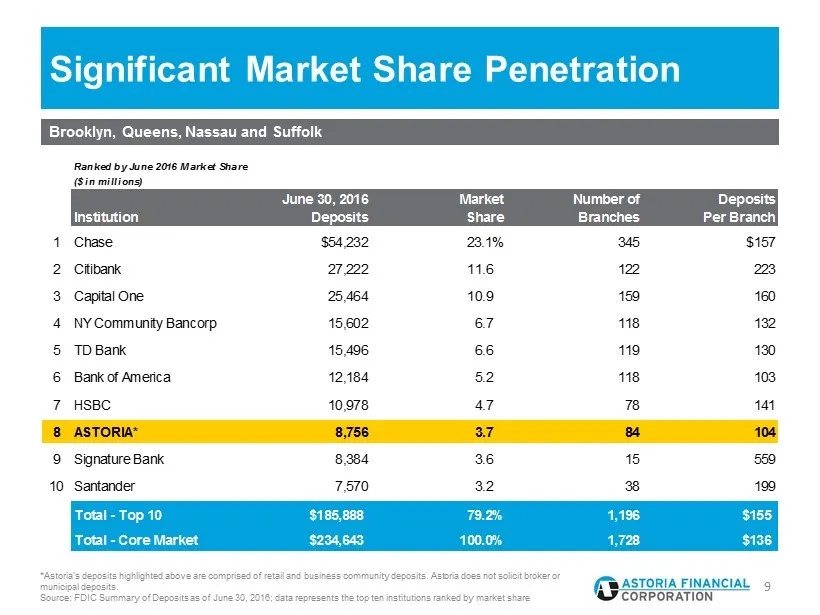
Significant Market Share Penetration 9 *Astoria’s deposits highlighted above are comprised of retail and business community deposits. Astoria does not solicit broker or municipal deposits. Source: FDIC Summary of Deposits as of June 30, 2016; data represents the top ten institutions ranked by market
Slide 10: Leading Retail Banking Franchise
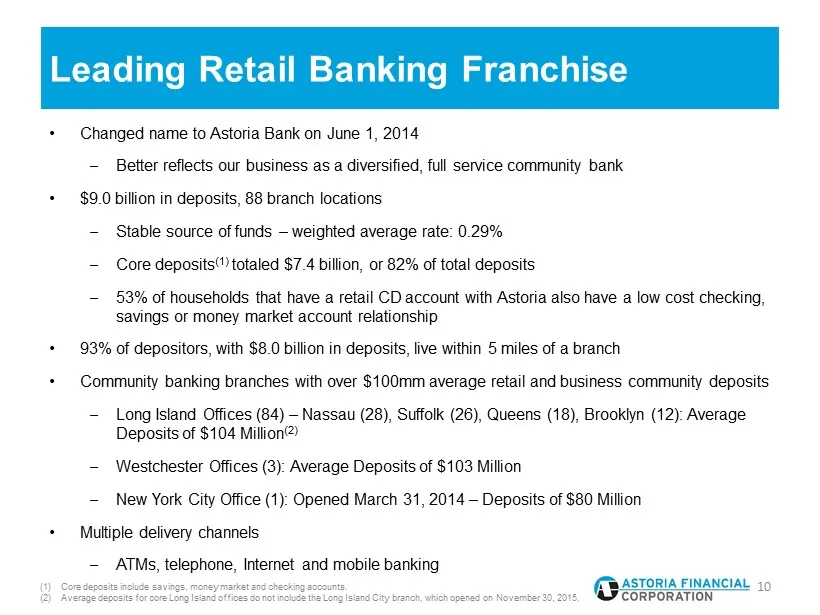
Leading Retail Banking Franchise 10 (1) Core deposits include savings, money market and checking accounts. (2) Average deposits for core Long Island offices do not include the Long Island City branch, which opened on November 30, 2015. • Changed name to Astoria Bank on June 1, 2014 – Better reflects
Slide 11: Balance Sheet Repositioning Trend
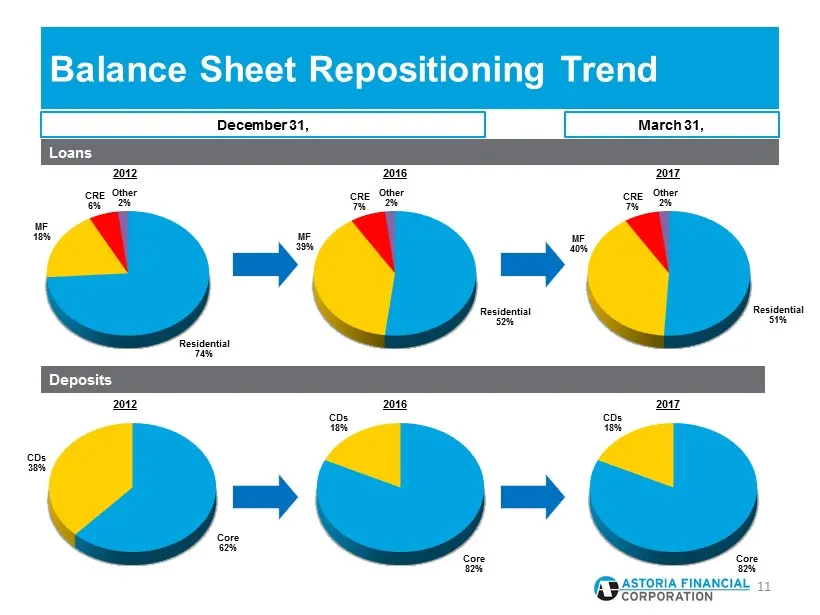
March 31, December 31, Residential 51% MF 40% CRE 7% Other 2% Residential 74% MF 18% CRE 6% Other 2% Core 62% CDs 38% Residential 52% MF 39% CRE 7% Other 2% Balance Sheet Repositioning Trend 11 Deposits Core 82% CDs 18% Loans 2017 2012 2016 Core 82% CDs 18% 2017 2012 2016
Slide 12: Net Interest Margin
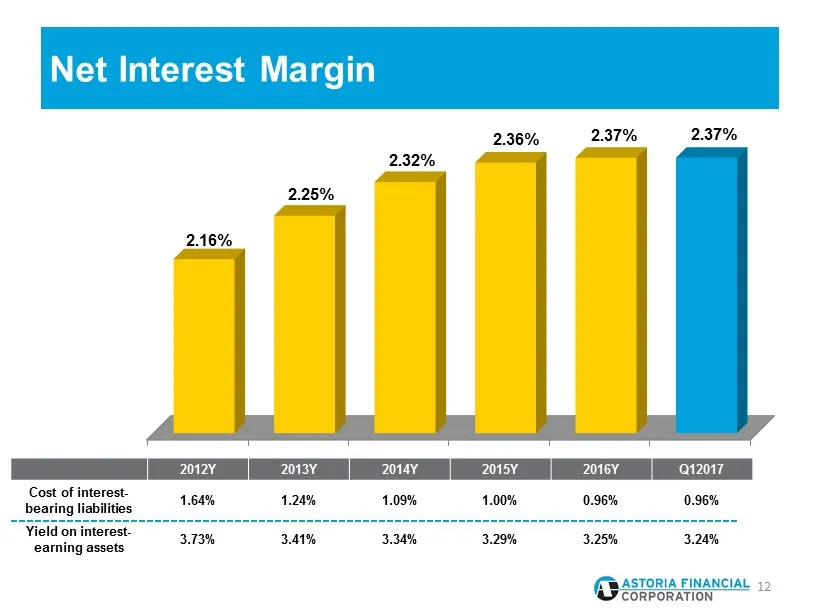
Net Interest Margin 12 2012Y 2013Y 2014Y 2015Y 2016Y Q12017 2.16% 2.25% 2.32% 2.36% 2.37% 2.37% 2012Y 2013Y 2014Y 2015Y 2016Y Q12017 Cost of interest - bearing liabilities 1.64% 1.24% 1.09% 1.00 % 0.96% 0.96 % Yield on interest - earning assets 3.73% 3.41% 3.34% 3.29% 3.25% 3.24%
Slide 13: Interest Rate Risk Management
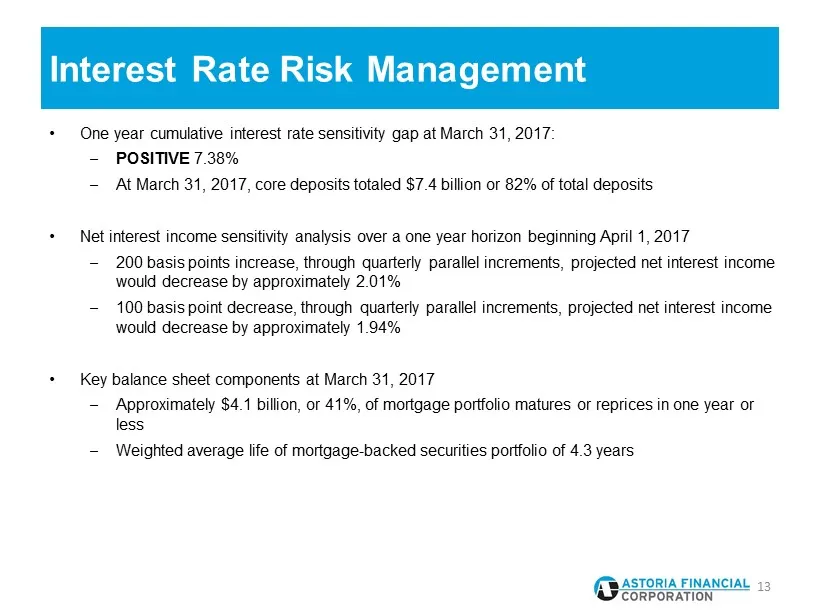
Interest Rate Risk Management • One year cumulative interest rate sensitivity gap at March 31, 2017: – POSITIVE 7.38% – At March 31, 2017, core deposits totaled $7.4 billion or 82% of total deposits • Net interest income sensitivity analysis over a one year horizon beginning April 1, 2017 – 200 basi
Slide 14: Asset and Liability Repricing
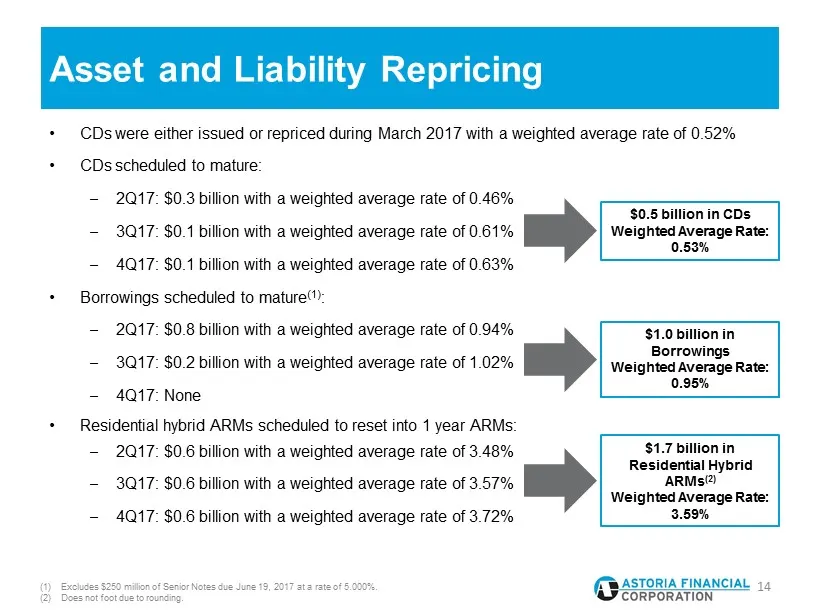
• CDs were either issued or repriced during March 2017 with a weighted average rate of 0.52% • CDs scheduled to mature: – 2Q17: $0.3 billion with a weighted average rate of 0.46% – 3Q17: $0.1 billion with a weighted average rate of 0.61% – 4Q17: $0.1 billion with a weighted average rate of 0.63% • B
Slide 15: Multi-family/Commercial Real Estate Lending
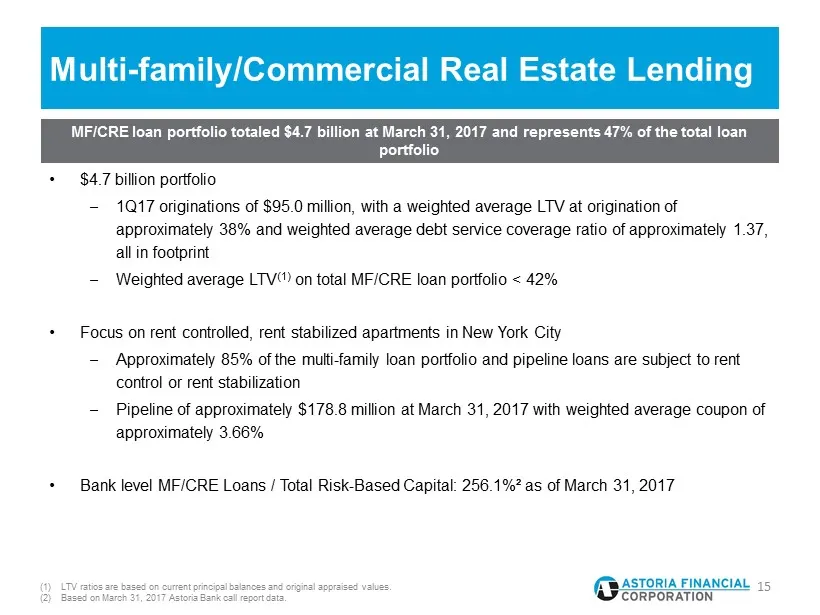
MF/CRE loan portfolio totaled $4.7 billion at March 31, 2017 and represents 47% of the total loan portfolio Multi - family/Commercial Real Estate Lending 15 (1) LTV ratios are based on current principal balances and original appraised values. (2) Based on March 31, 2017 Astoria Bank call report data
Slide 16: Residential Mortgage Lending
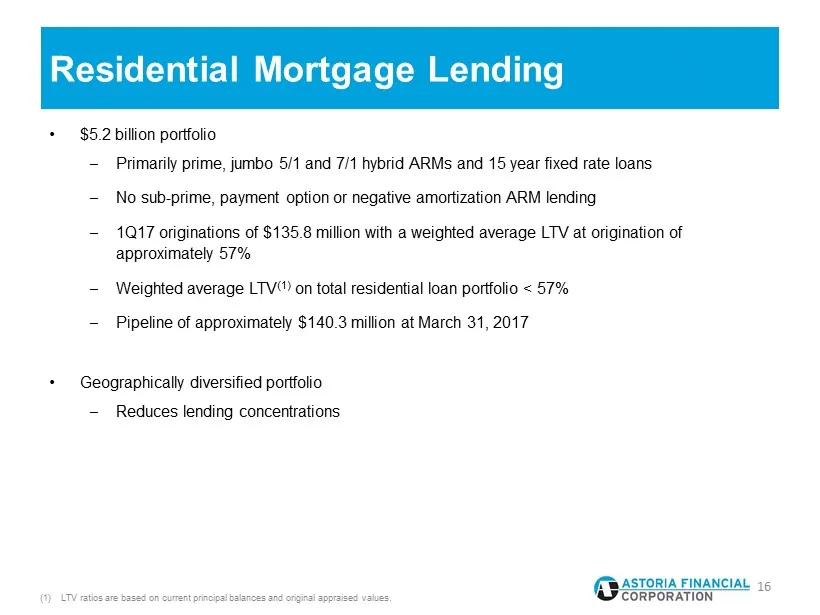
• $5.2 billion portfolio – Primarily prime, jumbo 5/1 and 7/1 hybrid ARMs and 15 year fixed rate loans – No sub - prime, payment option or negative amortization ARM lending – 1Q17 originations of $135.8 million with a weighted average LTV at origination of approximately 57% – Weighted average LTV (1
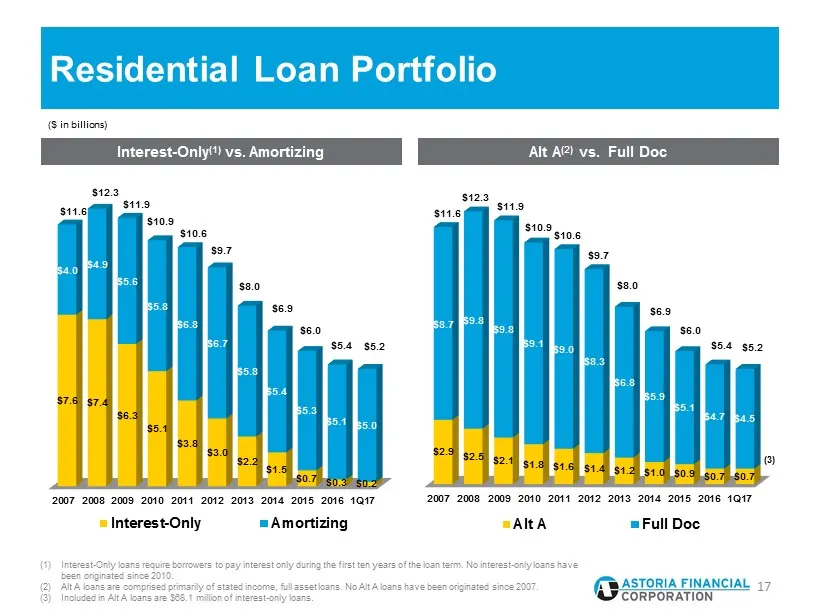
Slide 17: Alt A vs. Full Doc; Interest-Only vs. Amortizing Residential Loan Portfolio
Alt A (2) vs. Full Doc Interest - Only (1) vs. Amortizing Residential Loan Portfolio 17 (1) Interest - Only loans require borrowers to pay interest only during the first ten years of the loan term. No interest - only loans have been originated since 2010. (2) Alt A loans are comprised primarily of s
Slide 18: Asset Quality
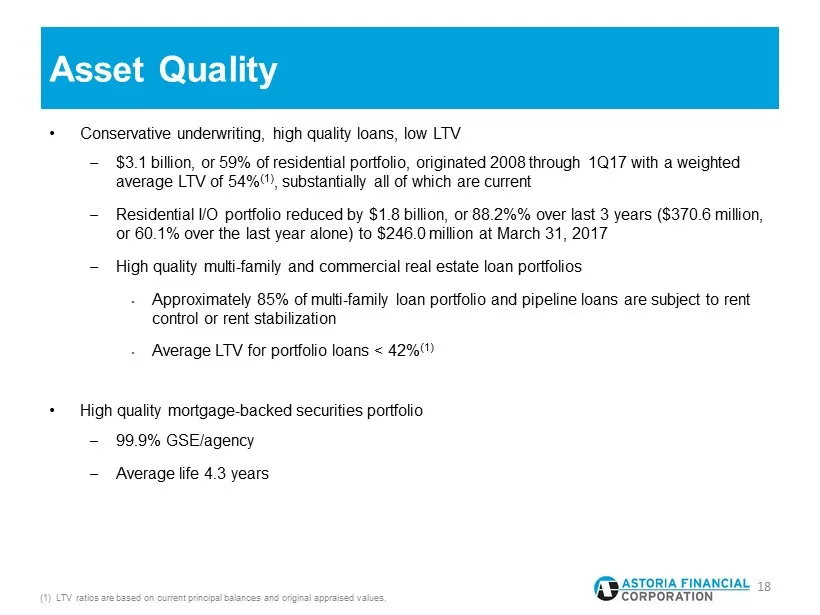
Asset Quality 18 (1) LTV ratios are based on current principal balances and original appraised values. • Conservative underwriting, high quality loans, low LTV – $3.1 billion, or 59% of residential portfolio, originated 2008 through 1Q17 with a weighted average LTV of 54% (1) , substantially all of
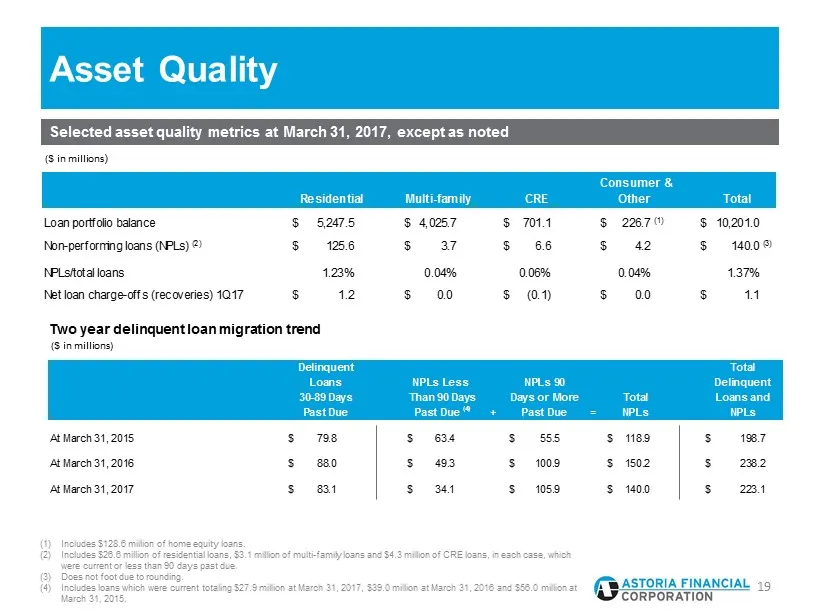
Slide 19: Asset Quality metrics
Selected asset quality metrics at March 31, 2017, except as noted Asset Quality 19 (1) Includes $128.6 million of home equity loans. (2) Includes $26.6 million of residential loans, $3.1 million of multi - family loans and $4.3 million of CRE loans, in each case, which were current or less than 90 d
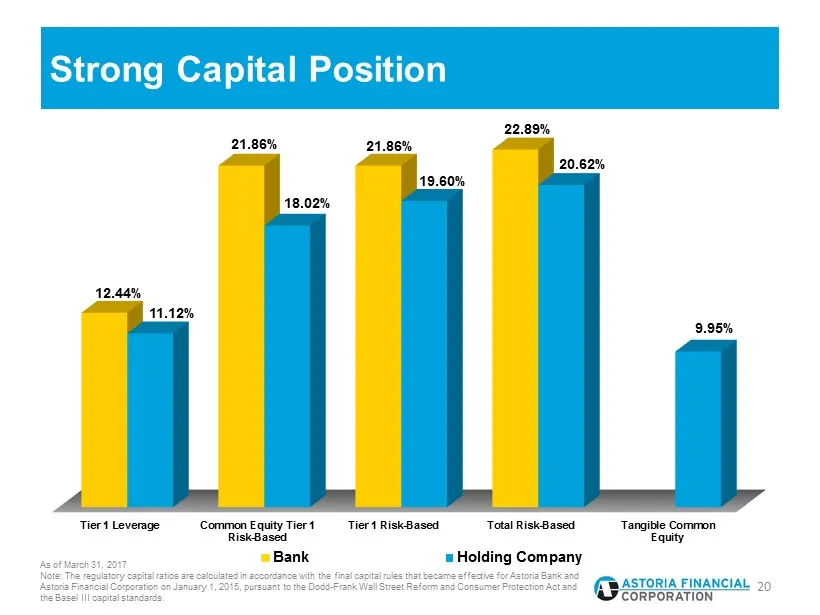
Slide 20: Strong Capital Position
Strong Capital Position 20 As of March 31, 2017 Note: The regulatory capital ratios are calculated in accordance with the final capital rules that became effective for Astoria Bank and Astoria Financial Corporation on January 1, 2015, pursuant to the Dodd - Frank Wall Street Reform and Consumer Prot
Slide 21: Pending Merger with Sterling Bancorp
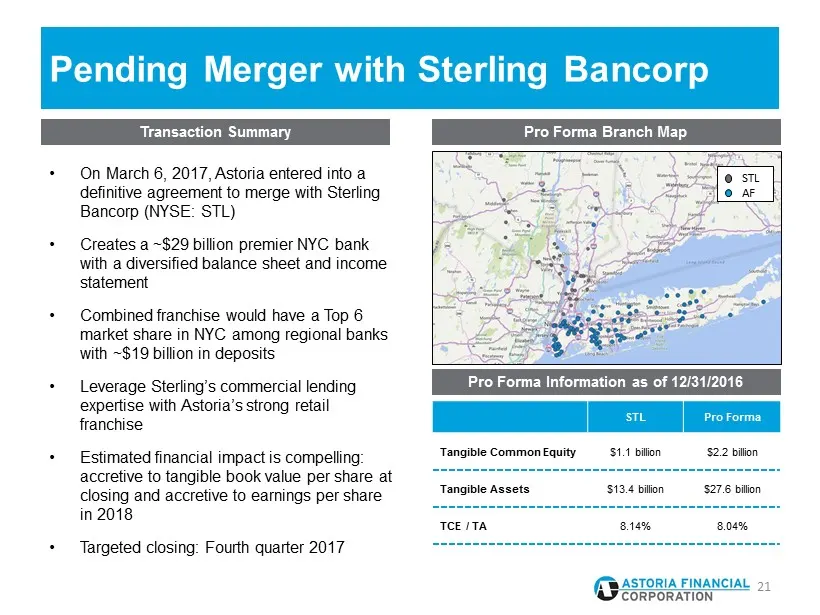
Transaction Summary Pro Forma Branch Map Pending Merger with Sterling Bancorp • On March 6, 2017, Astoria entered into a definitive agreement to merge with Sterling Bancorp ( NYSE: STL) • Creates a ~$29 billion premier NYC bank with a diversified balance sheet and income statement • Combined franchi
Slide 22: Pro Forma Capitalization
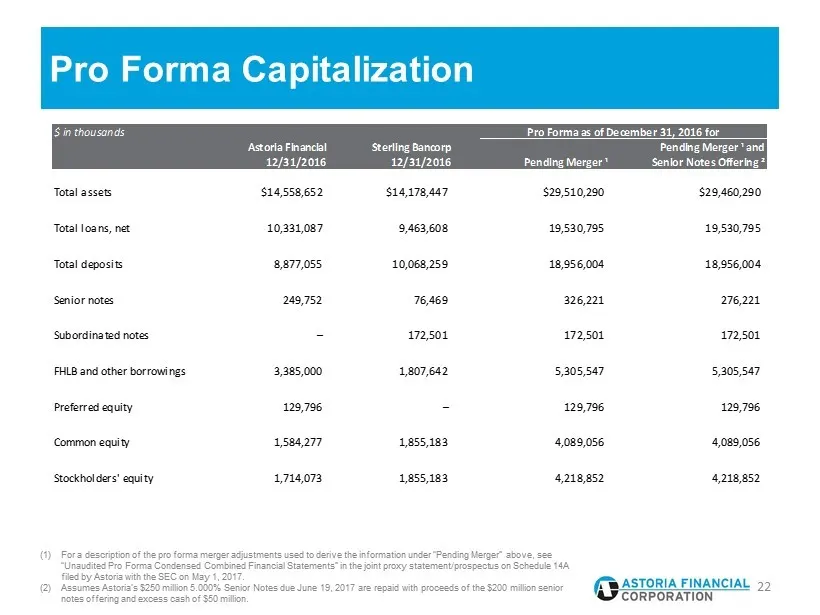
Pro Forma Capitalization 22 (1) For a description of the pro forma merger adjustments used to derive the information under “Pending Merger” above, see “Unaudited Pro Forma Condensed Combined Financial Statements” in the joint proxy statement/prospectus on Schedule 14A filed by Astoria with the SEC o
Slide 23: Pro Forma Double Leverage and Interest Coverage
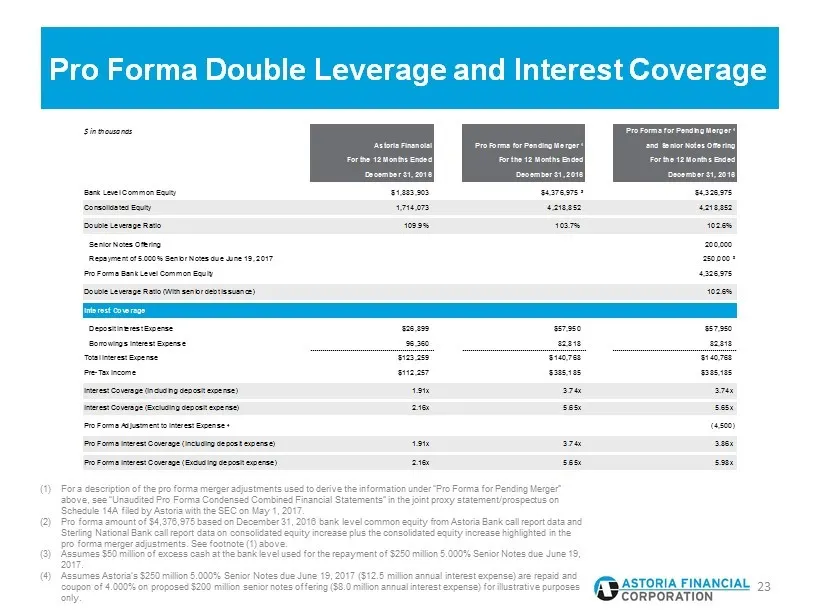
Pro Forma Double Leverage and Interest Coverage 23 (1) For a description of the pro forma merger adjustments used to derive the information under “Pro Forma for Pending Merger” above, see “Unaudited Pro Forma Condensed Combined Financial Statements” in the joint proxy statement/prospectus on Schedul
Slide 24: Investment Summary
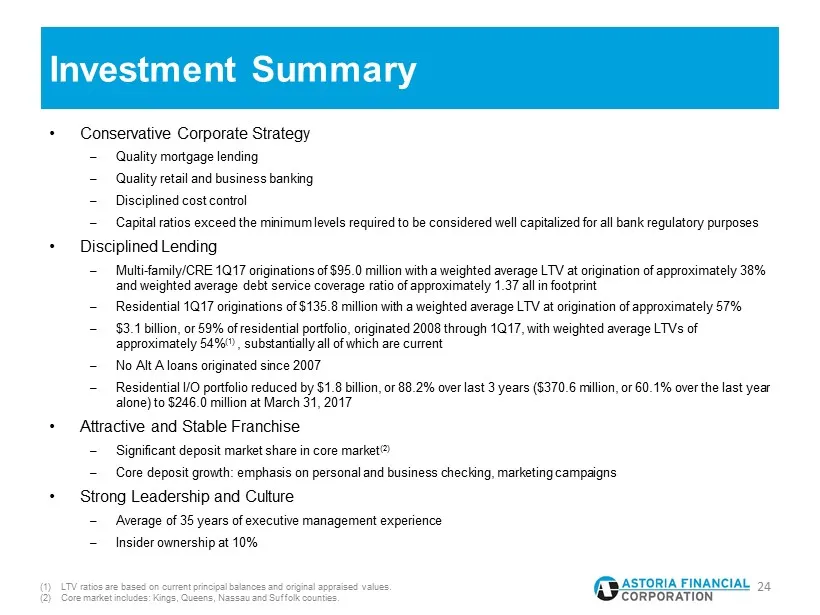
Investment Summary 24 (1) LTV ratios are based on current principal balances and original appraised values. (2) Core market includes: Kings, Queens, Nassau and Suffolk counties. • Conservative Corporate Strategy – Quality mortgage lending – Quality retail and business banking – Disciplined cost cont
Slide 25: Addendum
A @ ASTORIA FINANCIAL ‘© CORPORATION Addendum
Slide 26: Non-GAAP Reconciliation
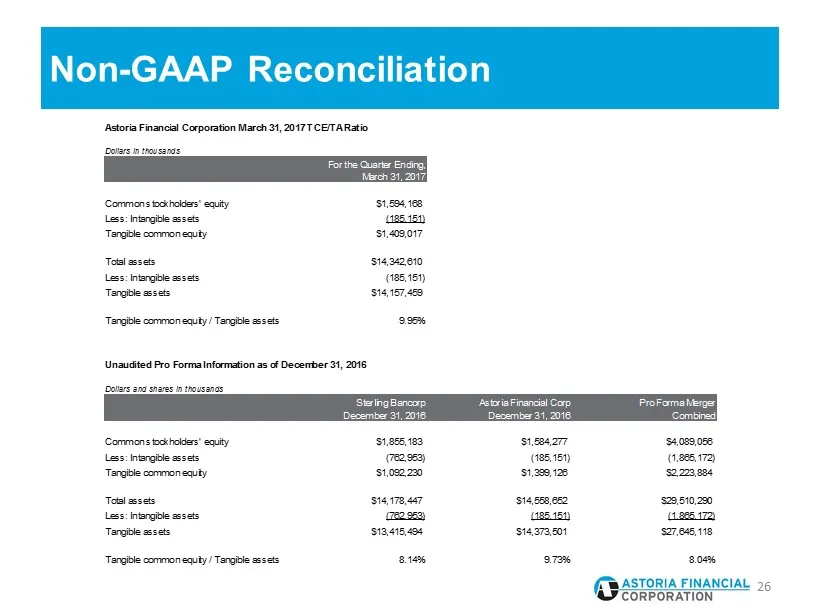
Non - GAAP Reconciliation 26 Astoria Financial Corporation March 31, 2017 TCE/TA Ratio Dollars in thousands For the Quarter Ending, March 31, 2017 Common stockholders' equity $1,594,168 Less: Intangible assets (185,151) Tangible common equity $1,409,017 Total assets $14,342,610 Less: Intangible asse
Source: SEC EDGAR · FWP filed Jun 5, 2017
More decks from Astoria Financial Corp
 Q2 2017 Earnings Presentation33 slides · Aug 14, 2017
 Shareholder Meeting (May 2017)14 slides · May 23, 2017
 Q1 2017 Earnings Presentation33 slides · May 10, 2017
 Merger or Acquisition (March 2017)25 slides · Mar 7, 2017
 Q4 2016 Earnings Presentation32 slides · Feb 17, 2017
 Q3 2016 Earnings Presentation33 slides · Nov 17, 2016